


$BTC after last week's drop has entered a zone where it is advantageous to buy. At the same time, statistics for the next six months are more indicative of a lack of growth.
That forecast was made by Jamie Coutts, chief crypto analyst at Real Vision and founder of Helios Analytics.
The decline was one of the steepest since 2014
Last week’s drawdown amounted to 3.4 volatility-adjusted sigmas. Put simply, the price fell much more sharply than in a typical week. In a sample of 299 moves since 2014, this decline ranked 21st.
Jamie Coutts noted that back in August, he considered a failed breakout unlikely. However, the rally was happening in the late stage of the liquidity cycle, when debt grows faster than the amount of money in the system.
Now what matters is exactly where the decline took place. The analyst uses his own market-regime filter to distinguish an uptrend from a downtrend. When bitcoin fell this sharply while above the filter, it was worth more six months later in 8 out of 9 cases. Below the filter, where the price is now, it rose in 10 out of 17 cases, with a median return of just +2%. Jamie Coutts acknowledged that, statistically, the odds favor further declines.
A similar picture emerged from a chart by Helios Analytics. The company selected episodes since 2017 when BTC was in a downtrend and was also undervalued according to on-chain metrics. Six months later, the price was higher in 7 out of 14 cases, with a median return of −1%. After a year, the balance shifted: prices rose in 10 out of 14 cases, with a median return of +38%.
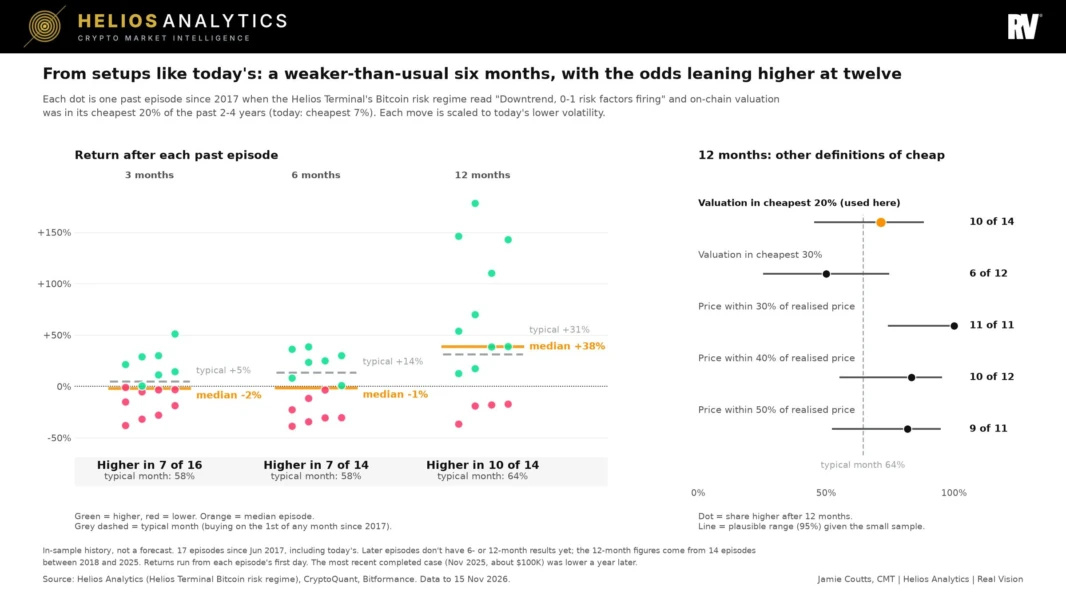
For investors, this means the coming months could be weak, while purchases in this zone are aimed at the long term.
A shakeout, not capitulation
Jamie Coutts called current prices an attractive value zone. He said the same thing in February, when bitcoin fell toward $60,000. In his view, those with spare capital should see the situation as an opportunity. The analyst would consider another decline a gift.
The price is trapped between key levels. Jamie Coutts highlighted four price points:
around $75,000 — the average purchase price for short-term holders;
around $73,000 — a weekly close above this level would put bitcoin back above the trend filter;
around $53,000 — the realized price, or the average price at which coins last moved on the network;
around $48,000 — the average purchase price for long-term holders.
The upper levels are about 15% away, and such a move would fall within the bounds of ordinary market noise. Below $60,000 lies an “air pocket.” That is how the analyst described a range where on-chain data shows few levels capable of supporting the price.
According to Helios, at a price of $64,120, almost half of all coins—48.9%—last moved at a higher price.
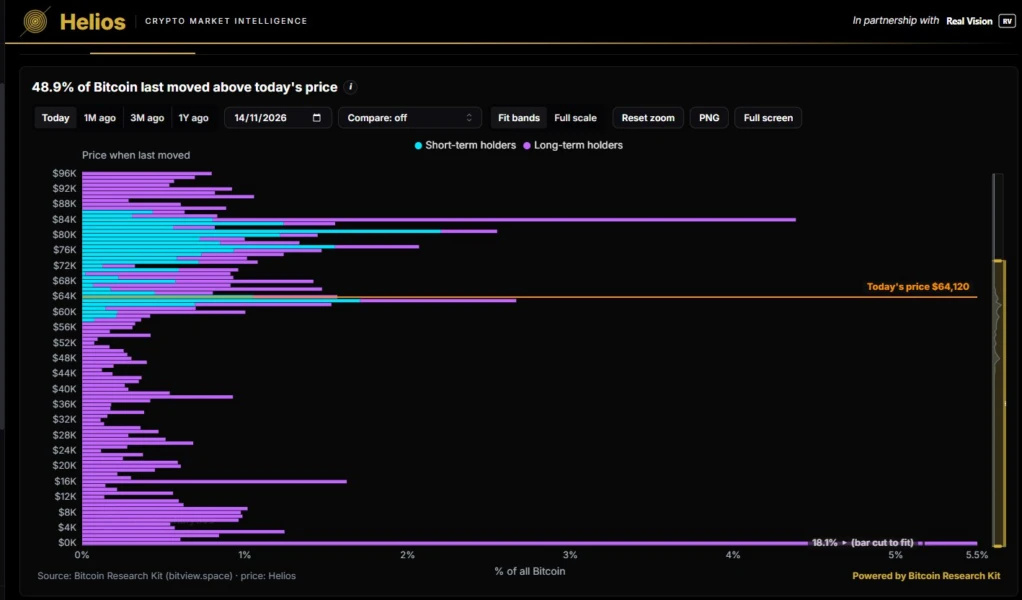
On-chain data—that is, information from the blockchain itself—point more to a shakeout than to capitulation. Recent buyers are selling at a loss, while long-term holders are not. The LTH-SOPR indicator shows whether long-term investors are selling at a profit or a loss. It currently stands around 1.0, whereas at the bottoms of past cycles it fell to 0.4–0.7. Realized losses over 30 days were ten times lower than in February.
A shift in the macroeconomic picture will signal a reversal. For now, these factors are working against bitcoin, but they may be close to running their course. Nothing is certain until the DXY turns around—the index that tracks the dollar against a basket of other currencies. Bitcoin reversals have usually coincided with reversals in the dollar, Jamie Coutts noted.
The analyst expects the final liquidity bottom in 2027. In his view, bitcoin should bottom out earlier. The coin’s relationship with global liquidity is currently the weakest on record, but Jamie Coutts does not believe it has broken down completely.
When liquidity turns around, BTC will outperform all other assets, he believes. To support his view, the analyst pointed to BTC’s reaction to Scott Bessent, the U.S. Treasury Secretary, announcing in August a buyback of U.S. government bonds.