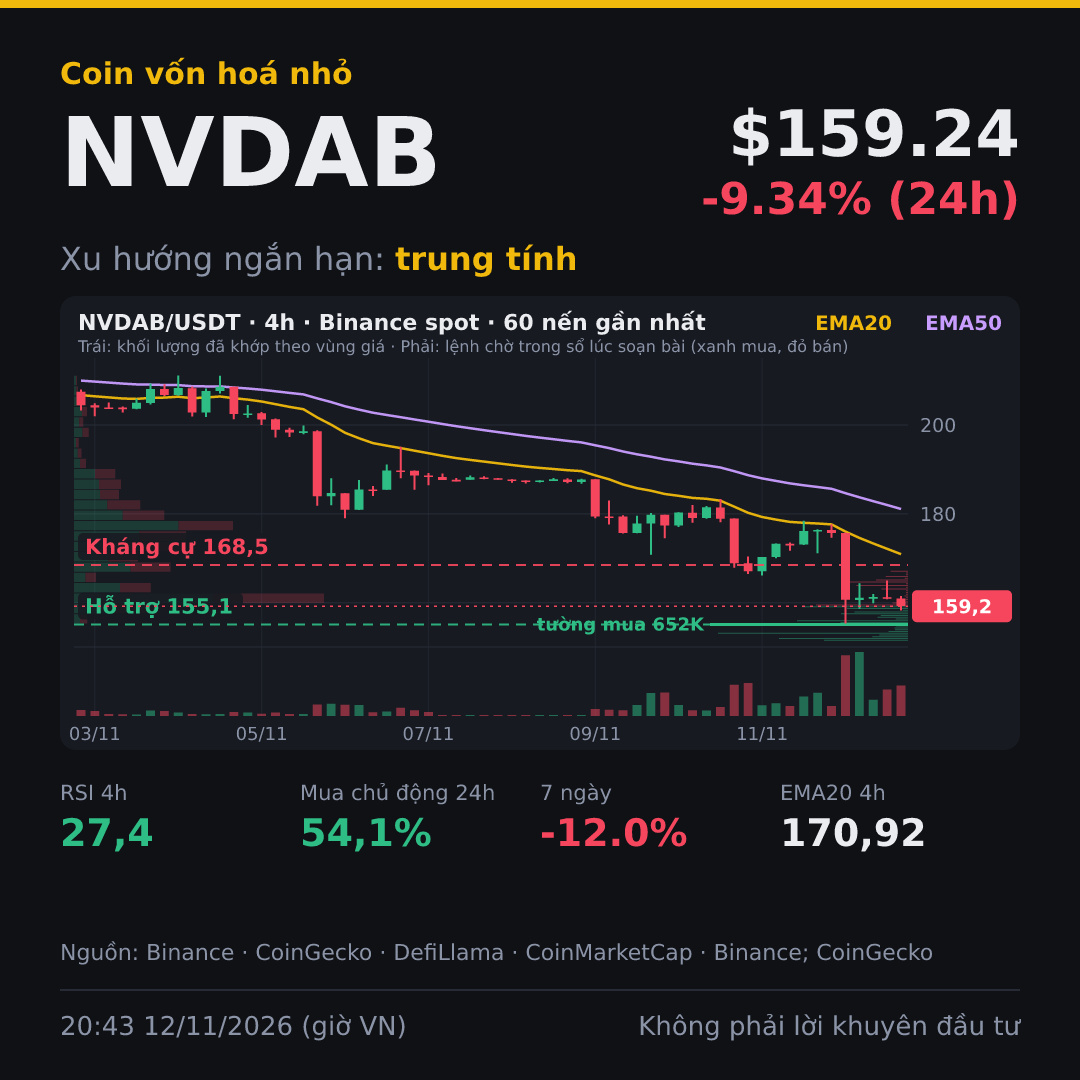
↔️ NEUTRAL | $NVDAB neutral, but the price is below the EMA on all three timeframes and down 9.34% in 24 hours, so the short-term trend is leaning bearish. Aggressive buying over the past 24 hours is slightly higher, which is worth watching.
📊 TECHNICALS: The daily, 4h, and 1h timeframes are all bearish because the price is below the EMA20 and EMA50, so sellers are in control. The daily RSI at 20.3 is oversold, so selling pressure may be easing, but technical signals are only partly reliable for a small-cap coin.
💰 MONEY FLOW: 24-hour volume on Binance spot is 156 million USDT, equal to 102% of market cap, indicating heavy speculation. Aggressive buyers account for 54.1%, with a net difference of 12.6 million USDT, but the price is still falling, so buying has not been enough to push it higher.
₿ VS. BTC: Over the past 24 hours, during the hours when BTC rose, its gains totaled +2.17%, while NVDAB gained +1.06%; during the hours when BTC fell, its losses totaled -3.74%, while NVDAB fell -9.9%. NVDAB is weaker than BTC: it rises less and falls more.
🎯 LEVELS TO WATCH FOR $NVDAB : support 155.1 USDT · resistance 168.5 USDT
Scenario: Between 155.1 and 168.5 USDT, neither side has an advantage. Longs are waiting for a 4-hour NVDAB/USDT candle on Binance spot to close above 168.5 USDT (the current candle closes at 23:00 on 12/11); shorts are waiting for a close below 155.1 USDT.
⚠️ If the price breaks below 155.1 USDT, the current view is invalidated, and the small-cap coin could fall faster than usual.
Data as of 20:43 on 12/11 (Vietnam time).
Between 155.1 and 168.5 USDT, are you leaning long or short, and why?
Manage your risk before entering a trade: risk only about one percent of your capital on each trade.
Not investment advice. DYOR.
#BinanceSquare #NVDAB #Tokenized
📊 TECHNICALS: The daily, 4h, and 1h timeframes are all bearish because the price is below the EMA20 and EMA50, so sellers are in control. The daily RSI at 20.3 is oversold, so selling pressure may be easing, but technical signals are only partly reliable for a small-cap coin.
💰 MONEY FLOW: 24-hour volume on Binance spot is 156 million USDT, equal to 102% of market cap, indicating heavy speculation. Aggressive buyers account for 54.1%, with a net difference of 12.6 million USDT, but the price is still falling, so buying has not been enough to push it higher.
₿ VS. BTC: Over the past 24 hours, during the hours when BTC rose, its gains totaled +2.17%, while NVDAB gained +1.06%; during the hours when BTC fell, its losses totaled -3.74%, while NVDAB fell -9.9%. NVDAB is weaker than BTC: it rises less and falls more.
🎯 LEVELS TO WATCH FOR $NVDAB : support 155.1 USDT · resistance 168.5 USDT
Scenario: Between 155.1 and 168.5 USDT, neither side has an advantage. Longs are waiting for a 4-hour NVDAB/USDT candle on Binance spot to close above 168.5 USDT (the current candle closes at 23:00 on 12/11); shorts are waiting for a close below 155.1 USDT.
⚠️ If the price breaks below 155.1 USDT, the current view is invalidated, and the small-cap coin could fall faster than usual.
Data as of 20:43 on 12/11 (Vietnam time).
Between 155.1 and 168.5 USDT, are you leaning long or short, and why?
Manage your risk before entering a trade: risk only about one percent of your capital on each trade.
Not investment advice. DYOR.
#BinanceSquare #NVDAB #Tokenized