
Ngọn cỏ ven đường
63 Posts

Ngọn cỏ ven đường
Report
Block User
23 Following
10 Followers
10 Liked
Posts
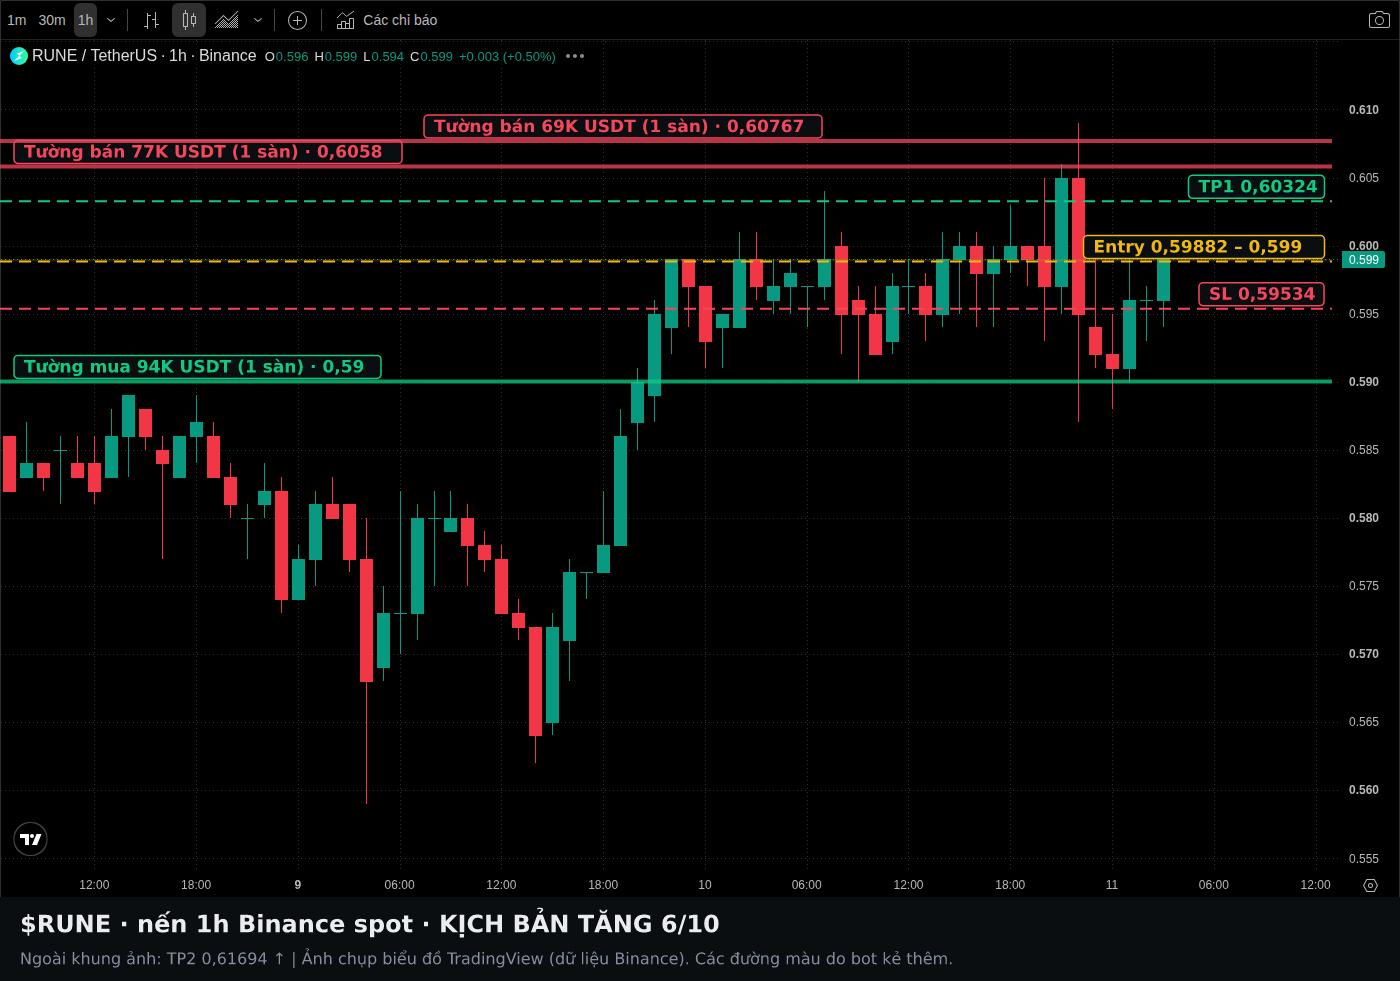
↔️ NEUTRAL | $RUNE slightly tilted upward in the short term: 59.3% of 1-hour volume was aggressive buying on Binance Spot, and the price is above the 1h EMA20.
📊 TECHNICALS: The 1h chart is rising, with the price at 0.599 above the 1h EMA20 (0.59601), indicating short-term support remains. The 4h chart is moving sideways, while the daily chart is declining, so the three timeframes are not aligned. This is a small-cap coin, so technical signals are only partly reliable.
💰 MONEY FLOW: 59.3% aggressive buying over 1 hour on Binance Spot means buyers are active in the short term, but sellers still have a slight edge over 7 days. Binance Futures: 66% of top traders are long, compared with 51.5% of the crowd, so top traders are more heavily tilted long.
₿ VS. BTC: Over the past 24 hours, during hours when BTC rose, its cumulative gain was +3.31%, while RUNE gained +4.2%; during hours when BTC fell, its cumulative loss was -5.09%, while RUNE fell -3.83%. RUNE is stronger than BTC: it rose more and fell less.
🎯 $RUNE LEVELS TO WATCH: support 0.5836 USDT · resistance 0.6058 USDT
🔎 CONCLUSION: Aggressive buying over 1 hour and the rising 1h chart support a long bias. BTC is declining on the 1h chart, with losses totaling -5.09% over 13 hours, which is a counterpoint. However, RUNE has fallen less than BTC, so this is a short-term setup.
🧭 1h swing trade: long near support, in line with the uptrend
📌 ENTRY AND EXIT LEVELS
• Entry: 0.5988 – 0.599
• SL: 0.5953 (-0.6%)
• TP1: 0.6032 (+0.7%, R:R 1:1.2)
• TP2: 0.6169 (+3%, R:R 1:4.9)
• Buy/sell balance: aggressive buying at 15 minutes 69.8%, 1 hour 59.3%, 4 hours 48.9%
• Basis: Buyers accounted for 69.8% of aggressive trades over the most recent 15 minutes; over the most recent hour, buyers also accounted for 59.3%
• Risk: BTC is declining on the 1h chart
• Setup score: 6/10
Data as of 03:16 11/11 (UTC+7).
In the 0.5836 to 0.6058 range, do you favor longs or shorts, and why?
Manage your risk before entering a trade.
Not investment advice. DYOR.
#BinanceSquare #RUNE #THORChain
↔️ NEUTRAL | $RUNE slightly tilted upward in the short term: 59.3% of 1-hour volume was aggressive buying on Binance Spot, and the price is above the 1h EMA20.
📊 TECHNICALS: The 1h chart is rising, with the price at 0.599 above the 1h EMA20 (0.59601), indicating short-term support remains. The 4h chart is moving sideways, while the daily chart is declining, so the three timeframes are not aligned. This is a small-cap coin, so technical signals are only partly reliable.
💰 MONEY FLOW: 59.3% aggressive buying over 1 hour on Binance Spot means buyers are active in the short term, but sellers still have a slight edge over 7 days. Binance Futures: 66% of top traders are long, compared with 51.5% of the crowd, so top traders are more heavily tilted long.
₿ VS. BTC: Over the past 24 hours, during hours when BTC rose, its cumulative gain was +3.31%, while RUNE gained +4.2%; during hours when BTC fell, its cumulative loss was -5.09%, while RUNE fell -3.83%. RUNE is stronger than BTC: it rose more and fell less.
🎯 $RUNE LEVELS TO WATCH: support 0.5836 USDT · resistance 0.6058 USDT
🔎 CONCLUSION: Aggressive buying over 1 hour and the rising 1h chart support a long bias. BTC is declining on the 1h chart, with losses totaling -5.09% over 13 hours, which is a counterpoint. However, RUNE has fallen less than BTC, so this is a short-term setup.
🧭 1h swing trade: long near support, in line with the uptrend
📌 ENTRY AND EXIT LEVELS
• Entry: 0.5988 – 0.599
• SL: 0.5953 (-0.6%)
• TP1: 0.6032 (+0.7%, R:R 1:1.2)
• TP2: 0.6169 (+3%, R:R 1:4.9)
• Buy/sell balance: aggressive buying at 15 minutes 69.8%, 1 hour 59.3%, 4 hours 48.9%
• Basis: Buyers accounted for 69.8% of aggressive trades over the most recent 15 minutes; over the most recent hour, buyers also accounted for 59.3%
• Risk: BTC is declining on the 1h chart
• Setup score: 6/10
Data as of 03:16 11/11 (UTC+7).
In the 0.5836 to 0.6058 range, do you favor longs or shorts, and why?
Manage your risk before entering a trade.
Not investment advice. DYOR.
#BinanceSquare #RUNE #THORChain
📊 TECHNICALS: The 1h chart is rising, with the price at 0.599 above the 1h EMA20 (0.59601), indicating short-term support remains. The 4h chart is moving sideways, while the daily chart is declining, so the three timeframes are not aligned. This is a small-cap coin, so technical signals are only partly reliable.
💰 MONEY FLOW: 59.3% aggressive buying over 1 hour on Binance Spot means buyers are active in the short term, but sellers still have a slight edge over 7 days. Binance Futures: 66% of top traders are long, compared with 51.5% of the crowd, so top traders are more heavily tilted long.
₿ VS. BTC: Over the past 24 hours, during hours when BTC rose, its cumulative gain was +3.31%, while RUNE gained +4.2%; during hours when BTC fell, its cumulative loss was -5.09%, while RUNE fell -3.83%. RUNE is stronger than BTC: it rose more and fell less.
🎯 $RUNE LEVELS TO WATCH: support 0.5836 USDT · resistance 0.6058 USDT
🔎 CONCLUSION: Aggressive buying over 1 hour and the rising 1h chart support a long bias. BTC is declining on the 1h chart, with losses totaling -5.09% over 13 hours, which is a counterpoint. However, RUNE has fallen less than BTC, so this is a short-term setup.
🧭 1h swing trade: long near support, in line with the uptrend
📌 ENTRY AND EXIT LEVELS
• Entry: 0.5988 – 0.599
• SL: 0.5953 (-0.6%)
• TP1: 0.6032 (+0.7%, R:R 1:1.2)
• TP2: 0.6169 (+3%, R:R 1:4.9)
• Buy/sell balance: aggressive buying at 15 minutes 69.8%, 1 hour 59.3%, 4 hours 48.9%
• Basis: Buyers accounted for 69.8% of aggressive trades over the most recent 15 minutes; over the most recent hour, buyers also accounted for 59.3%
• Risk: BTC is declining on the 1h chart
• Setup score: 6/10
Data as of 03:16 11/11 (UTC+7).
In the 0.5836 to 0.6058 range, do you favor longs or shorts, and why?
Manage your risk before entering a trade.
Not investment advice. DYOR.
#BinanceSquare #RUNE #THORChain
1
📉 BEARISH | $BCH Bearish: sellers are more aggressive, and the price remains below both the EMA20 and EMA50 on the 4h timeframe. This is a pending order—wait for the price to rebound to 244.4 before shorting.
📊 TECHNICALS: All three timeframes—1d, 4h, and 1h—are bearish. The price is below both the EMA20 and EMA50, so the trend favors shorts. The 1d MACD is negative and widening, which means downward momentum has not weakened yet.
💰 MONEY FLOW: Binance spot, aggressive buying over 1 hour: 45.4%—sellers are more aggressive. Binance Futures OI is $61.7 million; combined OI across 3 exchanges fell 0.168% as the price declined, meaning longs are trimming positions, with no new shorts entering yet.
₿ VS. BTC: Over the past 24 hours, during hours when BTC rose, its cumulative gain was +3.31% while BCH gained +1.77%; during hours when BTC fell, its cumulative loss was -5.09% while BCH fell -5.54%. BCH is weaker than BTC: it rises less and falls more.
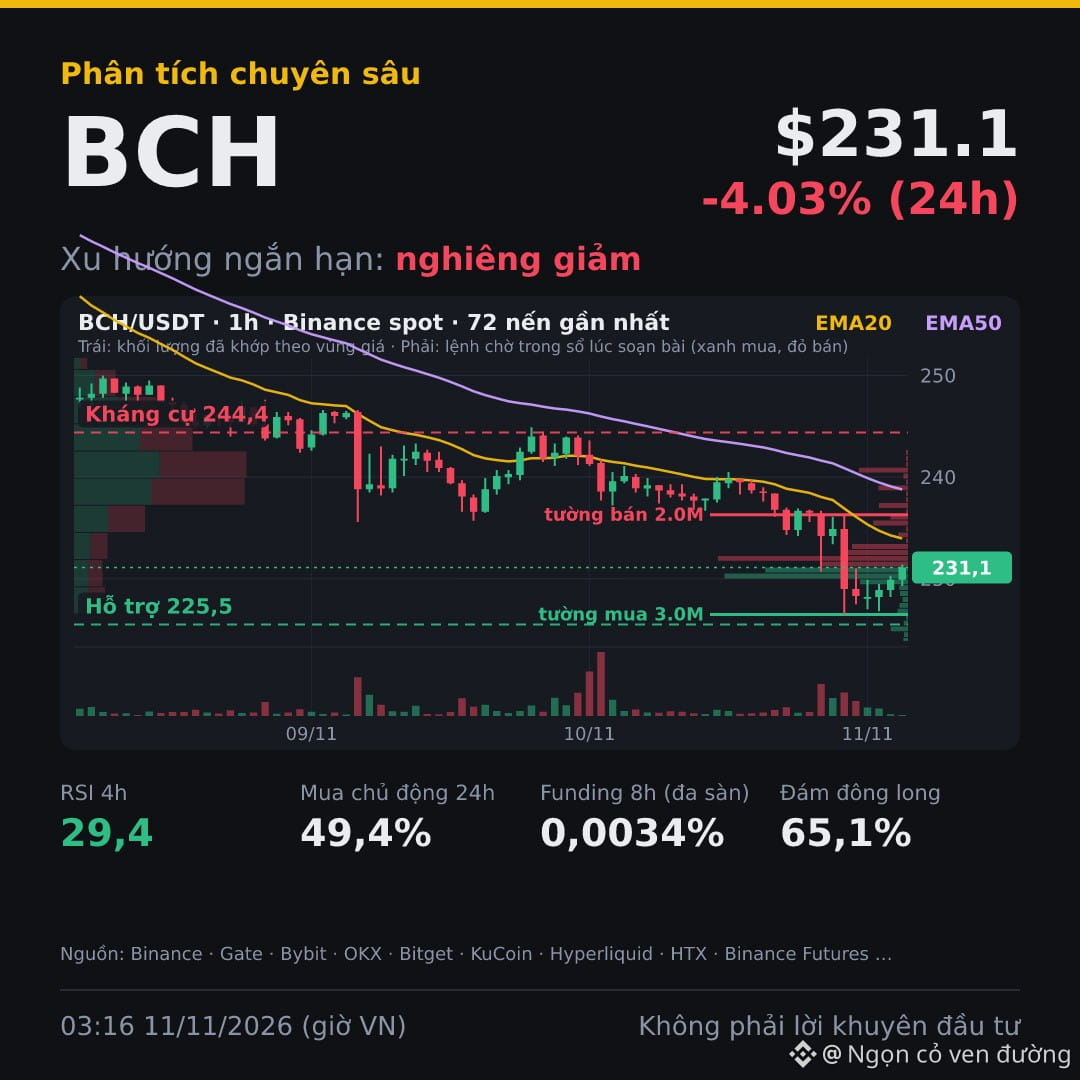
🎯 $BCH LEVELS TO WATCH: support 225.5 USDT · resistance 244.4 USDT
🔎 CONCLUSION: Wait for the price to rebound to 244.4 before shorting; don't enter now. At 231.1, the price still needs to rebound about 0.9% to reach the entry zone. If it doesn't get there, don't enter. Aggressive buying at 45.4% over 1 hour and all three timeframes trending down support this approach.
🧭 $BCH swing-trading plan: wait for the price to rebound to resistance, then short in line with the downtrend (score 8/10)
📌 ORDER LEVELS
▪️ Entry zone: 233.1–234
▪️ Stop-loss: 236.7 (+1.6%; above both the 1h EMA20 at 234 and the sell order wall at 236.3 (present on 1 exchange); if the price reaches this level, the setup is invalidated)
▪️ Take profit 1: 227.5 (-2.4%, R:R 1:1.6; just before 1h support at 226.5)
▪️ Take profit 2: 222.9 (-4.4%, R:R 1:2.8; only if the price breaks below 226.5; estimated beyond that level using a risk multiple)
Pending order: current price is 231.1, not yet in the entry zone.
▪️ Short-term money flow: aggressive buying at 44.0% over 15 minutes, 45.4% over 1 hour, and 49.9% over 4 hours
▪️ Supporting factor: aligned with the 1h and 4h trend (currently bearish)
▪️ Risk factor: this is a PENDING ORDER: current price is 231.1 and needs to rebound about 0.9% to reach the entry zone; if the price doesn't get there, don't enter
Data as of 03:16 11/11 (UTC+7).
At 244.4, are you leaning long or short?
Manage your risk before entering a trade.
Not investment advice. DYOR.
#BinanceSquare #BCH
📉 BEARISH | $BCH Bearish: sellers are more aggressive, and the price remains below both the EMA20 and EMA50 on the 4h timeframe. This is a pending order—wait for the price to rebound to 244.4 before shorting.
📊 TECHNICALS: All three timeframes—1d, 4h, and 1h—are bearish. The price is below both the EMA20 and EMA50, so the trend favors shorts. The 1d MACD is negative and widening, which means downward momentum has not weakened yet.
💰 MONEY FLOW: Binance spot, aggressive buying over 1 hour: 45.4%—sellers are more aggressive. Binance Futures OI is $61.7 million; combined OI across 3 exchanges fell 0.168% as the price declined, meaning longs are trimming positions, with no new shorts entering yet.
₿ VS. BTC: Over the past 24 hours, during hours when BTC rose, its cumulative gain was +3.31% while BCH gained +1.77%; during hours when BTC fell, its cumulative loss was -5.09% while BCH fell -5.54%. BCH is weaker than BTC: it rises less and falls more.
🎯 $BCH LEVELS TO WATCH: support 225.5 USDT · resistance 244.4 USDT
🔎 CONCLUSION: Wait for the price to rebound to 244.4 before shorting; don't enter now. At 231.1, the price still needs to rebound about 0.9% to reach the entry zone. If it doesn't get there, don't enter. Aggressive buying at 45.4% over 1 hour and all three timeframes trending down support this approach.
🧭 $BCH swing-trading plan: wait for the price to rebound to resistance, then short in line with the downtrend (score 8/10)
📌 ORDER LEVELS
▪️ Entry zone: 233.1–234
▪️ Stop-loss: 236.7 (+1.6%; above both the 1h EMA20 at 234 and the sell order wall at 236.3 (present on 1 exchange); if the price reaches this level, the setup is invalidated)
▪️ Take profit 1: 227.5 (-2.4%, R:R 1:1.6; just before 1h support at 226.5)
▪️ Take profit 2: 222.9 (-4.4%, R:R 1:2.8; only if the price breaks below 226.5; estimated beyond that level using a risk multiple)
Pending order: current price is 231.1, not yet in the entry zone.
▪️ Short-term money flow: aggressive buying at 44.0% over 15 minutes, 45.4% over 1 hour, and 49.9% over 4 hours
▪️ Supporting factor: aligned with the 1h and 4h trend (currently bearish)
▪️ Risk factor: this is a PENDING ORDER: current price is 231.1 and needs to rebound about 0.9% to reach the entry zone; if the price doesn't get there, don't enter
Data as of 03:16 11/11 (UTC+7).
At 244.4, are you leaning long or short?
Manage your risk before entering a trade.
Not investment advice. DYOR.
#BinanceSquare #BCH
📊 TECHNICALS: All three timeframes—1d, 4h, and 1h—are bearish. The price is below both the EMA20 and EMA50, so the trend favors shorts. The 1d MACD is negative and widening, which means downward momentum has not weakened yet.
💰 MONEY FLOW: Binance spot, aggressive buying over 1 hour: 45.4%—sellers are more aggressive. Binance Futures OI is $61.7 million; combined OI across 3 exchanges fell 0.168% as the price declined, meaning longs are trimming positions, with no new shorts entering yet.
₿ VS. BTC: Over the past 24 hours, during hours when BTC rose, its cumulative gain was +3.31% while BCH gained +1.77%; during hours when BTC fell, its cumulative loss was -5.09% while BCH fell -5.54%. BCH is weaker than BTC: it rises less and falls more.
🎯 $BCH LEVELS TO WATCH: support 225.5 USDT · resistance 244.4 USDT
🔎 CONCLUSION: Wait for the price to rebound to 244.4 before shorting; don't enter now. At 231.1, the price still needs to rebound about 0.9% to reach the entry zone. If it doesn't get there, don't enter. Aggressive buying at 45.4% over 1 hour and all three timeframes trending down support this approach.
🧭 $BCH swing-trading plan: wait for the price to rebound to resistance, then short in line with the downtrend (score 8/10)
📌 ORDER LEVELS
▪️ Entry zone: 233.1–234
▪️ Stop-loss: 236.7 (+1.6%; above both the 1h EMA20 at 234 and the sell order wall at 236.3 (present on 1 exchange); if the price reaches this level, the setup is invalidated)
▪️ Take profit 1: 227.5 (-2.4%, R:R 1:1.6; just before 1h support at 226.5)
▪️ Take profit 2: 222.9 (-4.4%, R:R 1:2.8; only if the price breaks below 226.5; estimated beyond that level using a risk multiple)
Pending order: current price is 231.1, not yet in the entry zone.
▪️ Short-term money flow: aggressive buying at 44.0% over 15 minutes, 45.4% over 1 hour, and 49.9% over 4 hours
▪️ Supporting factor: aligned with the 1h and 4h trend (currently bearish)
▪️ Risk factor: this is a PENDING ORDER: current price is 231.1 and needs to rebound about 0.9% to reach the entry zone; if the price doesn't get there, don't enter
Data as of 03:16 11/11 (UTC+7).
At 244.4, are you leaning long or short?
Manage your risk before entering a trade.
Not investment advice. DYOR.
#BinanceSquare #BCH
📉 BEARISH | $SUI is the decline following the trend, or has momentum run out? All three timeframes—1d, 4h, and 1h—are down, so wait for the price to rebound to 0.8291 before shorting; don't enter immediately.
📊 TECHNICALS: All three timeframes are down, so the short-term trend is bearish. The price is below the 4h EMA20 (0.84053), and the 4h MACD is negative and widening, so selling momentum has not weakened yet.
💰 MONEY FLOW: On Binance spot, aggressive buying is at 49.0% over 15 minutes, 43.1% over 1 hour, and 45.4% over 4 hours, so sellers are dominating. The crowd is 71.1% long, while top traders on OKX and Gate are only 44.6% and 46.9% long.
₿ VS. BTC: Over the past 24 hours, during the hours when BTC rose, its cumulative gain was +3.31%, while SUI gained +2.9%; during the hours when BTC fell, its cumulative loss was -5.09%, while SUI fell -6.25%. SUI is weaker than BTC: it rises less and falls more.
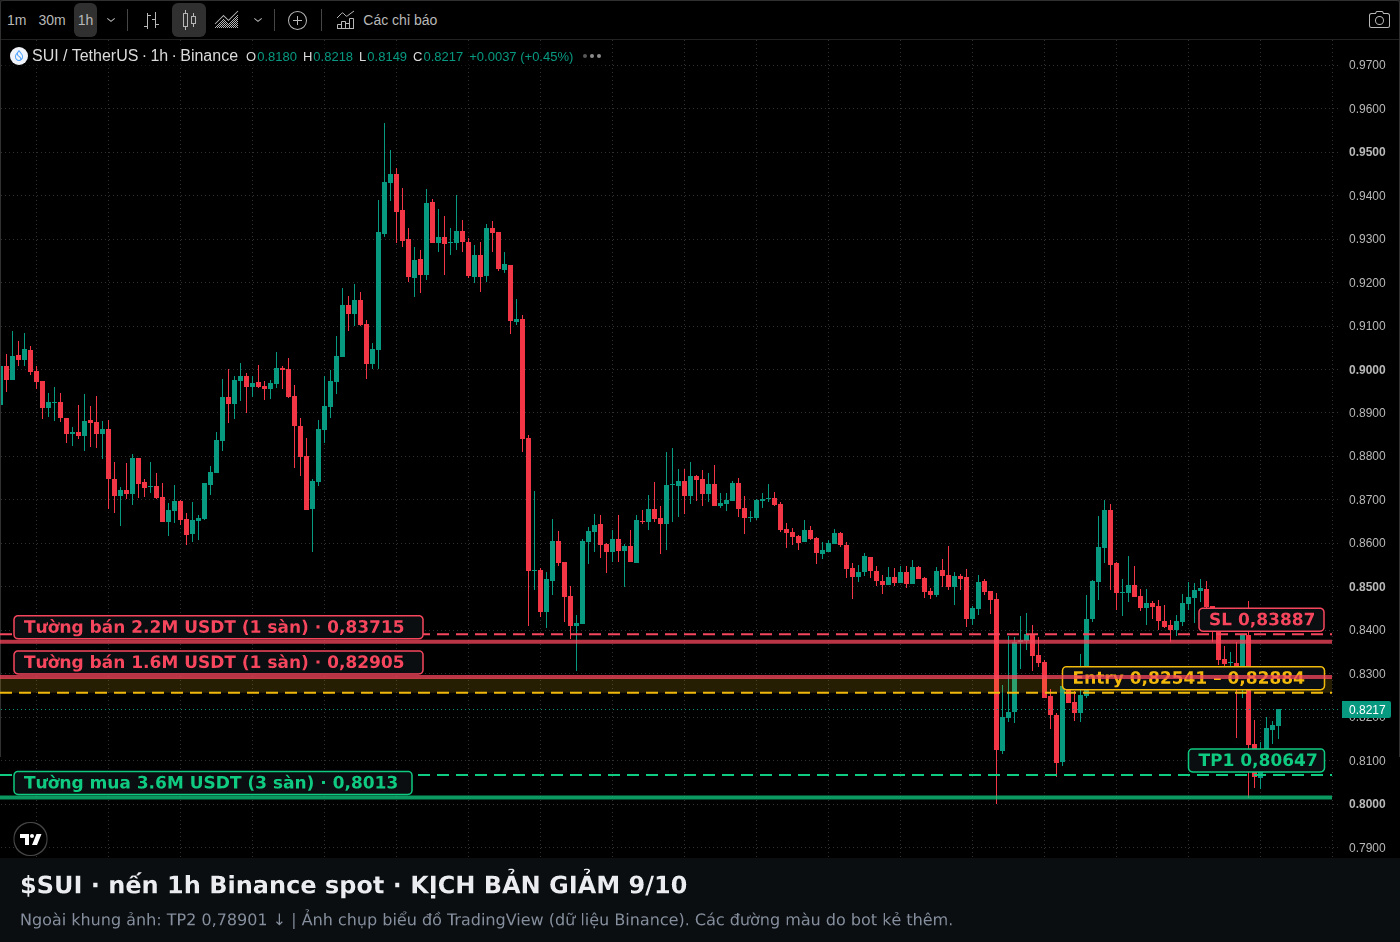
🎯 $SUI LEVELS TO WATCH: support 0.8 USDT · resistance 0.8291 USDT
🔎 CONCLUSION: All three timeframes are down, giving short sellers the advantage, but the price at 0.8192 is still about 1.2% below the 0.8291 resistance. Wait for a rebound to that level before shorting; don't enter immediately.
🧭 $SUI swing-trading plan: wait for the price to rebound to resistance, then short in line with the downtrend (score 9/10)
Buy/sell balance: aggressive buying is 49.0% over 15 minutes, 43.1% over 1 hour, and 45.4% over 4 hours
Basis: there is a sell-order wall of around 1.6 million USDT at 0.8291 (Binance Futures: 1.6 million; only one exchange, so the level is less reliable)
Risk: this is a PENDING ORDER: current price is 0.8192 and must rebound about 0.8% to reach the entry zone; if the price doesn't reach it, don't enter
Risk/reward ratio (R:R): 1:1.4 to the first target, 1:2.7 to the second target
📌 ENTRY AND EXIT POINTS
Enter within the 0.8254–0.8288 range.
Stop loss at 0.8389 (+1.6%).
Take profit at 0.8065 (-2.3%) for the first target; second target at 0.789 (-4.4%).
Pending order: current price is 0.8192, not yet in the entry zone.
Data as of 03:16 11/11 (UTC+7).
At 0.8291, do you favor the long or short side, and why?
Manage your capital before entering a trade.
Not investment advice. DYOR.
#BinanceSquare #SUI #Crypto
📉 BEARISH | $SUI is the decline following the trend, or has momentum run out? All three timeframes—1d, 4h, and 1h—are down, so wait for the price to rebound to 0.8291 before shorting; don't enter immediately.
📊 TECHNICALS: All three timeframes are down, so the short-term trend is bearish. The price is below the 4h EMA20 (0.84053), and the 4h MACD is negative and widening, so selling momentum has not weakened yet.
💰 MONEY FLOW: On Binance spot, aggressive buying is at 49.0% over 15 minutes, 43.1% over 1 hour, and 45.4% over 4 hours, so sellers are dominating. The crowd is 71.1% long, while top traders on OKX and Gate are only 44.6% and 46.9% long.
₿ VS. BTC: Over the past 24 hours, during the hours when BTC rose, its cumulative gain was +3.31%, while SUI gained +2.9%; during the hours when BTC fell, its cumulative loss was -5.09%, while SUI fell -6.25%. SUI is weaker than BTC: it rises less and falls more.
🎯 $SUI LEVELS TO WATCH: support 0.8 USDT · resistance 0.8291 USDT
🔎 CONCLUSION: All three timeframes are down, giving short sellers the advantage, but the price at 0.8192 is still about 1.2% below the 0.8291 resistance. Wait for a rebound to that level before shorting; don't enter immediately.
🧭 $SUI swing-trading plan: wait for the price to rebound to resistance, then short in line with the downtrend (score 9/10)
Buy/sell balance: aggressive buying is 49.0% over 15 minutes, 43.1% over 1 hour, and 45.4% over 4 hours
Basis: there is a sell-order wall of around 1.6 million USDT at 0.8291 (Binance Futures: 1.6 million; only one exchange, so the level is less reliable)
Risk: this is a PENDING ORDER: current price is 0.8192 and must rebound about 0.8% to reach the entry zone; if the price doesn't reach it, don't enter
Risk/reward ratio (R:R): 1:1.4 to the first target, 1:2.7 to the second target
📌 ENTRY AND EXIT POINTS
Enter within the 0.8254–0.8288 range.
Stop loss at 0.8389 (+1.6%).
Take profit at 0.8065 (-2.3%) for the first target; second target at 0.789 (-4.4%).
Pending order: current price is 0.8192, not yet in the entry zone.
Data as of 03:16 11/11 (UTC+7).
At 0.8291, do you favor the long or short side, and why?
Manage your capital before entering a trade.
Not investment advice. DYOR.
#BinanceSquare #SUI #Crypto
📊 TECHNICALS: All three timeframes are down, so the short-term trend is bearish. The price is below the 4h EMA20 (0.84053), and the 4h MACD is negative and widening, so selling momentum has not weakened yet.
💰 MONEY FLOW: On Binance spot, aggressive buying is at 49.0% over 15 minutes, 43.1% over 1 hour, and 45.4% over 4 hours, so sellers are dominating. The crowd is 71.1% long, while top traders on OKX and Gate are only 44.6% and 46.9% long.
₿ VS. BTC: Over the past 24 hours, during the hours when BTC rose, its cumulative gain was +3.31%, while SUI gained +2.9%; during the hours when BTC fell, its cumulative loss was -5.09%, while SUI fell -6.25%. SUI is weaker than BTC: it rises less and falls more.
🎯 $SUI LEVELS TO WATCH: support 0.8 USDT · resistance 0.8291 USDT
🔎 CONCLUSION: All three timeframes are down, giving short sellers the advantage, but the price at 0.8192 is still about 1.2% below the 0.8291 resistance. Wait for a rebound to that level before shorting; don't enter immediately.
🧭 $SUI swing-trading plan: wait for the price to rebound to resistance, then short in line with the downtrend (score 9/10)
Buy/sell balance: aggressive buying is 49.0% over 15 minutes, 43.1% over 1 hour, and 45.4% over 4 hours
Basis: there is a sell-order wall of around 1.6 million USDT at 0.8291 (Binance Futures: 1.6 million; only one exchange, so the level is less reliable)
Risk: this is a PENDING ORDER: current price is 0.8192 and must rebound about 0.8% to reach the entry zone; if the price doesn't reach it, don't enter
Risk/reward ratio (R:R): 1:1.4 to the first target, 1:2.7 to the second target
📌 ENTRY AND EXIT POINTS
Enter within the 0.8254–0.8288 range.
Stop loss at 0.8389 (+1.6%).
Take profit at 0.8065 (-2.3%) for the first target; second target at 0.789 (-4.4%).
Pending order: current price is 0.8192, not yet in the entry zone.
Data as of 03:16 11/11 (UTC+7).
At 0.8291, do you favor the long or short side, and why?
Manage your capital before entering a trade.
Not investment advice. DYOR.
#BinanceSquare #SUI #Crypto
11
↔️ NEUTRAL | $PENGU short-term decline is likely, but this is a WAIT order: the price is 0,006139 and still needs to rebound about 1,2% to reach the entry zone, so wait for the price to bounce up to resistance before shorting. Price is below the EMA on all three timeframes, and 1-hour aggressive buying is only 42,7%.
📊 TECHNICALS: Price is below the EMA20 and EMA50 on the daily, 4h, and 1h timeframes, so all three timeframes are trending down. This is a small-cap coin, so technical analysis is only partially reliable; the 4h MACD is positive but narrowing.
💰 MONEY FLOW: On Binance spot, aggressive buying is 42,7% over 1 hour and 47,4% over 4 hours, meaning sellers are more aggressive. In contrast, Binance top traders hold 72,2% long positions, while the crowd holds 43,9%, but that is not enough to change the direction while the price remains below the EMA.
₿ VS. BTC: Over the past 24 hours, during the hours when BTC rose, its cumulative gain was +3,23%, while PENGU gained +2,35%; during the hours when BTC fell, its cumulative loss was -5,18%, while PENGU fell -5,78%. PENGU is weaker than BTC: it rises less and falls more.
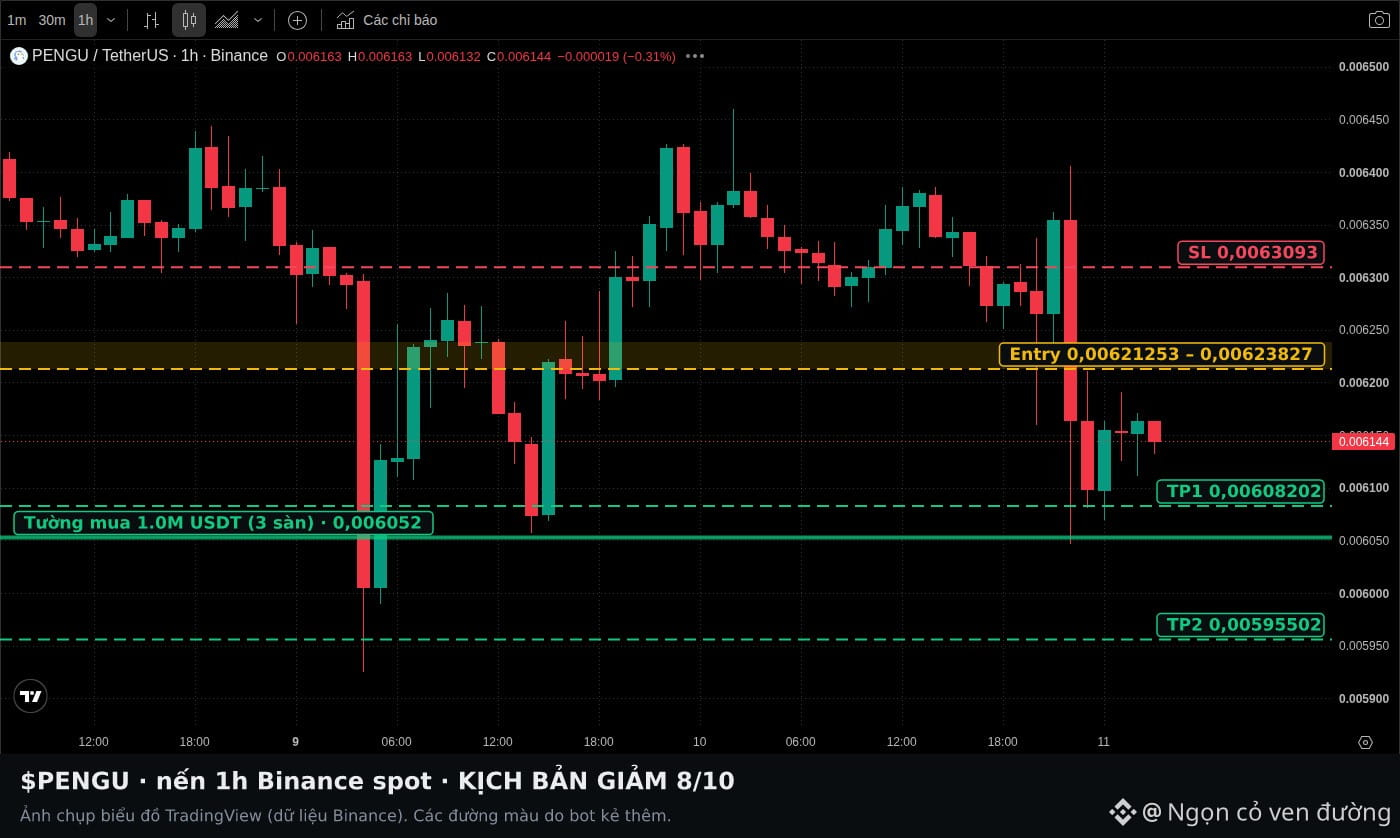
🎯 $PENGU LEVELS TO WATCH: support 0,005925 USDT · resistance 0,006386 USDT
🔎 CONCLUSION: Price is below the EMA on all three timeframes, and 1-hour aggressive buying is only 42,7%, both of which favor a trend-following short. However, this is a short-term move, as the overall outlook in this post is neutral.
🧭 $PENGU trading plan: wait for the price to bounce up to resistance, then short in line with the downtrend
Buy/sell ratio: aggressive buying is 46,0% over 15 minutes, 42,7% over 1 hour, and 47,4% over 4 hours
Basis: in line with the 1h and 4h trends (currently declining)
Risk: this is a WAIT ORDER: the current price is 0,006139 and must rebound about 1,2% to reach the entry zone; if the price does not reach it, do not enter
Setup score 8/10; reward-to-risk ratio (R:R) is 1:1,4 to the first target and 1:2,7 to the next target
✅ ENTRY PLAN
Enter within the 0,006213 – 0,006238 zone.
Stop loss at 0,006309 (+1,6%).
Take profit: first at 0,006082 (-2,1%); second at 0,005955 (-4,2%).
Wait order: the current price is 0,006139, and has not reached the entry zone.
Data as of 03:01 11/11 (UTC+7).
At 0,006386, do you lean long or short, and why?
Manage your capital before entering a trade.
Not investment advice. DYOR.
#BinanceSquare #PENGU
↔️ NEUTRAL | $PENGU short-term decline is likely, but this is a WAIT order: the price is 0,006139 and still needs to rebound about 1,2% to reach the entry zone, so wait for the price to bounce up to resistance before shorting. Price is below the EMA on all three timeframes, and 1-hour aggressive buying is only 42,7%.
📊 TECHNICALS: Price is below the EMA20 and EMA50 on the daily, 4h, and 1h timeframes, so all three timeframes are trending down. This is a small-cap coin, so technical analysis is only partially reliable; the 4h MACD is positive but narrowing.
💰 MONEY FLOW: On Binance spot, aggressive buying is 42,7% over 1 hour and 47,4% over 4 hours, meaning sellers are more aggressive. In contrast, Binance top traders hold 72,2% long positions, while the crowd holds 43,9%, but that is not enough to change the direction while the price remains below the EMA.
₿ VS. BTC: Over the past 24 hours, during the hours when BTC rose, its cumulative gain was +3,23%, while PENGU gained +2,35%; during the hours when BTC fell, its cumulative loss was -5,18%, while PENGU fell -5,78%. PENGU is weaker than BTC: it rises less and falls more.
🎯 $PENGU LEVELS TO WATCH: support 0,005925 USDT · resistance 0,006386 USDT
🔎 CONCLUSION: Price is below the EMA on all three timeframes, and 1-hour aggressive buying is only 42,7%, both of which favor a trend-following short. However, this is a short-term move, as the overall outlook in this post is neutral.
🧭 $PENGU trading plan: wait for the price to bounce up to resistance, then short in line with the downtrend
Buy/sell ratio: aggressive buying is 46,0% over 15 minutes, 42,7% over 1 hour, and 47,4% over 4 hours
Basis: in line with the 1h and 4h trends (currently declining)
Risk: this is a WAIT ORDER: the current price is 0,006139 and must rebound about 1,2% to reach the entry zone; if the price does not reach it, do not enter
Setup score 8/10; reward-to-risk ratio (R:R) is 1:1,4 to the first target and 1:2,7 to the next target
✅ ENTRY PLAN
Enter within the 0,006213 – 0,006238 zone.
Stop loss at 0,006309 (+1,6%).
Take profit: first at 0,006082 (-2,1%); second at 0,005955 (-4,2%).
Wait order: the current price is 0,006139, and has not reached the entry zone.
Data as of 03:01 11/11 (UTC+7).
At 0,006386, do you lean long or short, and why?
Manage your capital before entering a trade.
Not investment advice. DYOR.
#BinanceSquare #PENGU
📊 TECHNICALS: Price is below the EMA20 and EMA50 on the daily, 4h, and 1h timeframes, so all three timeframes are trending down. This is a small-cap coin, so technical analysis is only partially reliable; the 4h MACD is positive but narrowing.
💰 MONEY FLOW: On Binance spot, aggressive buying is 42,7% over 1 hour and 47,4% over 4 hours, meaning sellers are more aggressive. In contrast, Binance top traders hold 72,2% long positions, while the crowd holds 43,9%, but that is not enough to change the direction while the price remains below the EMA.
₿ VS. BTC: Over the past 24 hours, during the hours when BTC rose, its cumulative gain was +3,23%, while PENGU gained +2,35%; during the hours when BTC fell, its cumulative loss was -5,18%, while PENGU fell -5,78%. PENGU is weaker than BTC: it rises less and falls more.
🎯 $PENGU LEVELS TO WATCH: support 0,005925 USDT · resistance 0,006386 USDT
🔎 CONCLUSION: Price is below the EMA on all three timeframes, and 1-hour aggressive buying is only 42,7%, both of which favor a trend-following short. However, this is a short-term move, as the overall outlook in this post is neutral.
🧭 $PENGU trading plan: wait for the price to bounce up to resistance, then short in line with the downtrend
Buy/sell ratio: aggressive buying is 46,0% over 15 minutes, 42,7% over 1 hour, and 47,4% over 4 hours
Basis: in line with the 1h and 4h trends (currently declining)
Risk: this is a WAIT ORDER: the current price is 0,006139 and must rebound about 1,2% to reach the entry zone; if the price does not reach it, do not enter
Setup score 8/10; reward-to-risk ratio (R:R) is 1:1,4 to the first target and 1:2,7 to the next target
✅ ENTRY PLAN
Enter within the 0,006213 – 0,006238 zone.
Stop loss at 0,006309 (+1,6%).
Take profit: first at 0,006082 (-2,1%); second at 0,005955 (-4,2%).
Wait order: the current price is 0,006139, and has not reached the entry zone.
Data as of 03:01 11/11 (UTC+7).
At 0,006386, do you lean long or short, and why?
Manage your capital before entering a trade.
Not investment advice. DYOR.
#BinanceSquare #PENGU
40
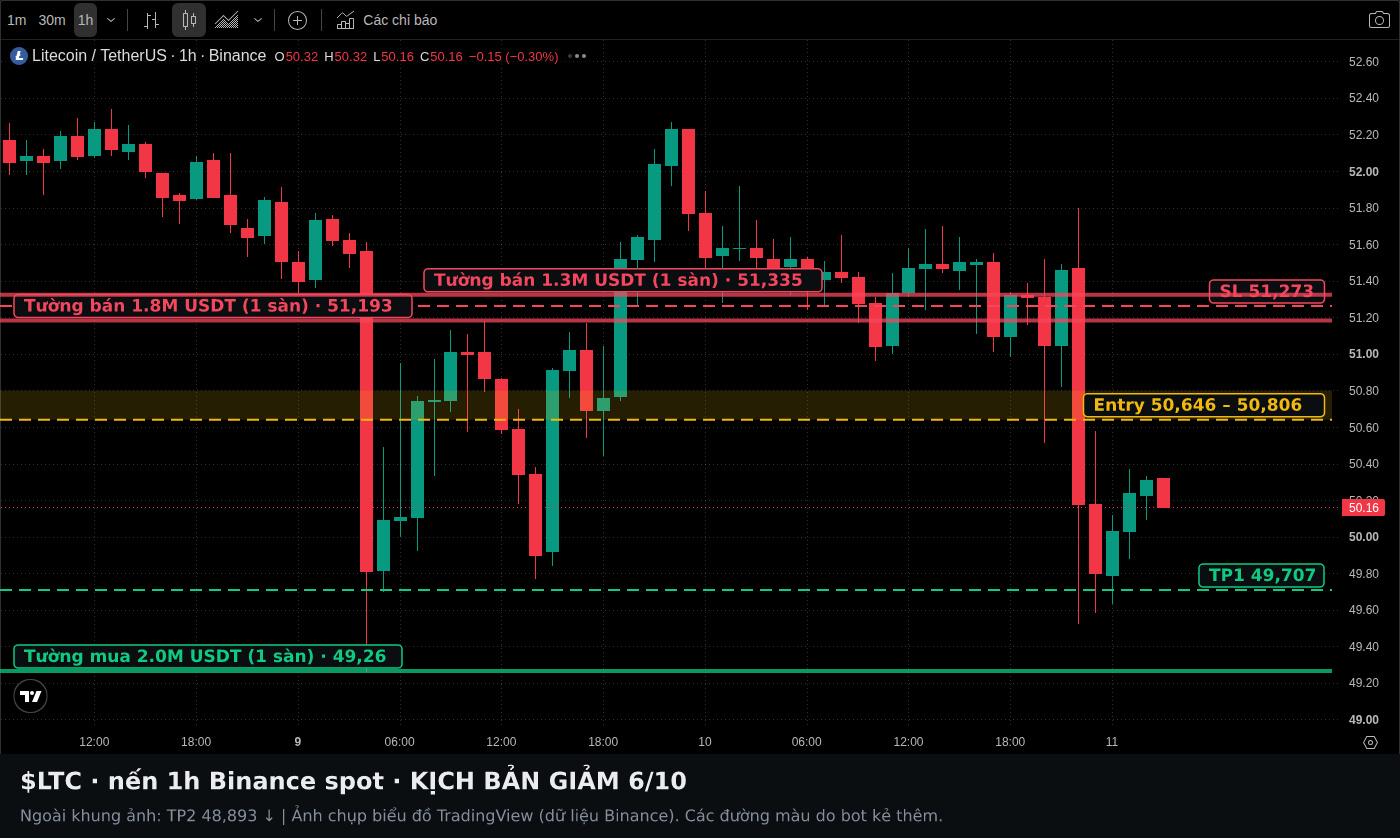
📉 BEARISH BIAS | $LTC Bearish bias, price at 50.23 USDT (-2.69% in 24 hours) is below the 4h EMA20. This is a WAITING order: price must rebound about 0.8% to the resistance zone before shorting; don't enter immediately.
💰 MONEY FLOW: On Binance spot, sellers dominated over 24 hours (46.3% aggressive buying) and 7 days (47.4%), meaning selling pressure remains in control; the 1-hour buying move (51.3%) goes against the trend, but 15 minutes (47.5%) and 4 hours (47.3%) are still below 50%, so there's not enough to signal a reversal. On Binance Futures, 69.3% of top traders are long and 66.7% of the crowd is long; longs are crowded, but spot buying hasn't followed through.
₿ VS. BTC: Over the past 24 hours, during the hours BTC rose, gains totaled +3.23%, while LTC gained +2.7%; during the hours BTC fell, losses totaled -5.18%, while LTC fell -5.21%. LTC is weaker than BTC: it rises less and falls more.
🎯 $LTC LEVELS TO WATCH: support 49.26 USDT · resistance 51.34 USDT
🔎 CONCLUSION: Price below the 4h EMA20 and sellers dominating over 24 hours (46.3% aggressive buying) support a trend-following short when price rebounds to the resistance zone; don't enter immediately. The 1-hour buying move at 51.3% may only be a short-term rebound.
🧭 WAIT FOR PRICE TO REBOUND TO RESISTANCE, THEN SHORT WITH THE DOWNTREND · score 6/10
📍 ORDER PRICE ZONE
→ Entry zone: 50.65 – 50.81
→ Stop loss: 51.27 (+1.2%)
→ Take profit 1: 49.71 (-1.9%, R:R 1:1.5)
→ Take profit 2: 48.89 (-3.5%, R:R 1:2.8)
Waiting order: current price is 50.23, not yet in the entry zone.
→ Exchange money flow: aggressive buying at 15 minutes 47.5%, 1 hour 51.3%, 4 hours 47.3%
→ Basis: aligned with the 1h and 4h trend (currently declining)
→ Note: this is a WAITING ORDER: current price is 50.23 and needs to rebound about 0.8% to reach the entry zone; if price doesn't reach it, don't enter.
Data at 03:01 11/11 (UTC+7).
At 51.34 USDT, do you favor longs or shorts, and why?
Manage your capital before entering a trade.
Not investment advice. DYOR.
#BinanceSquare #Litecoin #LTC
📉 BEARISH BIAS | $LTC Bearish bias, price at 50.23 USDT (-2.69% in 24 hours) is below the 4h EMA20. This is a WAITING order: price must rebound about 0.8% to the resistance zone before shorting; don't enter immediately.
💰 MONEY FLOW: On Binance spot, sellers dominated over 24 hours (46.3% aggressive buying) and 7 days (47.4%), meaning selling pressure remains in control; the 1-hour buying move (51.3%) goes against the trend, but 15 minutes (47.5%) and 4 hours (47.3%) are still below 50%, so there's not enough to signal a reversal. On Binance Futures, 69.3% of top traders are long and 66.7% of the crowd is long; longs are crowded, but spot buying hasn't followed through.
₿ VS. BTC: Over the past 24 hours, during the hours BTC rose, gains totaled +3.23%, while LTC gained +2.7%; during the hours BTC fell, losses totaled -5.18%, while LTC fell -5.21%. LTC is weaker than BTC: it rises less and falls more.
🎯 $LTC LEVELS TO WATCH: support 49.26 USDT · resistance 51.34 USDT
🔎 CONCLUSION: Price below the 4h EMA20 and sellers dominating over 24 hours (46.3% aggressive buying) support a trend-following short when price rebounds to the resistance zone; don't enter immediately. The 1-hour buying move at 51.3% may only be a short-term rebound.
🧭 WAIT FOR PRICE TO REBOUND TO RESISTANCE, THEN SHORT WITH THE DOWNTREND · score 6/10
📍 ORDER PRICE ZONE
→ Entry zone: 50.65 – 50.81
→ Stop loss: 51.27 (+1.2%)
→ Take profit 1: 49.71 (-1.9%, R:R 1:1.5)
→ Take profit 2: 48.89 (-3.5%, R:R 1:2.8)
Waiting order: current price is 50.23, not yet in the entry zone.
→ Exchange money flow: aggressive buying at 15 minutes 47.5%, 1 hour 51.3%, 4 hours 47.3%
→ Basis: aligned with the 1h and 4h trend (currently declining)
→ Note: this is a WAITING ORDER: current price is 50.23 and needs to rebound about 0.8% to reach the entry zone; if price doesn't reach it, don't enter.
Data at 03:01 11/11 (UTC+7).
At 51.34 USDT, do you favor longs or shorts, and why?
Manage your capital before entering a trade.
Not investment advice. DYOR.
#BinanceSquare #Litecoin #LTC
💰 MONEY FLOW: On Binance spot, sellers dominated over 24 hours (46.3% aggressive buying) and 7 days (47.4%), meaning selling pressure remains in control; the 1-hour buying move (51.3%) goes against the trend, but 15 minutes (47.5%) and 4 hours (47.3%) are still below 50%, so there's not enough to signal a reversal. On Binance Futures, 69.3% of top traders are long and 66.7% of the crowd is long; longs are crowded, but spot buying hasn't followed through.
₿ VS. BTC: Over the past 24 hours, during the hours BTC rose, gains totaled +3.23%, while LTC gained +2.7%; during the hours BTC fell, losses totaled -5.18%, while LTC fell -5.21%. LTC is weaker than BTC: it rises less and falls more.
🎯 $LTC LEVELS TO WATCH: support 49.26 USDT · resistance 51.34 USDT
🔎 CONCLUSION: Price below the 4h EMA20 and sellers dominating over 24 hours (46.3% aggressive buying) support a trend-following short when price rebounds to the resistance zone; don't enter immediately. The 1-hour buying move at 51.3% may only be a short-term rebound.
🧭 WAIT FOR PRICE TO REBOUND TO RESISTANCE, THEN SHORT WITH THE DOWNTREND · score 6/10
📍 ORDER PRICE ZONE
→ Entry zone: 50.65 – 50.81
→ Stop loss: 51.27 (+1.2%)
→ Take profit 1: 49.71 (-1.9%, R:R 1:1.5)
→ Take profit 2: 48.89 (-3.5%, R:R 1:2.8)
Waiting order: current price is 50.23, not yet in the entry zone.
→ Exchange money flow: aggressive buying at 15 minutes 47.5%, 1 hour 51.3%, 4 hours 47.3%
→ Basis: aligned with the 1h and 4h trend (currently declining)
→ Note: this is a WAITING ORDER: current price is 50.23 and needs to rebound about 0.8% to reach the entry zone; if price doesn't reach it, don't enter.
Data at 03:01 11/11 (UTC+7).
At 51.34 USDT, do you favor longs or shorts, and why?
Manage your capital before entering a trade.
Not investment advice. DYOR.
#BinanceSquare #Litecoin #LTC
4
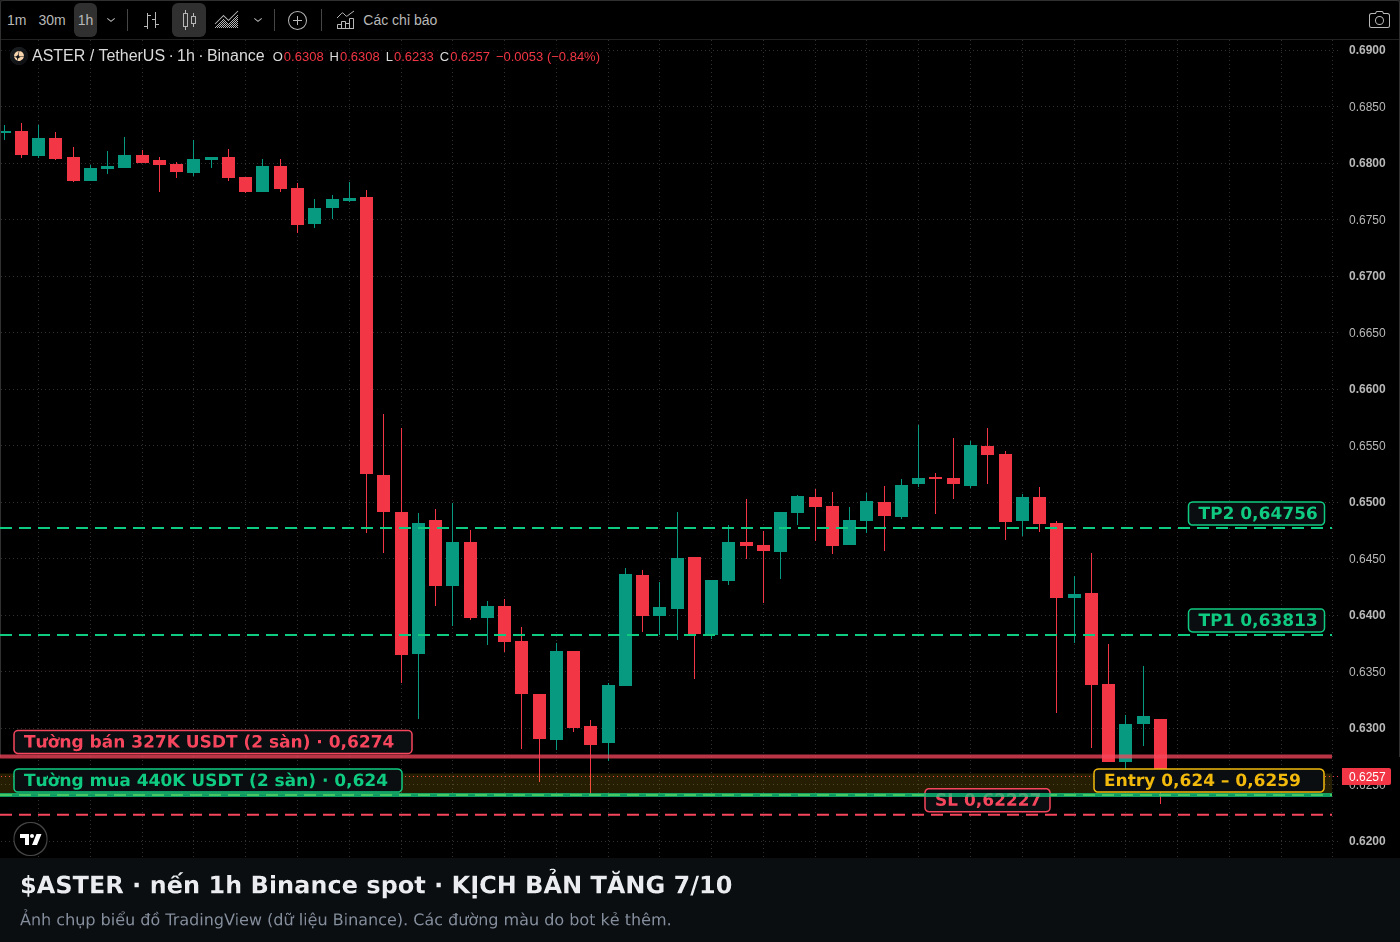
📉 BEARISH | $ASTER Bearish, but aggressive buying over the last 15 minutes reached 61.8% on Binance spot. The bullish scenario applies only to the 1h timeframe, as a short-term scalp.
📊 TECHNICALS: The daily, 4h, and 1h timeframes are all bearish, with price below the EMA20 and EMA50 on all three. The 4h RSI is 28.4, in oversold territory, so a bounce is possible, but the initial target is only the 1h EMA20 at 0.64067.
💰 MONEY FLOW: Aggressive buying on Binance spot was 61.8% over 15 minutes, but only 41.0% over 4 hours, so buying momentum is limited to the short term. Binance top traders hold 79.8% of positions long, while the figure on OKX is only 47.3%.
📰 NEWS: Cointelegraph (11/11, 00:31): U.S. October inflation came in above forecasts, increasing the likelihood of the Fed raising rates by half a percentage point in December.
₿ VS. BTC: Over the past 24 hours, during the hours when BTC rose, its cumulative gain was +3.23%, while ASTER gained +2.03%; during the hours when BTC fell, its cumulative loss was -5.24%, while ASTER fell -5.18%. ASTER is weaker than BTC: it rises less and falls more.
🎯 LEVELS TO WATCH FOR $ASTER: support 0.624 USDT · resistance 0.6566 USDT
🧭 $ASTER trading plan: long a technical bounce, against the trend
📍 ORDER PRICE ZONE
– Entry: 0.624 – 0.6259
– SL: 0.6223 (-0.6%; below the 0.624 buy wall (present on 2 exchanges), 0.5x the 1h ATR from entry to avoid noise; if price reaches this level, the scenario is invalidated)
– TP1: 0.6381 (+1.9%, R:R 1:3.4; just before the 1h EMA20 at 0.6407)
– TP2: 0.6476 (+3.5%, R:R 1:6; just before the 1h resistance at 0.6501)
– Short-term money flow: aggressive buying 61.8% over 15 minutes, 51.3% over 1 hour, 41.0% over 4 hours
– Supporting factors: 1h RSI 30.5 (oversold); a buy wall of approximately 440,000 USDT at 0.624 (190,000 on Binance spot, 250,000 on OKX; across 2 exchanges: a FIRM level)
– Adverse factors: AGAINST the 1h trend (currently bearish): this is only a short-term bounce, with the initial target at the 1h EMA20; BTC is bearish on the 1h timeframe
– Scenario rating: 7/10
Data as of 02:16 11/11 (UTC+7).
Between 0.624 and 0.6566, do you lean long or short, and why?
Manage your risk before entering a trade.
Not investment advice. DYOR.
#BinanceSquare #ASTER
📉 BEARISH | $ASTER Bearish, but aggressive buying over the last 15 minutes reached 61.8% on Binance spot. The bullish scenario applies only to the 1h timeframe, as a short-term scalp.
📊 TECHNICALS: The daily, 4h, and 1h timeframes are all bearish, with price below the EMA20 and EMA50 on all three. The 4h RSI is 28.4, in oversold territory, so a bounce is possible, but the initial target is only the 1h EMA20 at 0.64067.
💰 MONEY FLOW: Aggressive buying on Binance spot was 61.8% over 15 minutes, but only 41.0% over 4 hours, so buying momentum is limited to the short term. Binance top traders hold 79.8% of positions long, while the figure on OKX is only 47.3%.
📰 NEWS: Cointelegraph (11/11, 00:31): U.S. October inflation came in above forecasts, increasing the likelihood of the Fed raising rates by half a percentage point in December.
₿ VS. BTC: Over the past 24 hours, during the hours when BTC rose, its cumulative gain was +3.23%, while ASTER gained +2.03%; during the hours when BTC fell, its cumulative loss was -5.24%, while ASTER fell -5.18%. ASTER is weaker than BTC: it rises less and falls more.
🎯 LEVELS TO WATCH FOR $ASTER : support 0.624 USDT · resistance 0.6566 USDT
🧭 $ASTER trading plan: long a technical bounce, against the trend
📍 ORDER PRICE ZONE
– Entry: 0.624 – 0.6259
– SL: 0.6223 (-0.6%; below the 0.624 buy wall (present on 2 exchanges), 0.5x the 1h ATR from entry to avoid noise; if price reaches this level, the scenario is invalidated)
– TP1: 0.6381 (+1.9%, R:R 1:3.4; just before the 1h EMA20 at 0.6407)
– TP2: 0.6476 (+3.5%, R:R 1:6; just before the 1h resistance at 0.6501)
– Short-term money flow: aggressive buying 61.8% over 15 minutes, 51.3% over 1 hour, 41.0% over 4 hours
– Supporting factors: 1h RSI 30.5 (oversold); a buy wall of approximately 440,000 USDT at 0.624 (190,000 on Binance spot, 250,000 on OKX; across 2 exchanges: a FIRM level)
– Adverse factors: AGAINST the 1h trend (currently bearish): this is only a short-term bounce, with the initial target at the 1h EMA20; BTC is bearish on the 1h timeframe
– Scenario rating: 7/10
Data as of 02:16 11/11 (UTC+7).
Between 0.624 and 0.6566, do you lean long or short, and why?
Manage your risk before entering a trade.
Not investment advice. DYOR.
#BinanceSquare #ASTER
📊 TECHNICALS: The daily, 4h, and 1h timeframes are all bearish, with price below the EMA20 and EMA50 on all three. The 4h RSI is 28.4, in oversold territory, so a bounce is possible, but the initial target is only the 1h EMA20 at 0.64067.
💰 MONEY FLOW: Aggressive buying on Binance spot was 61.8% over 15 minutes, but only 41.0% over 4 hours, so buying momentum is limited to the short term. Binance top traders hold 79.8% of positions long, while the figure on OKX is only 47.3%.
📰 NEWS: Cointelegraph (11/11, 00:31): U.S. October inflation came in above forecasts, increasing the likelihood of the Fed raising rates by half a percentage point in December.
₿ VS. BTC: Over the past 24 hours, during the hours when BTC rose, its cumulative gain was +3.23%, while ASTER gained +2.03%; during the hours when BTC fell, its cumulative loss was -5.24%, while ASTER fell -5.18%. ASTER is weaker than BTC: it rises less and falls more.
🎯 LEVELS TO WATCH FOR $ASTER : support 0.624 USDT · resistance 0.6566 USDT
🧭 $ASTER trading plan: long a technical bounce, against the trend
📍 ORDER PRICE ZONE
– Entry: 0.624 – 0.6259
– SL: 0.6223 (-0.6%; below the 0.624 buy wall (present on 2 exchanges), 0.5x the 1h ATR from entry to avoid noise; if price reaches this level, the scenario is invalidated)
– TP1: 0.6381 (+1.9%, R:R 1:3.4; just before the 1h EMA20 at 0.6407)
– TP2: 0.6476 (+3.5%, R:R 1:6; just before the 1h resistance at 0.6501)
– Short-term money flow: aggressive buying 61.8% over 15 minutes, 51.3% over 1 hour, 41.0% over 4 hours
– Supporting factors: 1h RSI 30.5 (oversold); a buy wall of approximately 440,000 USDT at 0.624 (190,000 on Binance spot, 250,000 on OKX; across 2 exchanges: a FIRM level)
– Adverse factors: AGAINST the 1h trend (currently bearish): this is only a short-term bounce, with the initial target at the 1h EMA20; BTC is bearish on the 1h timeframe
– Scenario rating: 7/10
Data as of 02:16 11/11 (UTC+7).
Between 0.624 and 0.6566, do you lean long or short, and why?
Manage your risk before entering a trade.
Not investment advice. DYOR.
#BinanceSquare #ASTER
23
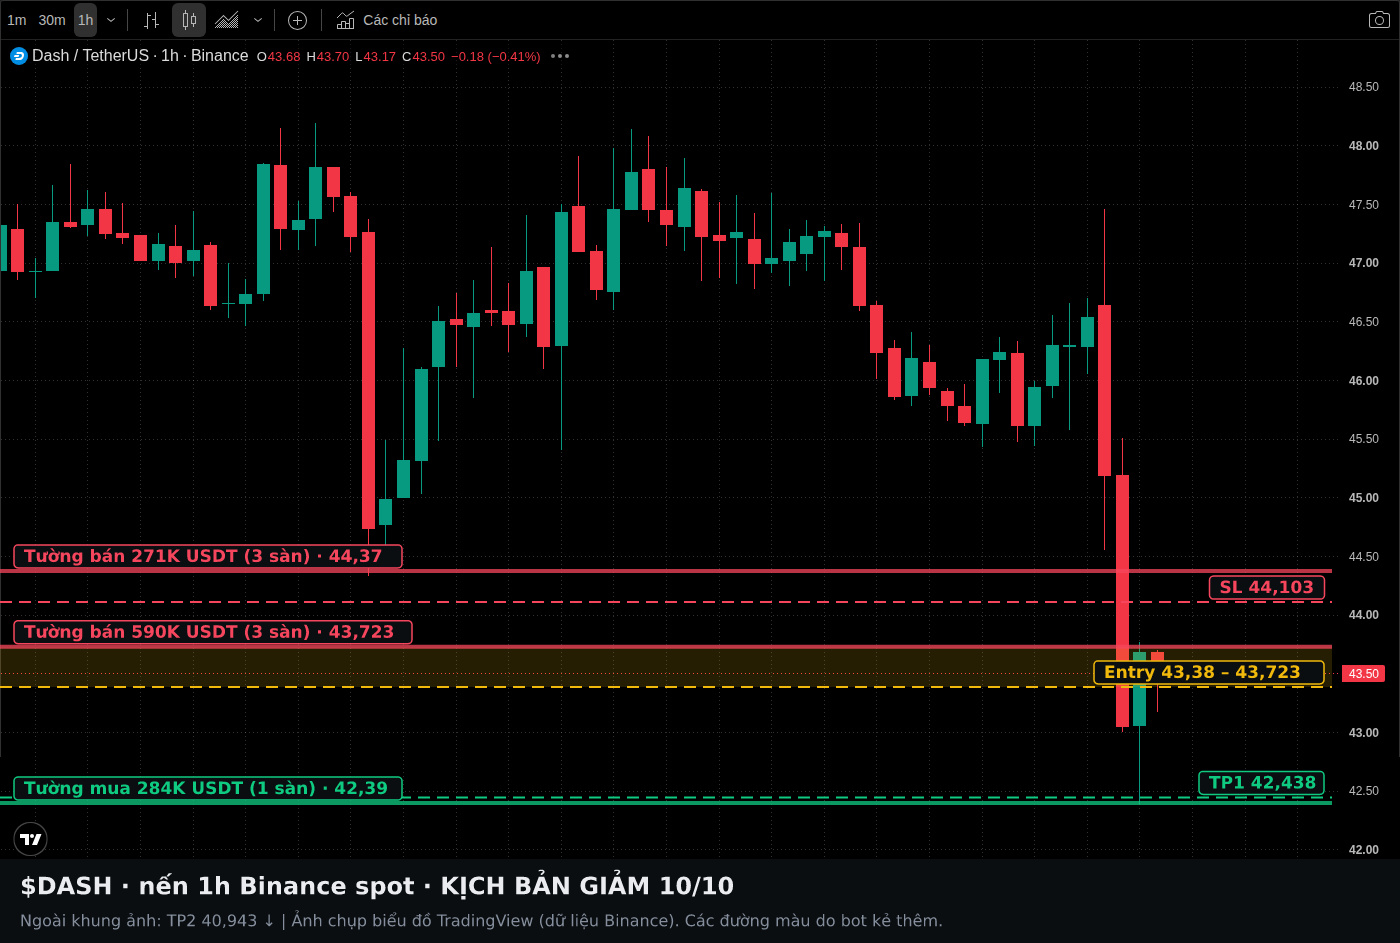
📉 BEARISH | $DASH is leaning bearish; the bearish scenario scores 10/10 on the 1h and 4h timeframes (short-term swing, primary timeframe: 1h). Price is down 7.98% in 24 hours, and sellers remain dominant.
📊 TECHNICALS: The daily, 4h, and 1h charts are all bearish, with price below both the EMA20 and EMA50 on all three. The 4h MACD (negative histogram, expanding) says the most: bearish momentum has not weakened. Overhead, there is a sell wall of around 590k USDT near 43.72 across 3 exchanges.
💰 FLOWS: On Binance spot, aggressive sellers are dominant; aggressive buying over the past hour is only 44.9%. On Binance Futures, funding at -0.0133%/8h means shorts are paying a fee; top traders are 74.4% long, while the crowd is 51.9%.
₿ VS. BTC: Over the past 24 hours, during the hours BTC rose, its cumulative gain was +3.38% while DASH gained +1.79%; during the hours BTC fell, its cumulative loss was -5.08% while DASH fell -10.14%. DASH is weaker than BTC: it rises less and falls more.
🎯 $DASH LEVELS TO WATCH: support 43.38 USDT · resistance 43.89 USDT
🧭 PULLBACK SCENARIO: price pulls back to resistance, then resumes moving lower · score 10/10 · R:R 1:0.9 to TP1, 1:2.4 to TP2
• Flows: aggressive buying is 41.9% over 15 minutes, 44.9% over 1 hour, and 44.9% over 4 hours
• Signals: aggressive sellers accounted for 58.1% over the last 15 minutes; sellers also accounted for 55.1% over the last hour; there is a sell wall of around 590k USDT right at 43.72 (Binance spot 68k, Binance Futures 447k, OKX 76k; across 3 exchanges: a HARD level); aligned with the 1h and 4h trend (currently bearish)
• Entry: 43.38–43.72 (from 1h resistance to the current price; don't chase if price moves further away)
• SL: 44.1 (+1.7%; just above 1h resistance at 43.72: a candle close above this level invalidates the pullback)
• TP1: 42.44–42.72 (-1.5%, R:R 1:0.9; just before the 24-hour low of 42.39)
• TP2: 40.94–41.67 (-4%, R:R 1:2.4; only if price breaks below 42.39; estimated beyond that using a risk multiple)
⚠️ Price is sitting right near support at 43.38; even a brief bounce could force shorts to cut their losses.
Data as of 01:31 11/11 (UTC+7).
In the 43.38–43.89 zone, are you leaning long or short, and why?
Manage your risk before entering a trade.
Not investment advice. DYOR.
#BinanceSquare #DASH #Crypto
📉 BEARISH | $DASH is leaning bearish; the bearish scenario scores 10/10 on the 1h and 4h timeframes (short-term swing, primary timeframe: 1h). Price is down 7.98% in 24 hours, and sellers remain dominant.
📊 TECHNICALS: The daily, 4h, and 1h charts are all bearish, with price below both the EMA20 and EMA50 on all three. The 4h MACD (negative histogram, expanding) says the most: bearish momentum has not weakened. Overhead, there is a sell wall of around 590k USDT near 43.72 across 3 exchanges.
💰 FLOWS: On Binance spot, aggressive sellers are dominant; aggressive buying over the past hour is only 44.9%. On Binance Futures, funding at -0.0133%/8h means shorts are paying a fee; top traders are 74.4% long, while the crowd is 51.9%.
₿ VS. BTC: Over the past 24 hours, during the hours BTC rose, its cumulative gain was +3.38% while DASH gained +1.79%; during the hours BTC fell, its cumulative loss was -5.08% while DASH fell -10.14%. DASH is weaker than BTC: it rises less and falls more.
🎯 $DASH LEVELS TO WATCH: support 43.38 USDT · resistance 43.89 USDT
🧭 PULLBACK SCENARIO: price pulls back to resistance, then resumes moving lower · score 10/10 · R:R 1:0.9 to TP1, 1:2.4 to TP2
• Flows: aggressive buying is 41.9% over 15 minutes, 44.9% over 1 hour, and 44.9% over 4 hours
• Signals: aggressive sellers accounted for 58.1% over the last 15 minutes; sellers also accounted for 55.1% over the last hour; there is a sell wall of around 590k USDT right at 43.72 (Binance spot 68k, Binance Futures 447k, OKX 76k; across 3 exchanges: a HARD level); aligned with the 1h and 4h trend (currently bearish)
• Entry: 43.38–43.72 (from 1h resistance to the current price; don't chase if price moves further away)
• SL: 44.1 (+1.7%; just above 1h resistance at 43.72: a candle close above this level invalidates the pullback)
• TP1: 42.44–42.72 (-1.5%, R:R 1:0.9; just before the 24-hour low of 42.39)
• TP2: 40.94–41.67 (-4%, R:R 1:2.4; only if price breaks below 42.39; estimated beyond that using a risk multiple)
⚠️ Price is sitting right near support at 43.38; even a brief bounce could force shorts to cut their losses.
Data as of 01:31 11/11 (UTC+7).
In the 43.38–43.89 zone, are you leaning long or short, and why?
Manage your risk before entering a trade.
Not investment advice. DYOR.
#BinanceSquare #DASH #Crypto
📊 TECHNICALS: The daily, 4h, and 1h charts are all bearish, with price below both the EMA20 and EMA50 on all three. The 4h MACD (negative histogram, expanding) says the most: bearish momentum has not weakened. Overhead, there is a sell wall of around 590k USDT near 43.72 across 3 exchanges.
💰 FLOWS: On Binance spot, aggressive sellers are dominant; aggressive buying over the past hour is only 44.9%. On Binance Futures, funding at -0.0133%/8h means shorts are paying a fee; top traders are 74.4% long, while the crowd is 51.9%.
₿ VS. BTC: Over the past 24 hours, during the hours BTC rose, its cumulative gain was +3.38% while DASH gained +1.79%; during the hours BTC fell, its cumulative loss was -5.08% while DASH fell -10.14%. DASH is weaker than BTC: it rises less and falls more.
🎯 $DASH LEVELS TO WATCH: support 43.38 USDT · resistance 43.89 USDT
🧭 PULLBACK SCENARIO: price pulls back to resistance, then resumes moving lower · score 10/10 · R:R 1:0.9 to TP1, 1:2.4 to TP2
• Flows: aggressive buying is 41.9% over 15 minutes, 44.9% over 1 hour, and 44.9% over 4 hours
• Signals: aggressive sellers accounted for 58.1% over the last 15 minutes; sellers also accounted for 55.1% over the last hour; there is a sell wall of around 590k USDT right at 43.72 (Binance spot 68k, Binance Futures 447k, OKX 76k; across 3 exchanges: a HARD level); aligned with the 1h and 4h trend (currently bearish)
• Entry: 43.38–43.72 (from 1h resistance to the current price; don't chase if price moves further away)
• SL: 44.1 (+1.7%; just above 1h resistance at 43.72: a candle close above this level invalidates the pullback)
• TP1: 42.44–42.72 (-1.5%, R:R 1:0.9; just before the 24-hour low of 42.39)
• TP2: 40.94–41.67 (-4%, R:R 1:2.4; only if price breaks below 42.39; estimated beyond that using a risk multiple)
⚠️ Price is sitting right near support at 43.38; even a brief bounce could force shorts to cut their losses.
Data as of 01:31 11/11 (UTC+7).
In the 43.38–43.89 zone, are you leaning long or short, and why?
Manage your risk before entering a trade.
Not investment advice. DYOR.
#BinanceSquare #DASH #Crypto
337
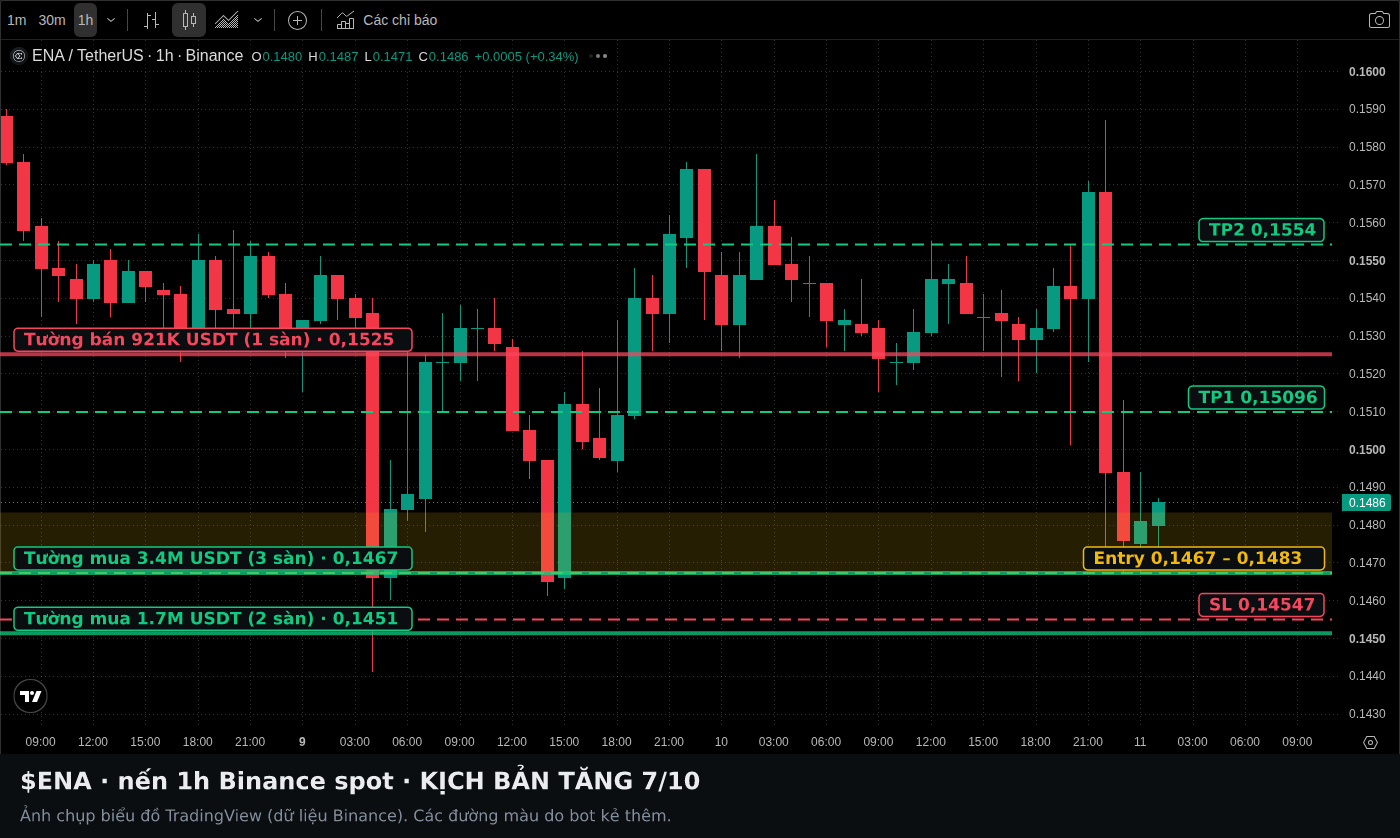
📉 BEARISH BIAS | $ENA bearish, but there is a bullish setup scoring 7/10 on the 1h timeframe; it is only a short-term countertrend swing against the 1h downtrend.
📊 TECHNICALS: The daily, 4h, and 1h timeframes are all bearish, with price below the EMA20 and EMA50 on all three. By contrast, the 4h MACD is still positive, but the histogram is narrowing.
💰 MONEY FLOW: Binance spot aggressive buying is 56.1% over 1 hour, but only 46.8% over 4 hours; buying pressure has only just started to pick up. Binance Futures top traders hold 59.2% long positions, while OKX and Gate top traders are leaning short.
📰 NEWS: Cointelegraph (11/11) reported that US inflation in October was higher than forecast, increasing the likelihood of the Fed raising interest rates by half a percentage point in December.
₿ VS. BTC: Over the past 24 hours, during the hours when BTC rose, its cumulative gain was +3.2%, while ENA gained +3.08%; during the hours when BTC fell, its cumulative loss was -5.2%, while ENA fell -7.08%. ENA is weaker than BTC: it rises less and falls more.
🎯 LEVELS TO WATCH FOR $ENA: support at 0.1441 USDT · resistance at 0.157 USDT
🧭 BOUNCE SETUP: long the bounce, countertrend · score 7/10 · R:R 1:0.9 to TP1, 1:2.5 to TP2
• Money flow: aggressive buying is 63.8% over 15 minutes, 56.1% over 1 hour, and 46.8% over 4 hours
• Signal: there is a buy wall of about 3449 thousand USDT right at 0.1467
• Watch out: COUNTER to the 1h trend (currently bearish): this is only a short bounce, with the first target at the 1h EMA20; BTC is bearish on the 1h timeframe
• Entry: 0.1467 – 0.1483 (from the 24-hour low to the current price; don't chase if price moves further away)
• SL: 0.1455 – 0.1462 (-1.9%; just below the 24-hour low of 0.1467: a close below this level invalidates the bounce)
• TP1: 0.151 – 0.1519 (+1.8%, R:R 1:0.9; just before the 1h EMA20 at 0.152)
• TP2: 0.1554 – 0.1563 (+4.8%, R:R 1:2.5; just before the 1h resistance at 0.1565)
Data as of 01:16 11/11 (UTC+7).
In the 0.1441 to 0.157 range, do you lean long or short, and why?
Manage your capital before entering a trade.
Not investment advice. DYOR.
#BinanceSquare #ENA
📉 BEARISH BIAS | $ENA bearish, but there is a bullish setup scoring 7/10 on the 1h timeframe; it is only a short-term countertrend swing against the 1h downtrend.
📊 TECHNICALS: The daily, 4h, and 1h timeframes are all bearish, with price below the EMA20 and EMA50 on all three. By contrast, the 4h MACD is still positive, but the histogram is narrowing.
💰 MONEY FLOW: Binance spot aggressive buying is 56.1% over 1 hour, but only 46.8% over 4 hours; buying pressure has only just started to pick up. Binance Futures top traders hold 59.2% long positions, while OKX and Gate top traders are leaning short.
📰 NEWS: Cointelegraph (11/11) reported that US inflation in October was higher than forecast, increasing the likelihood of the Fed raising interest rates by half a percentage point in December.
₿ VS. BTC: Over the past 24 hours, during the hours when BTC rose, its cumulative gain was +3.2%, while ENA gained +3.08%; during the hours when BTC fell, its cumulative loss was -5.2%, while ENA fell -7.08%. ENA is weaker than BTC: it rises less and falls more.
🎯 LEVELS TO WATCH FOR $ENA : support at 0.1441 USDT · resistance at 0.157 USDT
🧭 BOUNCE SETUP: long the bounce, countertrend · score 7/10 · R:R 1:0.9 to TP1, 1:2.5 to TP2
• Money flow: aggressive buying is 63.8% over 15 minutes, 56.1% over 1 hour, and 46.8% over 4 hours
• Signal: there is a buy wall of about 3449 thousand USDT right at 0.1467
• Watch out: COUNTER to the 1h trend (currently bearish): this is only a short bounce, with the first target at the 1h EMA20; BTC is bearish on the 1h timeframe
• Entry: 0.1467 – 0.1483 (from the 24-hour low to the current price; don't chase if price moves further away)
• SL: 0.1455 – 0.1462 (-1.9%; just below the 24-hour low of 0.1467: a close below this level invalidates the bounce)
• TP1: 0.151 – 0.1519 (+1.8%, R:R 1:0.9; just before the 1h EMA20 at 0.152)
• TP2: 0.1554 – 0.1563 (+4.8%, R:R 1:2.5; just before the 1h resistance at 0.1565)
Data as of 01:16 11/11 (UTC+7).
In the 0.1441 to 0.157 range, do you lean long or short, and why?
Manage your capital before entering a trade.
Not investment advice. DYOR.
#BinanceSquare #ENA
📊 TECHNICALS: The daily, 4h, and 1h timeframes are all bearish, with price below the EMA20 and EMA50 on all three. By contrast, the 4h MACD is still positive, but the histogram is narrowing.
💰 MONEY FLOW: Binance spot aggressive buying is 56.1% over 1 hour, but only 46.8% over 4 hours; buying pressure has only just started to pick up. Binance Futures top traders hold 59.2% long positions, while OKX and Gate top traders are leaning short.
📰 NEWS: Cointelegraph (11/11) reported that US inflation in October was higher than forecast, increasing the likelihood of the Fed raising interest rates by half a percentage point in December.
₿ VS. BTC: Over the past 24 hours, during the hours when BTC rose, its cumulative gain was +3.2%, while ENA gained +3.08%; during the hours when BTC fell, its cumulative loss was -5.2%, while ENA fell -7.08%. ENA is weaker than BTC: it rises less and falls more.
🎯 LEVELS TO WATCH FOR $ENA : support at 0.1441 USDT · resistance at 0.157 USDT
🧭 BOUNCE SETUP: long the bounce, countertrend · score 7/10 · R:R 1:0.9 to TP1, 1:2.5 to TP2
• Money flow: aggressive buying is 63.8% over 15 minutes, 56.1% over 1 hour, and 46.8% over 4 hours
• Signal: there is a buy wall of about 3449 thousand USDT right at 0.1467
• Watch out: COUNTER to the 1h trend (currently bearish): this is only a short bounce, with the first target at the 1h EMA20; BTC is bearish on the 1h timeframe
• Entry: 0.1467 – 0.1483 (from the 24-hour low to the current price; don't chase if price moves further away)
• SL: 0.1455 – 0.1462 (-1.9%; just below the 24-hour low of 0.1467: a close below this level invalidates the bounce)
• TP1: 0.151 – 0.1519 (+1.8%, R:R 1:0.9; just before the 1h EMA20 at 0.152)
• TP2: 0.1554 – 0.1563 (+4.8%, R:R 1:2.5; just before the 1h resistance at 0.1565)
Data as of 01:16 11/11 (UTC+7).
In the 0.1441 to 0.157 range, do you lean long or short, and why?
Manage your capital before entering a trade.
Not investment advice. DYOR.
#BinanceSquare #ENA
264
Partly True
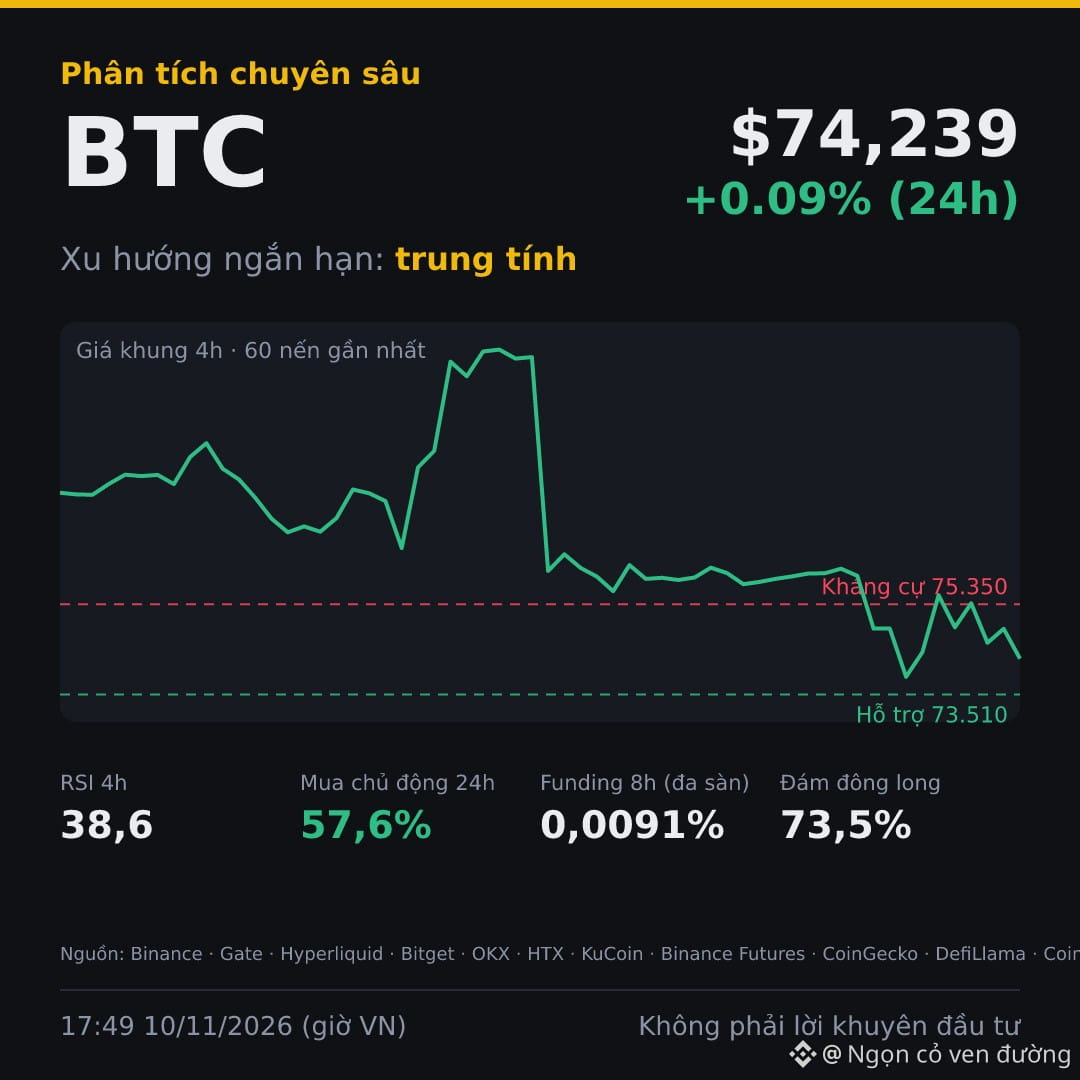
↔️ $BTC at 74.239 USDT, +0,086% in 24 hours: all three timeframes—1h, 4h, and daily—are down, but spot buyers have the edge.
📊 TECHNICAL: All three timeframes agree on a downtrend, and the price is below the daily EMA200 (74.716 USDT), an important medium-term level. The 4h MACD is positive, but the histogram is shrinking, so the recovery momentum remains weak.
💰 FLOWS: On Binance spot, aggressive buyers account for 57,6% of 24-hour volume, but the stablecoin supply has fallen 1,59% over 7 days. On Binance Futures, top traders hold 70,2% of positions long, while the figures on OKX and Gate are only 47,2% and 42,3%, respectively, putting the two groups at odds.
📰 NEWS: According to CoinDesk (10/11, 17:41), the market is pricing in the possibility of a Fed rate hike in December ahead of US inflation data, and both bitcoin and gold are falling.
🎯 LEVELS TO WATCH: support 73510 USDT · resistance 75350 USDT
Scenario: There is no clear direction within the 73510–75350 range; if the 4-hour candle for the BTC/USDT pair on Binance spot closes above 75350 at 19:00 on 10/11, the bias is bullish, while a close below 73510 would tilt bearish.
⚠️ The biggest risk is that selling pressure on the higher timeframes has not yet been overcome, and if the Fed does raise rates, that pressure could intensify.
Data as of 17:49 on 10/11 (UTC+7).
Do you think the daily timeframe or spot flows are more reliable for assessing BTC's trend right now?
Manage your capital before entering a trade.
Not investment advice. DYOR.
#BinanceSquare #BTC #Bitcoin
↔️ $BTC at 74.239 USDT, +0,086% in 24 hours: all three timeframes—1h, 4h, and daily—are down, but spot buyers have the edge.
📊 TECHNICAL: All three timeframes agree on a downtrend, and the price is below the daily EMA200 (74.716 USDT), an important medium-term level. The 4h MACD is positive, but the histogram is shrinking, so the recovery momentum remains weak.
💰 FLOWS: On Binance spot, aggressive buyers account for 57,6% of 24-hour volume, but the stablecoin supply has fallen 1,59% over 7 days. On Binance Futures, top traders hold 70,2% of positions long, while the figures on OKX and Gate are only 47,2% and 42,3%, respectively, putting the two groups at odds.
📰 NEWS: According to CoinDesk (10/11, 17:41), the market is pricing in the possibility of a Fed rate hike in December ahead of US inflation data, and both bitcoin and gold are falling.
🎯 LEVELS TO WATCH: support 73510 USDT · resistance 75350 USDT
Scenario: There is no clear direction within the 73510–75350 range; if the 4-hour candle for the BTC/USDT pair on Binance spot closes above 75350 at 19:00 on 10/11, the bias is bullish, while a close below 73510 would tilt bearish.
⚠️ The biggest risk is that selling pressure on the higher timeframes has not yet been overcome, and if the Fed does raise rates, that pressure could intensify.
Data as of 17:49 on 10/11 (UTC+7).
Do you think the daily timeframe or spot flows are more reliable for assessing BTC's trend right now?
Manage your capital before entering a trade.
Not investment advice. DYOR.
#BinanceSquare #BTC #Bitcoin
📊 TECHNICAL: All three timeframes agree on a downtrend, and the price is below the daily EMA200 (74.716 USDT), an important medium-term level. The 4h MACD is positive, but the histogram is shrinking, so the recovery momentum remains weak.
💰 FLOWS: On Binance spot, aggressive buyers account for 57,6% of 24-hour volume, but the stablecoin supply has fallen 1,59% over 7 days. On Binance Futures, top traders hold 70,2% of positions long, while the figures on OKX and Gate are only 47,2% and 42,3%, respectively, putting the two groups at odds.
📰 NEWS: According to CoinDesk (10/11, 17:41), the market is pricing in the possibility of a Fed rate hike in December ahead of US inflation data, and both bitcoin and gold are falling.
🎯 LEVELS TO WATCH: support 73510 USDT · resistance 75350 USDT
Scenario: There is no clear direction within the 73510–75350 range; if the 4-hour candle for the BTC/USDT pair on Binance spot closes above 75350 at 19:00 on 10/11, the bias is bullish, while a close below 73510 would tilt bearish.
⚠️ The biggest risk is that selling pressure on the higher timeframes has not yet been overcome, and if the Fed does raise rates, that pressure could intensify.
Data as of 17:49 on 10/11 (UTC+7).
Do you think the daily timeframe or spot flows are more reliable for assessing BTC's trend right now?
Manage your capital before entering a trade.
Not investment advice. DYOR.
#BinanceSquare #BTC #Bitcoin
339
Log in to explore more content
Join global crypto users on Binance Square
⚡️ Get latest and useful information about crypto.
💬 Trusted by the world’s largest crypto exchange.
👍 Discover real insights from verified creators.
Email / Phone number
Trending Topics
HotCPIDecemberHikePriced
42,252 views
765 Discussing
CPI Market Watch | US CPI Rises 0.4% in October, Hotter Than 0.3% Forecast
Binance News
·19 Likes
·35.8k views
AnthropicRejectsIPODelayValuationinQuestion
177,372 views
1,589 Discussing
NvidiaInvestigatesAfterHuang’sAffairApology
448,668 views
3,051 Discussing