$ETH $BTC $BNB
Here is an in-depth structural and technical breakdown for Ethereum (ETH):
1. Market Structure & Candlestick Analysis
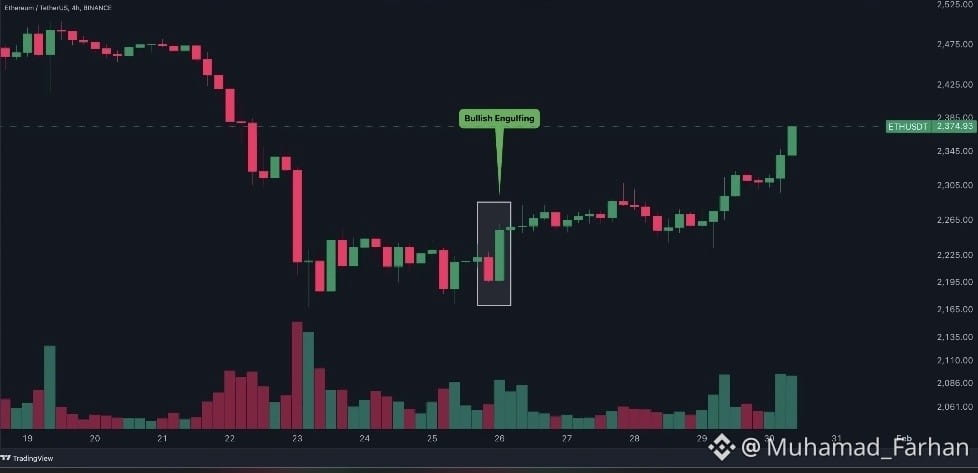
Pattern & Reversal Formations: As highlighted in the candlestick chart above, local price bottoms on Ethereum frequently initiate momentum shifts via key reversal patterns—such as the Bullish Engulfing pattern. In these scenarios, a strong green candle completely absorbs the body of the preceding red candle, signaling an aggressive influx of buyer volume and a transition from consolidation to an upward trend expansion.
Support & Resistance Zones:
Primary Support: Key structural reaction zones are typically anchored around major historical consolidation floors (e.g., key psychological levels around $2,100–$2,200). A clean break below these supports often invalidates near-term bullish setups.
Immediate Resistance: Resistance levels are marked by previous swing highs and moving average confluence areas (e.g., around $2,450–$2,500). Reclaiming these levels opens up clear paths toward multi-month targets.
2. Volume & Momentum Indicators
Trading Volume: As seen on the lower panel of the candlestick breakdown, price expansions accompanied by expanding green volume bars confirm institutional participation. Low-volume pullbacks suggest shallow consolidation rather than systemic distribution.
Relative Strength Index (RSI) & Moving Averages:
Watch for RSI divergence (higher lows on RSI while price makes equal or lower lows) near major support floors to signal waning bearish momentum.
Pay attention to the interaction between short-term (20-period, 50-period) and long-term (200-period) Moving Averages across high-timeframe (4H, Daily) charts to identify macro trend direction.
#BinanceReopensWithdrawalsForMoreAssets #BinanceIncidentReport #USOctoberNFP-AreRateCutsStillPossible #USMidterms-WhatAreMarketsExpecting? #AMDBeatsExpectations-AINarrativeContinues
Here is an in-depth structural and technical breakdown for Ethereum (ETH):
1. Market Structure & Candlestick Analysis
Pattern & Reversal Formations: As highlighted in the candlestick chart above, local price bottoms on Ethereum frequently initiate momentum shifts via key reversal patterns—such as the Bullish Engulfing pattern. In these scenarios, a strong green candle completely absorbs the body of the preceding red candle, signaling an aggressive influx of buyer volume and a transition from consolidation to an upward trend expansion.
Support & Resistance Zones:
Primary Support: Key structural reaction zones are typically anchored around major historical consolidation floors (e.g., key psychological levels around $2,100–$2,200). A clean break below these supports often invalidates near-term bullish setups.
Immediate Resistance: Resistance levels are marked by previous swing highs and moving average confluence areas (e.g., around $2,450–$2,500). Reclaiming these levels opens up clear paths toward multi-month targets.
2. Volume & Momentum Indicators
Trading Volume: As seen on the lower panel of the candlestick breakdown, price expansions accompanied by expanding green volume bars confirm institutional participation. Low-volume pullbacks suggest shallow consolidation rather than systemic distribution.
Relative Strength Index (RSI) & Moving Averages:
Watch for RSI divergence (higher lows on RSI while price makes equal or lower lows) near major support floors to signal waning bearish momentum.
Pay attention to the interaction between short-term (20-period, 50-period) and long-term (200-period) Moving Averages across high-timeframe (4H, Daily) charts to identify macro trend direction.
#BinanceReopensWithdrawalsForMoreAssets #BinanceIncidentReport #USOctoberNFP-AreRateCutsStillPossible #USMidterms-WhatAreMarketsExpecting? #AMDBeatsExpectations-AINarrativeContinues