
We’re starting a new day by monitoring analytical tools! The BMT (Bubblemaps) trading pair in the “Infrastructure” category is showing confident upward momentum, gaining +26.16% over the day and trading at 0.03024 USDT.
Key indicators and technical overview from the chart:
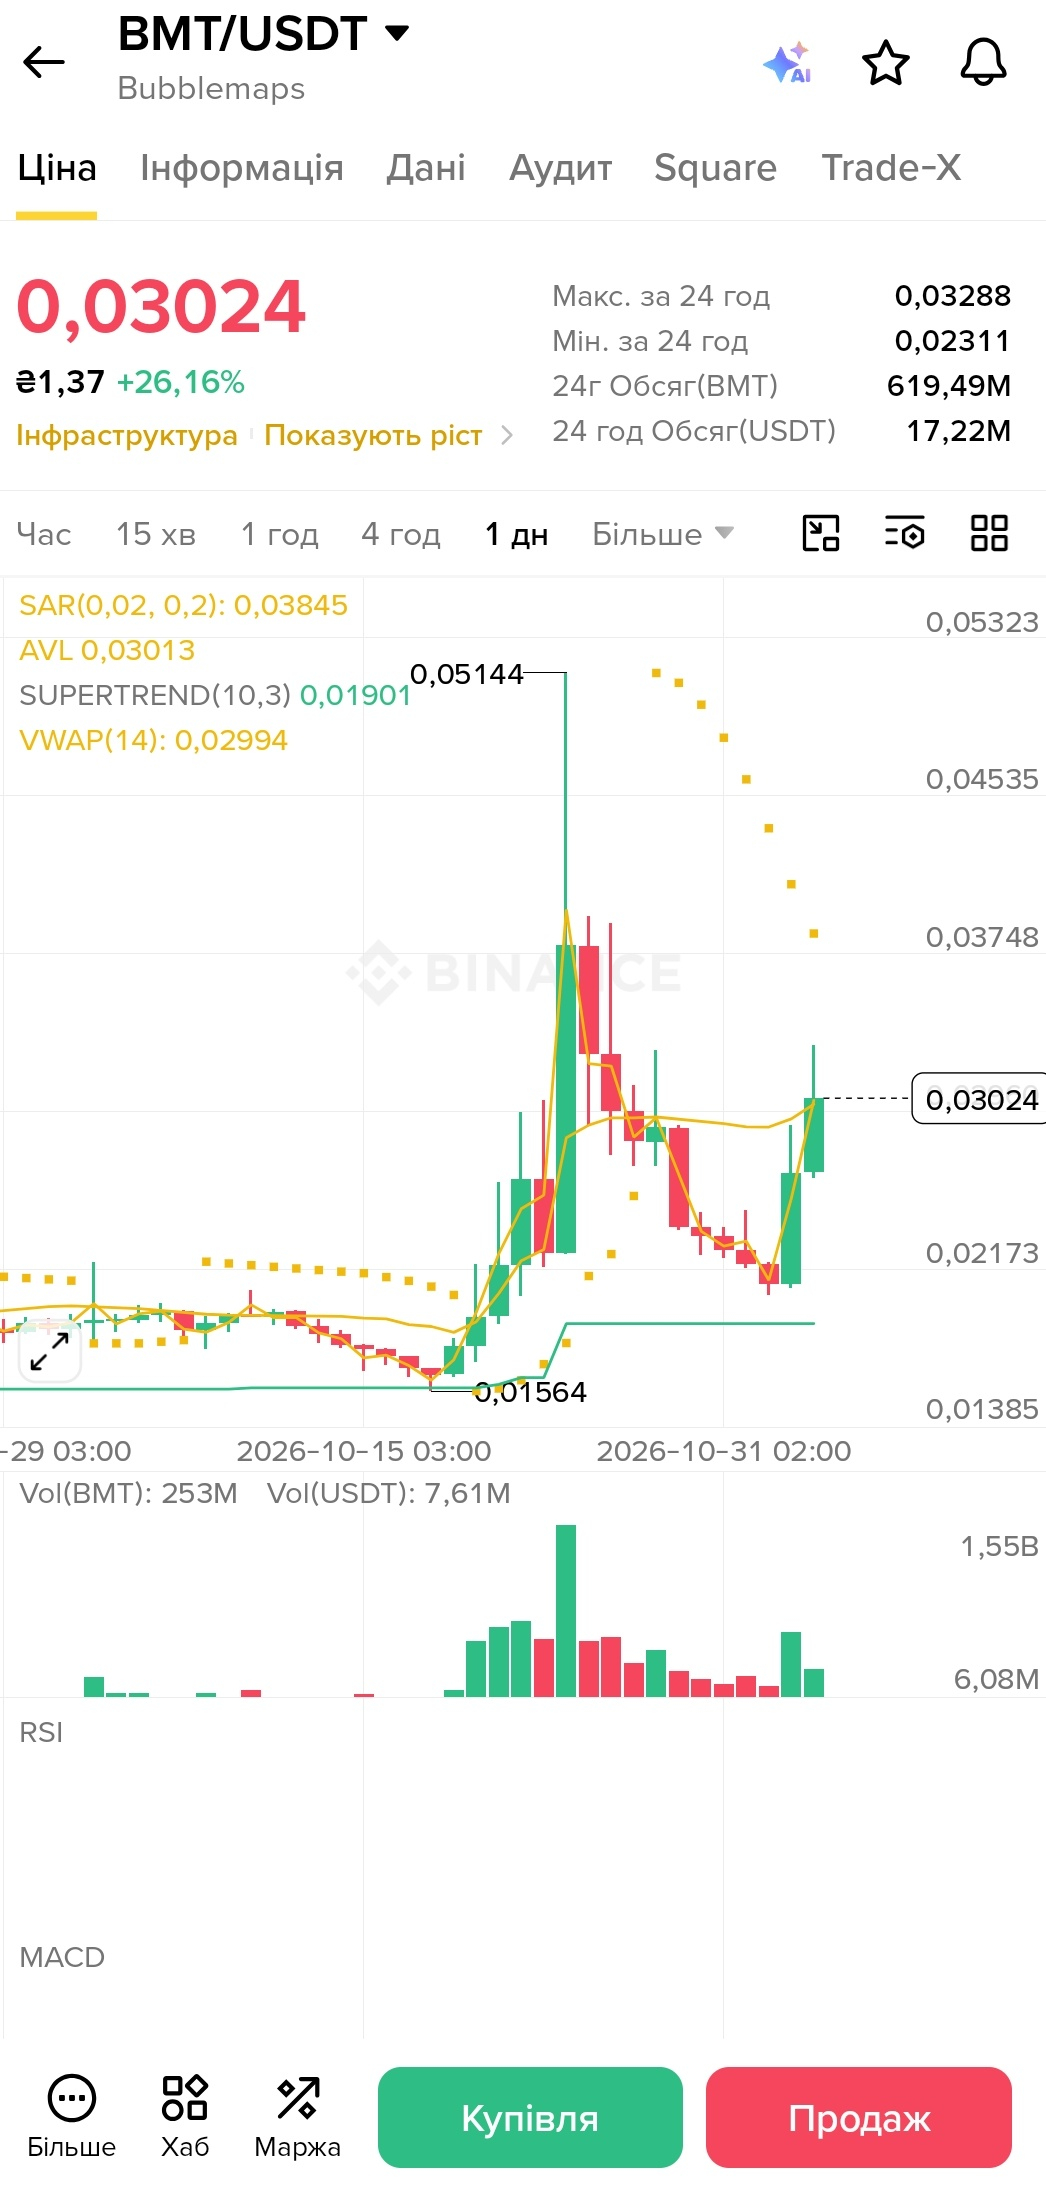
After a deep correction from the previous peak of 0.05144 USDT and forming a local bottom at 0.01564 USDT, the asset formed a reversal pattern and produced a series of confident green candles. The daily high reached 0.03288 USDT (with a 24-hour low of 0.02311 USDT).
Trading volume over the past 24 hours has risen noticeably to 17.22 million USDT (with a volume of 619.49 million BMT), confirming the recovery in buyer interest during the morning session.
The average AVL price is at 0.03013 USDT, while the VWAP (14) indicator passes through 0.02994 USDT, forming an immediate support zone for the bulls. The Supertrend (10,3) line is at 0.01901 USDT, and the Parabolic SAR indicator is at 0.03845 USDT, indicating the nearest resistance target if the upward move continues.
⚠️ Be careful: local rebounds after a prolonged correction call for a measured approach. Don't give in to emotions (FOMO), be sure to set stop-losses, and manage your risk!
☕ What are your expectations for BMT today? Can the asset hold above $0.030 and continue moving toward $0.038? Share your thoughts in the comments, and have a great start to the day! 👇
#BinanceSquare #BMT #Bubblemaps #Infrastructure #cryptotrading #TechnicalAnalysis #Altcoins