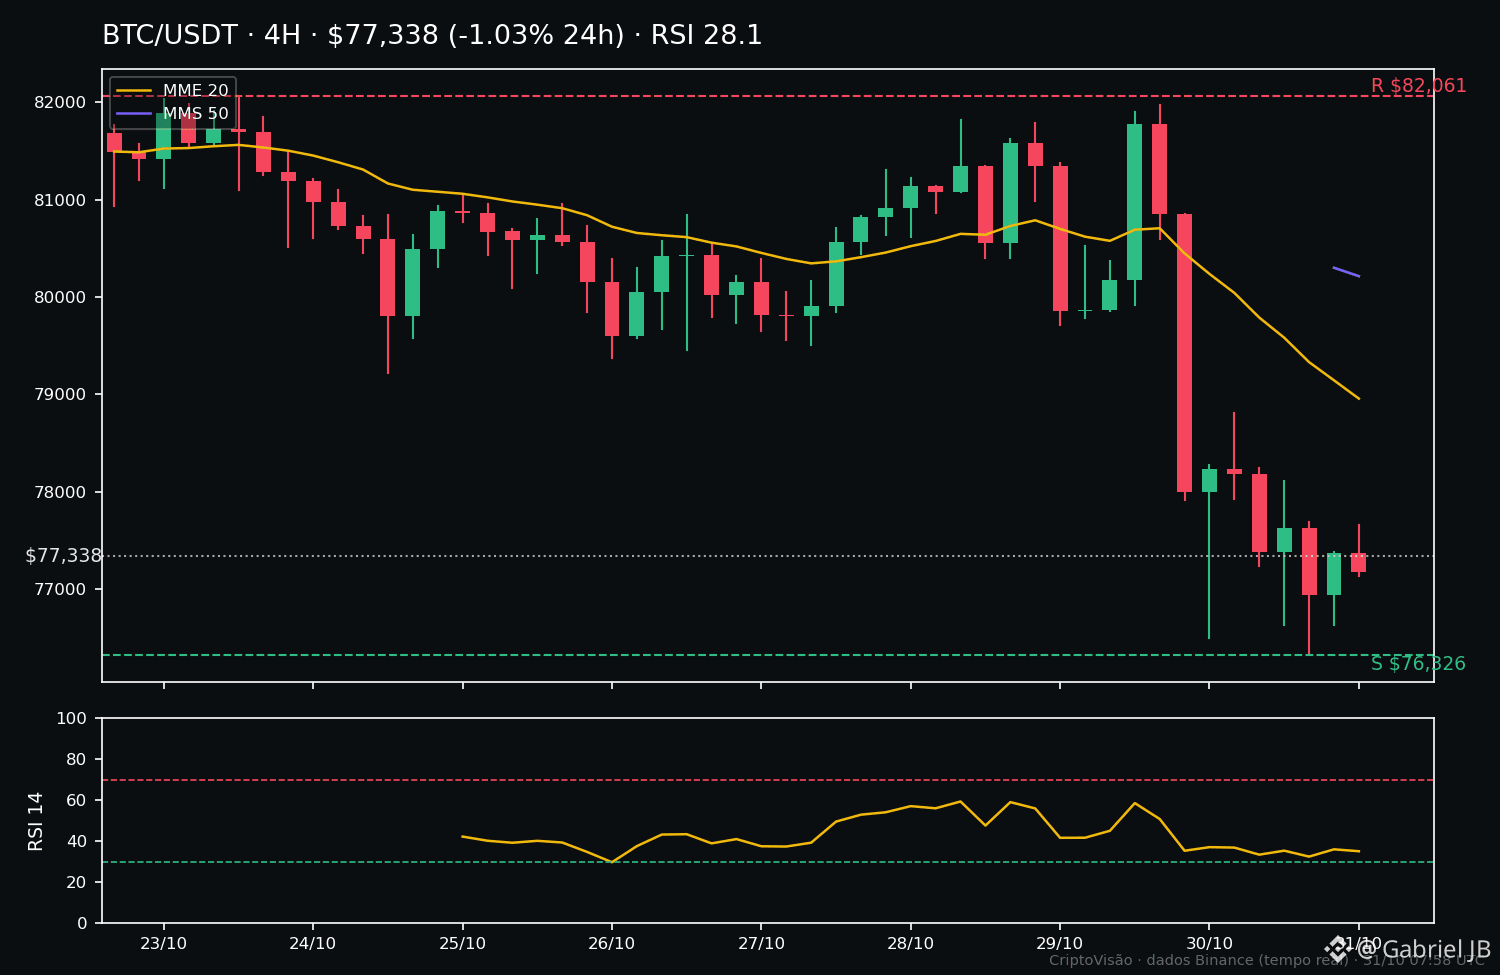
📊 Technical setup $BTC — weekly support test
SITUATION: $BTC is trading near $77.338, down 1.0% in 24h and 5.3% in 7 days. The price is below the 20-period moving average ($79.569) and the 50-period moving average ($80.214) on the 4h chart, and the RSI-14 is at 28.1 — oversold territory. In other words: the short-term trend is downward, but selling pressure is already stretched.
LEVELS: Immediate support at $76.326 (the low for the past 7 days and the past 24h). Resistance: $79.569 (EMA-20), $80.214 (EMA-50), and $82.061 (the high for the past 7 days).
SCENARIO A — support holds: a 4h candle close above $77.300 with a sustained recovery could open the way for a test of the $79.569–$80.214 zone. Only above both moving averages would the short-term structure begin to change.
SCENARIO B — support breaks: a 4h candle close below $76.326 opens the door to further declines, with the next reference point determined by subsequent lows — there is no immediate visible support on the weekly chart.
WHAT WOULD CONFIRM IT: in both cases, the 4h candle close matters, not the wick. A quick touch of support followed by a recovery is not the same as a close below it — and an oversold RSI alone is not a buy signal.
RISK: buying just because the RSI is low is like catching a falling knife; the trend is still downward, and volatility near tested support tends to be high. Size the position for the scenario where support breaks, never for the best-case scenario.
CONCLUSION: $BTC is at a decision point — will $76.326 hold or give way? Until a 4h close resolves the question, patience is more valuable than haste.
#Bitcoin #CriptoVisao #TechnicalAnalysis