
野原小新
3.5k Posts

野原小新
 Square Verified+
Report
Block User
🔸公众号: 小新服务小站 |🔸推特账号: @xing0082 专注技术分析/技术分享普及教学, 🎈手续费8折:MH999 邀请码。

CRCLB Holder
High-Frequency Trader
1.8 Years
187 Following
38.1K+ Followers
20.1K+ Liked
Posts
All
Quotes
Videos
Live
PINNED
·
--

Article
Nov 11 BTC Market Analysis~~#BTC
The BTC 2-day chart officially turned bearish today~~~
The intraday market bias is bearish; trades should mainly focus on shorting rebounds.
The 8-hour bullish divergence is gone~~which means this may not necessarily be a bottom
Today's overhead resistance has come down to: 73800 74800
Support below: 69200 67200 65000
The main decline is still playing out on the 8-hour timeframe
Yesterday, the 1-hour timeframe broke the previous low~~if it closes back above~~
At most, it could rebound to around 75800
So the trading plan is:
Consider opening a starter short at 74800, adding a second position at 75800 and a third at 764, with a stop loss at 775
#CPI高于预期,美股与BTC再度承压
$BTC
Nov 11 BTC Market Analysis~~
#BTC
The BTC 2-day chart officially turned bearish today~~~
The intraday market bias is bearish; trades should mainly focus on shorting rebounds.
The 8-hour bullish divergence is gone~~which means this may not necessarily be a bottom
Today's overhead resistance has come down to: 73800 74800
Support below: 69200 67200 65000
The main decline is still playing out on the 8-hour timeframe
Yesterday, the 1-hour timeframe broke the previous low~~if it closes back above~~
At most, it could rebound to around 75800
So the trading plan is:
Consider opening a starter short at 74800, adding a second position at 75800 and a third at 764, with a stop loss at 775
#CPI高于预期,美股与BTC再度承压
$BTC
The BTC 2-day chart officially turned bearish today~~~
The intraday market bias is bearish; trades should mainly focus on shorting rebounds.
The 8-hour bullish divergence is gone~~which means this may not necessarily be a bottom
Today's overhead resistance has come down to: 73800 74800
Support below: 69200 67200 65000
The main decline is still playing out on the 8-hour timeframe
Yesterday, the 1-hour timeframe broke the previous low~~if it closes back above~~
At most, it could rebound to around 75800
So the trading plan is:
Consider opening a starter short at 74800, adding a second position at 75800 and a third at 764, with a stop loss at 775
#CPI高于预期,美股与BTC再度承压
$BTC
3
830
PINNED
·
--
November 11 ETH Market Analysis~~#ETH
ETH is in a downtrend on the daily chart
If there's another wick down at 2000, it'll be around 1960–1950
The bottom is looking very weak right now~~the market is weak, so it's better to short the bounces
Resistance zones above: 2132 2158 2198
The main timeframe is 8 hours, and there is currently no bottoming pattern on the 8-hour chart~~
Can only look for an intraday oversold bounce
If you want to buy the bottom, at the very least wait for a bottoming pattern to form on the 1-day chart before considering it
$ETH #CPI高于预期,美股与BTC再度承压
November 11 ETH Market Analysis~~
#ETH
ETH is in a downtrend on the daily chart
If there's another wick down at 2000, it'll be around 1960–1950
The bottom is looking very weak right now~~the market is weak, so it's better to short the bounces
Resistance zones above: 2132 2158 2198
The main timeframe is 8 hours, and there is currently no bottoming pattern on the 8-hour chart~~
Can only look for an intraday oversold bounce
If you want to buy the bottom, at the very least wait for a bottoming pattern to form on the 1-day chart before considering it
$ETH #CPI高于预期,美股与BTC再度承压
ETH is in a downtrend on the daily chart
If there's another wick down at 2000, it'll be around 1960–1950
The bottom is looking very weak right now~~the market is weak, so it's better to short the bounces
Resistance zones above: 2132 2158 2198
The main timeframe is 8 hours, and there is currently no bottoming pattern on the 8-hour chart~~
Can only look for an intraday oversold bounce
If you want to buy the bottom, at the very least wait for a bottoming pattern to form on the 1-day chart before considering it
$ETH #CPI高于预期,美股与BTC再度承压
3
1.1k
·
--
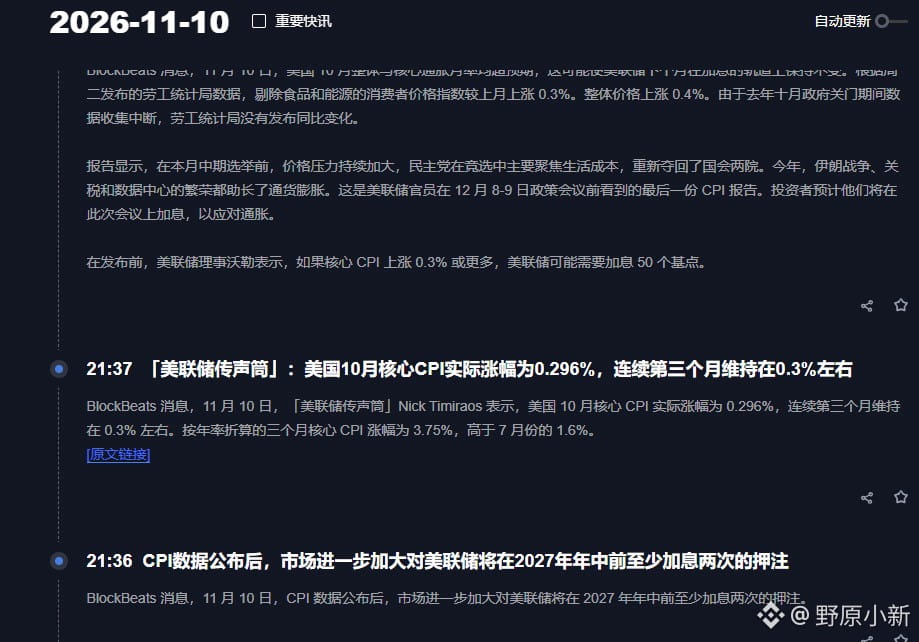
CPI~~ is bad news~~
There are still two more rate hikes~~
CPI~~ is bad news~~
There are still two more rate hikes~~
There are still two more rate hikes~~
2k
·
--
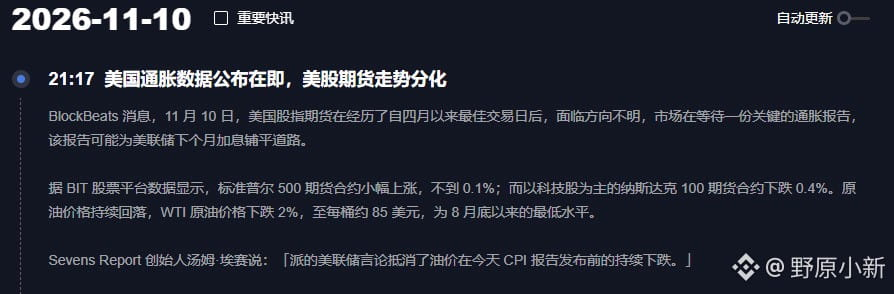
#CPI前瞻,12月利率走向迎关键考验
9:30 CPI data~~~~
MicroStrategy down 1.04% in pre-market trading
A spike down and rebound? Open low and climb?
$SNDKB stayed short all day today
Will it keep falling tonight?
{spot}(SNDKBUSDT)
#CPI前瞻,12月利率走向迎关键考验
9:30 CPI data~~~~
MicroStrategy down 1.04% in pre-market trading
A spike down and rebound? Open low and climb?
$SNDKB stayed short all day today
Will it keep falling tonight?
9:30 CPI data~~~~
MicroStrategy down 1.04% in pre-market trading
A spike down and rebound? Open low and climb?
$SNDKB stayed short all day today
Will it keep falling tonight?
780

·
--
Trump's crypto legislation hurdle~~won't be so easy to clear anymore
Trump's crypto legislation hurdle~~won't be so easy to clear anymore

1
6
11.3k
·
--

Article
November 7 ETH Market Analysis~~#ETH
First, let's look at the overall monthly chart:
ETH is seeing a rebound toward the 2-month line overall, not a new upward move.
Key resistance zones: 2414–2443 2388–2361
2414 is also a key level for the market to gain momentum. It needs to hold above this level before we can see whether a rebound toward the 2-month line will begin.
Key support below is around the 45-day EMA52: 2174–2129
The 45-day line support is at 2174 for futures and 2129 for spot.
Structural support: 1946–1906
In an extreme market, if it falls back to the 2-month line, support is at 1730.
Now let's look at the short-term intraday outlook:
Over the next 8 to 12 hours, downside momentum is insufficient, and a rebound is likely.
Clear support below ~ 45-day line: 2172
November 7 ETH Market Analysis~~
#ETH
First, let's look at the overall monthly chart:
ETH is seeing a rebound toward the 2-month line overall, not a new upward move.
Key resistance zones: 2414–2443 2388–2361
2414 is also a key level for the market to gain momentum. It needs to hold above this level before we can see whether a rebound toward the 2-month line will begin.
Key support below is around the 45-day EMA52: 2174–2129
The 45-day line support is at 2174 for futures and 2129 for spot.
Structural support: 1946–1906
In an extreme market, if it falls back to the 2-month line, support is at 1730.
Now let's look at the short-term intraday outlook:
Over the next 8 to 12 hours, downside momentum is insufficient, and a rebound is likely.
Clear support below ~ 45-day line: 2172
First, let's look at the overall monthly chart:
ETH is seeing a rebound toward the 2-month line overall, not a new upward move.
Key resistance zones: 2414–2443 2388–2361
2414 is also a key level for the market to gain momentum. It needs to hold above this level before we can see whether a rebound toward the 2-month line will begin.
Key support below is around the 45-day EMA52: 2174–2129
The 45-day line support is at 2174 for futures and 2129 for spot.
Structural support: 1946–1906
In an extreme market, if it falls back to the 2-month line, support is at 1730.
Now let's look at the short-term intraday outlook:
Over the next 8 to 12 hours, downside momentum is insufficient, and a rebound is likely.
Clear support below ~ 45-day line: 2172
2
9
1.8k
·
--

Article
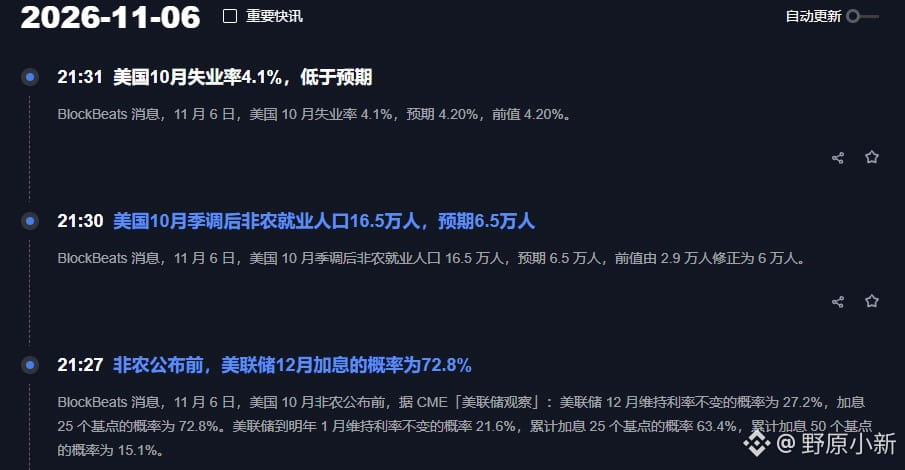
November 7 BTC Market Analysis~~Bearish or Bullish?#BTC
The 8-hour BTC chart is currently the primary downtrend timeframe~~
The market is weak~~the nearest support level is 74909, the point where the previous rally began
If it breaks below~~~the price will return to around 60,000 and move sideways
The 1-day chart has entered bearish territory~~~the 2-day chart is about to follow~~~
The 3-day price has fallen below the support level at 76500
For the market to strengthen~~the bare minimum is a move back above 76500
For the bulls, the good sign right now is that if the 8-hour chart can close back above 76500, a divergence pattern will form~~·
As the current primary timeframe, divergence on the 8-hour chart could mean the decline is temporarily coming to an end··there may be a chance for a rebound
November 7 BTC Market Analysis~~Bearish or Bullish?
#BTC
The 8-hour BTC chart is currently the primary downtrend timeframe~~
The market is weak~~the nearest support level is 74909, the point where the previous rally began
If it breaks below~~~the price will return to around 60,000 and move sideways
The 1-day chart has entered bearish territory~~~the 2-day chart is about to follow~~~
The 3-day price has fallen below the support level at 76500
For the market to strengthen~~the bare minimum is a move back above 76500
For the bulls, the good sign right now is that if the 8-hour chart can close back above 76500, a divergence pattern will form~~·
As the current primary timeframe, divergence on the 8-hour chart could mean the decline is temporarily coming to an end··there may be a chance for a rebound
The 8-hour BTC chart is currently the primary downtrend timeframe~~
The market is weak~~the nearest support level is 74909, the point where the previous rally began
If it breaks below~~~the price will return to around 60,000 and move sideways
The 1-day chart has entered bearish territory~~~the 2-day chart is about to follow~~~
The 3-day price has fallen below the support level at 76500
For the market to strengthen~~the bare minimum is a move back above 76500
For the bulls, the good sign right now is that if the 8-hour chart can close back above 76500, a divergence pattern will form~~·
As the current primary timeframe, divergence on the 8-hour chart could mean the decline is temporarily coming to an end··there may be a chance for a rebound
12
1.5k
·
--
Verified
Does the Nasdaq always rebound after a plunge? With tonight’s jobs report, can U.S. stocks stage a dramatic comeback?
U.S. stocks suffered an unusually brutal sell-off on Thursday. The QQQ plunged 6.49% in a single day, the Philadelphia Semiconductor Index tumbled more than 12%, and the VIX fear gauge surged nearly 70% overnight.
In the face of a collapse of this magnitude, some in the market expect a golden buying opportunity to have arrived. Looking back at past steep pullbacks, however, the next market move may still be up in the air. Even before this bloodbath, the sharpest hedge funds had already begun repositioning at any cost.
Tonight at 9:30 p.m. Beijing time, the nonfarm payrolls report is due. The failure of historical patterns, the cards held by institutional whales, and the looming macroeconomic data are pushing U.S. stocks to a critical juncture. After the plunge, will they stage a dramatic comeback—or is this the start of a correction?
Does the Nasdaq always rebound after a plunge? With tonight’s jobs report, can U.S. stocks stage a dramatic comeback?
U.S. stocks suffered an unusually brutal sell-off on Thursday. The QQQ plunged 6.49% in a single day, the Philadelphia Semiconductor Index tumbled more than 12%, and the VIX fear gauge surged nearly 70% overnight.
In the face of a collapse of this magnitude, some in the market expect a golden buying opportunity to have arrived. Looking back at past steep pullbacks, however, the next market move may still be up in the air. Even before this bloodbath, the sharpest hedge funds had already begun repositioning at any cost.
Tonight at 9:30 p.m. Beijing time, the nonfarm payrolls report is due. The failure of historical patterns, the cards held by institutional whales, and the looming macroeconomic data are pushing U.S. stocks to a critical juncture. After the plunge, will they stage a dramatic comeback—or is this the start of a correction?
U.S. stocks suffered an unusually brutal sell-off on Thursday. The QQQ plunged 6.49% in a single day, the Philadelphia Semiconductor Index tumbled more than 12%, and the VIX fear gauge surged nearly 70% overnight.
In the face of a collapse of this magnitude, some in the market expect a golden buying opportunity to have arrived. Looking back at past steep pullbacks, however, the next market move may still be up in the air. Even before this bloodbath, the sharpest hedge funds had already begun repositioning at any cost.
Tonight at 9:30 p.m. Beijing time, the nonfarm payrolls report is due. The failure of historical patterns, the cards held by institutional whales, and the looming macroeconomic data are pushing U.S. stocks to a critical juncture. After the plunge, will they stage a dramatic comeback—or is this the start of a correction?
5
796
·
--
Trump lost, and AI is dead
The Strategic Bitcoin Reserve is dead too
What’s the next story?
Trump lost, and AI is dead
The Strategic Bitcoin Reserve is dead too
What’s the next story?
The Strategic Bitcoin Reserve is dead too
What’s the next story?

4
23
13.1k
·
--
1
1.2k
·
--
Partly True
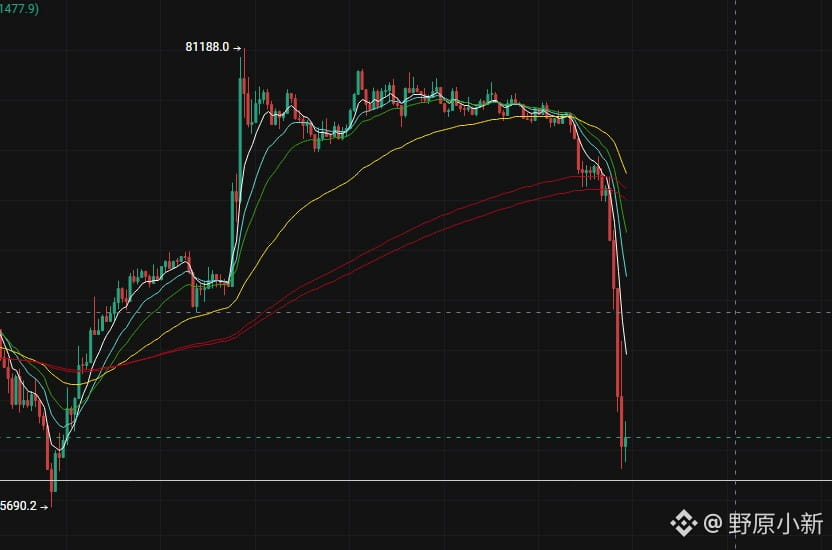
Bitcoin is at 78,341.38 on Binance, up 1.14% over 24 hours. At this level, it’s only knocked on the door of 78,000—it hasn’t managed to get above it and hold.
The idea that midterm election uncertainty is fading doesn’t quite line up with the market action. Gold token PAXG is also up 1.86%. If this were simply a return of risk appetite, there’d be no reason for gold to strengthen at the same time. Maybe the election risk premium is coming out while some other safe-haven dynamic is at play; or perhaps two groups of investors are each buying for their own reasons. Public data only lets us go this far.
The V-shaped rebound itself only shows that selling pressure paused for a moment; it tells us nothing about follow-through buying. Next, I’ll be watching to see whether Bitcoin can hold around 78,000. If it can’t, today’s move will probably amount to little more than short covering. It’s too early to call it a trend.
Bitcoin is at 78,341.38 on Binance, up 1.14% over 24 hours. At this level, it’s only knocked on the door of 78,000—it hasn’t managed to get above it and hold.
The idea that midterm election uncertainty is fading doesn’t quite line up with the market action. Gold token PAXG is also up 1.86%. If this were simply a return of risk appetite, there’d be no reason for gold to strengthen at the same time. Maybe the election risk premium is coming out while some other safe-haven dynamic is at play; or perhaps two groups of investors are each buying for their own reasons. Public data only lets us go this far.
The V-shaped rebound itself only shows that selling pressure paused for a moment; it tells us nothing about follow-through buying. Next, I’ll be watching to see whether Bitcoin can hold around 78,000. If it can’t, today’s move will probably amount to little more than short covering. It’s too early to call it a trend.
The idea that midterm election uncertainty is fading doesn’t quite line up with the market action. Gold token PAXG is also up 1.86%. If this were simply a return of risk appetite, there’d be no reason for gold to strengthen at the same time. Maybe the election risk premium is coming out while some other safe-haven dynamic is at play; or perhaps two groups of investors are each buying for their own reasons. Public data only lets us go this far.
The V-shaped rebound itself only shows that selling pressure paused for a moment; it tells us nothing about follow-through buying. Next, I’ll be watching to see whether Bitcoin can hold around 78,000. If it can’t, today’s move will probably amount to little more than short covering. It’s too early to call it a trend.
734
·
--
Verified
The results aren’t in yet, but prices have already voted. Polymarket puts the odds of Democrats controlling the House at about 95% and the Senate at about 77%. But polls have only just closed in six states, and the only race called so far is Ossoff’s reelection in Georgia.
BTC is at 76,964.82, down 0.33% over 24 hours, and hasn’t followed U.S. stocks higher. Once control of the House is settled, watch whether long-term yields and the dollar continue moving in tandem. If they diverge, it would suggest the market is trading on the cost of living, not a divided Congress.
The results aren’t in yet, but prices have already voted. Polymarket puts the odds of Democrats controlling the House at about 95% and the Senate at about 77%. But polls have only just closed in six states, and the only race called so far is Ossoff’s reelection in Georgia.
BTC is at 76,964.82, down 0.33% over 24 hours, and hasn’t followed U.S. stocks higher. Once control of the House is settled, watch whether long-term yields and the dollar continue moving in tandem. If they diverge, it would suggest the market is trading on the cost of living, not a divided Congress.
BTC is at 76,964.82, down 0.33% over 24 hours, and hasn’t followed U.S. stocks higher. Once control of the House is settled, watch whether long-term yields and the dollar continue moving in tandem. If they diverge, it would suggest the market is trading on the cost of living, not a divided Congress.

3
1.2k
Log in to explore more content
Join global crypto users on Binance Square
⚡️ Get latest and useful information about crypto.
💬 Trusted by the world’s largest crypto exchange.
👍 Discover real insights from verified creators.
Email / Phone number
Trending Topics
HotCPIDecemberHikePriced
145,107 views
1,641 Discussing
CPI Market Watch | US CPI Rises 0.4% in October, Hotter Than 0.3% Forecast
Binance News
·28 Likes
·42.1k views
StrategyFaces$2.8BSelloffRiskFromMSCIRemoval
0 views
0 Discussing
AnthropicRejectsIPODelayValuationinQuestion
257,901 views
2,201 Discussing