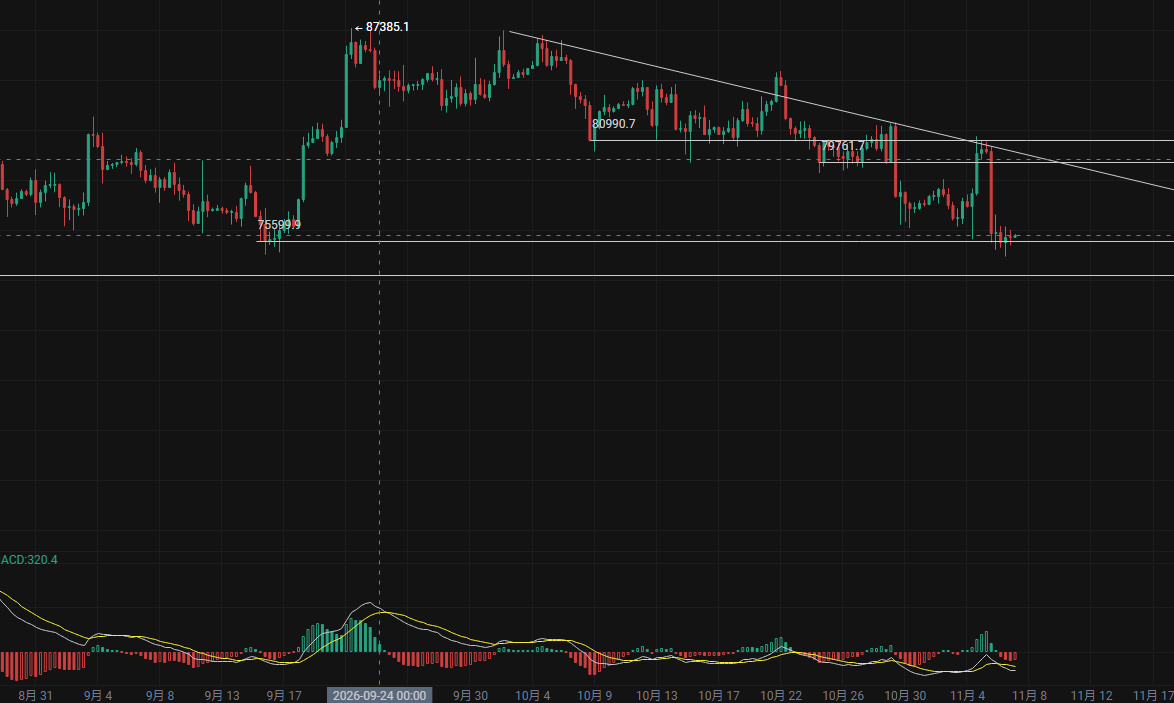


The 8-hour BTC chart is currently the primary downtrend timeframe~~
The market is weak~~the nearest support level is 74909, the point where the previous rally began
If it breaks below~~~the price will return to around 60,000 and move sideways
The 1-day chart has entered bearish territory~~~the 2-day chart is about to follow~~~
The 3-day price has fallen below the support level at 76500
For the market to strengthen~~the bare minimum is a move back above 76500
For the bulls, the good sign right now is that if the 8-hour chart can close back above 76500, a divergence pattern will form~~·
As the current primary timeframe, divergence on the 8-hour chart could mean the decline is temporarily coming to an end··there may be a chance for a rebound
But the higher timeframes~~still haven't finished correcting~~~
So my assessment is:
1. The overall market is moving sideways to lower
2. The 2-day chart is about to turn bearish, so the risk of a breakdown is high
3. There’s an 8-hour divergence, so a short-term rebound is possible, but the highs are getting lower
Trading idea: Shorting the rebound is relatively safe
Resistance zone above: 77962 79178 80344. Consider scaling into short positions if the price rebounds into this zone
Support zone below: 75599 74955. A break below could accelerate the decline. If going long, manage your position size and set a stop-loss$BTC #非农就业数据推升加息预期