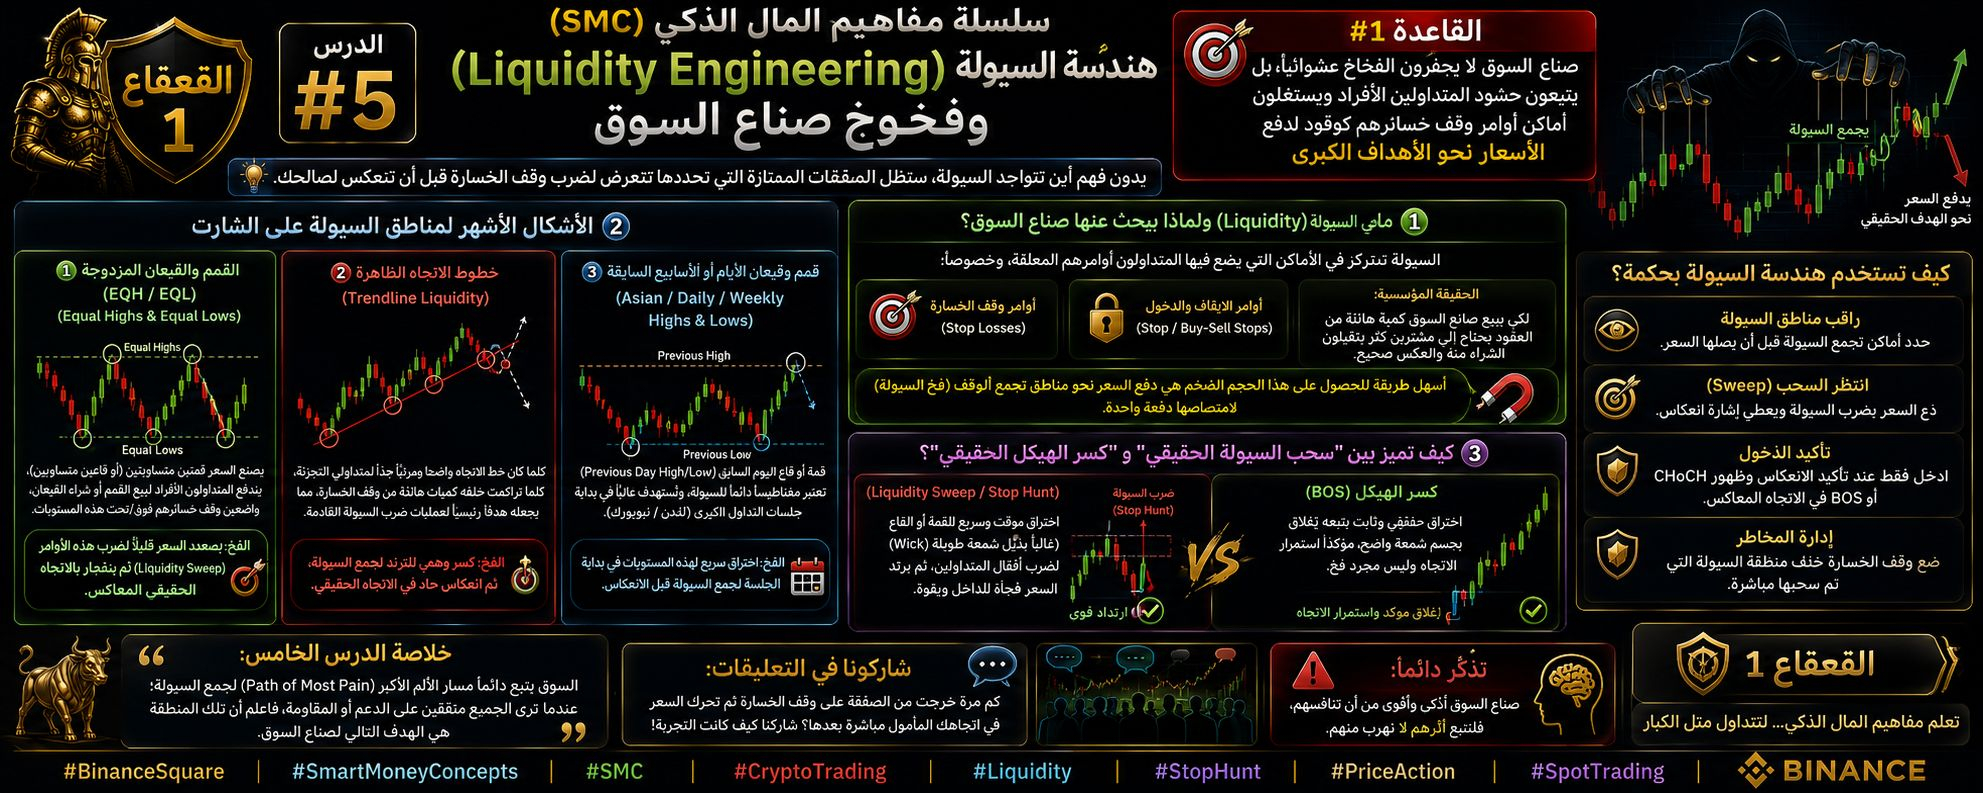

Welcome, fellow traders, to the fifth lesson in our series on Smart Money Concepts (SMC)!
Now that we understand market structure, order blocks, and imbalances, today we’ve reached the real fuel that drives the market: liquidity. Without understanding where liquidity lies, even the excellent trades you identify will keep getting stopped out before the market reverses in your favor.
---
🎯 Rule #1: “Market makers don’t set traps at random. They follow crowds of retail traders and exploit the places where their stop-loss orders are placed as fuel to drive prices toward larger targets.”
---
💡 1️⃣ What is liquidity, and why do market makers seek it?
In financial markets, liquidity is concentrated where hundreds of traders place their pending orders, especially stop-loss orders and stop-entry orders (buy/sell stops).
* The institutional reality: To sell a huge quantity of contracts, a market maker needs plenty of buyers willing to buy from them, and vice versa. The easiest way to obtain this massive volume is to push the price toward areas where stop orders are clustered (liquidity traps) and absorb them all at once.
---
🧬 2️⃣ The most common liquidity zones on a chart
Liquidity gathers like oxygen in clear, visible areas on the chart:
### 🟢 1. Double tops and bottoms (Equal Highs & Equal Lows - EQH / EQL):
* When the price forms two exactly equal highs (or two equal lows), retail traders rush to sell the highs or buy the lows, placing their stop-losses just above or below these levels.
* The trap: The price rises slightly to trigger these orders (a Liquidity Sweep) and fill market makers’ positions, then explodes in the opposite direction—the true direction.
### 🔴 2. Obvious trendlines (Trendline Liquidity):
* The more obvious and visible a trendline is to retail traders (with the price touching it many times), the more stop-loss orders accumulate behind it, making it a prime target for upcoming liquidity grabs.
### 🔵 3. Highs and lows of previous days or weeks (Asian / Daily / Weekly Highs & Lows):
* The previous day’s high or low (Previous Day High/Low) is a constant liquidity magnet, often targeted at the start of major trading sessions (such as the London or New York session).
---
🔍 3️⃣ How do you distinguish between a “true liquidity sweep” and a “true break of structure”?
* Liquidity Sweep / Stop Hunt: A temporary, rapid break above a high or below a low (often with a long candle wick) to trigger traders’ stop-losses, after which the price suddenly and forcefully reverses back inside.
* Break of Structure (BOS): A genuine, sustained break followed by a clear candle-body close, confirming that the trend is continuing rather than it being a mere trap.
---
⚖️ Lesson Five Takeaway:
“The market always follows the Path of Most Pain to collect liquidity. When you see everyone agreeing on a support or resistance level, know that this area is the market makers’ next target.”
---
💬 Tell us in the comments:
How many times have you been stopped out, only for the price to move in your intended direction right afterward? (Share your experience!)
#smc #cryptotrading #liquidity #priceaction #القعقاع_1 $BTC $ETH $BABAB