
#smc
smc
1.4M views
14,417 Discussing
Hot
Latest

·
--
THE MARKET JUST SWEPT $SUI — BUT THIS IS NOT A BUY SIGNAL YET.
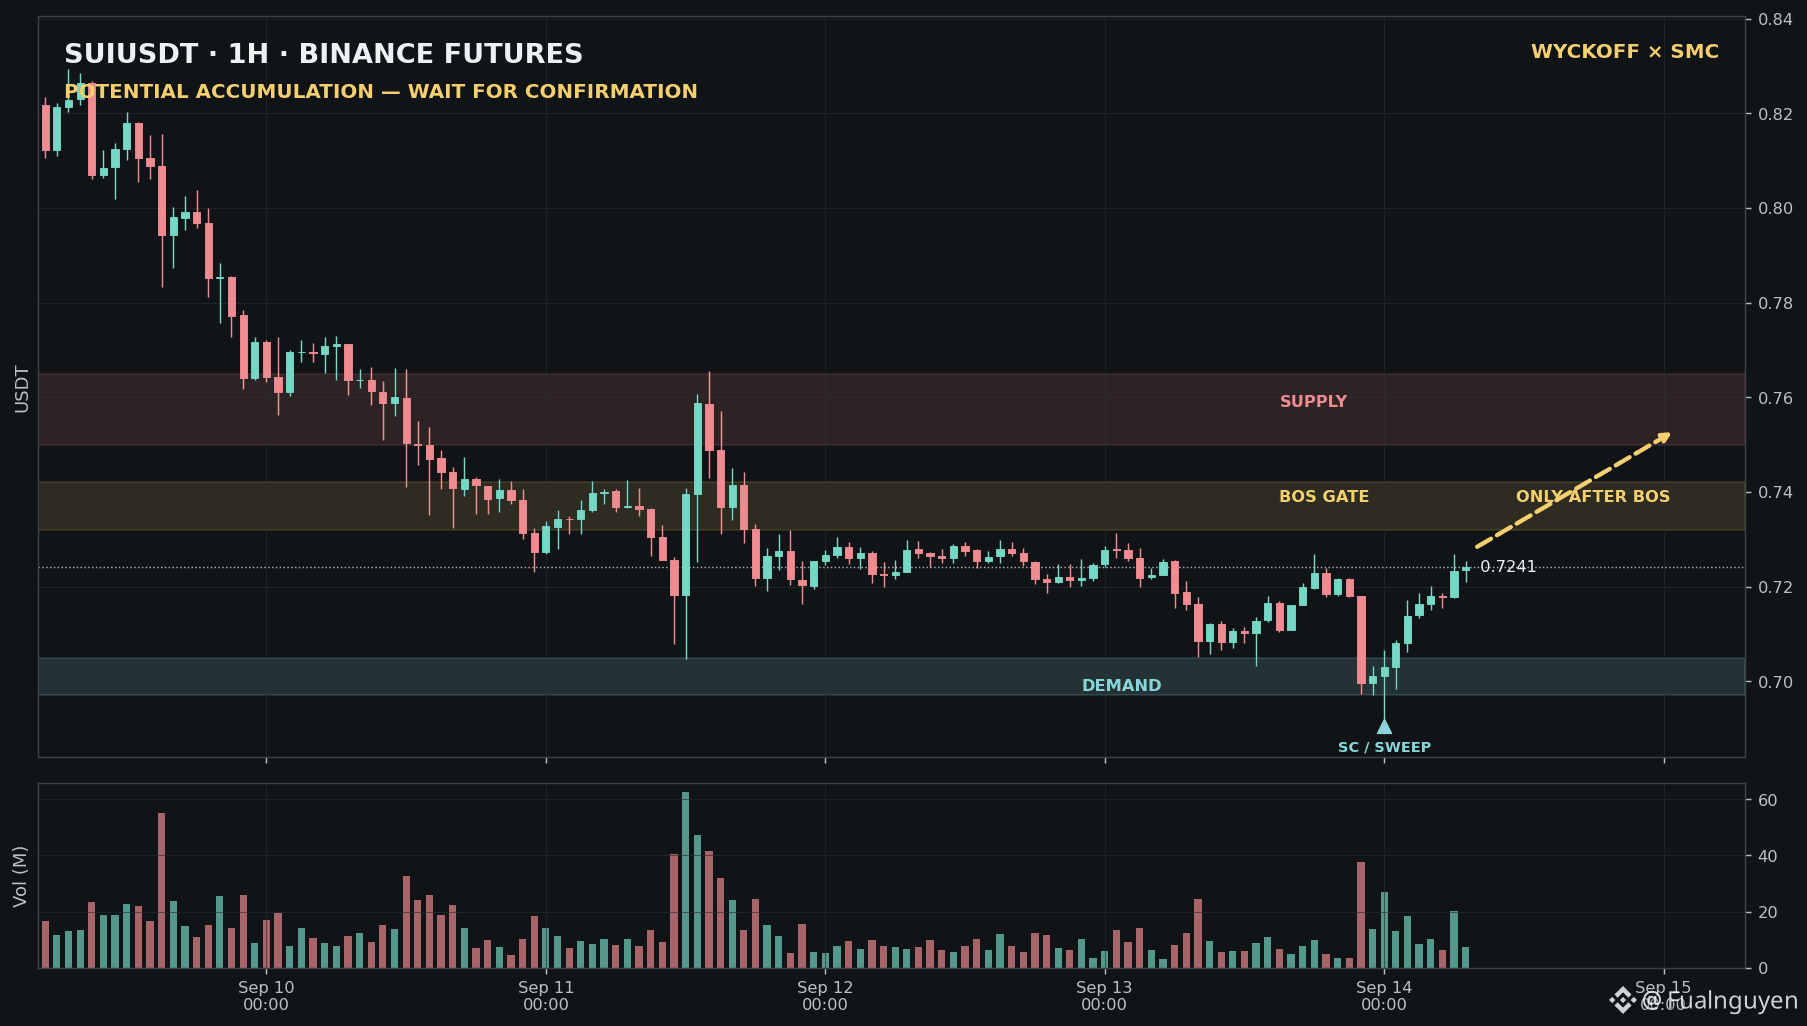
SUIUSDT H1 Futures has printed what may become a Wyckoff accumulation structure after an aggressive sell-off.
Price swept liquidity into $0.692, produced a sharp reaction, and recovered to a confirmed closed-candle price of $0.7241. In Wyckoff terms, that low may be acting as a Selling Climax or Spring candidate. In SMC terms, buyers have reclaimed nearby demand—but the larger bearish structure has not been fully broken.
The confirmation gate is clear:
🟢 An H1 close above $0.732–$0.742, followed by a successful retest, would confirm BOS and expose the $0.750–$0.765 supply zone.
🟡 Holding above $0.697–$0.705 keeps the accumulation thesis alive, but without BOS this remains WATCH—not TRADE READY.
🔴 A decisive H1 close below $0.692 invalidates the recovery thesis and raises the probability of markdown continuation.
The trap here is buying the bounce before confirmation—or shorting directly into recovered demand.
Smart Money may have tested the sell-side liquidity. Now I want proof that buyers can take control of structure.
Which happens first: BOS above $0.742 or another sweep below $0.692? 👀
Paper analysis only. Not financial advice.
#SUI #Wyckoff #SMC
THE MARKET JUST SWEPT $SUI — BUT THIS IS NOT A BUY SIGNAL YET.
SUIUSDT H1 Futures has printed what may become a Wyckoff accumulation structure after an aggressive sell-off.
Price swept liquidity into $0.692, produced a sharp reaction, and recovered to a confirmed closed-candle price of $0.7241. In Wyckoff terms, that low may be acting as a Selling Climax or Spring candidate. In SMC terms, buyers have reclaimed nearby demand—but the larger bearish structure has not been fully broken.
The confirmation gate is clear:
🟢 An H1 close above $0.732–$0.742, followed by a successful retest, would confirm BOS and expose the $0.750–$0.765 supply zone.
🟡 Holding above $0.697–$0.705 keeps the accumulation thesis alive, but without BOS this remains WATCH—not TRADE READY.
🔴 A decisive H1 close below $0.692 invalidates the recovery thesis and raises the probability of markdown continuation.
The trap here is buying the bounce before confirmation—or shorting directly into recovered demand.
Smart Money may have tested the sell-side liquidity. Now I want proof that buyers can take control of structure.
Which happens first: BOS above $0.742 or another sweep below $0.692? 👀
Paper analysis only. Not financial advice.
#SUI #Wyckoff #SMC
SUIUSDT H1 Futures has printed what may become a Wyckoff accumulation structure after an aggressive sell-off.
Price swept liquidity into $0.692, produced a sharp reaction, and recovered to a confirmed closed-candle price of $0.7241. In Wyckoff terms, that low may be acting as a Selling Climax or Spring candidate. In SMC terms, buyers have reclaimed nearby demand—but the larger bearish structure has not been fully broken.
The confirmation gate is clear:
🟢 An H1 close above $0.732–$0.742, followed by a successful retest, would confirm BOS and expose the $0.750–$0.765 supply zone.
🟡 Holding above $0.697–$0.705 keeps the accumulation thesis alive, but without BOS this remains WATCH—not TRADE READY.
🔴 A decisive H1 close below $0.692 invalidates the recovery thesis and raises the probability of markdown continuation.
The trap here is buying the bounce before confirmation—or shorting directly into recovered demand.
Smart Money may have tested the sell-side liquidity. Now I want proof that buyers can take control of structure.
Which happens first: BOS above $0.742 or another sweep below $0.692? 👀
Paper analysis only. Not financial advice.
#SUI #Wyckoff #SMC
Kmay2ts:
Hello Fual, e ko còn dùng tl kia nữa, có 1 số vấn đề bên square cần sự giup đỡ của anh, nếu có thể a kết nối lại với tl mới của em nha : @kmayyyy . Thank kiu anh
5
4
3.6k
·
--
$FIL JUST ENTERED THE DANGER ZONE.
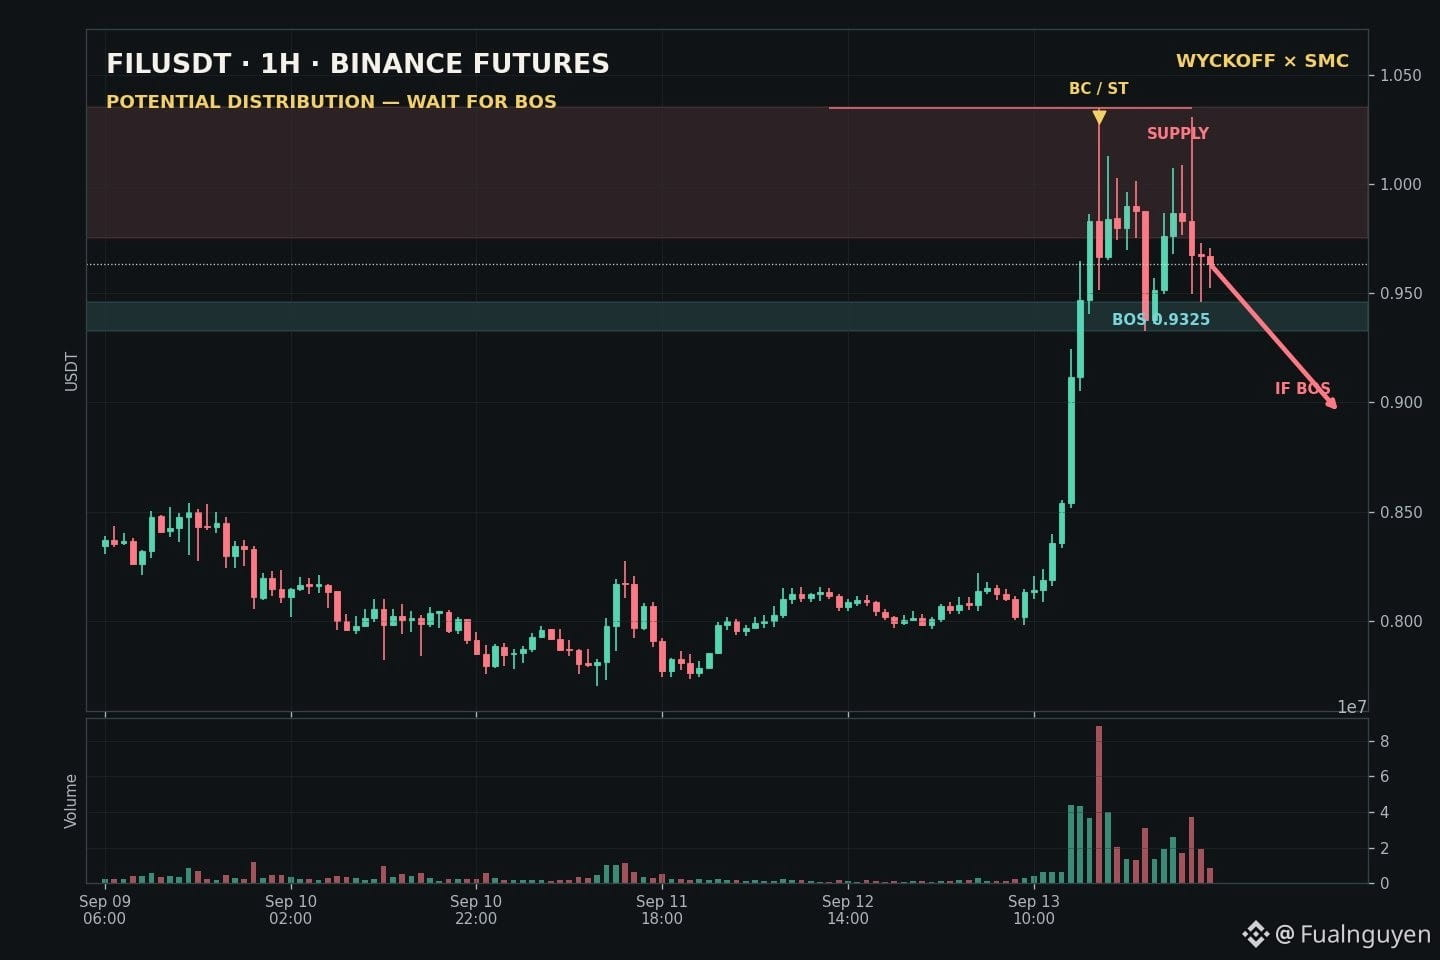
FILUSDT Futures exploded from roughly $0.80 into $1.03, but the H1 structure now looks less like a clean breakout and more like a potential Wyckoff distribution.
The buying climax printed near $1.0347 with the largest volume expansion in the sample. Price then rejected sharply to $0.9325, recovered, and tested the highs again—but failed to establish acceptance above the original peak.
From an SMC perspective, $0.975–$1.035 is now the key supply zone. The latest CLOSED H1 candle finished at $0.9633, below that supply, while momentum cooled.
But this is the important part: the bearish move is NOT confirmed yet.
My trigger is an H1 close below $0.9325. That would confirm a bearish BOS and open the path toward $0.90, followed by the $0.855–$0.82 breakout base where the imbalance began.
The invalidation is equally clear: an H1 close and acceptance above $1.035 would break the distribution thesis and put price discovery back on the table.
Current decision: WAIT — do not chase the pump, and do not front-run the breakdown.
Smart Money often creates maximum excitement near the exact area where risk quietly changes hands.
Which level breaks first: $1.035 or $0.9325? 👀
Paper analysis only. Not financial advice.
#FIL #Wyckoff #SMC
$FIL JUST ENTERED THE DANGER ZONE.
FILUSDT Futures exploded from roughly $0.80 into $1.03, but the H1 structure now looks less like a clean breakout and more like a potential Wyckoff distribution.
The buying climax printed near $1.0347 with the largest volume expansion in the sample. Price then rejected sharply to $0.9325, recovered, and tested the highs again—but failed to establish acceptance above the original peak.
From an SMC perspective, $0.975–$1.035 is now the key supply zone. The latest CLOSED H1 candle finished at $0.9633, below that supply, while momentum cooled.
But this is the important part: the bearish move is NOT confirmed yet.
My trigger is an H1 close below $0.9325. That would confirm a bearish BOS and open the path toward $0.90, followed by the $0.855–$0.82 breakout base where the imbalance began.
The invalidation is equally clear: an H1 close and acceptance above $1.035 would break the distribution thesis and put price discovery back on the table.
Current decision: WAIT — do not chase the pump, and do not front-run the breakdown.
Smart Money often creates maximum excitement near the exact area where risk quietly changes hands.
Which level breaks first: $1.035 or $0.9325? 👀
Paper analysis only. Not financial advice.
#FIL #Wyckoff #SMC
FILUSDT Futures exploded from roughly $0.80 into $1.03, but the H1 structure now looks less like a clean breakout and more like a potential Wyckoff distribution.
The buying climax printed near $1.0347 with the largest volume expansion in the sample. Price then rejected sharply to $0.9325, recovered, and tested the highs again—but failed to establish acceptance above the original peak.
From an SMC perspective, $0.975–$1.035 is now the key supply zone. The latest CLOSED H1 candle finished at $0.9633, below that supply, while momentum cooled.
But this is the important part: the bearish move is NOT confirmed yet.
My trigger is an H1 close below $0.9325. That would confirm a bearish BOS and open the path toward $0.90, followed by the $0.855–$0.82 breakout base where the imbalance began.
The invalidation is equally clear: an H1 close and acceptance above $1.035 would break the distribution thesis and put price discovery back on the table.
Current decision: WAIT — do not chase the pump, and do not front-run the breakdown.
Smart Money often creates maximum excitement near the exact area where risk quietly changes hands.
Which level breaks first: $1.035 or $0.9325? 👀
Paper analysis only. Not financial advice.
#FIL #Wyckoff #SMC
1
3
2.3k
·
--
THE MARKET JUST SWEPT $CVC — BUT THIS IS NOT A BUY SIGNAL YET.
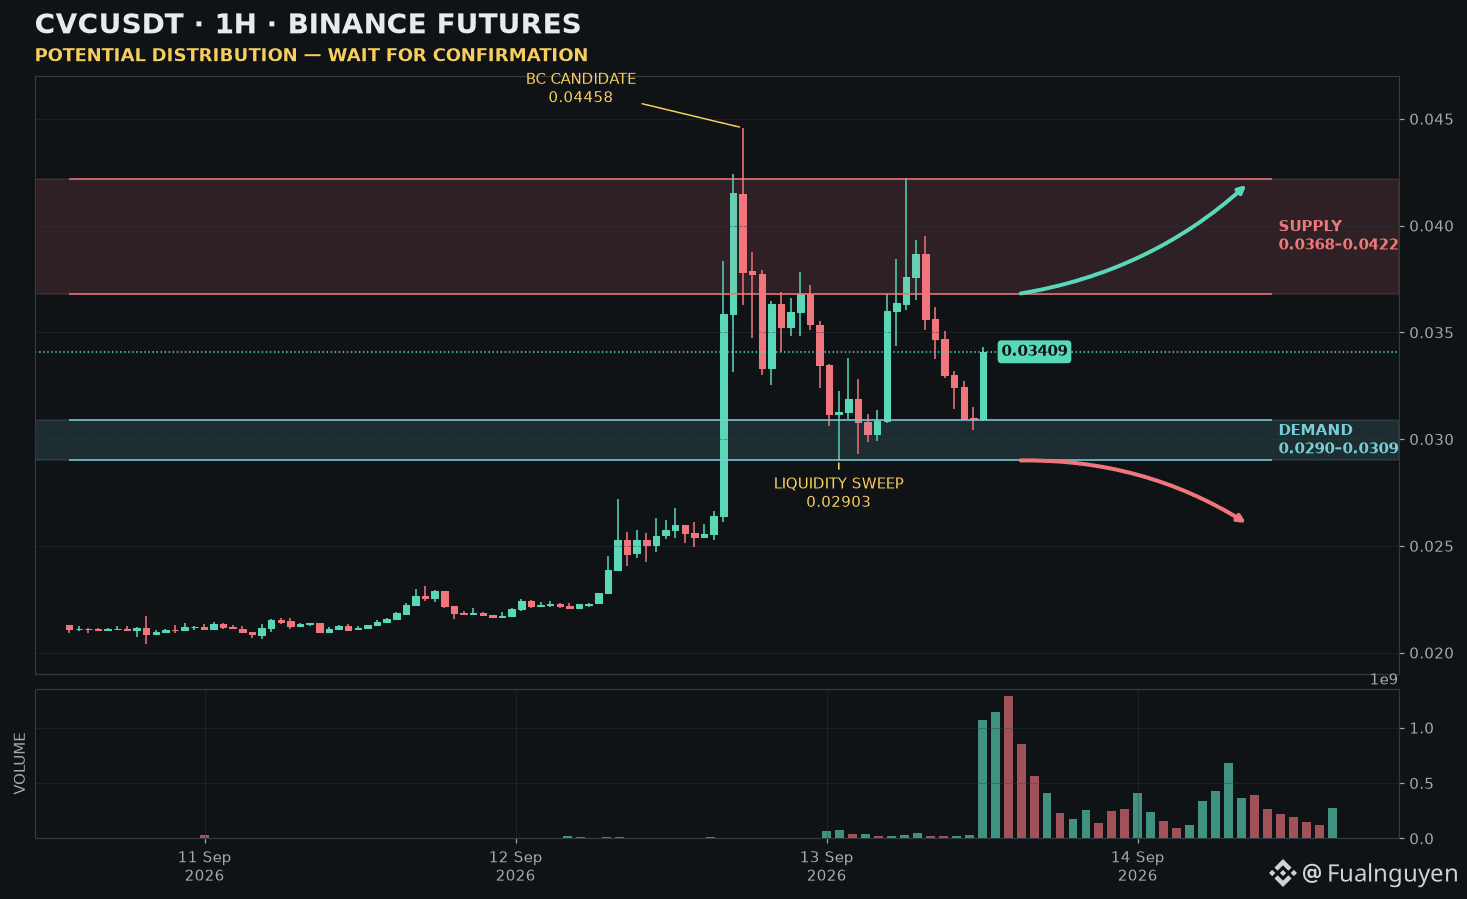
CVCUSDT H1 Futures has formed what may become a Wyckoff distribution range after an explosive markup.
Price accelerated from $0.0204 into a Buying Climax candidate at $0.04458, then reacted sharply toward $0.02903. The rebound stalled at $0.04223, leaving a lower high before price returned to demand.
The latest confirmed closed candle recovered to $0.03409 after testing $0.03086.
In Wyckoff terms, this may be a secondary test of demand inside a potential distribution range. In SMC terms, buyers defended nearby liquidity—but the larger bearish structure has not been broken.
The confirmation gate is clear:
🟢 An H1 close above $0.0368–$0.0385, followed by a successful retest, would confirm bullish BOS and expose the $0.0422–$0.0446 supply zone.
🟡 Holding $0.0290–$0.0309 keeps the recovery thesis alive, but without BOS this remains WATCH—not TRADE READY.
🔴 A decisive H1 close below $0.0290 invalidates the recovery thesis and could open a deeper move toward $0.026.
The trap is chasing the rebound before confirmation—or shorting directly into defended demand.
Smart Money may have tested sell-side liquidity. Now I want proof that buyers can reclaim structure.
Which happens first: BOS above $0.0385 or another sweep below $0.0290? 👀
Paper analysis only. Not financial advice.
#CVC #Wyckoff #SMC
THE MARKET JUST SWEPT $CVC — BUT THIS IS NOT A BUY SIGNAL YET.
CVCUSDT H1 Futures has formed what may become a Wyckoff distribution range after an explosive markup.
Price accelerated from $0.0204 into a Buying Climax candidate at $0.04458, then reacted sharply toward $0.02903. The rebound stalled at $0.04223, leaving a lower high before price returned to demand.
The latest confirmed closed candle recovered to $0.03409 after testing $0.03086.
In Wyckoff terms, this may be a secondary test of demand inside a potential distribution range. In SMC terms, buyers defended nearby liquidity—but the larger bearish structure has not been broken.
The confirmation gate is clear:
🟢 An H1 close above $0.0368–$0.0385, followed by a successful retest, would confirm bullish BOS and expose the $0.0422–$0.0446 supply zone.
🟡 Holding $0.0290–$0.0309 keeps the recovery thesis alive, but without BOS this remains WATCH—not TRADE READY.
🔴 A decisive H1 close below $0.0290 invalidates the recovery thesis and could open a deeper move toward $0.026.
The trap is chasing the rebound before confirmation—or shorting directly into defended demand.
Smart Money may have tested sell-side liquidity. Now I want proof that buyers can reclaim structure.
Which happens first: BOS above $0.0385 or another sweep below $0.0290? 👀
Paper analysis only. Not financial advice.
#CVC #Wyckoff #SMC
CVCUSDT H1 Futures has formed what may become a Wyckoff distribution range after an explosive markup.
Price accelerated from $0.0204 into a Buying Climax candidate at $0.04458, then reacted sharply toward $0.02903. The rebound stalled at $0.04223, leaving a lower high before price returned to demand.
The latest confirmed closed candle recovered to $0.03409 after testing $0.03086.
In Wyckoff terms, this may be a secondary test of demand inside a potential distribution range. In SMC terms, buyers defended nearby liquidity—but the larger bearish structure has not been broken.
The confirmation gate is clear:
🟢 An H1 close above $0.0368–$0.0385, followed by a successful retest, would confirm bullish BOS and expose the $0.0422–$0.0446 supply zone.
🟡 Holding $0.0290–$0.0309 keeps the recovery thesis alive, but without BOS this remains WATCH—not TRADE READY.
🔴 A decisive H1 close below $0.0290 invalidates the recovery thesis and could open a deeper move toward $0.026.
The trap is chasing the rebound before confirmation—or shorting directly into defended demand.
Smart Money may have tested sell-side liquidity. Now I want proof that buyers can reclaim structure.
Which happens first: BOS above $0.0385 or another sweep below $0.0290? 👀
Paper analysis only. Not financial advice.
#CVC #Wyckoff #SMC
ishammadkhan:
Should i keep holding ?
2
2
587
·
--
BTC JUST BROKE H1 STRUCTURE — BUT THIS IS WHERE LATE LONGS GET TRAPPED.
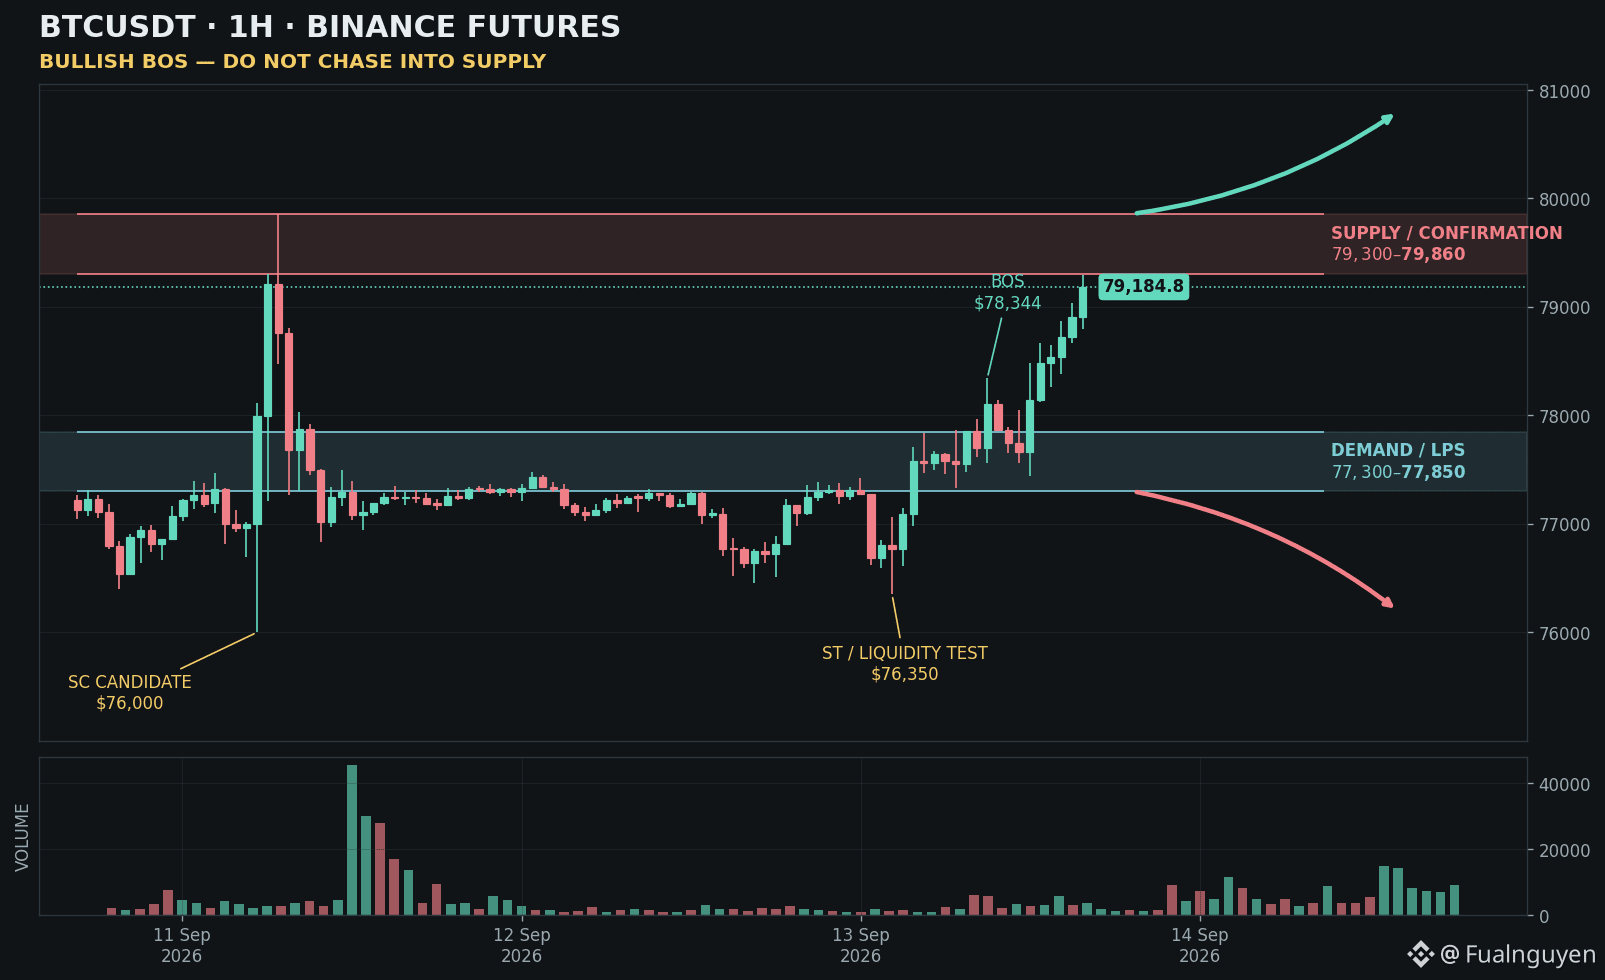
BTCUSDT H1 Futures has formed what may become a Wyckoff accumulation structure after repeated tests of sell-side liquidity.
The first reaction came from $76,000 — a possible Selling Climax candidate. Price later tested liquidity again at $76,350, held the range, and closed the latest confirmed H1 candle at $79,184.8.
In SMC terms, buyers have now produced bullish displacement and broken the $78,344 swing high. Volume on the latest closed candle reached 1.30× the 20-candle average.
That is real strength — but price is moving directly into supply while H1 RSI is already near 76.
The confirmation gate is clear:
🟢 An H1 close above $79,300–$79,860, followed by a successful retest, would confirm acceptance and expose $80,500–$81,000.
🟡 A pullback that holds $77,300–$77,850 could become the LPS. Until the retest succeeds, this is WATCH — not a place to chase.
🔴 An H1 close below $77,300 weakens the bullish structure. Losing $76,350 invalidates the recovery thesis and puts $76,000 back in play.
The trap is buying directly into resistance because BOS already printed — or shorting strength before supply actually rejects price.
Smart Money may have completed the liquidity test. Now I want proof that buyers can hold the breakout.
What happens first: acceptance above $79,860 or a retest of $77,850? 👀
Paper analysis only. Not financial advice.
#BTC #Wyckoff #SMC
BTC JUST BROKE H1 STRUCTURE — BUT THIS IS WHERE LATE LONGS GET TRAPPED.
BTCUSDT H1 Futures has formed what may become a Wyckoff accumulation structure after repeated tests of sell-side liquidity.
The first reaction came from $76,000 — a possible Selling Climax candidate. Price later tested liquidity again at $76,350, held the range, and closed the latest confirmed H1 candle at $79,184.8.
In SMC terms, buyers have now produced bullish displacement and broken the $78,344 swing high. Volume on the latest closed candle reached 1.30× the 20-candle average.
That is real strength — but price is moving directly into supply while H1 RSI is already near 76.
The confirmation gate is clear:
🟢 An H1 close above $79,300–$79,860, followed by a successful retest, would confirm acceptance and expose $80,500–$81,000.
🟡 A pullback that holds $77,300–$77,850 could become the LPS. Until the retest succeeds, this is WATCH — not a place to chase.
🔴 An H1 close below $77,300 weakens the bullish structure. Losing $76,350 invalidates the recovery thesis and puts $76,000 back in play.
The trap is buying directly into resistance because BOS already printed — or shorting strength before supply actually rejects price.
Smart Money may have completed the liquidity test. Now I want proof that buyers can hold the breakout.
What happens first: acceptance above $79,860 or a retest of $77,850? 👀
Paper analysis only. Not financial advice.
#BTC #Wyckoff #SMC
BTCUSDT H1 Futures has formed what may become a Wyckoff accumulation structure after repeated tests of sell-side liquidity.
The first reaction came from $76,000 — a possible Selling Climax candidate. Price later tested liquidity again at $76,350, held the range, and closed the latest confirmed H1 candle at $79,184.8.
In SMC terms, buyers have now produced bullish displacement and broken the $78,344 swing high. Volume on the latest closed candle reached 1.30× the 20-candle average.
That is real strength — but price is moving directly into supply while H1 RSI is already near 76.
The confirmation gate is clear:
🟢 An H1 close above $79,300–$79,860, followed by a successful retest, would confirm acceptance and expose $80,500–$81,000.
🟡 A pullback that holds $77,300–$77,850 could become the LPS. Until the retest succeeds, this is WATCH — not a place to chase.
🔴 An H1 close below $77,300 weakens the bullish structure. Losing $76,350 invalidates the recovery thesis and puts $76,000 back in play.
The trap is buying directly into resistance because BOS already printed — or shorting strength before supply actually rejects price.
Smart Money may have completed the liquidity test. Now I want proof that buyers can hold the breakout.
What happens first: acceptance above $79,860 or a retest of $77,850? 👀
Paper analysis only. Not financial advice.
#BTC #Wyckoff #SMC
1
2
155
·
--
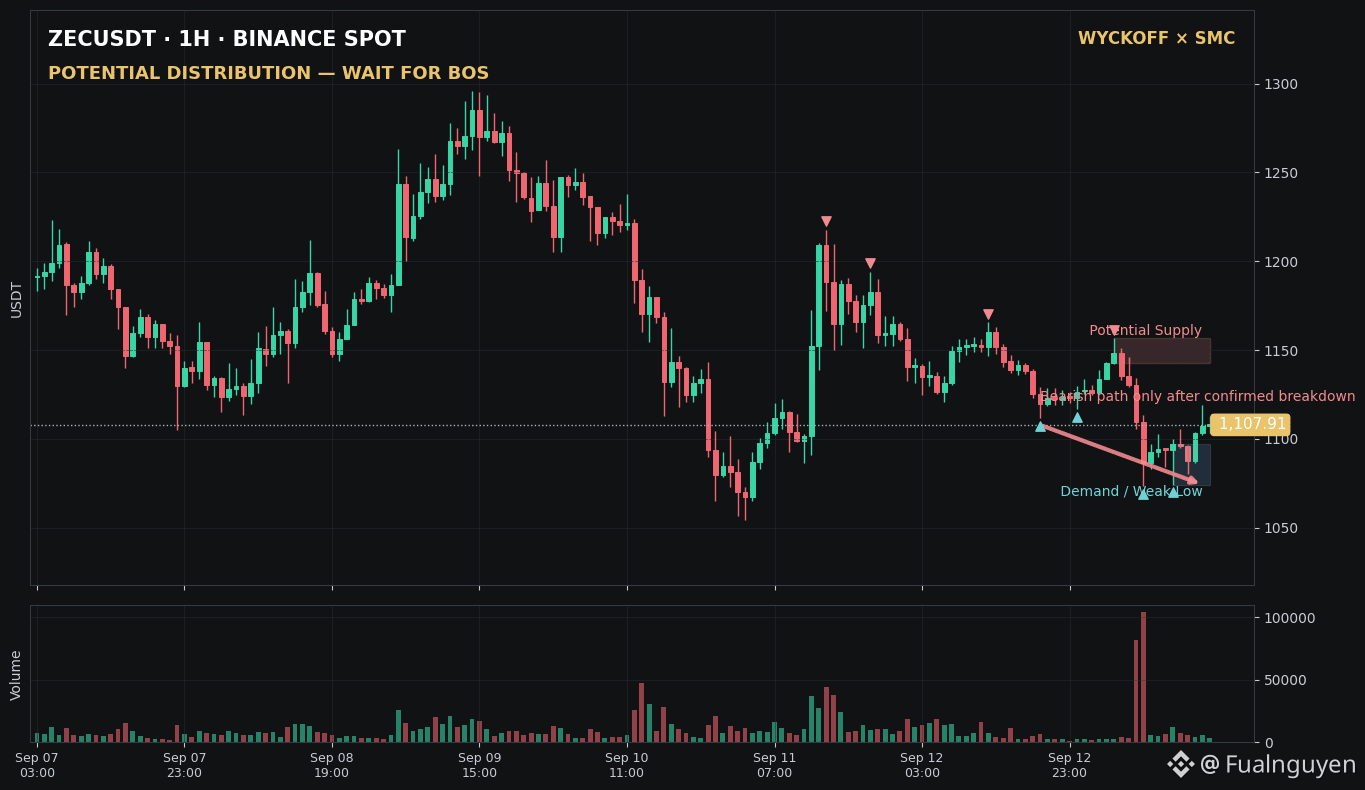
$ZEC is trying to bounce—but the H1 structure still looks like a potential distribution.
After the expansion toward $1,300, price began printing lower highs while every recovery attracted fresh supply. The latest rejection near $1,150–$1,157 strengthens the idea that Smart Money may still be distributing into strength rather than preparing an immediate breakout.
The key level is now $1,074.
As long as ZEC remains above it, the bearish thesis is NOT confirmed. This is still a range, not permission to chase a short.
But an H1 close below $1,074 would create the bearish BOS I am waiting for. That could open the path toward the $1,050 liquidity pocket first, followed by the psychological $1,000 zone if sellers maintain control.
My map:
🔴 Rejection below $1,150–$1,157 + H1 close under $1,074 = distribution confirmation and downside continuation
🟡 Holding $1,074 = no trade; price remains trapped inside the range
🟢 Reclaiming $1,157 with acceptance = bearish thesis invalidated and the market may attack higher liquidity again
I am not predicting a crash before confirmation. I am watching whether the weak low breaks after supply has already shown its hand.
Would you trade the breakdown below $1,074—or wait for a retest before acting? 👀
#ZEC #Wyckoff #SMC
Analysis based on closed Binance Spot H1 candles. Not financial advice.
$ZEC is trying to bounce—but the H1 structure still looks like a potential distribution.
After the expansion toward $1,300, price began printing lower highs while every recovery attracted fresh supply. The latest rejection near $1,150–$1,157 strengthens the idea that Smart Money may still be distributing into strength rather than preparing an immediate breakout.
The key level is now $1,074.
As long as ZEC remains above it, the bearish thesis is NOT confirmed. This is still a range, not permission to chase a short.
But an H1 close below $1,074 would create the bearish BOS I am waiting for. That could open the path toward the $1,050 liquidity pocket first, followed by the psychological $1,000 zone if sellers maintain control.
My map:
🔴 Rejection below $1,150–$1,157 + H1 close under $1,074 = distribution confirmation and downside continuation
🟡 Holding $1,074 = no trade; price remains trapped inside the range
🟢 Reclaiming $1,157 with acceptance = bearish thesis invalidated and the market may attack higher liquidity again
I am not predicting a crash before confirmation. I am watching whether the weak low breaks after supply has already shown its hand.
Would you trade the breakdown below $1,074—or wait for a retest before acting? 👀
#ZEC #Wyckoff #SMC
Analysis based on closed Binance Spot H1 candles. Not financial advice.
After the expansion toward $1,300, price began printing lower highs while every recovery attracted fresh supply. The latest rejection near $1,150–$1,157 strengthens the idea that Smart Money may still be distributing into strength rather than preparing an immediate breakout.
The key level is now $1,074.
As long as ZEC remains above it, the bearish thesis is NOT confirmed. This is still a range, not permission to chase a short.
But an H1 close below $1,074 would create the bearish BOS I am waiting for. That could open the path toward the $1,050 liquidity pocket first, followed by the psychological $1,000 zone if sellers maintain control.
My map:
🔴 Rejection below $1,150–$1,157 + H1 close under $1,074 = distribution confirmation and downside continuation
🟡 Holding $1,074 = no trade; price remains trapped inside the range
🟢 Reclaiming $1,157 with acceptance = bearish thesis invalidated and the market may attack higher liquidity again
I am not predicting a crash before confirmation. I am watching whether the weak low breaks after supply has already shown its hand.
Would you trade the breakdown below $1,074—or wait for a retest before acting? 👀
#ZEC #Wyckoff #SMC
Analysis based on closed Binance Spot H1 candles. Not financial advice.
1
6
2.2k
·
--
BR JUST ENTERED PRICE DISCOVERY — AND THIS IS WHERE FOMO BECOMES LIQUIDITY.
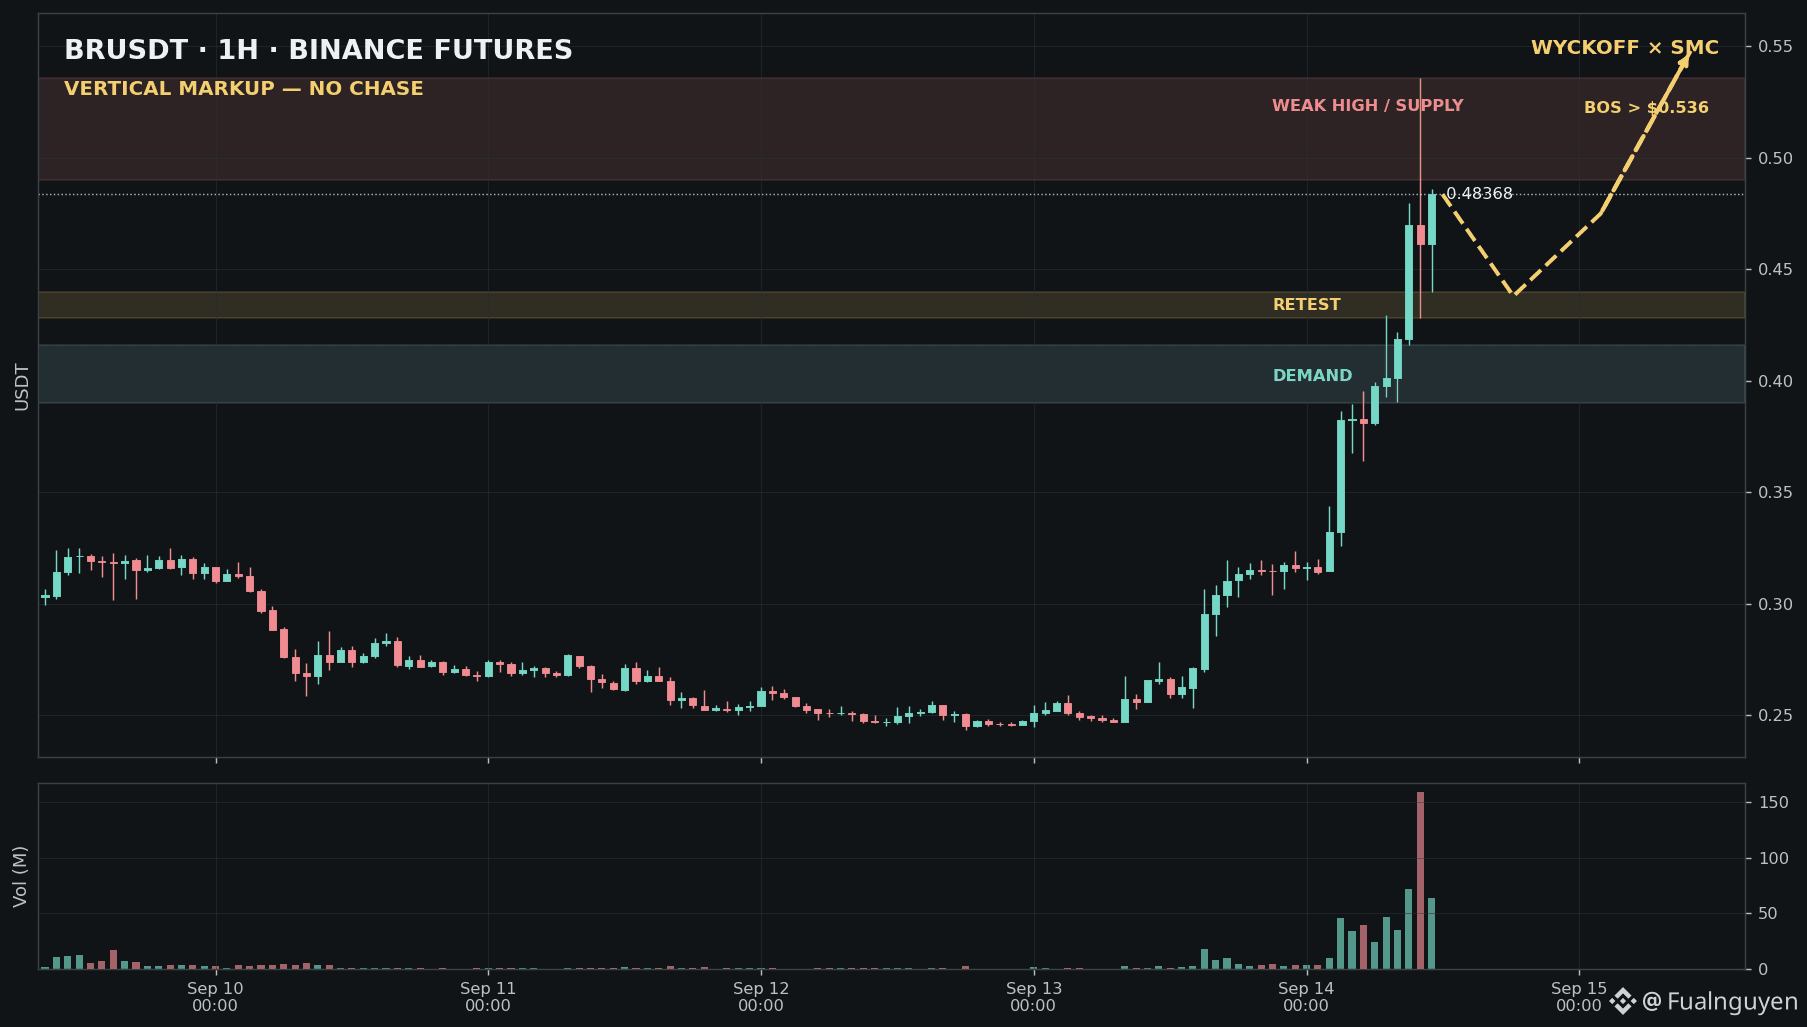
Using 299 closed H1 Futures candles, the Wyckoff–SMC agent found a vertical Markup phase—not a mature distribution yet.
$BR gained roughly 81.8% across the latest 24-hour window. The confirmed H1 close is $0.48368 after price printed a $0.536 high, while the latest closed-candle volume reached about 2.8× the prior 24-hour average.
That confirms aggressive demand—but it also confirms extreme extension.
Here is my market map:
🟢 An H1 close above $0.536 followed by a successful retest would confirm continuation into fresh price discovery
🟡 A controlled pullback into $0.428–$0.440 could provide the first structural retest worth watching
🔴 Losing that zone exposes deeper demand at $0.390–$0.416. A decisive close below $0.390 would damage the immediate Markup thesis
The Wyckoff warning is simple: vertical demand can continue longer than expected, but chasing after expansion often turns late buyers into exit liquidity
The SMC rule is even cleaner: bullish displacement is not the same as a low-risk entry
I am not calling a top. I am refusing to confuse momentum with permission to chase
What comes first: a confirmed BOS above $0.536—or a liquidity reset into $0.440? 👀
Paper analysis only. Not financial advice
#BR #Wyckoff #SMC
BR JUST ENTERED PRICE DISCOVERY — AND THIS IS WHERE FOMO BECOMES LIQUIDITY.
Using 299 closed H1 Futures candles, the Wyckoff–SMC agent found a vertical Markup phase—not a mature distribution yet.
$BR gained roughly 81.8% across the latest 24-hour window. The confirmed H1 close is $0.48368 after price printed a $0.536 high, while the latest closed-candle volume reached about 2.8× the prior 24-hour average.
That confirms aggressive demand—but it also confirms extreme extension.
Here is my market map:
🟢 An H1 close above $0.536 followed by a successful retest would confirm continuation into fresh price discovery
🟡 A controlled pullback into $0.428–$0.440 could provide the first structural retest worth watching
🔴 Losing that zone exposes deeper demand at $0.390–$0.416. A decisive close below $0.390 would damage the immediate Markup thesis
The Wyckoff warning is simple: vertical demand can continue longer than expected, but chasing after expansion often turns late buyers into exit liquidity
The SMC rule is even cleaner: bullish displacement is not the same as a low-risk entry
I am not calling a top. I am refusing to confuse momentum with permission to chase
What comes first: a confirmed BOS above $0.536—or a liquidity reset into $0.440? 👀
Paper analysis only. Not financial advice
#BR #Wyckoff #SMC
Using 299 closed H1 Futures candles, the Wyckoff–SMC agent found a vertical Markup phase—not a mature distribution yet.
$BR gained roughly 81.8% across the latest 24-hour window. The confirmed H1 close is $0.48368 after price printed a $0.536 high, while the latest closed-candle volume reached about 2.8× the prior 24-hour average.
That confirms aggressive demand—but it also confirms extreme extension.
Here is my market map:
🟢 An H1 close above $0.536 followed by a successful retest would confirm continuation into fresh price discovery
🟡 A controlled pullback into $0.428–$0.440 could provide the first structural retest worth watching
🔴 Losing that zone exposes deeper demand at $0.390–$0.416. A decisive close below $0.390 would damage the immediate Markup thesis
The Wyckoff warning is simple: vertical demand can continue longer than expected, but chasing after expansion often turns late buyers into exit liquidity
The SMC rule is even cleaner: bullish displacement is not the same as a low-risk entry
I am not calling a top. I am refusing to confuse momentum with permission to chase
What comes first: a confirmed BOS above $0.536—or a liquidity reset into $0.440? 👀
Paper analysis only. Not financial advice
#BR #Wyckoff #SMC
1
1
723

🚀 3 ALTCOINS ON WATCH: KEY SMC & FVG LEVELS 📊
🔹 $CAP / USDT
Price: ~$0.06618
Target: $0.07800 – $0.08000
FVG Resistance: $0.06000 – $0.06800
FVG Support: $0.05500 – $0.06000 | $0.04100 – $0.04400
Invalidation: $0.02500
{future}(CAPUSDT)
🔹 $LSK / USDT
Price: ~$0.36179
Target: $2.4000
FVG Targets: $1.8500 – $1.9500 | $1.2000 – $1.3500
FVG Resistance: $0.7500 – $0.8500
FVG Support: $0.2000 – $0.2500 | $0.1500
{future}(LSKUSDT)
🔹 $BR / USDT
Price: ~$0.53380
Target: $0.5500
FVG Support: $0.2700 – $0.3000
Inducement: $0.2200
Major FVG Demand: $0.1400 – $0.2000
{future}(BRUSDT)
⚠️ NFA. Manage your risk! 🚀
#BinanceSquare #CryptoTrading #CAP #LSK #BR #FVG #smc
🚀 3 ALTCOINS ON WATCH: KEY SMC & FVG LEVELS 📊
🔹 $CAP / USDT
Price: ~$0.06618
Target: $0.07800 – $0.08000
FVG Resistance: $0.06000 – $0.06800
FVG Support: $0.05500 – $0.06000 | $0.04100 – $0.04400
Invalidation: $0.02500
🔹 $LSK / USDT
Price: ~$0.36179
Target: $2.4000
FVG Targets: $1.8500 – $1.9500 | $1.2000 – $1.3500
FVG Resistance: $0.7500 – $0.8500
FVG Support: $0.2000 – $0.2500 | $0.1500
🔹 $BR / USDT
Price: ~$0.53380
Target: $0.5500
FVG Support: $0.2700 – $0.3000
Inducement: $0.2200
Major FVG Demand: $0.1400 – $0.2000
⚠️ NFA. Manage your risk! 🚀
#BinanceSquare #CryptoTrading #CAP #LSK #BR #FVG #smc
🔹 $CAP / USDT
Price: ~$0.06618
Target: $0.07800 – $0.08000
FVG Resistance: $0.06000 – $0.06800
FVG Support: $0.05500 – $0.06000 | $0.04100 – $0.04400
Invalidation: $0.02500
🔹 $LSK / USDT
Price: ~$0.36179
Target: $2.4000
FVG Targets: $1.8500 – $1.9500 | $1.2000 – $1.3500
FVG Resistance: $0.7500 – $0.8500
FVG Support: $0.2000 – $0.2500 | $0.1500
🔹 $BR / USDT
Price: ~$0.53380
Target: $0.5500
FVG Support: $0.2700 – $0.3000
Inducement: $0.2200
Major FVG Demand: $0.1400 – $0.2000
⚠️ NFA. Manage your risk! 🚀
#BinanceSquare #CryptoTrading #CAP #LSK #BR #FVG #smc
Ict 🟢
Smc 🟢
21 hr(s) left
2.2k

WE’RE BACK 🚨
It’s been a little quiet around here, but the market never sleeps and neither does the opportunity. 📊🔥
I’ve been watching the charts, studying the structure, and waiting for the right setups rather than forcing trades.
From now on, we’re back to focusing on:
📌 Market Structure
📌 SMC Setups
📌 Liquidity & Key Levels
📌 High-Probability Entries
📌 Risk Management
No FOMO. No emotional trading. Just patience, discipline, and execution. 🎯
Stay locked in there’s a lot to watch in crypto. 🚀
Let’s get back to work. 💪📈
#Crypto #Bitcoin #Trading #SMC #CryptoTrading
WE’RE BACK 🚨
It’s been a little quiet around here, but the market never sleeps and neither does the opportunity. 📊🔥
I’ve been watching the charts, studying the structure, and waiting for the right setups rather than forcing trades.
From now on, we’re back to focusing on:
📌 Market Structure
📌 SMC Setups
📌 Liquidity & Key Levels
📌 High-Probability Entries
📌 Risk Management
No FOMO. No emotional trading. Just patience, discipline, and execution. 🎯
Stay locked in there’s a lot to watch in crypto. 🚀
Let’s get back to work. 💪📈
#Crypto #Bitcoin #Trading #SMC #CryptoTrading
It’s been a little quiet around here, but the market never sleeps and neither does the opportunity. 📊🔥
I’ve been watching the charts, studying the structure, and waiting for the right setups rather than forcing trades.
From now on, we’re back to focusing on:
📌 Market Structure
📌 SMC Setups
📌 Liquidity & Key Levels
📌 High-Probability Entries
📌 Risk Management
No FOMO. No emotional trading. Just patience, discipline, and execution. 🎯
Stay locked in there’s a lot to watch in crypto. 🚀
Let’s get back to work. 💪📈
#Crypto #Bitcoin #Trading #SMC #CryptoTrading
68

🚨 $BR EXPLODES 81% INTO PRICE DISCOVERY AS SMART MONEY HUNTS LIQUIDITY! 💥
Entry: 0.428 - 0.440 ⚡
Target: 0.536 🚀
Stop Loss: 0.390 ⚠️
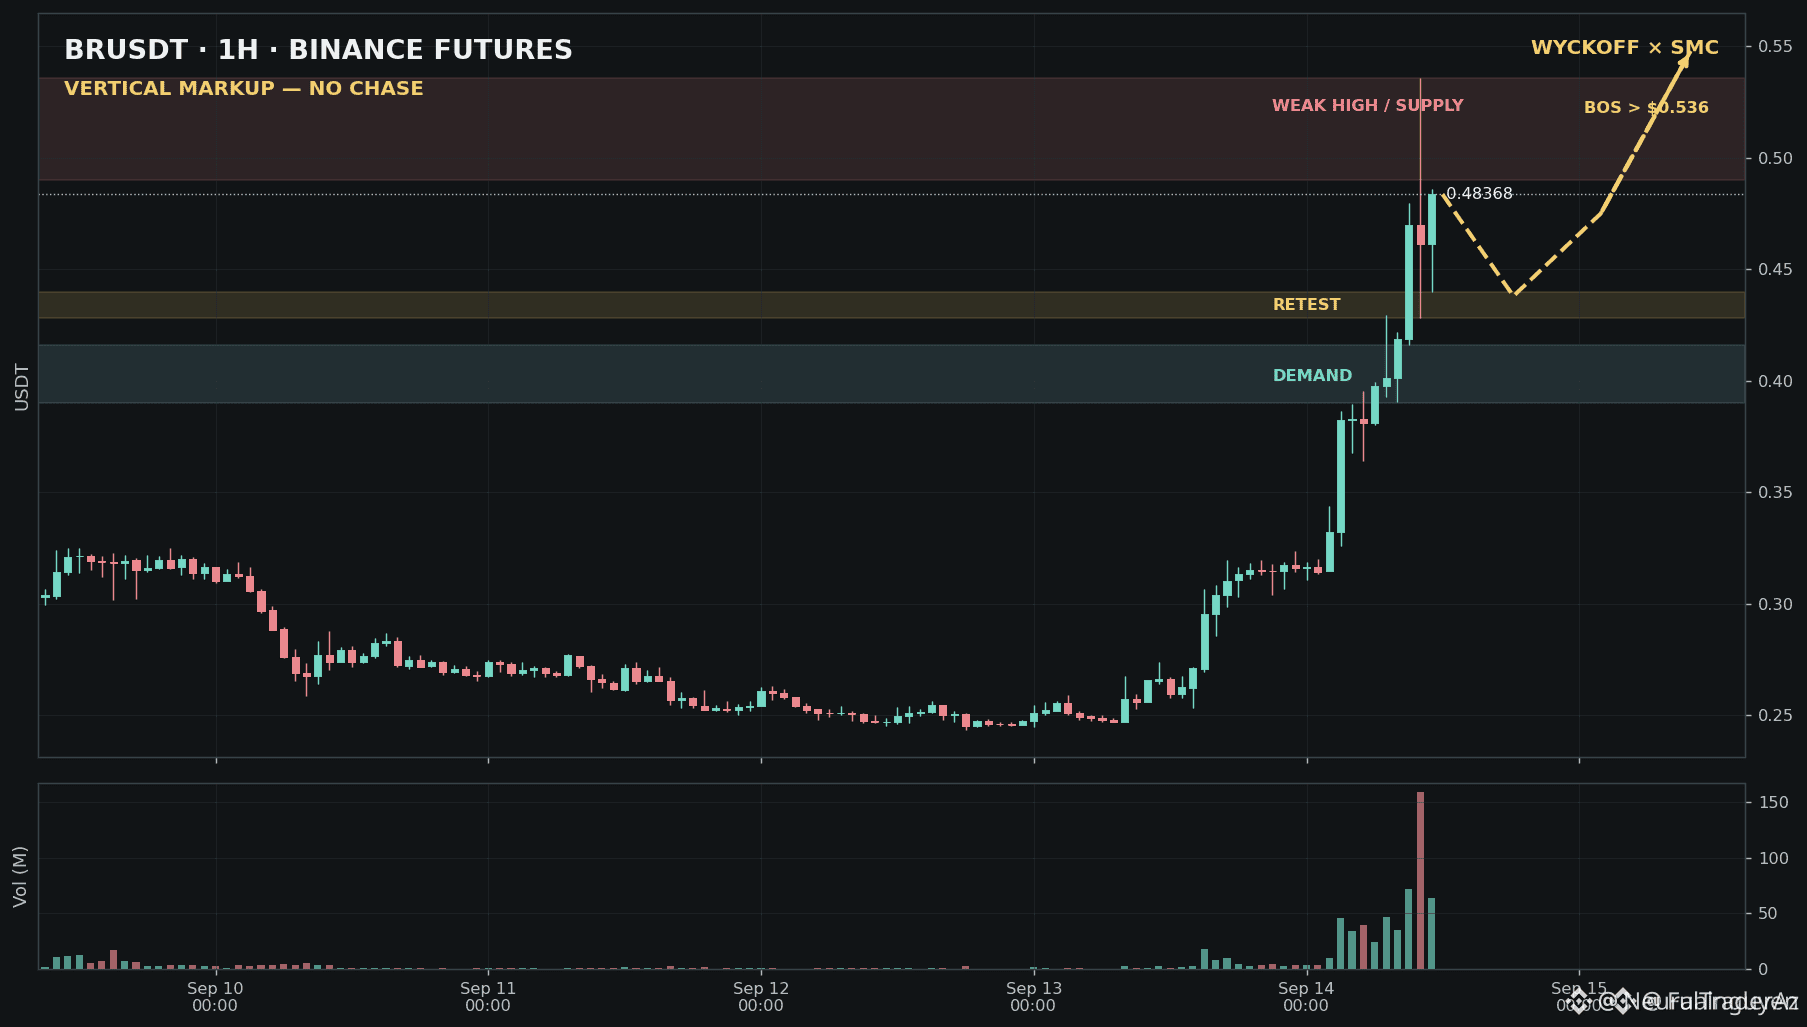
After printing an 81.8% 24-hour expansion, $BR has officially entered vertical Wyckoff Markup mode. 📊 Aggressive buying volume expanded to 2.8x the daily average, driving price to a local high of $0.536 before settling near $0.483.
While institutional momentum is strong, entering after extreme extension carries a severe risk of becoming exit liquidity. 🔍 Smart money patience dictates waiting for either a clean structural breakout above $0.536 or a controlled liquidity reset into the $0.428–$0.440 demand block. 💬 What comes first: a confirmed BOS above the high or a liquidity sweep into demand? 👇
⚠️ Not financial advice. Always manage your risk. 🛡️
🏷️ #BR #Wyckoff #SMC #Crypto
🔥 💎
🚨 $BR EXPLODES 81% INTO PRICE DISCOVERY AS SMART MONEY HUNTS LIQUIDITY! 💥
Entry: 0.428 - 0.440 ⚡
Target: 0.536 🚀
Stop Loss: 0.390 ⚠️
After printing an 81.8% 24-hour expansion, $BR has officially entered vertical Wyckoff Markup mode. 📊 Aggressive buying volume expanded to 2.8x the daily average, driving price to a local high of $0.536 before settling near $0.483.
While institutional momentum is strong, entering after extreme extension carries a severe risk of becoming exit liquidity. 🔍 Smart money patience dictates waiting for either a clean structural breakout above $0.536 or a controlled liquidity reset into the $0.428–$0.440 demand block. 💬 What comes first: a confirmed BOS above the high or a liquidity sweep into demand? 👇
⚠️ Not financial advice. Always manage your risk. 🛡️
🏷️ #BR #Wyckoff #SMC #Crypto
🔥 💎
Entry: 0.428 - 0.440 ⚡
Target: 0.536 🚀
Stop Loss: 0.390 ⚠️
After printing an 81.8% 24-hour expansion, $BR has officially entered vertical Wyckoff Markup mode. 📊 Aggressive buying volume expanded to 2.8x the daily average, driving price to a local high of $0.536 before settling near $0.483.
While institutional momentum is strong, entering after extreme extension carries a severe risk of becoming exit liquidity. 🔍 Smart money patience dictates waiting for either a clean structural breakout above $0.536 or a controlled liquidity reset into the $0.428–$0.440 demand block. 💬 What comes first: a confirmed BOS above the high or a liquidity sweep into demand? 👇
⚠️ Not financial advice. Always manage your risk. 🛡️
🏷️ #BR #Wyckoff #SMC #Crypto
🔥 💎
88


·
--
📚 TRADING LESSON
What is BOS?
Break Of Structure.
Higher High + Higher Low = bullish structure 🐂
Lower Low + Lower High = bearish structure 🐻
Simple—but extremely important.
Save this post. 🔖
$BTC
#bos #smc #priceaction #BTC
📚 TRADING LESSON
What is BOS?
Break Of Structure.
Higher High + Higher Low = bullish structure 🐂
Lower Low + Lower High = bearish structure 🐻
Simple—but extremely important.
Save this post. 🔖
$BTC
#bos #smc #priceaction #BTC
What is BOS?
Break Of Structure.
Higher High + Higher Low = bullish structure 🐂
Lower Low + Lower High = bearish structure 🐻
Simple—but extremely important.
Save this post. 🔖
$BTC
#bos #smc #priceaction #BTC
48

Virtual ( VIRTUAL ) surges as order blocks reveal bullish volume, signaling strong momentum and growing investor sentiment. Pol ( POL ) leverages its ecosystem growth, attracting liquidity and trading activity that fuels adoption. Mubarak ( MUBARAK ) showcases innovation with cross chain bridges, boosting confidence among traders. Together, they form a compelling bullish case for SMC strategy. 🚀🔥📈 #Crypto #SMC #BSC
Virtual ( VIRTUAL ) surges as order blocks reveal bullish volume, signaling strong momentum and growing investor sentiment. Pol ( POL ) leverages its ecosystem growth, attracting liquidity and trading activity that fuels adoption. Mubarak ( MUBARAK ) showcases innovation with cross chain bridges, boosting confidence among traders. Together, they form a compelling bullish case for SMC strategy. 🚀🔥📈 #Crypto #SMC #BSC
118

·
--
Bearish
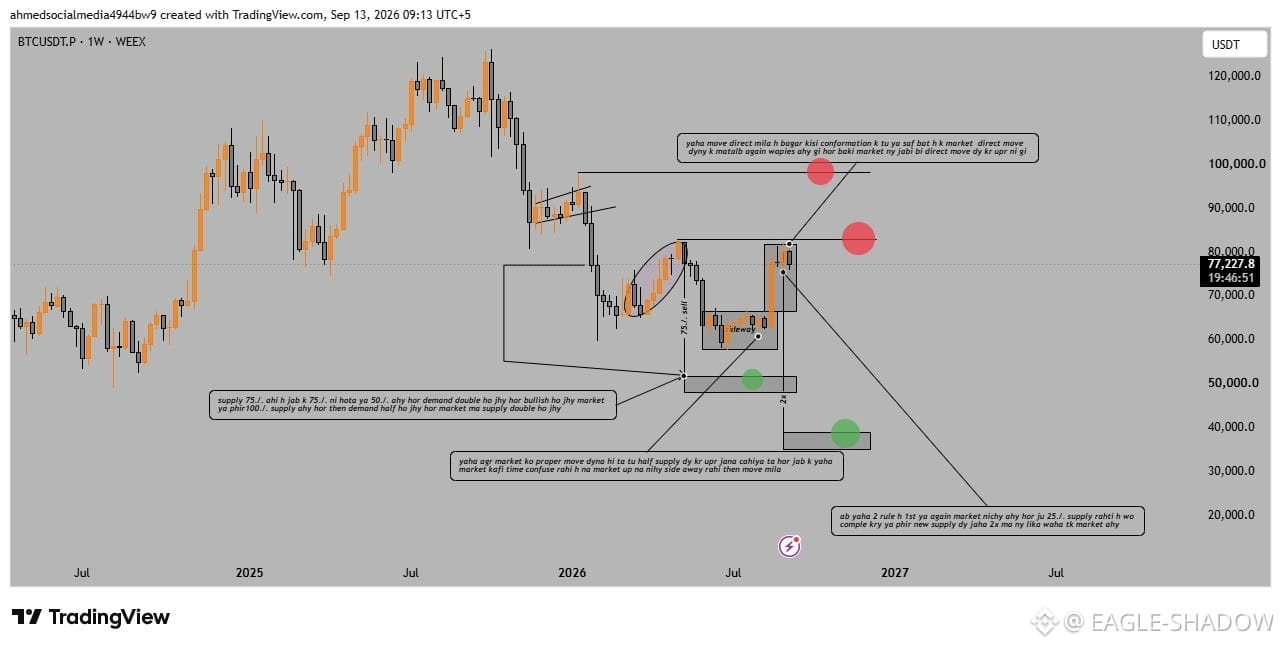
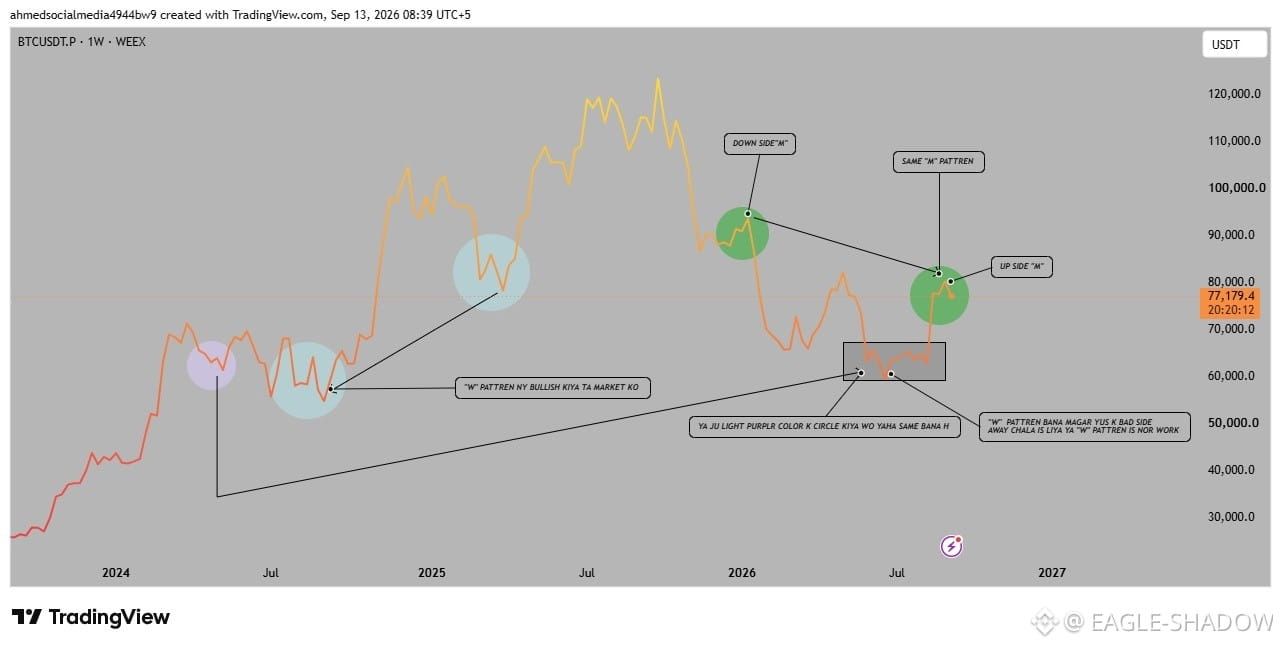
Title: 🎯 BTC/USDT 1W Deep-Dive: The "2x Supply Origin" & Direct Move Institutional Imbalance! 🚨📉Post Body:Hey Traders! 👋 Zooming in close on the Bitcoin (BTC/USDT) 1-Weekly structure. The algorithms are painting a very specific delivery pattern here, and we are tracking the hidden footprints step-by-step! 🧠💼Here is the deep tactical analysis of this layout:1️⃣ The 75% Sell Vector Footprint: Notice the major distribution curve (marked 75% Sell). The subsequent rapid cascade forced a temporary local absorption box below. This structural pause confirms that heavy block orders were being trapped before this sudden vertical reaction. 🚨2️⃣ The No-Confirmation Direct Pump: The current weekly price action has pushed straight up to $77,193.6. However, because this expansion was direct and lacked proper lower structural revalidation, it has left behind an organic imbalance. Institutional engineering states that direct unconfirmed pumps always retrace to mitigate the origin! 🔄🪙3️⃣ The 2x Supply & 25% Residual Targets: Rule 1 is completely locked in. Either the market builds a structural top deviation here, or it turns back around aggressively to absorb the remaining 25% distribution metrics. This coordinates perfectly with a sweep straight into our lower primary institutional blocks! 🎯📉⚠️ Risk Warning: Trading macro cycles on digital assets carries severe financial risks, and high-leverage or aggressive short biases during volatile expansion weeks can lead to total capital loss. Always align your setups with strict risk execution frameworks.⚡ My Strategy: I am refusing to chase this unconfirmed weekly green momentum. The direct vector indicates an engineered trap to induce late-stage buyer FOMO. I am holding my ground, keeping my capital protected, and waiting for the ultimate bearish validation to execute the macro downward hedge! 🏹💰Are you trapping yourself in this unconfirmed direct move, or are you executing the structural rules with me? Let me know below! 👇💬#Bitcoin #BTC #MacroStructure #SMC #PriceAction
Title: 🎯 BTC/USDT 1W Deep-Dive: The "2x Supply Origin" & Direct Move Institutional Imbalance! 🚨📉Post Body:Hey Traders! 👋 Zooming in close on the Bitcoin (BTC/USDT) 1-Weekly structure. The algorithms are painting a very specific delivery pattern here, and we are tracking the hidden footprints step-by-step! 🧠💼Here is the deep tactical analysis of this layout:1️⃣ The 75% Sell Vector Footprint: Notice the major distribution curve (marked 75% Sell). The subsequent rapid cascade forced a temporary local absorption box below. This structural pause confirms that heavy block orders were being trapped before this sudden vertical reaction. 🚨2️⃣ The No-Confirmation Direct Pump: The current weekly price action has pushed straight up to $77,193.6. However, because this expansion was direct and lacked proper lower structural revalidation, it has left behind an organic imbalance. Institutional engineering states that direct unconfirmed pumps always retrace to mitigate the origin! 🔄🪙3️⃣ The 2x Supply & 25% Residual Targets: Rule 1 is completely locked in. Either the market builds a structural top deviation here, or it turns back around aggressively to absorb the remaining 25% distribution metrics. This coordinates perfectly with a sweep straight into our lower primary institutional blocks! 🎯📉⚠️ Risk Warning: Trading macro cycles on digital assets carries severe financial risks, and high-leverage or aggressive short biases during volatile expansion weeks can lead to total capital loss. Always align your setups with strict risk execution frameworks.⚡ My Strategy: I am refusing to chase this unconfirmed weekly green momentum. The direct vector indicates an engineered trap to induce late-stage buyer FOMO. I am holding my ground, keeping my capital protected, and waiting for the ultimate bearish validation to execute the macro downward hedge! 🏹💰Are you trapping yourself in this unconfirmed direct move, or are you executing the structural rules with me? Let me know below! 👇💬#Bitcoin #BTC #MacroStructure #SMC #PriceAction
78
·
--
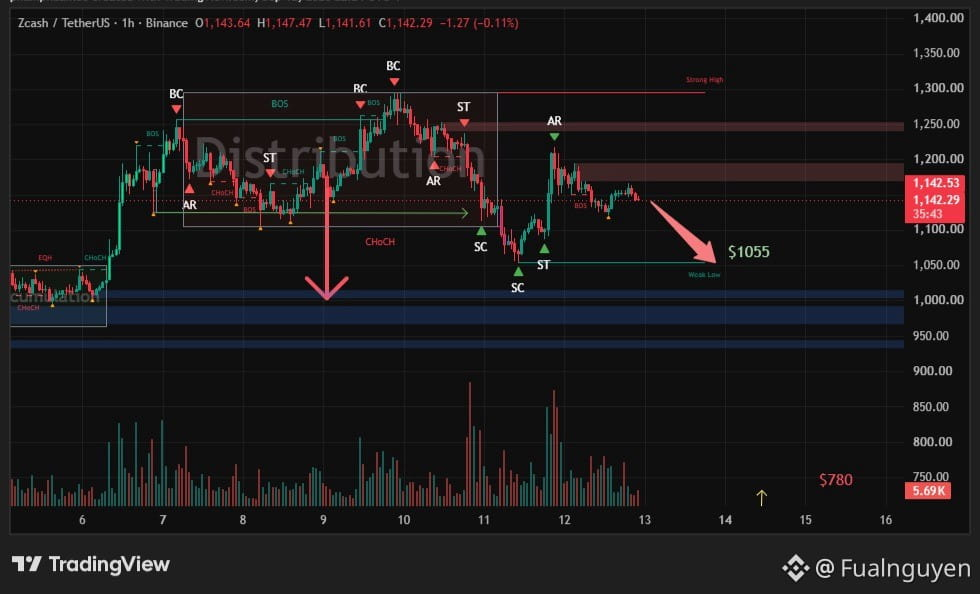
**Is $ZEC preparing for another markdown toward $1,055?**
Running the ZECUSDT H1 chart through my Wyckoff-smc-swing-agent reveals a potential distribution structure—not a clean bullish continuation
The larger range was repeatedly rejected near $1,250–$1,290, with multiple Buying Climax attempts followed by lower highs, CHoCH, and bearish BOS
After the first markdown, ZEC printed a Selling Climax near $1,055 and rallied toward $1,200
But the recovery failed to reclaim supply
Price is now consolidating around $1,142 beneath the $1,180–$1,200 resistance zone, while the previous low at $1,055 remains visibly weak
One distinction matters here
Smart Money does not need to wait until $1,055 to unload
The distribution likely happens during rallies into overhead supply. Once inventory has been transferred, the markdown can seek the sell-side liquidity resting beneath the weak low
A confirmed H1 breakdown below the current consolidation would make $1,055 the next logical liquidity target
But the reaction there matters more than simply reaching it
⚡ Sweep $1,055 and reclaim quickly: potential Spring and reversal setup
🔻 Accept below $1,055: the structure could expand toward the $1,000 demand area
The bearish thesis weakens if ZEC reclaims and holds above $1,200, while a recovery above $1,250 would invalidate the immediate distribution scenario
For a Spot-only strategy, the current output is **AVOID_BUY**, not a recommendation to short
Would you buy a Spring below $1,055—or wait for $1,200 to become support?
$ZEC #Wyckoff #SMC
**Is $ZEC preparing for another markdown toward $1,055?**
Running the ZECUSDT H1 chart through my Wyckoff-smc-swing-agent reveals a potential distribution structure—not a clean bullish continuation
The larger range was repeatedly rejected near $1,250–$1,290, with multiple Buying Climax attempts followed by lower highs, CHoCH, and bearish BOS
After the first markdown, ZEC printed a Selling Climax near $1,055 and rallied toward $1,200
But the recovery failed to reclaim supply
Price is now consolidating around $1,142 beneath the $1,180–$1,200 resistance zone, while the previous low at $1,055 remains visibly weak
One distinction matters here
Smart Money does not need to wait until $1,055 to unload
The distribution likely happens during rallies into overhead supply. Once inventory has been transferred, the markdown can seek the sell-side liquidity resting beneath the weak low
A confirmed H1 breakdown below the current consolidation would make $1,055 the next logical liquidity target
But the reaction there matters more than simply reaching it
⚡ Sweep $1,055 and reclaim quickly: potential Spring and reversal setup
🔻 Accept below $1,055: the structure could expand toward the $1,000 demand area
The bearish thesis weakens if ZEC reclaims and holds above $1,200, while a recovery above $1,250 would invalidate the immediate distribution scenario
For a Spot-only strategy, the current output is **AVOID_BUY**, not a recommendation to short
Would you buy a Spring below $1,055—or wait for $1,200 to become support?
$ZEC #Wyckoff #SMC
Running the ZECUSDT H1 chart through my Wyckoff-smc-swing-agent reveals a potential distribution structure—not a clean bullish continuation
The larger range was repeatedly rejected near $1,250–$1,290, with multiple Buying Climax attempts followed by lower highs, CHoCH, and bearish BOS
After the first markdown, ZEC printed a Selling Climax near $1,055 and rallied toward $1,200
But the recovery failed to reclaim supply
Price is now consolidating around $1,142 beneath the $1,180–$1,200 resistance zone, while the previous low at $1,055 remains visibly weak
One distinction matters here
Smart Money does not need to wait until $1,055 to unload
The distribution likely happens during rallies into overhead supply. Once inventory has been transferred, the markdown can seek the sell-side liquidity resting beneath the weak low
A confirmed H1 breakdown below the current consolidation would make $1,055 the next logical liquidity target
But the reaction there matters more than simply reaching it
⚡ Sweep $1,055 and reclaim quickly: potential Spring and reversal setup
🔻 Accept below $1,055: the structure could expand toward the $1,000 demand area
The bearish thesis weakens if ZEC reclaims and holds above $1,200, while a recovery above $1,250 would invalidate the immediate distribution scenario
For a Spot-only strategy, the current output is **AVOID_BUY**, not a recommendation to short
Would you buy a Spring below $1,055—or wait for $1,200 to become support?
$ZEC #Wyckoff #SMC
닥터 카므란 잘랄리:
Excellent breakdown of the Wyckoff structure, especially the distinction between a liquidity sweep and genuine acceptance below $1,055. That reaction could be more informative than the level itself. A quick reclaim after a sweep would suggest trapped sellers, while sustained trading below it would strengthen the markdown thesis toward $1,000. I also like the discipline of using $1,200 and $1,250 as clear invalidation levels. This is the kind of structure I look for before considering a setup.
2
3
1.9k
·
--
I don’t believe $BTC will print a deeper low this year
Not because downside risk has disappeared—but because the weekly structure has changed
When I ran this chart through my Wyckoff-smc-swing-agent, the most important signal was not the rebound toward $77.4K
It was what happened inside the $55K–$60K demand zone
BTC entered long-term weekly demand, formed a Secondary Test, failed to extend lower, and then reclaimed the $70K area
From a Wyckoff perspective, supply was tested without fresh downside follow-through
From an SMC perspective, weekly demand defended while price moved back toward the first supply zone around $77K–$82K
This does not mean BTC must rally in a straight line
A rejection could still trigger a retest of $70K—or even another visit to the weekly demand zone
But a retest is not the same as a deeper yearly bottom
My thesis remains constructive while weekly candles hold above $55K–$60K
A clean weekly acceptance below that zone would invalidate the setup and force the agent to switch from WATCH to AVOID_BUY
Until that happens, I see this structure as a re-accumulation candidate after markdown—not preparation for another major capitulation
I am not chasing a green candle
I simply believe the market may have already shown us where serious buyers are willing to defend
Do you see $55K–$60K as the cycle floor—or unfinished business?
$BTC #Wyckoff #SMC
I don’t believe $BTC will print a deeper low this year
Not because downside risk has disappeared—but because the weekly structure has changed
When I ran this chart through my Wyckoff-smc-swing-agent, the most important signal was not the rebound toward $77.4K
It was what happened inside the $55K–$60K demand zone
BTC entered long-term weekly demand, formed a Secondary Test, failed to extend lower, and then reclaimed the $70K area
From a Wyckoff perspective, supply was tested without fresh downside follow-through
From an SMC perspective, weekly demand defended while price moved back toward the first supply zone around $77K–$82K
This does not mean BTC must rally in a straight line
A rejection could still trigger a retest of $70K—or even another visit to the weekly demand zone
But a retest is not the same as a deeper yearly bottom
My thesis remains constructive while weekly candles hold above $55K–$60K
A clean weekly acceptance below that zone would invalidate the setup and force the agent to switch from WATCH to AVOID_BUY
Until that happens, I see this structure as a re-accumulation candidate after markdown—not preparation for another major capitulation
I am not chasing a green candle
I simply believe the market may have already shown us where serious buyers are willing to defend
Do you see $55K–$60K as the cycle floor—or unfinished business?
$BTC #Wyckoff #SMC
Not because downside risk has disappeared—but because the weekly structure has changed
When I ran this chart through my Wyckoff-smc-swing-agent, the most important signal was not the rebound toward $77.4K
It was what happened inside the $55K–$60K demand zone
BTC entered long-term weekly demand, formed a Secondary Test, failed to extend lower, and then reclaimed the $70K area
From a Wyckoff perspective, supply was tested without fresh downside follow-through
From an SMC perspective, weekly demand defended while price moved back toward the first supply zone around $77K–$82K
This does not mean BTC must rally in a straight line
A rejection could still trigger a retest of $70K—or even another visit to the weekly demand zone
But a retest is not the same as a deeper yearly bottom
My thesis remains constructive while weekly candles hold above $55K–$60K
A clean weekly acceptance below that zone would invalidate the setup and force the agent to switch from WATCH to AVOID_BUY
Until that happens, I see this structure as a re-accumulation candidate after markdown—not preparation for another major capitulation
I am not chasing a green candle
I simply believe the market may have already shown us where serious buyers are willing to defend
Do you see $55K–$60K as the cycle floor—or unfinished business?
$BTC #Wyckoff #SMC

닥터 카므란 잘랄리:
Excellent structural breakdown, especially the distinction between a retest and a genuine cycle low. The $55K to $60K demand zone becomes much more meaningful when combined with the weekly structure and the failure to extend lower after the secondary test. I’d also watch the reaction around $77K to $82K, because rejection there followed by a higher low could strengthen the re-accumulation thesis. Clear invalidation levels make this analysis much more actionable.
4
3
936
·
--
Bearish
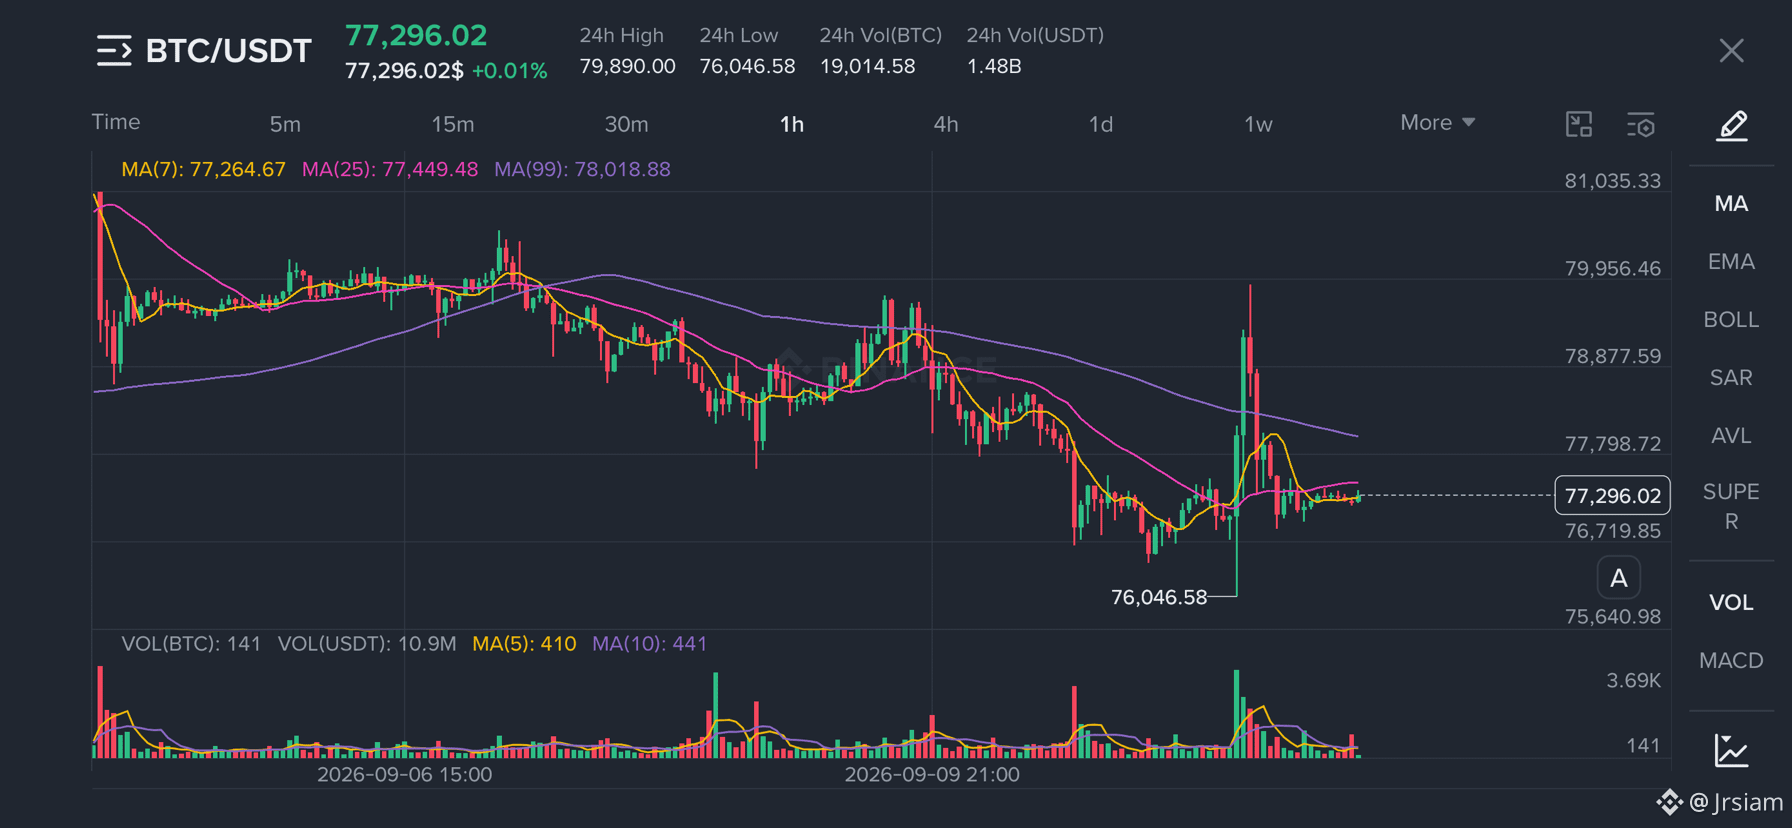
Most beginners chase the breakout.
Smart traders watch the liquidity sweep. 👀
Price takes the previous high → traders enter LONG → price reverses.
Or…
Price takes the previous low → shorts enter → price reverses.
That’s why I never enter just because a level breaks.
$BTC
#liquidity #smc #BTC #Trading
Most beginners chase the breakout.
Smart traders watch the liquidity sweep. 👀
Price takes the previous high → traders enter LONG → price reverses.
Or…
Price takes the previous low → shorts enter → price reverses.
That’s why I never enter just because a level breaks.
$BTC
#liquidity #smc #BTC #Trading
Smart traders watch the liquidity sweep. 👀
Price takes the previous high → traders enter LONG → price reverses.
Or…
Price takes the previous low → shorts enter → price reverses.
That’s why I never enter just because a level breaks.
$BTC
#liquidity #smc #BTC #Trading
1
72

·
--
$ETH / USDT (15M Chart Analysis) — Bullish Expansion or Liquidity Sweep? 🔥
Ethereum ($ETH) is currently showing short-term bullish momentum on the 15-minute timeframe after rebounding from local low liquidity at $2,436.75. Here is the technical breakdown using Smart Money Concepts (SMC) & Moving Averages:
Key Technical Observations:
(1) Current Price: ~$2,467.77
(2) Recent Local High: $2,471.26 (Immediate Liquidity Target / Resistance)
(3) Key Support Zone: $2,450.00 – $2,456.00 (MA25 & MA99 Dynamic Support / FVG)
(4) Moving Average Alignment: Price has pushed above the MA(7), MA(25), and MA(99), signaling a short-term bullish trend alignment on lower timeframes.
Potential Market Scenarios:
1️⃣ Liquidity Sweep & Continuation (Bullish):
If $ETH sweeps above the recent high at $2,471.26 and holds structure above the $2,460 support area, we could see an expansion toward the $2,480 – $2,500 zone.
2️⃣ Retracement / Reversal:
If $ETH fails to break $2,471 cleanly and forms a lower timeframe CHOCH below $2,456, expect a retracement back toward the $2,440 – $2,436 liquidity pool.
Trading Strategy:
Avoid chasing green candles near short-term highs. Wait for lower timeframe confirmation (CHOCH + FVG) on pullbacks before executing positions. Always practice strict risk management!
What is your bias on etherum right now? Are you expecting a breakout past $2,480? Share your views below! 👇
#ETH #cryptotrading #smc
$ETH / USDT (15M Chart Analysis) — Bullish Expansion or Liquidity Sweep? 🔥
Ethereum ($ETH ) is currently showing short-term bullish momentum on the 15-minute timeframe after rebounding from local low liquidity at $2,436.75. Here is the technical breakdown using Smart Money Concepts (SMC) & Moving Averages:
Key Technical Observations:
(1) Current Price: ~$2,467.77
(2) Recent Local High: $2,471.26 (Immediate Liquidity Target / Resistance)
(3) Key Support Zone: $2,450.00 – $2,456.00 (MA25 & MA99 Dynamic Support / FVG)
(4) Moving Average Alignment: Price has pushed above the MA(7), MA(25), and MA(99), signaling a short-term bullish trend alignment on lower timeframes.
Potential Market Scenarios:
1️⃣ Liquidity Sweep & Continuation (Bullish):
If $ETH sweeps above the recent high at $2,471.26 and holds structure above the $2,460 support area, we could see an expansion toward the $2,480 – $2,500 zone.
2️⃣ Retracement / Reversal:
If $ETH fails to break $2,471 cleanly and forms a lower timeframe CHOCH below $2,456, expect a retracement back toward the $2,440 – $2,436 liquidity pool.
Trading Strategy:
Avoid chasing green candles near short-term highs. Wait for lower timeframe confirmation (CHOCH + FVG) on pullbacks before executing positions. Always practice strict risk management!
What is your bias on etherum right now? Are you expecting a breakout past $2,480? Share your views below! 👇
#ETH #cryptotrading #smc
Ethereum ($ETH ) is currently showing short-term bullish momentum on the 15-minute timeframe after rebounding from local low liquidity at $2,436.75. Here is the technical breakdown using Smart Money Concepts (SMC) & Moving Averages:
Key Technical Observations:
(1) Current Price: ~$2,467.77
(2) Recent Local High: $2,471.26 (Immediate Liquidity Target / Resistance)
(3) Key Support Zone: $2,450.00 – $2,456.00 (MA25 & MA99 Dynamic Support / FVG)
(4) Moving Average Alignment: Price has pushed above the MA(7), MA(25), and MA(99), signaling a short-term bullish trend alignment on lower timeframes.
Potential Market Scenarios:
1️⃣ Liquidity Sweep & Continuation (Bullish):
If $ETH sweeps above the recent high at $2,471.26 and holds structure above the $2,460 support area, we could see an expansion toward the $2,480 – $2,500 zone.
2️⃣ Retracement / Reversal:
If $ETH fails to break $2,471 cleanly and forms a lower timeframe CHOCH below $2,456, expect a retracement back toward the $2,440 – $2,436 liquidity pool.
Trading Strategy:
Avoid chasing green candles near short-term highs. Wait for lower timeframe confirmation (CHOCH + FVG) on pullbacks before executing positions. Always practice strict risk management!
What is your bias on etherum right now? Are you expecting a breakout past $2,480? Share your views below! 👇
#ETH #cryptotrading #smc

1
72

·
--
🚨 Live Chart Update: The Gold Algo is Hunting Liquidity with Deadly Precision! 📉🔥
Hey traders, Raffayel here.
Look at how the Smart Money Algorithm is running the board on the 15M Gold (XAU/USD) chart. No lagging indicators, just pure institutional delivery!
Following the historic crash, price swept straight through our previously noted $4,315 level, clearing out sell-side liquidity (SSL) to hit exactly $4,303.25.
🔎 SMC/ICT Engineering on the Current Chart:
1️⃣ Price has left behind clear, unfilled Fair Value Gaps (FVG) during this aggressive displacement (marked in red/green boxes).
2️⃣ The $4,300 handle acts as a major psychological round number and a key liquidity pool where the algo is currently pricing orders.
🛡️ Execution Plan (Master Zero Account):
We remain disciplined with our strict 0.05 lot size, core funds locked in USDT/USDC. No catching falling knives. We are waiting for a clear Change of Character (CHoCH) on lower timeframes before anticipating a premium pullback to rebalance the upper FVGs at $4,312 and $4,330.
Patience pays, FOMO destroys. Did you catch this massive expansion lower, or are you waiting to snipe the structural reversal? Let me know below! 👁️🗨️👇
#Gold #XAUUSD #SMC #Trading
$PAXG
🚨 Live Chart Update: The Gold Algo is Hunting Liquidity with Deadly Precision! 📉🔥
Hey traders, Raffayel here.
Look at how the Smart Money Algorithm is running the board on the 15M Gold (XAU/USD) chart. No lagging indicators, just pure institutional delivery!
Following the historic crash, price swept straight through our previously noted $4,315 level, clearing out sell-side liquidity (SSL) to hit exactly $4,303.25.
🔎 SMC/ICT Engineering on the Current Chart:
1️⃣ Price has left behind clear, unfilled Fair Value Gaps (FVG) during this aggressive displacement (marked in red/green boxes).
2️⃣ The $4,300 handle acts as a major psychological round number and a key liquidity pool where the algo is currently pricing orders.
🛡️ Execution Plan (Master Zero Account):
We remain disciplined with our strict 0.05 lot size, core funds locked in USDT/USDC. No catching falling knives. We are waiting for a clear Change of Character (CHoCH) on lower timeframes before anticipating a premium pullback to rebalance the upper FVGs at $4,312 and $4,330.
Patience pays, FOMO destroys. Did you catch this massive expansion lower, or are you waiting to snipe the structural reversal? Let me know below! 👁️🗨️👇
#Gold #XAUUSD #SMC #Trading
$PAXG
Hey traders, Raffayel here.
Look at how the Smart Money Algorithm is running the board on the 15M Gold (XAU/USD) chart. No lagging indicators, just pure institutional delivery!
Following the historic crash, price swept straight through our previously noted $4,315 level, clearing out sell-side liquidity (SSL) to hit exactly $4,303.25.
🔎 SMC/ICT Engineering on the Current Chart:
1️⃣ Price has left behind clear, unfilled Fair Value Gaps (FVG) during this aggressive displacement (marked in red/green boxes).
2️⃣ The $4,300 handle acts as a major psychological round number and a key liquidity pool where the algo is currently pricing orders.
🛡️ Execution Plan (Master Zero Account):
We remain disciplined with our strict 0.05 lot size, core funds locked in USDT/USDC. No catching falling knives. We are waiting for a clear Change of Character (CHoCH) on lower timeframes before anticipating a premium pullback to rebalance the upper FVGs at $4,312 and $4,330.
Patience pays, FOMO destroys. Did you catch this massive expansion lower, or are you waiting to snipe the structural reversal? Let me know below! 👁️🗨️👇
#Gold #XAUUSD #SMC #Trading
$PAXG

117
·
--
Bearish
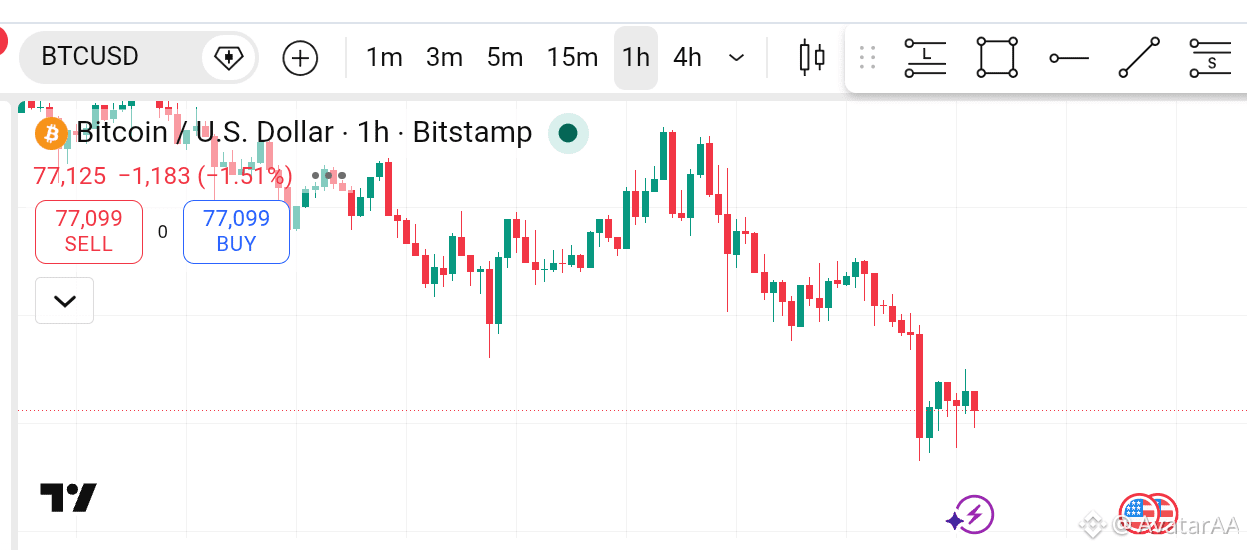
$BTC / US Dollar (1H Chart Analysis) — Liquidity Sweep & Reversal Setup? 🔥
Bitcoin ($BTC) is currently consolidating on the 1-Hour timeframe after a sharp bearish impulse. Here is the technical breakdown using Smart Money Concepts (SMC) & Price Action:
Key Technical Observations:
(1) Current Price: ~$77,100
(2) Liquidity Sweep at Bottom: The recent aggressive sell-off swept the bottom liquidity (Stop Losses below key lows), leaving a long lower wick that signals an initial buying response.
(3) Immediate Resistance Zone: $78,500 – $79,200 (Unfilled FVG / Lower High Structure)
(4) Key Support Zone: $76,000 – $76,500
Potential Market Scenarios:
1️⃣ Bullish Relief Rally (Reversal):
If price holds the $76,000 support area and forms a lower timeframe CHOCH (Change of Character), we could see a quick retracement toward the $78,500 – $80,000 resistance zone.
2️⃣ Bearish Continuation:
If the $76,000 level breaks with strong body closure, expect a continuation toward deeper lower liquidity pools.
⚠️ Trading Plan:
Avoid entering blindly into late breakdowns. Wait for lower timeframe confirmation (CHOCH + FVG) before executing. Always manage your risk carefully!
What’s your bias on $BTC right now? Are you buying the dip or waiting for lower levels? Let’s discuss in the comments below! 👇
$ETH
#crypto #bitcoin #smc
$BTC / US Dollar (1H Chart Analysis) — Liquidity Sweep & Reversal Setup? 🔥
Bitcoin ($BTC ) is currently consolidating on the 1-Hour timeframe after a sharp bearish impulse. Here is the technical breakdown using Smart Money Concepts (SMC) & Price Action:
Key Technical Observations:
(1) Current Price: ~$77,100
(2) Liquidity Sweep at Bottom: The recent aggressive sell-off swept the bottom liquidity (Stop Losses below key lows), leaving a long lower wick that signals an initial buying response.
(3) Immediate Resistance Zone: $78,500 – $79,200 (Unfilled FVG / Lower High Structure)
(4) Key Support Zone: $76,000 – $76,500
Potential Market Scenarios:
1️⃣ Bullish Relief Rally (Reversal):
If price holds the $76,000 support area and forms a lower timeframe CHOCH (Change of Character), we could see a quick retracement toward the $78,500 – $80,000 resistance zone.
2️⃣ Bearish Continuation:
If the $76,000 level breaks with strong body closure, expect a continuation toward deeper lower liquidity pools.
⚠️ Trading Plan:
Avoid entering blindly into late breakdowns. Wait for lower timeframe confirmation (CHOCH + FVG) before executing. Always manage your risk carefully!
What’s your bias on $BTC right now? Are you buying the dip or waiting for lower levels? Let’s discuss in the comments below! 👇
$ETH
#crypto #bitcoin #smc
Bitcoin ($BTC ) is currently consolidating on the 1-Hour timeframe after a sharp bearish impulse. Here is the technical breakdown using Smart Money Concepts (SMC) & Price Action:
Key Technical Observations:
(1) Current Price: ~$77,100
(2) Liquidity Sweep at Bottom: The recent aggressive sell-off swept the bottom liquidity (Stop Losses below key lows), leaving a long lower wick that signals an initial buying response.
(3) Immediate Resistance Zone: $78,500 – $79,200 (Unfilled FVG / Lower High Structure)
(4) Key Support Zone: $76,000 – $76,500
Potential Market Scenarios:
1️⃣ Bullish Relief Rally (Reversal):
If price holds the $76,000 support area and forms a lower timeframe CHOCH (Change of Character), we could see a quick retracement toward the $78,500 – $80,000 resistance zone.
2️⃣ Bearish Continuation:
If the $76,000 level breaks with strong body closure, expect a continuation toward deeper lower liquidity pools.
⚠️ Trading Plan:
Avoid entering blindly into late breakdowns. Wait for lower timeframe confirmation (CHOCH + FVG) before executing. Always manage your risk carefully!
What’s your bias on $BTC right now? Are you buying the dip or waiting for lower levels? Let’s discuss in the comments below! 👇
$ETH
#crypto #bitcoin #smc
1
110
·
--
🌐 London opening update: Gold is playing around at the supply zones! 🚨🇬🇧
Hello traders, Raffayel with you.
An entire hour has passed since the London open, and gold (XAU/USD) is now trading precisely at $4,345.01, achieving gains of +0.65%.
The chart on the 15-minute timeframe shows the algorithm’s strict adherence to key levels:
1️⃣ Liquidity absorption: The price refuses to fall right now and is stabilizing directly above the small price gap (FVG) at the $4,340 level after the bullish CHoCH confirmation.
2️⃣ Current zone: Trading is confined below the achieved high at $4,360, where London contracts are now engineering new liquidity (Liquidity Engineering).
On the funding account (Master Zero), lot 0.05, we’re still watching professionally. A break below the $4,340 levels will bring the price back to mitigate the major gap (the green FVG) extending up to $4,310, while a breakout above $4,360 means an immediate move toward the $4,380 liquidity.
Your platform balance is safe in USDT/USDC.
Where do you expect the next liquidity explosion with the later arrival of New York liquidity? 👁️🗨️👇
#Gold #GoldTrading #BinanceSquare #XAUUSD #SMC $PAXG
🌐 London opening update: Gold is playing around at the supply zones! 🚨🇬🇧
Hello traders, Raffayel with you.
An entire hour has passed since the London open, and gold (XAU/USD) is now trading precisely at $4,345.01, achieving gains of +0.65%.
The chart on the 15-minute timeframe shows the algorithm’s strict adherence to key levels:
1️⃣ Liquidity absorption: The price refuses to fall right now and is stabilizing directly above the small price gap (FVG) at the $4,340 level after the bullish CHoCH confirmation.
2️⃣ Current zone: Trading is confined below the achieved high at $4,360, where London contracts are now engineering new liquidity (Liquidity Engineering).
On the funding account (Master Zero), lot 0.05, we’re still watching professionally. A break below the $4,340 levels will bring the price back to mitigate the major gap (the green FVG) extending up to $4,310, while a breakout above $4,360 means an immediate move toward the $4,380 liquidity.
Your platform balance is safe in USDT/USDC.
Where do you expect the next liquidity explosion with the later arrival of New York liquidity? 👁️🗨️👇
#Gold #GoldTrading #BinanceSquare #XAUUSD #SMC $PAXG
Hello traders, Raffayel with you.
An entire hour has passed since the London open, and gold (XAU/USD) is now trading precisely at $4,345.01, achieving gains of +0.65%.
The chart on the 15-minute timeframe shows the algorithm’s strict adherence to key levels:
1️⃣ Liquidity absorption: The price refuses to fall right now and is stabilizing directly above the small price gap (FVG) at the $4,340 level after the bullish CHoCH confirmation.
2️⃣ Current zone: Trading is confined below the achieved high at $4,360, where London contracts are now engineering new liquidity (Liquidity Engineering).
On the funding account (Master Zero), lot 0.05, we’re still watching professionally. A break below the $4,340 levels will bring the price back to mitigate the major gap (the green FVG) extending up to $4,310, while a breakout above $4,360 means an immediate move toward the $4,380 liquidity.
Your platform balance is safe in USDT/USDC.
Where do you expect the next liquidity explosion with the later arrival of New York liquidity? 👁️🗨️👇
#Gold #GoldTrading #BinanceSquare #XAUUSD #SMC $PAXG

1
74
Log in to explore more content
Join global crypto users on Binance Square
⚡️ Get latest and useful information about crypto.
💬 Trusted by the world’s largest crypto exchange.
👍 Discover real insights from verified creators.
Email / Phone number
Trending Topics
1
#BitcoinReboundsTo$79K
12,153 views
116 Discussing
2
#RussianCentralBankFlagsCryptoAsFinancialRisk
294 views
32 Discussing
3
#GrayscalePutsXRPAt26.11%InAdvisorPortfolio
3,273 views
128 Discussing
4
#PhiladelphiaSemiconductorIndexFalls5.9%
2,029 views
72 Discussing
5
#SECChairUrgesCongressToAdvanceClarityAct
3,495 views
87 Discussing
6
#FedHikeOddsRiseTo89%
83,154 views
1,079 Discussing
7
#RLUSDSupplyHitsRecord$2.442B
6,295 views
65 Discussing
8
#AvalancheIntegratesIntoUAEPassDigitalVault
76,560 views
1,019 Discussing
9
#UKSeeksViewsOnTokenizingGold
63,514 views
779 Discussing
10
#AnthropicCEOCallsForAISlowdown
238,802 views
3,306 Discussing