
The cryptocurrency market is at a critical consolidation point. After falling 0.58% over the past 24 hours, Bitcoin (BTC) is trading around $81,576, caught in a technical and fundamental battle that has intraday traders on the edge of their seats. Are we seeing an accumulation zone or an imminent continuation of the downtrend?
1. The Fundamental Context: Macroeconomics and Institutional Pressure
Market sentiment has been weakened mainly by two high-impact factors (classified as having High relevance in capital flow reports):
U.S. Inflation Shock: Recent Consumer Price Index (CPI) data for September set off alarm bells, recording a 6.3% year-over-year increase and a 1.3% monthly increase. This surge fuels fears that interest rates will remain elevated for longer (macroeconomic tightening), restricting global liquidity and putting downward pressure on risk assets.
Institutional Capital Flight: Bitcoin ETF products recorded daily net outflows worth -$82.4 million on October 16. This persistent selling pressure extends weekly redemptions and stifles any attempt at a sustained rally.
2. Technical Analysis: Absorption at Support and EMA Resistance
Looking at the charts, price action is teaching us invaluable lessons about price behavior and the impact of different timeframes:
Defending Historical Support: Over the past few hours, selling pressure drove Bitcoin to test a low around $81,142. Strong absorption kicked in at this key level, which is directly connected to institutional support on higher timeframes such as the 4H chart. Buyers entered the market with an hourly injection of +$38.4 million, defending the area and forcing consolidation.
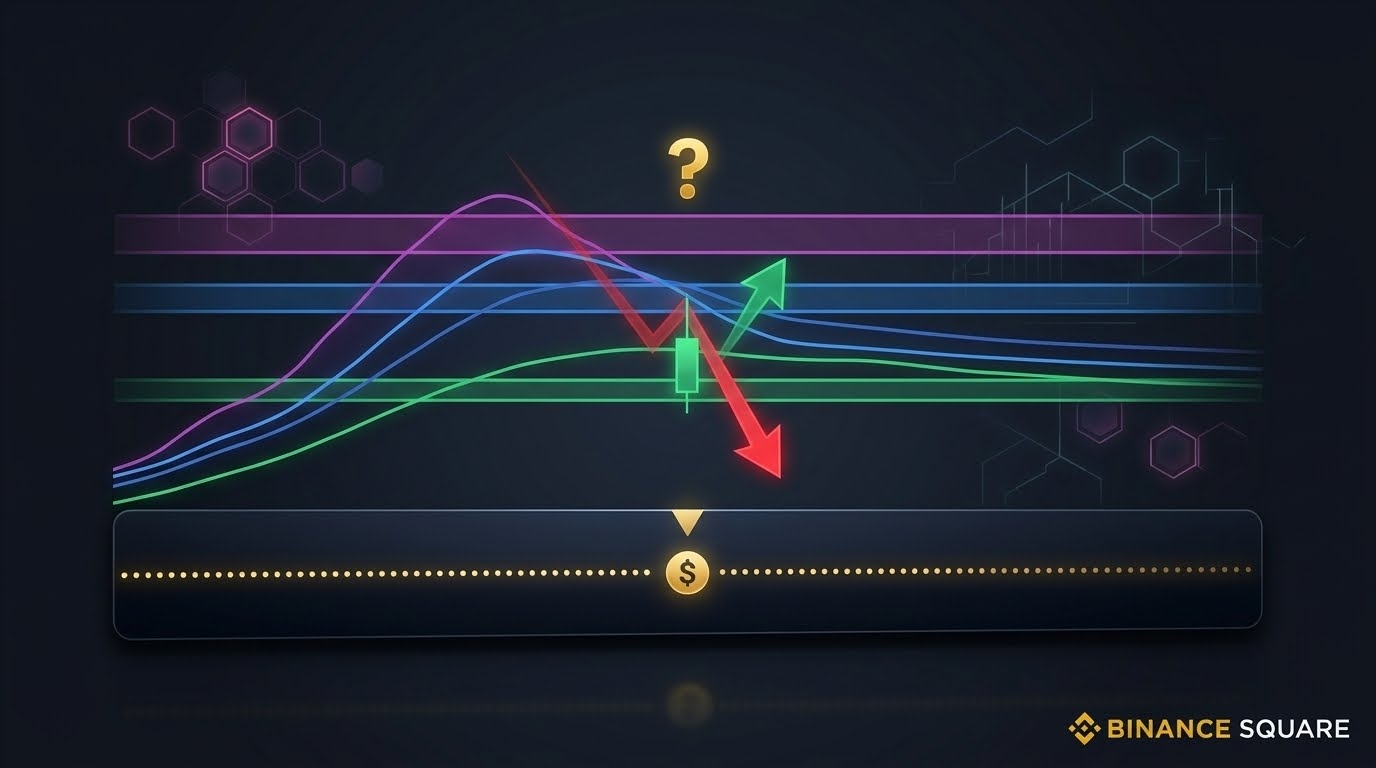
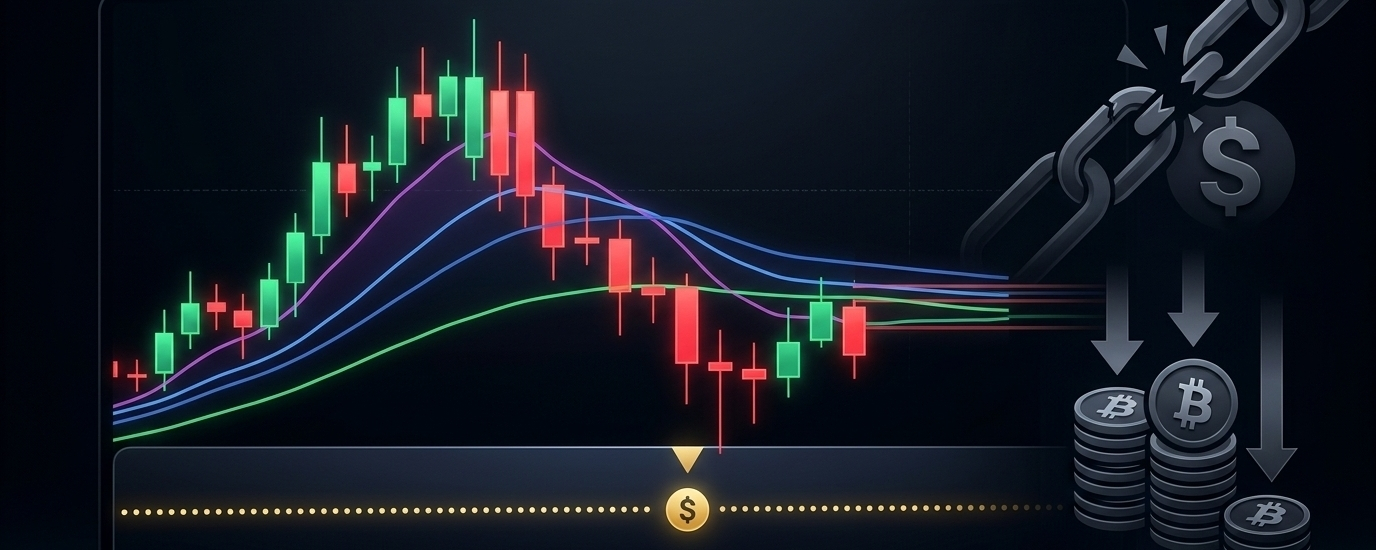
The Moving Average Wall: Despite the defensive rebound, the short-term structure continues to show clear bearish momentum. The current price is trapped below critical dynamic resistance levels: the 25 EMA ($81,688) and the 99 EMA on the hourly charts are acting as a formidable ceiling.
Additionally, technical oscillators support a cautious outlook: the MACD histogram remains in negative territory, and the occasional rebounds lack substantial buying volume, which often translates into weakening momentum or liquidity contraction.
3. Conclusion and Trading Strategy
The market is showing us a classic scenario of compression and widespread lack of interest. Trading amid this tangle of moving averages on short timeframes (such as 1H or 5m) increases the risk of getting caught in false breakouts or a "stop hunt."
For Bullish Scenarios (Longs): Patience is key. A safer entry would require waiting for a decisive candle close above the EMA resistance zone ($81,700 - $81,900), ideally accompanied by a clean bullish fan-out and a notable increase in volume.
For Bearish Scenarios (Shorts): A decisive break below the $81,142 support would invalidate the recent absorption, opening the door to target latent liquidity at lower levels, such as $80,600 or $80,300.
What do you think? Do you believe the institutional support on the 4H chart will withstand macroeconomic pressure, or will we see capitulation toward lower levels? Share your analysis in the comments!