
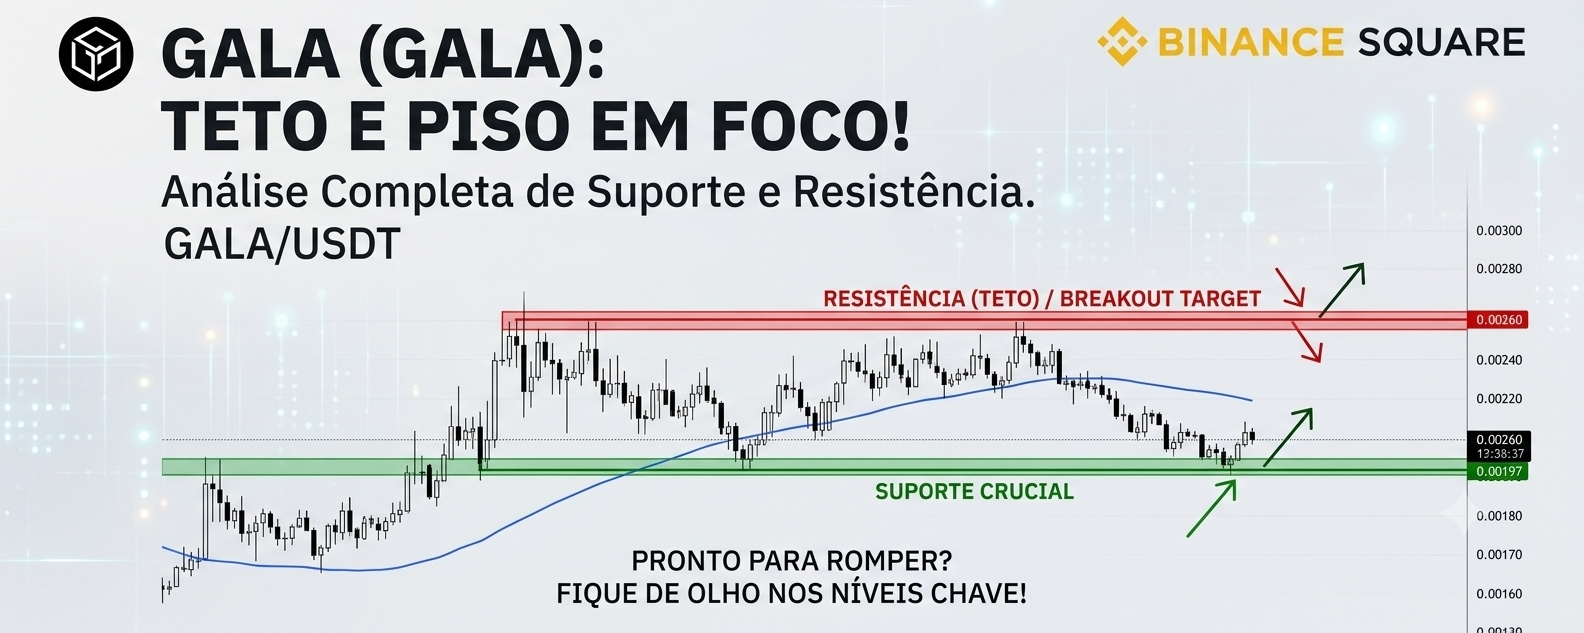

Hello, community! If you’re keeping an eye on Gala $GALA market today brings interesting data. With daily volatility setting the rules, let’s analyze how the token has been behaving over the last 24 hours, the current indicators, and the ceiling and floor levels you need to monitor.
💵 Current Price and 24h Movement
Right now, GALA is trading in the range of $0.00210, supported by a trading volume over the last 24 hours between $35 million and $41 million.
Daily movement shows an attempt to stabilize the asset after recent selling pressure. Volume indicates that interest in the token remains active, but traders are waiting for a clearer definition of the trend.
📉 What do the Current Indicators Say?
The technical scenario on the daily chart points to an interesting divergence among the indicators:
Moving Averages (MAs): The vast majority of moving averages point to a "Sell" signal. The price is still struggling to hold above the shorter averages, which calls for caution from buyers.
Oscillators (RSI, MACD): Unlike moving averages, the oscillators are in the "Neutral" zone, with some slightly pointing toward "Buy." This suggests that the downward momentum (selling pressure) may be losing steam in the short term, making room for a possible technical rebound.
🧱 Support Floor (the line of defense)
For GALA to have any chance of recovery in the short term, buyers need to defend these levels:
Immediate Support ($0.00197): This is the first area of interest. Losing this level may reignite the sell signal from moving averages and accelerate the decline.
Vital Bottom / Major Support ($0.00155): This is the real "concrete floor," marked by the recent swing low. If the broader market weakens and GALA loses the $0.00155 level, the recovery structure will be invalidated, opening the way for new annual lows.
🚀 Breakthrough Ceiling (Key Resistance)
To confirm a trend reversal and give bulls some momentum, the token needs to break through a heavy barrier:
Macro Resistance (200-day Moving Average - $0.00260): The main directional target is the $0.00260 mark. This 200-day SMA (Simple Moving Average) is the definitive ceiling of the current move. A breakout and consistent daily close above that value would completely change GALA’s technical structure from bearish to bullish.
💡 Market Conclusion
GALA is in a decision zone. The oscillators show that selling exhaustion may be near, but the moving averages warn that the broader trend is still cautious. Keep an eye on support at $0.00197 and on Bitcoin: if BTC helps, an attempt to reach the $0.00260 ceiling is not off the table.
⚠️ Notice: This post is not financial advice. The cryptocurrency market is highly volatile. Do your own risk management and trade wisely!
#gala #analysis #GalaChain #Binance #BinanceSquare
