
#gala
gala
8.5M views
9,068 Discussing
Hot
Latest

·
--
Can Web3 Gaming make a massive comeback with $GALA ? 🎮🚀
Crypto gaming narratives move fast. Gala continues to expand beyond just games into decentralized music and film nodes, creating multiple avenues for token utility.
Retail interest explodes the moment a Web3 game goes truly mainstream.
What’s your take: Will crypto gaming pump hardest this season, or are AI tokens taking all the liquidity? 🕹️
#gala #web3gaming #PlayToEarn
Can Web3 Gaming make a massive comeback with $GALA ? 🎮🚀
Crypto gaming narratives move fast. Gala continues to expand beyond just games into decentralized music and film nodes, creating multiple avenues for token utility.
Retail interest explodes the moment a Web3 game goes truly mainstream.
What’s your take: Will crypto gaming pump hardest this season, or are AI tokens taking all the liquidity? 🕹️
#gala #web3gaming #PlayToEarn
Crypto gaming narratives move fast. Gala continues to expand beyond just games into decentralized music and film nodes, creating multiple avenues for token utility.
Retail interest explodes the moment a Web3 game goes truly mainstream.
What’s your take: Will crypto gaming pump hardest this season, or are AI tokens taking all the liquidity? 🕹️
#gala #web3gaming #PlayToEarn
249

·
--

Article
I’m Not Missing the $GALA Train This TimeI’ve secured 200,000 $GALA , and this time I’m not missing the train. 😂🚂
Last year, I held around 100,000 $GALA, but I sold my position too early. At the time, $GALA was moving painfully slow while other altcoins were taking off. I got impatient and decided to move on.
And then… $GALA finally woke up. 😅
A few days after I sold, I started seeing those giant green candles I had been waiting for. That was one of those moments where you look at the chart and think, “Why did I sell?” 😂
This time, I’ve been waiting patiently for the correction and the opportunity to build my position again. Now that I’ve accumulated 200,000 $GALA, I’m prepared to sit back and let the market do its thing.
I personally believe $GALA has the potential for a massive move from these levels, and I’m targeting much higher prices over the longer term. I’m not here for a quick pump — I’m willing to be patient and wait for the bigger move.
⚠️ The most important lesson: DON’T FOMO
If a coin has already pumped 100%+, chasing it can be extremely risky.
Sometimes the best trade is simply waiting.
You don’t have to buy every green candle. You don’t have to catch the exact bottom. And you definitely don’t need to FOMO because everyone else is talking about a coin.
Be patient. Wait for your opportunity.
The market will always give you another entry.
For me, $GALA is a long-term patience play this time. I’ve made the mistake of selling too early before, and I don’t want to repeat it.
Wishing all $GALA holders massive green candles and, most importantly, profitable trades. 🚀💚
Stay patient. Stay disciplined. Don’t chase. Don’t FOMO.
#gala #crypto #Binance #Web3 #gaming
I’m Not Missing the $GALA Train This Time
I’ve secured 200,000 $GALA , and this time I’m not missing the train. 😂🚂
Last year, I held around 100,000 $GALA , but I sold my position too early. At the time, $GALA was moving painfully slow while other altcoins were taking off. I got impatient and decided to move on.
And then… $GALA finally woke up. 😅
A few days after I sold, I started seeing those giant green candles I had been waiting for. That was one of those moments where you look at the chart and think, “Why did I sell?” 😂
This time, I’ve been waiting patiently for the correction and the opportunity to build my position again. Now that I’ve accumulated 200,000 $GALA , I’m prepared to sit back and let the market do its thing.
I personally believe $GALA has the potential for a massive move from these levels, and I’m targeting much higher prices over the longer term. I’m not here for a quick pump — I’m willing to be patient and wait for the bigger move.
⚠️ The most important lesson: DON’T FOMO
If a coin has already pumped 100%+, chasing it can be extremely risky.
Sometimes the best trade is simply waiting.
You don’t have to buy every green candle. You don’t have to catch the exact bottom. And you definitely don’t need to FOMO because everyone else is talking about a coin.
Be patient. Wait for your opportunity.
The market will always give you another entry.
For me, $GALA is a long-term patience play this time. I’ve made the mistake of selling too early before, and I don’t want to repeat it.
Wishing all $GALA holders massive green candles and, most importantly, profitable trades. 🚀💚
Stay patient. Stay disciplined. Don’t chase. Don’t FOMO.
#gala #crypto #Binance #Web3 #gaming
Last year, I held around 100,000 $GALA , but I sold my position too early. At the time, $GALA was moving painfully slow while other altcoins were taking off. I got impatient and decided to move on.
And then… $GALA finally woke up. 😅
A few days after I sold, I started seeing those giant green candles I had been waiting for. That was one of those moments where you look at the chart and think, “Why did I sell?” 😂
This time, I’ve been waiting patiently for the correction and the opportunity to build my position again. Now that I’ve accumulated 200,000 $GALA , I’m prepared to sit back and let the market do its thing.
I personally believe $GALA has the potential for a massive move from these levels, and I’m targeting much higher prices over the longer term. I’m not here for a quick pump — I’m willing to be patient and wait for the bigger move.
⚠️ The most important lesson: DON’T FOMO
If a coin has already pumped 100%+, chasing it can be extremely risky.
Sometimes the best trade is simply waiting.
You don’t have to buy every green candle. You don’t have to catch the exact bottom. And you definitely don’t need to FOMO because everyone else is talking about a coin.
Be patient. Wait for your opportunity.
The market will always give you another entry.
For me, $GALA is a long-term patience play this time. I’ve made the mistake of selling too early before, and I don’t want to repeat it.
Wishing all $GALA holders massive green candles and, most importantly, profitable trades. 🚀💚
Stay patient. Stay disciplined. Don’t chase. Don’t FOMO.
#gala #crypto #Binance #Web3 #gaming
241

Market Leaders at Prime Levels — Position Before Expansion
$STX | $IMX | $GALA
STX, IMX, and GALA are holding important structural areas while the market remains controlled. This phase can reveal which assets are preparing for stronger momentum.
STX continues to defend key levels. IMX remains resilient around support. GALA is maintaining its broader structure while market attention builds.
Key Takeaway: Positioning before acceleration can offer an advantage over chasing the move.
#STX #IMX #GALA #HighConviction #StrategicEntry
{future}(STXUSDT)
{future}(IMXUSDT)
{future}(GALAUSDT)
Market Leaders at Prime Levels — Position Before Expansion
$STX | $IMX | $GALA
STX, IMX, and GALA are holding important structural areas while the market remains controlled. This phase can reveal which assets are preparing for stronger momentum.
STX continues to defend key levels. IMX remains resilient around support. GALA is maintaining its broader structure while market attention builds.
Key Takeaway: Positioning before acceleration can offer an advantage over chasing the move.
#STX #IMX #GALA #HighConviction #StrategicEntry
$STX | $IMX | $GALA
STX, IMX, and GALA are holding important structural areas while the market remains controlled. This phase can reveal which assets are preparing for stronger momentum.
STX continues to defend key levels. IMX remains resilient around support. GALA is maintaining its broader structure while market attention builds.
Key Takeaway: Positioning before acceleration can offer an advantage over chasing the move.
#STX #IMX #GALA #HighConviction #StrategicEntry
1
175


·
--
GALA is sitting at a key zone 👀
Current Price: ~$0.00170
Support: $0.00165 $0.00160 $0.00150
Resistance: $0.00180 $0.00200 $0.00220
TP: $0.00180 → $0.00200 → $0.00220 → $0.00250 → $0.00300 → $0.00400 → $0.00500
If GALA breaks $0.00220 with strong volume, the bigger targets could come into play.
Invalidation: Below $0.00148–$0.00150
Not financial advice. Always manage risk.
#gala #GalaToMoon $GALA
GALA is sitting at a key zone 👀
Current Price: ~$0.00170
Support: $0.00165 $0.00160 $0.00150
Resistance: $0.00180 $0.00200 $0.00220
TP: $0.00180 → $0.00200 → $0.00220 → $0.00250 → $0.00300 → $0.00400 → $0.00500
If GALA breaks $0.00220 with strong volume, the bigger targets could come into play.
Invalidation: Below $0.00148–$0.00150
Not financial advice. Always manage risk.
#gala #GalaToMoon $GALA
Current Price: ~$0.00170
Support: $0.00165 $0.00160 $0.00150
Resistance: $0.00180 $0.00200 $0.00220
TP: $0.00180 → $0.00200 → $0.00220 → $0.00250 → $0.00300 → $0.00400 → $0.00500
If GALA breaks $0.00220 with strong volume, the bigger targets could come into play.
Invalidation: Below $0.00148–$0.00150
Not financial advice. Always manage risk.
#gala #GalaToMoon $GALA
2
390

·
--
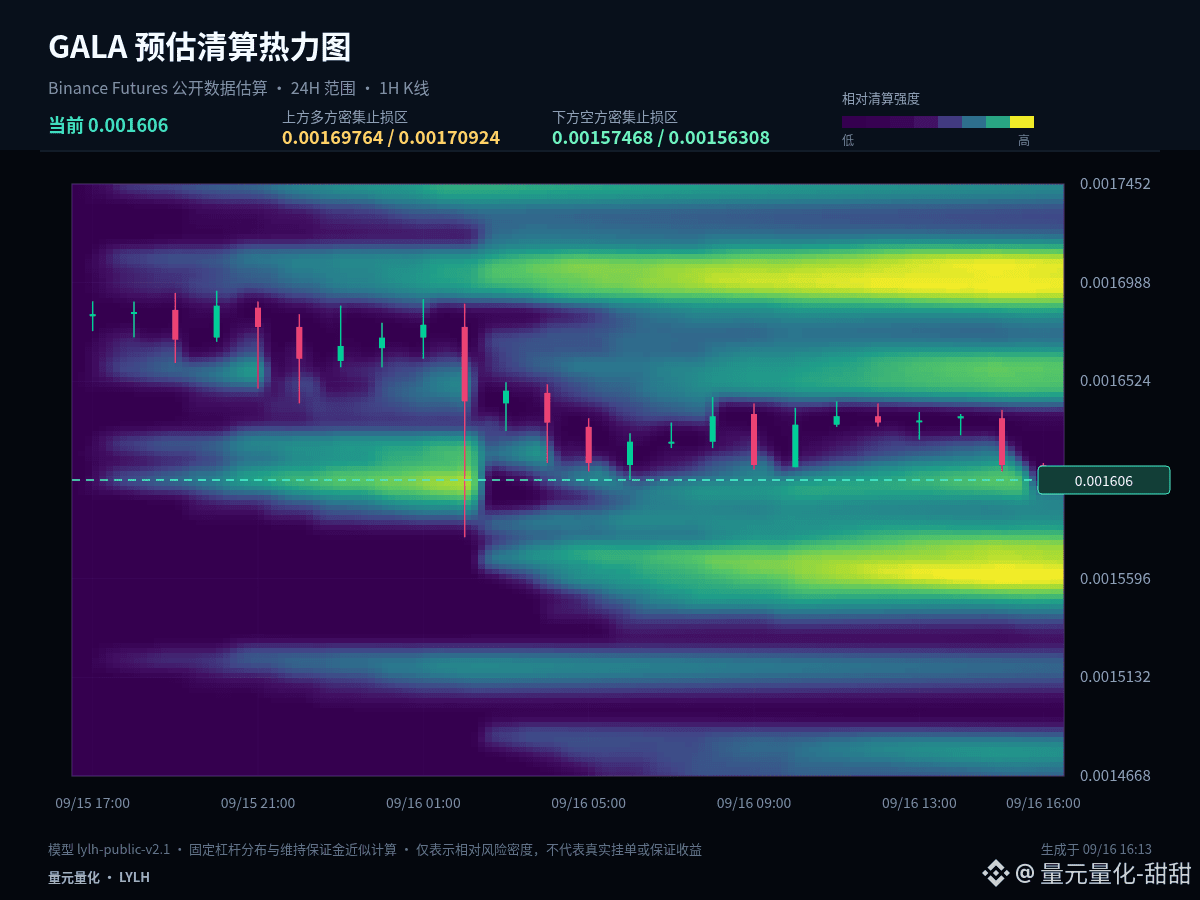
$GALA #GALA In the past 24 hours, the high-low amplitude is about 7.0%, and the current price is 0.001609. This is not a calm market suitable for casually opening positions. When volatility increases, you should adjust your position first, then discuss direction.
$GALA #GALA has not yet formed a clear one-way move. The 1-hour and 24-hour rhythms are still pulling against each other. At this stage, focus on the boundaries of the range rather than the color of every candlestick.
Currently, the 1-hour change is -0.43%, and the 24-hour change is -3.36%. These two cycles have not formed sufficiently clear alignment in the same direction. In range-bound conditions, the margin for chasing or selling too aggressively is lower. It’s more suitable to confirm direction using the upper boundary, confirm acceptance using the lower boundary, and treat the midline only as the line dividing strength and weakness.
For key price levels: 0.00164 is the midline that must be reclaimed for a weak recovery to be considered. If price cannot stand back above this level, any rebound should still be viewed as a technical, corrective move. Below, 0.001584 still has the possibility of being tested again; only after reclaiming the midline is it worth further observing 0.001696.
In high-volatility phases, the execution principle is to reduce single-trade exposure, avoid repeatedly chasing prices back and forth in the middle of the range, and write the invalidation conditions before entering. If price does not give confirmation, it’s better to do one less trade than to use a larger position size to compensate for uncertainty.
My scenario is not a single directional bet. If price breaks above 0.001696 and can hold, it means the upside space has been reopened. If it breaks below 0.001584 and cannot manage a successful retest, it indicates the structure is further weakening. If it keeps trading between the two, continue monitoring the closes on both sides of 0.00164.
The key point of this contract is not to predict every single candlestick. It’s to ensure there is a basis for entry, trimming, and exit. When there’s no confirmation, do less; when key levels fail, redo the plan—control single-trade risk first, then discuss the potential space ahead.
#USSenateBlocksClarityAct
$GALA #GALA In the past 24 hours, the high-low amplitude is about 7.0%, and the current price is 0.001609. This is not a calm market suitable for casually opening positions. When volatility increases, you should adjust your position first, then discuss direction.
$GALA #GALA has not yet formed a clear one-way move. The 1-hour and 24-hour rhythms are still pulling against each other. At this stage, focus on the boundaries of the range rather than the color of every candlestick.
Currently, the 1-hour change is -0.43%, and the 24-hour change is -3.36%. These two cycles have not formed sufficiently clear alignment in the same direction. In range-bound conditions, the margin for chasing or selling too aggressively is lower. It’s more suitable to confirm direction using the upper boundary, confirm acceptance using the lower boundary, and treat the midline only as the line dividing strength and weakness.
For key price levels: 0.00164 is the midline that must be reclaimed for a weak recovery to be considered. If price cannot stand back above this level, any rebound should still be viewed as a technical, corrective move. Below, 0.001584 still has the possibility of being tested again; only after reclaiming the midline is it worth further observing 0.001696.
In high-volatility phases, the execution principle is to reduce single-trade exposure, avoid repeatedly chasing prices back and forth in the middle of the range, and write the invalidation conditions before entering. If price does not give confirmation, it’s better to do one less trade than to use a larger position size to compensate for uncertainty.
My scenario is not a single directional bet. If price breaks above 0.001696 and can hold, it means the upside space has been reopened. If it breaks below 0.001584 and cannot manage a successful retest, it indicates the structure is further weakening. If it keeps trading between the two, continue monitoring the closes on both sides of 0.00164.
The key point of this contract is not to predict every single candlestick. It’s to ensure there is a basis for entry, trimming, and exit. When there’s no confirmation, do less; when key levels fail, redo the plan—control single-trade risk first, then discuss the potential space ahead.
#USSenateBlocksClarityAct
$GALA #GALA has not yet formed a clear one-way move. The 1-hour and 24-hour rhythms are still pulling against each other. At this stage, focus on the boundaries of the range rather than the color of every candlestick.
Currently, the 1-hour change is -0.43%, and the 24-hour change is -3.36%. These two cycles have not formed sufficiently clear alignment in the same direction. In range-bound conditions, the margin for chasing or selling too aggressively is lower. It’s more suitable to confirm direction using the upper boundary, confirm acceptance using the lower boundary, and treat the midline only as the line dividing strength and weakness.
For key price levels: 0.00164 is the midline that must be reclaimed for a weak recovery to be considered. If price cannot stand back above this level, any rebound should still be viewed as a technical, corrective move. Below, 0.001584 still has the possibility of being tested again; only after reclaiming the midline is it worth further observing 0.001696.
In high-volatility phases, the execution principle is to reduce single-trade exposure, avoid repeatedly chasing prices back and forth in the middle of the range, and write the invalidation conditions before entering. If price does not give confirmation, it’s better to do one less trade than to use a larger position size to compensate for uncertainty.
My scenario is not a single directional bet. If price breaks above 0.001696 and can hold, it means the upside space has been reopened. If it breaks below 0.001584 and cannot manage a successful retest, it indicates the structure is further weakening. If it keeps trading between the two, continue monitoring the closes on both sides of 0.00164.
The key point of this contract is not to predict every single candlestick. It’s to ensure there is a basis for entry, trimming, and exit. When there’s no confirmation, do less; when key levels fail, redo the plan—control single-trade risk first, then discuss the potential space ahead.
#USSenateBlocksClarityAct
32

·
--
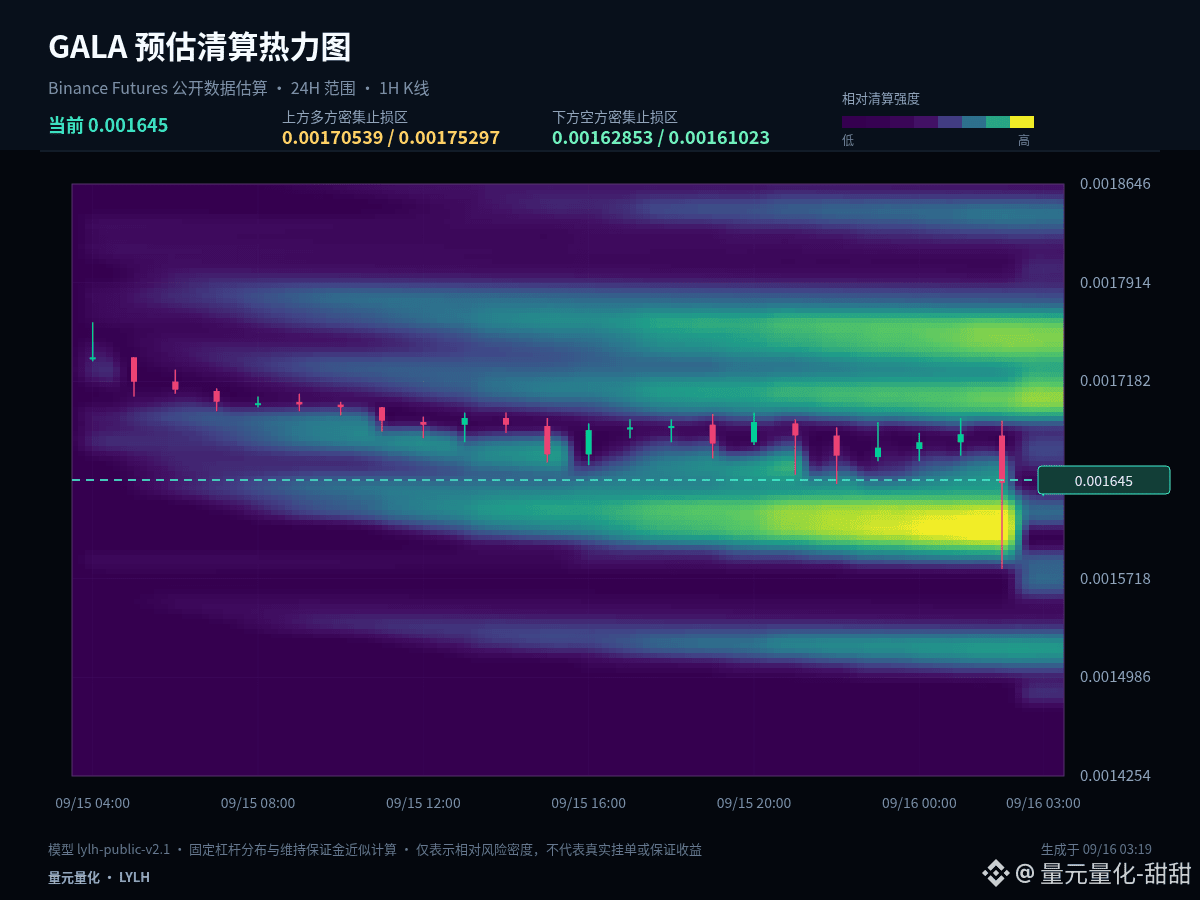
$GALA #GALA Order book notes: current price 0.001647, 1 hour 0.00%, 24 hours -5.56%, and the amplitude over the last 24 hours is about 10.9%. First write down the current data and my judgment; later I’ll verify them against the trend.
$GALA #GALA has not formed a clear one-way move yet, and the rhythm of the 1-hour and 24-hour periods is still in contention. In this phase, focus on the boundaries of the range rather than the color of every single candlestick.
I will treat 0.0016735 as the short-term long/short dividing line: if it holds, it indicates the pullback is still within a controllable range. After that, only if conditions are met, we may test 0.001763 again. After an effective breakdown, don’t rush to enter—wait for a new stable structure to appear around 0.001584.
When executing, set clear conditions: after breaking above 0.001763, it needs confirmation—not a fleeting pump that makes you chase. After probing down to 0.001584, you need to see whether it can quickly reclaim the level—not simply buy because it’s falling. If the middle zone doesn’t offer sufficient odds, waiting itself is also part of the strategy.
During review, I will check three things: how the price reacts when it first approaches a key level, whether the 1-hour close completes the confirmation, and whether I adjust the plan according to the pre-defined steps if my judgment turns out to be invalid. Compared with only recording outcomes, these three items reveal execution problems more effectively.
Your trading plan must include invalidation conditions. Being right can be realized in stages, but if you’re wrong, you must also allow yourself to exit. Don’t use averaging down to disguise the fact that the original logic has already changed. The market will update, and my view should also evolve with the price evidence.
#ClarityActOddsHalveOnPolymarket
$GALA #GALA Order book notes: current price 0.001647, 1 hour 0.00%, 24 hours -5.56%, and the amplitude over the last 24 hours is about 10.9%. First write down the current data and my judgment; later I’ll verify them against the trend.
$GALA #GALA has not formed a clear one-way move yet, and the rhythm of the 1-hour and 24-hour periods is still in contention. In this phase, focus on the boundaries of the range rather than the color of every single candlestick.
I will treat 0.0016735 as the short-term long/short dividing line: if it holds, it indicates the pullback is still within a controllable range. After that, only if conditions are met, we may test 0.001763 again. After an effective breakdown, don’t rush to enter—wait for a new stable structure to appear around 0.001584.
When executing, set clear conditions: after breaking above 0.001763, it needs confirmation—not a fleeting pump that makes you chase. After probing down to 0.001584, you need to see whether it can quickly reclaim the level—not simply buy because it’s falling. If the middle zone doesn’t offer sufficient odds, waiting itself is also part of the strategy.
During review, I will check three things: how the price reacts when it first approaches a key level, whether the 1-hour close completes the confirmation, and whether I adjust the plan according to the pre-defined steps if my judgment turns out to be invalid. Compared with only recording outcomes, these three items reveal execution problems more effectively.
Your trading plan must include invalidation conditions. Being right can be realized in stages, but if you’re wrong, you must also allow yourself to exit. Don’t use averaging down to disguise the fact that the original logic has already changed. The market will update, and my view should also evolve with the price evidence.
#ClarityActOddsHalveOnPolymarket
$GALA #GALA has not formed a clear one-way move yet, and the rhythm of the 1-hour and 24-hour periods is still in contention. In this phase, focus on the boundaries of the range rather than the color of every single candlestick.
I will treat 0.0016735 as the short-term long/short dividing line: if it holds, it indicates the pullback is still within a controllable range. After that, only if conditions are met, we may test 0.001763 again. After an effective breakdown, don’t rush to enter—wait for a new stable structure to appear around 0.001584.
When executing, set clear conditions: after breaking above 0.001763, it needs confirmation—not a fleeting pump that makes you chase. After probing down to 0.001584, you need to see whether it can quickly reclaim the level—not simply buy because it’s falling. If the middle zone doesn’t offer sufficient odds, waiting itself is also part of the strategy.
During review, I will check three things: how the price reacts when it first approaches a key level, whether the 1-hour close completes the confirmation, and whether I adjust the plan according to the pre-defined steps if my judgment turns out to be invalid. Compared with only recording outcomes, these three items reveal execution problems more effectively.
Your trading plan must include invalidation conditions. Being right can be realized in stages, but if you’re wrong, you must also allow yourself to exit. Don’t use averaging down to disguise the fact that the original logic has already changed. The market will update, and my view should also evolve with the price evidence.
#ClarityActOddsHalveOnPolymarket
80
·
--
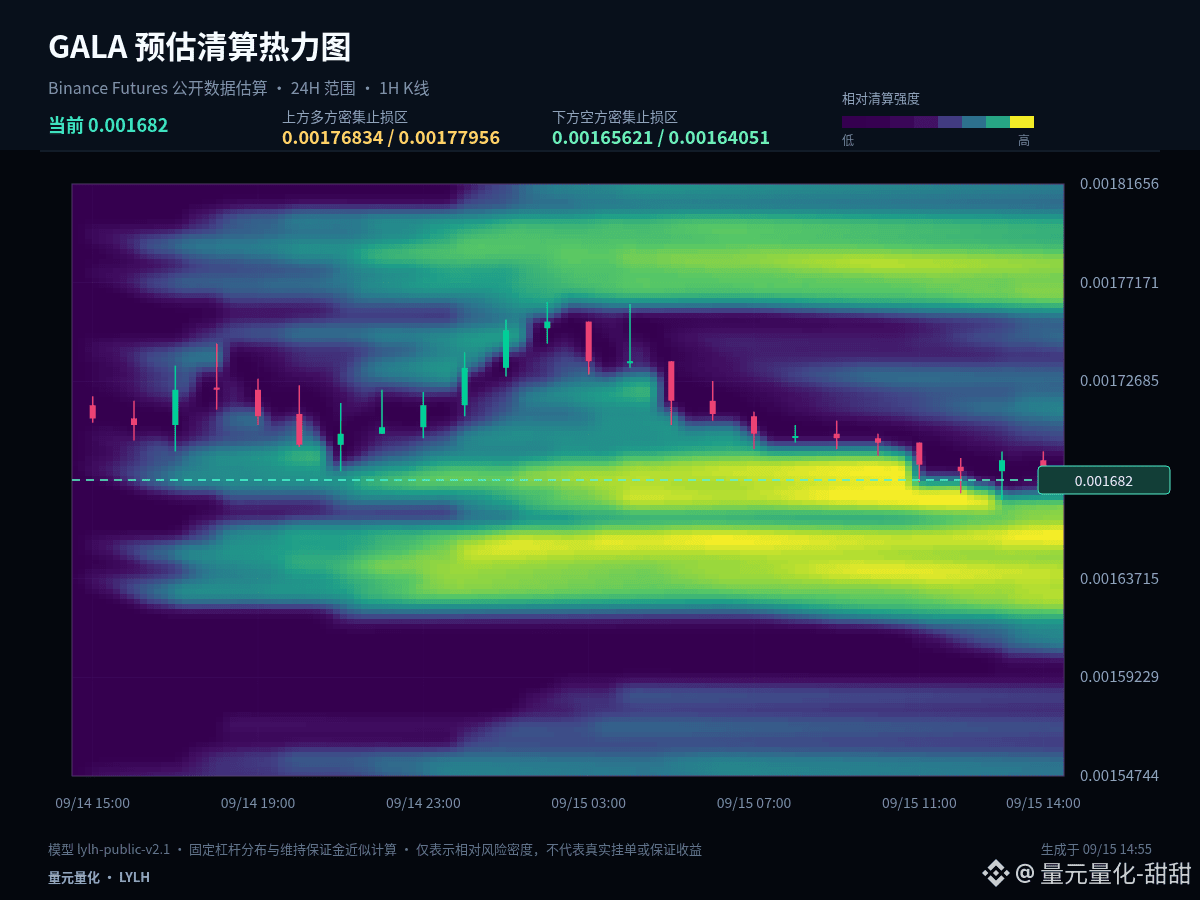
$GALA #GALA Current Price 0.001685, -0.47% in the last 1 hour, -2.15% in the last 24 hours. Rather than committing to long or short too early, it’s better to list the possible paths and the corresponding actions.
The current price is close to the lower bound of the past 24-hour range: -0.47% in the last 1 hour and -2.15% in the last 24 hours. The key of analyzing the low isn’t to anticipate a bottom and buy too early, but to observe whether it can quickly rebound after breaking down. If it can rebound, it indicates that selling pressure is being absorbed; if it keeps lingering below the lower bound, it suggests weakness has not ended.
The first path is upward: the price must break through 0.001766 and form a stable close above it. After that, only when a retest does not break down can the confirmation be considered valid. The second path is downward: if 0.001676 is lost and a rebound cannot regain it, then there’s insufficient support; you should prioritize defense rather than rushing to add positions.
If the price continues to stay between 0.001766 and 0.001676, then 0.001721 is only a reference for short-term initiative. There is no clear advantage in the middle of the range—don’t force an entry just to feel involved. Wait for the market to show its direction.
For those who already hold positions, the focus is to manage based on whether support has failed, not to be carried along by every fluctuation. For those who are currently flat, prioritize waiting for a breakout with a retest or support confirmation. With spot, you can scale in/out in batches; for contracts, shorten the decision chain—first determine the stop-loss level, then decide whether to participate.
The key of contracts isn’t to predict every single candlestick. It’s to ensure that entry, reducing exposure, and exiting all have a basis. When there’s no confirmation, do less. If a key level fails, redo the plan. Control the risk per trade first, then talk about the potential upside/downside afterward.
#SolanaTransactionV1GoesLiveOnMainnet
$GALA #GALA Current Price 0.001685, -0.47% in the last 1 hour, -2.15% in the last 24 hours. Rather than committing to long or short too early, it’s better to list the possible paths and the corresponding actions.
The current price is close to the lower bound of the past 24-hour range: -0.47% in the last 1 hour and -2.15% in the last 24 hours. The key of analyzing the low isn’t to anticipate a bottom and buy too early, but to observe whether it can quickly rebound after breaking down. If it can rebound, it indicates that selling pressure is being absorbed; if it keeps lingering below the lower bound, it suggests weakness has not ended.
The first path is upward: the price must break through 0.001766 and form a stable close above it. After that, only when a retest does not break down can the confirmation be considered valid. The second path is downward: if 0.001676 is lost and a rebound cannot regain it, then there’s insufficient support; you should prioritize defense rather than rushing to add positions.
If the price continues to stay between 0.001766 and 0.001676, then 0.001721 is only a reference for short-term initiative. There is no clear advantage in the middle of the range—don’t force an entry just to feel involved. Wait for the market to show its direction.
For those who already hold positions, the focus is to manage based on whether support has failed, not to be carried along by every fluctuation. For those who are currently flat, prioritize waiting for a breakout with a retest or support confirmation. With spot, you can scale in/out in batches; for contracts, shorten the decision chain—first determine the stop-loss level, then decide whether to participate.
The key of contracts isn’t to predict every single candlestick. It’s to ensure that entry, reducing exposure, and exiting all have a basis. When there’s no confirmation, do less. If a key level fails, redo the plan. Control the risk per trade first, then talk about the potential upside/downside afterward.
#SolanaTransactionV1GoesLiveOnMainnet
The current price is close to the lower bound of the past 24-hour range: -0.47% in the last 1 hour and -2.15% in the last 24 hours. The key of analyzing the low isn’t to anticipate a bottom and buy too early, but to observe whether it can quickly rebound after breaking down. If it can rebound, it indicates that selling pressure is being absorbed; if it keeps lingering below the lower bound, it suggests weakness has not ended.
The first path is upward: the price must break through 0.001766 and form a stable close above it. After that, only when a retest does not break down can the confirmation be considered valid. The second path is downward: if 0.001676 is lost and a rebound cannot regain it, then there’s insufficient support; you should prioritize defense rather than rushing to add positions.
If the price continues to stay between 0.001766 and 0.001676, then 0.001721 is only a reference for short-term initiative. There is no clear advantage in the middle of the range—don’t force an entry just to feel involved. Wait for the market to show its direction.
For those who already hold positions, the focus is to manage based on whether support has failed, not to be carried along by every fluctuation. For those who are currently flat, prioritize waiting for a breakout with a retest or support confirmation. With spot, you can scale in/out in batches; for contracts, shorten the decision chain—first determine the stop-loss level, then decide whether to participate.
The key of contracts isn’t to predict every single candlestick. It’s to ensure that entry, reducing exposure, and exiting all have a basis. When there’s no confirmation, do less. If a key level fails, redo the plan. Control the risk per trade first, then talk about the potential upside/downside afterward.
#SolanaTransactionV1GoesLiveOnMainnet
1
4

·
--
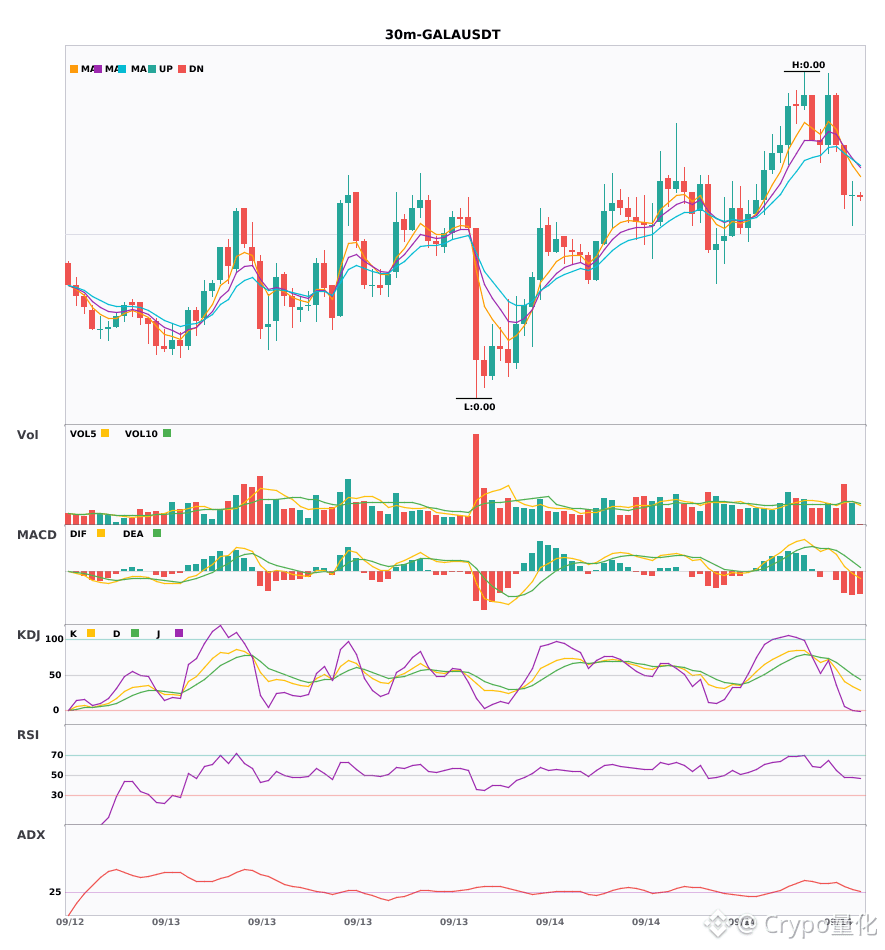
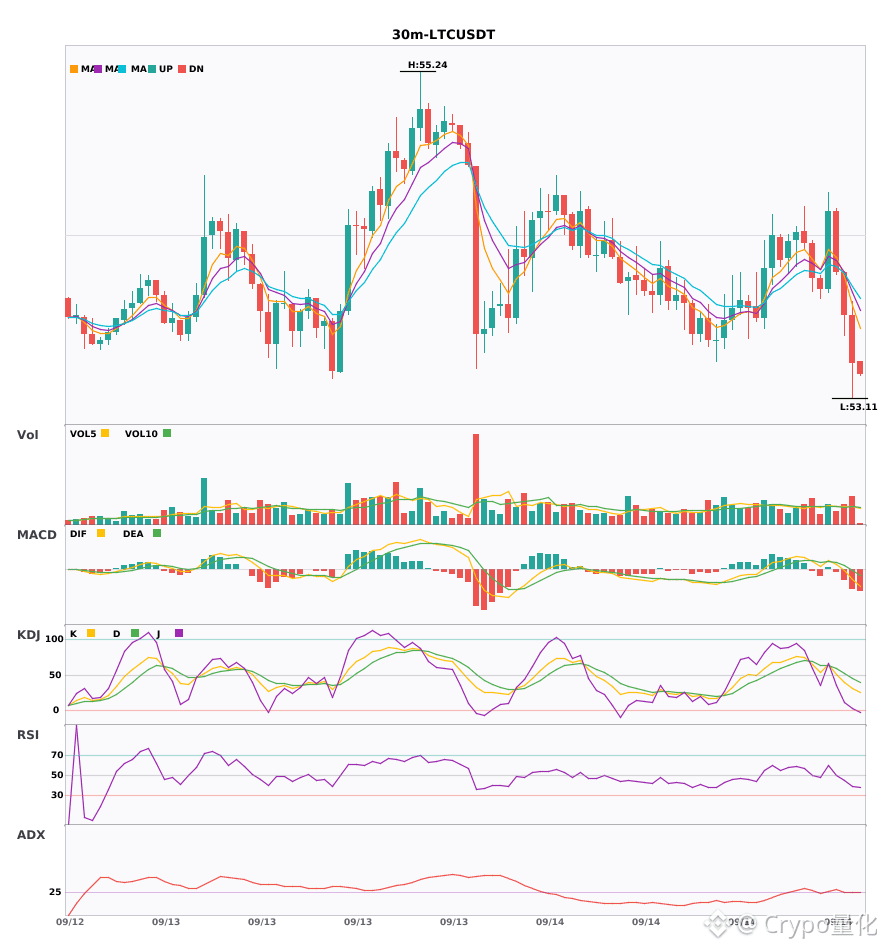
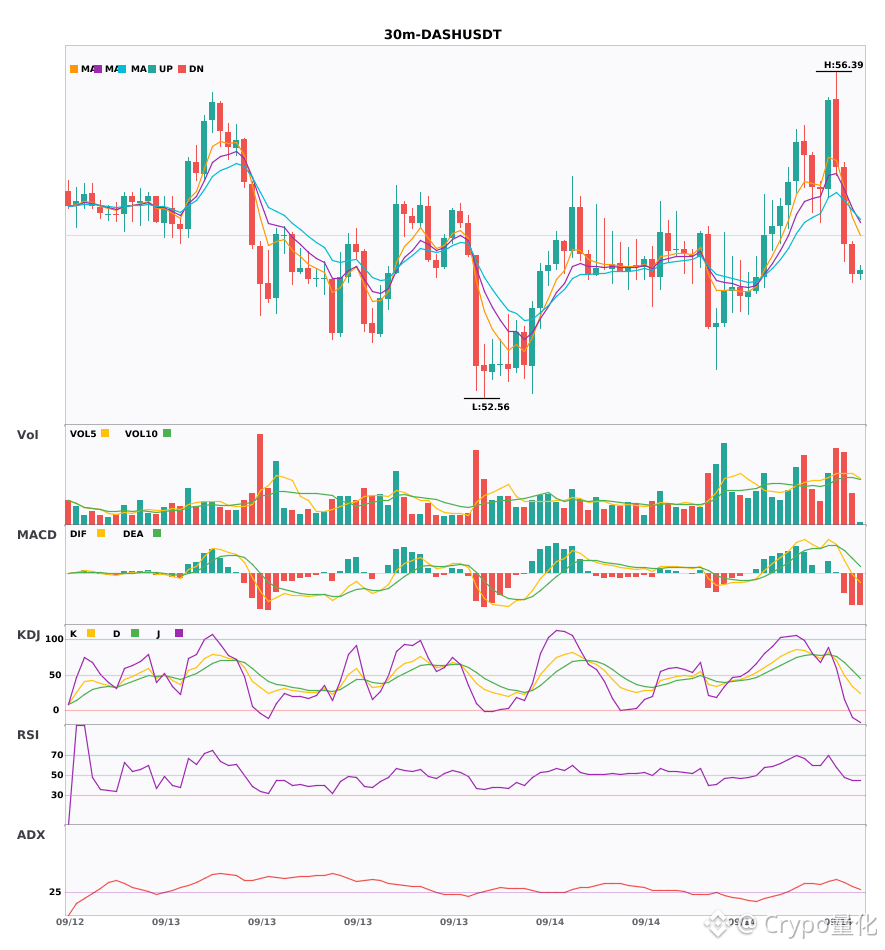
$GALA / $LTC / $DASH 30 minutes: resonance shifts to short; short signals appear at the same time🔥
════════════════════
🟢 $GALA 30 minutes short signal
⚠️ Technical analysis: ADX(29) trend is forming and can be entered. MACD’s DIF breaks below the zero line and turns bearish; moving averages are sticking together, building up for a direction to be selected; trading volume expands by 1.7x.
════════════════════
🟢 $LTC 30 minutes short signal
⚠️ Technical analysis: ADX(26) trend has just formed and can be entered. MACD green histogram expands but is relatively weak; moving averages are arranged bearish; KDJ favors the bears; volume expands by 1.5x.
════════════════════
🟢 $DASH 30 minutes short signal
⚠️ Technical analysis: ADX33 indicates the trend is very clear. MACD’s DIF breaks below the zero line and turns bearish. EMA5 forms a dead cross with EMA8; the short-term outlook weakens; volume expands by 1.5x.
════════════════════
🔔 Pay attention to get real-time first-hand market news of unusual moves 🔔
#技术分析 #GALA #LTC #DASH
📌 When trading, make sure whether the candlestick patterns match
$GALA / $LTC / $DASH 30 minutes: resonance shifts to short; short signals appear at the same time🔥
════════════════════
🟢 $GALA 30 minutes short signal
⚠️ Technical analysis: ADX(29) trend is forming and can be entered. MACD’s DIF breaks below the zero line and turns bearish; moving averages are sticking together, building up for a direction to be selected; trading volume expands by 1.7x.
════════════════════
🟢 $LTC 30 minutes short signal
⚠️ Technical analysis: ADX(26) trend has just formed and can be entered. MACD green histogram expands but is relatively weak; moving averages are arranged bearish; KDJ favors the bears; volume expands by 1.5x.
════════════════════
🟢 $DASH 30 minutes short signal
⚠️ Technical analysis: ADX33 indicates the trend is very clear. MACD’s DIF breaks below the zero line and turns bearish. EMA5 forms a dead cross with EMA8; the short-term outlook weakens; volume expands by 1.5x.
════════════════════
🔔 Pay attention to get real-time first-hand market news of unusual moves 🔔
#技术分析 #GALA #LTC #DASH
📌 When trading, make sure whether the candlestick patterns match
════════════════════
🟢 $GALA 30 minutes short signal
⚠️ Technical analysis: ADX(29) trend is forming and can be entered. MACD’s DIF breaks below the zero line and turns bearish; moving averages are sticking together, building up for a direction to be selected; trading volume expands by 1.7x.
════════════════════
🟢 $LTC 30 minutes short signal
⚠️ Technical analysis: ADX(26) trend has just formed and can be entered. MACD green histogram expands but is relatively weak; moving averages are arranged bearish; KDJ favors the bears; volume expands by 1.5x.
════════════════════
🟢 $DASH 30 minutes short signal
⚠️ Technical analysis: ADX33 indicates the trend is very clear. MACD’s DIF breaks below the zero line and turns bearish. EMA5 forms a dead cross with EMA8; the short-term outlook weakens; volume expands by 1.5x.
════════════════════
🔔 Pay attention to get real-time first-hand market news of unusual moves 🔔
#技术分析 #GALA #LTC #DASH
📌 When trading, make sure whether the candlestick patterns match
316

·
--
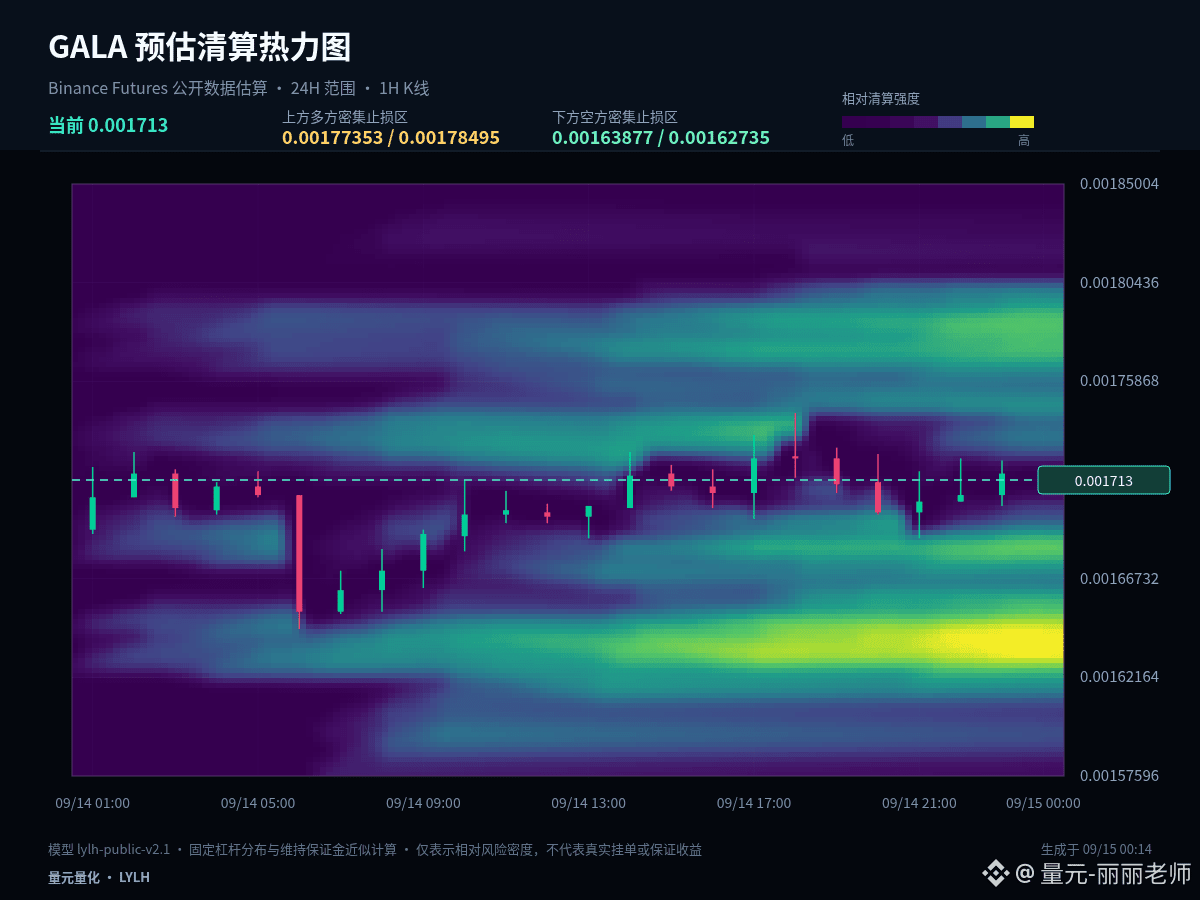
$GALA #GALA If I can keep only one observation price for this round, I would choose 0.001696. Current price: 0.001716; 1 hour: -0.17%, 24 hours: +1.72%. The gains/losses around the midline can help filter out a lot of intraday noise.
The price has not yet reclaimed 0.001696. For now, treat the current rebound as a weak repair; a genuine shift to strength depends on proof from a stable close. If it turns weaker again, 0.001646 is the next level to observe whether the sell pressure is fading.
Current 1 hour: -0.17%, 24 hours: +1.72%. These two cycles have not formed a clear same-direction alignment. In a range-bound market, tolerance for chasing highs and selling lows is low. It’s better to confirm direction using the upper boundary and confirm follow-through using the lower boundary; the midline is only used as the line dividing strength and weakness.
There are three possible ways forward: if price holds effectively above 0.001746, wait for a pullback that doesn’t break and then reassess whether the move can continue; if it breaks down below 0.001646, prioritize risk control and wait for new support; if price continues to chop around 0.001696, treat it as rotation within the range and don’t repeatedly chase direction from the middle.
For those who already hold positions, the key is to manage based on whether support fails—not to be carried around by every fluctuation. For those with no position, prioritize waiting for a breakout with a pullback or confirmation of support. Spot can be built in batches, but for futures, shorten the decision chain: first determine the stop-loss level, then decide whether to participate.
If the next 1-hour candle closes above 0.001696, the structure becomes more proactive; if it closes below, continue to be cautious. Which of these paths do you currently lean toward?
#AnthropicCEOCallsForAISlowdown
$GALA #GALA If I can keep only one observation price for this round, I would choose 0.001696. Current price: 0.001716; 1 hour: -0.17%, 24 hours: +1.72%. The gains/losses around the midline can help filter out a lot of intraday noise.
The price has not yet reclaimed 0.001696. For now, treat the current rebound as a weak repair; a genuine shift to strength depends on proof from a stable close. If it turns weaker again, 0.001646 is the next level to observe whether the sell pressure is fading.
Current 1 hour: -0.17%, 24 hours: +1.72%. These two cycles have not formed a clear same-direction alignment. In a range-bound market, tolerance for chasing highs and selling lows is low. It’s better to confirm direction using the upper boundary and confirm follow-through using the lower boundary; the midline is only used as the line dividing strength and weakness.
There are three possible ways forward: if price holds effectively above 0.001746, wait for a pullback that doesn’t break and then reassess whether the move can continue; if it breaks down below 0.001646, prioritize risk control and wait for new support; if price continues to chop around 0.001696, treat it as rotation within the range and don’t repeatedly chase direction from the middle.
For those who already hold positions, the key is to manage based on whether support fails—not to be carried around by every fluctuation. For those with no position, prioritize waiting for a breakout with a pullback or confirmation of support. Spot can be built in batches, but for futures, shorten the decision chain: first determine the stop-loss level, then decide whether to participate.
If the next 1-hour candle closes above 0.001696, the structure becomes more proactive; if it closes below, continue to be cautious. Which of these paths do you currently lean toward?
#AnthropicCEOCallsForAISlowdown
The price has not yet reclaimed 0.001696. For now, treat the current rebound as a weak repair; a genuine shift to strength depends on proof from a stable close. If it turns weaker again, 0.001646 is the next level to observe whether the sell pressure is fading.
Current 1 hour: -0.17%, 24 hours: +1.72%. These two cycles have not formed a clear same-direction alignment. In a range-bound market, tolerance for chasing highs and selling lows is low. It’s better to confirm direction using the upper boundary and confirm follow-through using the lower boundary; the midline is only used as the line dividing strength and weakness.
There are three possible ways forward: if price holds effectively above 0.001746, wait for a pullback that doesn’t break and then reassess whether the move can continue; if it breaks down below 0.001646, prioritize risk control and wait for new support; if price continues to chop around 0.001696, treat it as rotation within the range and don’t repeatedly chase direction from the middle.
For those who already hold positions, the key is to manage based on whether support fails—not to be carried around by every fluctuation. For those with no position, prioritize waiting for a breakout with a pullback or confirmation of support. Spot can be built in batches, but for futures, shorten the decision chain: first determine the stop-loss level, then decide whether to participate.
If the next 1-hour candle closes above 0.001696, the structure becomes more proactive; if it closes below, continue to be cautious. Which of these paths do you currently lean toward?
#AnthropicCEOCallsForAISlowdown
15

$GALA Coin Price Prediction 🔥🚀💥
If you short-sell $ 1,000.00 worth of GALA today and repurchase it on Feb 18, 2027, you could make a potential profit of $ 1333.10, reflecting a 133.31% ROI over the next 255 days.
The coin is in a dip right now, so it can be a good buying opportunity for quick investment.
Price Prediction 2026
After the analysis of the prices of in previous years, it is assumed that in 2026, the minimum price of will be around $0.00574. The maximum expected GALA price may be around $0.0252. On average, the trading price might be $0.0231 in 2026.
Price Prediction 2027
Based on the technical analysis by cryptocurrency experts regarding the prices of , in 2027, GALA is expected to have the following minimum and maximum prices: about $0.0368 and $0.0454, respectively. The average expected trading cost is $0.0381.
Price Prediction 2028
The experts in the field of cryptocurrency have analyzed the prices of and their fluctuations during the previous years. It is assumed that in 2028, the minimum GALA price might drop to $0.0541, while its maximum can reach $0.1567. On average, the trading cost will be around $0.1023.
Price Prediction 2029
The experts in the field of cryptocurrency have analyzed the prices of and their fluctuations during the previous years. It is assumed that in 2029, the minimum GALA price might drop to $0.0586, while its maximum can reach $0.1892. On average, the trading cost will be around $0.1303.
Please🙏 Follow Me ❤
#gala
$GALA Coin Price Prediction 🔥🚀💥
If you short-sell $ 1,000.00 worth of GALA today and repurchase it on Feb 18, 2027, you could make a potential profit of $ 1333.10, reflecting a 133.31% ROI over the next 255 days.
The coin is in a dip right now, so it can be a good buying opportunity for quick investment.
Price Prediction 2026
After the analysis of the prices of in previous years, it is assumed that in 2026, the minimum price of will be around $0.00574. The maximum expected GALA price may be around $0.0252. On average, the trading price might be $0.0231 in 2026.
Price Prediction 2027
Based on the technical analysis by cryptocurrency experts regarding the prices of , in 2027, GALA is expected to have the following minimum and maximum prices: about $0.0368 and $0.0454, respectively. The average expected trading cost is $0.0381.
Price Prediction 2028
The experts in the field of cryptocurrency have analyzed the prices of and their fluctuations during the previous years. It is assumed that in 2028, the minimum GALA price might drop to $0.0541, while its maximum can reach $0.1567. On average, the trading cost will be around $0.1023.
Price Prediction 2029
The experts in the field of cryptocurrency have analyzed the prices of and their fluctuations during the previous years. It is assumed that in 2029, the minimum GALA price might drop to $0.0586, while its maximum can reach $0.1892. On average, the trading cost will be around $0.1303.
Please🙏 Follow Me ❤
#gala
If you short-sell $ 1,000.00 worth of GALA today and repurchase it on Feb 18, 2027, you could make a potential profit of $ 1333.10, reflecting a 133.31% ROI over the next 255 days.
The coin is in a dip right now, so it can be a good buying opportunity for quick investment.
Price Prediction 2026
After the analysis of the prices of in previous years, it is assumed that in 2026, the minimum price of will be around $0.00574. The maximum expected GALA price may be around $0.0252. On average, the trading price might be $0.0231 in 2026.
Price Prediction 2027
Based on the technical analysis by cryptocurrency experts regarding the prices of , in 2027, GALA is expected to have the following minimum and maximum prices: about $0.0368 and $0.0454, respectively. The average expected trading cost is $0.0381.
Price Prediction 2028
The experts in the field of cryptocurrency have analyzed the prices of and their fluctuations during the previous years. It is assumed that in 2028, the minimum GALA price might drop to $0.0541, while its maximum can reach $0.1567. On average, the trading cost will be around $0.1023.
Price Prediction 2029
The experts in the field of cryptocurrency have analyzed the prices of and their fluctuations during the previous years. It is assumed that in 2029, the minimum GALA price might drop to $0.0586, while its maximum can reach $0.1892. On average, the trading cost will be around $0.1303.
Please🙏 Follow Me ❤
#gala

suraj1223:
help
1
1
407
·
--
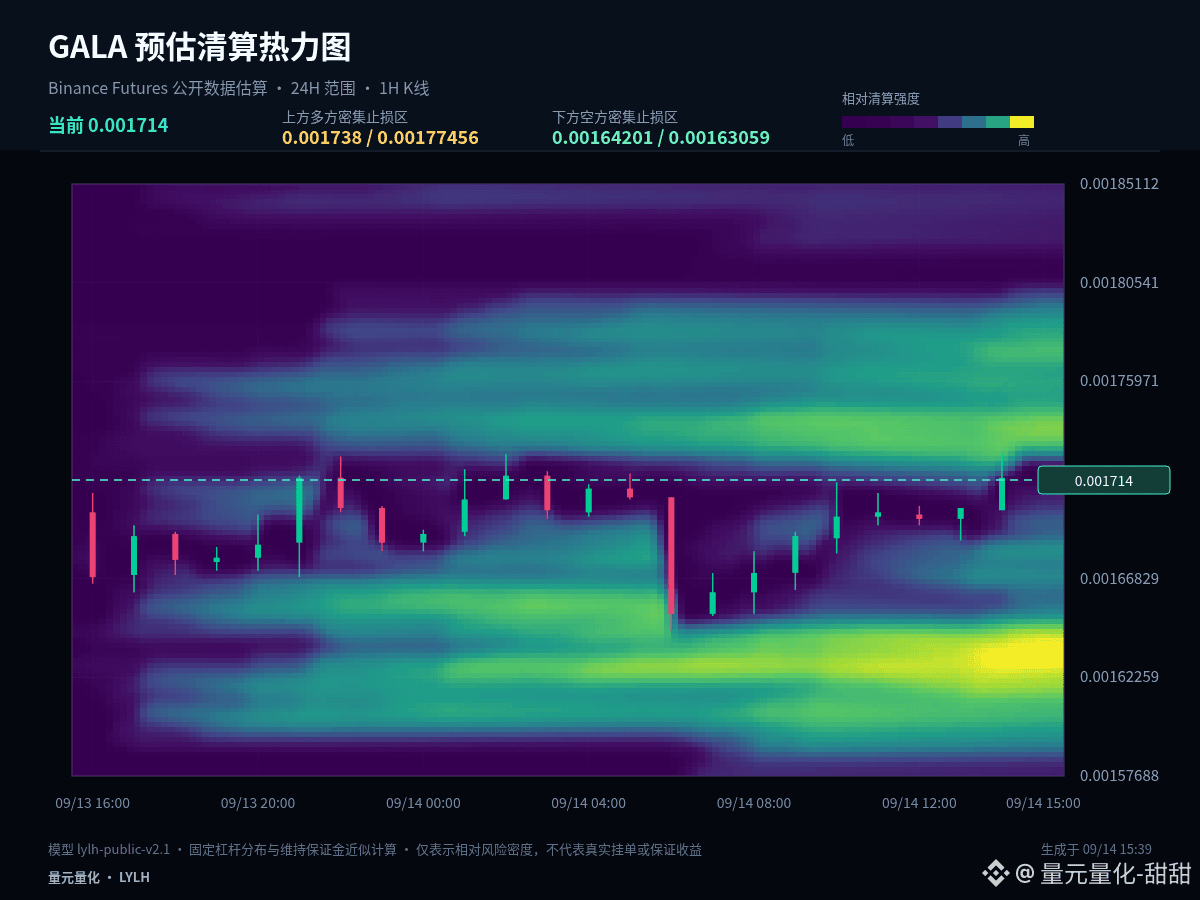
$GALA #GALA Let's put the in-session conclusion up front: if we can’t reclaim 0.0016865, we need to keep defending 0.001646. Current price is 0.001716, 1-hour -0.17%, 24-hour +0.59%.
The current price is close to the upper bound of the last 24-hour trading range: 1-hour -0.17%, 24-hour +0.59%. The most important thing at the high is to confirm the market’s acceptance after any breakout—if price can stay above the upper band, it means the market recognizes a higher zone; if it only briefly pierces and then quickly pulls back, we need to guard against a false breakout.
For the short term, first watch whether 0.001646 can form continuous support, then whether 0.0016865 can be reclaimed again. The first determines whether the downside starts to slow; the second determines whether the rebound can strengthen. Without confirmation on either, it’s not advisable to judge opportunities based solely on the magnitude of the drop.
There are three possible paths going forward:
1) If price effectively holds above and stands at 0.001727, wait for a pullback that doesn’t break and then reassess for continuation.
2) If price breaks down below 0.001646, prioritize risk control and wait for new support.
3) If price continues to chop around 0.0016865, treat it as a range for rotation—don’t chase direction repeatedly in the middle.
For those with existing positions, the key is to manage based on whether support fails, rather than being carried along by every fluctuation. For those with no position, prioritize waiting for a breakout + pullback or for support to be confirmed. For spot holdings, you can scale in/out in batches; for derivatives, shorten the decision chain—first determine the stop-loss level, then decide whether to participate.
A simplified conclusion doesn’t mean simplified risk control. In real execution, you still need price confirmation, and you should leave room to exit if your thesis proves wrong. Next, I’ll focus on tracking whether 0.0016865 holds or fails. Do you lean toward testing 0.001727 first, or returning to 0.001646 first? Feel free to share your view and the reasoning behind it.
#KoreaCryptoTaxDelayPetitionMeetsReviewThreshold
$GALA #GALA Let's put the in-session conclusion up front: if we can’t reclaim 0.0016865, we need to keep defending 0.001646. Current price is 0.001716, 1-hour -0.17%, 24-hour +0.59%.
The current price is close to the upper bound of the last 24-hour trading range: 1-hour -0.17%, 24-hour +0.59%. The most important thing at the high is to confirm the market’s acceptance after any breakout—if price can stay above the upper band, it means the market recognizes a higher zone; if it only briefly pierces and then quickly pulls back, we need to guard against a false breakout.
For the short term, first watch whether 0.001646 can form continuous support, then whether 0.0016865 can be reclaimed again. The first determines whether the downside starts to slow; the second determines whether the rebound can strengthen. Without confirmation on either, it’s not advisable to judge opportunities based solely on the magnitude of the drop.
There are three possible paths going forward:
1) If price effectively holds above and stands at 0.001727, wait for a pullback that doesn’t break and then reassess for continuation.
2) If price breaks down below 0.001646, prioritize risk control and wait for new support.
3) If price continues to chop around 0.0016865, treat it as a range for rotation—don’t chase direction repeatedly in the middle.
For those with existing positions, the key is to manage based on whether support fails, rather than being carried along by every fluctuation. For those with no position, prioritize waiting for a breakout + pullback or for support to be confirmed. For spot holdings, you can scale in/out in batches; for derivatives, shorten the decision chain—first determine the stop-loss level, then decide whether to participate.
A simplified conclusion doesn’t mean simplified risk control. In real execution, you still need price confirmation, and you should leave room to exit if your thesis proves wrong. Next, I’ll focus on tracking whether 0.0016865 holds or fails. Do you lean toward testing 0.001727 first, or returning to 0.001646 first? Feel free to share your view and the reasoning behind it.
#KoreaCryptoTaxDelayPetitionMeetsReviewThreshold
The current price is close to the upper bound of the last 24-hour trading range: 1-hour -0.17%, 24-hour +0.59%. The most important thing at the high is to confirm the market’s acceptance after any breakout—if price can stay above the upper band, it means the market recognizes a higher zone; if it only briefly pierces and then quickly pulls back, we need to guard against a false breakout.
For the short term, first watch whether 0.001646 can form continuous support, then whether 0.0016865 can be reclaimed again. The first determines whether the downside starts to slow; the second determines whether the rebound can strengthen. Without confirmation on either, it’s not advisable to judge opportunities based solely on the magnitude of the drop.
There are three possible paths going forward:
1) If price effectively holds above and stands at 0.001727, wait for a pullback that doesn’t break and then reassess for continuation.
2) If price breaks down below 0.001646, prioritize risk control and wait for new support.
3) If price continues to chop around 0.0016865, treat it as a range for rotation—don’t chase direction repeatedly in the middle.
For those with existing positions, the key is to manage based on whether support fails, rather than being carried along by every fluctuation. For those with no position, prioritize waiting for a breakout + pullback or for support to be confirmed. For spot holdings, you can scale in/out in batches; for derivatives, shorten the decision chain—first determine the stop-loss level, then decide whether to participate.
A simplified conclusion doesn’t mean simplified risk control. In real execution, you still need price confirmation, and you should leave room to exit if your thesis proves wrong. Next, I’ll focus on tracking whether 0.0016865 holds or fails. Do you lean toward testing 0.001727 first, or returning to 0.001646 first? Feel free to share your view and the reasoning behind it.
#KoreaCryptoTaxDelayPetitionMeetsReviewThreshold
9
·
--
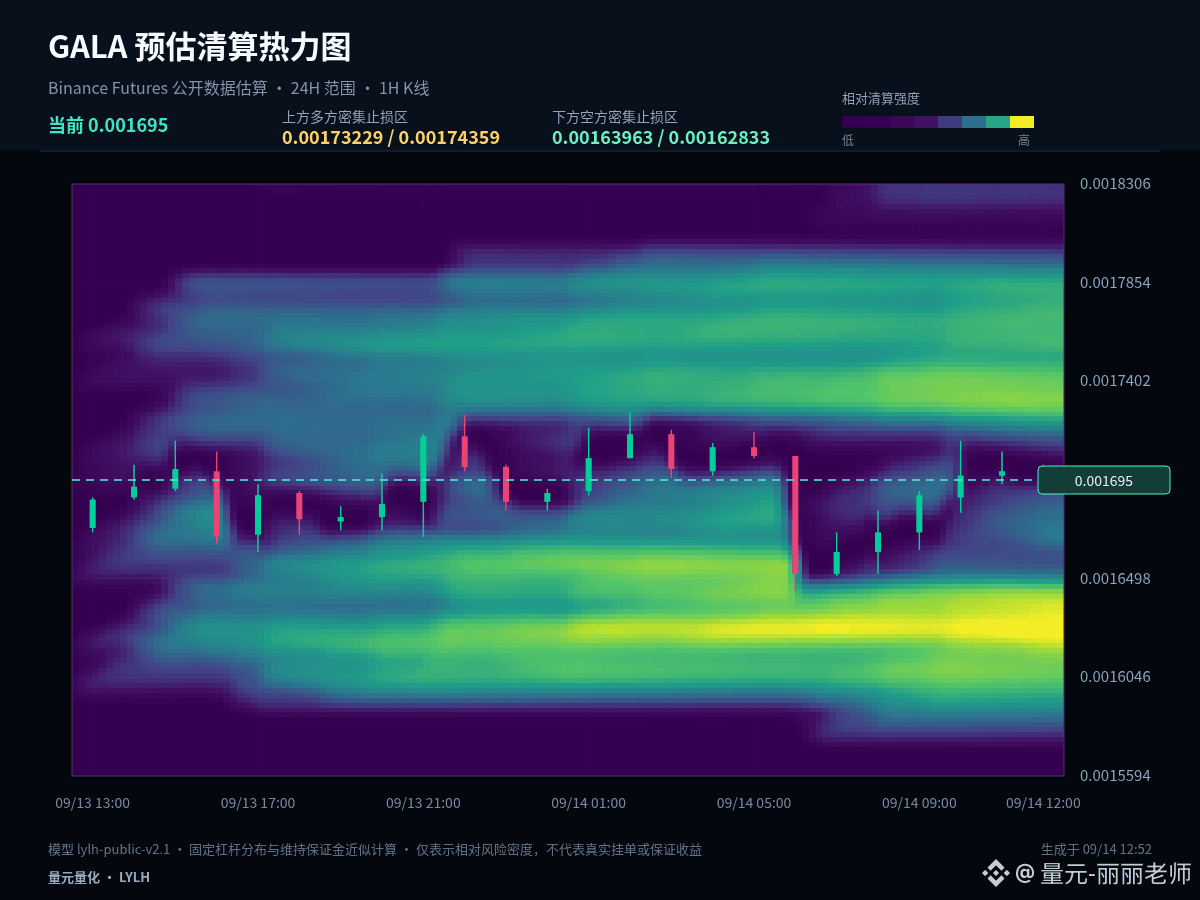
$GALA #GALA From a layout perspective, the key is not to chase already-existing fluctuations, but to determine in advance the position you are willing to wait for. Current price: 0.001698; 1 hour: -0.12%; 24 hours: +1.49%.
Currently, 1 hour is -0.12% and 24 hours is +1.49%. These two timeframes have not formed sufficiently clear alignment in the same direction. In range-bound markets, the tolerance for buying high and selling low is lower. It’s more suitable to confirm direction with an upper-band break, confirm pullback/holding with the lower band, while the midline is used only as the line that separates strength and weakness.
The first observation zone is 0.0016865, used to judge whether ordinary pullbacks have ended; the second observation zone is 0.001646, used to judge whether a deeper retracement can form support/holding. On the upside, focus on 0.001727. After a breakout, a pullback confirmation is needed to avoid mistaking a brief wick/piercing moment for the trend already being underway.
For those who already hold positions, the focus is on managing based on whether support has failed, rather than being carried along by every fluctuation. For those who are currently flat (no position), prioritize waiting for a breakout-and-pullback setup or support confirmation. Spot holdings can be built in batches; for futures/contracts, shorten the decision chain: first set the stop-loss level, then decide whether to participate.
The meaning of batching is not to continuously lower the average cost, but to control the pace while the structure remains valid. Once a key support fails, you should stop the original layout plan and wait for a new price range to form.
A trading plan must include invalidation conditions. Correct judgment can be realized in stages; if the judgment is wrong, you must also be allowed to exit. Don’t use adding positions to cover the fact that the original logic has changed. The market will update, and your viewpoint should adjust with the price evidence.
#EURequiresWalletMakersReportFlawsIn24Hours
$GALA #GALA From a layout perspective, the key is not to chase already-existing fluctuations, but to determine in advance the position you are willing to wait for. Current price: 0.001698; 1 hour: -0.12%; 24 hours: +1.49%.
Currently, 1 hour is -0.12% and 24 hours is +1.49%. These two timeframes have not formed sufficiently clear alignment in the same direction. In range-bound markets, the tolerance for buying high and selling low is lower. It’s more suitable to confirm direction with an upper-band break, confirm pullback/holding with the lower band, while the midline is used only as the line that separates strength and weakness.
The first observation zone is 0.0016865, used to judge whether ordinary pullbacks have ended; the second observation zone is 0.001646, used to judge whether a deeper retracement can form support/holding. On the upside, focus on 0.001727. After a breakout, a pullback confirmation is needed to avoid mistaking a brief wick/piercing moment for the trend already being underway.
For those who already hold positions, the focus is on managing based on whether support has failed, rather than being carried along by every fluctuation. For those who are currently flat (no position), prioritize waiting for a breakout-and-pullback setup or support confirmation. Spot holdings can be built in batches; for futures/contracts, shorten the decision chain: first set the stop-loss level, then decide whether to participate.
The meaning of batching is not to continuously lower the average cost, but to control the pace while the structure remains valid. Once a key support fails, you should stop the original layout plan and wait for a new price range to form.
A trading plan must include invalidation conditions. Correct judgment can be realized in stages; if the judgment is wrong, you must also be allowed to exit. Don’t use adding positions to cover the fact that the original logic has changed. The market will update, and your viewpoint should adjust with the price evidence.
#EURequiresWalletMakersReportFlawsIn24Hours
Currently, 1 hour is -0.12% and 24 hours is +1.49%. These two timeframes have not formed sufficiently clear alignment in the same direction. In range-bound markets, the tolerance for buying high and selling low is lower. It’s more suitable to confirm direction with an upper-band break, confirm pullback/holding with the lower band, while the midline is used only as the line that separates strength and weakness.
The first observation zone is 0.0016865, used to judge whether ordinary pullbacks have ended; the second observation zone is 0.001646, used to judge whether a deeper retracement can form support/holding. On the upside, focus on 0.001727. After a breakout, a pullback confirmation is needed to avoid mistaking a brief wick/piercing moment for the trend already being underway.
For those who already hold positions, the focus is on managing based on whether support has failed, rather than being carried along by every fluctuation. For those who are currently flat (no position), prioritize waiting for a breakout-and-pullback setup or support confirmation. Spot holdings can be built in batches; for futures/contracts, shorten the decision chain: first set the stop-loss level, then decide whether to participate.
The meaning of batching is not to continuously lower the average cost, but to control the pace while the structure remains valid. Once a key support fails, you should stop the original layout plan and wait for a new price range to form.
A trading plan must include invalidation conditions. Correct judgment can be realized in stages; if the judgment is wrong, you must also be allowed to exit. Don’t use adding positions to cover the fact that the original logic has changed. The market will update, and your viewpoint should adjust with the price evidence.
#EURequiresWalletMakersReportFlawsIn24Hours
29
·
--
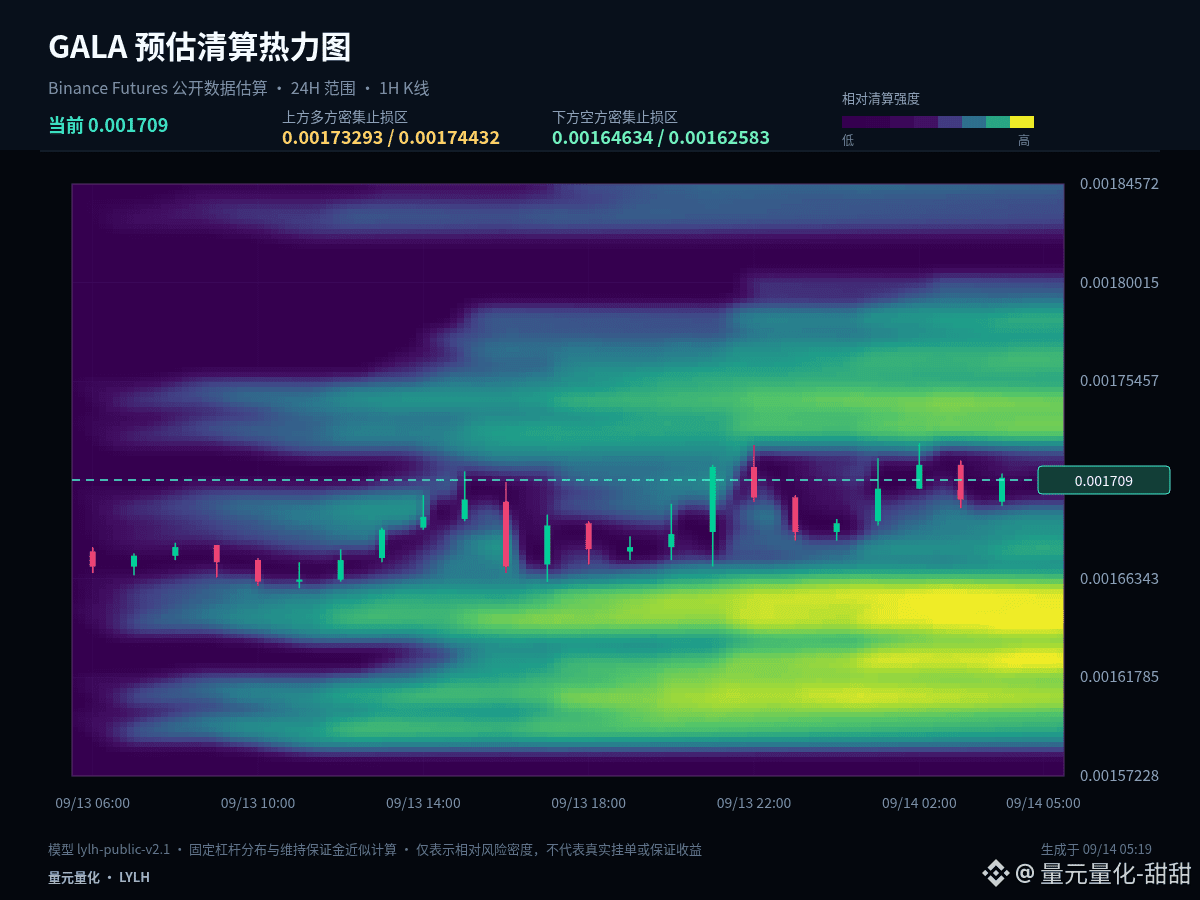
$GALA #GALA In the past 24 hours, the high-low amplitude is about 3.8%. Current price: 0.001711. This is not a calm market that’s suitable for casually opening a position. When volatility increases, you should adjust your position first, then discuss direction.
$GALA #GALA is still trading back and forth within the past-24-hour range, without a clear directional advantage. The middle part is the real test of patience—waiting for boundary signals is usually more effective.
Current 1-hour change: -0.06%; 24-hour change: +1.54%. The two timeframes have not formed sufficiently clear alignment in the same direction. In range-bound markets, the tolerance for chasing and killing entries is low. It’s more suitable to use upper-bound confirmation for direction, lower-bound confirmation for support, and treat the midline only as a boundary between strength and weakness.
For the short term, first watch whether 0.001662 can form continuous support, then whether 0.0016945 can be reclaimed. The former determines whether the decline can slow down; the latter determines whether the rebound can turn stronger. Without confirmation on both, you shouldn’t judge opportunities based only on the magnitude of the drop.
During high-volatility phases, the execution principle is to reduce single-trade exposure, avoid repeatedly chasing prices back and forth in the middle of the range, and write the invalidation conditions before entering. If price doesn’t provide confirmation, it’s better to do less than once than to compensate for uncertainty with a larger position.
In execution, set clear conditions: after breaking above 0.001727, you need confirmation—not to chase just because of a brief spike. After dipping to 0.001662, you need to see whether it can be quickly reclaimed—not to catch every drop. If the middle zone doesn’t offer enough reward-to-risk, waiting itself is part of the strategy.
The key focus of the contract is not predicting every single candlestick. It’s to ensure that entries, position reductions, and exits all have a basis. Do less without confirmation; when key levels fail, redo the plan. First control the risk per trade, then talk about the potential for further upside/downsides.
#SECReceivesGrayscaleLitecoinTrustETFFiling
$GALA #GALA In the past 24 hours, the high-low amplitude is about 3.8%. Current price: 0.001711. This is not a calm market that’s suitable for casually opening a position. When volatility increases, you should adjust your position first, then discuss direction.
$GALA #GALA is still trading back and forth within the past-24-hour range, without a clear directional advantage. The middle part is the real test of patience—waiting for boundary signals is usually more effective.
Current 1-hour change: -0.06%; 24-hour change: +1.54%. The two timeframes have not formed sufficiently clear alignment in the same direction. In range-bound markets, the tolerance for chasing and killing entries is low. It’s more suitable to use upper-bound confirmation for direction, lower-bound confirmation for support, and treat the midline only as a boundary between strength and weakness.
For the short term, first watch whether 0.001662 can form continuous support, then whether 0.0016945 can be reclaimed. The former determines whether the decline can slow down; the latter determines whether the rebound can turn stronger. Without confirmation on both, you shouldn’t judge opportunities based only on the magnitude of the drop.
During high-volatility phases, the execution principle is to reduce single-trade exposure, avoid repeatedly chasing prices back and forth in the middle of the range, and write the invalidation conditions before entering. If price doesn’t provide confirmation, it’s better to do less than once than to compensate for uncertainty with a larger position.
In execution, set clear conditions: after breaking above 0.001727, you need confirmation—not to chase just because of a brief spike. After dipping to 0.001662, you need to see whether it can be quickly reclaimed—not to catch every drop. If the middle zone doesn’t offer enough reward-to-risk, waiting itself is part of the strategy.
The key focus of the contract is not predicting every single candlestick. It’s to ensure that entries, position reductions, and exits all have a basis. Do less without confirmation; when key levels fail, redo the plan. First control the risk per trade, then talk about the potential for further upside/downsides.
#SECReceivesGrayscaleLitecoinTrustETFFiling
$GALA #GALA is still trading back and forth within the past-24-hour range, without a clear directional advantage. The middle part is the real test of patience—waiting for boundary signals is usually more effective.
Current 1-hour change: -0.06%; 24-hour change: +1.54%. The two timeframes have not formed sufficiently clear alignment in the same direction. In range-bound markets, the tolerance for chasing and killing entries is low. It’s more suitable to use upper-bound confirmation for direction, lower-bound confirmation for support, and treat the midline only as a boundary between strength and weakness.
For the short term, first watch whether 0.001662 can form continuous support, then whether 0.0016945 can be reclaimed. The former determines whether the decline can slow down; the latter determines whether the rebound can turn stronger. Without confirmation on both, you shouldn’t judge opportunities based only on the magnitude of the drop.
During high-volatility phases, the execution principle is to reduce single-trade exposure, avoid repeatedly chasing prices back and forth in the middle of the range, and write the invalidation conditions before entering. If price doesn’t provide confirmation, it’s better to do less than once than to compensate for uncertainty with a larger position.
In execution, set clear conditions: after breaking above 0.001727, you need confirmation—not to chase just because of a brief spike. After dipping to 0.001662, you need to see whether it can be quickly reclaimed—not to catch every drop. If the middle zone doesn’t offer enough reward-to-risk, waiting itself is part of the strategy.
The key focus of the contract is not predicting every single candlestick. It’s to ensure that entries, position reductions, and exits all have a basis. Do less without confirmation; when key levels fail, redo the plan. First control the risk per trade, then talk about the potential for further upside/downsides.
#SECReceivesGrayscaleLitecoinTrustETFFiling
203
·
--
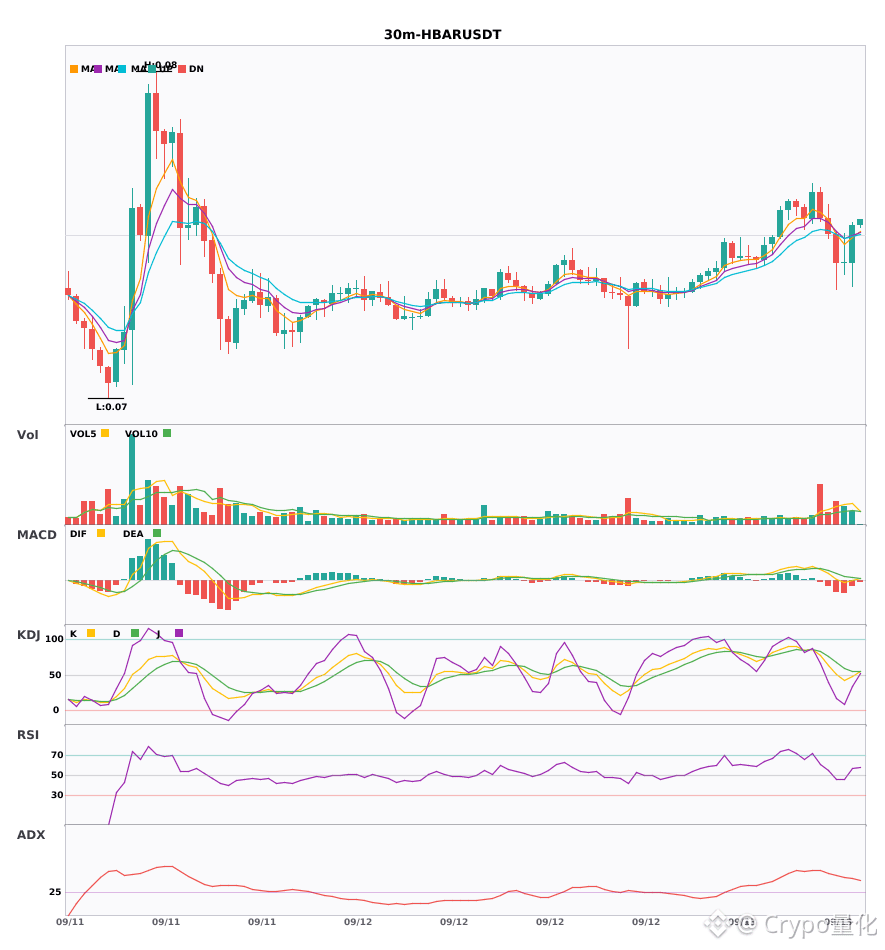
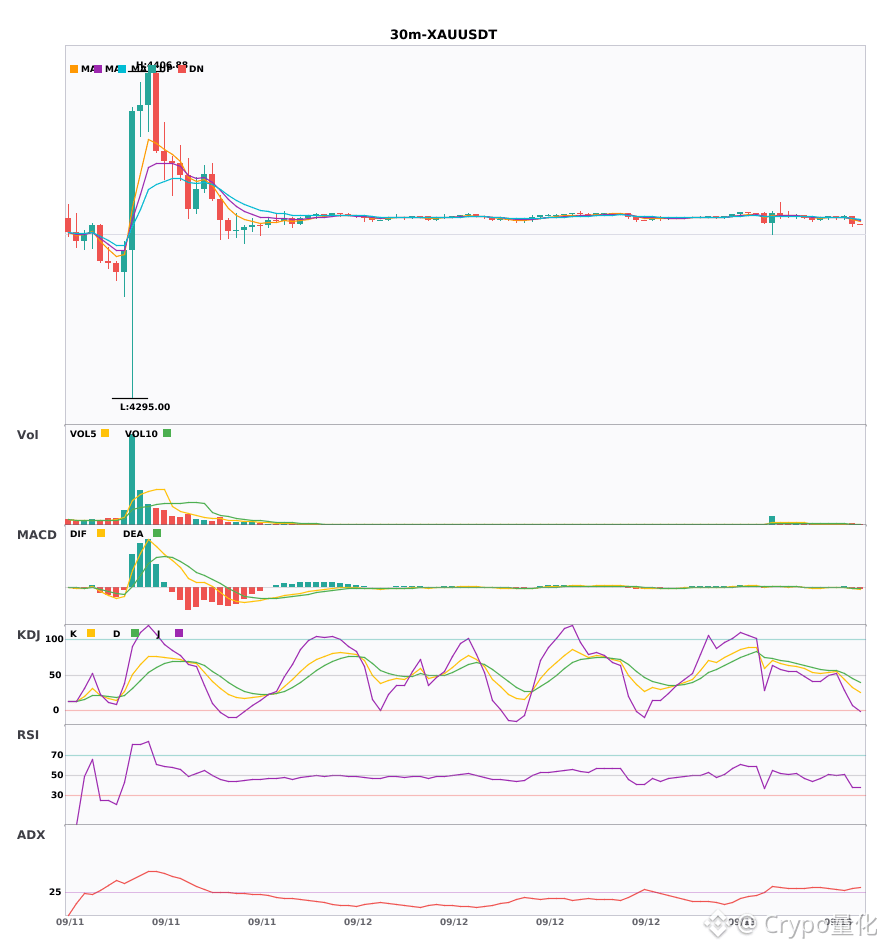
$GALA / $HBAR / $XAU 30-minute resonance turns to a short (bearish) phase. Bearish signals appear at the same time🔥
════════════════════
🟢 $GALA 30-minute bearish signal
⚠️ Technicals: ADX(43) shows a clear trending market | MACD DIF breaks below the zero line, the trend turns bearish | Moving averages are sticking together and building up momentum, about to choose a direction | Volume expands (1.9x)
════════════════════
🟢 $HBAR 30-minute bearish signal
⚠️ Technicals: ADX(44) shows a clear trending market | MACD DIF breaks below the zero line, the trend turns bearish | Moving averages are sticking together and building up momentum, about to choose a direction | Volume expands (1.8x)
════════════════════
🟢 $XAU 30-minute bearish signal
⚠️ Technicals: ADX(30) the trend is forming and you can participate | MACD dead cross below zero; shorts accelerate | EMA5 < EMA8 < EMA13; bearish alignment | KDJ is running weakly, bears in control (K is 32.8, D is 45.6) | Volume expands (2.3x)
════════════════════
🔔 Watch for immediate real-time alerts for unusual market moves 🔔
#技术分析 #GALA #HBAR #XAU
📌 When trading, pay attention to whether the candlestick pattern matches
$GALA / $HBAR / $XAU 30-minute resonance turns to a short (bearish) phase. Bearish signals appear at the same time🔥
════════════════════
🟢 $GALA 30-minute bearish signal
⚠️ Technicals: ADX(43) shows a clear trending market | MACD DIF breaks below the zero line, the trend turns bearish | Moving averages are sticking together and building up momentum, about to choose a direction | Volume expands (1.9x)
════════════════════
🟢 $HBAR 30-minute bearish signal
⚠️ Technicals: ADX(44) shows a clear trending market | MACD DIF breaks below the zero line, the trend turns bearish | Moving averages are sticking together and building up momentum, about to choose a direction | Volume expands (1.8x)
════════════════════
🟢 $XAU 30-minute bearish signal
⚠️ Technicals: ADX(30) the trend is forming and you can participate | MACD dead cross below zero; shorts accelerate | EMA5 < EMA8 < EMA13; bearish alignment | KDJ is running weakly, bears in control (K is 32.8, D is 45.6) | Volume expands (2.3x)
════════════════════
🔔 Watch for immediate real-time alerts for unusual market moves 🔔
#技术分析 #GALA #HBAR #XAU
📌 When trading, pay attention to whether the candlestick pattern matches
════════════════════
🟢 $GALA 30-minute bearish signal
⚠️ Technicals: ADX(43) shows a clear trending market | MACD DIF breaks below the zero line, the trend turns bearish | Moving averages are sticking together and building up momentum, about to choose a direction | Volume expands (1.9x)
════════════════════
🟢 $HBAR 30-minute bearish signal
⚠️ Technicals: ADX(44) shows a clear trending market | MACD DIF breaks below the zero line, the trend turns bearish | Moving averages are sticking together and building up momentum, about to choose a direction | Volume expands (1.8x)
════════════════════
🟢 $XAU 30-minute bearish signal
⚠️ Technicals: ADX(30) the trend is forming and you can participate | MACD dead cross below zero; shorts accelerate | EMA5 < EMA8 < EMA13; bearish alignment | KDJ is running weakly, bears in control (K is 32.8, D is 45.6) | Volume expands (2.3x)
════════════════════
🔔 Watch for immediate real-time alerts for unusual market moves 🔔
#技术分析 #GALA #HBAR #XAU
📌 When trading, pay attention to whether the candlestick pattern matches
158
·
--
$GALA #GALA Pullbacks in a strong market often reveal the actual demand/supply that underpins price more clearly than an accelerated rally. Currently, 1 hour is +0.12%, and 24 hours is -1.35%. We need to determine whether this is normal cooling or a structural weakening.
Right now, 1 hour is +0.12% and 24 hours is -1.35%. The two timeframes have not formed a sufficiently clear alignment in the same direction. In a range-bound market, the tolerance for chasing or selling aggressively is lower. It’s more suitable to confirm direction by the upper boundary, confirm support by the lower boundary, and use the midline only as the line separating strength and weakness.
The short-term initiative has not been clearly broken. 0.001688 is the primary standard for the quality of a pullback. Hold it first, then test 0.001714—this would be a relatively bullish consolidation. If it breaks below the midline and continues to stay there, the focus of observation should be shifted down to 0.001662.
There are three ways to handle the next path: If price is able to move up and hold effectively above 0.001714, wait to see whether a pullback fails to break, then reassess continuation; if it breaks down below 0.001662, prioritize risk control and wait for new support; if it continues to oscillate around 0.001688, treat it as a range turnover—don’t repeatedly chase direction from the middle.
For those already holding positions, the key is to manage based on whether the support becomes invalid—not to be carried along by every fluctuation. For those currently in no position, prioritize waiting for a breakout and pullback, or confirmation of support. Spot positions can be built in batches; for futures/contracts, you should shorten the decision chain: first set the stop-loss level, then decide whether to participate.
A trading plan must include invalidation conditions. If your judgment is correct, you can realize profits in stages; if it’s wrong, you must be allowed to exit. Don’t use adding positions to cover the fact that the initial logic has already changed. The market will update, and your viewpoint should also adjust in line with price evidence.
#USBankCompletesCrossBorderPaymentPilotOnStellar
$GALA #GALA Pullbacks in a strong market often reveal the actual demand/supply that underpins price more clearly than an accelerated rally. Currently, 1 hour is +0.12%, and 24 hours is -1.35%. We need to determine whether this is normal cooling or a structural weakening.
Right now, 1 hour is +0.12% and 24 hours is -1.35%. The two timeframes have not formed a sufficiently clear alignment in the same direction. In a range-bound market, the tolerance for chasing or selling aggressively is lower. It’s more suitable to confirm direction by the upper boundary, confirm support by the lower boundary, and use the midline only as the line separating strength and weakness.
The short-term initiative has not been clearly broken. 0.001688 is the primary standard for the quality of a pullback. Hold it first, then test 0.001714—this would be a relatively bullish consolidation. If it breaks below the midline and continues to stay there, the focus of observation should be shifted down to 0.001662.
There are three ways to handle the next path: If price is able to move up and hold effectively above 0.001714, wait to see whether a pullback fails to break, then reassess continuation; if it breaks down below 0.001662, prioritize risk control and wait for new support; if it continues to oscillate around 0.001688, treat it as a range turnover—don’t repeatedly chase direction from the middle.
For those already holding positions, the key is to manage based on whether the support becomes invalid—not to be carried along by every fluctuation. For those currently in no position, prioritize waiting for a breakout and pullback, or confirmation of support. Spot positions can be built in batches; for futures/contracts, you should shorten the decision chain: first set the stop-loss level, then decide whether to participate.
A trading plan must include invalidation conditions. If your judgment is correct, you can realize profits in stages; if it’s wrong, you must be allowed to exit. Don’t use adding positions to cover the fact that the initial logic has already changed. The market will update, and your viewpoint should also adjust in line with price evidence.
#USBankCompletesCrossBorderPaymentPilotOnStellar
Right now, 1 hour is +0.12% and 24 hours is -1.35%. The two timeframes have not formed a sufficiently clear alignment in the same direction. In a range-bound market, the tolerance for chasing or selling aggressively is lower. It’s more suitable to confirm direction by the upper boundary, confirm support by the lower boundary, and use the midline only as the line separating strength and weakness.
The short-term initiative has not been clearly broken. 0.001688 is the primary standard for the quality of a pullback. Hold it first, then test 0.001714—this would be a relatively bullish consolidation. If it breaks below the midline and continues to stay there, the focus of observation should be shifted down to 0.001662.
There are three ways to handle the next path: If price is able to move up and hold effectively above 0.001714, wait to see whether a pullback fails to break, then reassess continuation; if it breaks down below 0.001662, prioritize risk control and wait for new support; if it continues to oscillate around 0.001688, treat it as a range turnover—don’t repeatedly chase direction from the middle.
For those already holding positions, the key is to manage based on whether the support becomes invalid—not to be carried along by every fluctuation. For those currently in no position, prioritize waiting for a breakout and pullback, or confirmation of support. Spot positions can be built in batches; for futures/contracts, you should shorten the decision chain: first set the stop-loss level, then decide whether to participate.
A trading plan must include invalidation conditions. If your judgment is correct, you can realize profits in stages; if it’s wrong, you must be allowed to exit. Don’t use adding positions to cover the fact that the initial logic has already changed. The market will update, and your viewpoint should also adjust in line with price evidence.
#USBankCompletesCrossBorderPaymentPilotOnStellar
29

·
--
Bearish
GALA longs just got cleared near $0.0017.
The downside liquidity sweep keeps sellers active.
$GALA
{future}(GALAUSDT)
🔴 LIQUIDITY ZONE HIT 🔴
Long liquidation spotted 🧨
$2.2581K cleared at $0.0017
Downside liquidity swept — watch reaction 👀
🎯 TP Targets:
TP1: ~$0.00168
TP2: ~$0.00167
TP3: ~$0.00165
#gala
GALA longs just got cleared near $0.0017.
The downside liquidity sweep keeps sellers active.
$GALA
🔴 LIQUIDITY ZONE HIT 🔴
Long liquidation spotted 🧨
$2.2581K cleared at $0.0017
Downside liquidity swept — watch reaction 👀
🎯 TP Targets:
TP1: ~$0.00168
TP2: ~$0.00167
TP3: ~$0.00165
#gala
The downside liquidity sweep keeps sellers active.
$GALA
🔴 LIQUIDITY ZONE HIT 🔴
Long liquidation spotted 🧨
$2.2581K cleared at $0.0017
Downside liquidity swept — watch reaction 👀
🎯 TP Targets:
TP1: ~$0.00168
TP2: ~$0.00167
TP3: ~$0.00165
#gala
120
·
--
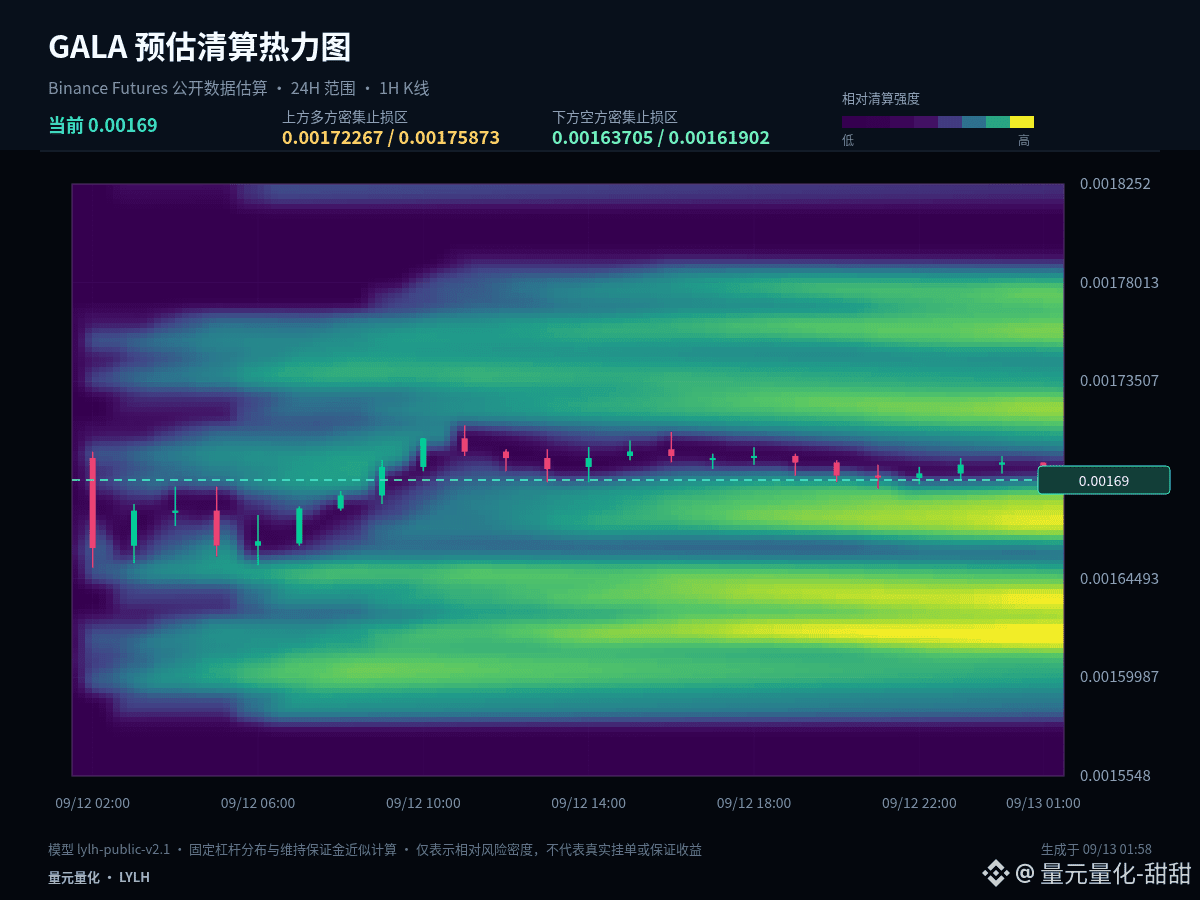
$GALA #GALA Current price 0.001691. This time I’m not only looking at the size of the bullish/bearish move. I put the 1-hour structure together with the estimated liquidation distribution to observe which side the price is more likely to seek liquidity next.
For the current 1 hour: -0.47%, and for the past 24 hours: -0.70%. Across these two periods, there isn’t enough clear same-direction alignment. In a range-bound market, the margin for chasing and selling is lower; it’s better to confirm with the upper boundary for direction, and confirm with the lower boundary for acceptance. The midline is only used as a strong/weak boundary.
Based on the estimated liquidation heatmap, 0.00172267 and 0.00163705 are the liquidity regions on both sides of the current price that are more worth tracking. Price may first move toward the dense zone to look for filled orders, but reaching it is only the first step. A rapid penetration indicates momentum dominance; if it quickly snaps back after impact, it’s more like liquidity release.
In terms of price structure: 0.001685 is the intraday midline. Typical resistance and support are at 0.001717 and 0.001653, respectively. Use heatmap price levels to observe potential liquidity, and key candlestick levels to confirm structure. When the two overlap, the reference value is higher; when they don’t, rely on the actual price reaction.
For the next path, handle it in three scenarios: if it holds effectively above 0.001717, wait for a pullback that doesn’t break and then reassess for continuation; if it breaks down below 0.001653, prioritize risk control and wait for new support; if it keeps oscillating around 0.001685, treat it as rotation within the range—don’t repeatedly chase direction from the middle.
Risk control still comes before any conclusion: execute only when the conditions appear; if the price invalidates the thesis, reassess immediately. The higher the volatility, the more restrained you should be with single-position sizing.
The above is a scenario projection based on the current 1-hour and 24-hour data, and does not constitute any promise of returns.
Next, I’ll focus on tracking the gains/losses around 0.001685. Do you lean more toward first testing 0.001717, or first returning to 0.001653? Feel free to leave your judgment and reasoning.
#EtherRalliesAsBearishBetsLiquidate
$GALA #GALA Current price 0.001691. This time I’m not only looking at the size of the bullish/bearish move. I put the 1-hour structure together with the estimated liquidation distribution to observe which side the price is more likely to seek liquidity next.
For the current 1 hour: -0.47%, and for the past 24 hours: -0.70%. Across these two periods, there isn’t enough clear same-direction alignment. In a range-bound market, the margin for chasing and selling is lower; it’s better to confirm with the upper boundary for direction, and confirm with the lower boundary for acceptance. The midline is only used as a strong/weak boundary.
Based on the estimated liquidation heatmap, 0.00172267 and 0.00163705 are the liquidity regions on both sides of the current price that are more worth tracking. Price may first move toward the dense zone to look for filled orders, but reaching it is only the first step. A rapid penetration indicates momentum dominance; if it quickly snaps back after impact, it’s more like liquidity release.
In terms of price structure: 0.001685 is the intraday midline. Typical resistance and support are at 0.001717 and 0.001653, respectively. Use heatmap price levels to observe potential liquidity, and key candlestick levels to confirm structure. When the two overlap, the reference value is higher; when they don’t, rely on the actual price reaction.
For the next path, handle it in three scenarios: if it holds effectively above 0.001717, wait for a pullback that doesn’t break and then reassess for continuation; if it breaks down below 0.001653, prioritize risk control and wait for new support; if it keeps oscillating around 0.001685, treat it as rotation within the range—don’t repeatedly chase direction from the middle.
Risk control still comes before any conclusion: execute only when the conditions appear; if the price invalidates the thesis, reassess immediately. The higher the volatility, the more restrained you should be with single-position sizing.
The above is a scenario projection based on the current 1-hour and 24-hour data, and does not constitute any promise of returns.
Next, I’ll focus on tracking the gains/losses around 0.001685. Do you lean more toward first testing 0.001717, or first returning to 0.001653? Feel free to leave your judgment and reasoning.
#EtherRalliesAsBearishBetsLiquidate
For the current 1 hour: -0.47%, and for the past 24 hours: -0.70%. Across these two periods, there isn’t enough clear same-direction alignment. In a range-bound market, the margin for chasing and selling is lower; it’s better to confirm with the upper boundary for direction, and confirm with the lower boundary for acceptance. The midline is only used as a strong/weak boundary.
Based on the estimated liquidation heatmap, 0.00172267 and 0.00163705 are the liquidity regions on both sides of the current price that are more worth tracking. Price may first move toward the dense zone to look for filled orders, but reaching it is only the first step. A rapid penetration indicates momentum dominance; if it quickly snaps back after impact, it’s more like liquidity release.
In terms of price structure: 0.001685 is the intraday midline. Typical resistance and support are at 0.001717 and 0.001653, respectively. Use heatmap price levels to observe potential liquidity, and key candlestick levels to confirm structure. When the two overlap, the reference value is higher; when they don’t, rely on the actual price reaction.
For the next path, handle it in three scenarios: if it holds effectively above 0.001717, wait for a pullback that doesn’t break and then reassess for continuation; if it breaks down below 0.001653, prioritize risk control and wait for new support; if it keeps oscillating around 0.001685, treat it as rotation within the range—don’t repeatedly chase direction from the middle.
Risk control still comes before any conclusion: execute only when the conditions appear; if the price invalidates the thesis, reassess immediately. The higher the volatility, the more restrained you should be with single-position sizing.
The above is a scenario projection based on the current 1-hour and 24-hour data, and does not constitute any promise of returns.
Next, I’ll focus on tracking the gains/losses around 0.001685. Do you lean more toward first testing 0.001717, or first returning to 0.001653? Feel free to leave your judgment and reasoning.
#EtherRalliesAsBearishBetsLiquidate
7
·
--
$GALA #GALA Order book notes: Current price 0.001695, 1-hour -0.24%, 24-hour -0.47%, and the recent 24-hour range amplitude is about 8.3%. First write down the current data and judgment; later we’ll verify with the trend.
$GALA #GALA is still within the past 24-hour range, repeatedly switching hands, and there isn’t a clear directional advantage. The middle zone is the most testing for patience; waiting for boundary signals is usually more effective.
For the short term, watch whether 0.001639 can form continuous support, then whether 0.0017095 can be reclaimed again. The former determines whether the sell-off can slow down; the latter determines whether the rebound can strengthen. Until both are confirmed, it’s not advisable to judge opportunities based only on the magnitude of the drop.
For the next path, handle it in three ways: if it holds up effectively above 0.00178, wait for a pullback that doesn’t break and then reassess continuation; if it breaks down below 0.001639, prioritize risk control and wait for new support; if it continues to oscillate around 0.0017095, treat it as range-bound turnover and don’t chase a direction repeatedly in the middle position.
During review, I’ll check three things: how price responds when it first approaches the key level, whether the 1-hour close completes the confirmation, and whether adjustments are made according to the plan after the judgment becomes invalid. Compared with only recording outcomes, these three items are better at finding execution issues.
Risk control is still placed before the conclusion: only execute when conditions appear, and re-evaluate promptly when price invalidates the setup; the higher the volatility, the more restrained you should be with any single position size. The above is a scenario projection based on the current 1-hour and 24-hour data and does not constitute any promise of returns.
#CPIWatch
$GALA #GALA Order book notes: Current price 0.001695, 1-hour -0.24%, 24-hour -0.47%, and the recent 24-hour range amplitude is about 8.3%. First write down the current data and judgment; later we’ll verify with the trend.
$GALA #GALA is still within the past 24-hour range, repeatedly switching hands, and there isn’t a clear directional advantage. The middle zone is the most testing for patience; waiting for boundary signals is usually more effective.
For the short term, watch whether 0.001639 can form continuous support, then whether 0.0017095 can be reclaimed again. The former determines whether the sell-off can slow down; the latter determines whether the rebound can strengthen. Until both are confirmed, it’s not advisable to judge opportunities based only on the magnitude of the drop.
For the next path, handle it in three ways: if it holds up effectively above 0.00178, wait for a pullback that doesn’t break and then reassess continuation; if it breaks down below 0.001639, prioritize risk control and wait for new support; if it continues to oscillate around 0.0017095, treat it as range-bound turnover and don’t chase a direction repeatedly in the middle position.
During review, I’ll check three things: how price responds when it first approaches the key level, whether the 1-hour close completes the confirmation, and whether adjustments are made according to the plan after the judgment becomes invalid. Compared with only recording outcomes, these three items are better at finding execution issues.
Risk control is still placed before the conclusion: only execute when conditions appear, and re-evaluate promptly when price invalidates the setup; the higher the volatility, the more restrained you should be with any single position size. The above is a scenario projection based on the current 1-hour and 24-hour data and does not constitute any promise of returns.
#CPIWatch
$GALA #GALA is still within the past 24-hour range, repeatedly switching hands, and there isn’t a clear directional advantage. The middle zone is the most testing for patience; waiting for boundary signals is usually more effective.
For the short term, watch whether 0.001639 can form continuous support, then whether 0.0017095 can be reclaimed again. The former determines whether the sell-off can slow down; the latter determines whether the rebound can strengthen. Until both are confirmed, it’s not advisable to judge opportunities based only on the magnitude of the drop.
For the next path, handle it in three ways: if it holds up effectively above 0.00178, wait for a pullback that doesn’t break and then reassess continuation; if it breaks down below 0.001639, prioritize risk control and wait for new support; if it continues to oscillate around 0.0017095, treat it as range-bound turnover and don’t chase a direction repeatedly in the middle position.
During review, I’ll check three things: how price responds when it first approaches the key level, whether the 1-hour close completes the confirmation, and whether adjustments are made according to the plan after the judgment becomes invalid. Compared with only recording outcomes, these three items are better at finding execution issues.
Risk control is still placed before the conclusion: only execute when conditions appear, and re-evaluate promptly when price invalidates the setup; the higher the volatility, the more restrained you should be with any single position size. The above is a scenario projection based on the current 1-hour and 24-hour data and does not constitute any promise of returns.
#CPIWatch
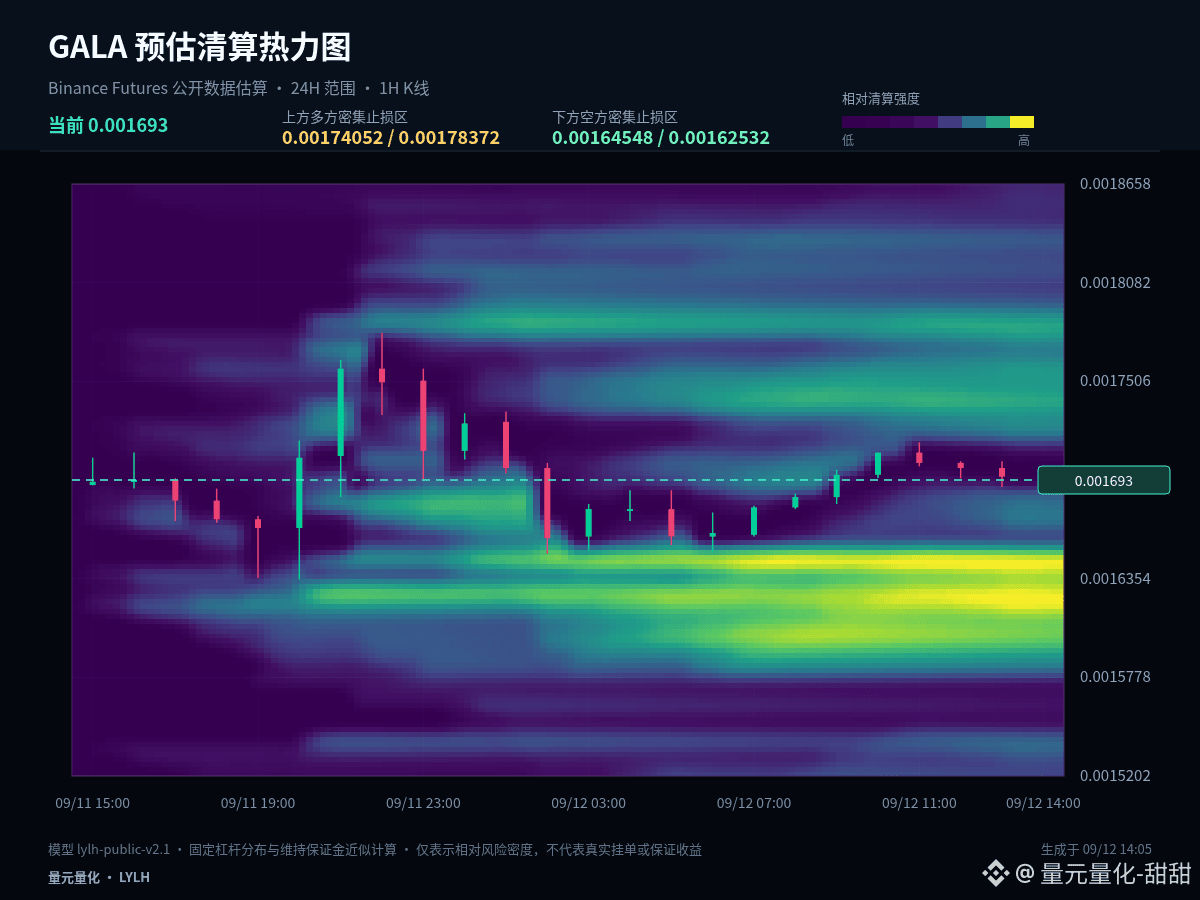
8
·
--
$GALA #GALA Order book notes: current price 0.001696, 1 hour -0.29%, 24 hours -0.29%, and the amplitude over the last 24 hours is about 8.3%. First write down the current data and my judgment, then later verify it with the price action.
$GALA #GALA has not formed a clear single-direction move yet; the 1-hour and 24-hour rhythms are still tugging at each other. In this phase, focus on the boundaries of the range rather than the color of each individual candlestick.
For key levels: 0.0017095 is the central axis that must be reclaimed for a weak repair. If the price cannot get back above it, rebounds should still be treated as a technical correction. Below that, 0.001639 still has the possibility of being tested again. Only after reclaiming the central axis do we have the right to further observe 0.00178.
For execution, set clear conditions: after a breakout above 0.00178, you need confirmation—not chasing just because of a momentary surge. After a dip to 0.001639, you need to see whether it can quickly reclaim—not catching just because it looks like it’s falling. When the middle zone does not offer sufficient odds, waiting is also part of the strategy.
When reviewing the trade, I will check three things: how price reacts when it first approaches the key level, whether the 1-hour close completes confirmation, and whether the plan is adjusted according to schedule after the judgment becomes invalid. Compared with merely recording outcomes, these three items are better at revealing execution problems.
Risk control stays in front of the conclusion: execute only when the conditions appear, and reassess promptly if the price action fails. The greater the volatility, the more you must restrain your position size per trade. The above is a scenario based on the current 1-hour and 24-hour data; it does not constitute any promise of returns.
#EtherRalliesAsBearishBetsLiquidate
$GALA #GALA Order book notes: current price 0.001696, 1 hour -0.29%, 24 hours -0.29%, and the amplitude over the last 24 hours is about 8.3%. First write down the current data and my judgment, then later verify it with the price action.
$GALA #GALA has not formed a clear single-direction move yet; the 1-hour and 24-hour rhythms are still tugging at each other. In this phase, focus on the boundaries of the range rather than the color of each individual candlestick.
For key levels: 0.0017095 is the central axis that must be reclaimed for a weak repair. If the price cannot get back above it, rebounds should still be treated as a technical correction. Below that, 0.001639 still has the possibility of being tested again. Only after reclaiming the central axis do we have the right to further observe 0.00178.
For execution, set clear conditions: after a breakout above 0.00178, you need confirmation—not chasing just because of a momentary surge. After a dip to 0.001639, you need to see whether it can quickly reclaim—not catching just because it looks like it’s falling. When the middle zone does not offer sufficient odds, waiting is also part of the strategy.
When reviewing the trade, I will check three things: how price reacts when it first approaches the key level, whether the 1-hour close completes confirmation, and whether the plan is adjusted according to schedule after the judgment becomes invalid. Compared with merely recording outcomes, these three items are better at revealing execution problems.
Risk control stays in front of the conclusion: execute only when the conditions appear, and reassess promptly if the price action fails. The greater the volatility, the more you must restrain your position size per trade. The above is a scenario based on the current 1-hour and 24-hour data; it does not constitute any promise of returns.
#EtherRalliesAsBearishBetsLiquidate
$GALA #GALA has not formed a clear single-direction move yet; the 1-hour and 24-hour rhythms are still tugging at each other. In this phase, focus on the boundaries of the range rather than the color of each individual candlestick.
For key levels: 0.0017095 is the central axis that must be reclaimed for a weak repair. If the price cannot get back above it, rebounds should still be treated as a technical correction. Below that, 0.001639 still has the possibility of being tested again. Only after reclaiming the central axis do we have the right to further observe 0.00178.
For execution, set clear conditions: after a breakout above 0.00178, you need confirmation—not chasing just because of a momentary surge. After a dip to 0.001639, you need to see whether it can quickly reclaim—not catching just because it looks like it’s falling. When the middle zone does not offer sufficient odds, waiting is also part of the strategy.
When reviewing the trade, I will check three things: how price reacts when it first approaches the key level, whether the 1-hour close completes confirmation, and whether the plan is adjusted according to schedule after the judgment becomes invalid. Compared with merely recording outcomes, these three items are better at revealing execution problems.
Risk control stays in front of the conclusion: execute only when the conditions appear, and reassess promptly if the price action fails. The greater the volatility, the more you must restrain your position size per trade. The above is a scenario based on the current 1-hour and 24-hour data; it does not constitute any promise of returns.
#EtherRalliesAsBearishBetsLiquidate
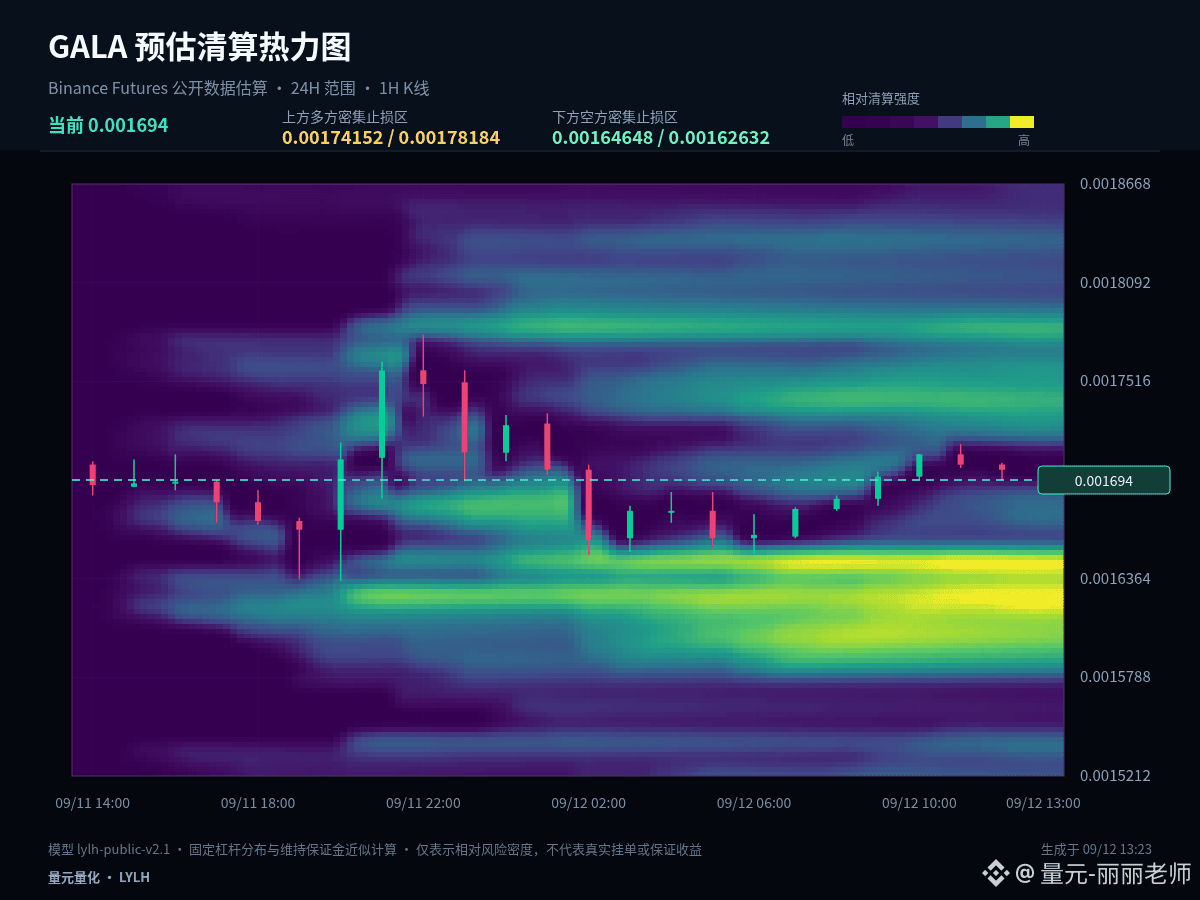
8
Log in to explore more content
Join global crypto users on Binance Square
⚡️ Get latest and useful information about crypto.
💬 Trusted by the world’s largest crypto exchange.
👍 Discover real insights from verified creators.
Email / Phone number
Trending Topics
1
#FedRateWatch
947,540 views
4,546 Discussing
2
#MSTRTradingVolumeSurpassesMorganStanley
3,915 views
176 Discussing
3
#BitcoinFalls4%
13,066 views
440 Discussing
4
#SKHynixInTalksToMakeMemoryChipsInUS
5,219 views
161 Discussing
5
#OpenAIDiscussesNewFundingAt$1.2TValuation
2,036 views
38 Discussing
6
#ArgentinaCommitsToOECDCryptoReportingBy2029
14,476 views
332 Discussing
7
#EthereumFallsBelow$2400
6,034 views
87 Discussing
8
#USDTLaunchesOnZamaPrivacyProtocol
5,980 views
189 Discussing
9
#USSenateBlocksClarityAct
49,416 views
463 Discussing
10
#BitcoinSlidesTo$76000
39,390 views
179 Discussing