

Greetings, dear friends!
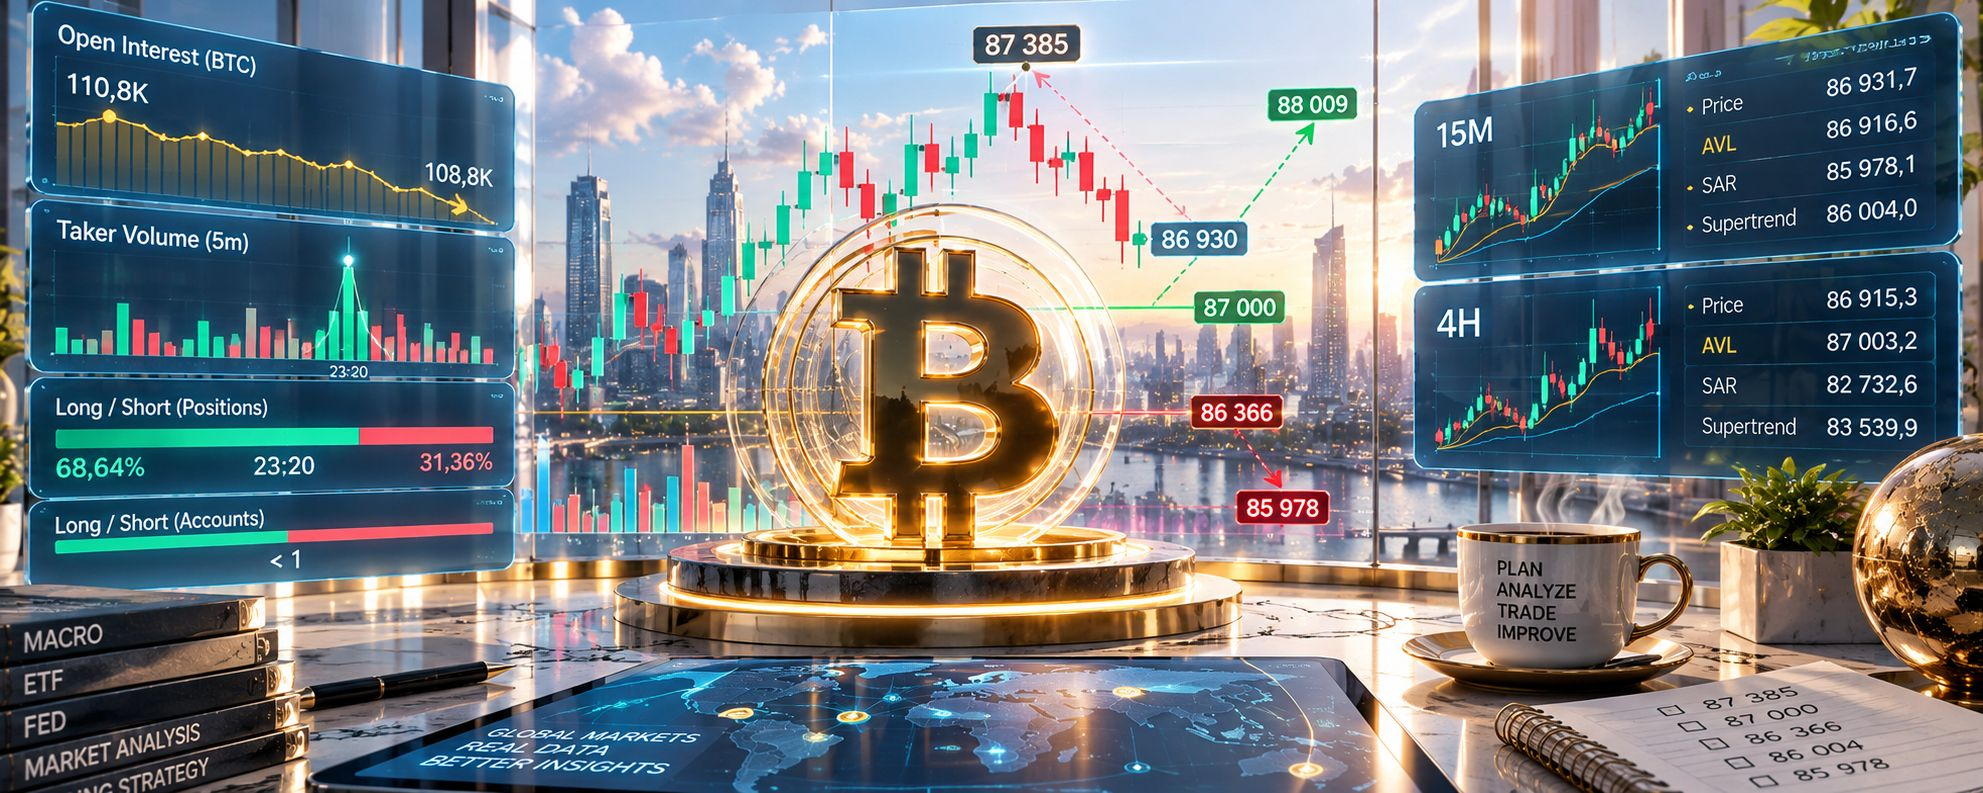
Right now $BTC is around 86 930 USDT, and the local peak on the chart is 87 385 USDT.
The main detail from the latest data: the price is rising, but over the displayed segment the open interest decreased from approximately 110.8 to 108.8 thousand BTC. That is, the price increase is accompanied by a reduction in the total number of open futures positions. From one OI alone, you cannot determine which specific positions were closed.
On the taker chart, around 23:20 there was a noticeable spike in buying. After that, volumes became mixed again. Therefore, for now it is more accurate to talk about a strong buying episode rather than constant one-sided pressure.
At the 23:30 mark, longs made up 68.64%, shorts 31.36%, and the long/short ratio was 2.19. At the same time, the ratio of longs to shorts by accounts remains below 1. This means that the distribution of the positions themselves and the number of accounts give different pictures.
On the 15M timeframe, the price is around 86 931.7; AVL is 86 916.6; SAR is 85 978.1; and Supertrend is 86 004. The price is above all three values.
On the 4H timeframe, the price is around 86 915.3, and the AVL is 87 003.2. Here, the price is currently slightly below the AVL.
Therefore, the 86 900–87 000 zone is practically significant right now: it contains the 15M AVL and the 4H AVL. The nearest recorded peak above is 87 385.
If the price holds above 87 385, the next reference point on the 4H timeframe will be the 88 009 area. If the price falls back below 86 900, the nearest level on the 15M timeframe is around 86 366; then the 86 004–85 978 zone is where Supertrend and SAR are located.
For me, the key indicator right now isn’t the price increase itself, but the combination of price + open interest. The price keeps rising, while OI over the shown segment is decreasing. So if the move continues upward, I’ll watch whether open interest starts increasing again together with the price. If that happens, the move will get confirmation from the futures market. If the price rises while OI continues to drop, then the structure of the move will be different and will require a more cautious assessment.
This is my personal opinion and analysis of market data. The material is for informational purposes only and is not financial, investment, or trading advice, nor a guide for making trades—especially using futures and leverage.