
612 Ceros
24.7k Posts

612 Ceros
 Square Verified+
Report
Block User
📊 Crypto strategist | Market signals daily | Trade smart, not emotional. Find me on X: @612Ceros
High-Frequency Trader
5 Years
13 Following
177.6K+ Followers
225.6K+ Liked
Posts
All
Quotes
PINNED
·
--
Bullish
🚀 Stop Trading in the Dark. Master Binance Futures Together—100% Free.
Navigating the volatility of Binance Futures can feel like a minefield when you're doing it alone. Between calculating leverage, managing liquidation risks, and tracking volume, the market doesn't forgive mistakes.
That’s why we built Atlas—a dedicated community for traders who want to sharpen their edge, share real setups, and actually understand the mechanics of the market.
Here is the deal: There is no catch. No hidden subscription fees. No "VIP" signal groups. No premium courses to buy. Just a collective of dedicated traders sharing actionable knowledge.
What you’ll find inside:
📊 Deep-Dive Market Analysis: Real-time breakdowns of Binance Futures trends, volume shifts, and price action.
🛡️ Risk & Leverage Management: Practical strategies to protect your capital and optimize your fee structures.
🧠 Open Knowledge Sharing: Ask questions, discuss your setups, and learn from both the wins and the losses of the community.
🤝 Zero Noise, Zero Spam: A focused environment built for serious growth, not hype.
Whether you are just starting to figure out futures mechanics or you're an experienced trader looking for a sharp community to exchange ideas with, you belong here.
Save your capital for your trades, not for trading groups.
👉 Click the link below to join me and start trading smarter today: Inviting you to join my group [612 Ceros Trading Lab](https://app.binance.com/uni-qr/5MXQ5seD)
👇 Drop a comment or send a DM if you have any trouble joining!
🚀 Stop Trading in the Dark. Master Binance Futures Together—100% Free.
Navigating the volatility of Binance Futures can feel like a minefield when you're doing it alone. Between calculating leverage, managing liquidation risks, and tracking volume, the market doesn't forgive mistakes.
That’s why we built Atlas—a dedicated community for traders who want to sharpen their edge, share real setups, and actually understand the mechanics of the market.
Here is the deal: There is no catch. No hidden subscription fees. No "VIP" signal groups. No premium courses to buy. Just a collective of dedicated traders sharing actionable knowledge.
What you’ll find inside:
📊 Deep-Dive Market Analysis: Real-time breakdowns of Binance Futures trends, volume shifts, and price action.
🛡️ Risk & Leverage Management: Practical strategies to protect your capital and optimize your fee structures.
🧠 Open Knowledge Sharing: Ask questions, discuss your setups, and learn from both the wins and the losses of the community.
🤝 Zero Noise, Zero Spam: A focused environment built for serious growth, not hype.
Whether you are just starting to figure out futures mechanics or you're an experienced trader looking for a sharp community to exchange ideas with, you belong here.
Save your capital for your trades, not for trading groups.
👉 Click the link below to join me and start trading smarter today: Inviting you to join my group 612 Ceros Trading Lab
👇 Drop a comment or send a DM if you have any trouble joining!
Navigating the volatility of Binance Futures can feel like a minefield when you're doing it alone. Between calculating leverage, managing liquidation risks, and tracking volume, the market doesn't forgive mistakes.
That’s why we built Atlas—a dedicated community for traders who want to sharpen their edge, share real setups, and actually understand the mechanics of the market.
Here is the deal: There is no catch. No hidden subscription fees. No "VIP" signal groups. No premium courses to buy. Just a collective of dedicated traders sharing actionable knowledge.
What you’ll find inside:
📊 Deep-Dive Market Analysis: Real-time breakdowns of Binance Futures trends, volume shifts, and price action.
🛡️ Risk & Leverage Management: Practical strategies to protect your capital and optimize your fee structures.
🧠 Open Knowledge Sharing: Ask questions, discuss your setups, and learn from both the wins and the losses of the community.
🤝 Zero Noise, Zero Spam: A focused environment built for serious growth, not hype.
Whether you are just starting to figure out futures mechanics or you're an experienced trader looking for a sharp community to exchange ideas with, you belong here.
Save your capital for your trades, not for trading groups.
👉 Click the link below to join me and start trading smarter today: Inviting you to join my group 612 Ceros Trading Lab
👇 Drop a comment or send a DM if you have any trouble joining!
20
1
17
3.7k
·
--
Bearish
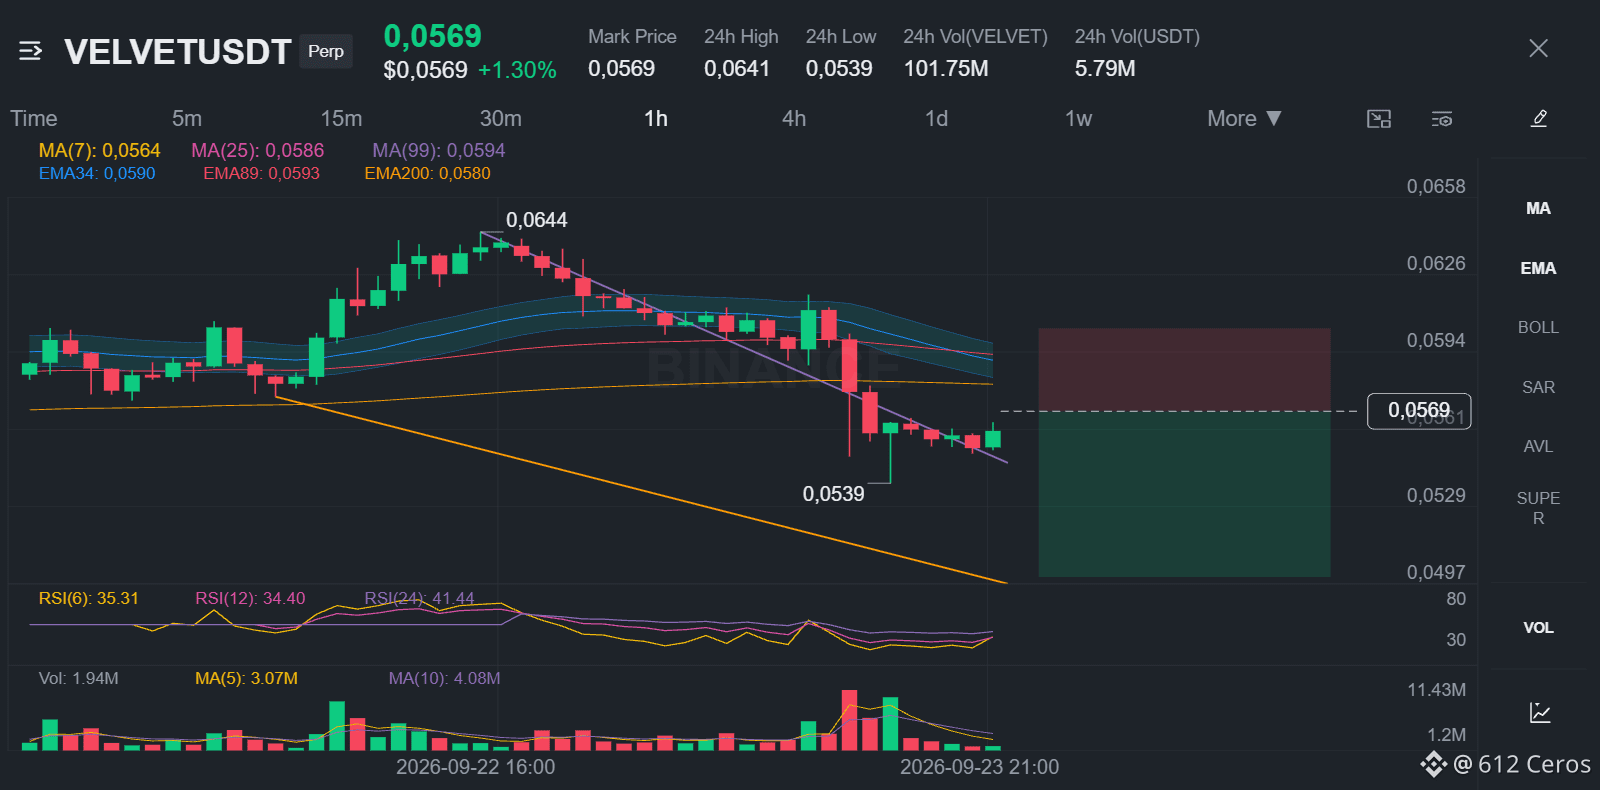
Everyone is still calling VELVET a bounce play
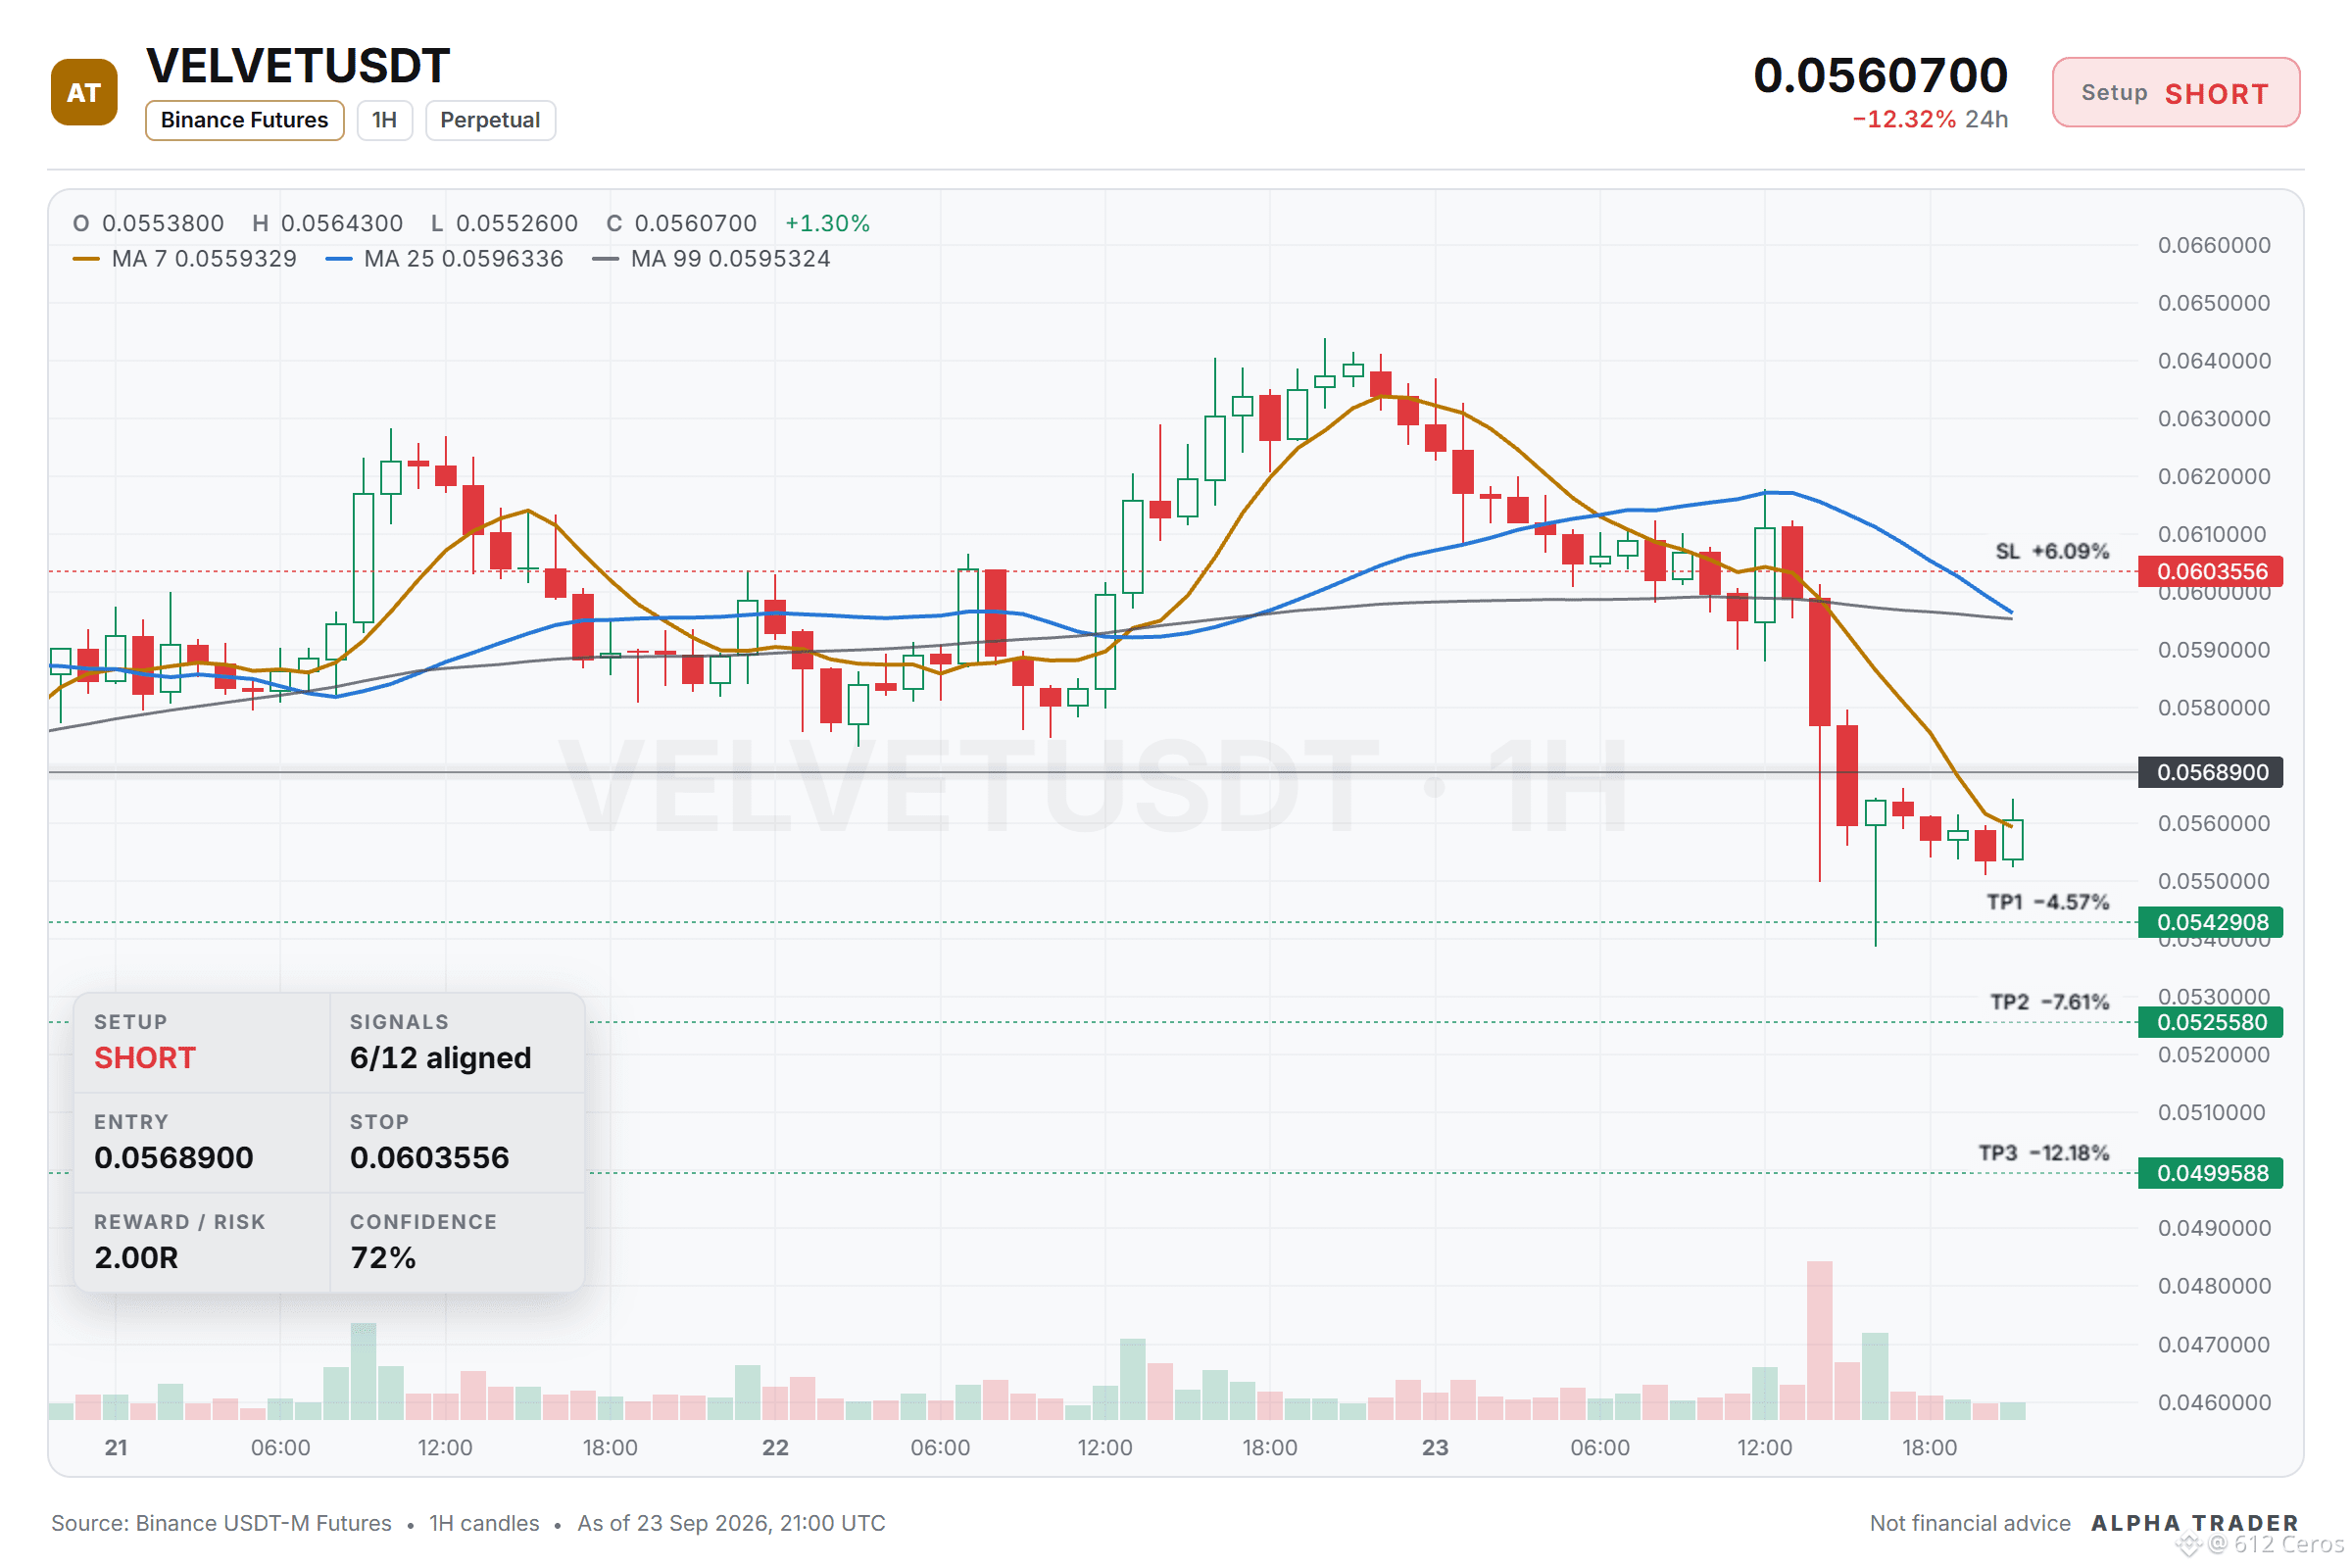
$VELVET /USDT - 🔴 Bias: SHORT (Strong) · 6/12 signals aligned
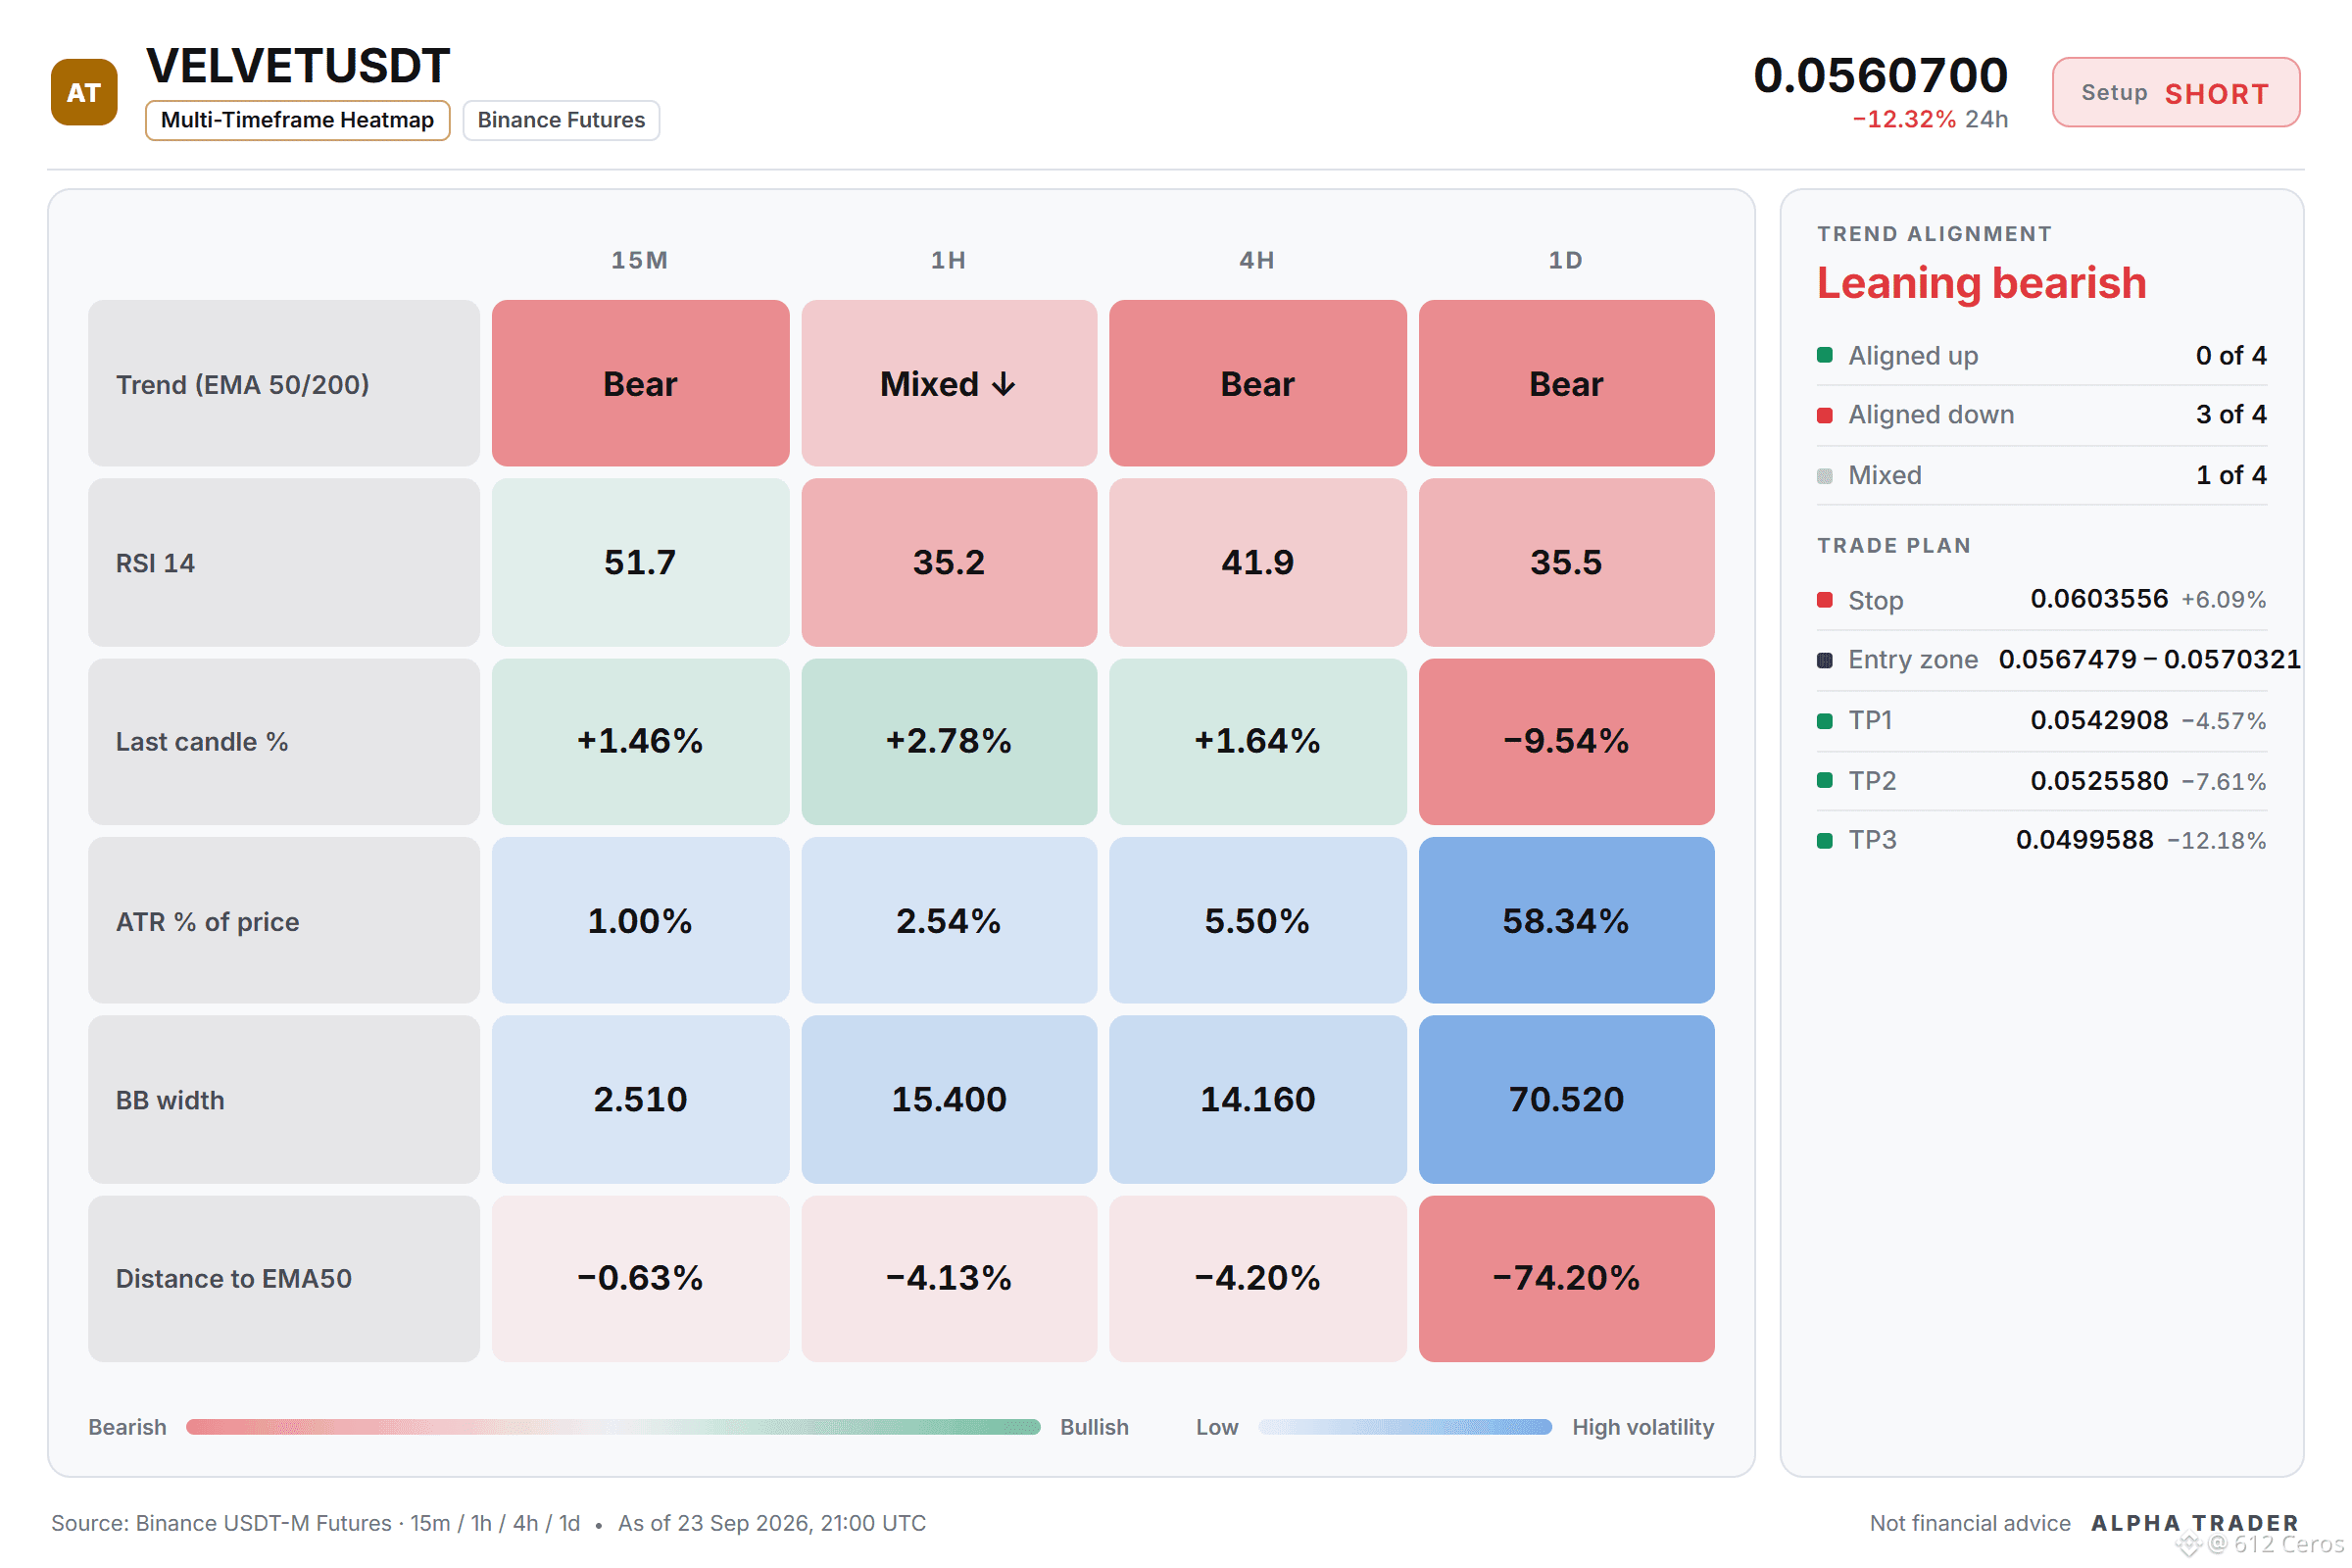
Pre-trade checklist: 6/12 signals aligned
🟢 Daily trend: price < EMA50 < EMA200, bearish stack
🟢 4h trend: price < EMA50 < EMA200, bearish stack
🟢 Trend strength (ADX/DI, 15m): ADX 44.1 with sellers in control (DI+ 22.0 vs DI− 24.2)
🟢 4h RSI: 41.9, bearish momentum (below 45)
🟢 1h RSI: 35.2, bearish momentum (below 45)
🟠 Short-term momentum (15m): RSI z-score +2.72, last candle +1.46%, buyers pressing
🟠 Invalidation: the idea is wrong beyond 0.0609525
Verdict: The setup has strong daily and 4h bearish stacked EMAs with ADX 44.1 and RSI 35.2 on the 1h, but the 15m RSI z-score of +2.72 shows aggressive short-term buying.
📍 Entry: 0.0567479 – 0.0570321
🎯 TP1: 0.0542908 | TP2: 0.0525580 | TP3: 0.0499588
🛑 SL: 0.0603556
💬 Where are you taking profit on a VELVET short, and what level would make you cover?
Levels mapped on the chart below 👇
{future}(VELVETUSDT)
📲 Want more of my latest signals? Join me here:
[https://app.binance.com/uni-qr/D26WbL9t](https://app.binance.com/uni-qr/D26WbL9t)
⚠️ Personal market analysis only. NFA — manage risk and DYOR.
Educational content, not investment advice or a recommendation to buy, sell, deposit, or withdraw any asset. No paid promotion; the invite link above is my own referral link, and I may earn a commission if you sign up through it — at no extra cost to you.
Everyone is still calling VELVET a bounce play
$VELVET /USDT - 🔴 Bias: SHORT (Strong) · 6/12 signals aligned
Pre-trade checklist: 6/12 signals aligned
🟢 Daily trend: price < EMA50 < EMA200, bearish stack
🟢 4h trend: price < EMA50 < EMA200, bearish stack
🟢 Trend strength (ADX/DI, 15m): ADX 44.1 with sellers in control (DI+ 22.0 vs DI− 24.2)
🟢 4h RSI: 41.9, bearish momentum (below 45)
🟢 1h RSI: 35.2, bearish momentum (below 45)
🟠 Short-term momentum (15m): RSI z-score +2.72, last candle +1.46%, buyers pressing
🟠 Invalidation: the idea is wrong beyond 0.0609525
Verdict: The setup has strong daily and 4h bearish stacked EMAs with ADX 44.1 and RSI 35.2 on the 1h, but the 15m RSI z-score of +2.72 shows aggressive short-term buying.
📍 Entry: 0.0567479 – 0.0570321
🎯 TP1: 0.0542908 | TP2: 0.0525580 | TP3: 0.0499588
🛑 SL: 0.0603556
💬 Where are you taking profit on a VELVET short, and what level would make you cover?
Levels mapped on the chart below 👇
📲 Want more of my latest signals? Join me here:
https://app.binance.com/uni-qr/D26WbL9t
⚠️ Personal market analysis only. NFA — manage risk and DYOR.
Educational content, not investment advice or a recommendation to buy, sell, deposit, or withdraw any asset. No paid promotion; the invite link above is my own referral link, and I may earn a commission if you sign up through it — at no extra cost to you.
$VELVET /USDT - 🔴 Bias: SHORT (Strong) · 6/12 signals aligned
Pre-trade checklist: 6/12 signals aligned
🟢 Daily trend: price < EMA50 < EMA200, bearish stack
🟢 4h trend: price < EMA50 < EMA200, bearish stack
🟢 Trend strength (ADX/DI, 15m): ADX 44.1 with sellers in control (DI+ 22.0 vs DI− 24.2)
🟢 4h RSI: 41.9, bearish momentum (below 45)
🟢 1h RSI: 35.2, bearish momentum (below 45)
🟠 Short-term momentum (15m): RSI z-score +2.72, last candle +1.46%, buyers pressing
🟠 Invalidation: the idea is wrong beyond 0.0609525
Verdict: The setup has strong daily and 4h bearish stacked EMAs with ADX 44.1 and RSI 35.2 on the 1h, but the 15m RSI z-score of +2.72 shows aggressive short-term buying.
📍 Entry: 0.0567479 – 0.0570321
🎯 TP1: 0.0542908 | TP2: 0.0525580 | TP3: 0.0499588
🛑 SL: 0.0603556
💬 Where are you taking profit on a VELVET short, and what level would make you cover?
Levels mapped on the chart below 👇
📲 Want more of my latest signals? Join me here:
https://app.binance.com/uni-qr/D26WbL9t
⚠️ Personal market analysis only. NFA — manage risk and DYOR.
Educational content, not investment advice or a recommendation to buy, sell, deposit, or withdraw any asset. No paid promotion; the invite link above is my own referral link, and I may earn a commission if you sign up through it — at no extra cost to you.
572
·
--
Bearish
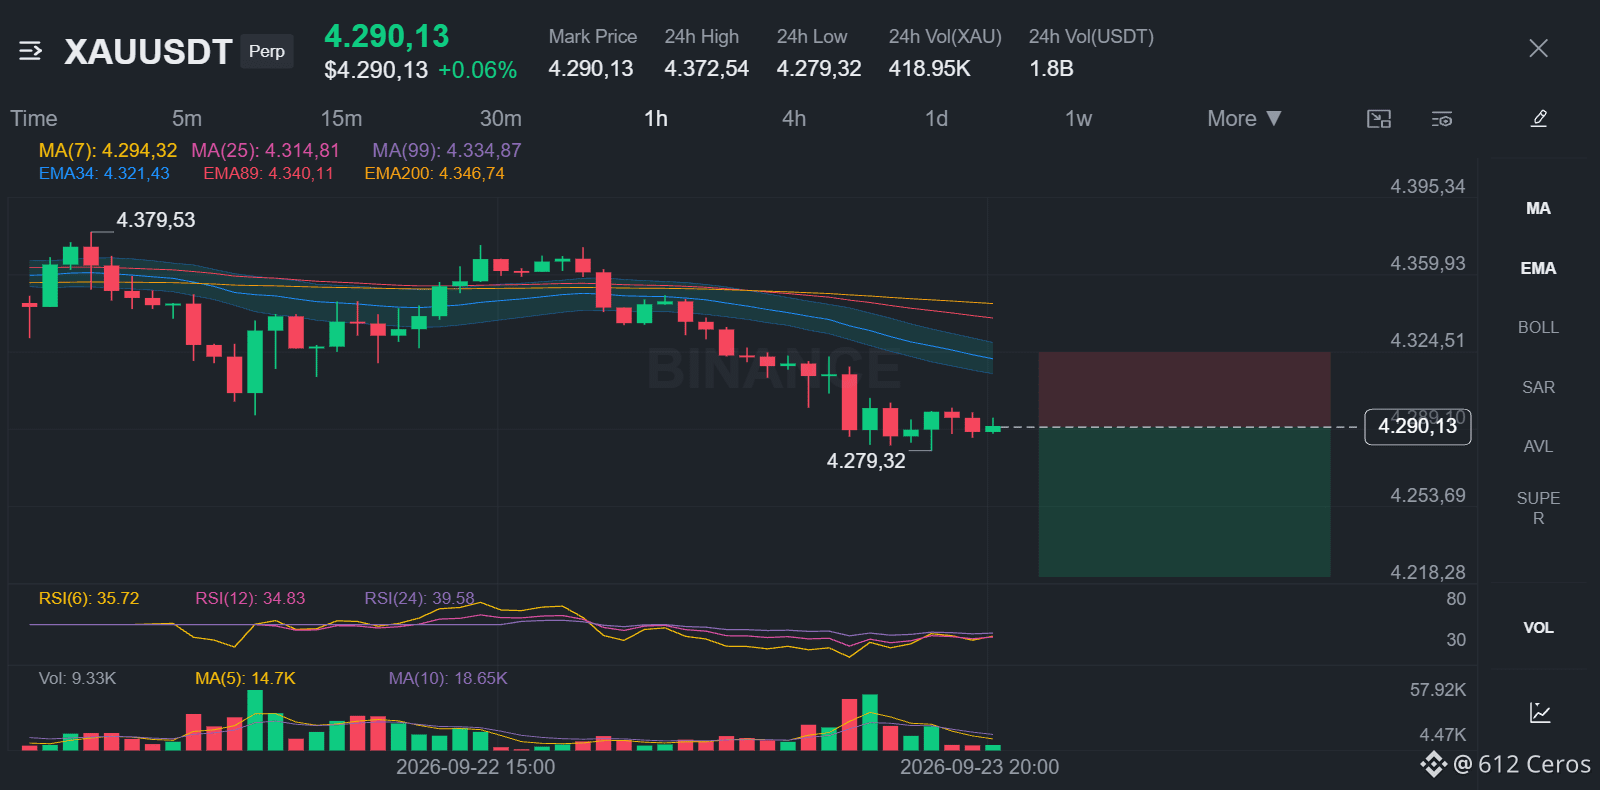
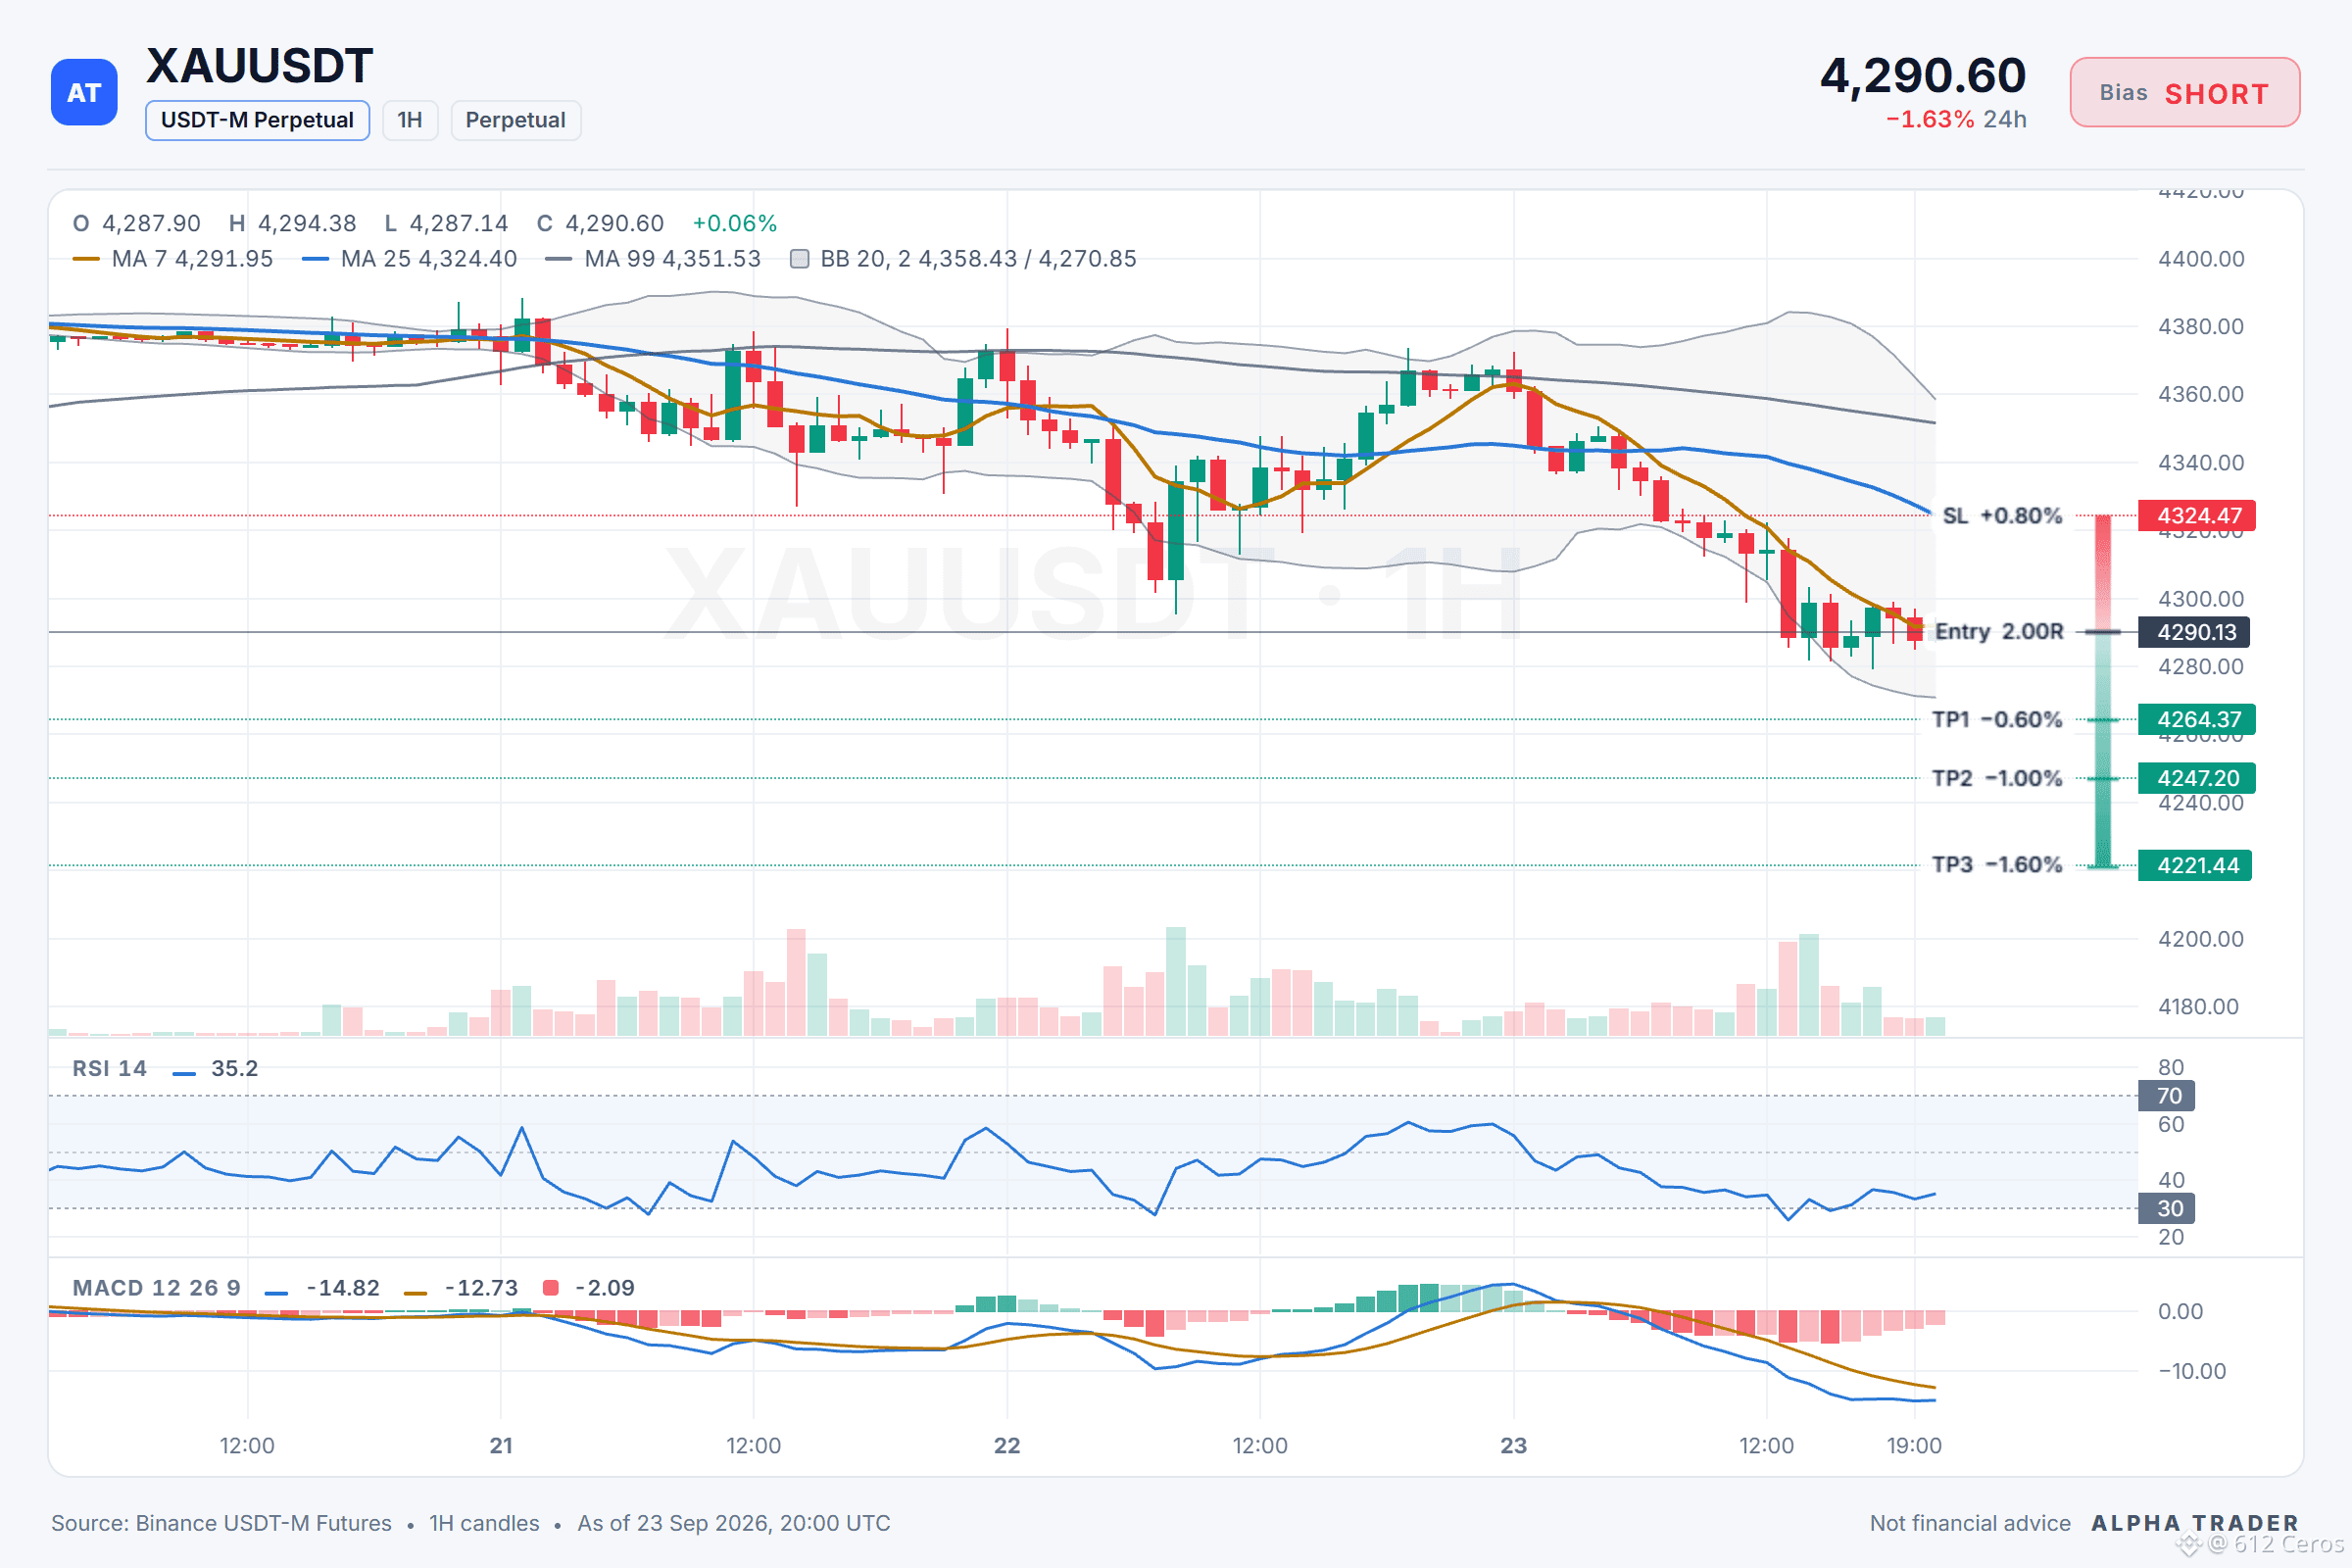
XAU is sliding through all three stacked daily moving averages.
🔴 $XAU /USDT | Bias: SHORT (Strong) | 6/12 signals aligned
Technical verdict: STRONG SHORT. 6 of 12 signals aligned, 0 against.
What supports it (6):
• Daily trend: price < EMA50 < EMA200, bearish stack
• 4h trend: price < EMA50 < EMA200, bearish stack
• 1h trend: price < EMA50 < EMA200, bearish stack
• Trend strength (ADX/DI, 15m): ADX 21.0 with sellers in control (DI+ 16.9 vs DI− 22.5)
No factor points the other way right now.
XAU in 4 points 🧵
1/4 The daily trend is bearish, with price below the EMA50 and EMA200.
2/4 The 4h trend is bearish, with price below the EMA50 and EMA200.
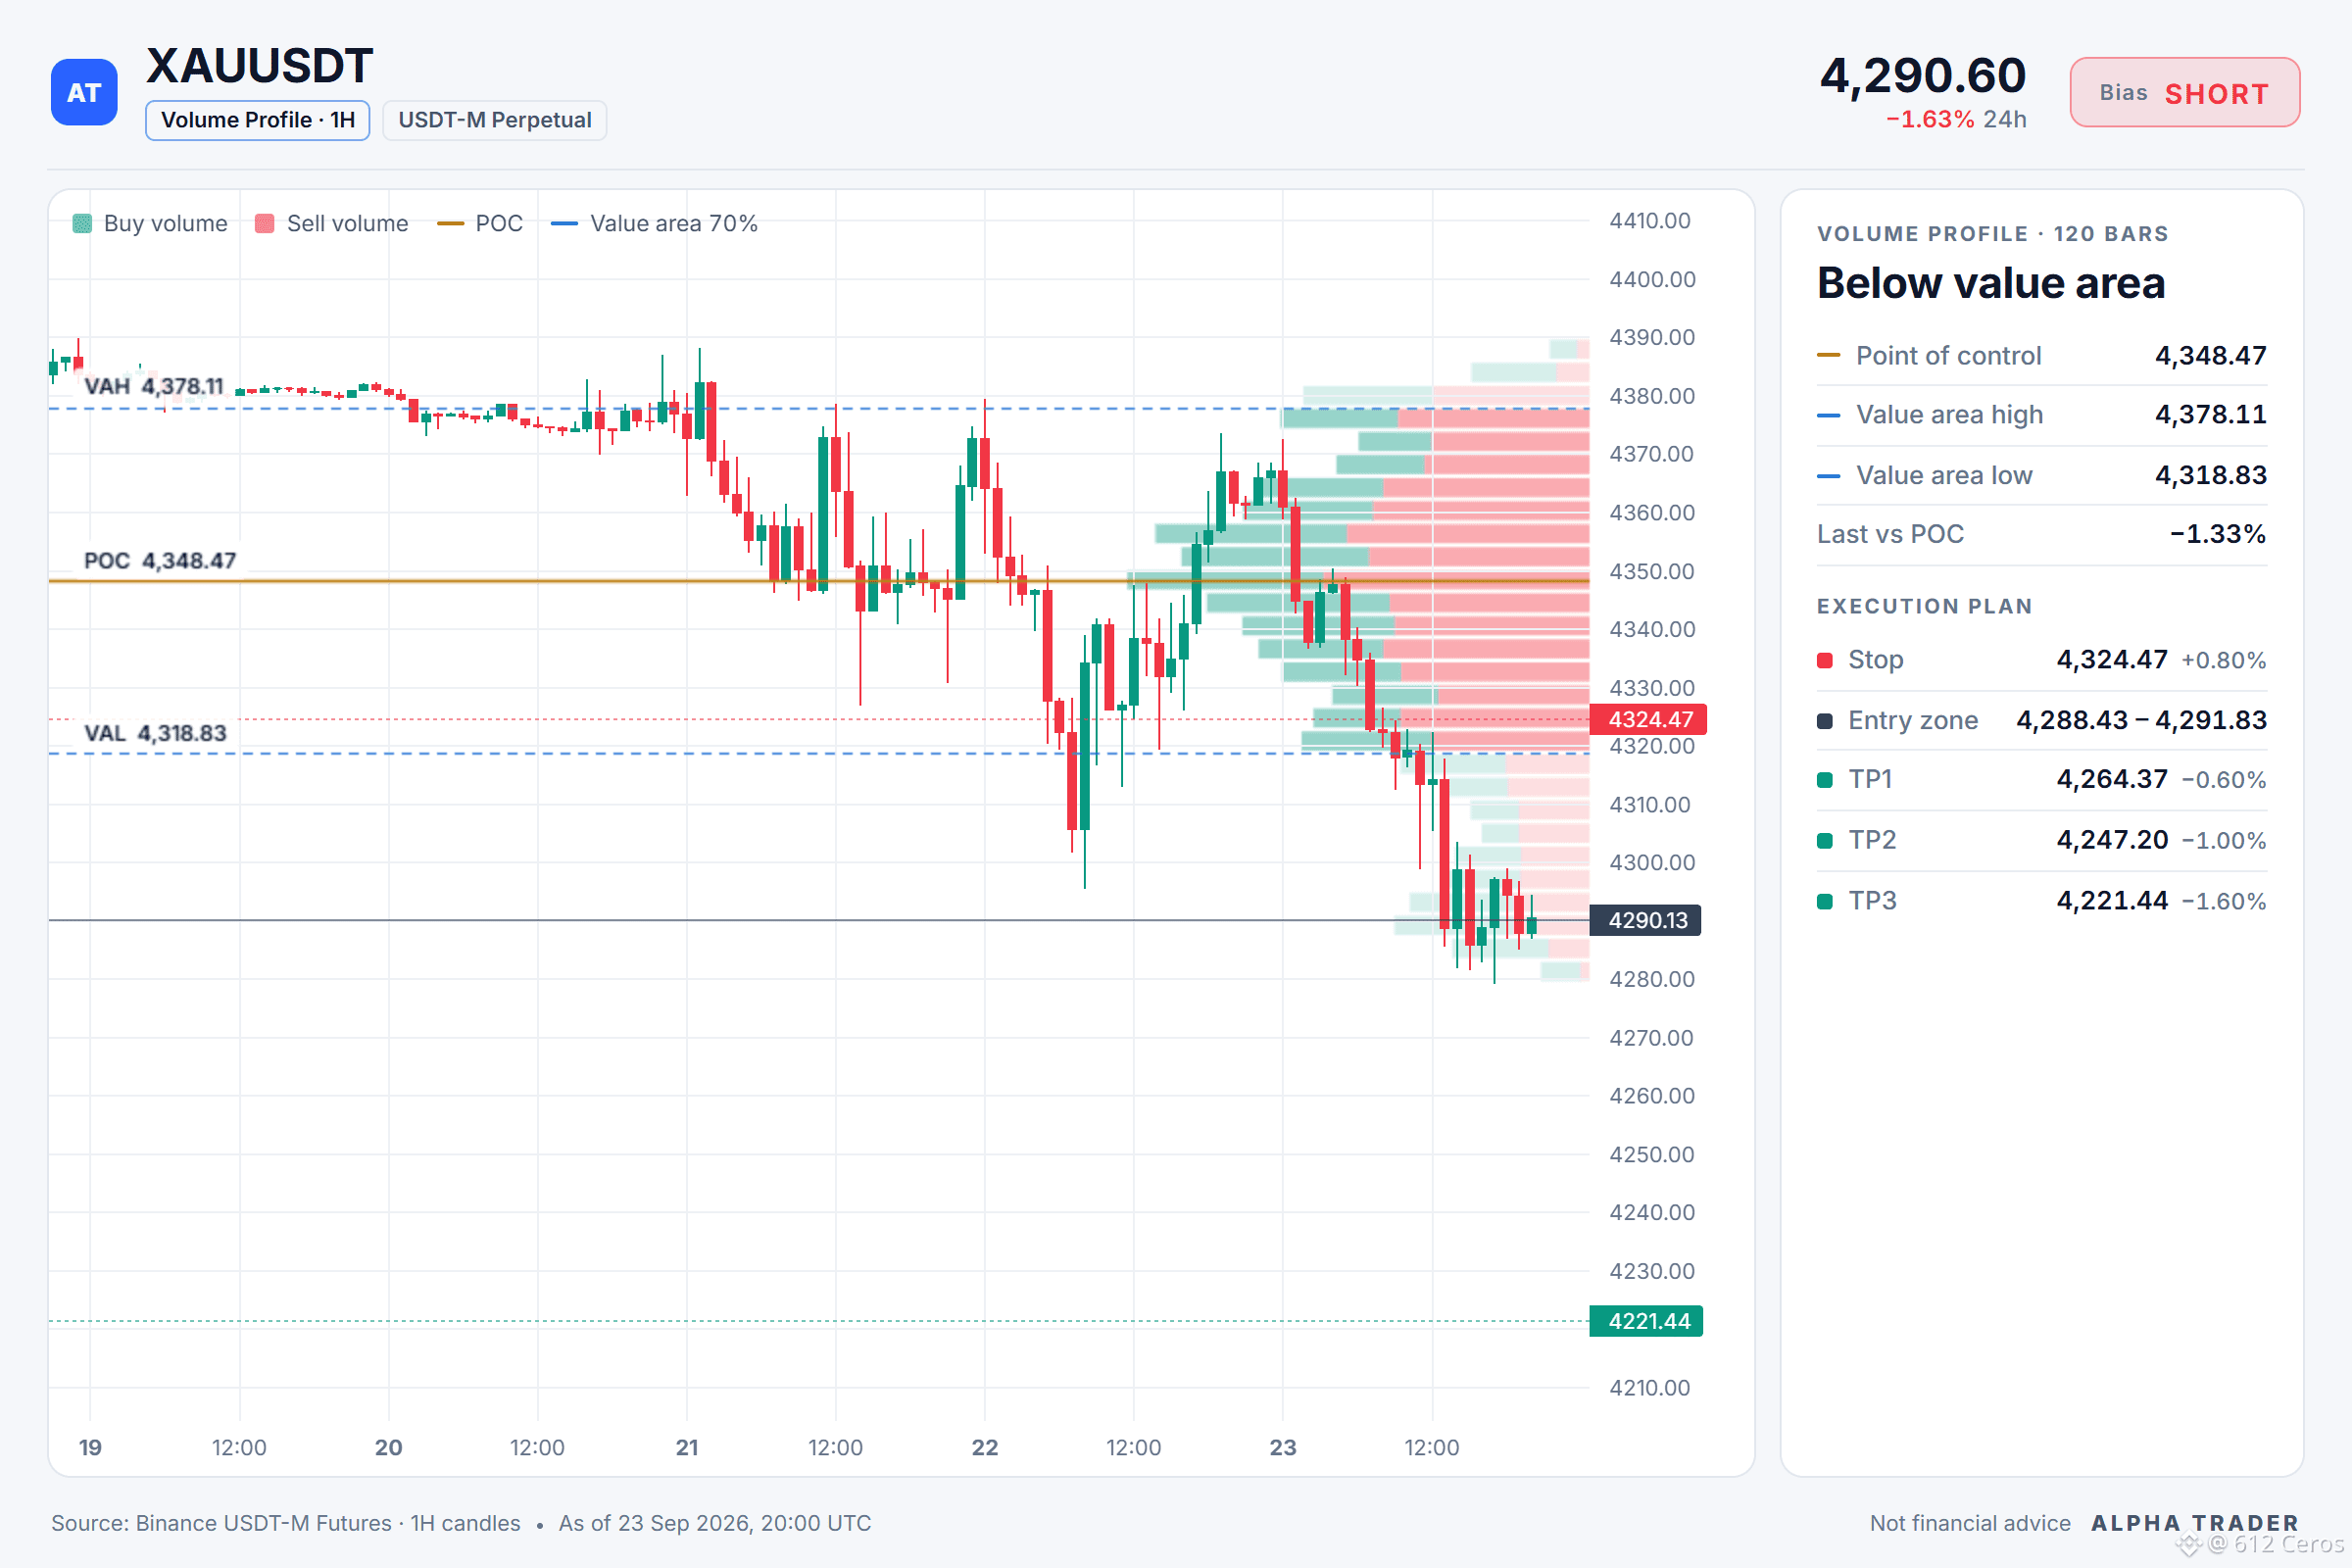
3/4 Entry at 4290.13 with targets at 4264.37, 4247.20, and 4221.44.
4/4 Invalidation is a daily close above 4362.81.
The plan:
Entry: 4288.43 – 4291.83
SL: 4324.47
TP1: 4264.37
TP2: 4247.20
TP3: 4221.44
Over to you:
What is your invalidation level for this daily XAU short setup?
See it on the chart 👇
{future}(XAUUSDT)
📲 Want more of my latest signals? Join me here:
[https://app.binance.com/uni-qr/D26WbL9t](https://app.binance.com/uni-qr/D26WbL9t)
⚠️ Personal market analysis only. NFA — manage risk and DYOR.
Educational content, not investment advice or a recommendation to buy, sell, deposit, or withdraw any asset. No paid promotion; the invite link above is my own referral link, and I may earn a commission if you sign up through it — at no extra cost to you.
XAU is sliding through all three stacked daily moving averages.
🔴 $XAU /USDT | Bias: SHORT (Strong) | 6/12 signals aligned
Technical verdict: STRONG SHORT. 6 of 12 signals aligned, 0 against.
What supports it (6):
• Daily trend: price < EMA50 < EMA200, bearish stack
• 4h trend: price < EMA50 < EMA200, bearish stack
• 1h trend: price < EMA50 < EMA200, bearish stack
• Trend strength (ADX/DI, 15m): ADX 21.0 with sellers in control (DI+ 16.9 vs DI− 22.5)
No factor points the other way right now.
XAU in 4 points 🧵
1/4 The daily trend is bearish, with price below the EMA50 and EMA200.
2/4 The 4h trend is bearish, with price below the EMA50 and EMA200.
3/4 Entry at 4290.13 with targets at 4264.37, 4247.20, and 4221.44.
4/4 Invalidation is a daily close above 4362.81.
The plan:
Entry: 4288.43 – 4291.83
SL: 4324.47
TP1: 4264.37
TP2: 4247.20
TP3: 4221.44
Over to you:
What is your invalidation level for this daily XAU short setup?
See it on the chart 👇
📲 Want more of my latest signals? Join me here:
https://app.binance.com/uni-qr/D26WbL9t
⚠️ Personal market analysis only. NFA — manage risk and DYOR.
Educational content, not investment advice or a recommendation to buy, sell, deposit, or withdraw any asset. No paid promotion; the invite link above is my own referral link, and I may earn a commission if you sign up through it — at no extra cost to you.
🔴 $XAU /USDT | Bias: SHORT (Strong) | 6/12 signals aligned
Technical verdict: STRONG SHORT. 6 of 12 signals aligned, 0 against.
What supports it (6):
• Daily trend: price < EMA50 < EMA200, bearish stack
• 4h trend: price < EMA50 < EMA200, bearish stack
• 1h trend: price < EMA50 < EMA200, bearish stack
• Trend strength (ADX/DI, 15m): ADX 21.0 with sellers in control (DI+ 16.9 vs DI− 22.5)
No factor points the other way right now.
XAU in 4 points 🧵
1/4 The daily trend is bearish, with price below the EMA50 and EMA200.
2/4 The 4h trend is bearish, with price below the EMA50 and EMA200.
3/4 Entry at 4290.13 with targets at 4264.37, 4247.20, and 4221.44.
4/4 Invalidation is a daily close above 4362.81.
The plan:
Entry: 4288.43 – 4291.83
SL: 4324.47
TP1: 4264.37
TP2: 4247.20
TP3: 4221.44
Over to you:
What is your invalidation level for this daily XAU short setup?
See it on the chart 👇
📲 Want more of my latest signals? Join me here:
https://app.binance.com/uni-qr/D26WbL9t
⚠️ Personal market analysis only. NFA — manage risk and DYOR.
Educational content, not investment advice or a recommendation to buy, sell, deposit, or withdraw any asset. No paid promotion; the invite link above is my own referral link, and I may earn a commission if you sign up through it — at no extra cost to you.
1
931
·
--
Bearish
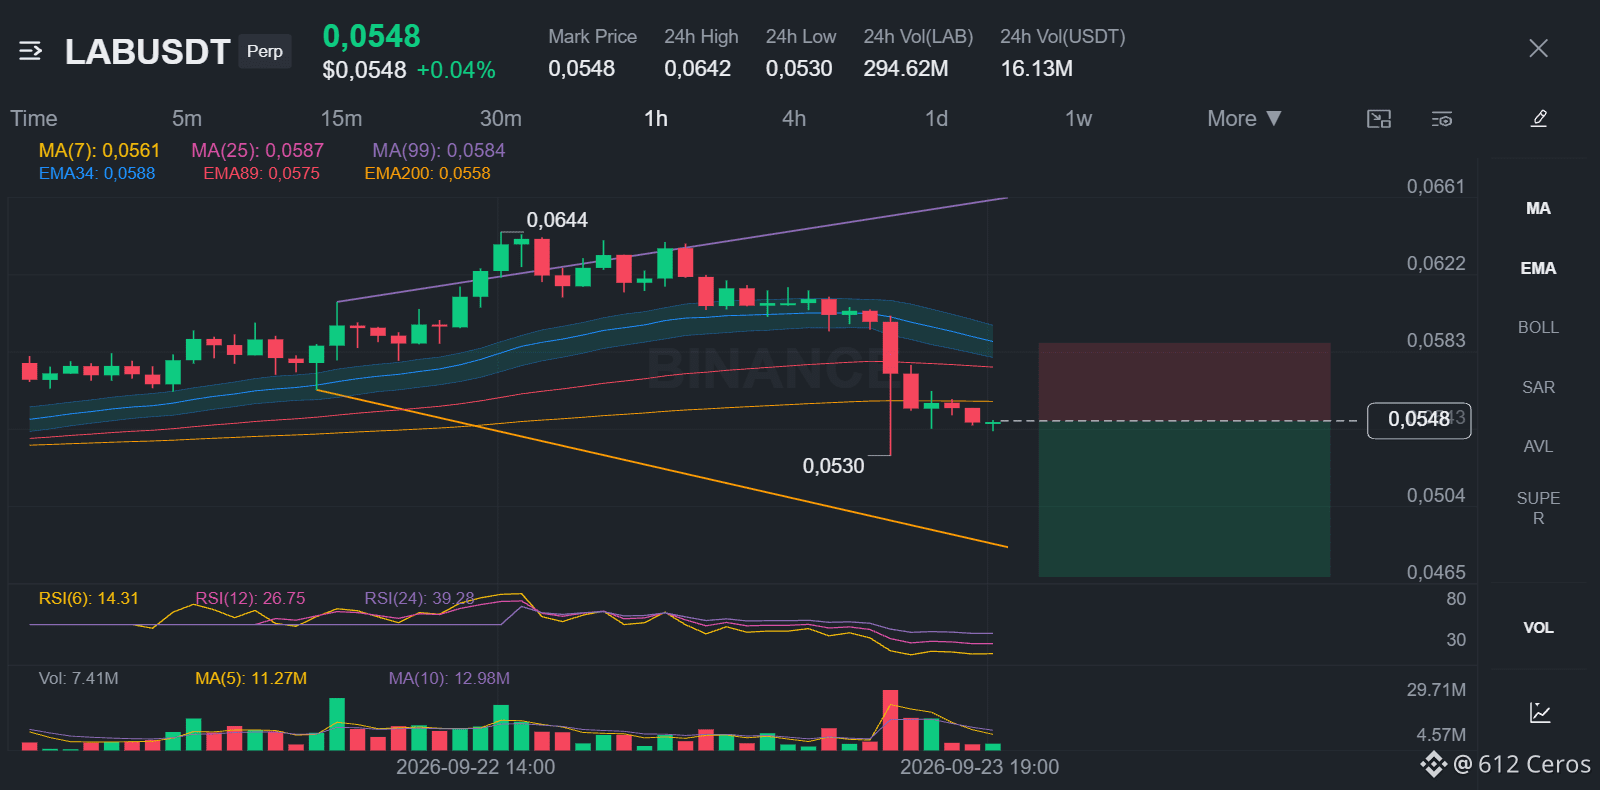
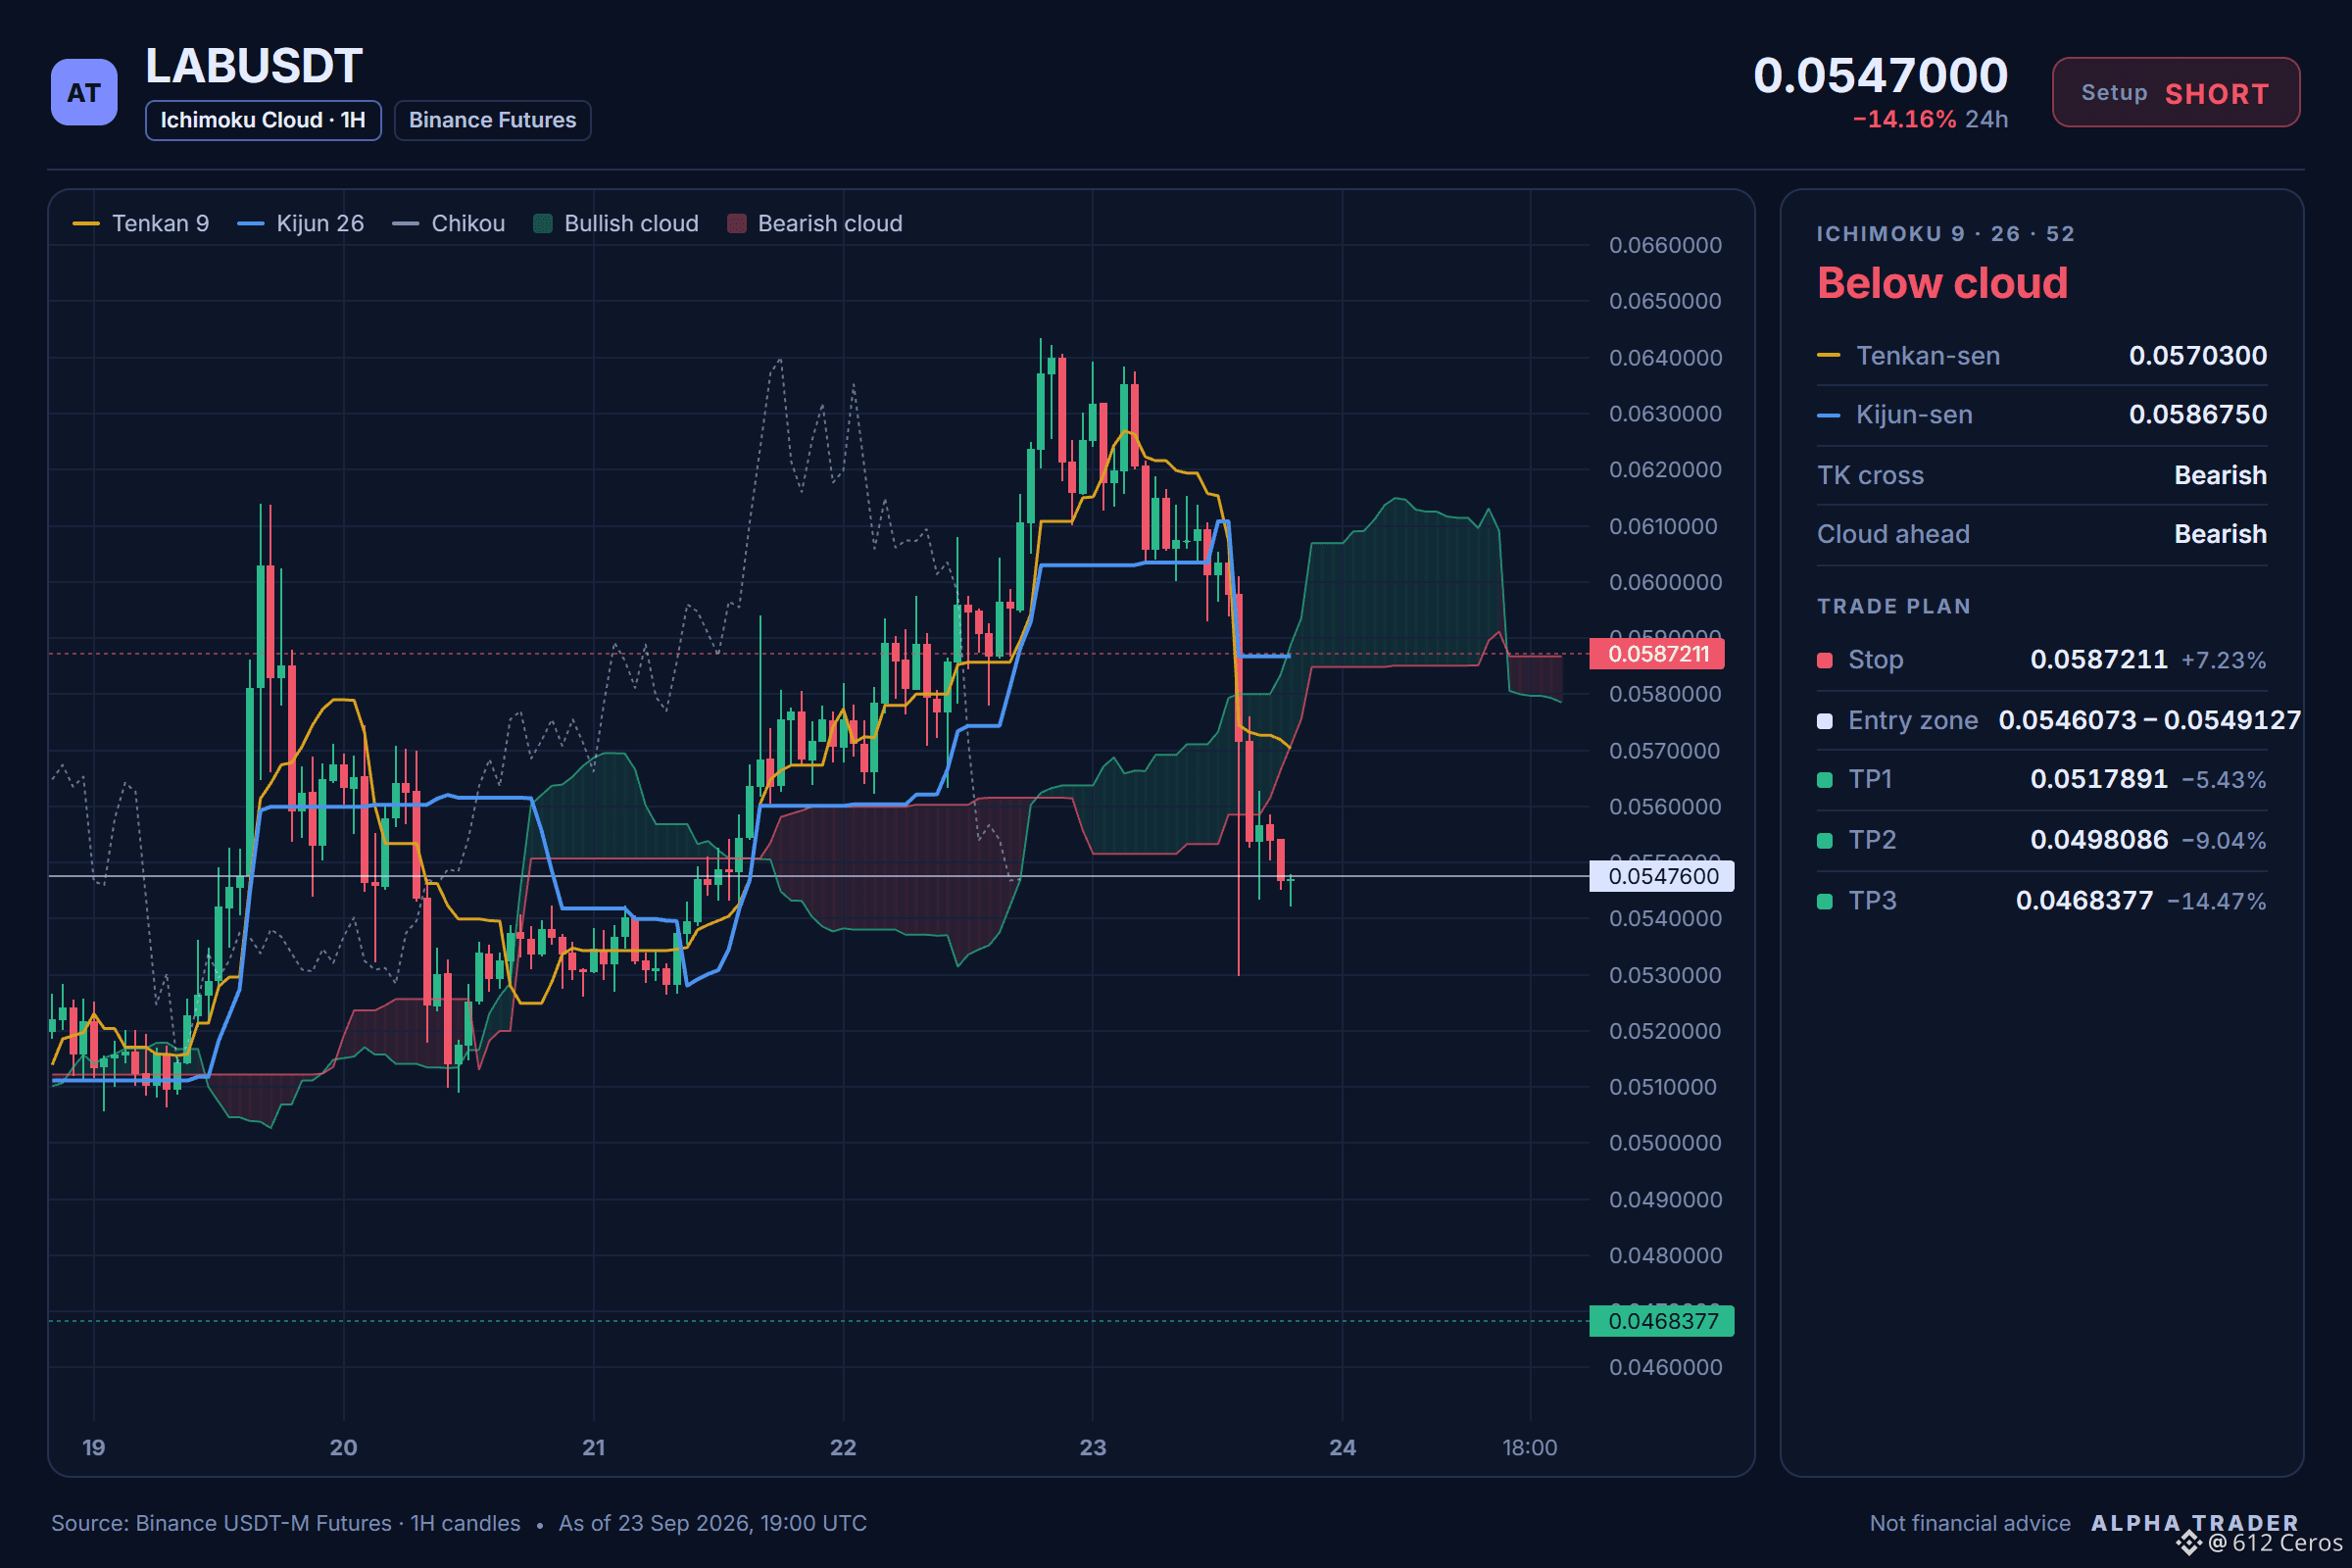
LAB looks weak on the daily, but is the short timing right.
📊 $LAB /USDT · Bias: SHORT (Strong) · 6/12 signals aligned
Technical verdict: STRONG SHORT. 6 of 12 signals aligned, 0 against.
✅ Daily trend: price < EMA50 < EMA200, bearish stack
✅ 4h trend: price < EMA50 < EMA200, bearish stack
✅ Trend strength (ADX/DI, 15m): ADX 66.2 with sellers in control (DI+ 7.8 vs DI− 35.8)
✅ 4h RSI: 44.1, bearish momentum (below 45)
No factor points the other way right now.
🤔 Why short LAB when the daily trend is already bearish?</Q>
💡 The daily trend is bearish with price below both the EMA50 and EMA200, and the 4h trend confirms the same stacked bearish structure.
🤔 Where exactly is the entry zone for the LAB short?</Q>
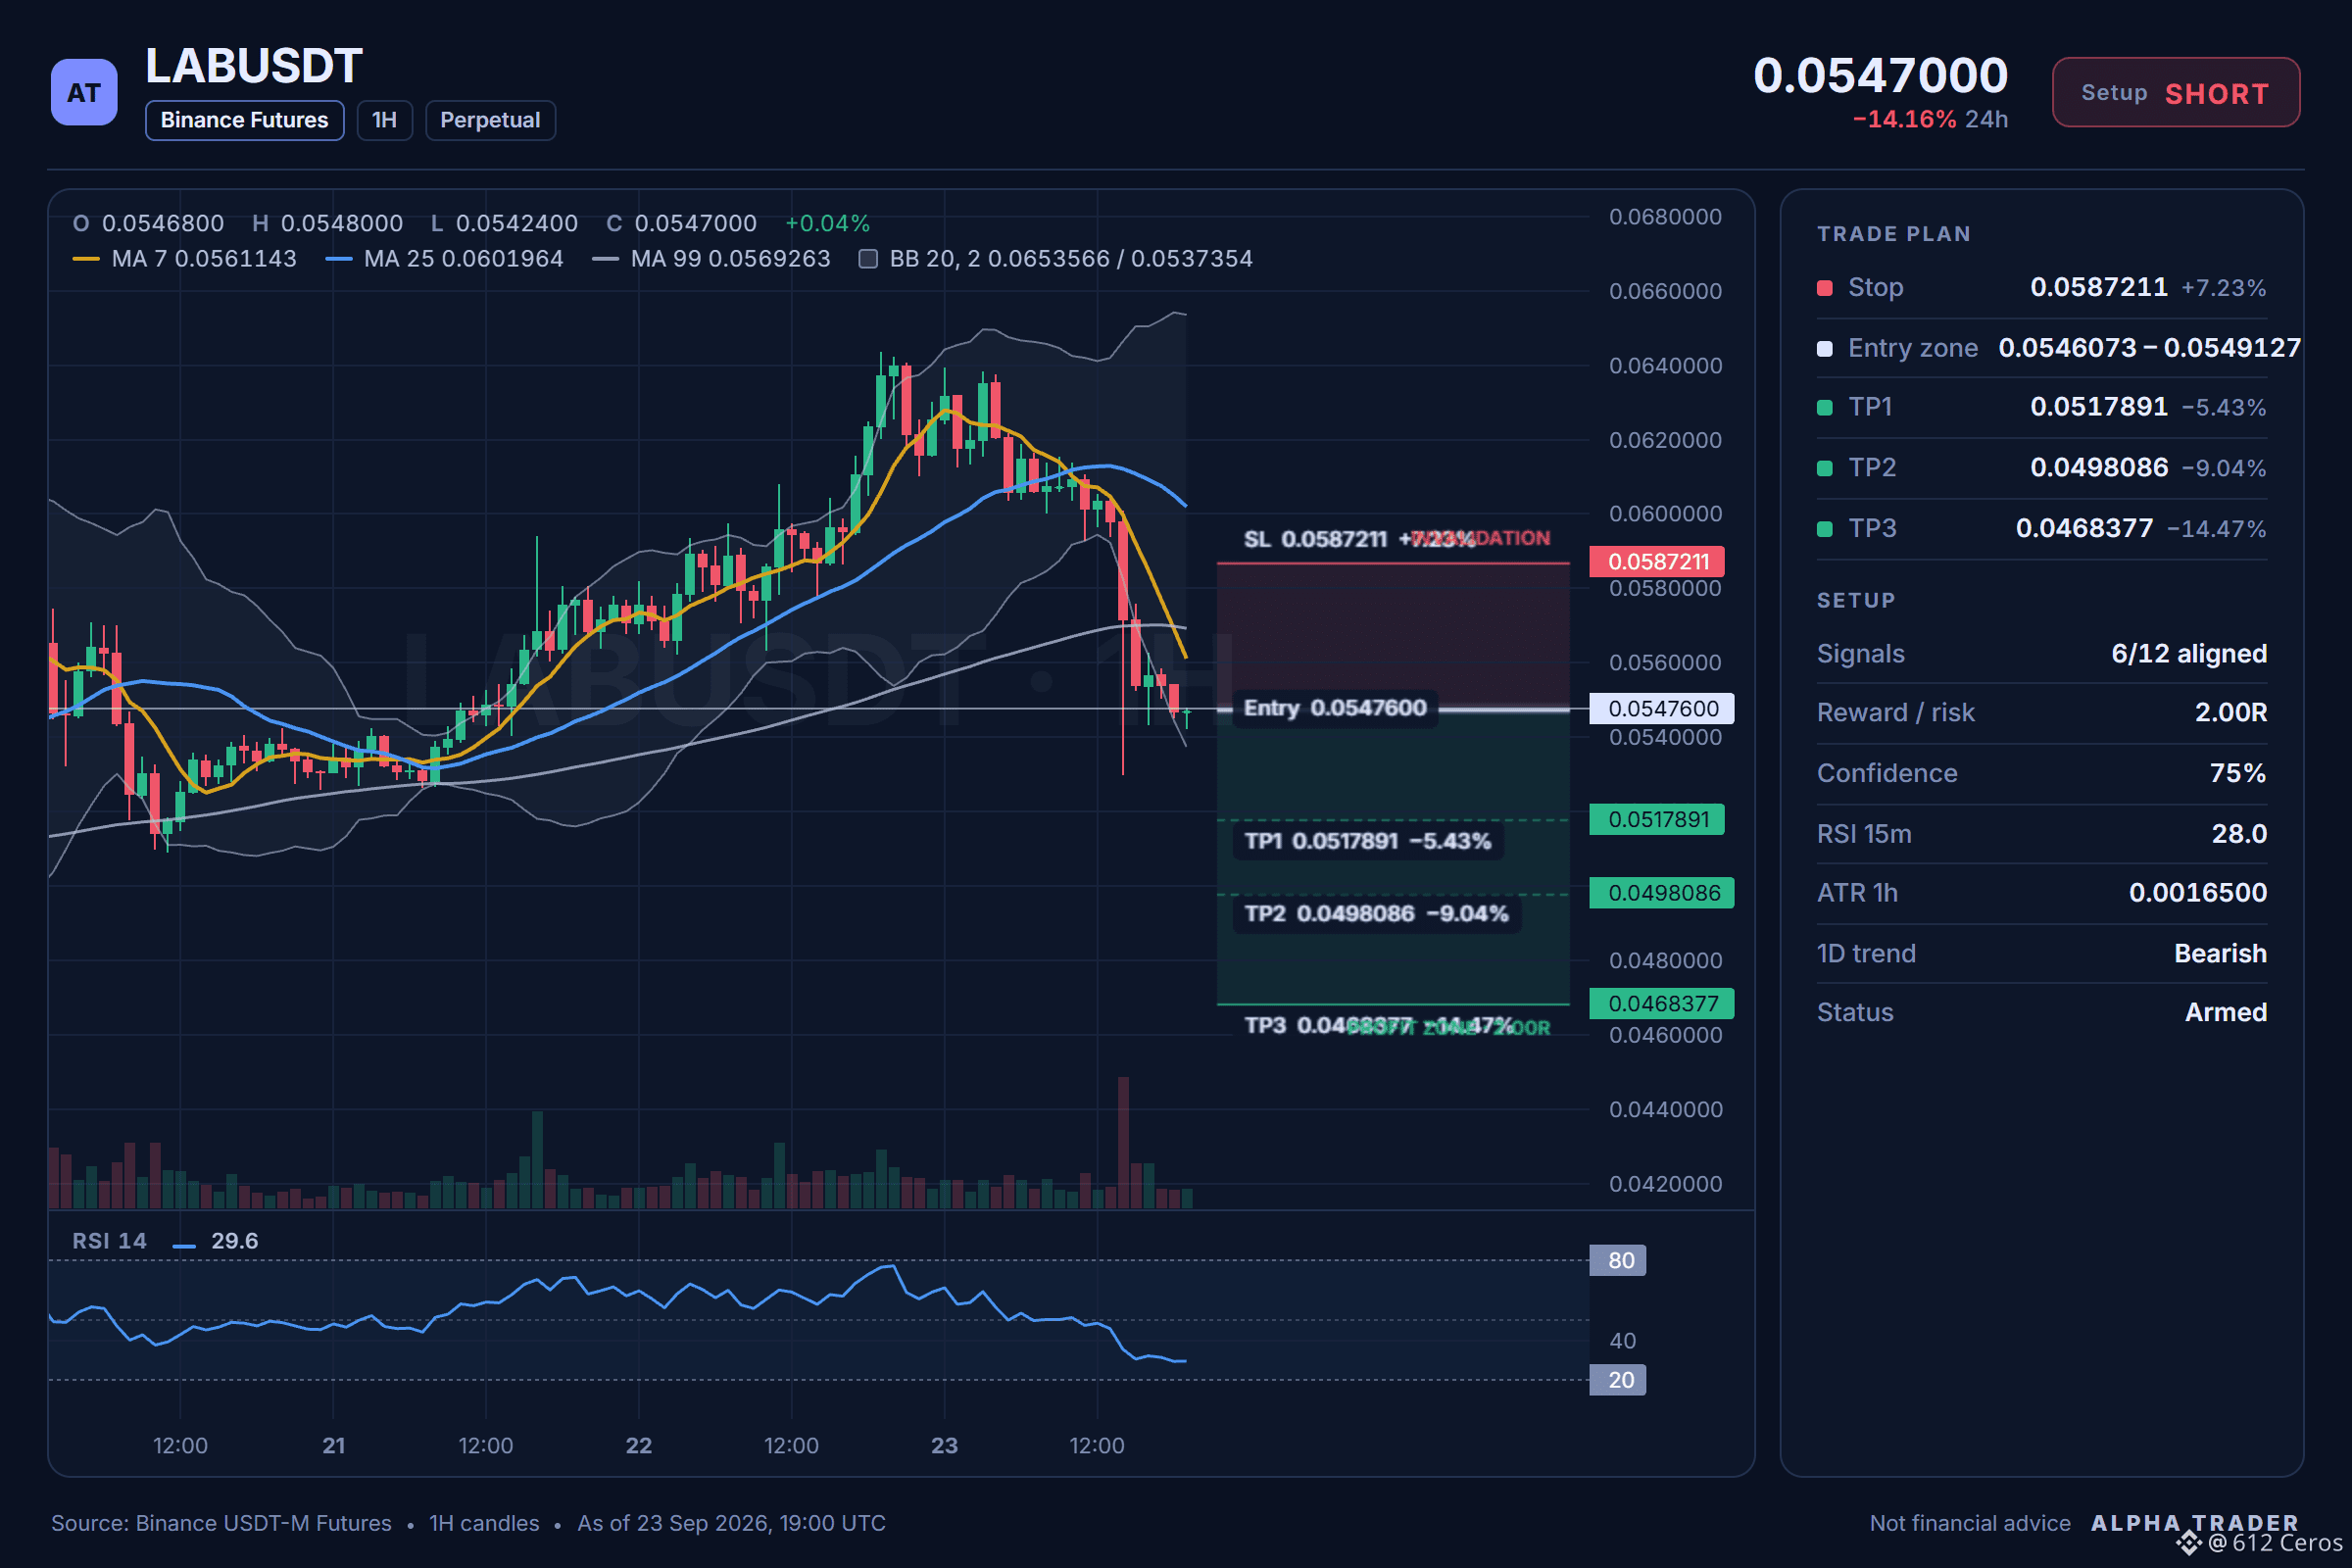
💡 The 1h price sits at 0.0547600, with the entry range between 0.0546073 and 0.0549127, so you can fade any micro bounce into the short.
🤔 When does this LAB short become invalid?</Q>
💡 A close back above 0.0581105 invalidates the setup, because that level sits above the entry high and the stacked daily EMAs.
The plan:
Entry: 0.0546073 – 0.0549127
SL: 0.0587211
TP1: 0.0517891
TP2: 0.0498086
TP3: 0.0468377
Over to you:
Where is your level on LAB right now, and would you wait for a close below the 1h price before joining the short?
Click here to view the chart 👇️
{future}(LABUSDT)
📲 Want more of my latest signals? Join me here:
[https://app.binance.com/uni-qr/D26WbL9t](https://app.binance.com/uni-qr/D26WbL9t)
⚠️ Personal market analysis only. NFA — manage risk and DYOR.
Educational content, not investment advice or a recommendation to buy, sell, deposit, or withdraw any asset. No paid promotion; the invite link above is my own referral link, and I may earn a commission if you sign up through it — at no extra cost to you.
LAB looks weak on the daily, but is the short timing right.
📊 $LAB /USDT · Bias: SHORT (Strong) · 6/12 signals aligned
Technical verdict: STRONG SHORT. 6 of 12 signals aligned, 0 against.
✅ Daily trend: price < EMA50 < EMA200, bearish stack
✅ 4h trend: price < EMA50 < EMA200, bearish stack
✅ Trend strength (ADX/DI, 15m): ADX 66.2 with sellers in control (DI+ 7.8 vs DI− 35.8)
✅ 4h RSI: 44.1, bearish momentum (below 45)
No factor points the other way right now.
🤔 Why short LAB when the daily trend is already bearish?</Q>
💡 The daily trend is bearish with price below both the EMA50 and EMA200, and the 4h trend confirms the same stacked bearish structure.
🤔 Where exactly is the entry zone for the LAB short?</Q>
💡 The 1h price sits at 0.0547600, with the entry range between 0.0546073 and 0.0549127, so you can fade any micro bounce into the short.
🤔 When does this LAB short become invalid?</Q>
💡 A close back above 0.0581105 invalidates the setup, because that level sits above the entry high and the stacked daily EMAs.
The plan:
Entry: 0.0546073 – 0.0549127
SL: 0.0587211
TP1: 0.0517891
TP2: 0.0498086
TP3: 0.0468377
Over to you:
Where is your level on LAB right now, and would you wait for a close below the 1h price before joining the short?
Click here to view the chart 👇️
📲 Want more of my latest signals? Join me here:
https://app.binance.com/uni-qr/D26WbL9t
⚠️ Personal market analysis only. NFA — manage risk and DYOR.
Educational content, not investment advice or a recommendation to buy, sell, deposit, or withdraw any asset. No paid promotion; the invite link above is my own referral link, and I may earn a commission if you sign up through it — at no extra cost to you.
📊 $LAB /USDT · Bias: SHORT (Strong) · 6/12 signals aligned
Technical verdict: STRONG SHORT. 6 of 12 signals aligned, 0 against.
✅ Daily trend: price < EMA50 < EMA200, bearish stack
✅ 4h trend: price < EMA50 < EMA200, bearish stack
✅ Trend strength (ADX/DI, 15m): ADX 66.2 with sellers in control (DI+ 7.8 vs DI− 35.8)
✅ 4h RSI: 44.1, bearish momentum (below 45)
No factor points the other way right now.
🤔 Why short LAB when the daily trend is already bearish?</Q>
💡 The daily trend is bearish with price below both the EMA50 and EMA200, and the 4h trend confirms the same stacked bearish structure.
🤔 Where exactly is the entry zone for the LAB short?</Q>
💡 The 1h price sits at 0.0547600, with the entry range between 0.0546073 and 0.0549127, so you can fade any micro bounce into the short.
🤔 When does this LAB short become invalid?</Q>
💡 A close back above 0.0581105 invalidates the setup, because that level sits above the entry high and the stacked daily EMAs.
The plan:
Entry: 0.0546073 – 0.0549127
SL: 0.0587211
TP1: 0.0517891
TP2: 0.0498086
TP3: 0.0468377
Over to you:
Where is your level on LAB right now, and would you wait for a close below the 1h price before joining the short?
Click here to view the chart 👇️
📲 Want more of my latest signals? Join me here:
https://app.binance.com/uni-qr/D26WbL9t
⚠️ Personal market analysis only. NFA — manage risk and DYOR.
Educational content, not investment advice or a recommendation to buy, sell, deposit, or withdraw any asset. No paid promotion; the invite link above is my own referral link, and I may earn a commission if you sign up through it — at no extra cost to you.
1
1
1.3k
·
--
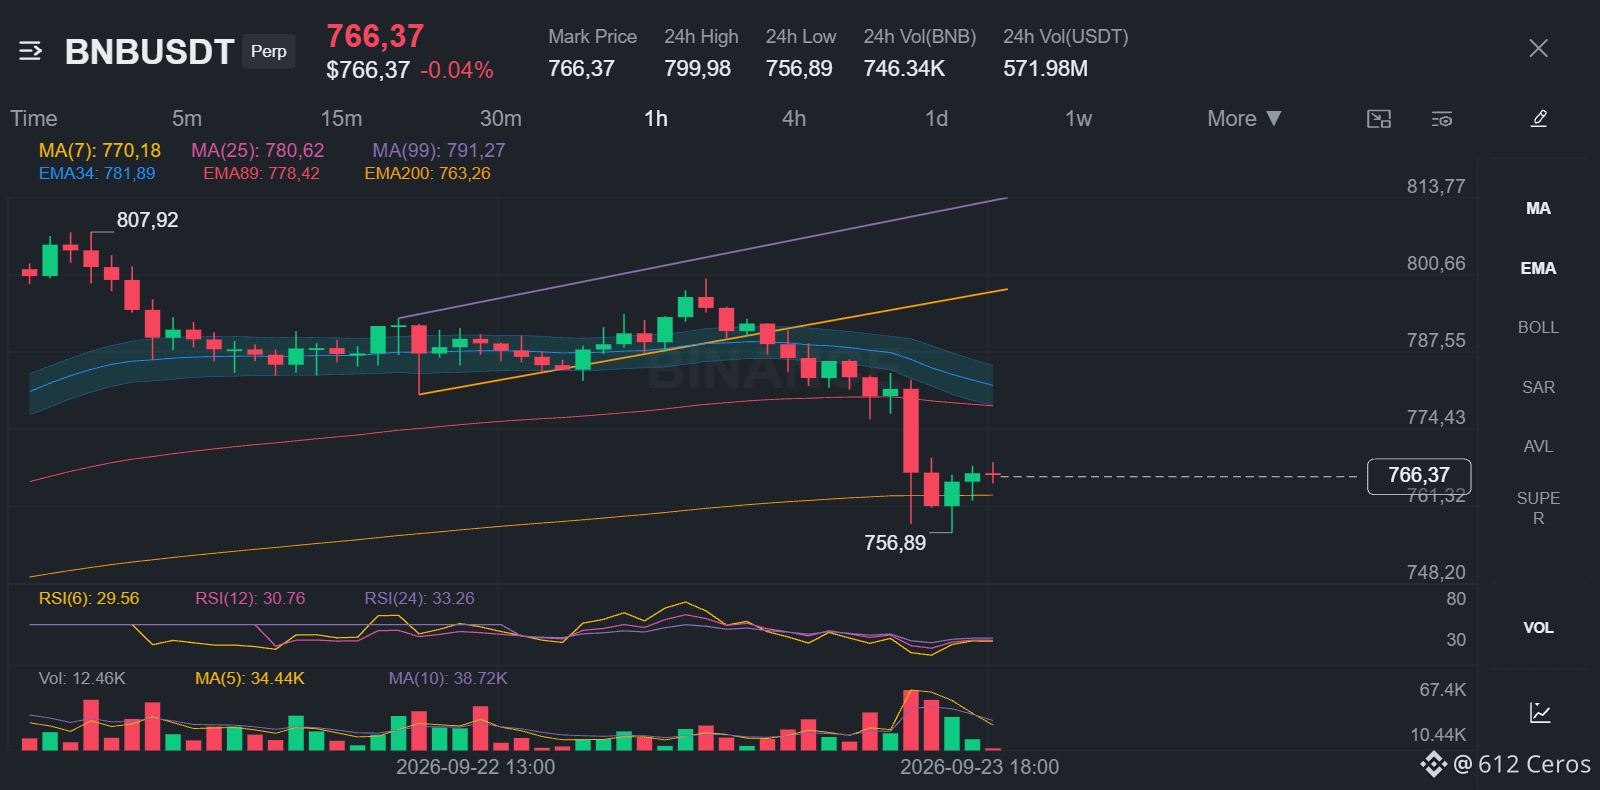
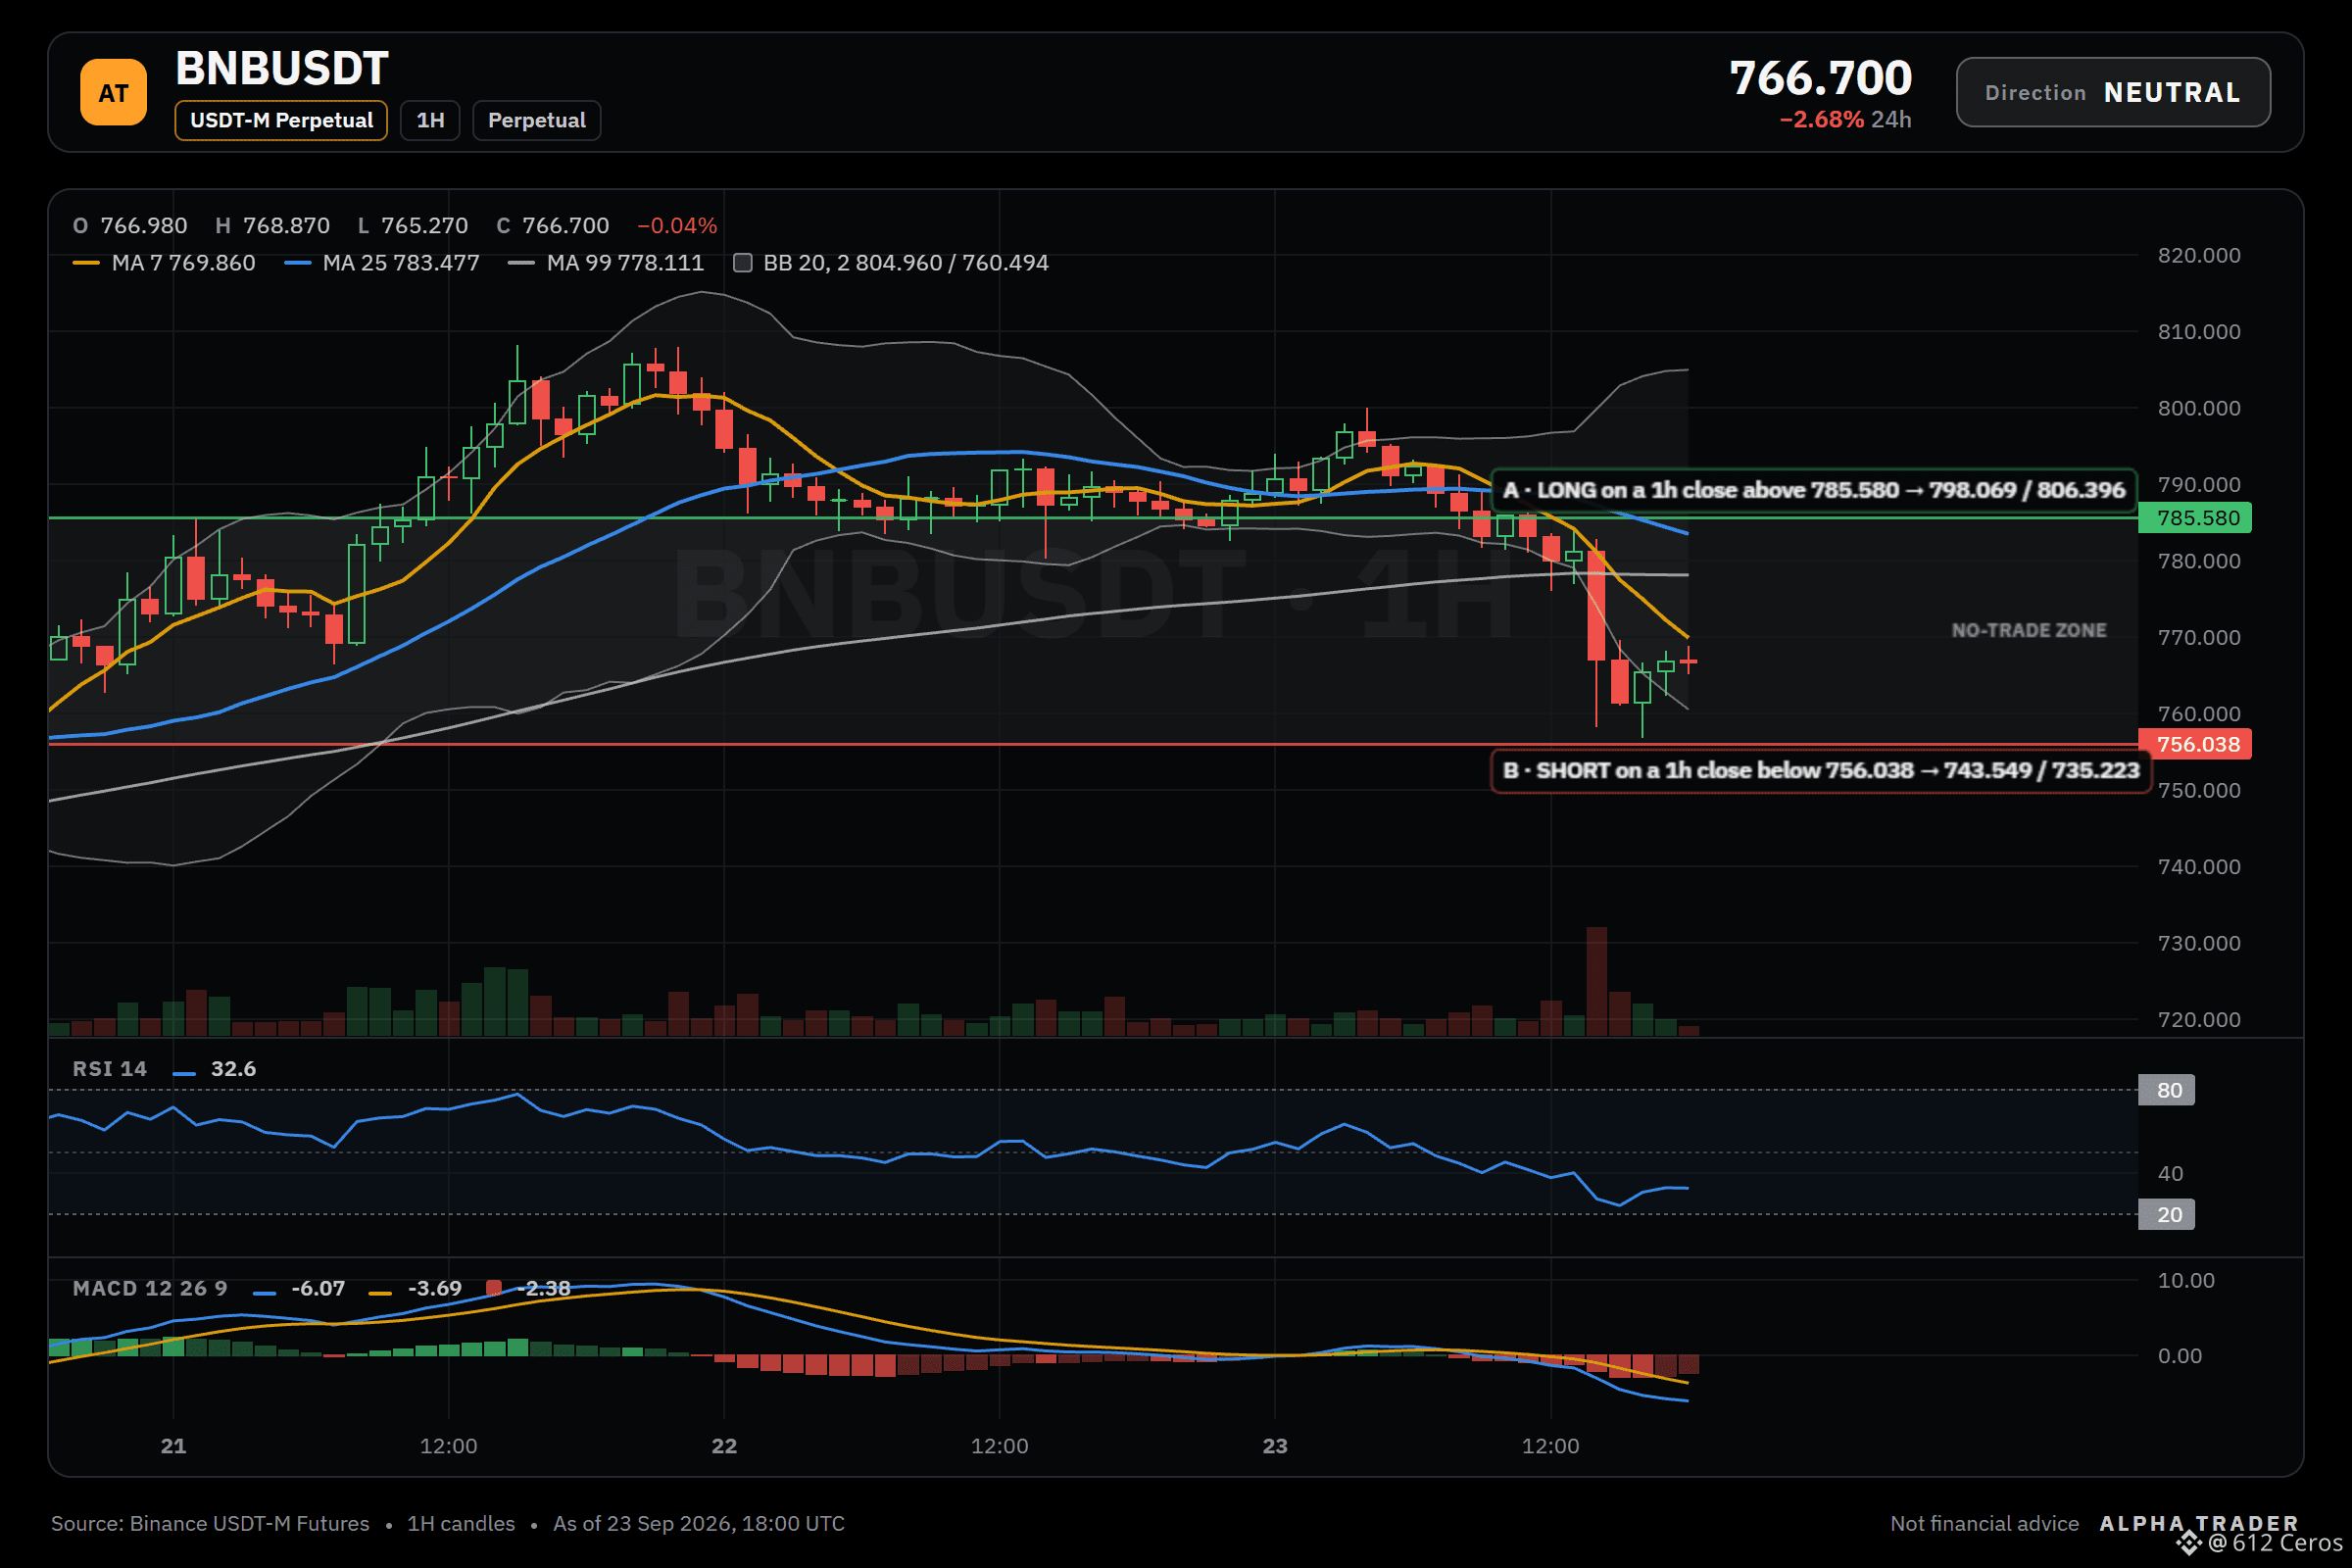
BNB lacks a clear edge; I am waiting on the next setup.
$BNB /USDT - ⚪ Bias: NEUTRAL (No edge) · 2 bullish vs 4 bearish
Technical verdict: NEUTRAL. 2 of 12 signals bullish, 4 bearish, 6 undecided.
Bullish side:
🟢 Daily trend: price > EMA50 > EMA200, bullish stack
🟢 4h trend: price > EMA50 > EMA200, bullish stack
Bearish side:
🔴 Trend strength (ADX/DI, 15m): ADX 60.1 with sellers in control (DI+ 10.7 vs DI− 28.1)
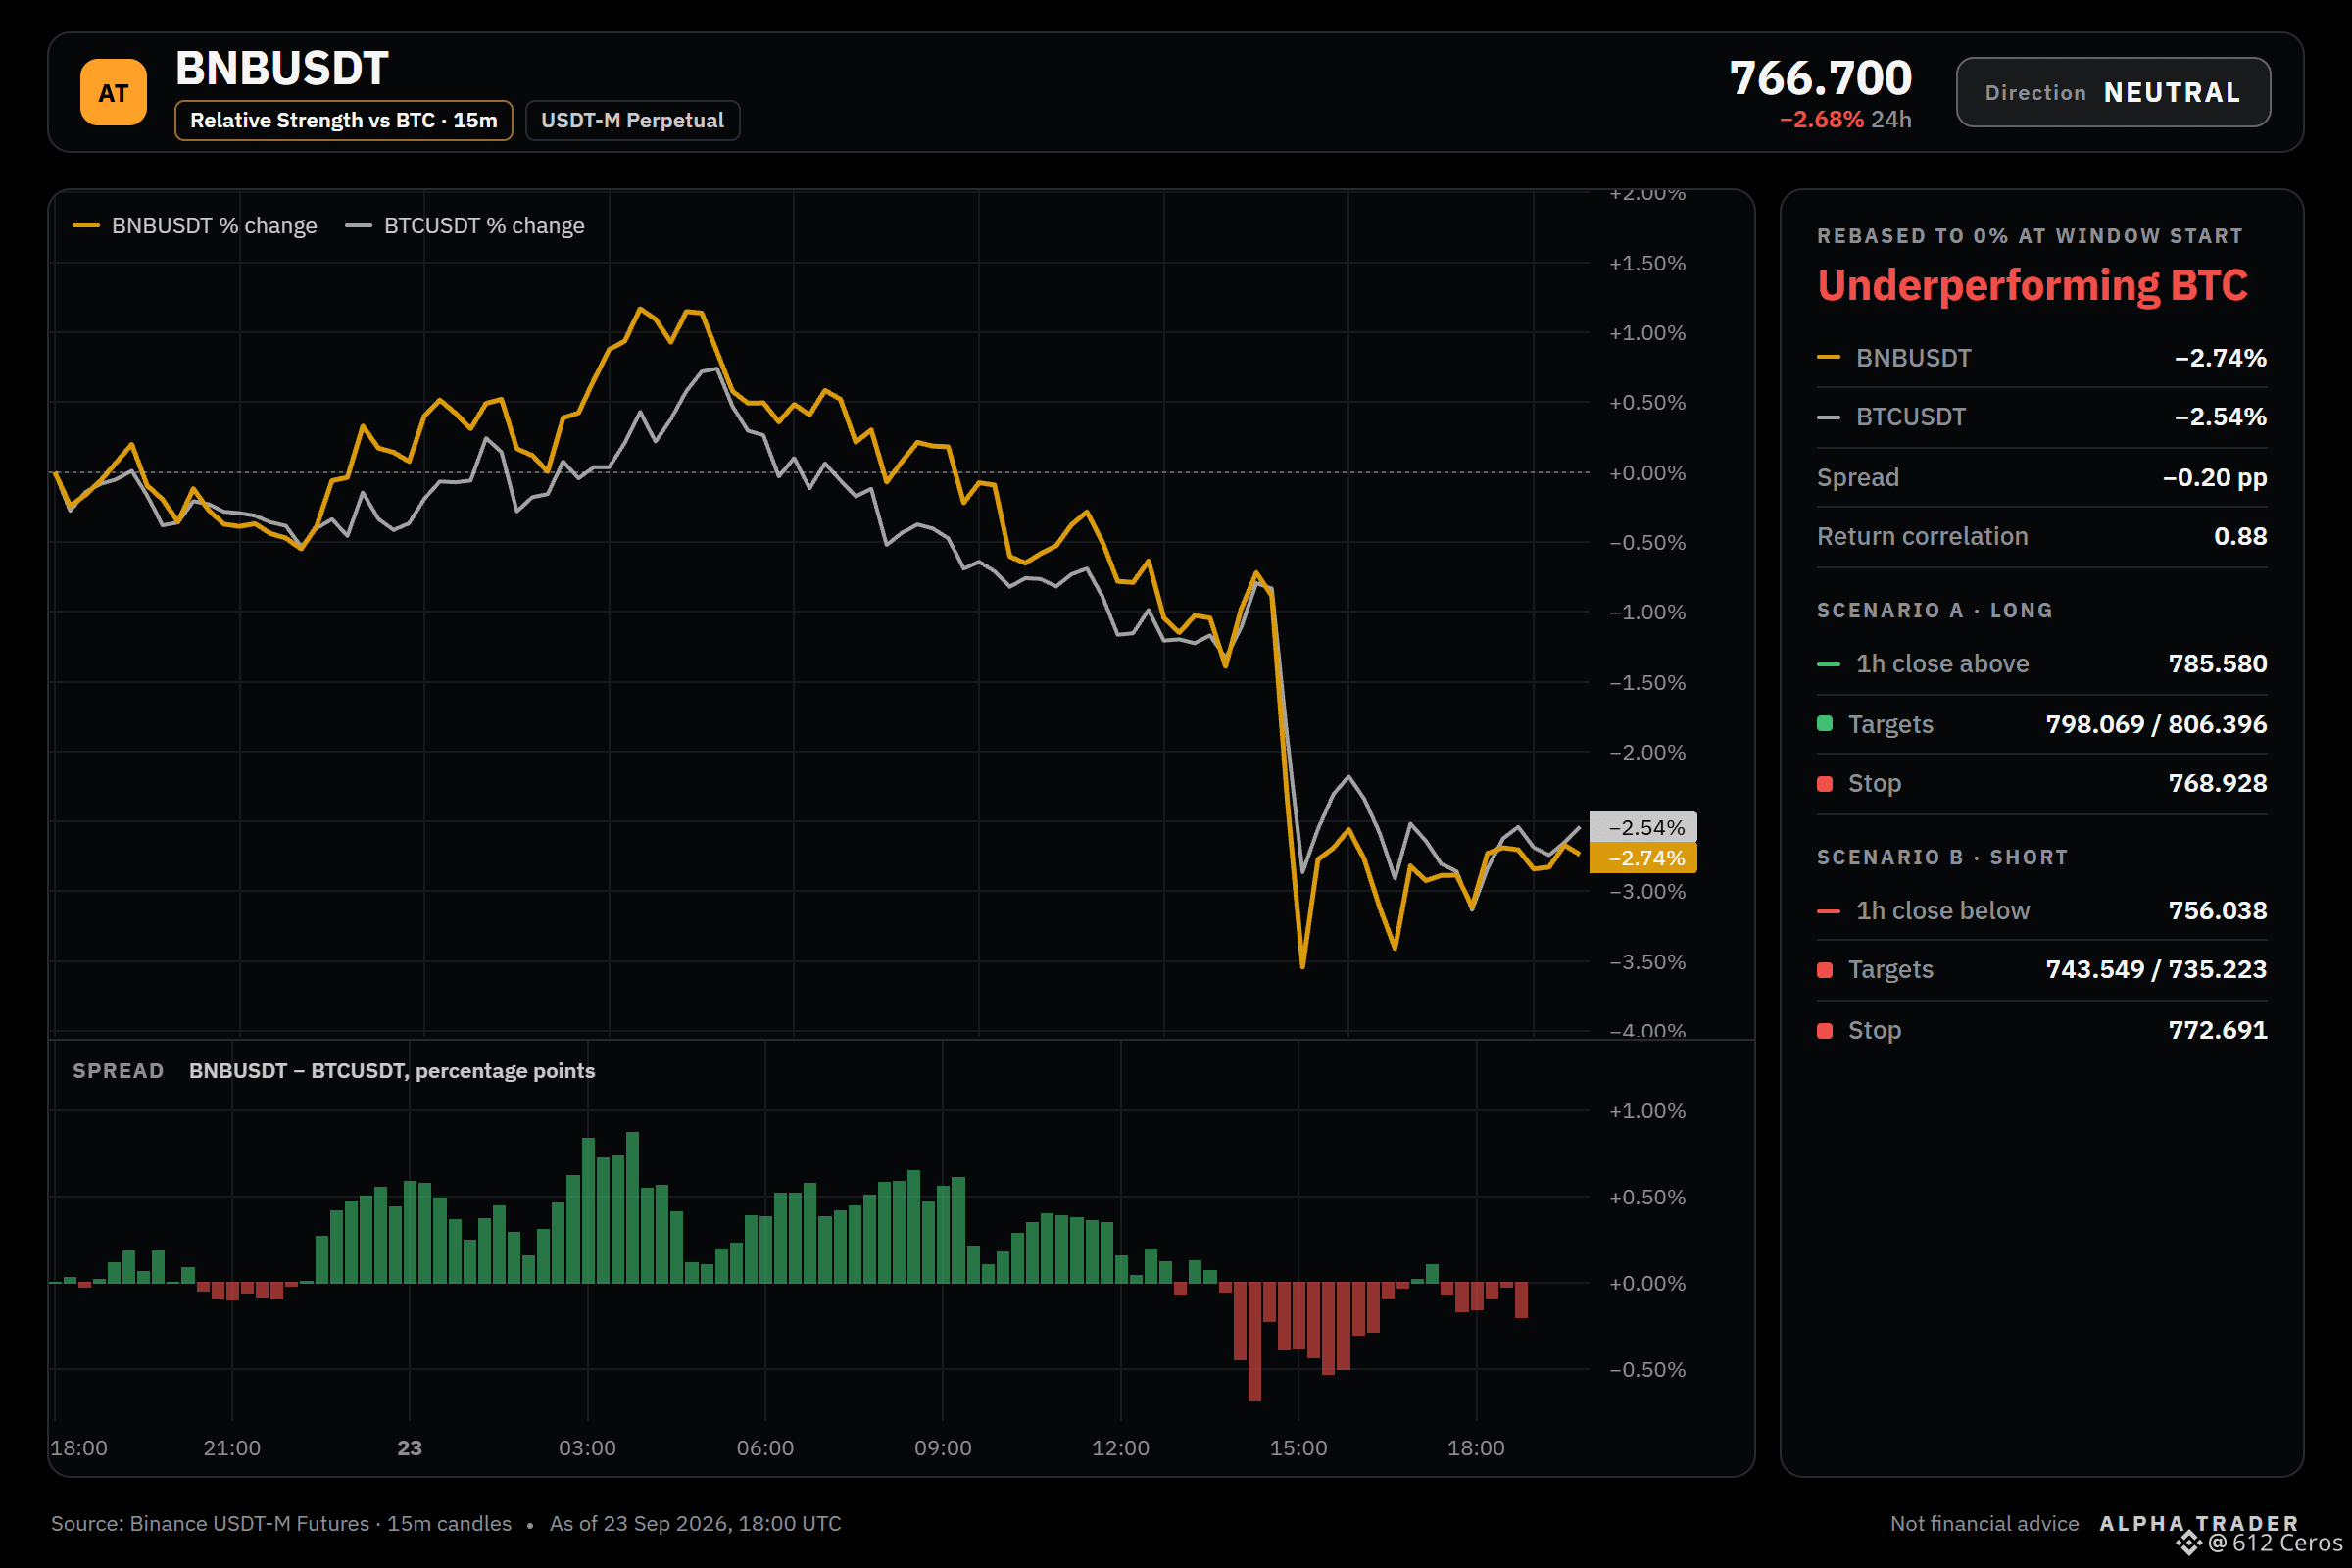
🔴 BTC backdrop: BTC trend is bearish and correlation is 0.90
🔴 4h RSI: 41.8, bearish momentum (below 45)
🔴 1h RSI: 32.6, bearish momentum (below 45)
What would make me act:
🟢 Scenario A: LONG on a 1h close above 785.580 (top of the resistance zone)
Trigger 785.580 → targets 798.069 / 806.396 / 818.885, stop 768.928
🔴 Scenario B: SHORT on a 1h close below 756.038 (bottom of the support zone)
Trigger 756.038 → targets 743.549 / 735.223 / 722.733, stop 772.691
⏸ Between 756.038 and 785.580 (3.9% wide): no edge, no trade.
What would tip it:
There is no edge right now, with the 1h price stuck between mixed momentum and a daily trend that is still bullish. Two supportive factors are the daily trend with price above EMA50 and EMA200 in a bullish stack and the 4h trend with price above EMA50 and EMA200 in a bullish stack. The main against factors are the 1h RSI at 32.6 showing bearish momentum and ADX at 60.1 with sellers in control (DI+ 10.7 vs DI− 28.1). A long setup needs a 1h close above 785.580, while a short setup needs a 1h close below 756.038.
Debate:
Where do you see the next clean 1h close that would tip your bias?
Full setup on the chart 👇
{future}(BNBUSDT)
📲 Want more of my latest signals? Join me here:
[https://app.binance.com/uni-qr/D26WbL9t](https://app.binance.com/uni-qr/D26WbL9t)
⚠️ Personal market analysis only. NFA — manage risk and DYOR.
Educational content, not investment advice or a recommendation to buy, sell, deposit, or withdraw any asset. No paid promotion; the invite link above is my own referral link, and I may earn a commission if you sign up through it — at no extra cost to you.
BNB lacks a clear edge; I am waiting on the next setup.
$BNB /USDT - ⚪ Bias: NEUTRAL (No edge) · 2 bullish vs 4 bearish
Technical verdict: NEUTRAL. 2 of 12 signals bullish, 4 bearish, 6 undecided.
Bullish side:
🟢 Daily trend: price > EMA50 > EMA200, bullish stack
🟢 4h trend: price > EMA50 > EMA200, bullish stack
Bearish side:
🔴 Trend strength (ADX/DI, 15m): ADX 60.1 with sellers in control (DI+ 10.7 vs DI− 28.1)
🔴 BTC backdrop: BTC trend is bearish and correlation is 0.90
🔴 4h RSI: 41.8, bearish momentum (below 45)
🔴 1h RSI: 32.6, bearish momentum (below 45)
What would make me act:
🟢 Scenario A: LONG on a 1h close above 785.580 (top of the resistance zone)
Trigger 785.580 → targets 798.069 / 806.396 / 818.885, stop 768.928
🔴 Scenario B: SHORT on a 1h close below 756.038 (bottom of the support zone)
Trigger 756.038 → targets 743.549 / 735.223 / 722.733, stop 772.691
⏸ Between 756.038 and 785.580 (3.9% wide): no edge, no trade.
What would tip it:
There is no edge right now, with the 1h price stuck between mixed momentum and a daily trend that is still bullish. Two supportive factors are the daily trend with price above EMA50 and EMA200 in a bullish stack and the 4h trend with price above EMA50 and EMA200 in a bullish stack. The main against factors are the 1h RSI at 32.6 showing bearish momentum and ADX at 60.1 with sellers in control (DI+ 10.7 vs DI− 28.1). A long setup needs a 1h close above 785.580, while a short setup needs a 1h close below 756.038.
Debate:
Where do you see the next clean 1h close that would tip your bias?
Full setup on the chart 👇
📲 Want more of my latest signals? Join me here:
https://app.binance.com/uni-qr/D26WbL9t
⚠️ Personal market analysis only. NFA — manage risk and DYOR.
Educational content, not investment advice or a recommendation to buy, sell, deposit, or withdraw any asset. No paid promotion; the invite link above is my own referral link, and I may earn a commission if you sign up through it — at no extra cost to you.
$BNB /USDT - ⚪ Bias: NEUTRAL (No edge) · 2 bullish vs 4 bearish
Technical verdict: NEUTRAL. 2 of 12 signals bullish, 4 bearish, 6 undecided.
Bullish side:
🟢 Daily trend: price > EMA50 > EMA200, bullish stack
🟢 4h trend: price > EMA50 > EMA200, bullish stack
Bearish side:
🔴 Trend strength (ADX/DI, 15m): ADX 60.1 with sellers in control (DI+ 10.7 vs DI− 28.1)
🔴 BTC backdrop: BTC trend is bearish and correlation is 0.90
🔴 4h RSI: 41.8, bearish momentum (below 45)
🔴 1h RSI: 32.6, bearish momentum (below 45)
What would make me act:
🟢 Scenario A: LONG on a 1h close above 785.580 (top of the resistance zone)
Trigger 785.580 → targets 798.069 / 806.396 / 818.885, stop 768.928
🔴 Scenario B: SHORT on a 1h close below 756.038 (bottom of the support zone)
Trigger 756.038 → targets 743.549 / 735.223 / 722.733, stop 772.691
⏸ Between 756.038 and 785.580 (3.9% wide): no edge, no trade.
What would tip it:
There is no edge right now, with the 1h price stuck between mixed momentum and a daily trend that is still bullish. Two supportive factors are the daily trend with price above EMA50 and EMA200 in a bullish stack and the 4h trend with price above EMA50 and EMA200 in a bullish stack. The main against factors are the 1h RSI at 32.6 showing bearish momentum and ADX at 60.1 with sellers in control (DI+ 10.7 vs DI− 28.1). A long setup needs a 1h close above 785.580, while a short setup needs a 1h close below 756.038.
Debate:
Where do you see the next clean 1h close that would tip your bias?
Full setup on the chart 👇
📲 Want more of my latest signals? Join me here:
https://app.binance.com/uni-qr/D26WbL9t
⚠️ Personal market analysis only. NFA — manage risk and DYOR.
Educational content, not investment advice or a recommendation to buy, sell, deposit, or withdraw any asset. No paid promotion; the invite link above is my own referral link, and I may earn a commission if you sign up through it — at no extra cost to you.
2
1.7k
·
--
Bullish
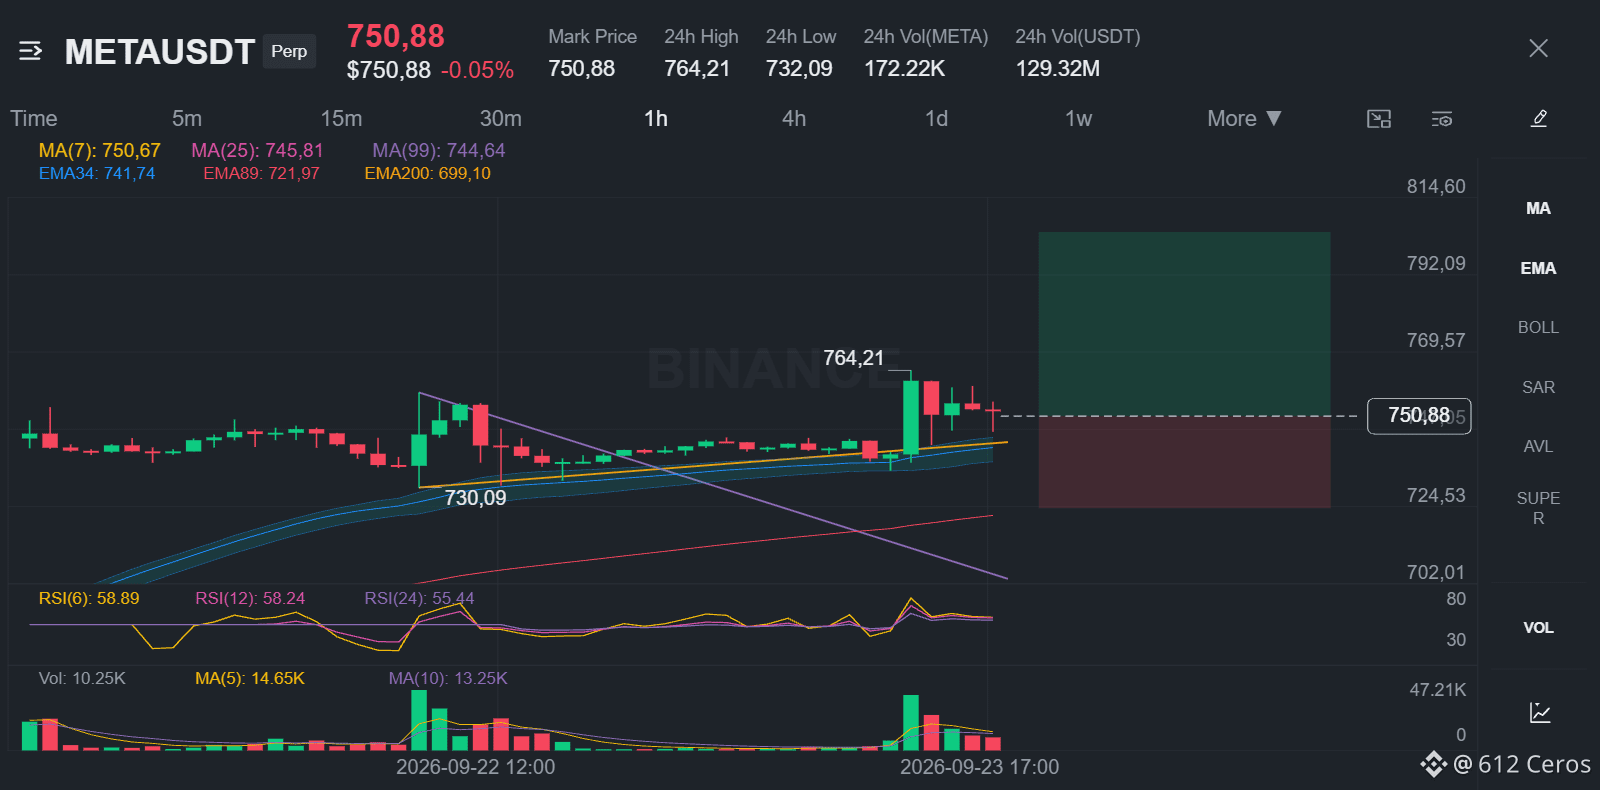
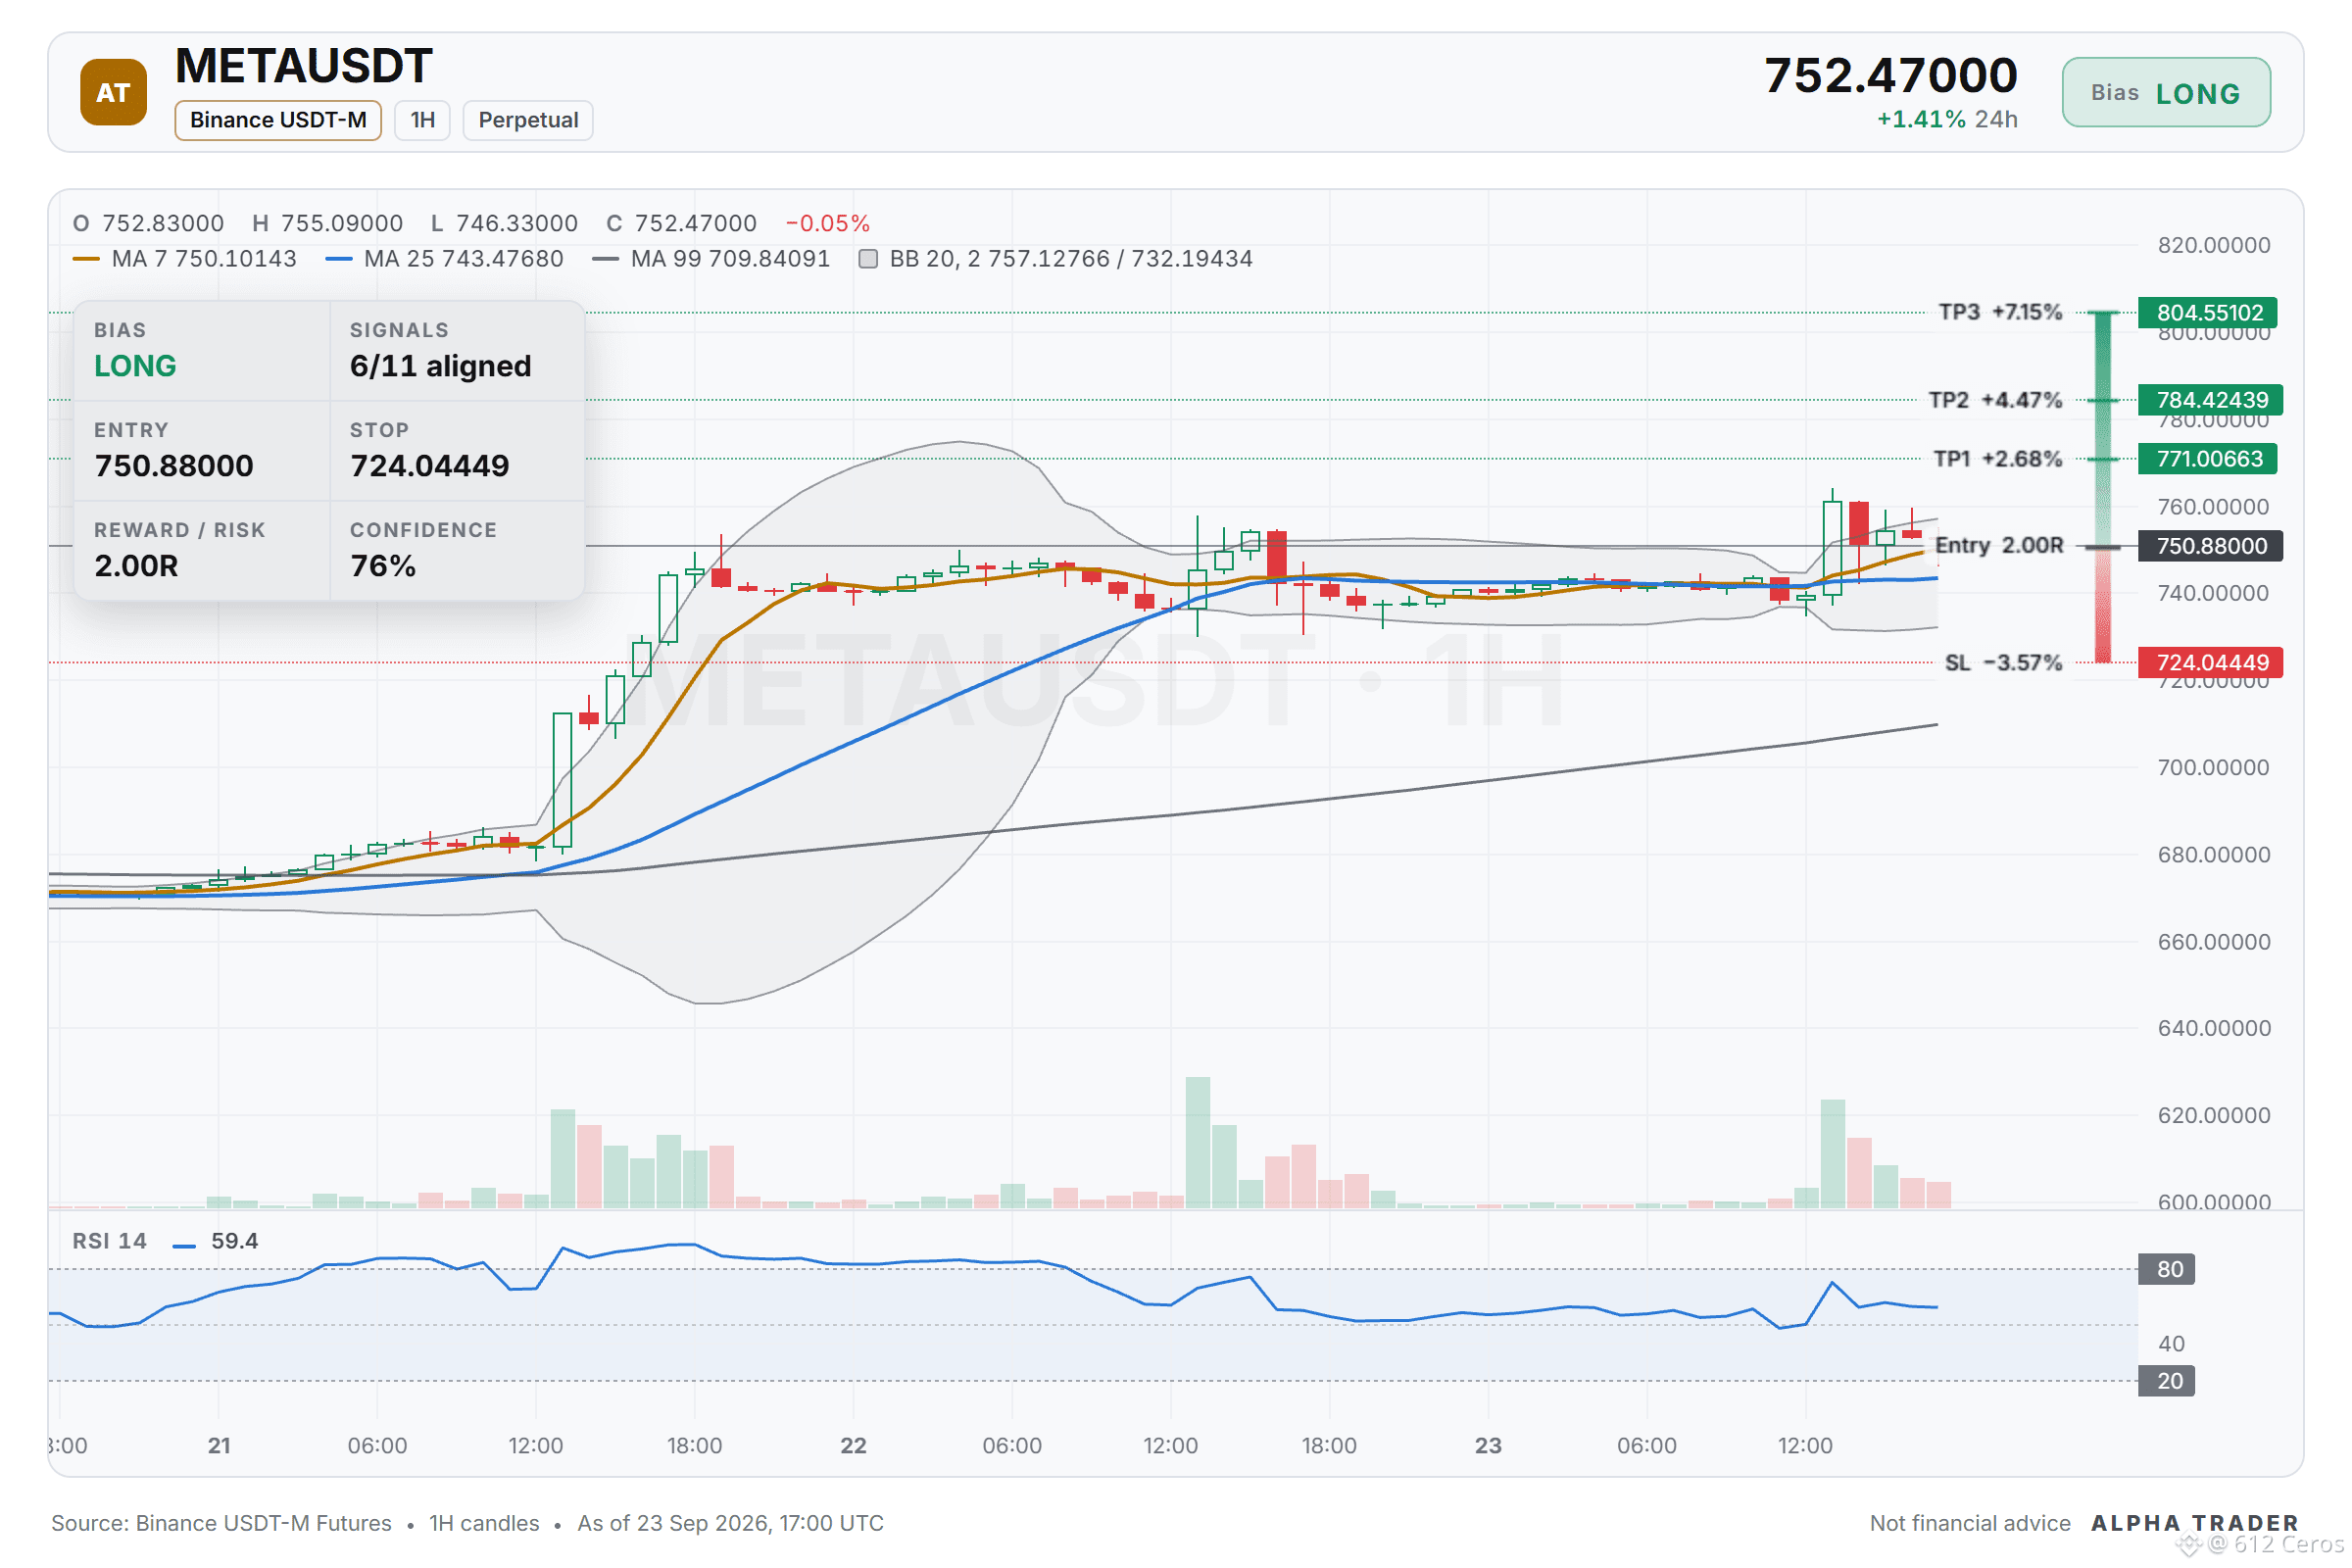
META long setup: the levels I'm watching
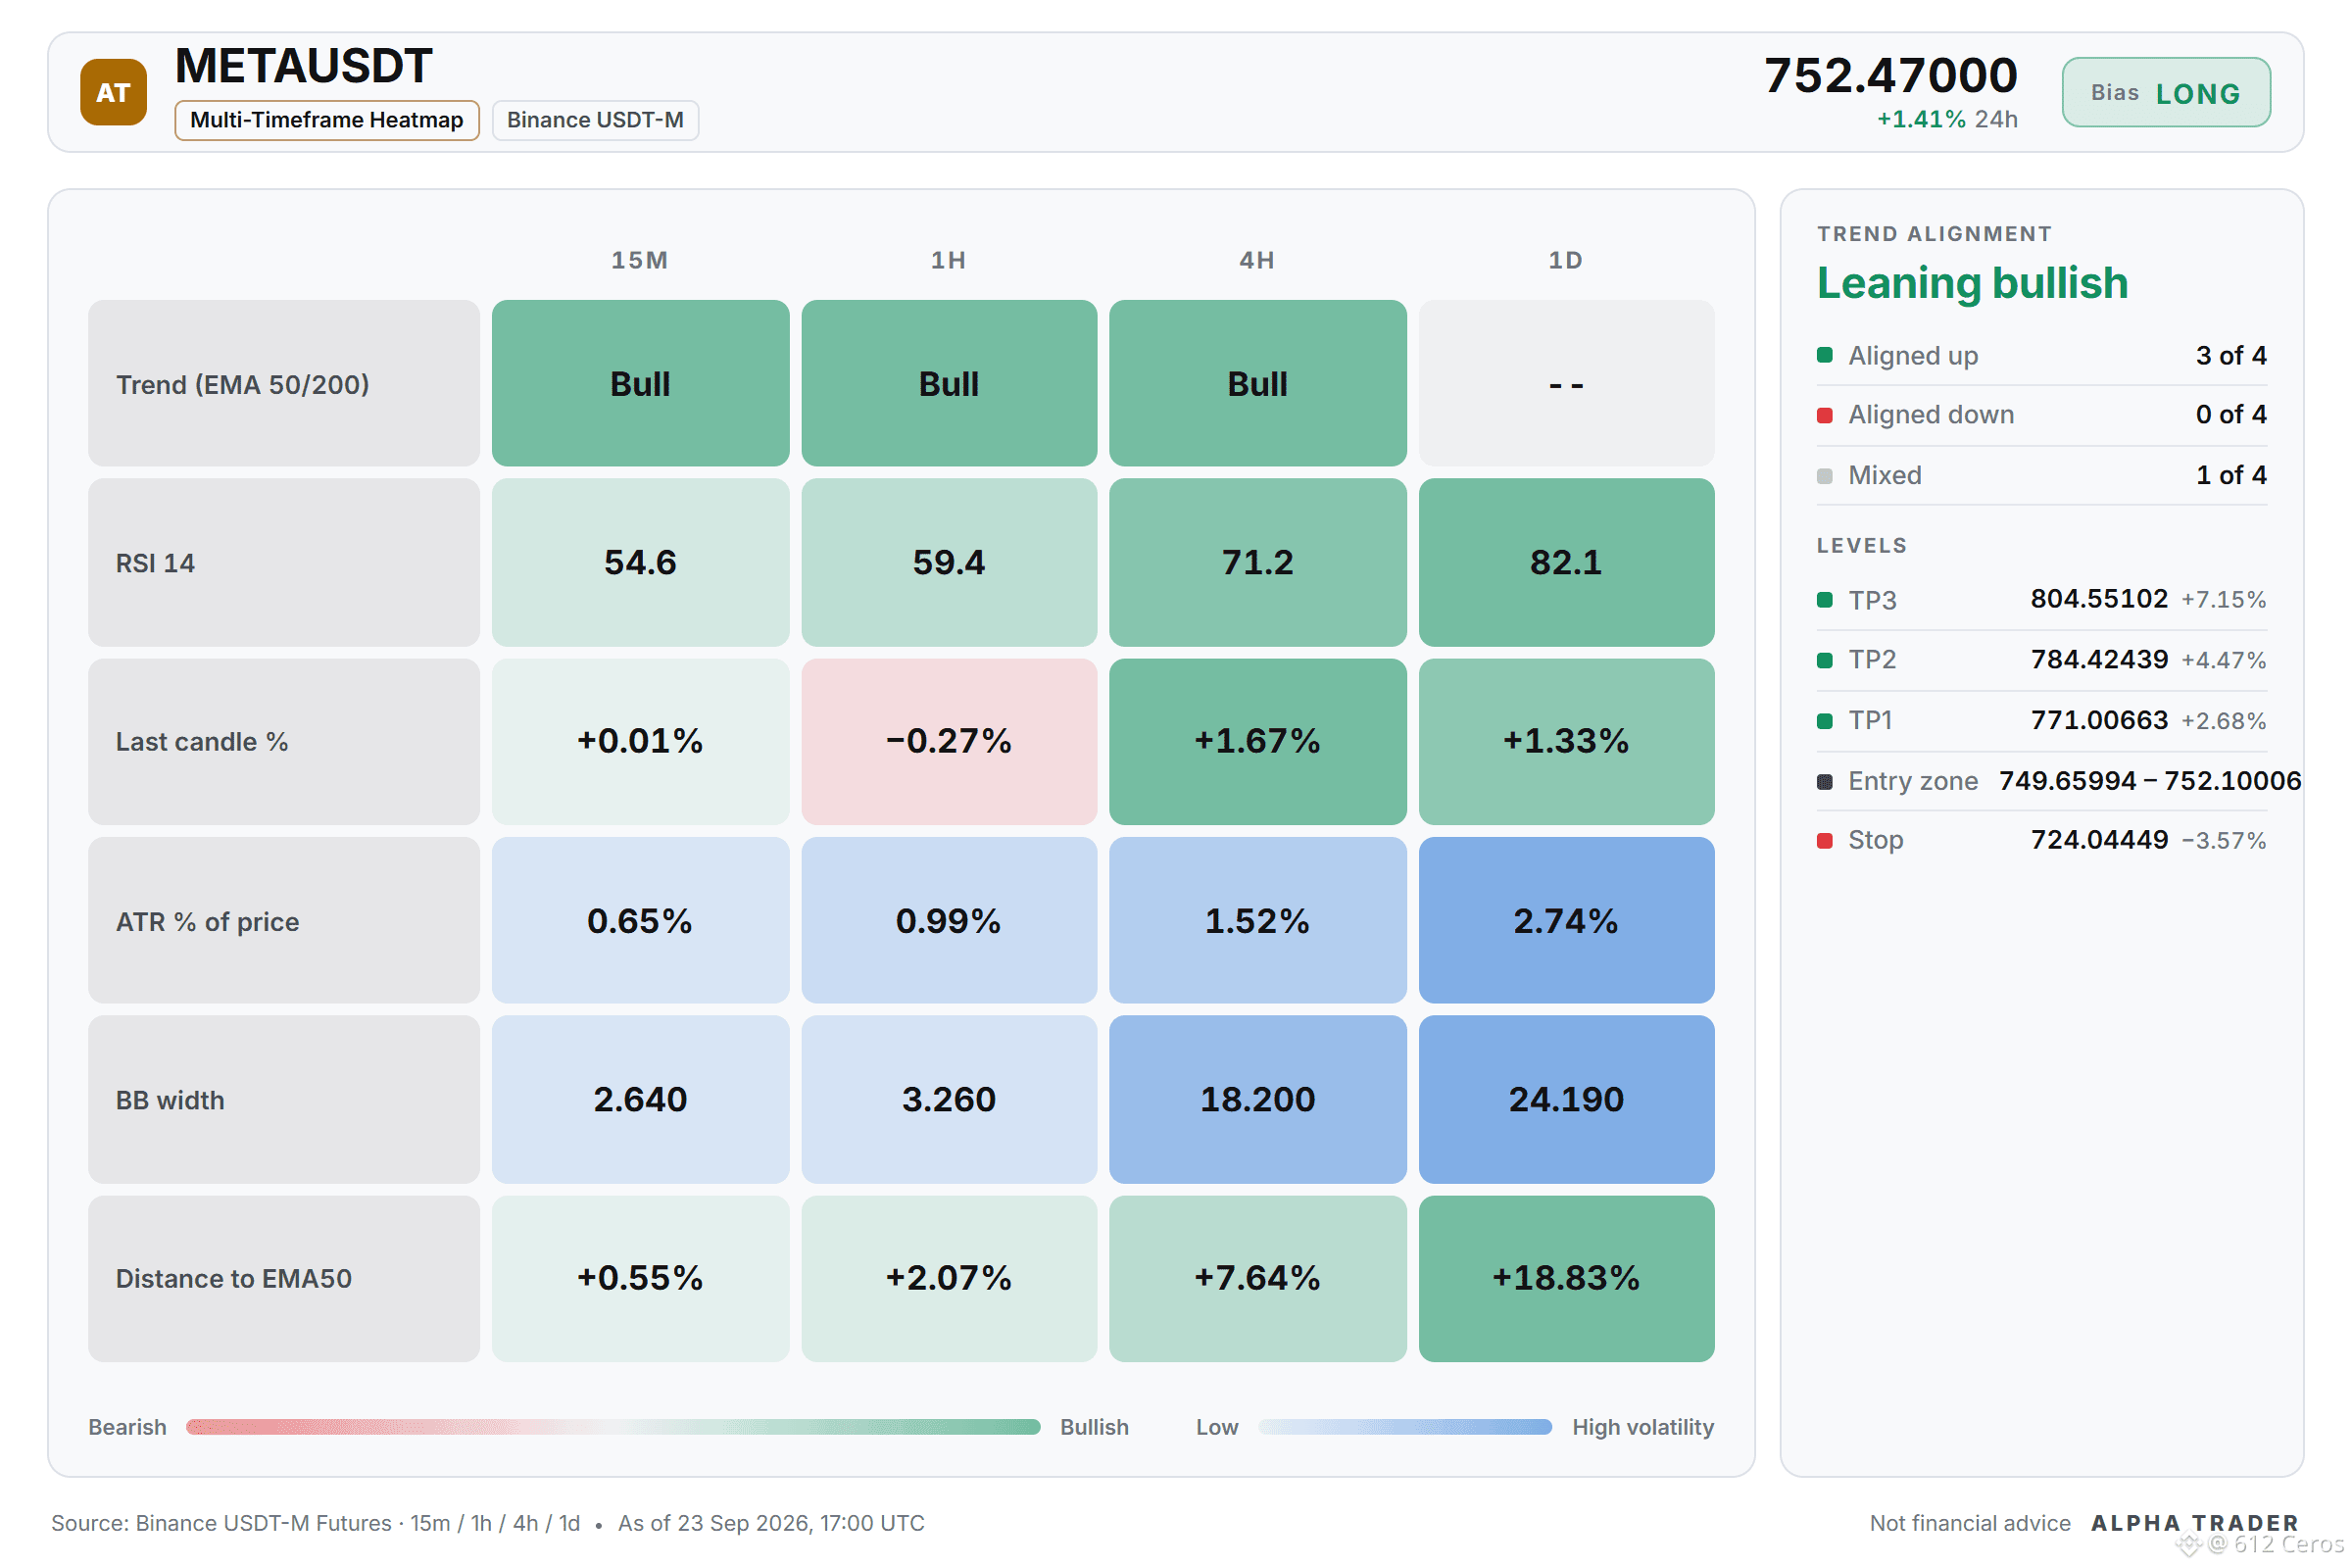
📊 $META /USDT · Bias: LONG (Strong) · 6/11 signals aligned
Technical verdict: STRONG LONG. 6 of 11 signals aligned, 0 against.
What supports it (6):
• 4h trend: price > EMA50 > EMA200, bullish stack
• 1h trend: price > EMA50 > EMA200, bullish stack
• Trend strength (ADX/DI, 15m): ADX 34.9 with buyers in control (DI+ 28.4 vs DI− 16.8)
• 4h RSI: 71.2, bullish momentum (above 55)
• 1h RSI: 59.4, bullish momentum (above 55)
• Relative strength vs BTC: outperforming, +3.67% vs BTC over the last day
No factor points the other way right now.
Trade Plan:
Entry: 749.65994 – 752.10006
SL: 724.04449
TP1: 771.00663
TP2: 784.42439
TP3: 804.55102
Why I like it:
The daily trend reads range, and 6/11 signals aligned favour the long side. The plan is to work the 749.65994 – 752.10006 zone, scale out at 771.00663 and 784.42439, and stay patient for 804.55102. A move through 724.04449 means the idea is wrong and the stop does its job.
💬 Does META tag 771.00663 first, or the stop?
Levels mapped on the chart below 👇
{future}(METAUSDT)
📲 Want more of my latest signals? Join me here:
[https://app.binance.com/uni-qr/D26WbL9t](https://app.binance.com/uni-qr/D26WbL9t)
⚠️ Personal market analysis only. NFA — manage risk and DYOR.
Educational content, not investment advice or a recommendation to buy, sell, deposit, or withdraw any asset. No paid promotion; the invite link above is my own referral link, and I may earn a commission if you sign up through it — at no extra cost to you.
META long setup: the levels I'm watching
📊 $META /USDT · Bias: LONG (Strong) · 6/11 signals aligned
Technical verdict: STRONG LONG. 6 of 11 signals aligned, 0 against.
What supports it (6):
• 4h trend: price > EMA50 > EMA200, bullish stack
• 1h trend: price > EMA50 > EMA200, bullish stack
• Trend strength (ADX/DI, 15m): ADX 34.9 with buyers in control (DI+ 28.4 vs DI− 16.8)
• 4h RSI: 71.2, bullish momentum (above 55)
• 1h RSI: 59.4, bullish momentum (above 55)
• Relative strength vs BTC: outperforming, +3.67% vs BTC over the last day
No factor points the other way right now.
Trade Plan:
Entry: 749.65994 – 752.10006
SL: 724.04449
TP1: 771.00663
TP2: 784.42439
TP3: 804.55102
Why I like it:
The daily trend reads range, and 6/11 signals aligned favour the long side. The plan is to work the 749.65994 – 752.10006 zone, scale out at 771.00663 and 784.42439, and stay patient for 804.55102. A move through 724.04449 means the idea is wrong and the stop does its job.
💬 Does META tag 771.00663 first, or the stop?
Levels mapped on the chart below 👇
📲 Want more of my latest signals? Join me here:
https://app.binance.com/uni-qr/D26WbL9t
⚠️ Personal market analysis only. NFA — manage risk and DYOR.
Educational content, not investment advice or a recommendation to buy, sell, deposit, or withdraw any asset. No paid promotion; the invite link above is my own referral link, and I may earn a commission if you sign up through it — at no extra cost to you.
📊 $META /USDT · Bias: LONG (Strong) · 6/11 signals aligned
Technical verdict: STRONG LONG. 6 of 11 signals aligned, 0 against.
What supports it (6):
• 4h trend: price > EMA50 > EMA200, bullish stack
• 1h trend: price > EMA50 > EMA200, bullish stack
• Trend strength (ADX/DI, 15m): ADX 34.9 with buyers in control (DI+ 28.4 vs DI− 16.8)
• 4h RSI: 71.2, bullish momentum (above 55)
• 1h RSI: 59.4, bullish momentum (above 55)
• Relative strength vs BTC: outperforming, +3.67% vs BTC over the last day
No factor points the other way right now.
Trade Plan:
Entry: 749.65994 – 752.10006
SL: 724.04449
TP1: 771.00663
TP2: 784.42439
TP3: 804.55102
Why I like it:
The daily trend reads range, and 6/11 signals aligned favour the long side. The plan is to work the 749.65994 – 752.10006 zone, scale out at 771.00663 and 784.42439, and stay patient for 804.55102. A move through 724.04449 means the idea is wrong and the stop does its job.
💬 Does META tag 771.00663 first, or the stop?
Levels mapped on the chart below 👇
📲 Want more of my latest signals? Join me here:
https://app.binance.com/uni-qr/D26WbL9t
⚠️ Personal market analysis only. NFA — manage risk and DYOR.
Educational content, not investment advice or a recommendation to buy, sell, deposit, or withdraw any asset. No paid promotion; the invite link above is my own referral link, and I may earn a commission if you sign up through it — at no extra cost to you.
4
2
995
·
--
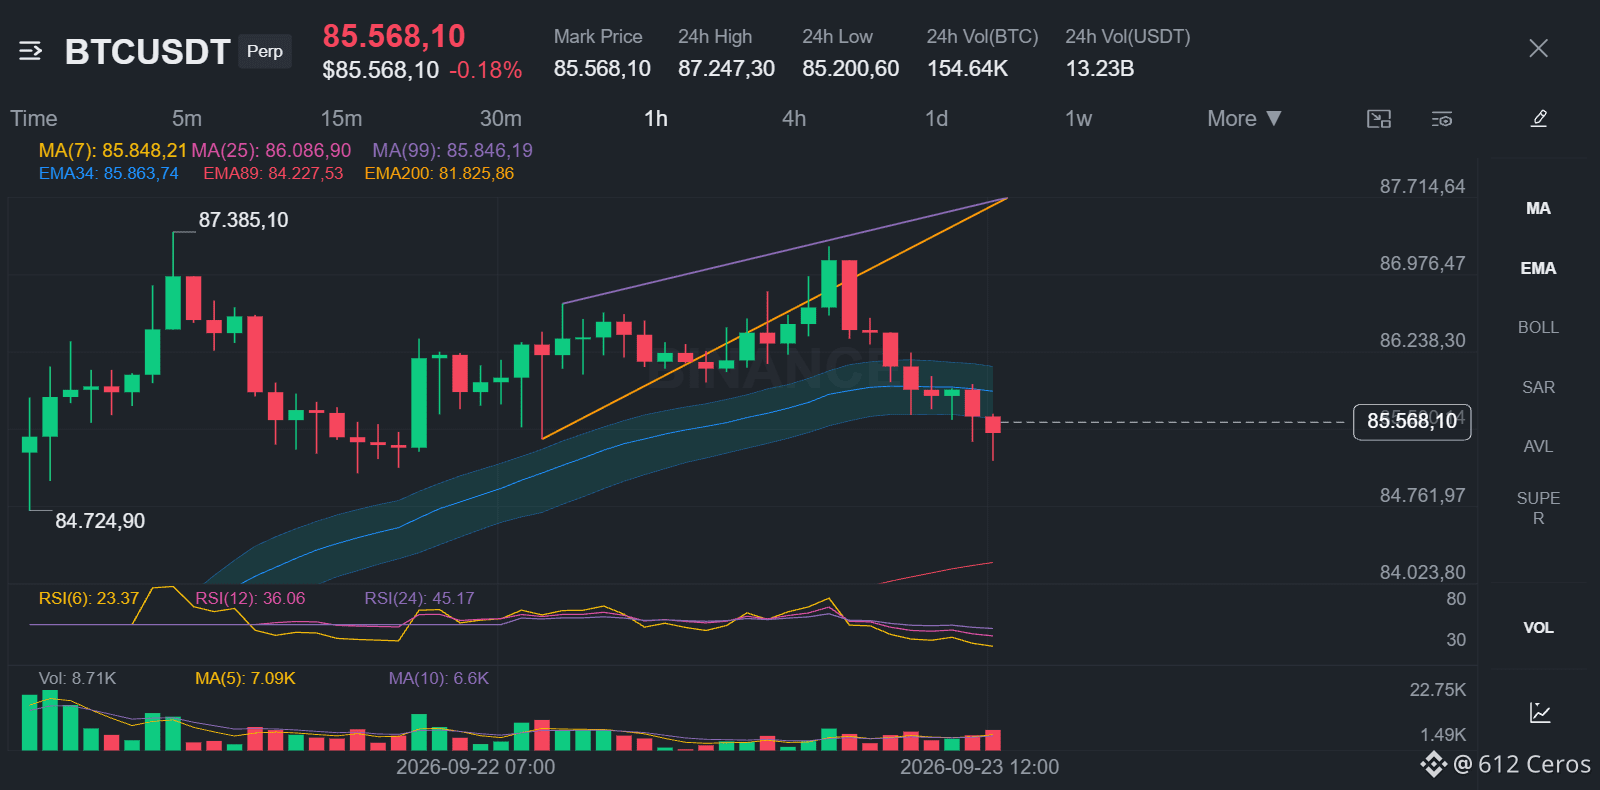
No clear edge on BTC right now
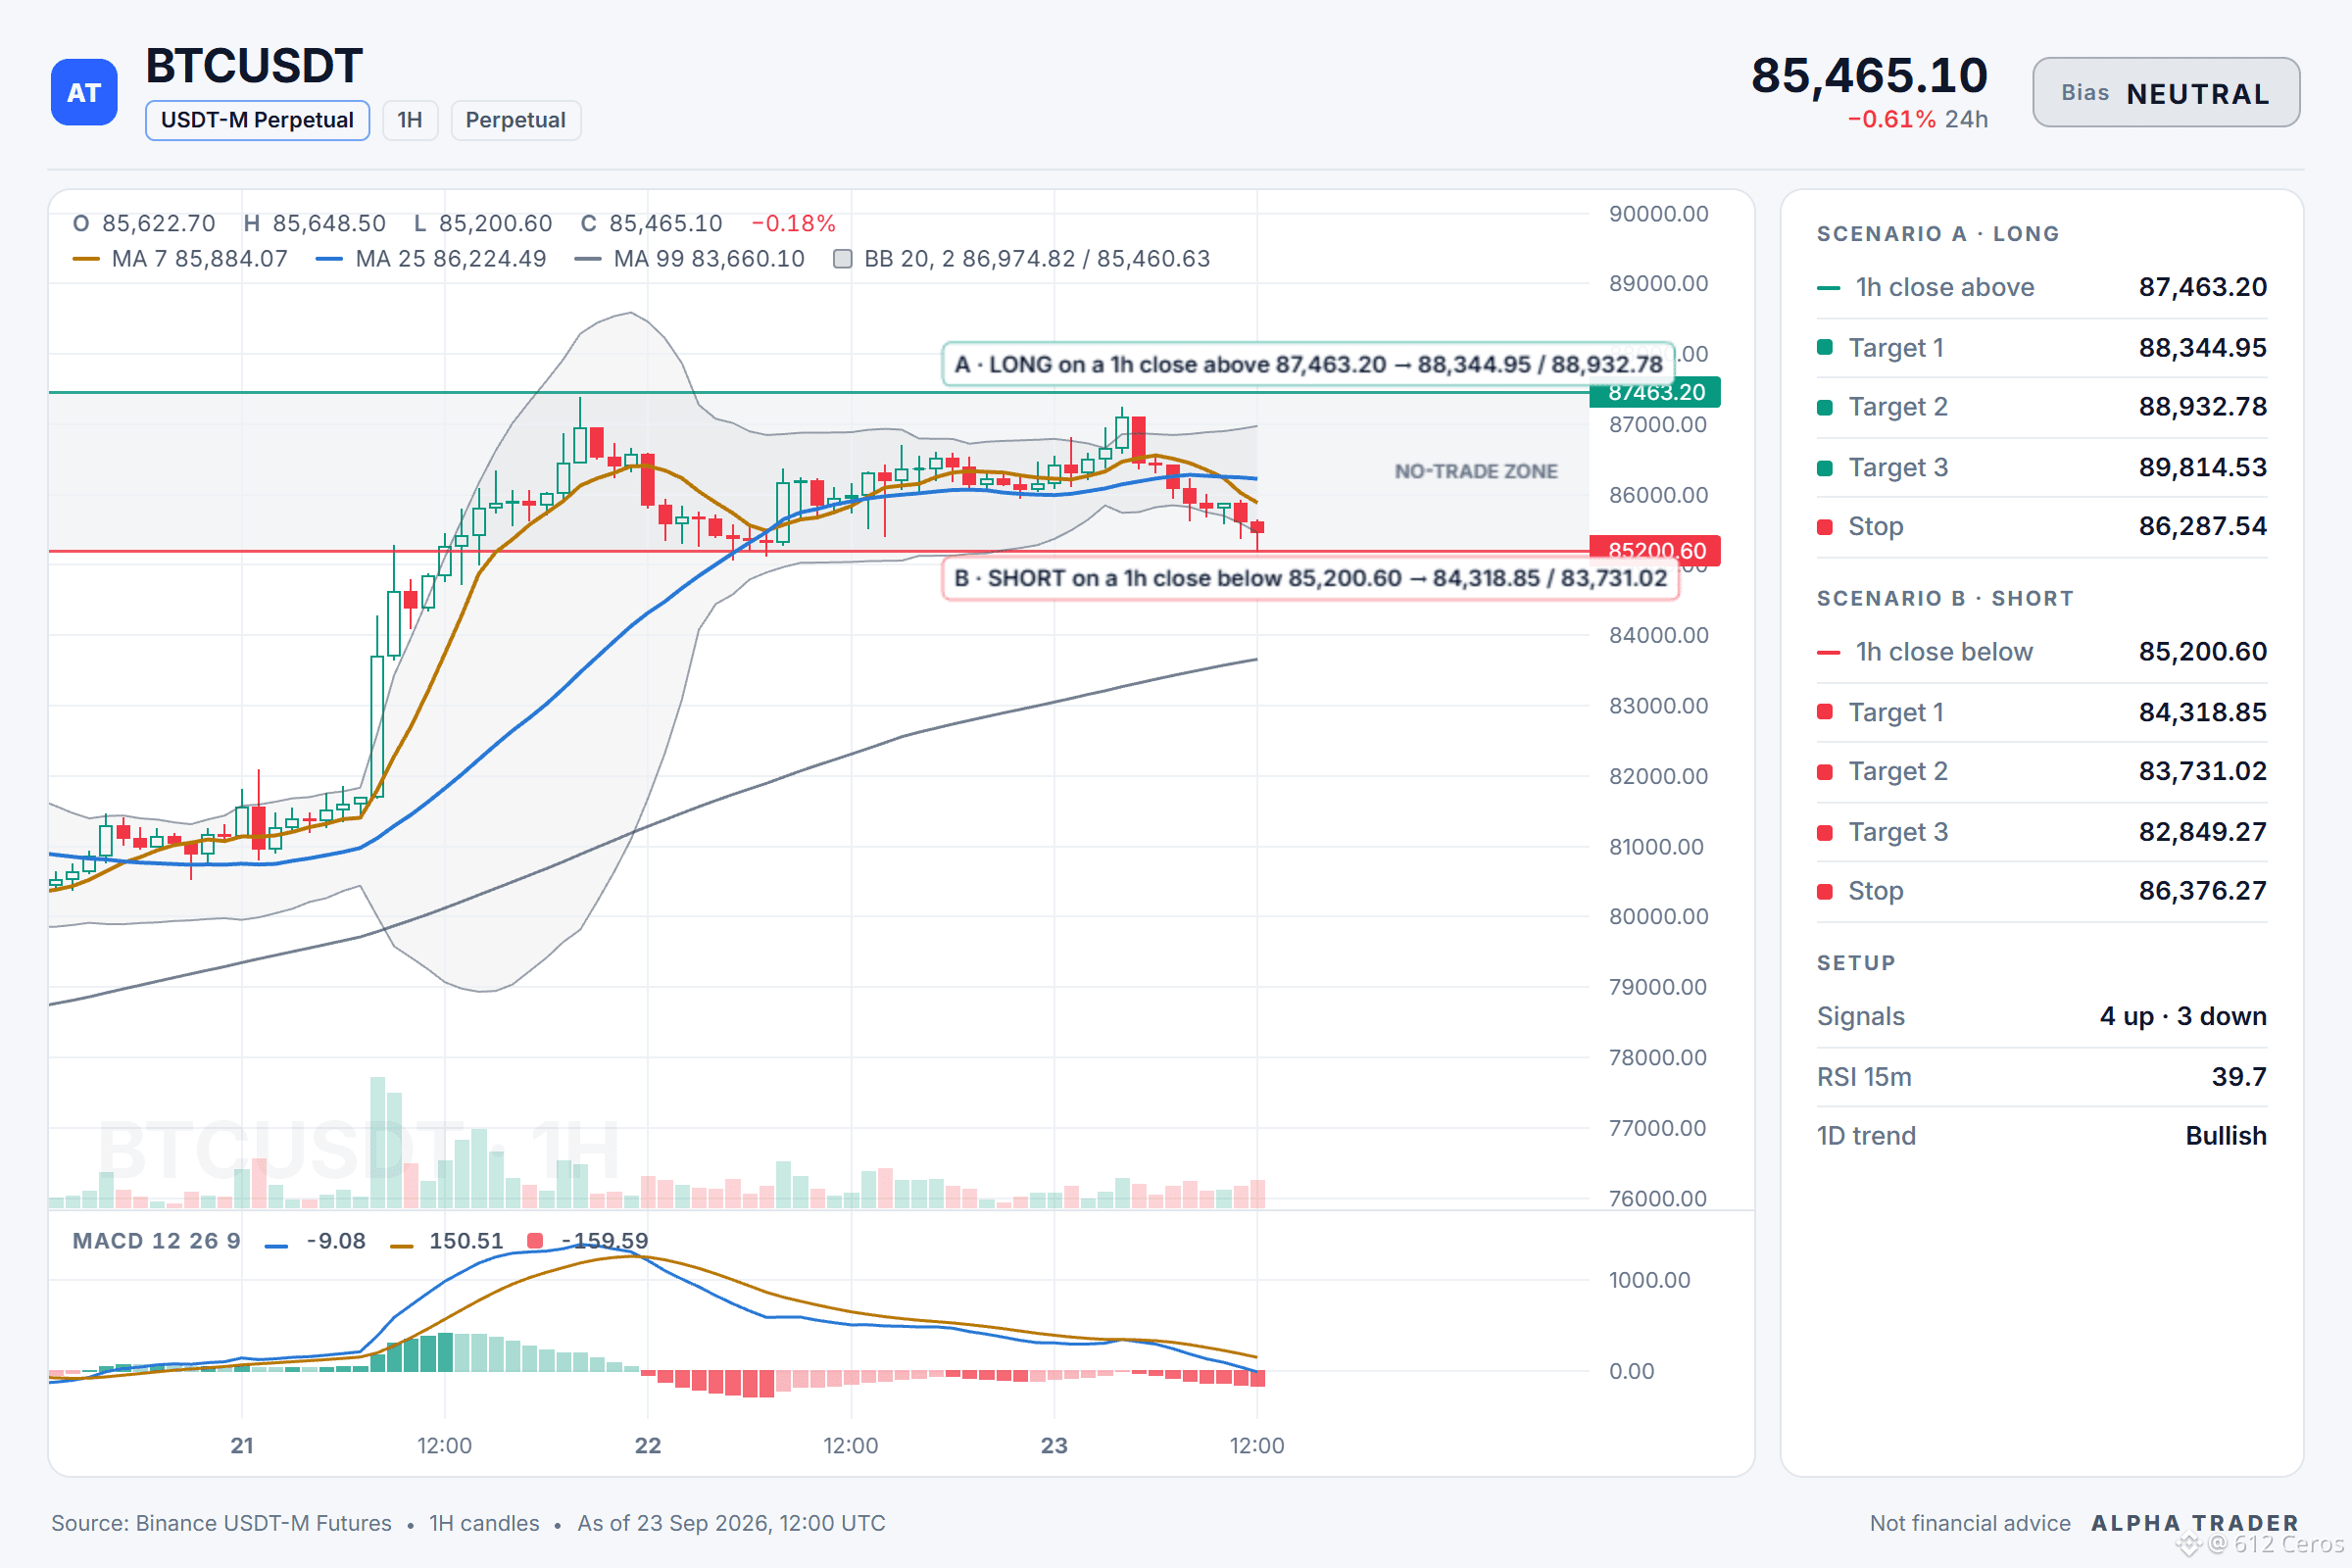
📊 $BTC /USDT · Bias: NEUTRAL (No edge) · 4 bullish vs 3 bearish
Technical verdict: NEUTRAL. 4 of 12 signals bullish, 3 bearish, 5 undecided.
What leans up:
🟢 Daily trend: price > EMA50 > EMA200, bullish stack
🟢 4h trend: price > EMA50 > EMA200, bullish stack
🟢 1h trend: price > EMA50 > EMA200, bullish stack
🟢 4h RSI: 65.2, bullish momentum (above 55)
What leans down:
🔴 Trend strength (ADX/DI, 15m): ADX 50.7 with sellers in control (DI+ 10.2 vs DI− 34.5)
🔴 BTC backdrop: BTC trend is bearish and correlation is 1.00
🔴 1h RSI: 39.8, bearish momentum (below 45)
Two scenarios, no position yet:
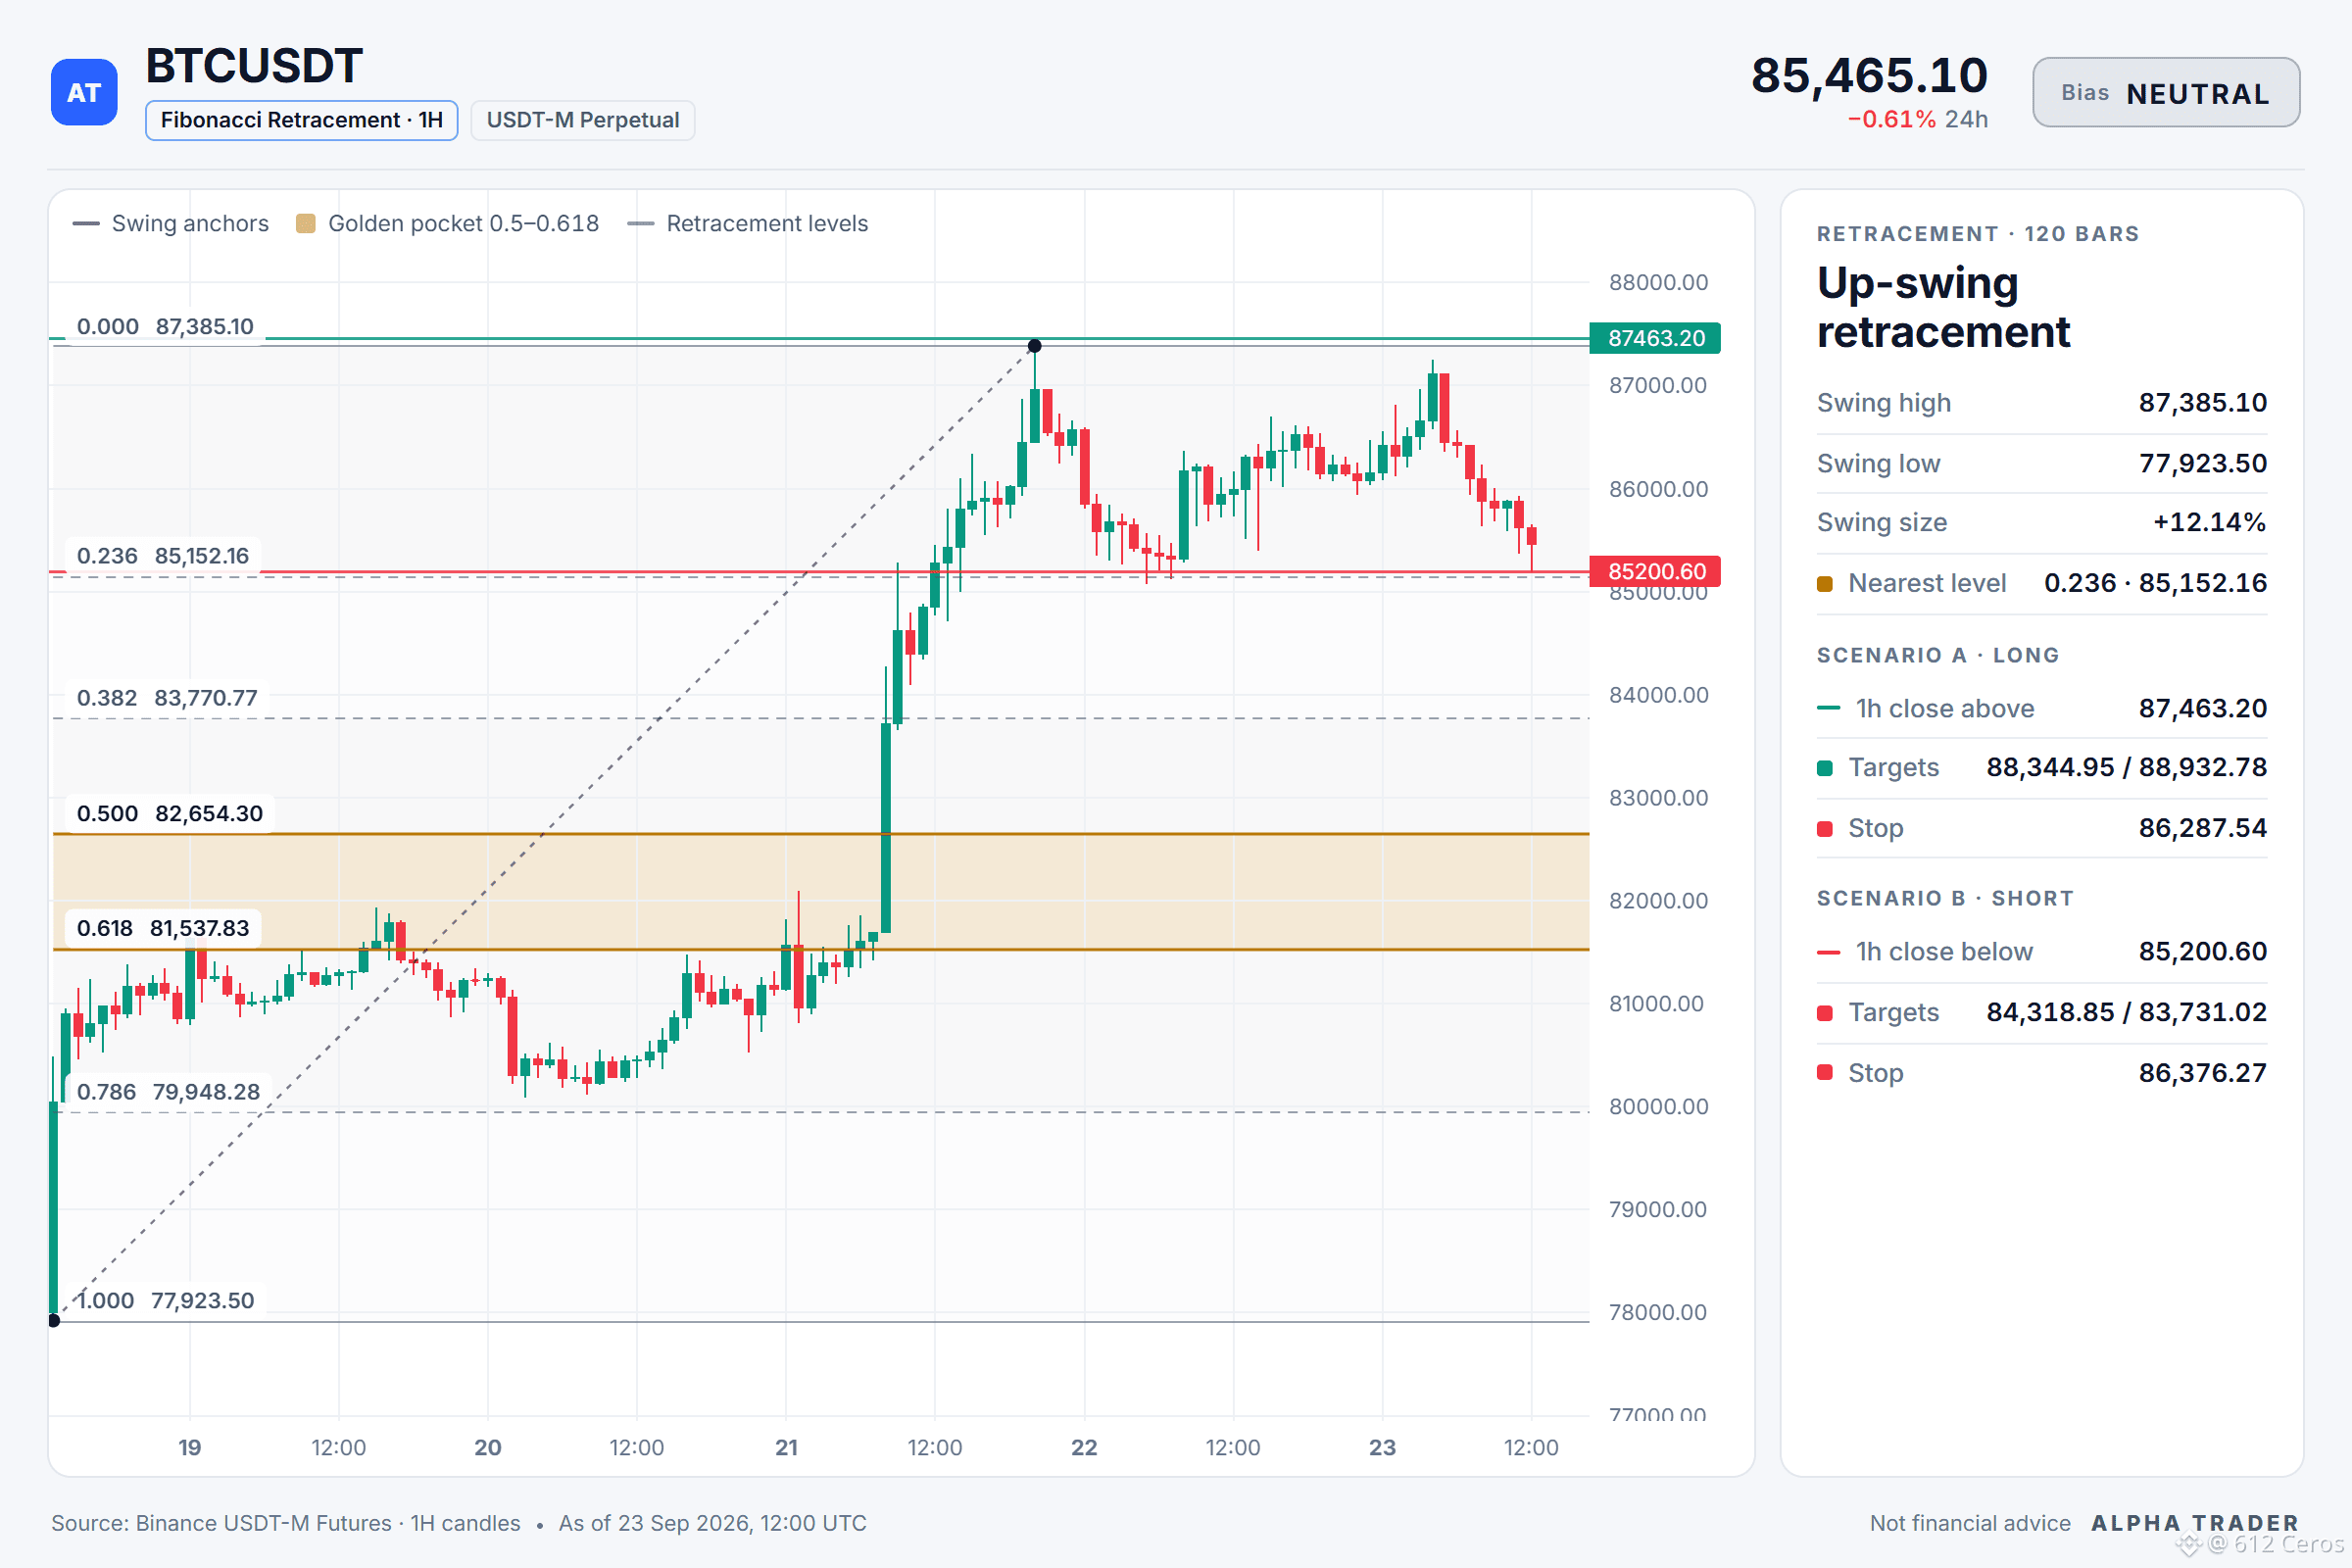
🟢 Scenario A: LONG on a 1h close above 87463.20 (top of the resistance zone)
Trigger 87463.20 → targets 88344.95 / 88932.78 / 89814.53, stop 86287.54
🔴 Scenario B: SHORT on a 1h close below 85200.60 (24h low)
Trigger 85200.60 → targets 84318.85 / 83731.02 / 82849.27, stop 86376.27
⏸ Between 85200.60 and 87463.20 (2.7% wide): no edge, no trade.
My read:
There is no trade for BTC yet. The daily trend is bullish with price above EMA50 above EMA200, and the 4h trend shows the same bullish stack. But the 1h RSI sits at 39.8 with bearish momentum, and ADX at 50.7 shows sellers in control with DI- at 34.5 versus DI+ at 10.2. A bullish scenario needs a 1h close above 87463.20 resistance; a bearish scenario needs a 1h close below 85200.60 support. I am not in either side yet.
Your call:
Which level do you think BTC will violate first, 87463.20 or 85200.60?
Levels mapped on the chart below 👇
{future}(BTCUSDT)
⚠️ Personal market analysis only. NFA — manage risk and DYOR.
Educational content, not investment advice or a recommendation to buy, sell, deposit, or withdraw any asset. No paid promotion; the invite link below is my own referral link, and I may earn a commission if you sign up through it — at no extra cost to you.
📲 Want more of my latest signals? Join me here:
[https://app.binance.com/uni-qr/D26WbL9t](https://app.binance.com/uni-qr/D26WbL9t)
No clear edge on BTC right now
📊 $BTC /USDT · Bias: NEUTRAL (No edge) · 4 bullish vs 3 bearish
Technical verdict: NEUTRAL. 4 of 12 signals bullish, 3 bearish, 5 undecided.
What leans up:
🟢 Daily trend: price > EMA50 > EMA200, bullish stack
🟢 4h trend: price > EMA50 > EMA200, bullish stack
🟢 1h trend: price > EMA50 > EMA200, bullish stack
🟢 4h RSI: 65.2, bullish momentum (above 55)
What leans down:
🔴 Trend strength (ADX/DI, 15m): ADX 50.7 with sellers in control (DI+ 10.2 vs DI− 34.5)
🔴 BTC backdrop: BTC trend is bearish and correlation is 1.00
🔴 1h RSI: 39.8, bearish momentum (below 45)
Two scenarios, no position yet:
🟢 Scenario A: LONG on a 1h close above 87463.20 (top of the resistance zone)
Trigger 87463.20 → targets 88344.95 / 88932.78 / 89814.53, stop 86287.54
🔴 Scenario B: SHORT on a 1h close below 85200.60 (24h low)
Trigger 85200.60 → targets 84318.85 / 83731.02 / 82849.27, stop 86376.27
⏸ Between 85200.60 and 87463.20 (2.7% wide): no edge, no trade.
My read:
There is no trade for BTC yet. The daily trend is bullish with price above EMA50 above EMA200, and the 4h trend shows the same bullish stack. But the 1h RSI sits at 39.8 with bearish momentum, and ADX at 50.7 shows sellers in control with DI- at 34.5 versus DI+ at 10.2. A bullish scenario needs a 1h close above 87463.20 resistance; a bearish scenario needs a 1h close below 85200.60 support. I am not in either side yet.
Your call:
Which level do you think BTC will violate first, 87463.20 or 85200.60?
Levels mapped on the chart below 👇
⚠️ Personal market analysis only. NFA — manage risk and DYOR.
Educational content, not investment advice or a recommendation to buy, sell, deposit, or withdraw any asset. No paid promotion; the invite link below is my own referral link, and I may earn a commission if you sign up through it — at no extra cost to you.
📲 Want more of my latest signals? Join me here:
https://app.binance.com/uni-qr/D26WbL9t
📊 $BTC /USDT · Bias: NEUTRAL (No edge) · 4 bullish vs 3 bearish
Technical verdict: NEUTRAL. 4 of 12 signals bullish, 3 bearish, 5 undecided.
What leans up:
🟢 Daily trend: price > EMA50 > EMA200, bullish stack
🟢 4h trend: price > EMA50 > EMA200, bullish stack
🟢 1h trend: price > EMA50 > EMA200, bullish stack
🟢 4h RSI: 65.2, bullish momentum (above 55)
What leans down:
🔴 Trend strength (ADX/DI, 15m): ADX 50.7 with sellers in control (DI+ 10.2 vs DI− 34.5)
🔴 BTC backdrop: BTC trend is bearish and correlation is 1.00
🔴 1h RSI: 39.8, bearish momentum (below 45)
Two scenarios, no position yet:
🟢 Scenario A: LONG on a 1h close above 87463.20 (top of the resistance zone)
Trigger 87463.20 → targets 88344.95 / 88932.78 / 89814.53, stop 86287.54
🔴 Scenario B: SHORT on a 1h close below 85200.60 (24h low)
Trigger 85200.60 → targets 84318.85 / 83731.02 / 82849.27, stop 86376.27
⏸ Between 85200.60 and 87463.20 (2.7% wide): no edge, no trade.
My read:
There is no trade for BTC yet. The daily trend is bullish with price above EMA50 above EMA200, and the 4h trend shows the same bullish stack. But the 1h RSI sits at 39.8 with bearish momentum, and ADX at 50.7 shows sellers in control with DI- at 34.5 versus DI+ at 10.2. A bullish scenario needs a 1h close above 87463.20 resistance; a bearish scenario needs a 1h close below 85200.60 support. I am not in either side yet.
Your call:
Which level do you think BTC will violate first, 87463.20 or 85200.60?
Levels mapped on the chart below 👇
⚠️ Personal market analysis only. NFA — manage risk and DYOR.
Educational content, not investment advice or a recommendation to buy, sell, deposit, or withdraw any asset. No paid promotion; the invite link below is my own referral link, and I may earn a commission if you sign up through it — at no extra cost to you.
📲 Want more of my latest signals? Join me here:
https://app.binance.com/uni-qr/D26WbL9t
2
8
1.8k
·
--
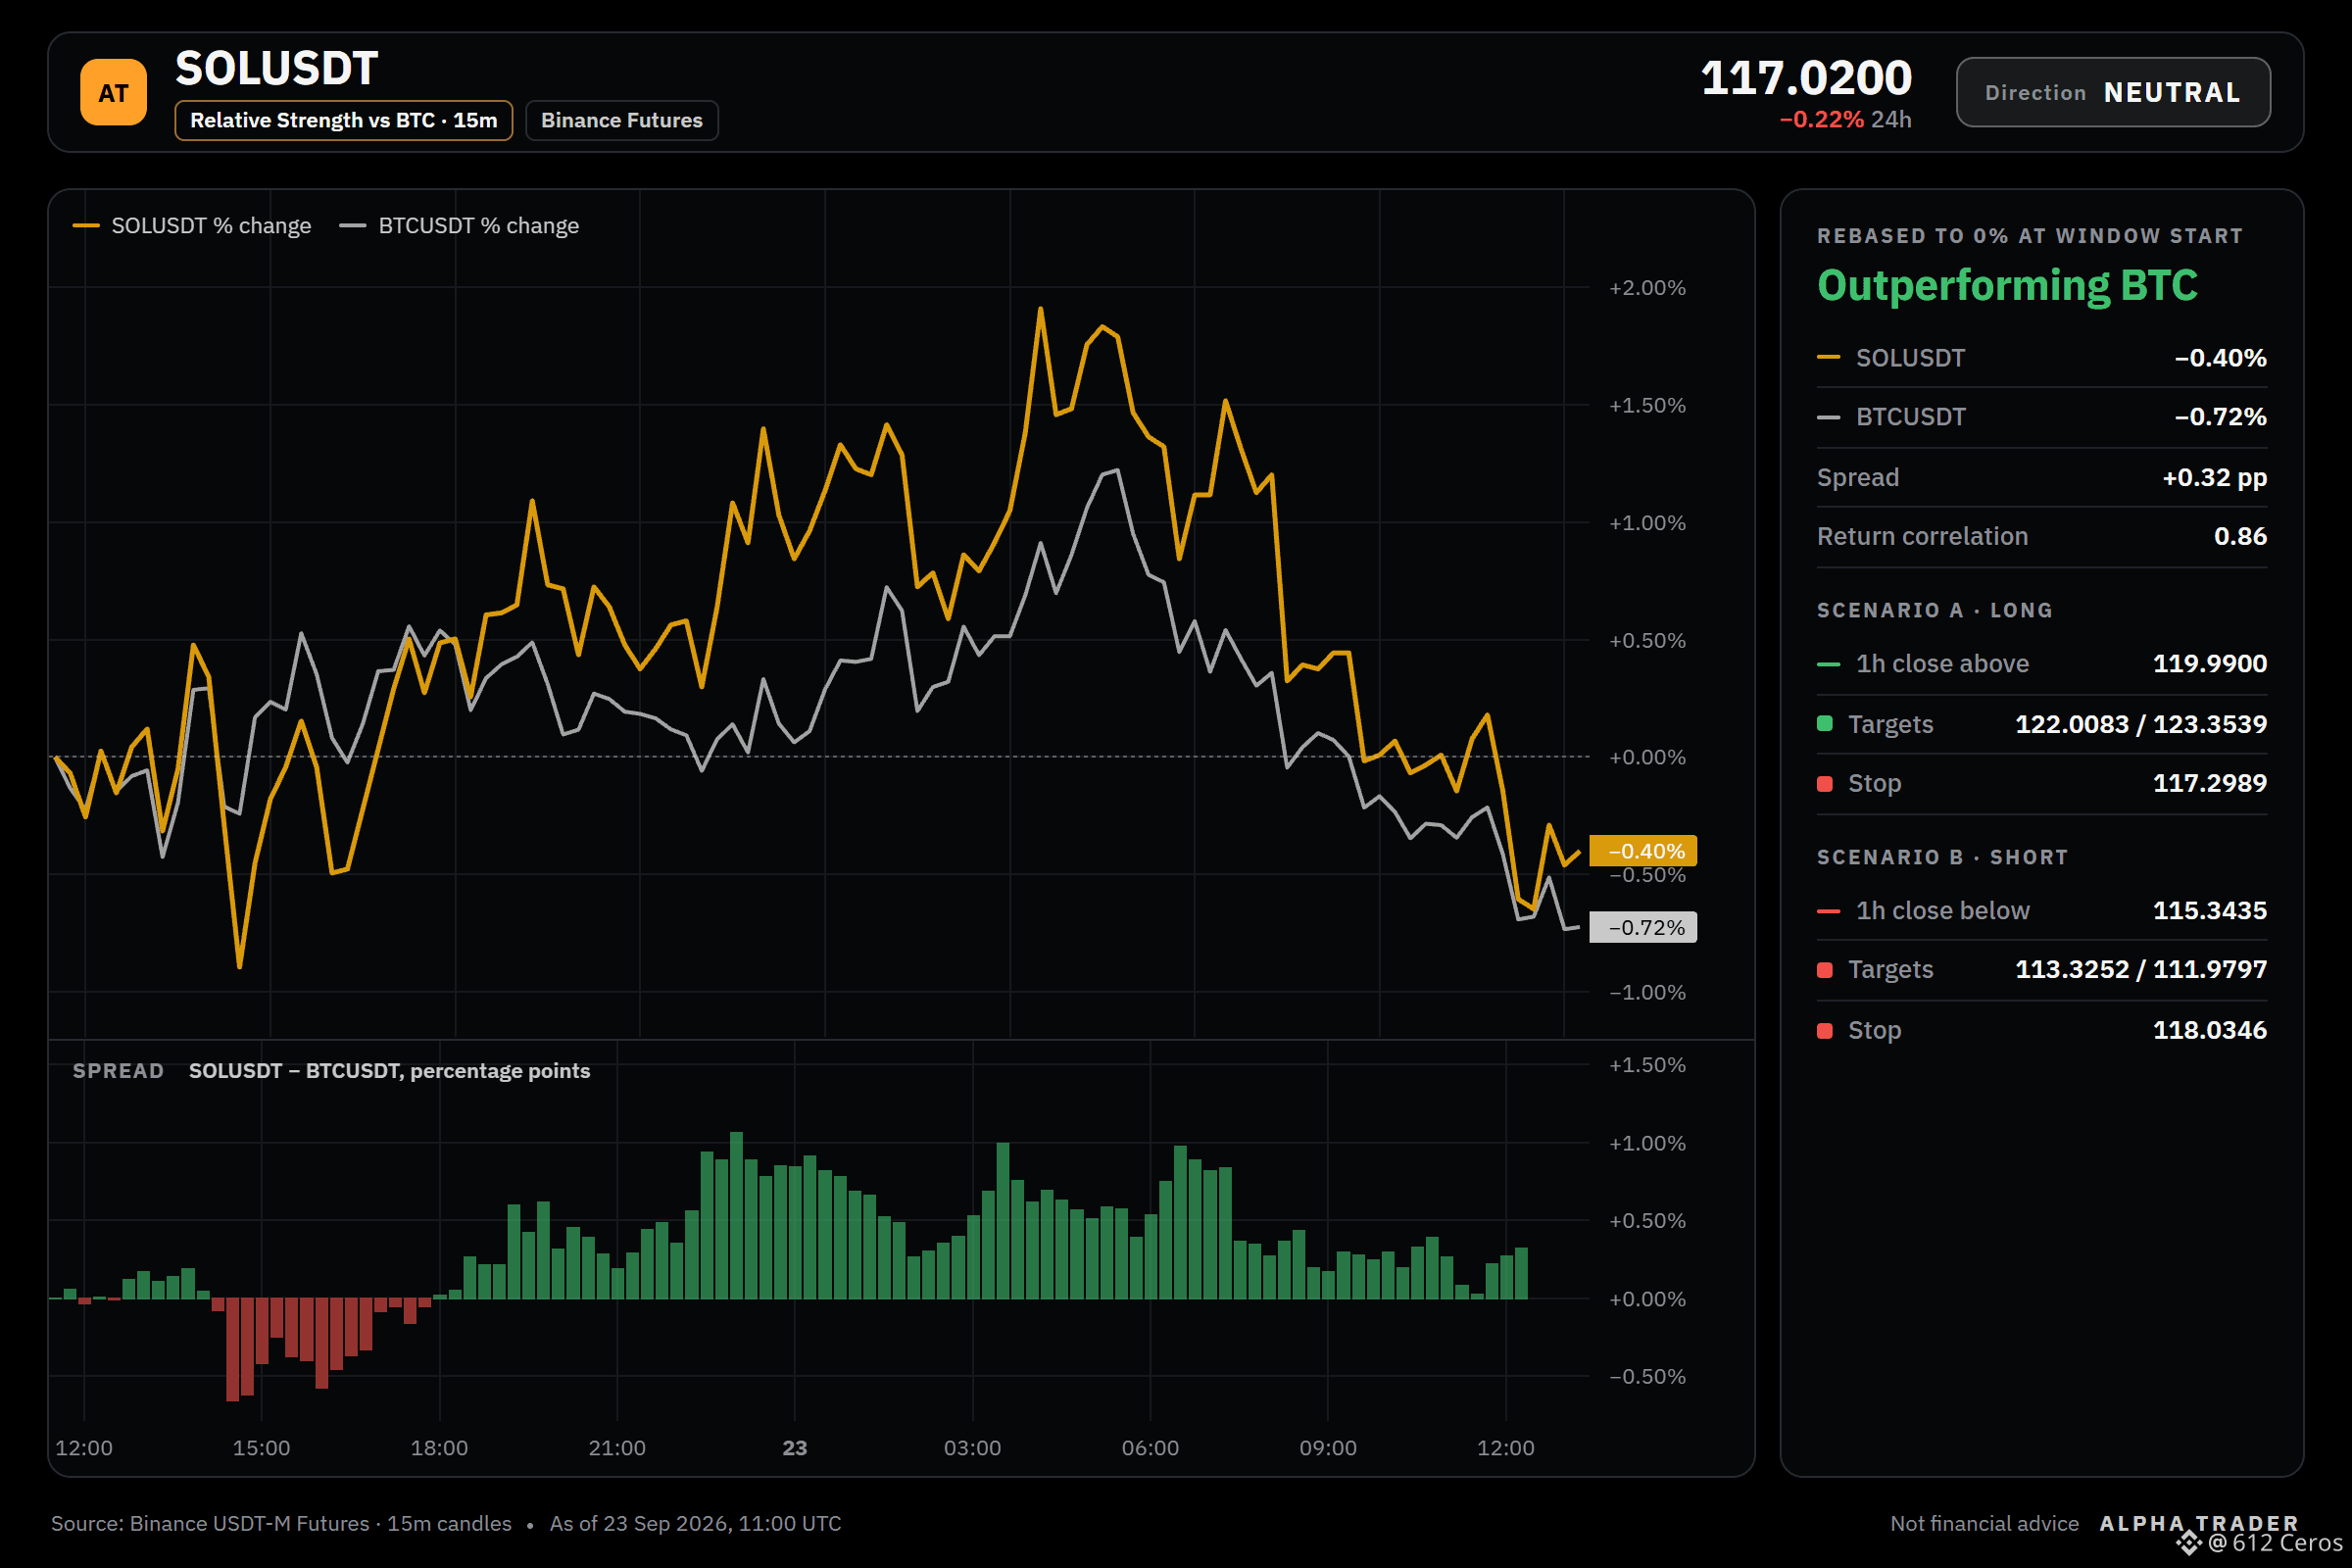
SOL is range-bound with no clear edge right now.
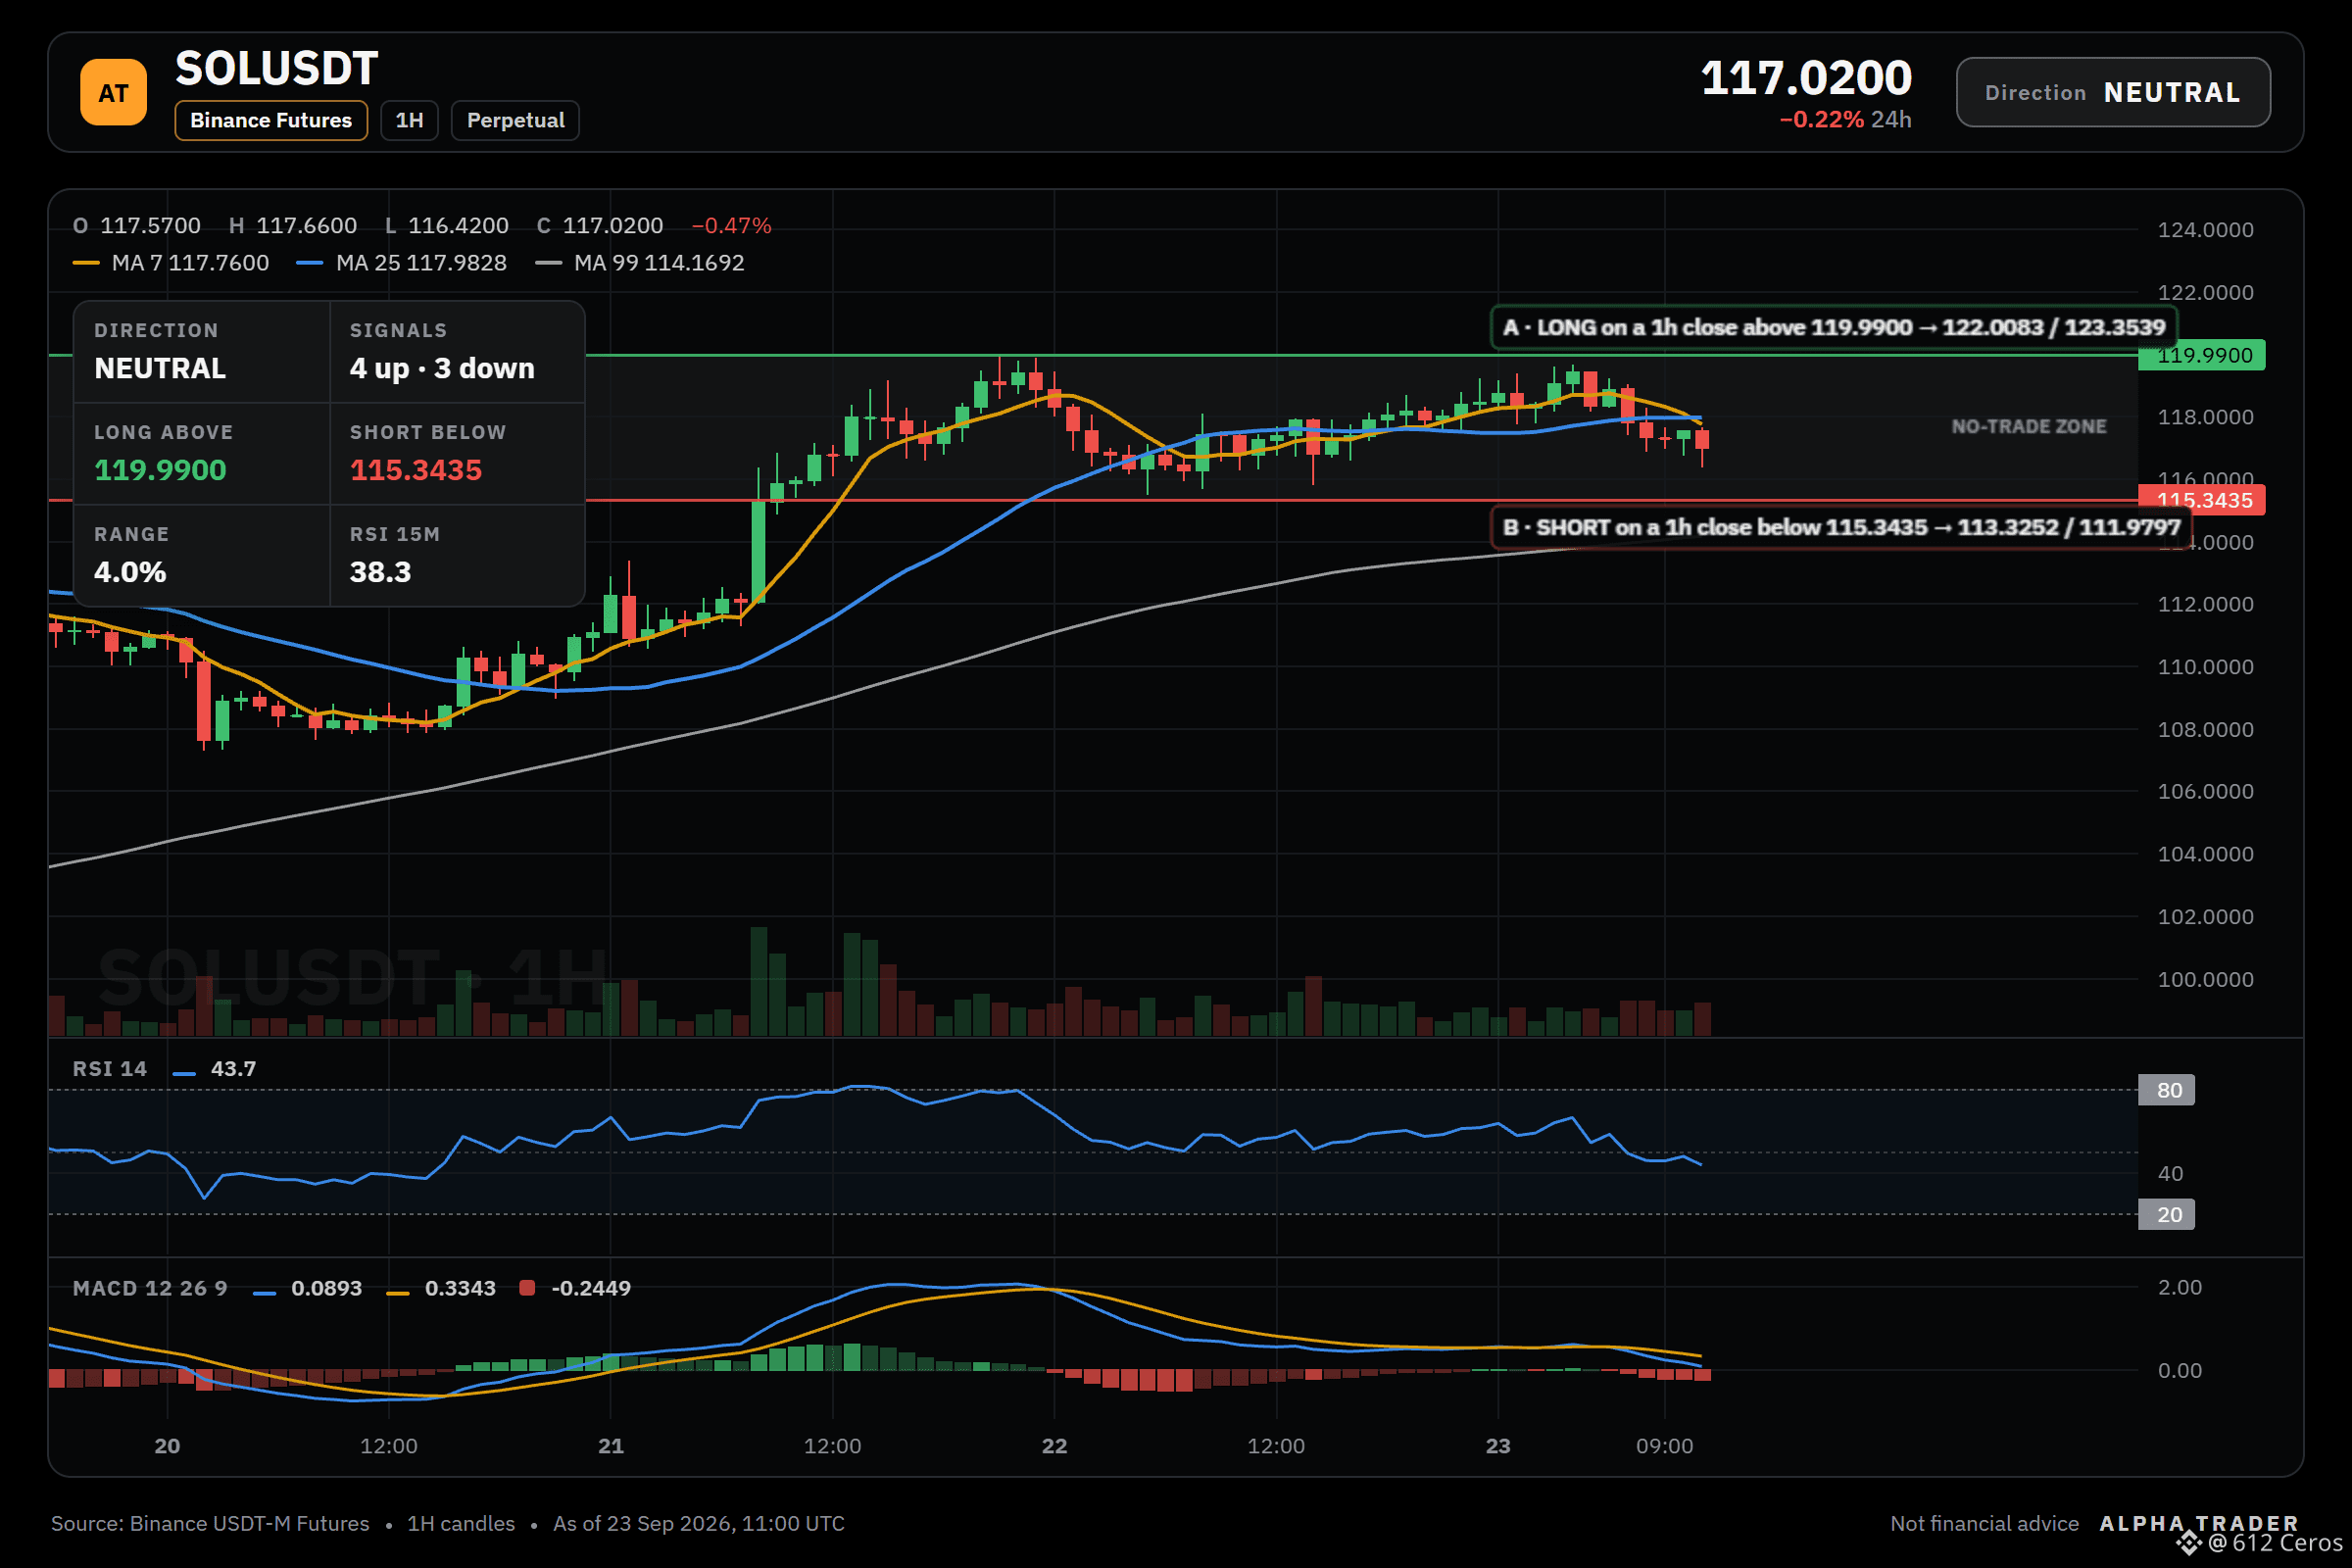
⚪ $SOL /USDT | Bias: NEUTRAL (No edge) | 4 bullish vs 3 bearish
Technical verdict: NEUTRAL. 4 of 12 signals bullish, 3 bearish, 5 undecided.
What leans up:
🟢 Daily trend: price > EMA50 > EMA200, bullish stack
🟢 4h trend: price > EMA50 > EMA200, bullish stack
🟢 1h trend: price > EMA50 > EMA200, bullish stack
🟢 4h RSI: 62.1, bullish momentum (above 55)
What leans down:
🔴 Trend strength (ADX/DI, 15m): ADX 34.4 with sellers in control (DI+ 12.8 vs DI− 28.1)
🔴 BTC backdrop: BTC trend is bearish and correlation is 0.89
🔴 1h RSI: 43.7, bearish momentum (below 45)
What would make me act:
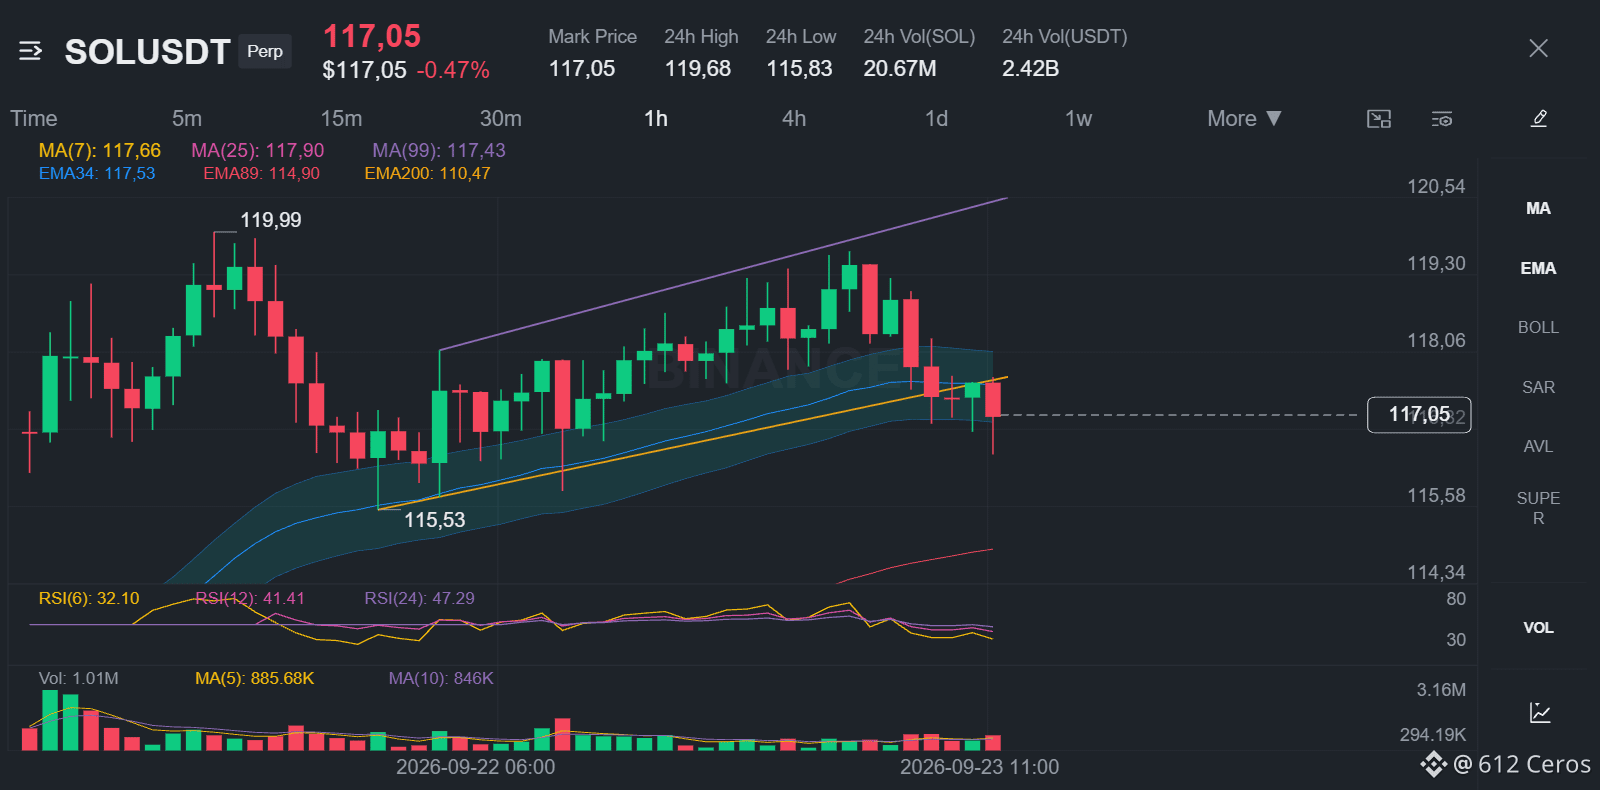
🟢 Scenario A: LONG on a 1h close above 119.9900 (top of the resistance zone)
Trigger 119.9900 → targets 122.0083 / 123.3539 / 125.3722, stop 117.2989
🔴 Scenario B: SHORT on a 1h close below 115.3435 (bottom of the support zone)
Trigger 115.3435 → targets 113.3252 / 111.9797 / 109.9613, stop 118.0346
⏸ Between 115.3435 and 119.9900 (4.0% wide): no edge, no trade.
My read:
There is no edge right now because the daily trend remains bullish with price above both the 50 and 200 period EMAs, and the 4h trend also shows price above those EMAs, while the strongest bearish factor is the 15m ADX at 34.4 with sellers in control (DI+ 12.8 vs DI− 28.1). The 4h RSI sits at 62.1 showing bullish momentum, but the 1h RSI is at 43.7 indicating bearish momentum and BTC is trending bearish with a 0.89 correlation. A long setup needs a 1h close above 119.9900, and a short setup needs a 1h close below 115.3435.
Over to you:
Which trigger level do you think SOL will respect first, 119.9900 or 115.3435?
Levels mapped on the chart below 👇
{future}(SOLUSDT)
⚠️ Personal market analysis only. NFA — manage risk and DYOR.
Educational content, not investment advice or a recommendation to buy, sell, deposit, or withdraw any asset. No paid promotion or referral/affiliate links.
SOL is range-bound with no clear edge right now.
⚪ $SOL /USDT | Bias: NEUTRAL (No edge) | 4 bullish vs 3 bearish
Technical verdict: NEUTRAL. 4 of 12 signals bullish, 3 bearish, 5 undecided.
What leans up:
🟢 Daily trend: price > EMA50 > EMA200, bullish stack
🟢 4h trend: price > EMA50 > EMA200, bullish stack
🟢 1h trend: price > EMA50 > EMA200, bullish stack
🟢 4h RSI: 62.1, bullish momentum (above 55)
What leans down:
🔴 Trend strength (ADX/DI, 15m): ADX 34.4 with sellers in control (DI+ 12.8 vs DI− 28.1)
🔴 BTC backdrop: BTC trend is bearish and correlation is 0.89
🔴 1h RSI: 43.7, bearish momentum (below 45)
What would make me act:
🟢 Scenario A: LONG on a 1h close above 119.9900 (top of the resistance zone)
Trigger 119.9900 → targets 122.0083 / 123.3539 / 125.3722, stop 117.2989
🔴 Scenario B: SHORT on a 1h close below 115.3435 (bottom of the support zone)
Trigger 115.3435 → targets 113.3252 / 111.9797 / 109.9613, stop 118.0346
⏸ Between 115.3435 and 119.9900 (4.0% wide): no edge, no trade.
My read:
There is no edge right now because the daily trend remains bullish with price above both the 50 and 200 period EMAs, and the 4h trend also shows price above those EMAs, while the strongest bearish factor is the 15m ADX at 34.4 with sellers in control (DI+ 12.8 vs DI− 28.1). The 4h RSI sits at 62.1 showing bullish momentum, but the 1h RSI is at 43.7 indicating bearish momentum and BTC is trending bearish with a 0.89 correlation. A long setup needs a 1h close above 119.9900, and a short setup needs a 1h close below 115.3435.
Over to you:
Which trigger level do you think SOL will respect first, 119.9900 or 115.3435?
Levels mapped on the chart below 👇
⚠️ Personal market analysis only. NFA — manage risk and DYOR.
Educational content, not investment advice or a recommendation to buy, sell, deposit, or withdraw any asset. No paid promotion or referral/affiliate links.
⚪ $SOL /USDT | Bias: NEUTRAL (No edge) | 4 bullish vs 3 bearish
Technical verdict: NEUTRAL. 4 of 12 signals bullish, 3 bearish, 5 undecided.
What leans up:
🟢 Daily trend: price > EMA50 > EMA200, bullish stack
🟢 4h trend: price > EMA50 > EMA200, bullish stack
🟢 1h trend: price > EMA50 > EMA200, bullish stack
🟢 4h RSI: 62.1, bullish momentum (above 55)
What leans down:
🔴 Trend strength (ADX/DI, 15m): ADX 34.4 with sellers in control (DI+ 12.8 vs DI− 28.1)
🔴 BTC backdrop: BTC trend is bearish and correlation is 0.89
🔴 1h RSI: 43.7, bearish momentum (below 45)
What would make me act:
🟢 Scenario A: LONG on a 1h close above 119.9900 (top of the resistance zone)
Trigger 119.9900 → targets 122.0083 / 123.3539 / 125.3722, stop 117.2989
🔴 Scenario B: SHORT on a 1h close below 115.3435 (bottom of the support zone)
Trigger 115.3435 → targets 113.3252 / 111.9797 / 109.9613, stop 118.0346
⏸ Between 115.3435 and 119.9900 (4.0% wide): no edge, no trade.
My read:
There is no edge right now because the daily trend remains bullish with price above both the 50 and 200 period EMAs, and the 4h trend also shows price above those EMAs, while the strongest bearish factor is the 15m ADX at 34.4 with sellers in control (DI+ 12.8 vs DI− 28.1). The 4h RSI sits at 62.1 showing bullish momentum, but the 1h RSI is at 43.7 indicating bearish momentum and BTC is trending bearish with a 0.89 correlation. A long setup needs a 1h close above 119.9900, and a short setup needs a 1h close below 115.3435.
Over to you:
Which trigger level do you think SOL will respect first, 119.9900 or 115.3435?
Levels mapped on the chart below 👇
⚠️ Personal market analysis only. NFA — manage risk and DYOR.
Educational content, not investment advice or a recommendation to buy, sell, deposit, or withdraw any asset. No paid promotion or referral/affiliate links.
2
3
2.3k
·
--
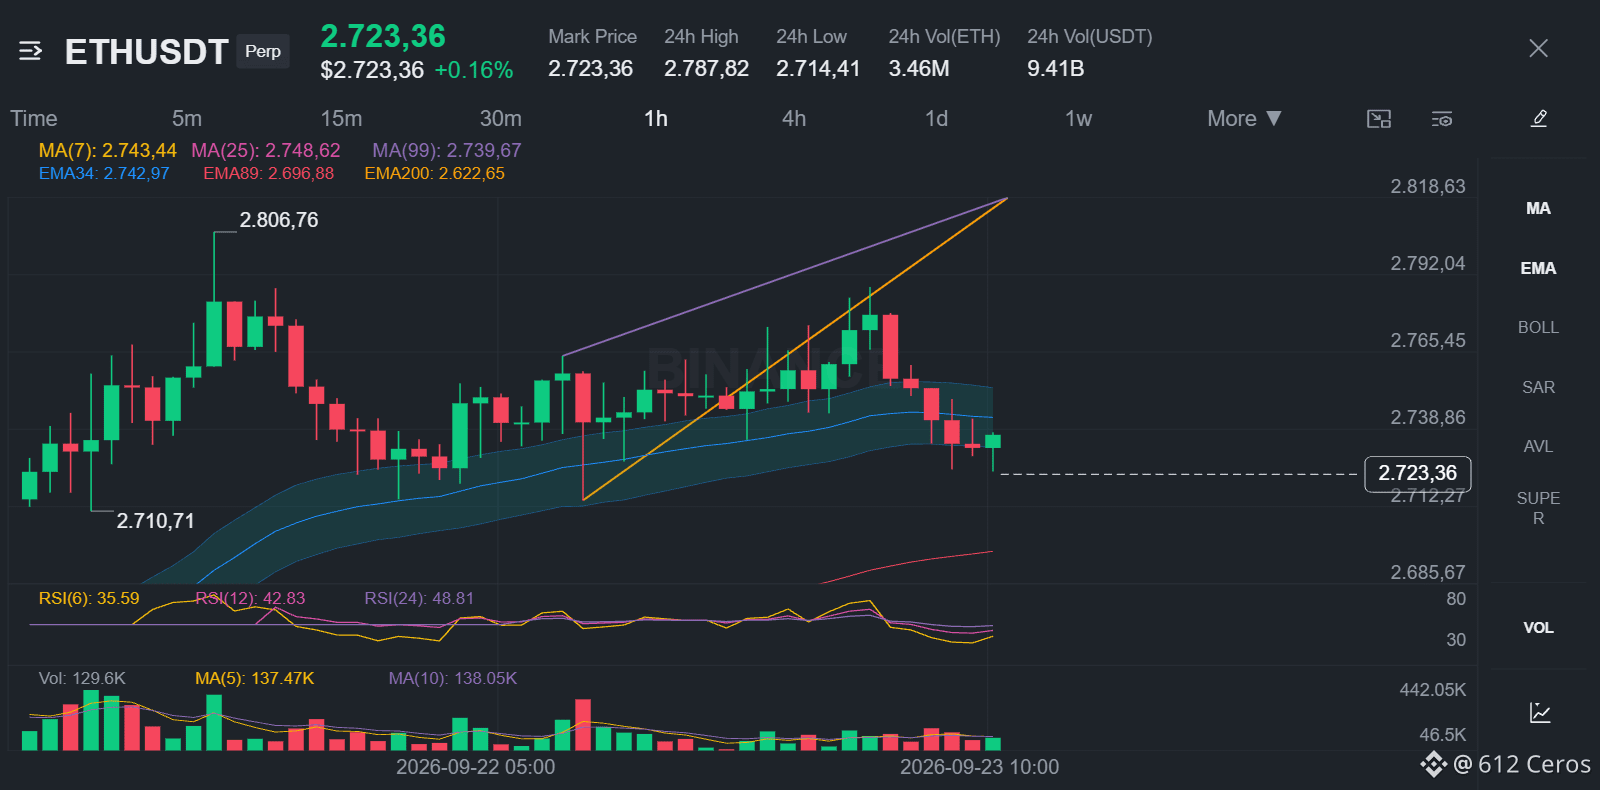
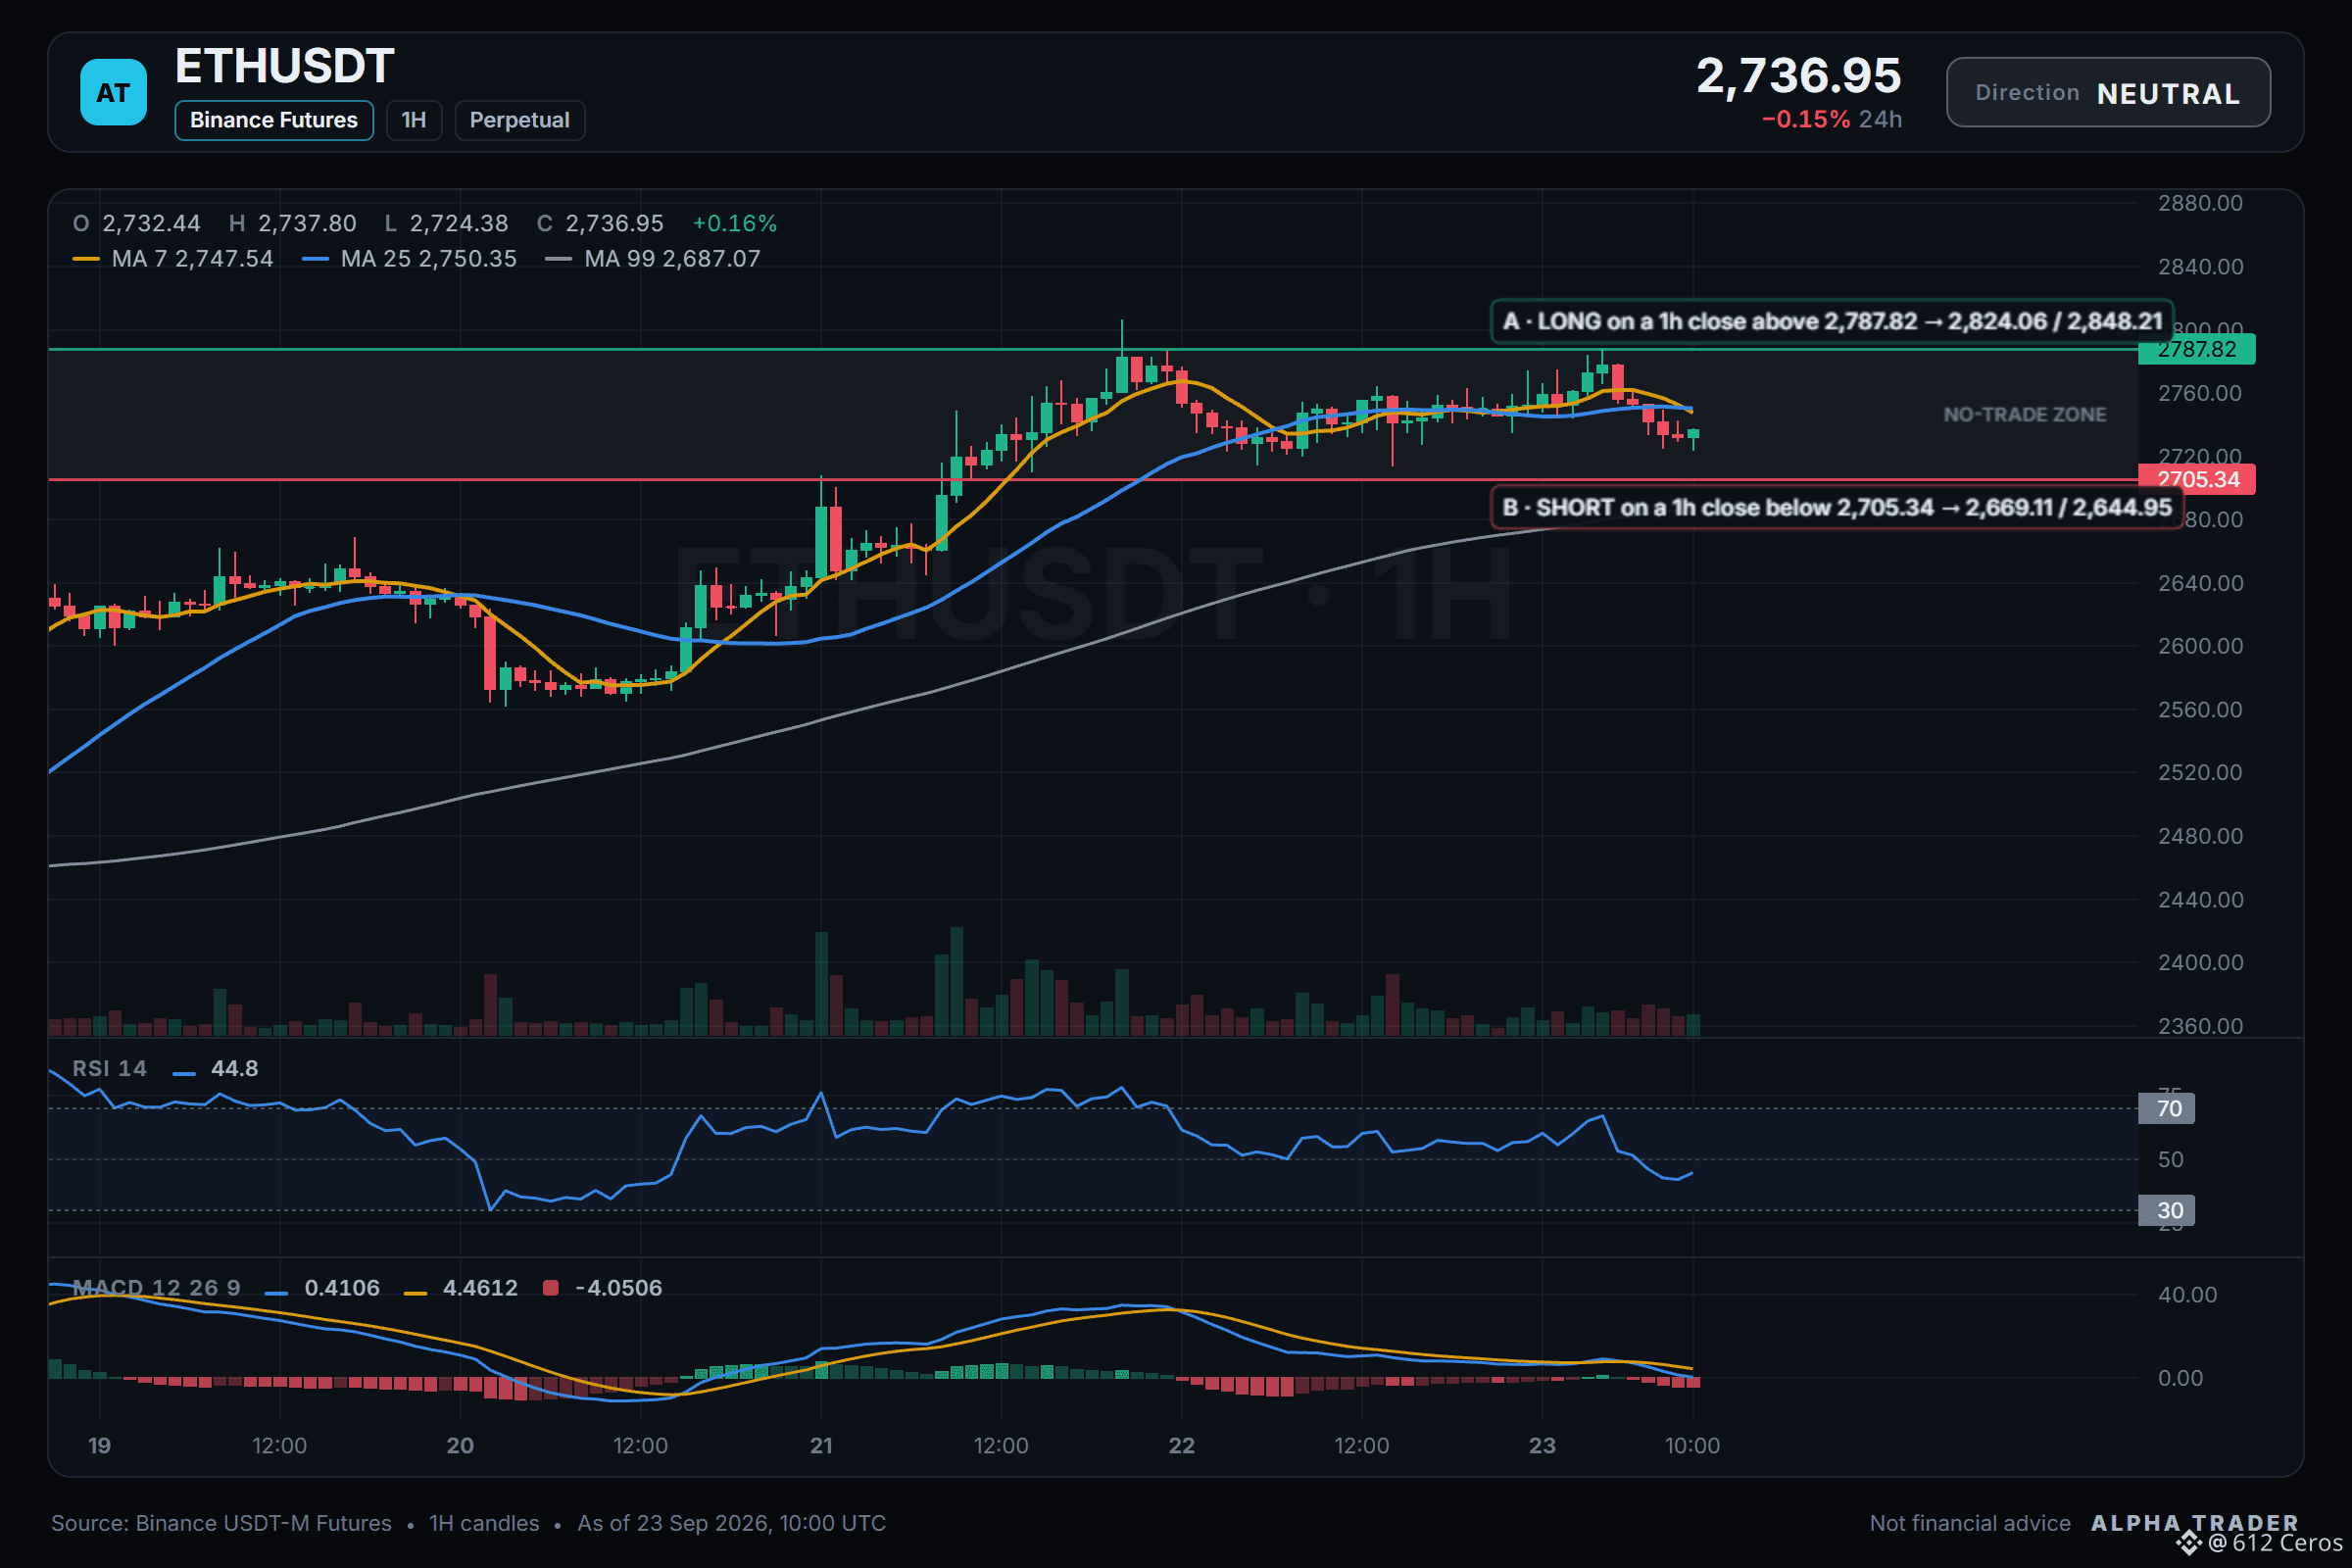
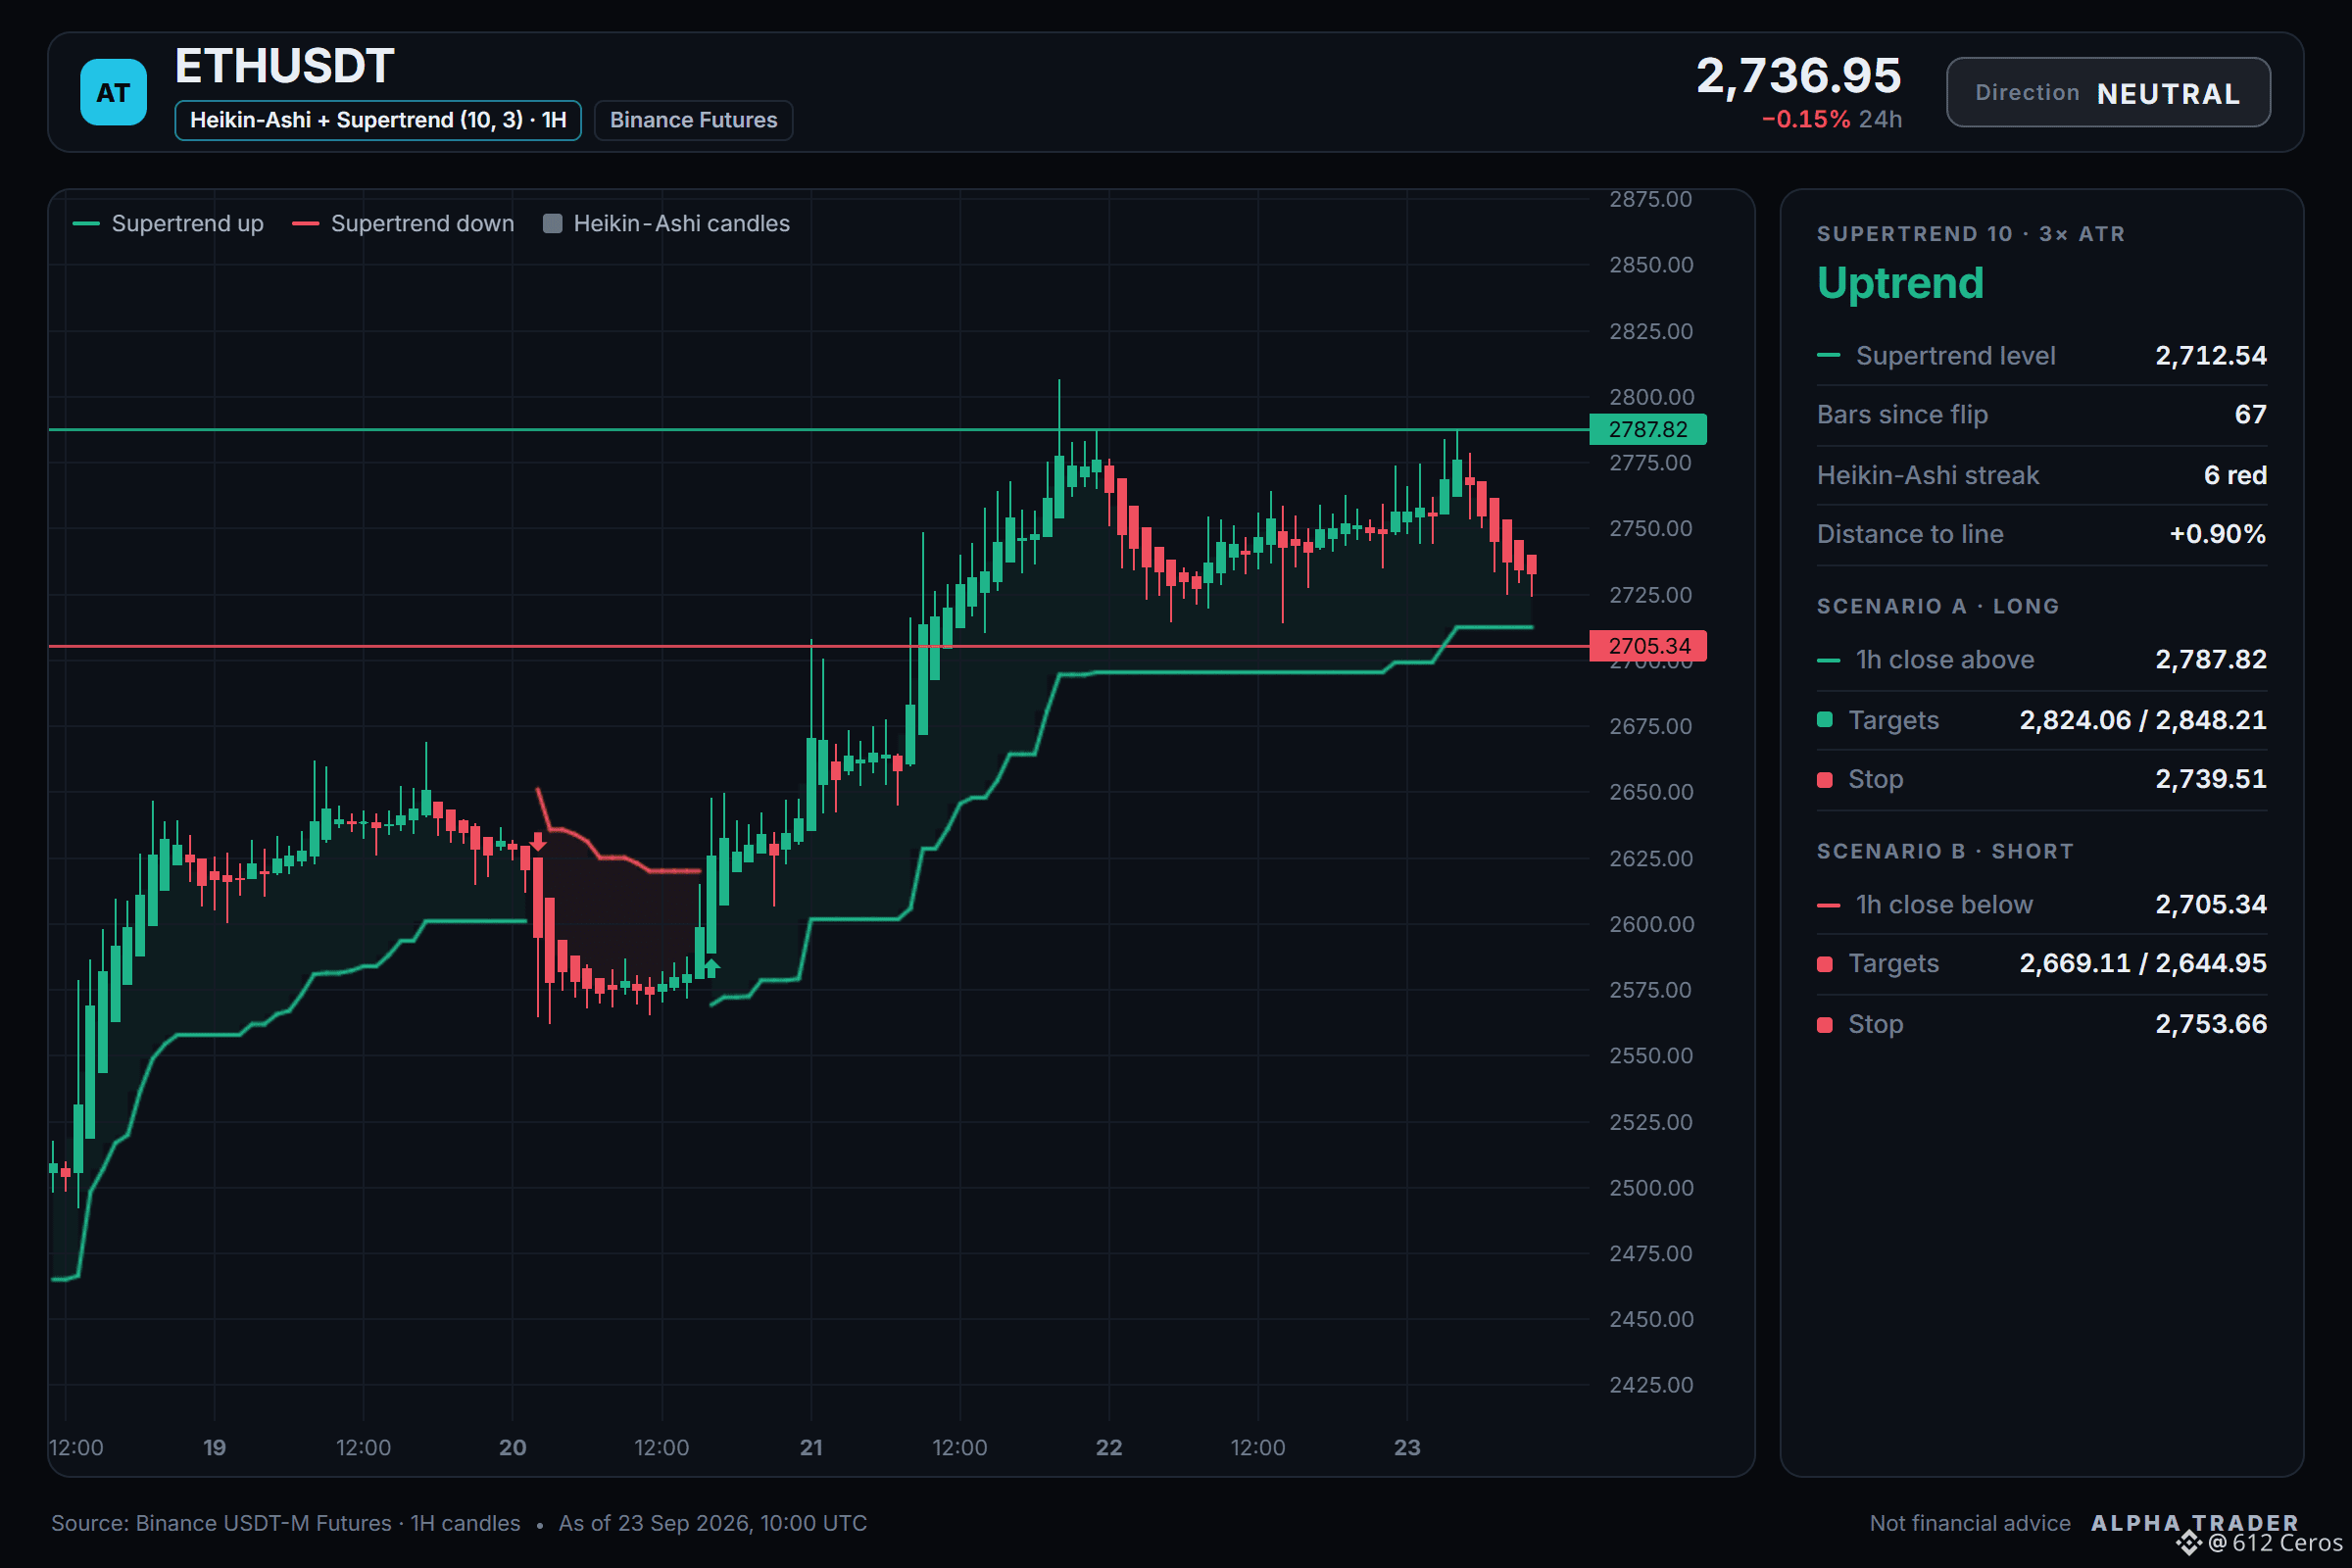
ETH has three bullish counts against five bearish ones right now
⚪ $ETH /USDT | Bias: NEUTRAL (No edge) | 3 bullish vs 5 bearish
Technical verdict: NEUTRAL. 3 of 12 signals bullish, 5 bearish, 4 undecided.
What leans up:
🟢 Daily trend: price > EMA50 > EMA200, bullish stack
🟢 4h trend: price > EMA50 > EMA200, bullish stack
🟢 4h RSI: 63.4, bullish momentum (above 55)
What leans down:
🔴 Trend strength (ADX/DI, 15m): ADX 34.6 with sellers in control (DI+ 11.3 vs DI− 32.5)
🔴 BTC backdrop: BTC trend is bearish and correlation is 0.90
🔴 1h RSI: 44.8, bearish momentum (below 45)
🔴 Short-term momentum (15m): RSI z-score −1.44, last candle −0.33%, sellers pressing
What would make me act:
🟢 Scenario A: LONG on a 1h close above 2787.82 (24h high)
Trigger 2787.82 → targets 2824.06 / 2848.21 / 2884.45, stop 2739.51
🔴 Scenario B: SHORT on a 1h close below 2705.34 (bottom of the support zone)
Trigger 2705.34 → targets 2669.11 / 2644.95 / 2608.72, stop 2753.66
⏸ Between 2705.34 and 2787.82 (3.0% wide): no edge, no trade.
What would tip it:
There is no edge at 2723.36 because three BULLISH factors (daily bullish stack, 4h bullish stack, 4h RSI 63.4) are outweighed by five BEARISH ones (1h RSI 44.8, 15m ADX 34.6 with sellers dominant at DI+ 11.3 vs DI- 32.5, BTC bearish trend at 0.90 correlation, 1h red candle with volume z-score +2.4). A long setup needs a 1h close above 2787.82, while a short setup needs a 1h close below 2705.34. No position is being taken until one of those triggers prints.
Your call:
Which trigger do you think ETH will respect first, 2787.82 or 2705.34?
Levels mapped on the chart below 👇
{future}(ETHUSDT)
⚠️ Personal market analysis only. NFA — manage risk and DYOR.
Educational content, not investment advice or a recommendation to buy, sell, deposit, or withdraw any asset. No paid promotion or referral/affiliate links.
ETH has three bullish counts against five bearish ones right now
⚪ $ETH /USDT | Bias: NEUTRAL (No edge) | 3 bullish vs 5 bearish
Technical verdict: NEUTRAL. 3 of 12 signals bullish, 5 bearish, 4 undecided.
What leans up:
🟢 Daily trend: price > EMA50 > EMA200, bullish stack
🟢 4h trend: price > EMA50 > EMA200, bullish stack
🟢 4h RSI: 63.4, bullish momentum (above 55)
What leans down:
🔴 Trend strength (ADX/DI, 15m): ADX 34.6 with sellers in control (DI+ 11.3 vs DI− 32.5)
🔴 BTC backdrop: BTC trend is bearish and correlation is 0.90
🔴 1h RSI: 44.8, bearish momentum (below 45)
🔴 Short-term momentum (15m): RSI z-score −1.44, last candle −0.33%, sellers pressing
What would make me act:
🟢 Scenario A: LONG on a 1h close above 2787.82 (24h high)
Trigger 2787.82 → targets 2824.06 / 2848.21 / 2884.45, stop 2739.51
🔴 Scenario B: SHORT on a 1h close below 2705.34 (bottom of the support zone)
Trigger 2705.34 → targets 2669.11 / 2644.95 / 2608.72, stop 2753.66
⏸ Between 2705.34 and 2787.82 (3.0% wide): no edge, no trade.
What would tip it:
There is no edge at 2723.36 because three BULLISH factors (daily bullish stack, 4h bullish stack, 4h RSI 63.4) are outweighed by five BEARISH ones (1h RSI 44.8, 15m ADX 34.6 with sellers dominant at DI+ 11.3 vs DI- 32.5, BTC bearish trend at 0.90 correlation, 1h red candle with volume z-score +2.4). A long setup needs a 1h close above 2787.82, while a short setup needs a 1h close below 2705.34. No position is being taken until one of those triggers prints.
Your call:
Which trigger do you think ETH will respect first, 2787.82 or 2705.34?
Levels mapped on the chart below 👇
⚠️ Personal market analysis only. NFA — manage risk and DYOR.
Educational content, not investment advice or a recommendation to buy, sell, deposit, or withdraw any asset. No paid promotion or referral/affiliate links.
⚪ $ETH /USDT | Bias: NEUTRAL (No edge) | 3 bullish vs 5 bearish
Technical verdict: NEUTRAL. 3 of 12 signals bullish, 5 bearish, 4 undecided.
What leans up:
🟢 Daily trend: price > EMA50 > EMA200, bullish stack
🟢 4h trend: price > EMA50 > EMA200, bullish stack
🟢 4h RSI: 63.4, bullish momentum (above 55)
What leans down:
🔴 Trend strength (ADX/DI, 15m): ADX 34.6 with sellers in control (DI+ 11.3 vs DI− 32.5)
🔴 BTC backdrop: BTC trend is bearish and correlation is 0.90
🔴 1h RSI: 44.8, bearish momentum (below 45)
🔴 Short-term momentum (15m): RSI z-score −1.44, last candle −0.33%, sellers pressing
What would make me act:
🟢 Scenario A: LONG on a 1h close above 2787.82 (24h high)
Trigger 2787.82 → targets 2824.06 / 2848.21 / 2884.45, stop 2739.51
🔴 Scenario B: SHORT on a 1h close below 2705.34 (bottom of the support zone)
Trigger 2705.34 → targets 2669.11 / 2644.95 / 2608.72, stop 2753.66
⏸ Between 2705.34 and 2787.82 (3.0% wide): no edge, no trade.
What would tip it:
There is no edge at 2723.36 because three BULLISH factors (daily bullish stack, 4h bullish stack, 4h RSI 63.4) are outweighed by five BEARISH ones (1h RSI 44.8, 15m ADX 34.6 with sellers dominant at DI+ 11.3 vs DI- 32.5, BTC bearish trend at 0.90 correlation, 1h red candle with volume z-score +2.4). A long setup needs a 1h close above 2787.82, while a short setup needs a 1h close below 2705.34. No position is being taken until one of those triggers prints.
Your call:
Which trigger do you think ETH will respect first, 2787.82 or 2705.34?
Levels mapped on the chart below 👇
⚠️ Personal market analysis only. NFA — manage risk and DYOR.
Educational content, not investment advice or a recommendation to buy, sell, deposit, or withdraw any asset. No paid promotion or referral/affiliate links.
2
1.8k
·
--
Bearish
HEMI keeps sliding below its daily moving averages.
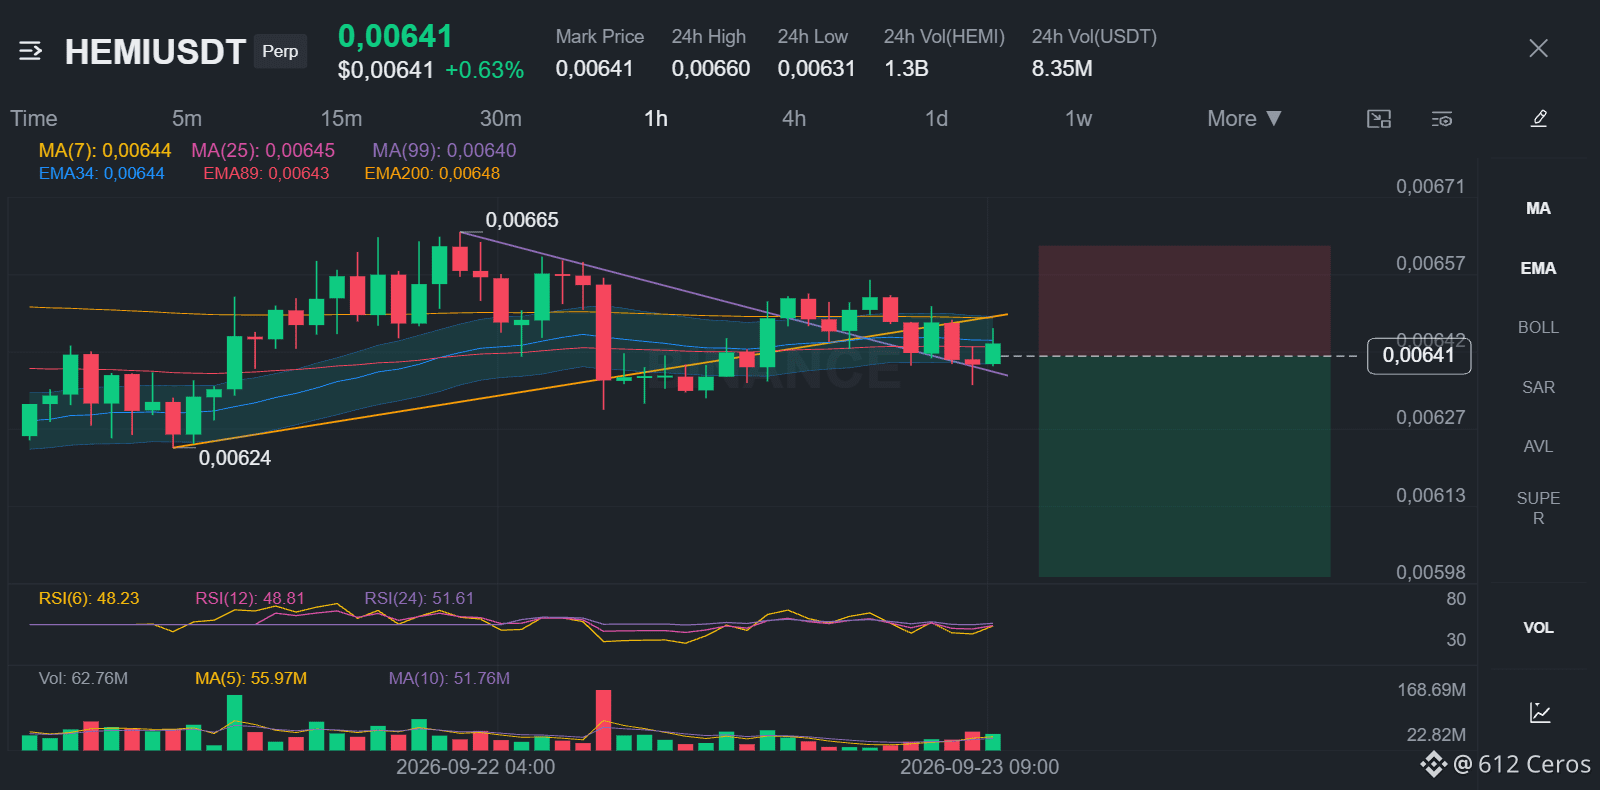
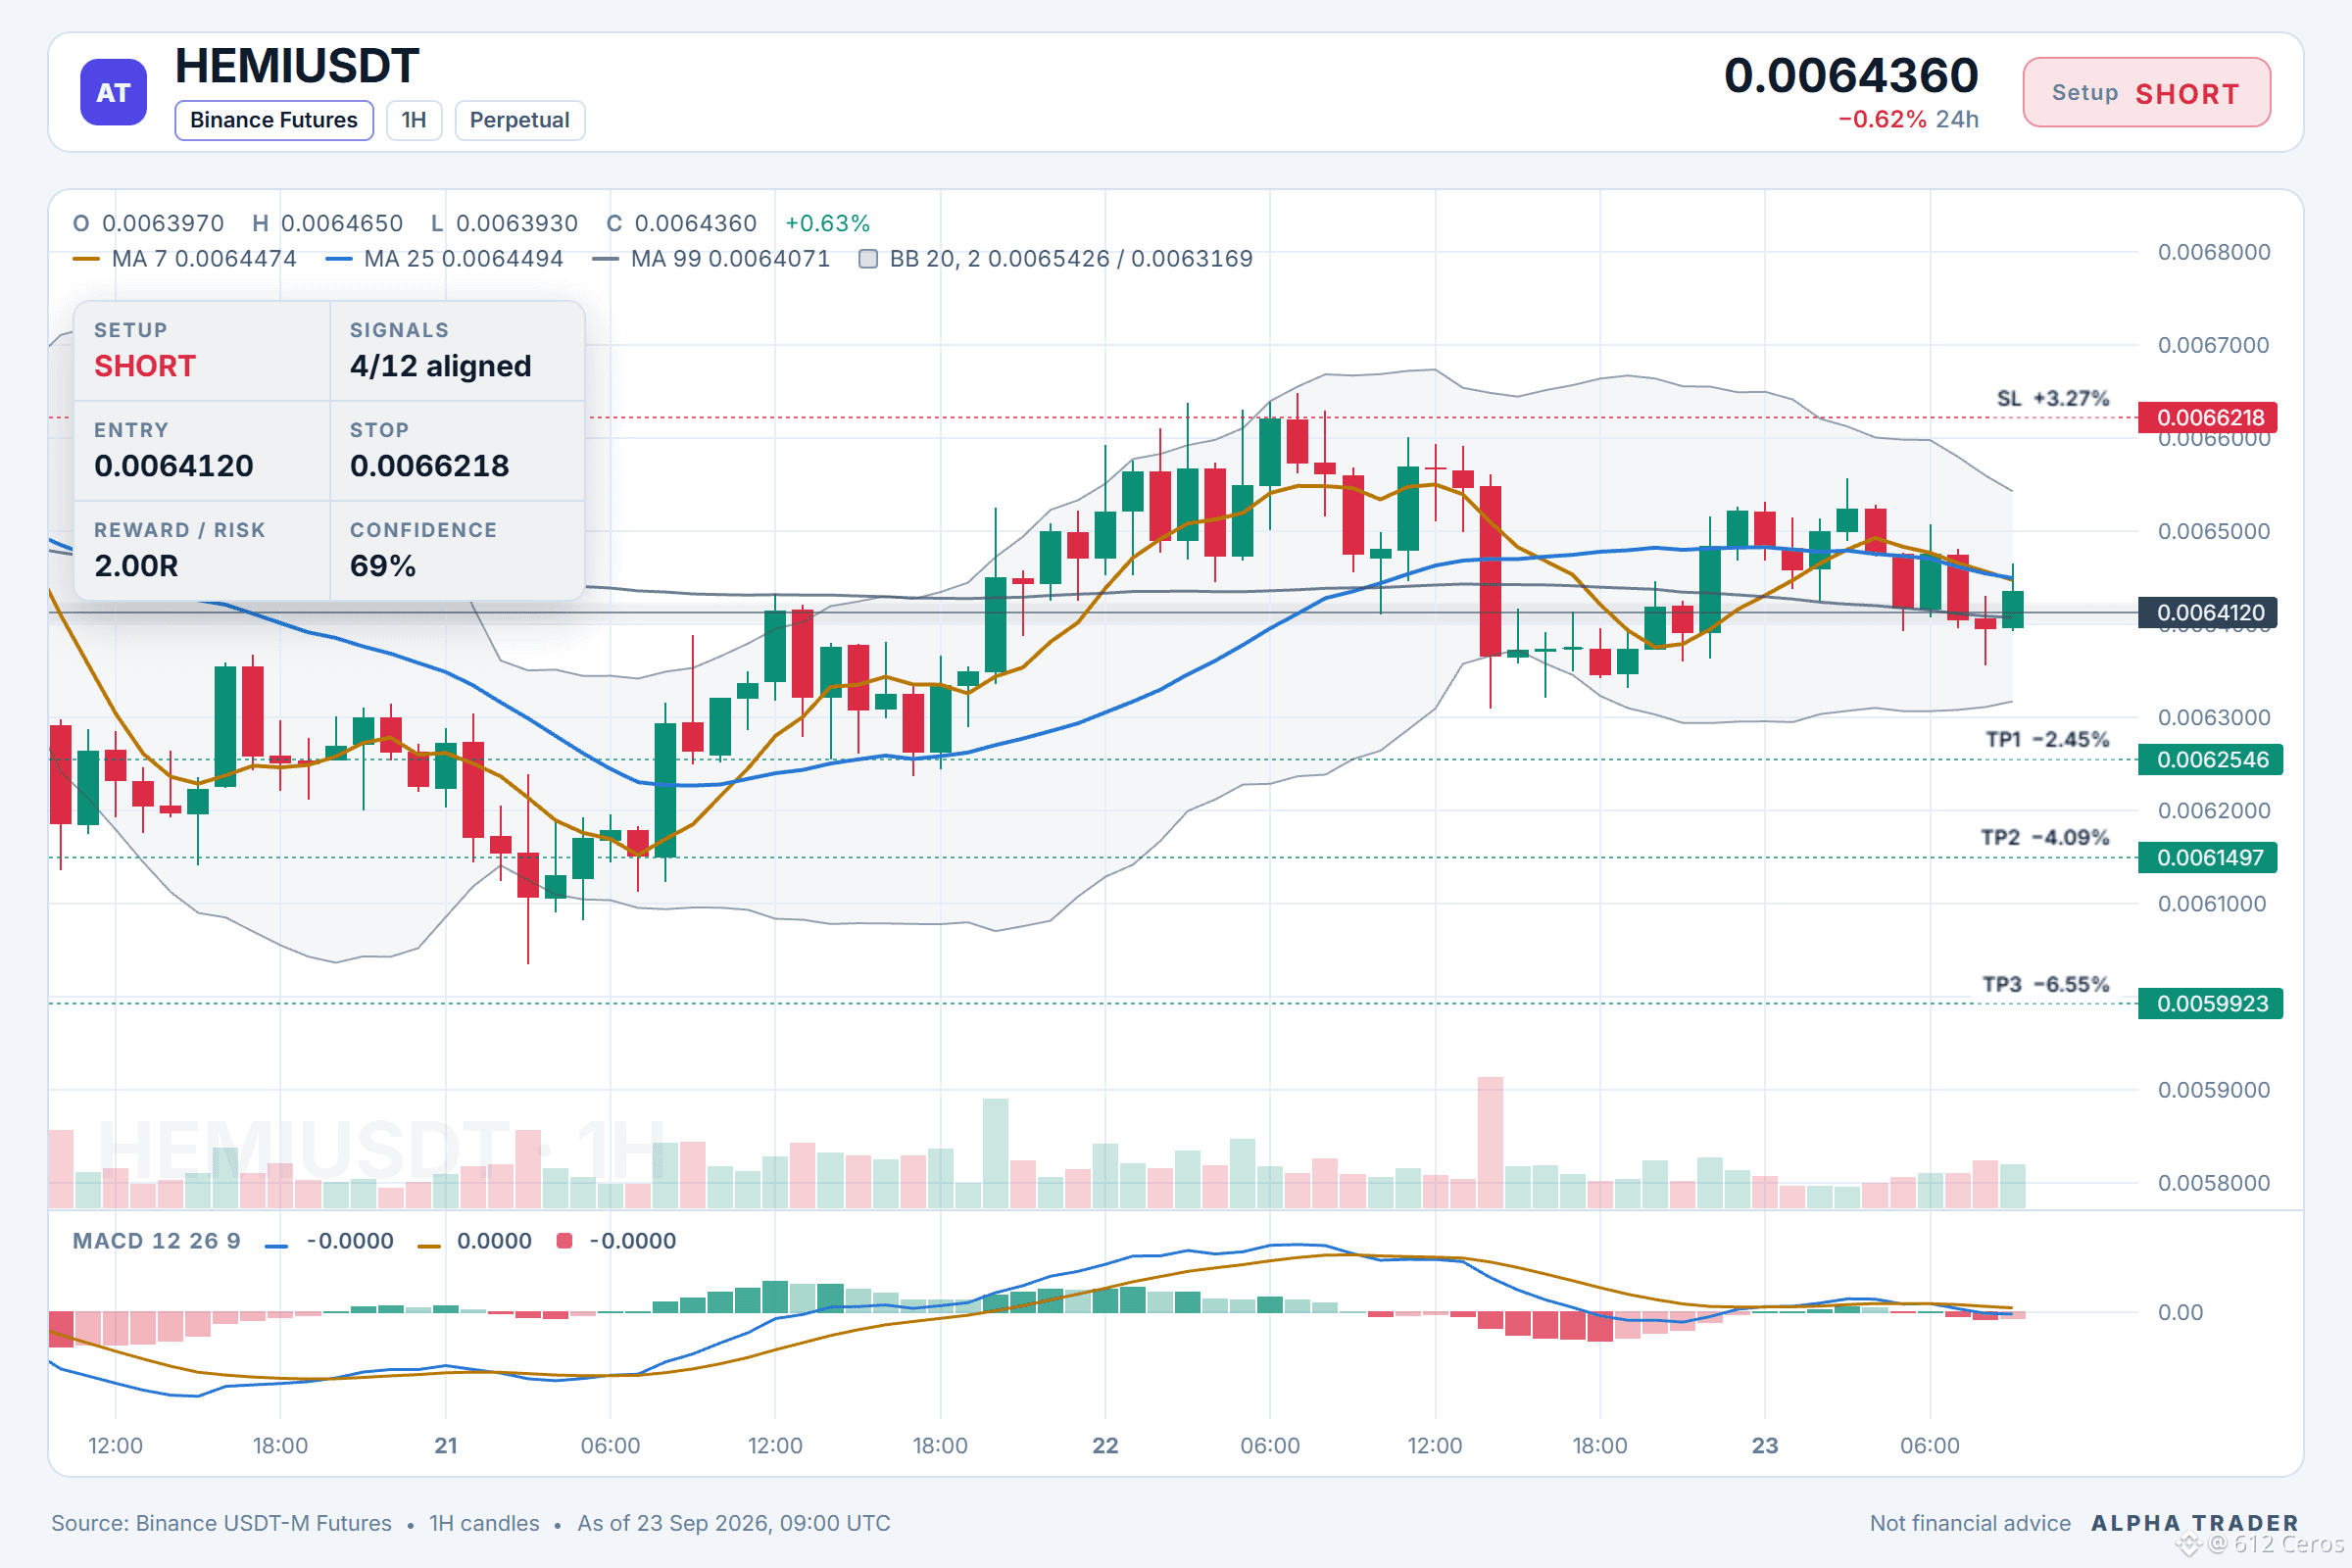
📊 $HEMI /USDT · Bias: SHORT (Leaning) · 4/12 signals aligned
⚠️ Leaning only: 8 of 12 signals are still undecided. Keep size light.
What I checked: 4/12 signals aligned
✔️ Daily trend: price < EMA50 < EMA200, bearish stack
✔️ 4h trend: price < EMA50 < EMA200, bearish stack
✔️ 1h trend: price < EMA50 < EMA200, bearish stack
✔️ Trend strength (ADX/DI, 15m): ADX 22.0 with sellers in control (DI+ 14.1 vs DI− 27.7)
👀 Invalidation: the idea is wrong beyond 0.0067155
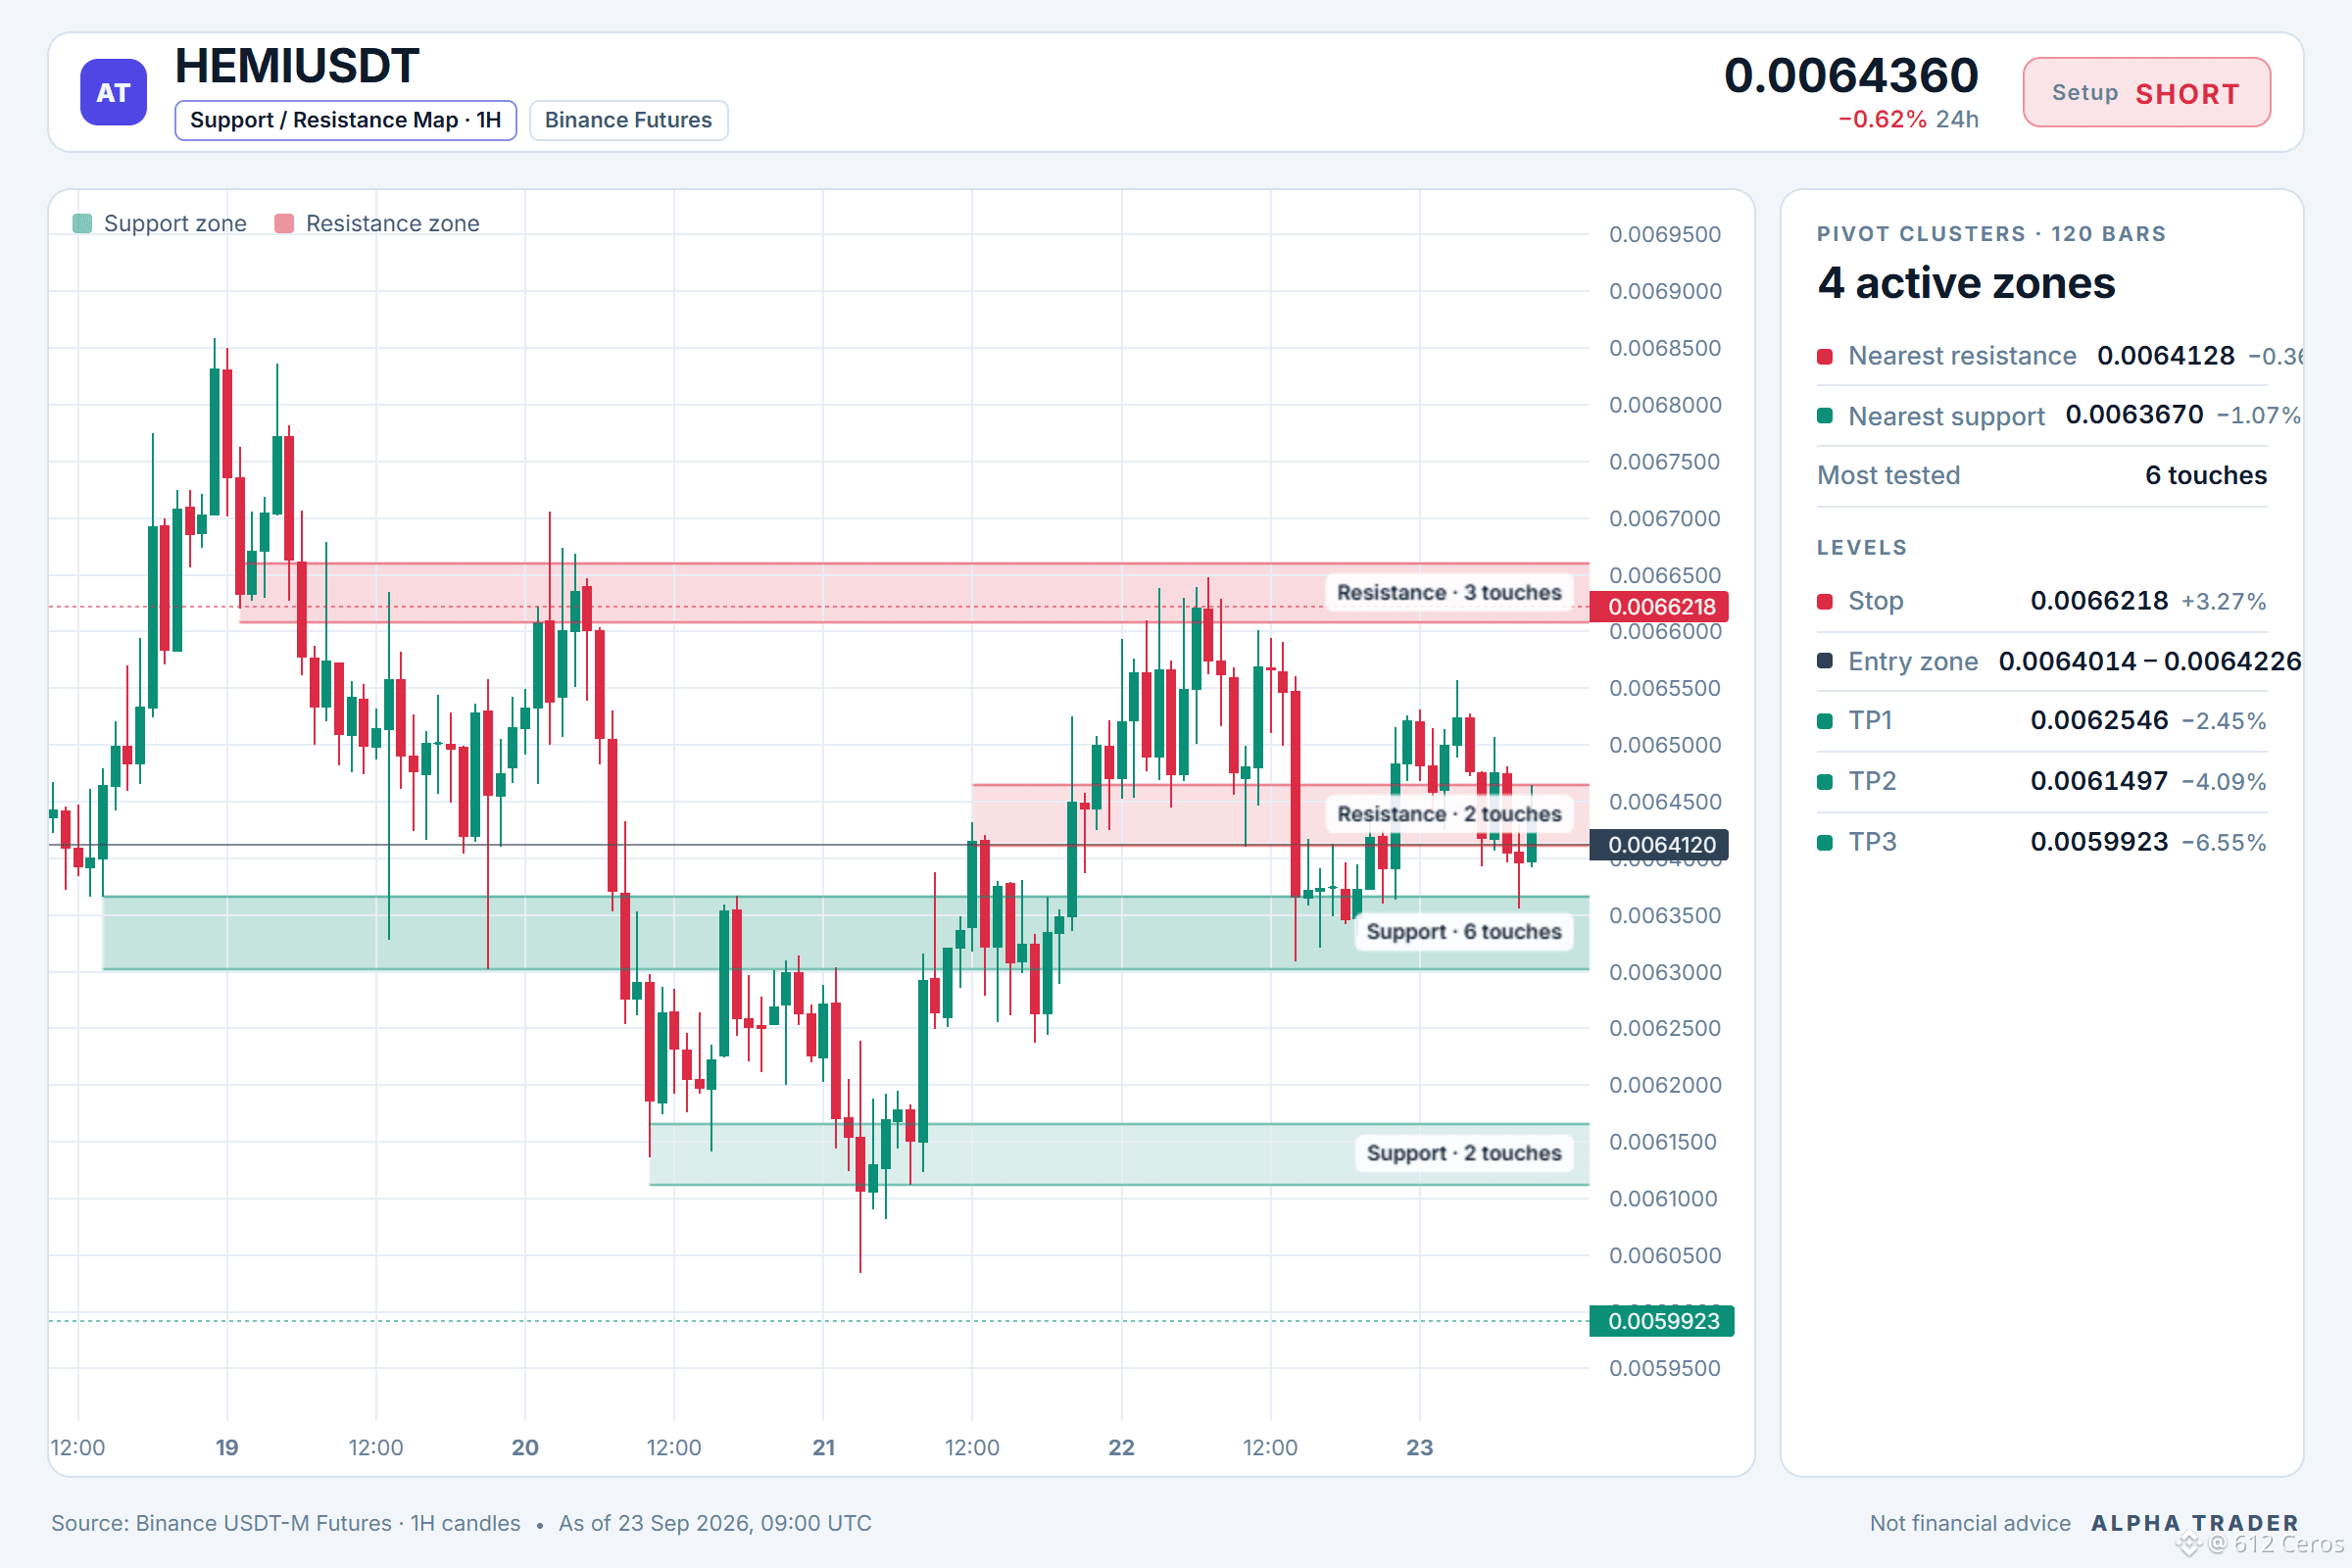
Bottom line: The setup leans short with 4 of 12 signals aligned. The strongest supports are the bearish daily stack (price below EMA50 and EMA200) and the bearish 1h stack (same structure), plus a 15m ADX of 22.0 with sellers controlling (DI- 27.7 vs DI+ 14.1). The main against factor is that BTC correlation sits at a neutral 0.25, which limits external drive. Conviction is moderate because some factors still disagree.
Level map:
🛑 SL: 0.0066218
📍 Entry: 0.0064014 – 0.0064226
🎯 TP1: 0.0062546
🎯 TP2: 0.0061497
🎯 TP3: 0.0059923
Your call:
Where do you place your HEMI short stop if the 1h price pushes above 0.0064226?
Chart with every level 👇
{future}(HEMIUSDT)
⚠️ Personal market analysis only. NFA — manage risk and DYOR.
Educational content, not investment advice or a recommendation to buy, sell, deposit, or withdraw any asset. No paid promotion or referral/affiliate links.
HEMI keeps sliding below its daily moving averages.
📊 $HEMI /USDT · Bias: SHORT (Leaning) · 4/12 signals aligned
⚠️ Leaning only: 8 of 12 signals are still undecided. Keep size light.
What I checked: 4/12 signals aligned
✔️ Daily trend: price < EMA50 < EMA200, bearish stack
✔️ 4h trend: price < EMA50 < EMA200, bearish stack
✔️ 1h trend: price < EMA50 < EMA200, bearish stack
✔️ Trend strength (ADX/DI, 15m): ADX 22.0 with sellers in control (DI+ 14.1 vs DI− 27.7)
👀 Invalidation: the idea is wrong beyond 0.0067155
Bottom line: The setup leans short with 4 of 12 signals aligned. The strongest supports are the bearish daily stack (price below EMA50 and EMA200) and the bearish 1h stack (same structure), plus a 15m ADX of 22.0 with sellers controlling (DI- 27.7 vs DI+ 14.1). The main against factor is that BTC correlation sits at a neutral 0.25, which limits external drive. Conviction is moderate because some factors still disagree.
Level map:
🛑 SL: 0.0066218
📍 Entry: 0.0064014 – 0.0064226
🎯 TP1: 0.0062546
🎯 TP2: 0.0061497
🎯 TP3: 0.0059923
Your call:
Where do you place your HEMI short stop if the 1h price pushes above 0.0064226?
Chart with every level 👇
⚠️ Personal market analysis only. NFA — manage risk and DYOR.
Educational content, not investment advice or a recommendation to buy, sell, deposit, or withdraw any asset. No paid promotion or referral/affiliate links.
📊 $HEMI /USDT · Bias: SHORT (Leaning) · 4/12 signals aligned
⚠️ Leaning only: 8 of 12 signals are still undecided. Keep size light.
What I checked: 4/12 signals aligned
✔️ Daily trend: price < EMA50 < EMA200, bearish stack
✔️ 4h trend: price < EMA50 < EMA200, bearish stack
✔️ 1h trend: price < EMA50 < EMA200, bearish stack
✔️ Trend strength (ADX/DI, 15m): ADX 22.0 with sellers in control (DI+ 14.1 vs DI− 27.7)
👀 Invalidation: the idea is wrong beyond 0.0067155
Bottom line: The setup leans short with 4 of 12 signals aligned. The strongest supports are the bearish daily stack (price below EMA50 and EMA200) and the bearish 1h stack (same structure), plus a 15m ADX of 22.0 with sellers controlling (DI- 27.7 vs DI+ 14.1). The main against factor is that BTC correlation sits at a neutral 0.25, which limits external drive. Conviction is moderate because some factors still disagree.
Level map:
🛑 SL: 0.0066218
📍 Entry: 0.0064014 – 0.0064226
🎯 TP1: 0.0062546
🎯 TP2: 0.0061497
🎯 TP3: 0.0059923
Your call:
Where do you place your HEMI short stop if the 1h price pushes above 0.0064226?
Chart with every level 👇
⚠️ Personal market analysis only. NFA — manage risk and DYOR.
Educational content, not investment advice or a recommendation to buy, sell, deposit, or withdraw any asset. No paid promotion or referral/affiliate links.
1
1.7k
·
--
Bullish
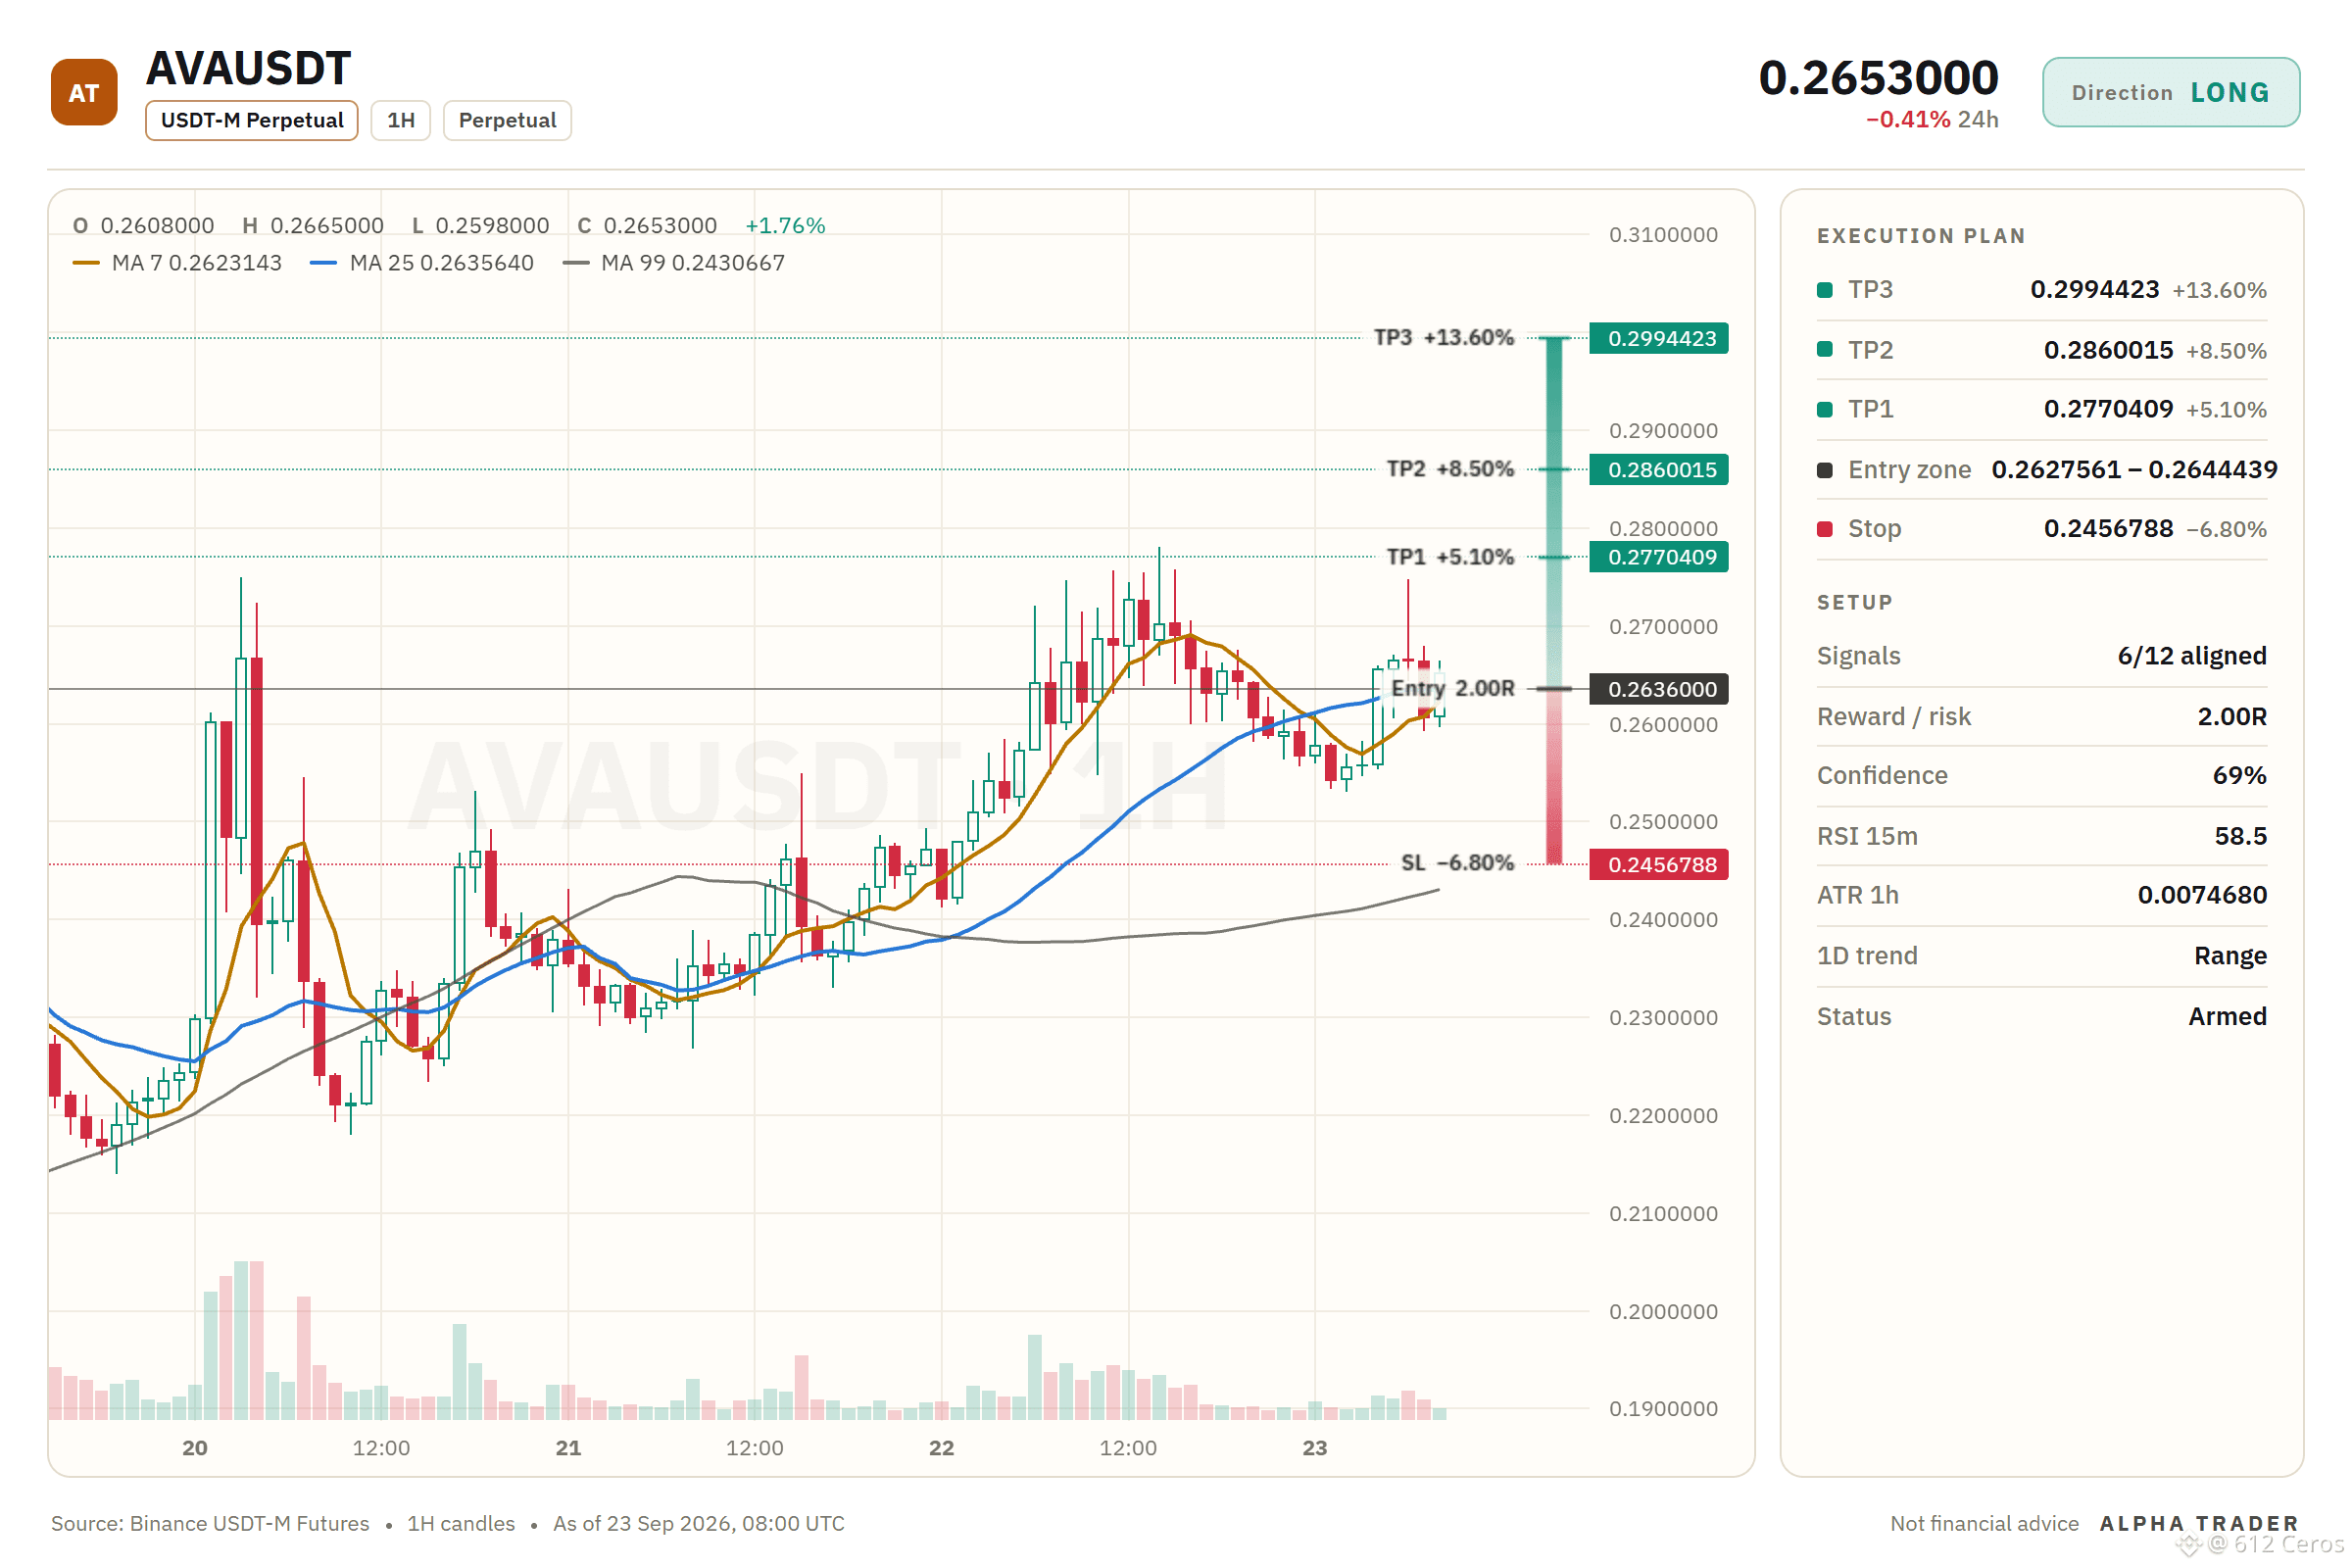
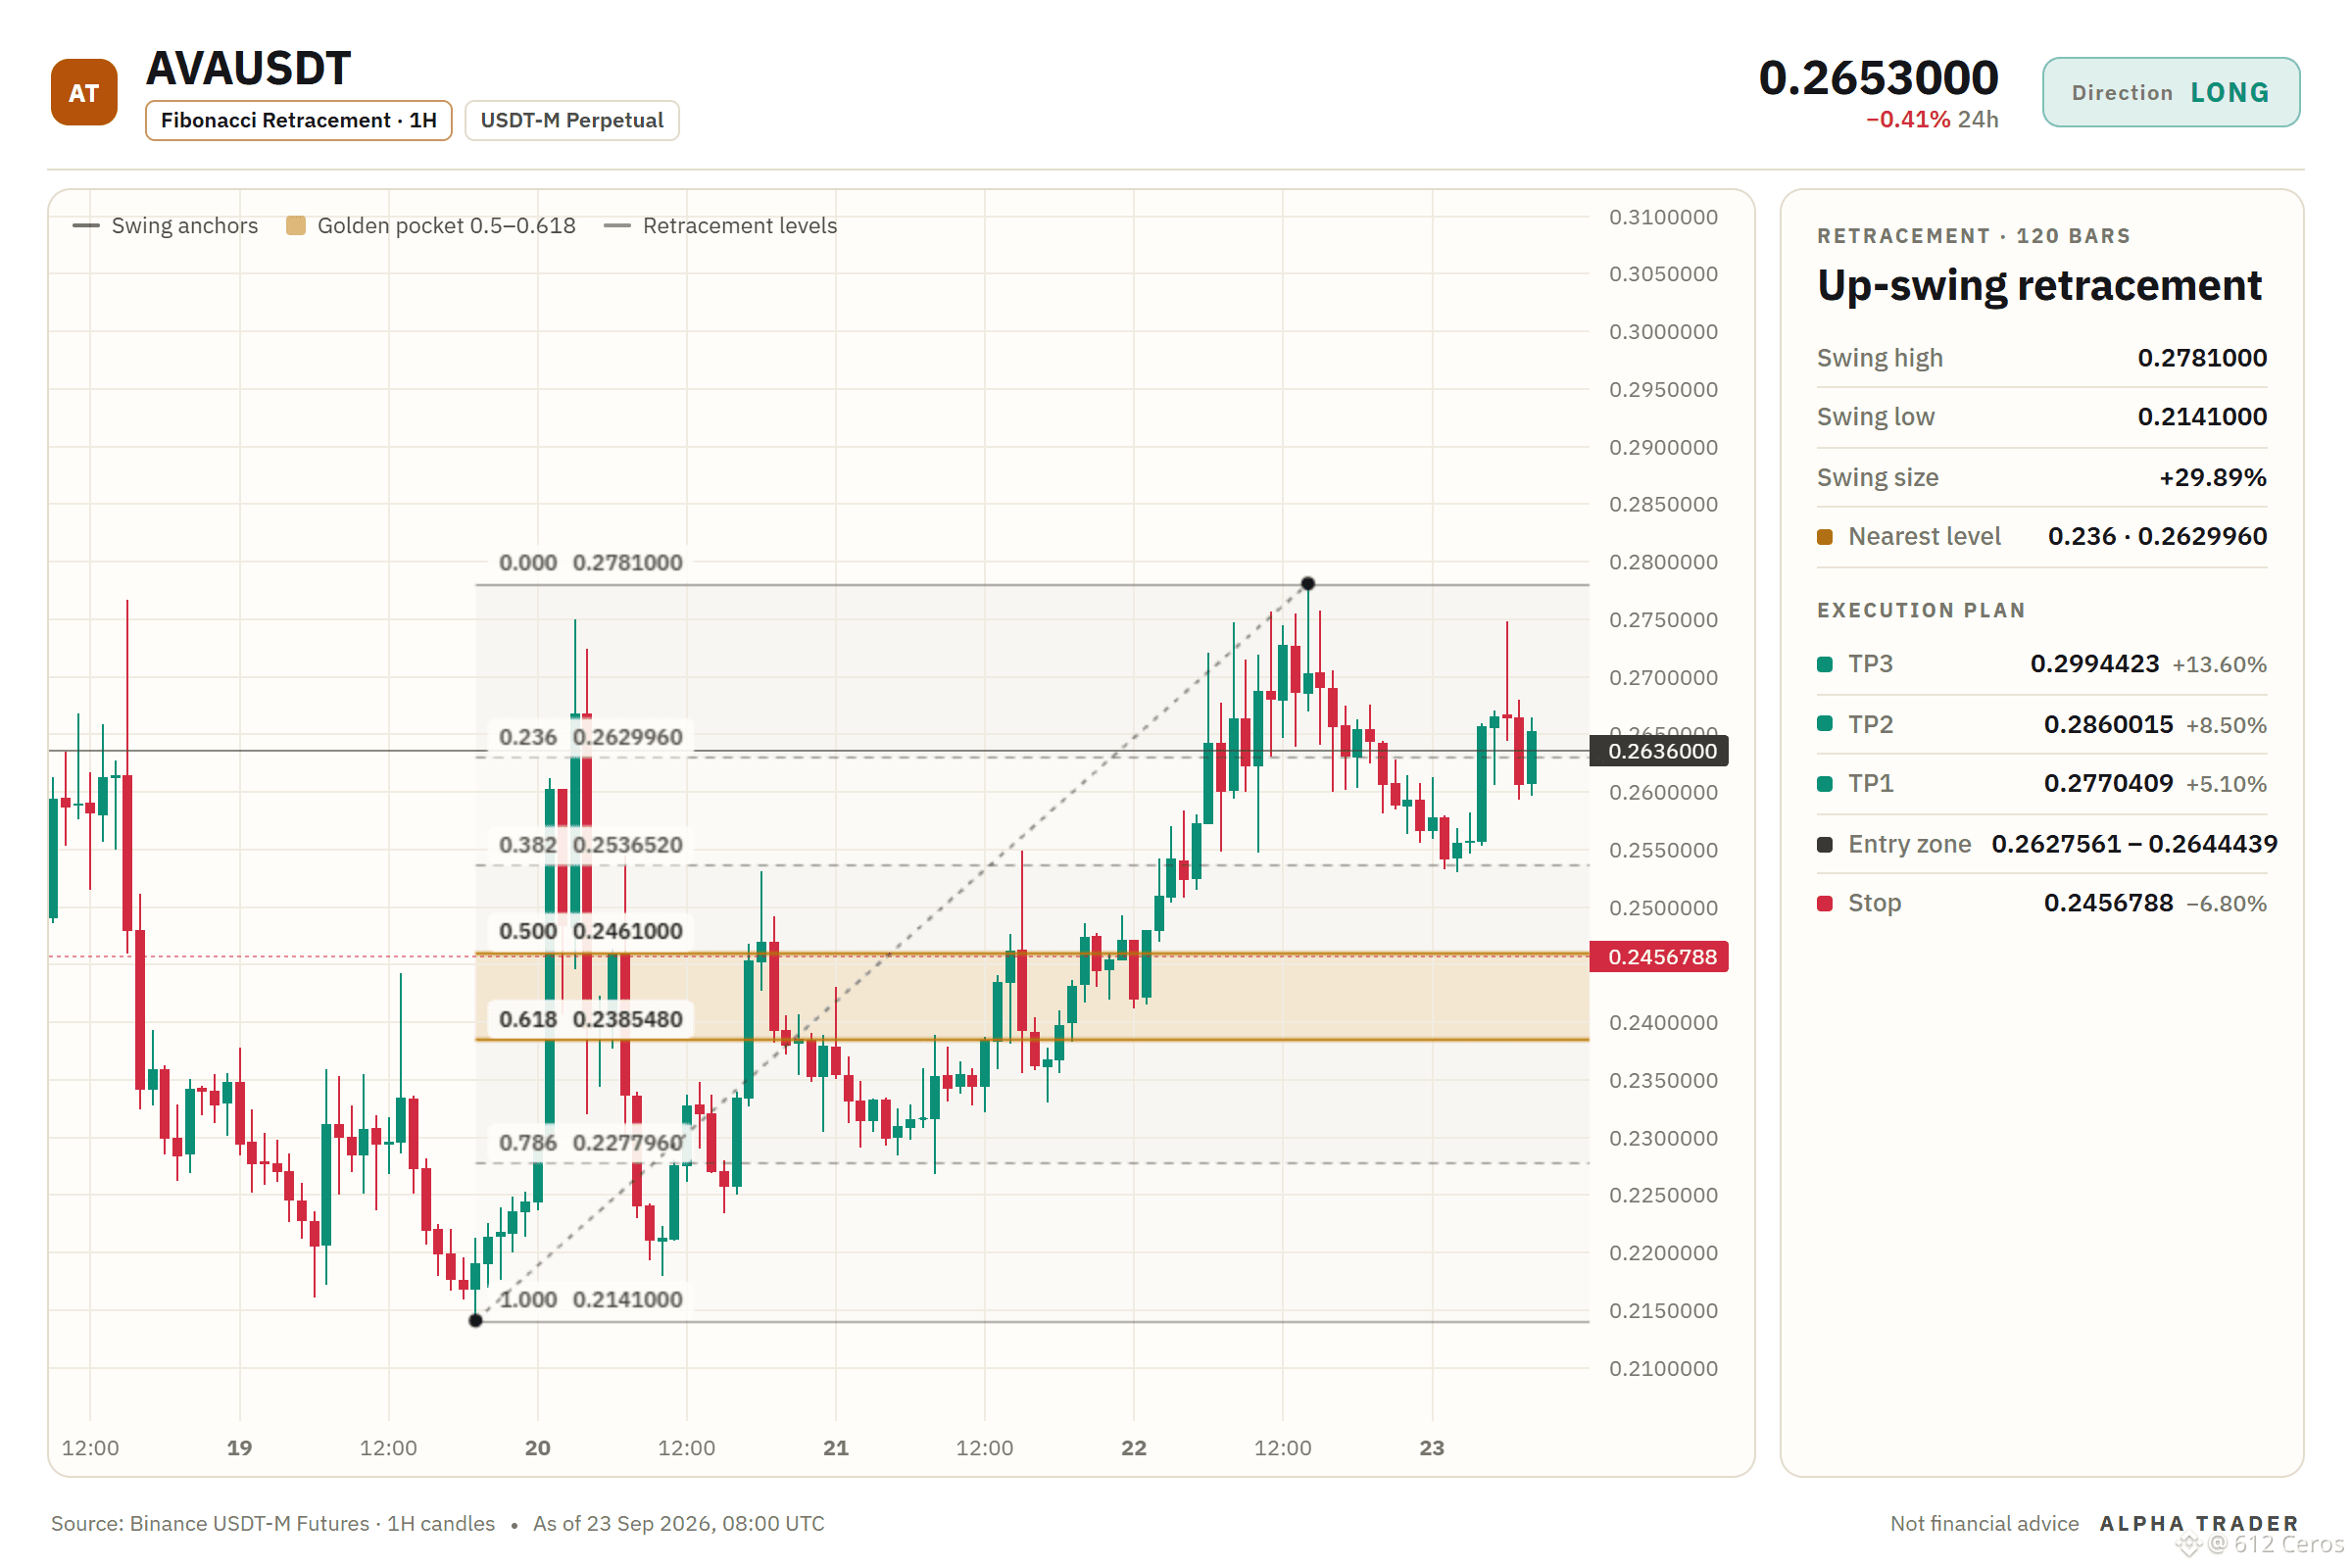
Has AVA quietly stacked a bullish structure on the 4h that most are still ignoring?
My read on AVA today
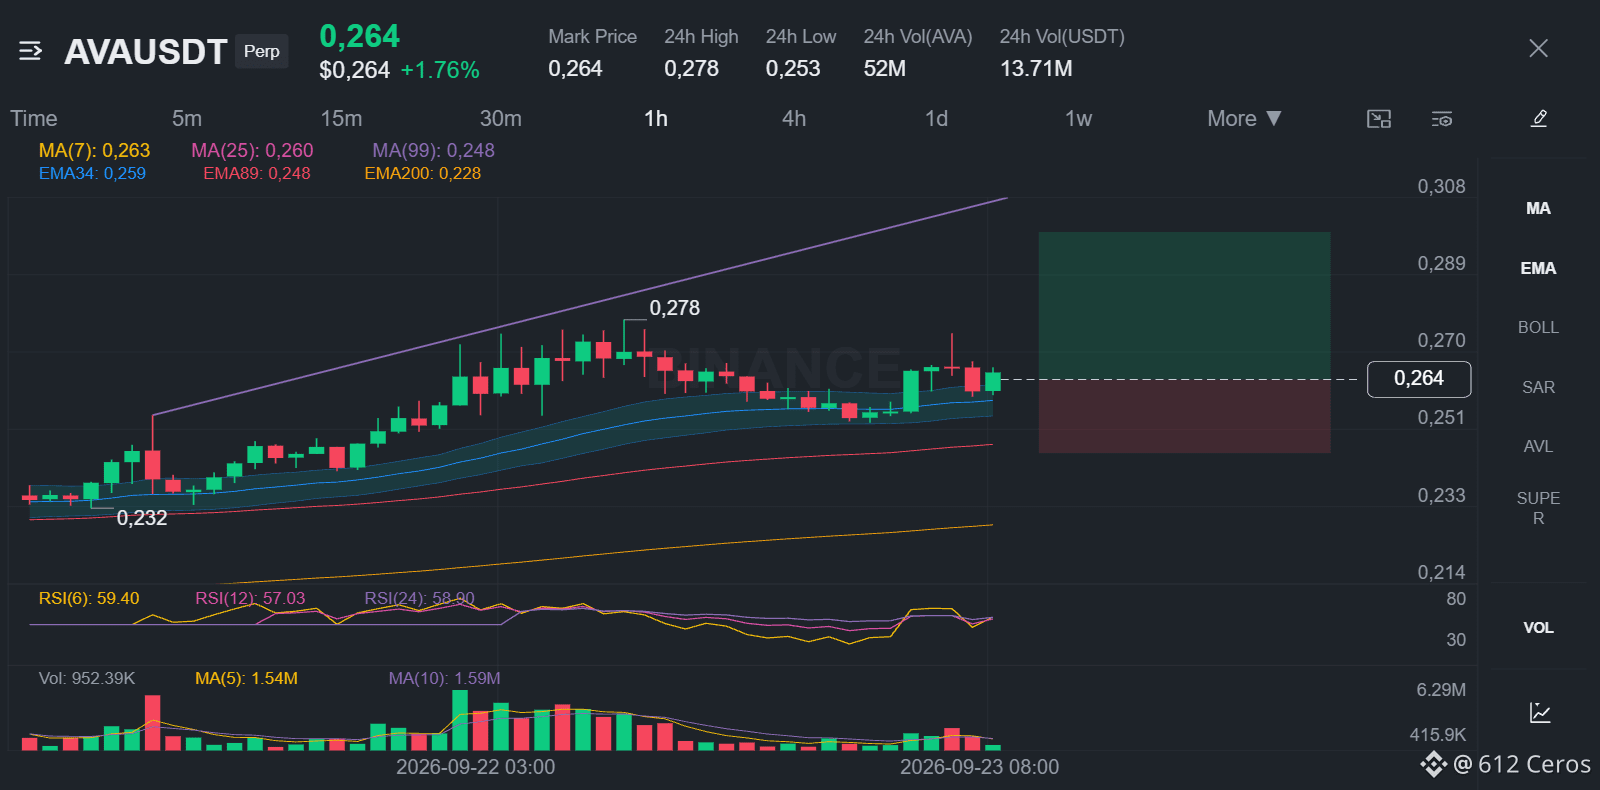
$AVA /USDT · Bias: LONG · 6/12 signals aligned
Technical verdict: STRONG LONG. 6 of 12 signals aligned, 1 against.
What supports it (6):
• 4h trend: price > EMA50 > EMA200, bullish stack
• 1h trend: price > EMA50 > EMA200, bullish stack
• Trend strength (ADX/DI, 15m): ADX 21.4 with buyers in control (DI+ 28.0 vs DI− 18.6)
• 4h RSI: 59.3, bullish momentum (above 55)
What argues against (1):
• RSI extreme in a range: RSI z-score +2.13 in a range, fade-the-high risk
I'm watching AVA from the 1h price of 0.2636000 with a long bias. The 4h trend shows price above EMA50 above EMA200 with a bullish stack, and the 1h trend mirrors that setup. The 15m ADX reads 21.4 with DI+ at 28.0 versus DI− at 18.6, and the 4h RSI sits at 59.3 while the 1h RSI is at 56.7, both above 55. I would be wrong if price breaks below 0.2207105, which is where I would cut the trade. The main thing working against me is the RSI z-score at +2.13 in a range, suggesting a fade-the-high risk.
The plan:
Entry: 0.2627561 – 0.2644439
SL: 0.2456788
TP1: 0.2770409
TP2: 0.2860015
TP3: 0.2994423
Your call:
What level would you invalidate this long on, and are you seeing anything on your timeframe that I might be missing?
Full setup on the chart 👇
{future}(AVAUSDT)
⚠️ Personal market analysis only. NFA — manage risk and DYOR.
Educational content, not investment advice or a recommendation to buy, sell, deposit, or withdraw any asset. No paid promotion or referral/affiliate links.
Has AVA quietly stacked a bullish structure on the 4h that most are still ignoring?
My read on AVA today
$AVA /USDT · Bias: LONG · 6/12 signals aligned
Technical verdict: STRONG LONG. 6 of 12 signals aligned, 1 against.
What supports it (6):
• 4h trend: price > EMA50 > EMA200, bullish stack
• 1h trend: price > EMA50 > EMA200, bullish stack
• Trend strength (ADX/DI, 15m): ADX 21.4 with buyers in control (DI+ 28.0 vs DI− 18.6)
• 4h RSI: 59.3, bullish momentum (above 55)
What argues against (1):
• RSI extreme in a range: RSI z-score +2.13 in a range, fade-the-high risk
I'm watching AVA from the 1h price of 0.2636000 with a long bias. The 4h trend shows price above EMA50 above EMA200 with a bullish stack, and the 1h trend mirrors that setup. The 15m ADX reads 21.4 with DI+ at 28.0 versus DI− at 18.6, and the 4h RSI sits at 59.3 while the 1h RSI is at 56.7, both above 55. I would be wrong if price breaks below 0.2207105, which is where I would cut the trade. The main thing working against me is the RSI z-score at +2.13 in a range, suggesting a fade-the-high risk.
The plan:
Entry: 0.2627561 – 0.2644439
SL: 0.2456788
TP1: 0.2770409
TP2: 0.2860015
TP3: 0.2994423
Your call:
What level would you invalidate this long on, and are you seeing anything on your timeframe that I might be missing?
Full setup on the chart 👇
⚠️ Personal market analysis only. NFA — manage risk and DYOR.
Educational content, not investment advice or a recommendation to buy, sell, deposit, or withdraw any asset. No paid promotion or referral/affiliate links.
My read on AVA today
$AVA /USDT · Bias: LONG · 6/12 signals aligned
Technical verdict: STRONG LONG. 6 of 12 signals aligned, 1 against.
What supports it (6):
• 4h trend: price > EMA50 > EMA200, bullish stack
• 1h trend: price > EMA50 > EMA200, bullish stack
• Trend strength (ADX/DI, 15m): ADX 21.4 with buyers in control (DI+ 28.0 vs DI− 18.6)
• 4h RSI: 59.3, bullish momentum (above 55)
What argues against (1):
• RSI extreme in a range: RSI z-score +2.13 in a range, fade-the-high risk
I'm watching AVA from the 1h price of 0.2636000 with a long bias. The 4h trend shows price above EMA50 above EMA200 with a bullish stack, and the 1h trend mirrors that setup. The 15m ADX reads 21.4 with DI+ at 28.0 versus DI− at 18.6, and the 4h RSI sits at 59.3 while the 1h RSI is at 56.7, both above 55. I would be wrong if price breaks below 0.2207105, which is where I would cut the trade. The main thing working against me is the RSI z-score at +2.13 in a range, suggesting a fade-the-high risk.
The plan:
Entry: 0.2627561 – 0.2644439
SL: 0.2456788
TP1: 0.2770409
TP2: 0.2860015
TP3: 0.2994423
Your call:
What level would you invalidate this long on, and are you seeing anything on your timeframe that I might be missing?
Full setup on the chart 👇
⚠️ Personal market analysis only. NFA — manage risk and DYOR.
Educational content, not investment advice or a recommendation to buy, sell, deposit, or withdraw any asset. No paid promotion or referral/affiliate links.
6
2.7k
·
--
Bullish
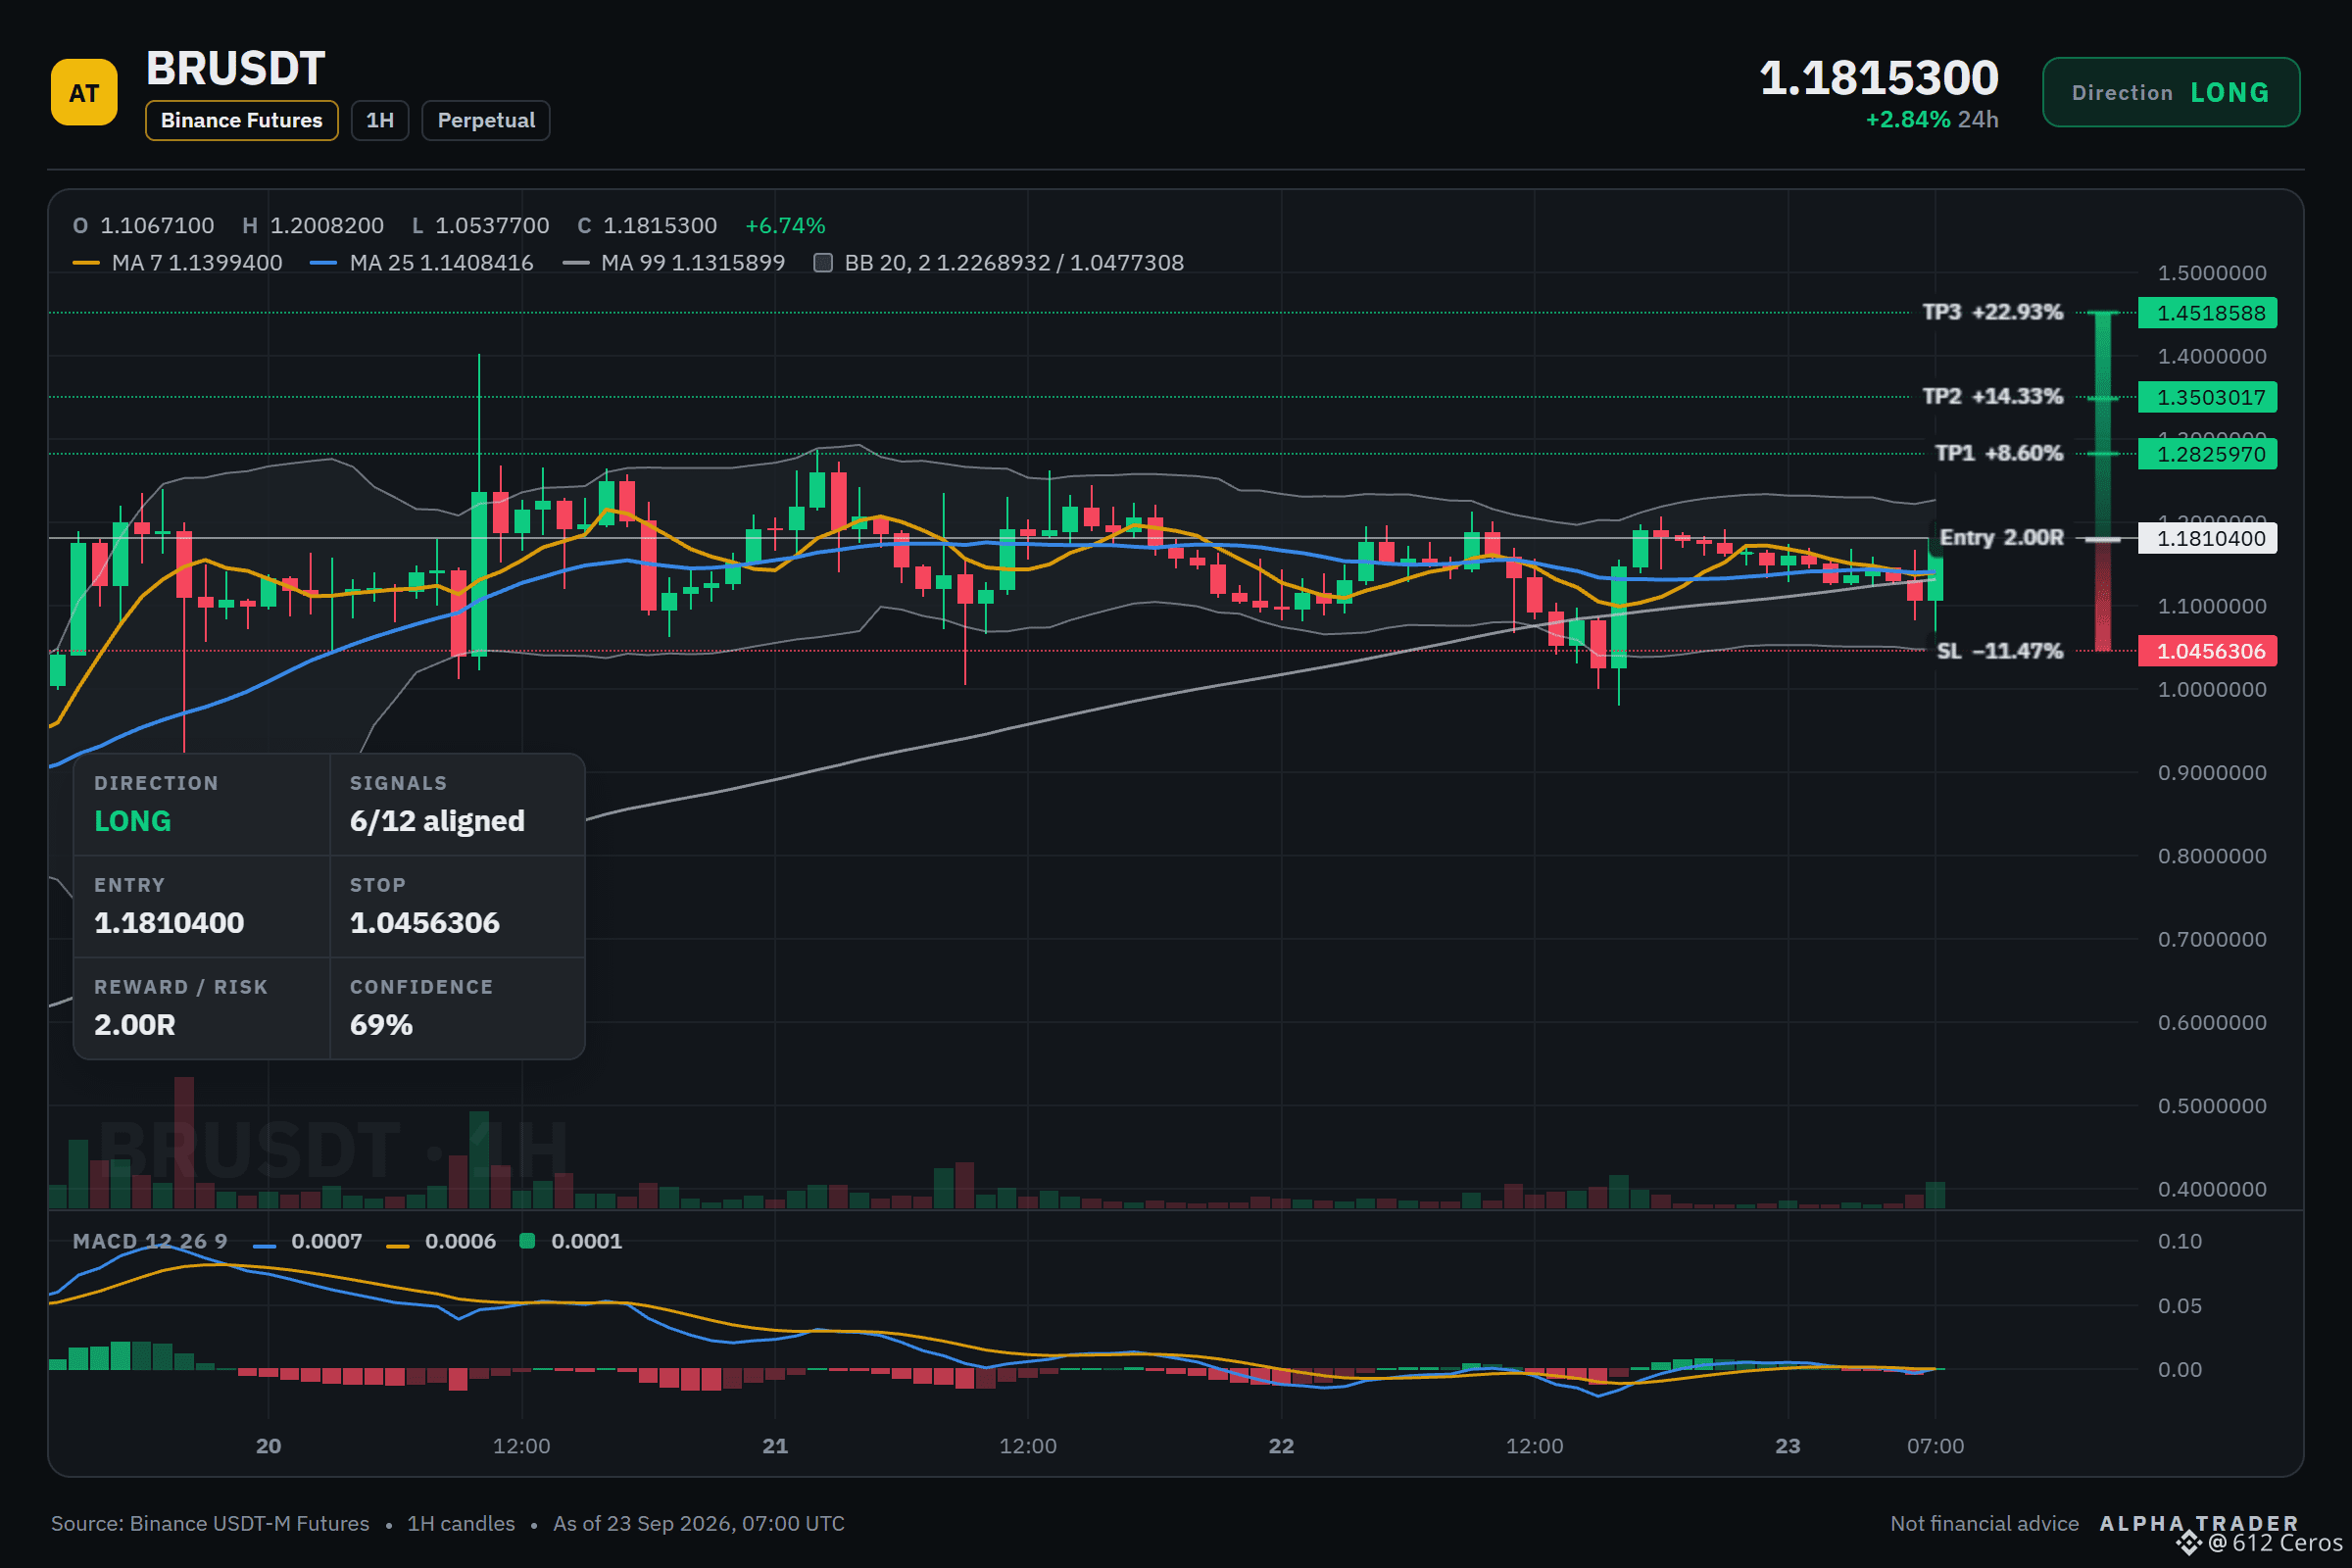
BR long setup: the levels I'm watching
🟢 $BR
/USDT | Bias: LONG (Strong) | 6/12 signals aligned
Technical verdict: STRONG LONG. 6 of 12 signals aligned, 2 against.
What supports it (6):
• Daily trend: price > EMA50 > EMA200, bullish stack
• 4h trend: price > EMA50 > EMA200, bullish stack
• 1h trend: price > EMA50 > EMA200, bullish stack
• 4h RSI: 59.4, bullish momentum (above 55)
• 1h RSI: 55.9, bullish momentum (above 55)
• Relative strength vs BTC: outperforming, +3.56% vs BTC over the last day
What argues against (2):
• RSI extreme in a range: RSI z-score +2.36 in a range, fade-the-high risk
• Volume: volume z-score +1.7 on a red candle, supply confirms
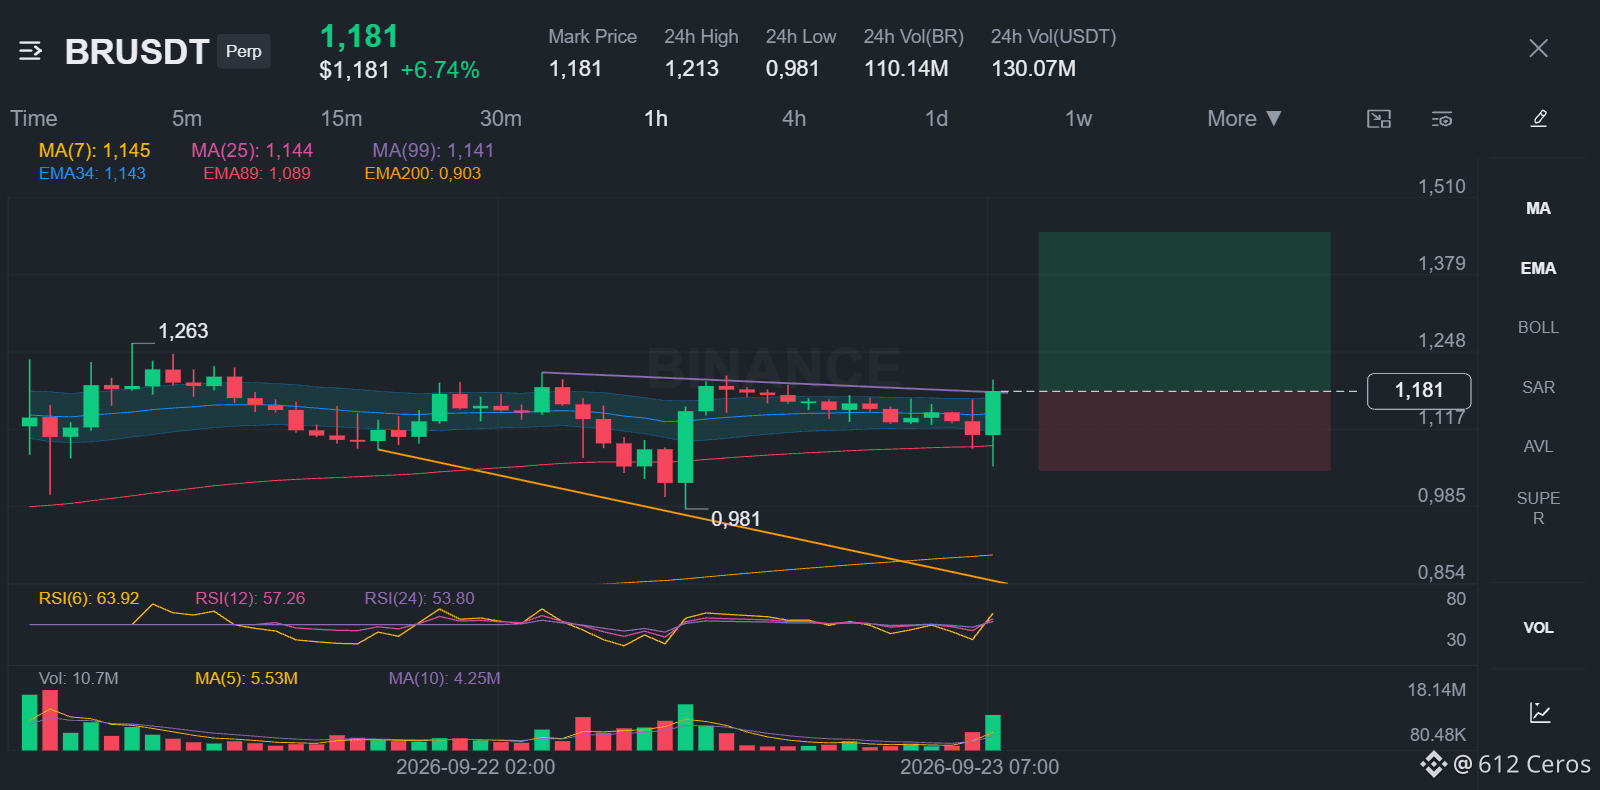
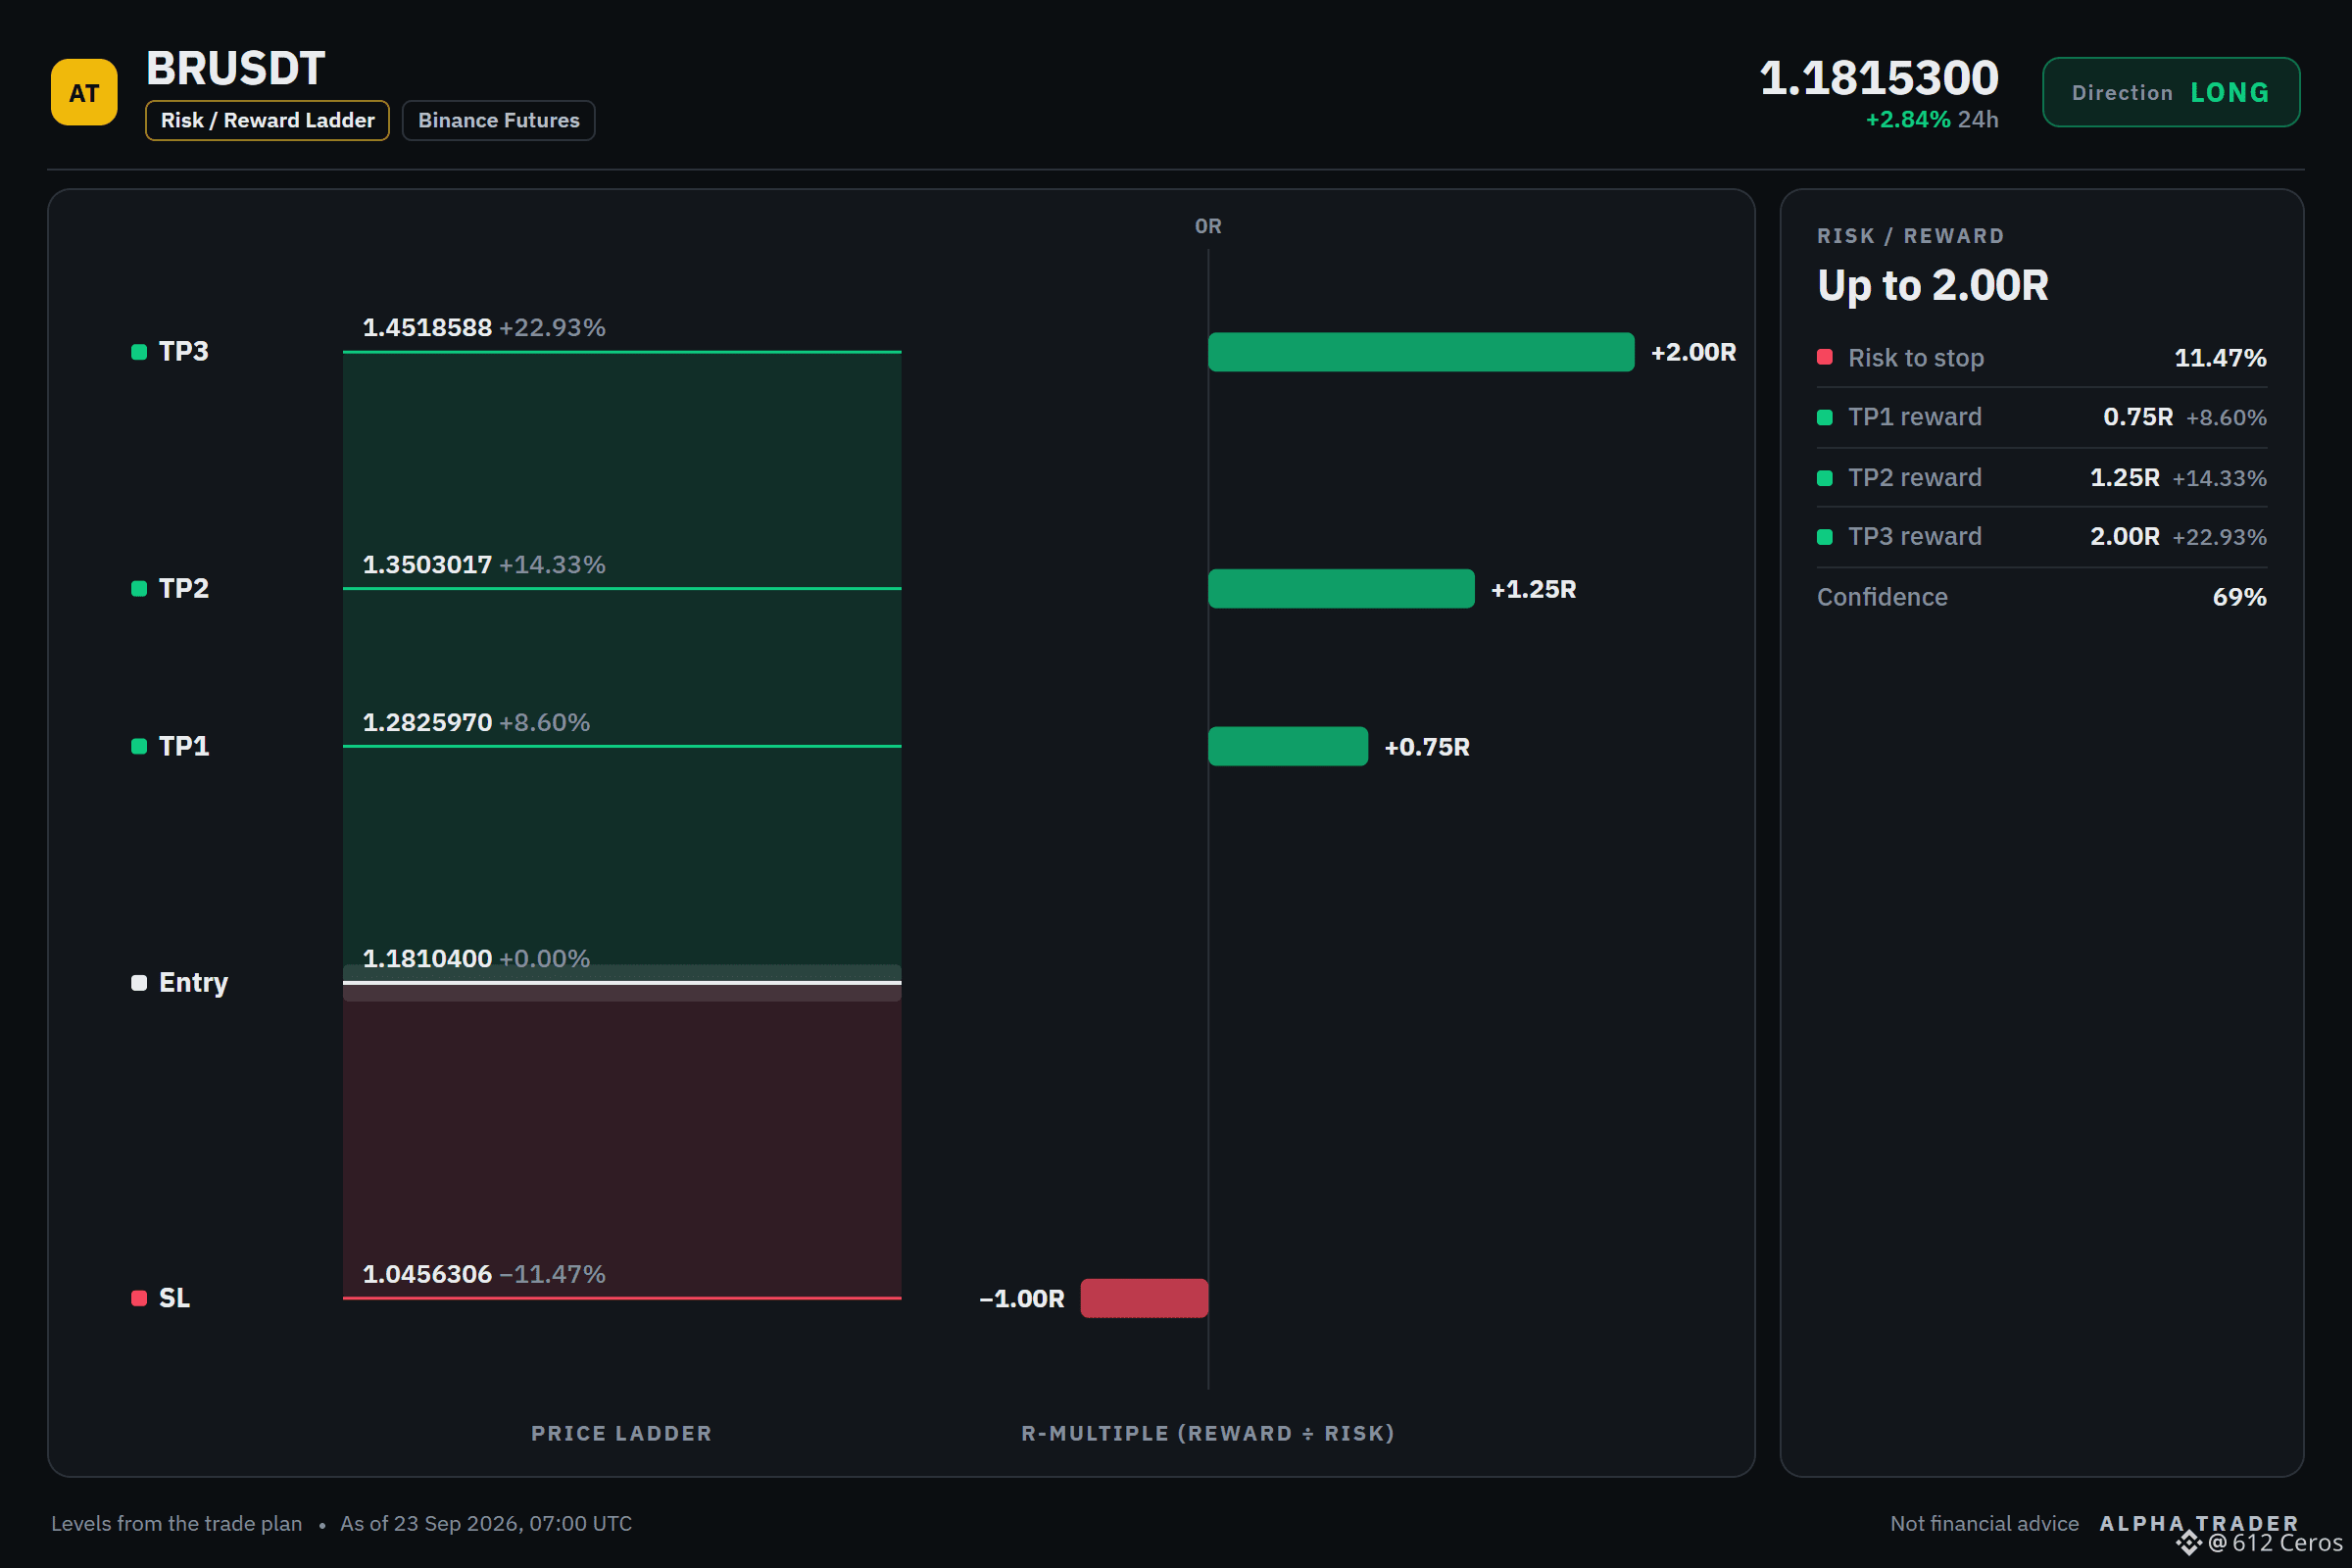
📍 Entry: 1.1732058 – 1.1888742
🎯 TP1: 1.2825970 | TP2: 1.3503017 | TP3: 1.4518588
🛑 SL: 1.0456306
Why this setup?
The daily trend reads bullish, and 6/12 signals aligned favour the long side. The plan is to work the 1.1732058 – 1.1888742 zone, scale out at 1.2825970 and 1.3503017, and stay patient for 1.4518588. A move through 1.0456306 means the idea is wrong and the stop does its job.
Over to you:
Does BR tag 1.2825970 first, or the stop?
Levels mapped on the chart below 👇
{future}(BRUSDT)
⚠️ Personal market analysis only. NFA — manage risk and DYOR.
Educational content, not investment advice or a recommendation to buy, sell, deposit, or withdraw any asset. No paid promotion or referral/affiliate links.
BR long setup: the levels I'm watching
🟢 $BR
/USDT | Bias: LONG (Strong) | 6/12 signals aligned
Technical verdict: STRONG LONG. 6 of 12 signals aligned, 2 against.
What supports it (6):
• Daily trend: price > EMA50 > EMA200, bullish stack
• 4h trend: price > EMA50 > EMA200, bullish stack
• 1h trend: price > EMA50 > EMA200, bullish stack
• 4h RSI: 59.4, bullish momentum (above 55)
• 1h RSI: 55.9, bullish momentum (above 55)
• Relative strength vs BTC: outperforming, +3.56% vs BTC over the last day
What argues against (2):
• RSI extreme in a range: RSI z-score +2.36 in a range, fade-the-high risk
• Volume: volume z-score +1.7 on a red candle, supply confirms
📍 Entry: 1.1732058 – 1.1888742
🎯 TP1: 1.2825970 | TP2: 1.3503017 | TP3: 1.4518588
🛑 SL: 1.0456306
Why this setup?
The daily trend reads bullish, and 6/12 signals aligned favour the long side. The plan is to work the 1.1732058 – 1.1888742 zone, scale out at 1.2825970 and 1.3503017, and stay patient for 1.4518588. A move through 1.0456306 means the idea is wrong and the stop does its job.
Over to you:
Does BR tag 1.2825970 first, or the stop?
Levels mapped on the chart below 👇
⚠️ Personal market analysis only. NFA — manage risk and DYOR.
Educational content, not investment advice or a recommendation to buy, sell, deposit, or withdraw any asset. No paid promotion or referral/affiliate links.
🟢 $BR
/USDT | Bias: LONG (Strong) | 6/12 signals aligned
Technical verdict: STRONG LONG. 6 of 12 signals aligned, 2 against.
What supports it (6):
• Daily trend: price > EMA50 > EMA200, bullish stack
• 4h trend: price > EMA50 > EMA200, bullish stack
• 1h trend: price > EMA50 > EMA200, bullish stack
• 4h RSI: 59.4, bullish momentum (above 55)
• 1h RSI: 55.9, bullish momentum (above 55)
• Relative strength vs BTC: outperforming, +3.56% vs BTC over the last day
What argues against (2):
• RSI extreme in a range: RSI z-score +2.36 in a range, fade-the-high risk
• Volume: volume z-score +1.7 on a red candle, supply confirms
📍 Entry: 1.1732058 – 1.1888742
🎯 TP1: 1.2825970 | TP2: 1.3503017 | TP3: 1.4518588
🛑 SL: 1.0456306
Why this setup?
The daily trend reads bullish, and 6/12 signals aligned favour the long side. The plan is to work the 1.1732058 – 1.1888742 zone, scale out at 1.2825970 and 1.3503017, and stay patient for 1.4518588. A move through 1.0456306 means the idea is wrong and the stop does its job.
Over to you:
Does BR tag 1.2825970 first, or the stop?
Levels mapped on the chart below 👇
⚠️ Personal market analysis only. NFA — manage risk and DYOR.
Educational content, not investment advice or a recommendation to buy, sell, deposit, or withdraw any asset. No paid promotion or referral/affiliate links.
2
2
1.8k
·
--
Bullish
SPCX long setup: the levels I'm watching
$SPCX /USDT - 🟢 Bias: LONG (Leaning) · 5/11 signals aligned
⚠️ Leaning only: 6 of 11 signals are still undecided. Keep size light.
Technical verdict: LEANING LONG. 5 of 11 signals aligned, 0 against.
✅ 4h trend: price > EMA50 > EMA200, bullish stack
✅ 1h trend: price > EMA50 > EMA200, bullish stack
✅ Trend strength (ADX/DI, 15m): ADX 26.0 with buyers in control (DI+ 22.8 vs DI− 12.9)
✅ 4h RSI: 56.8, bullish momentum (above 55)
✅ 1h RSI: 57.6, bullish momentum (above 55)
No factor points the other way right now.
Price map:
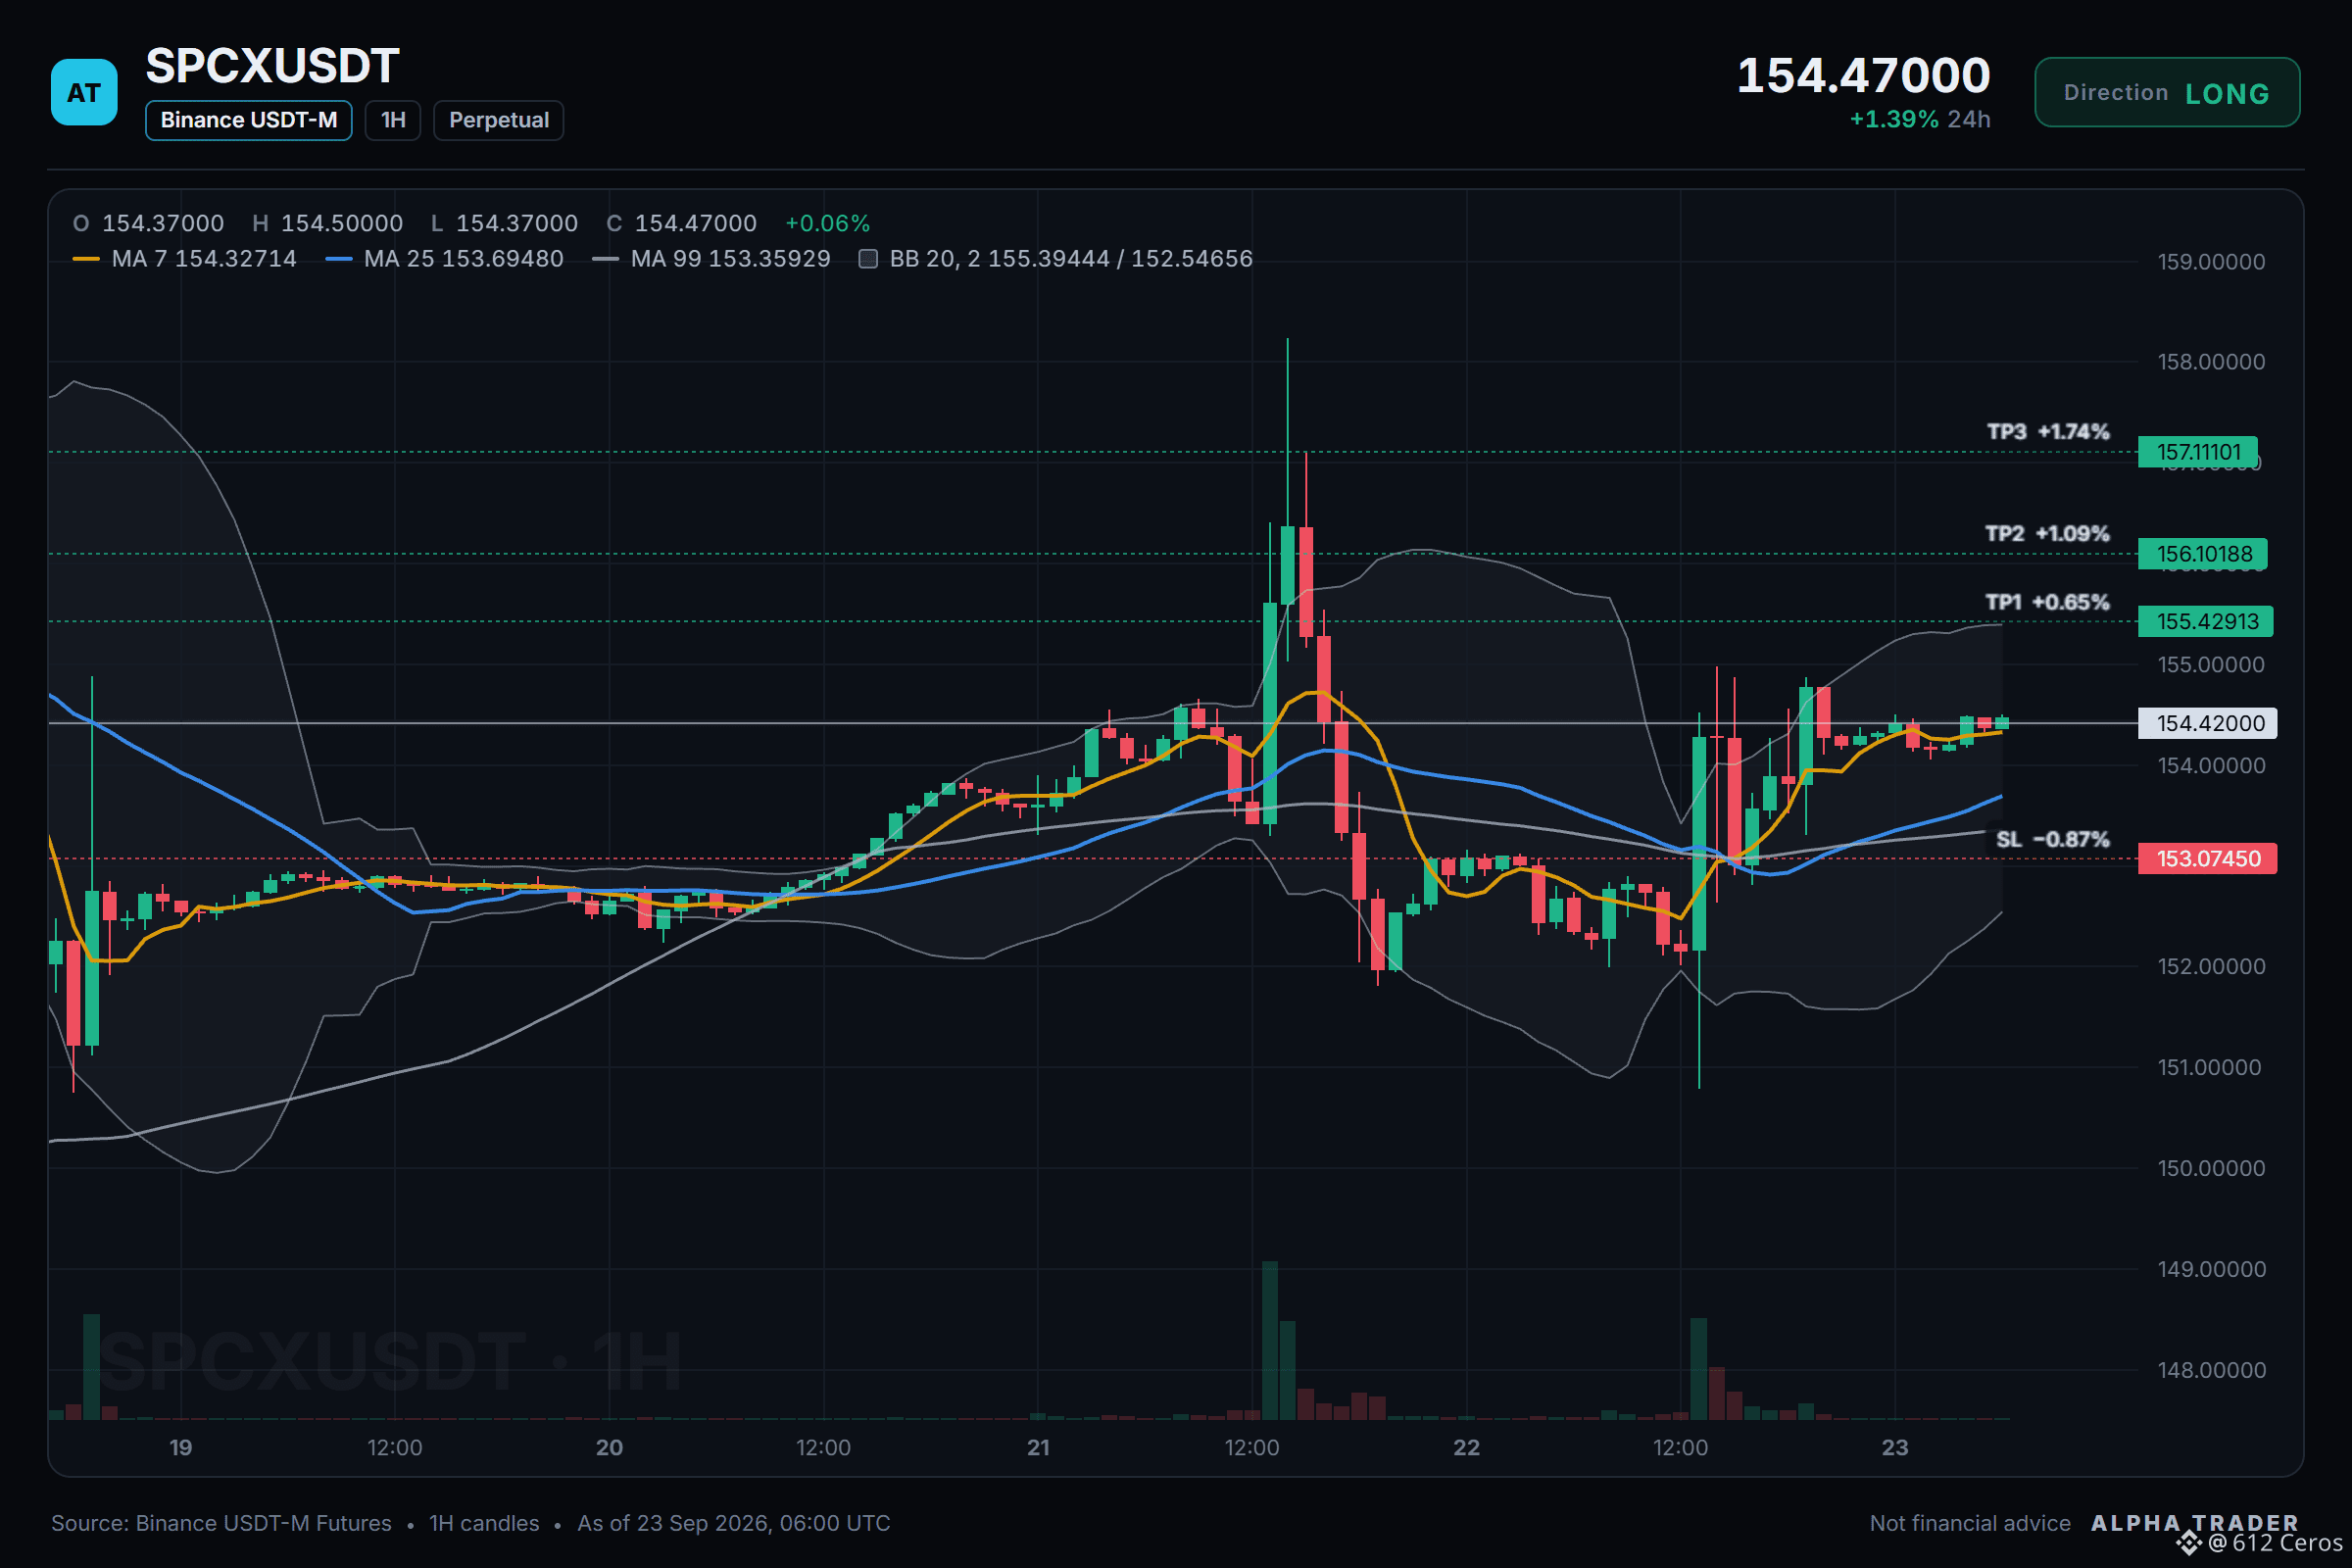
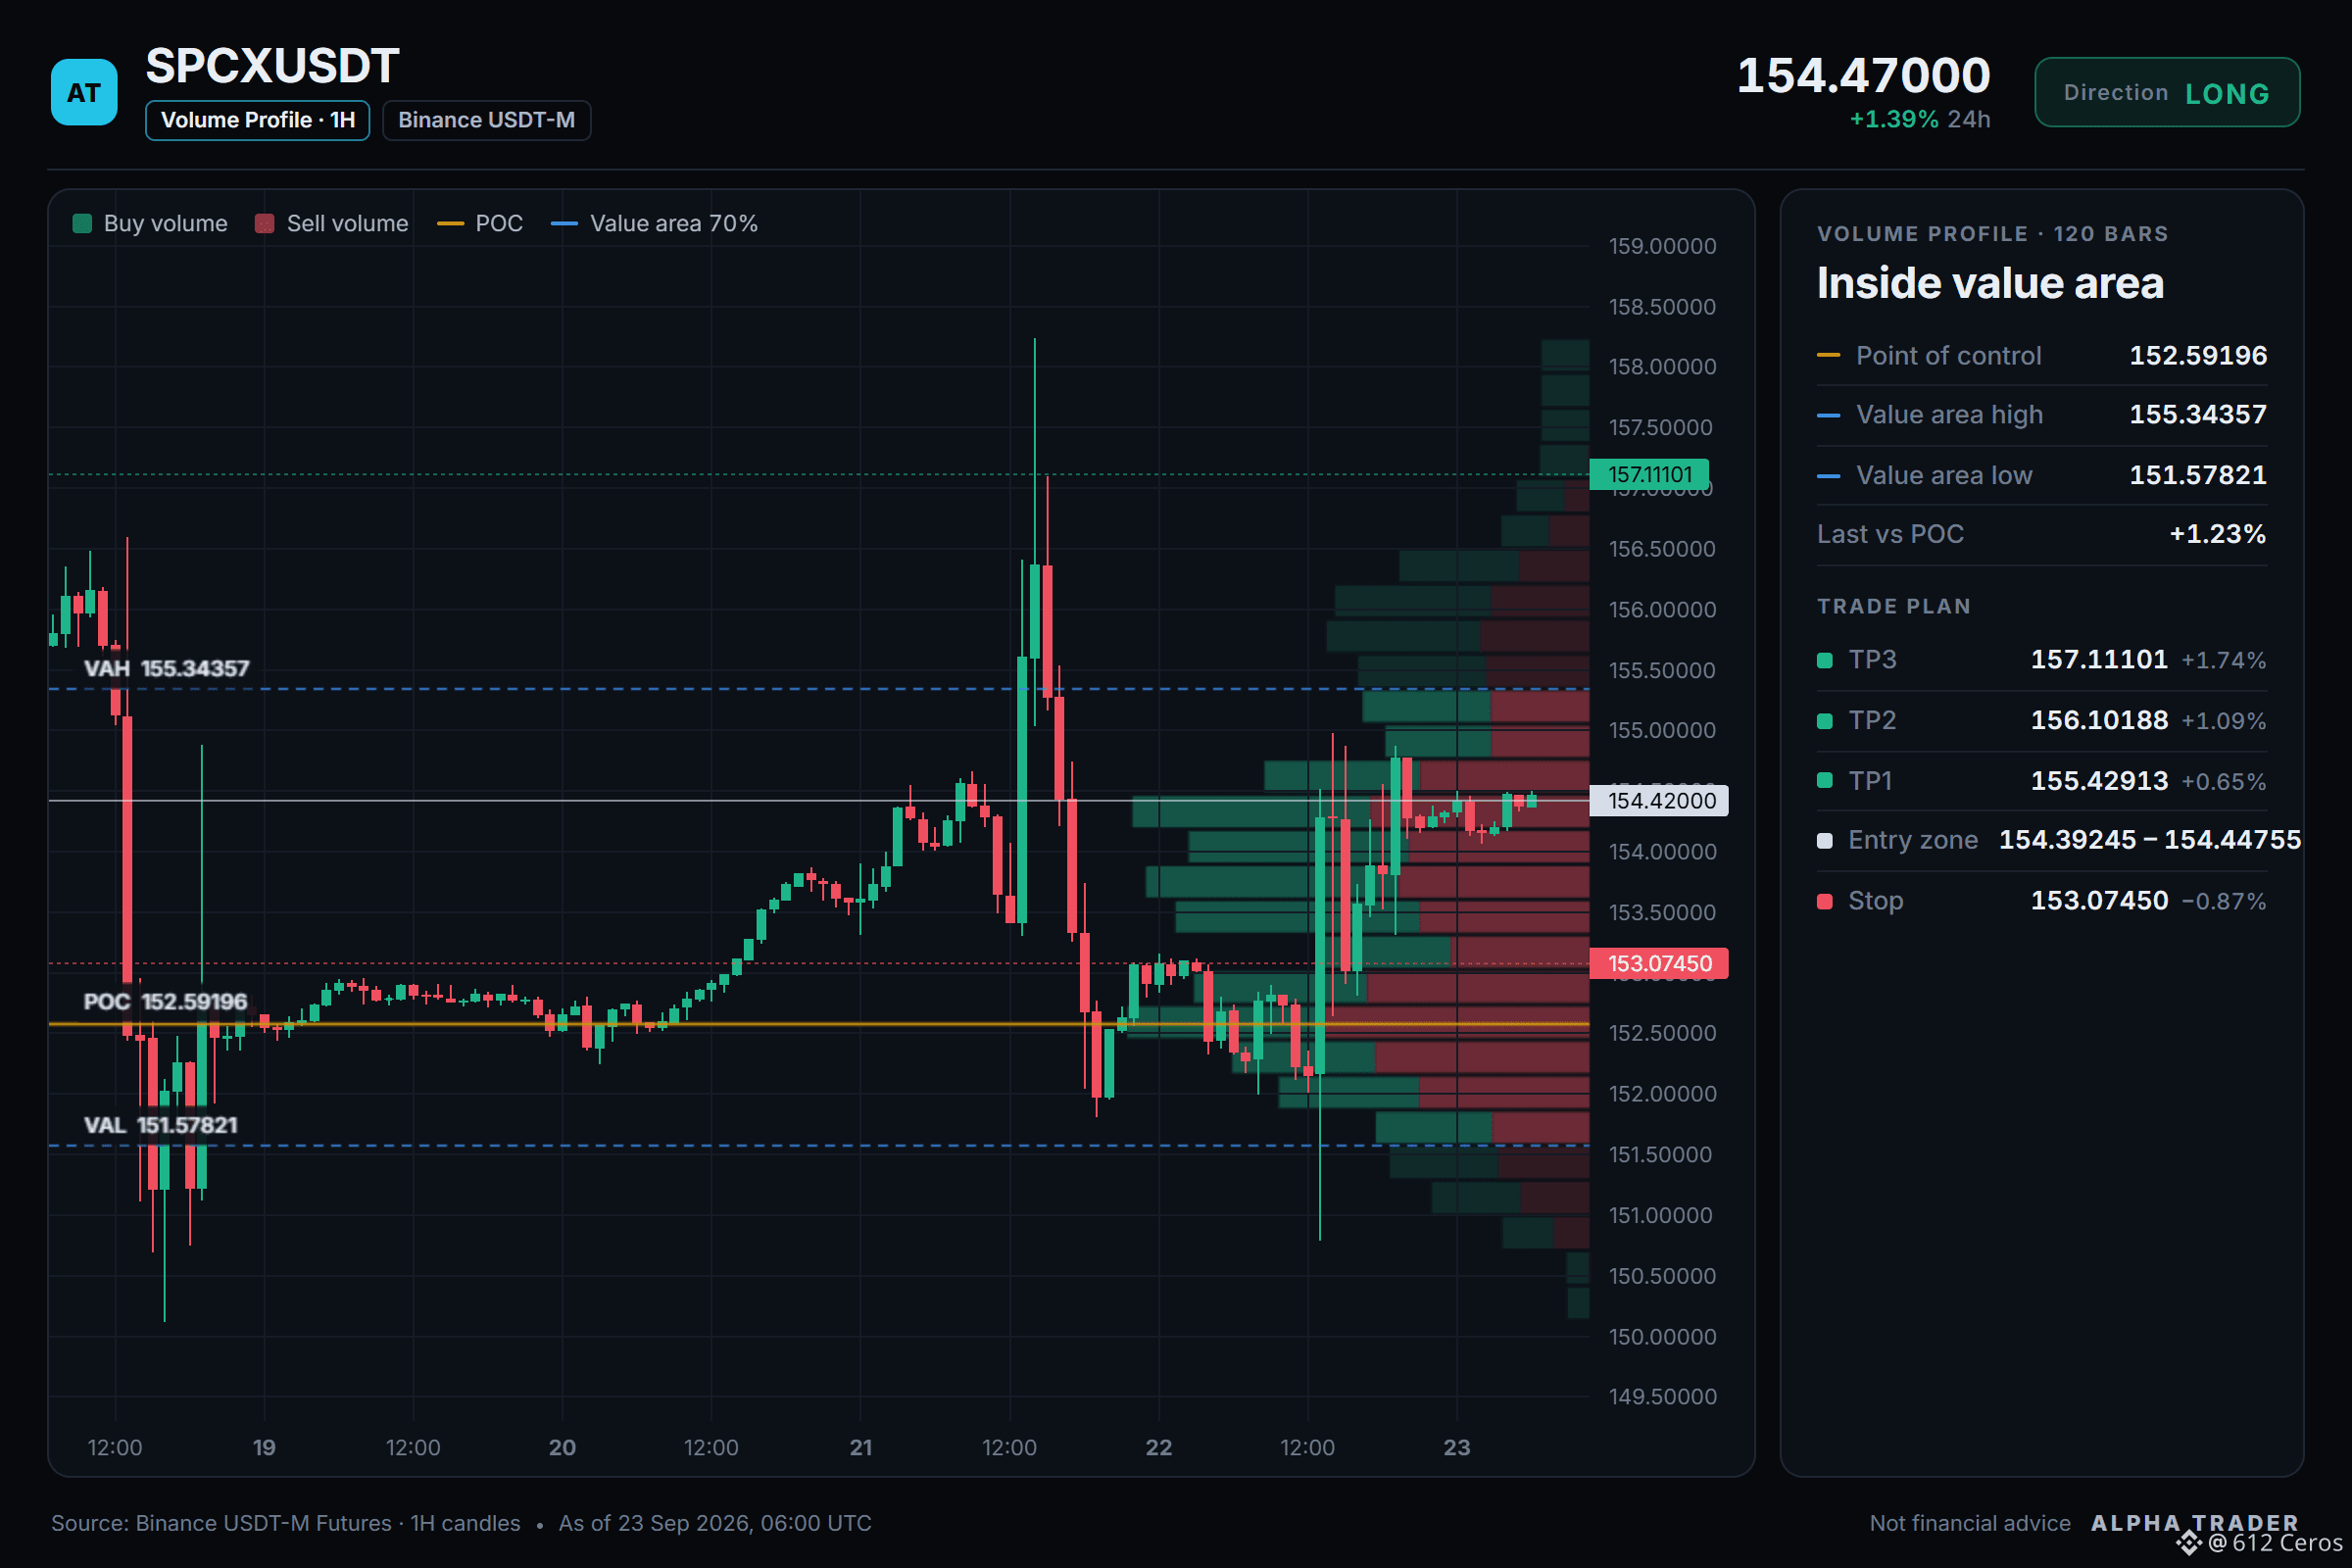
🎯 TP3: 157.11101
🎯 TP2: 156.10188
🎯 TP1: 155.42913
📍 Entry: 154.39245 – 154.44755
🛑 SL: 153.07450
Why I like it:
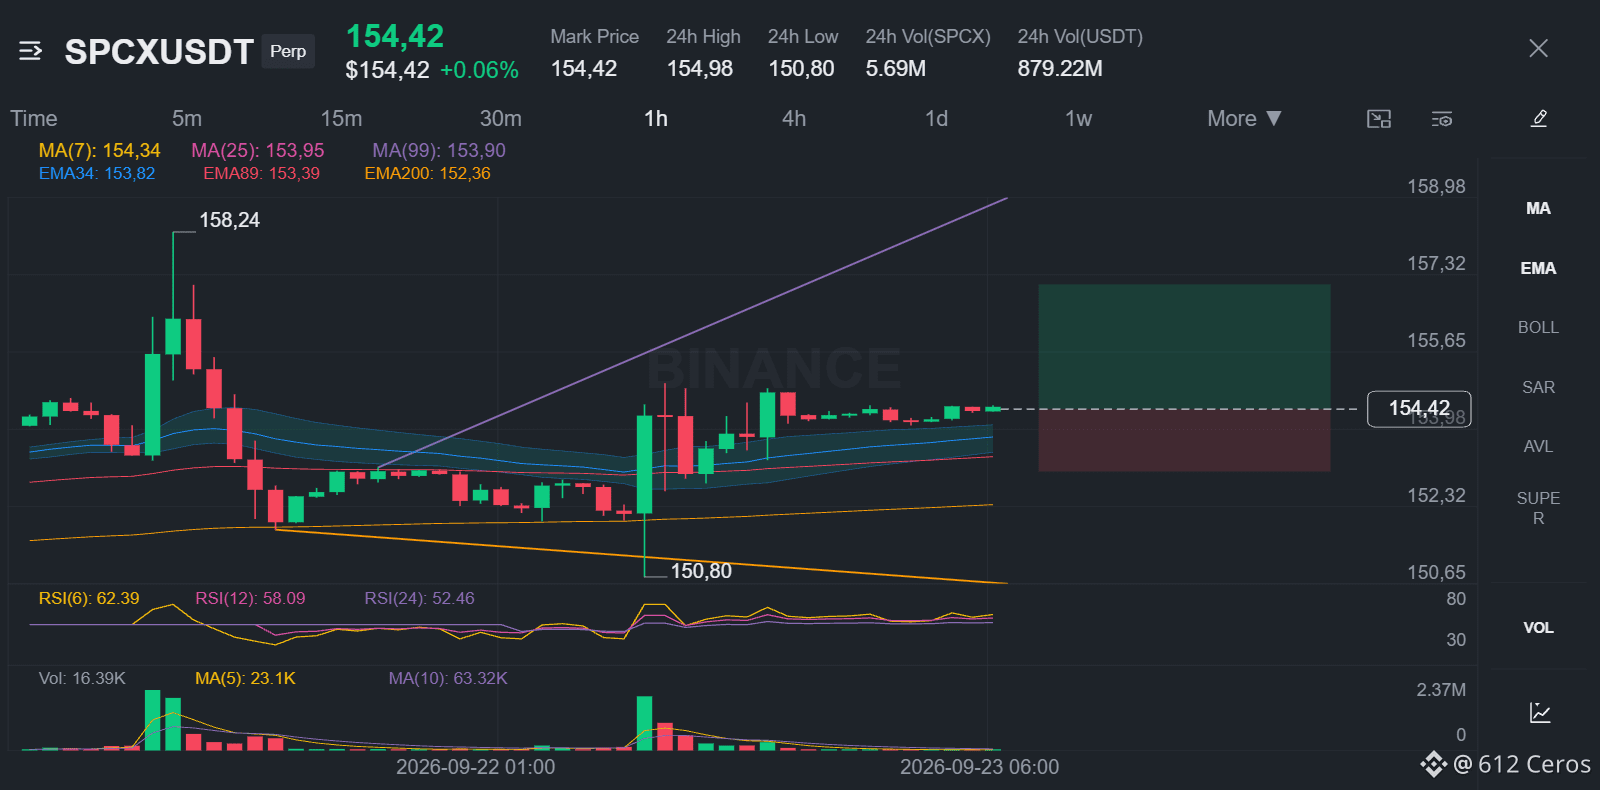
The daily trend reads range, and 5/11 signals aligned favour the long side. The plan is to work the 154.39245 – 154.44755 zone, scale out at 155.42913 and 156.10188, and stay patient for 157.11101. A move through 153.07450 means the idea is wrong and the stop does its job.
Over to you:
Does SPCX tag 155.42913 first, or the stop?
Levels mapped on the chart below 👇
{future}(SPCXUSDT)
⚠️ Personal market analysis only. NFA — manage risk and DYOR.
Educational content, not investment advice or a recommendation to buy, sell, deposit, or withdraw any asset. No paid promotion or referral/affiliate links.
SPCX long setup: the levels I'm watching
$SPCX /USDT - 🟢 Bias: LONG (Leaning) · 5/11 signals aligned
⚠️ Leaning only: 6 of 11 signals are still undecided. Keep size light.
Technical verdict: LEANING LONG. 5 of 11 signals aligned, 0 against.
✅ 4h trend: price > EMA50 > EMA200, bullish stack
✅ 1h trend: price > EMA50 > EMA200, bullish stack
✅ Trend strength (ADX/DI, 15m): ADX 26.0 with buyers in control (DI+ 22.8 vs DI− 12.9)
✅ 4h RSI: 56.8, bullish momentum (above 55)
✅ 1h RSI: 57.6, bullish momentum (above 55)
No factor points the other way right now.
Price map:
🎯 TP3: 157.11101
🎯 TP2: 156.10188
🎯 TP1: 155.42913
📍 Entry: 154.39245 – 154.44755
🛑 SL: 153.07450
Why I like it:
The daily trend reads range, and 5/11 signals aligned favour the long side. The plan is to work the 154.39245 – 154.44755 zone, scale out at 155.42913 and 156.10188, and stay patient for 157.11101. A move through 153.07450 means the idea is wrong and the stop does its job.
Over to you:
Does SPCX tag 155.42913 first, or the stop?
Levels mapped on the chart below 👇
⚠️ Personal market analysis only. NFA — manage risk and DYOR.
Educational content, not investment advice or a recommendation to buy, sell, deposit, or withdraw any asset. No paid promotion or referral/affiliate links.
$SPCX /USDT - 🟢 Bias: LONG (Leaning) · 5/11 signals aligned
⚠️ Leaning only: 6 of 11 signals are still undecided. Keep size light.
Technical verdict: LEANING LONG. 5 of 11 signals aligned, 0 against.
✅ 4h trend: price > EMA50 > EMA200, bullish stack
✅ 1h trend: price > EMA50 > EMA200, bullish stack
✅ Trend strength (ADX/DI, 15m): ADX 26.0 with buyers in control (DI+ 22.8 vs DI− 12.9)
✅ 4h RSI: 56.8, bullish momentum (above 55)
✅ 1h RSI: 57.6, bullish momentum (above 55)
No factor points the other way right now.
Price map:
🎯 TP3: 157.11101
🎯 TP2: 156.10188
🎯 TP1: 155.42913
📍 Entry: 154.39245 – 154.44755
🛑 SL: 153.07450
Why I like it:
The daily trend reads range, and 5/11 signals aligned favour the long side. The plan is to work the 154.39245 – 154.44755 zone, scale out at 155.42913 and 156.10188, and stay patient for 157.11101. A move through 153.07450 means the idea is wrong and the stop does its job.
Over to you:
Does SPCX tag 155.42913 first, or the stop?
Levels mapped on the chart below 👇
⚠️ Personal market analysis only. NFA — manage risk and DYOR.
Educational content, not investment advice or a recommendation to buy, sell, deposit, or withdraw any asset. No paid promotion or referral/affiliate links.
3
4.3k
·
--
Bullish
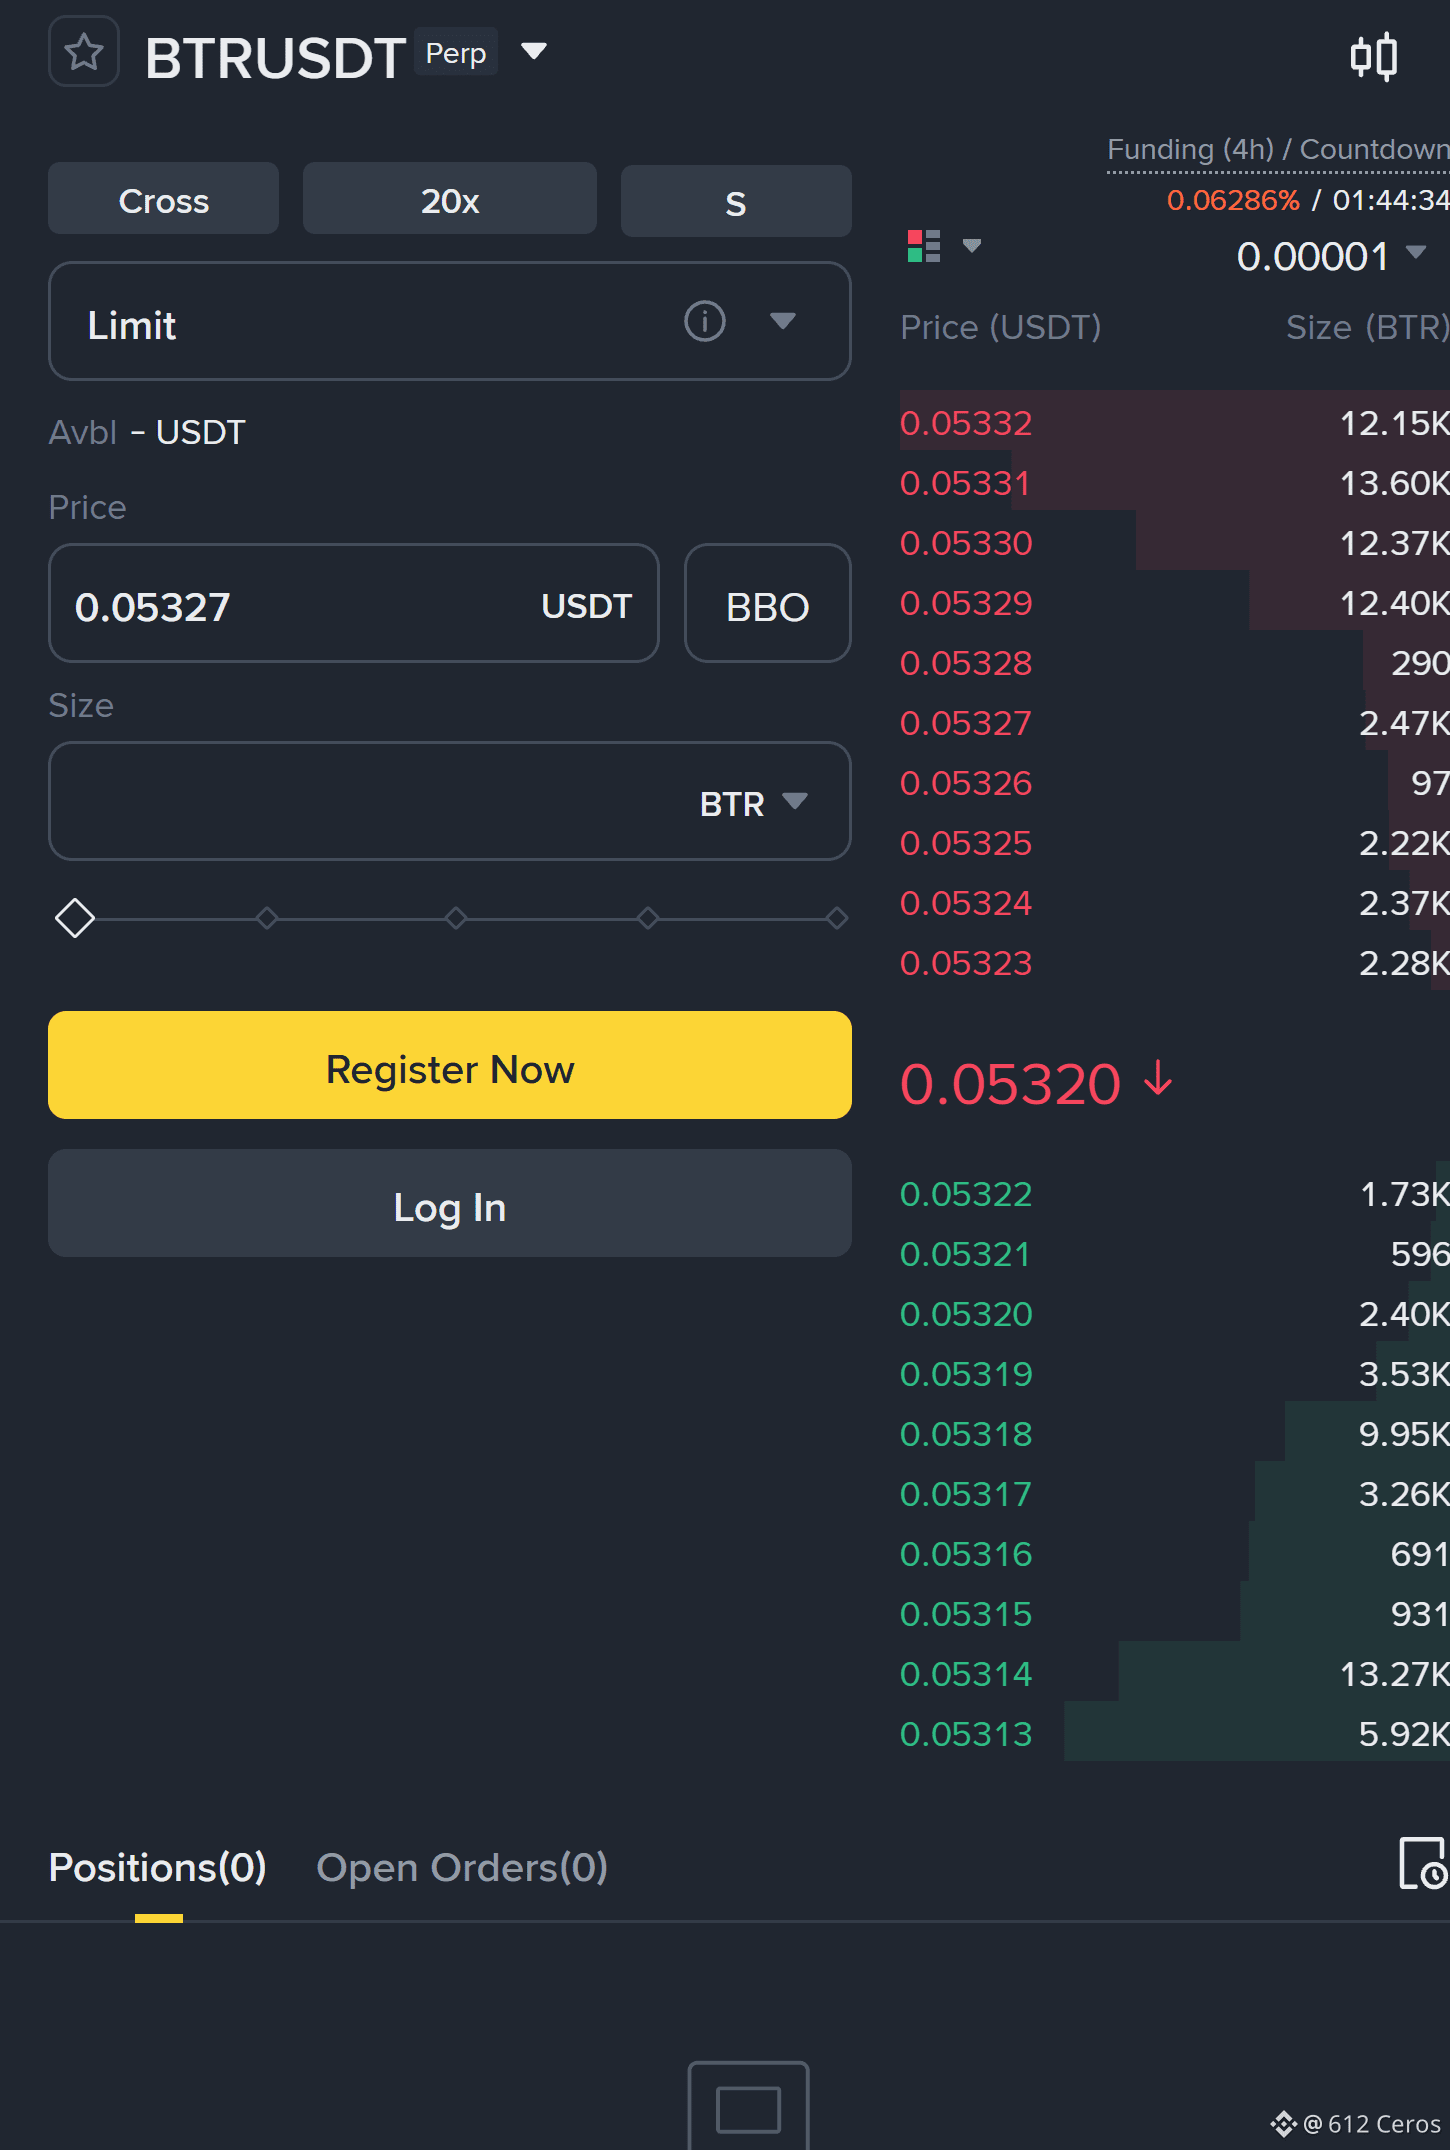
BTR is not a myth; its daily bullish stack is real.
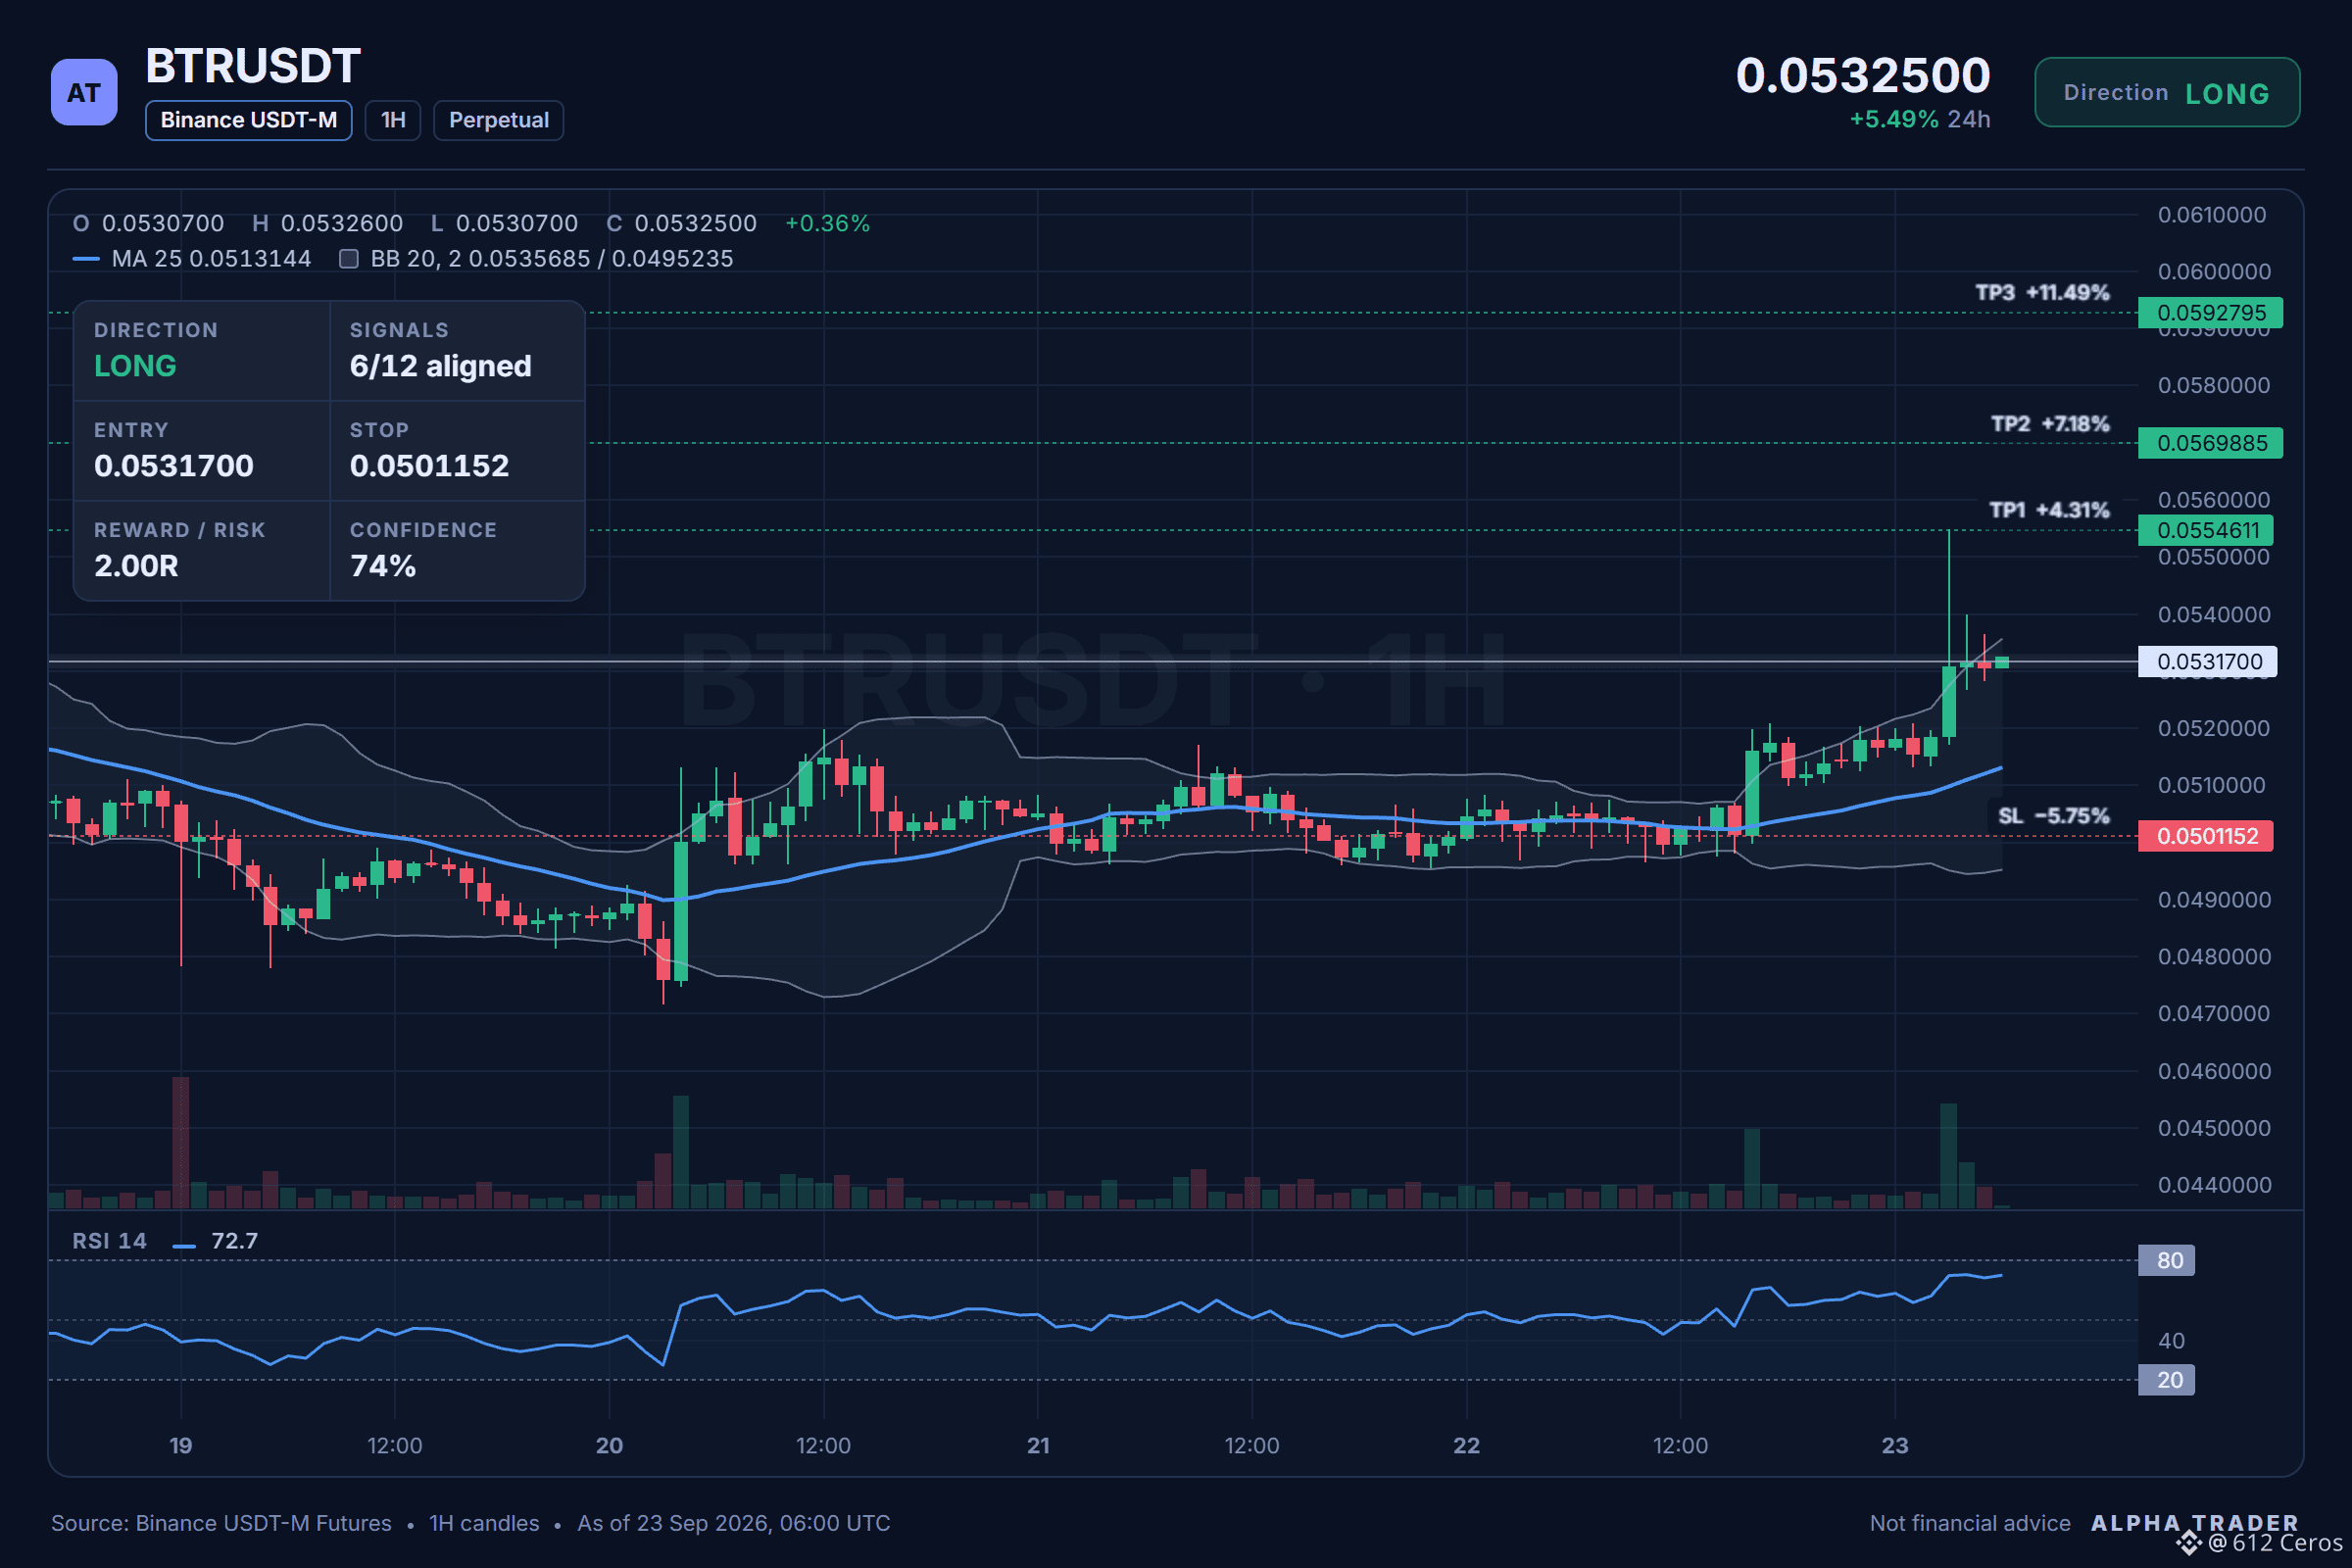
$BTR /USDT - 🟢 Bias: LONG (Strong) · 6/12 signals aligned
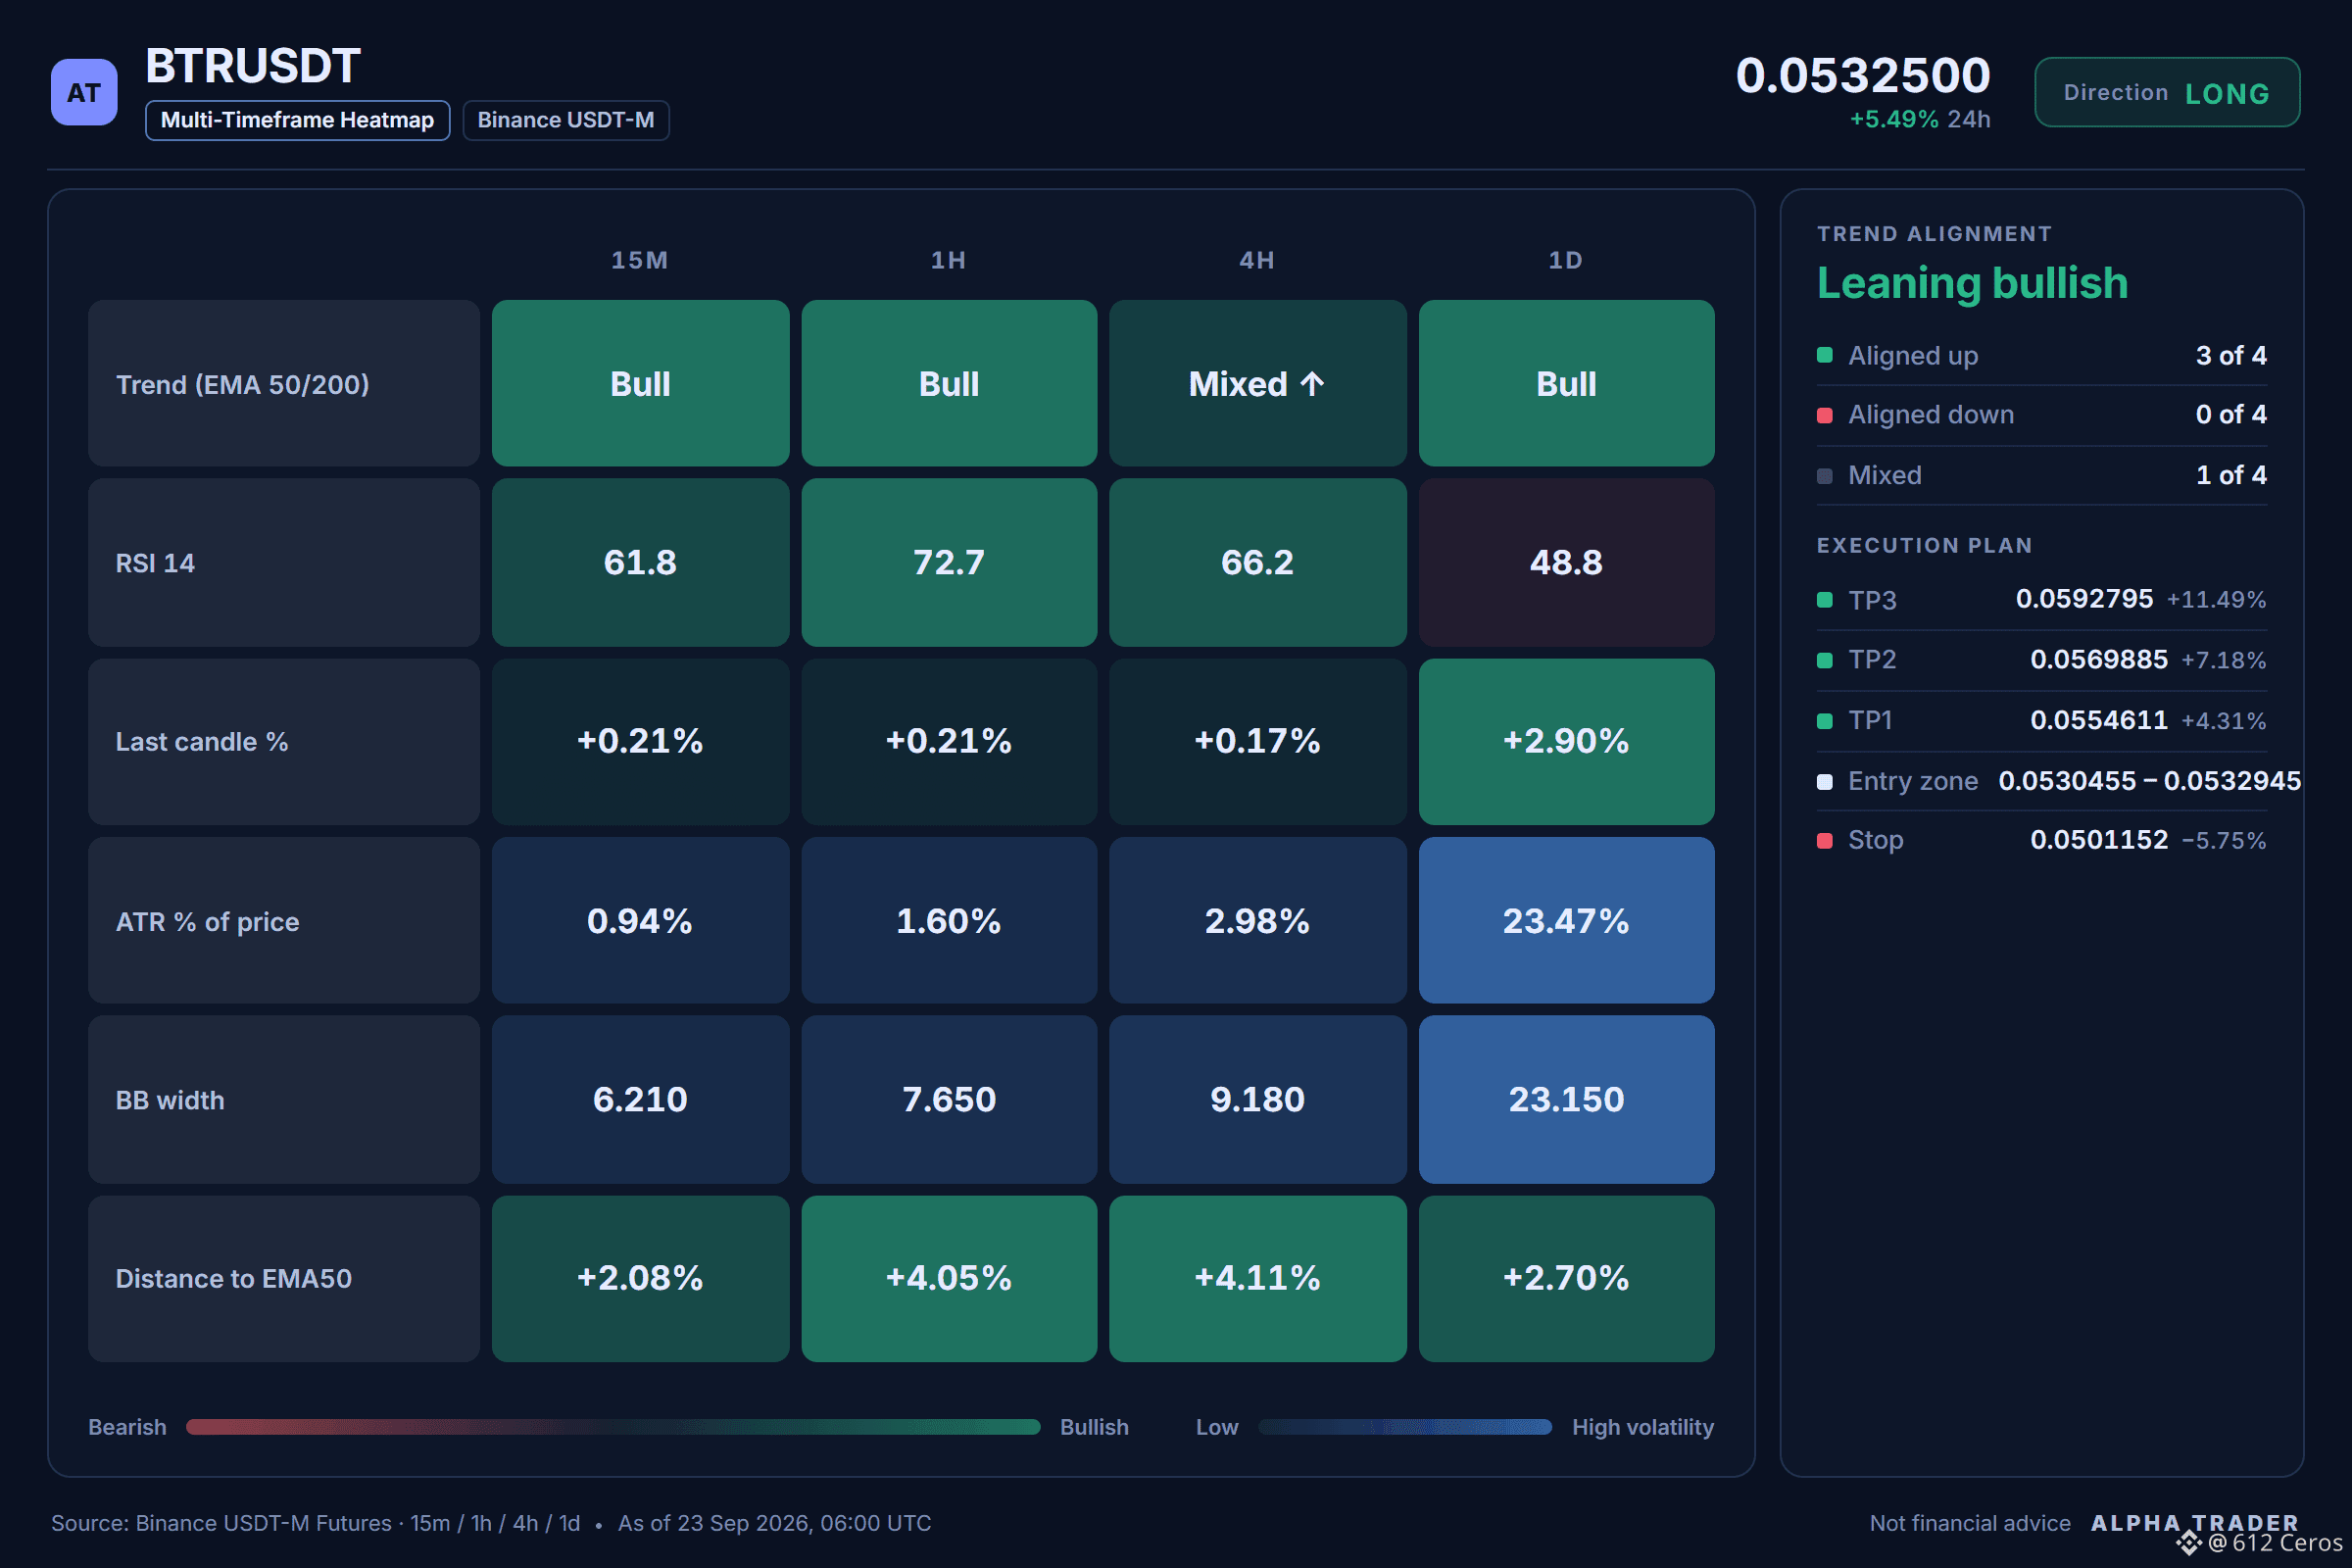
BTR setup checklist: 6/12 signals aligned
✔️ Daily trend: price > EMA50 > EMA200, bullish stack
✔️ 1h trend: price > EMA50 > EMA200, bullish stack
✔️ Trend strength (ADX/DI, 15m): ADX 49.0 with buyers in control (DI+ 38.2 vs DI− 9.0)
✔️ 4h RSI: 66.2, bullish momentum (above 55)
✔️ 1h RSI: 72.7, bullish momentum (above 55)
👀 Invalidation: the idea is wrong beyond 0.0502810
Net read: Verdict: LONG (Strong, 6/12 signals aligned). Daily trend bullish with price above EMA50 and EMA200 stacked, 1h trend showing the same bullish stack, and the strongest factor being ADX at 49.0 with buyers firmly in control (DI+ 38.2 vs DI− 9.0). The main headwind is mixed 4h trend structure, where price sits above EMA50 but the EMAs are not stacked.
Trade Plan:
Entry: 0.0530455 – 0.0532945
SL: 0.0501152
TP1: 0.0554611
TP2: 0.0569885
TP3: 0.0592795
Over to you:
If you were in this trade, where would you place your initial stop relative to the 1h EMA50?
Click here to view the chart 👇️
{future}(BTRUSDT)
⚠️ Personal market analysis only. NFA — manage risk and DYOR.
Educational content, not investment advice or a recommendation to buy, sell, deposit, or withdraw any asset. No paid promotion or referral/affiliate links.
BTR is not a myth; its daily bullish stack is real.
$BTR /USDT - 🟢 Bias: LONG (Strong) · 6/12 signals aligned
BTR setup checklist: 6/12 signals aligned
✔️ Daily trend: price > EMA50 > EMA200, bullish stack
✔️ 1h trend: price > EMA50 > EMA200, bullish stack
✔️ Trend strength (ADX/DI, 15m): ADX 49.0 with buyers in control (DI+ 38.2 vs DI− 9.0)
✔️ 4h RSI: 66.2, bullish momentum (above 55)
✔️ 1h RSI: 72.7, bullish momentum (above 55)
👀 Invalidation: the idea is wrong beyond 0.0502810
Net read: Verdict: LONG (Strong, 6/12 signals aligned). Daily trend bullish with price above EMA50 and EMA200 stacked, 1h trend showing the same bullish stack, and the strongest factor being ADX at 49.0 with buyers firmly in control (DI+ 38.2 vs DI− 9.0). The main headwind is mixed 4h trend structure, where price sits above EMA50 but the EMAs are not stacked.
Trade Plan:
Entry: 0.0530455 – 0.0532945
SL: 0.0501152
TP1: 0.0554611
TP2: 0.0569885
TP3: 0.0592795
Over to you:
If you were in this trade, where would you place your initial stop relative to the 1h EMA50?
Click here to view the chart 👇️
⚠️ Personal market analysis only. NFA — manage risk and DYOR.
Educational content, not investment advice or a recommendation to buy, sell, deposit, or withdraw any asset. No paid promotion or referral/affiliate links.
$BTR /USDT - 🟢 Bias: LONG (Strong) · 6/12 signals aligned
BTR setup checklist: 6/12 signals aligned
✔️ Daily trend: price > EMA50 > EMA200, bullish stack
✔️ 1h trend: price > EMA50 > EMA200, bullish stack
✔️ Trend strength (ADX/DI, 15m): ADX 49.0 with buyers in control (DI+ 38.2 vs DI− 9.0)
✔️ 4h RSI: 66.2, bullish momentum (above 55)
✔️ 1h RSI: 72.7, bullish momentum (above 55)
👀 Invalidation: the idea is wrong beyond 0.0502810
Net read: Verdict: LONG (Strong, 6/12 signals aligned). Daily trend bullish with price above EMA50 and EMA200 stacked, 1h trend showing the same bullish stack, and the strongest factor being ADX at 49.0 with buyers firmly in control (DI+ 38.2 vs DI− 9.0). The main headwind is mixed 4h trend structure, where price sits above EMA50 but the EMAs are not stacked.
Trade Plan:
Entry: 0.0530455 – 0.0532945
SL: 0.0501152
TP1: 0.0554611
TP2: 0.0569885
TP3: 0.0592795
Over to you:
If you were in this trade, where would you place your initial stop relative to the 1h EMA50?
Click here to view the chart 👇️
⚠️ Personal market analysis only. NFA — manage risk and DYOR.
Educational content, not investment advice or a recommendation to buy, sell, deposit, or withdraw any asset. No paid promotion or referral/affiliate links.
9
7
3.7k
·
--
Bullish
Range breaks upward when nobody expects it
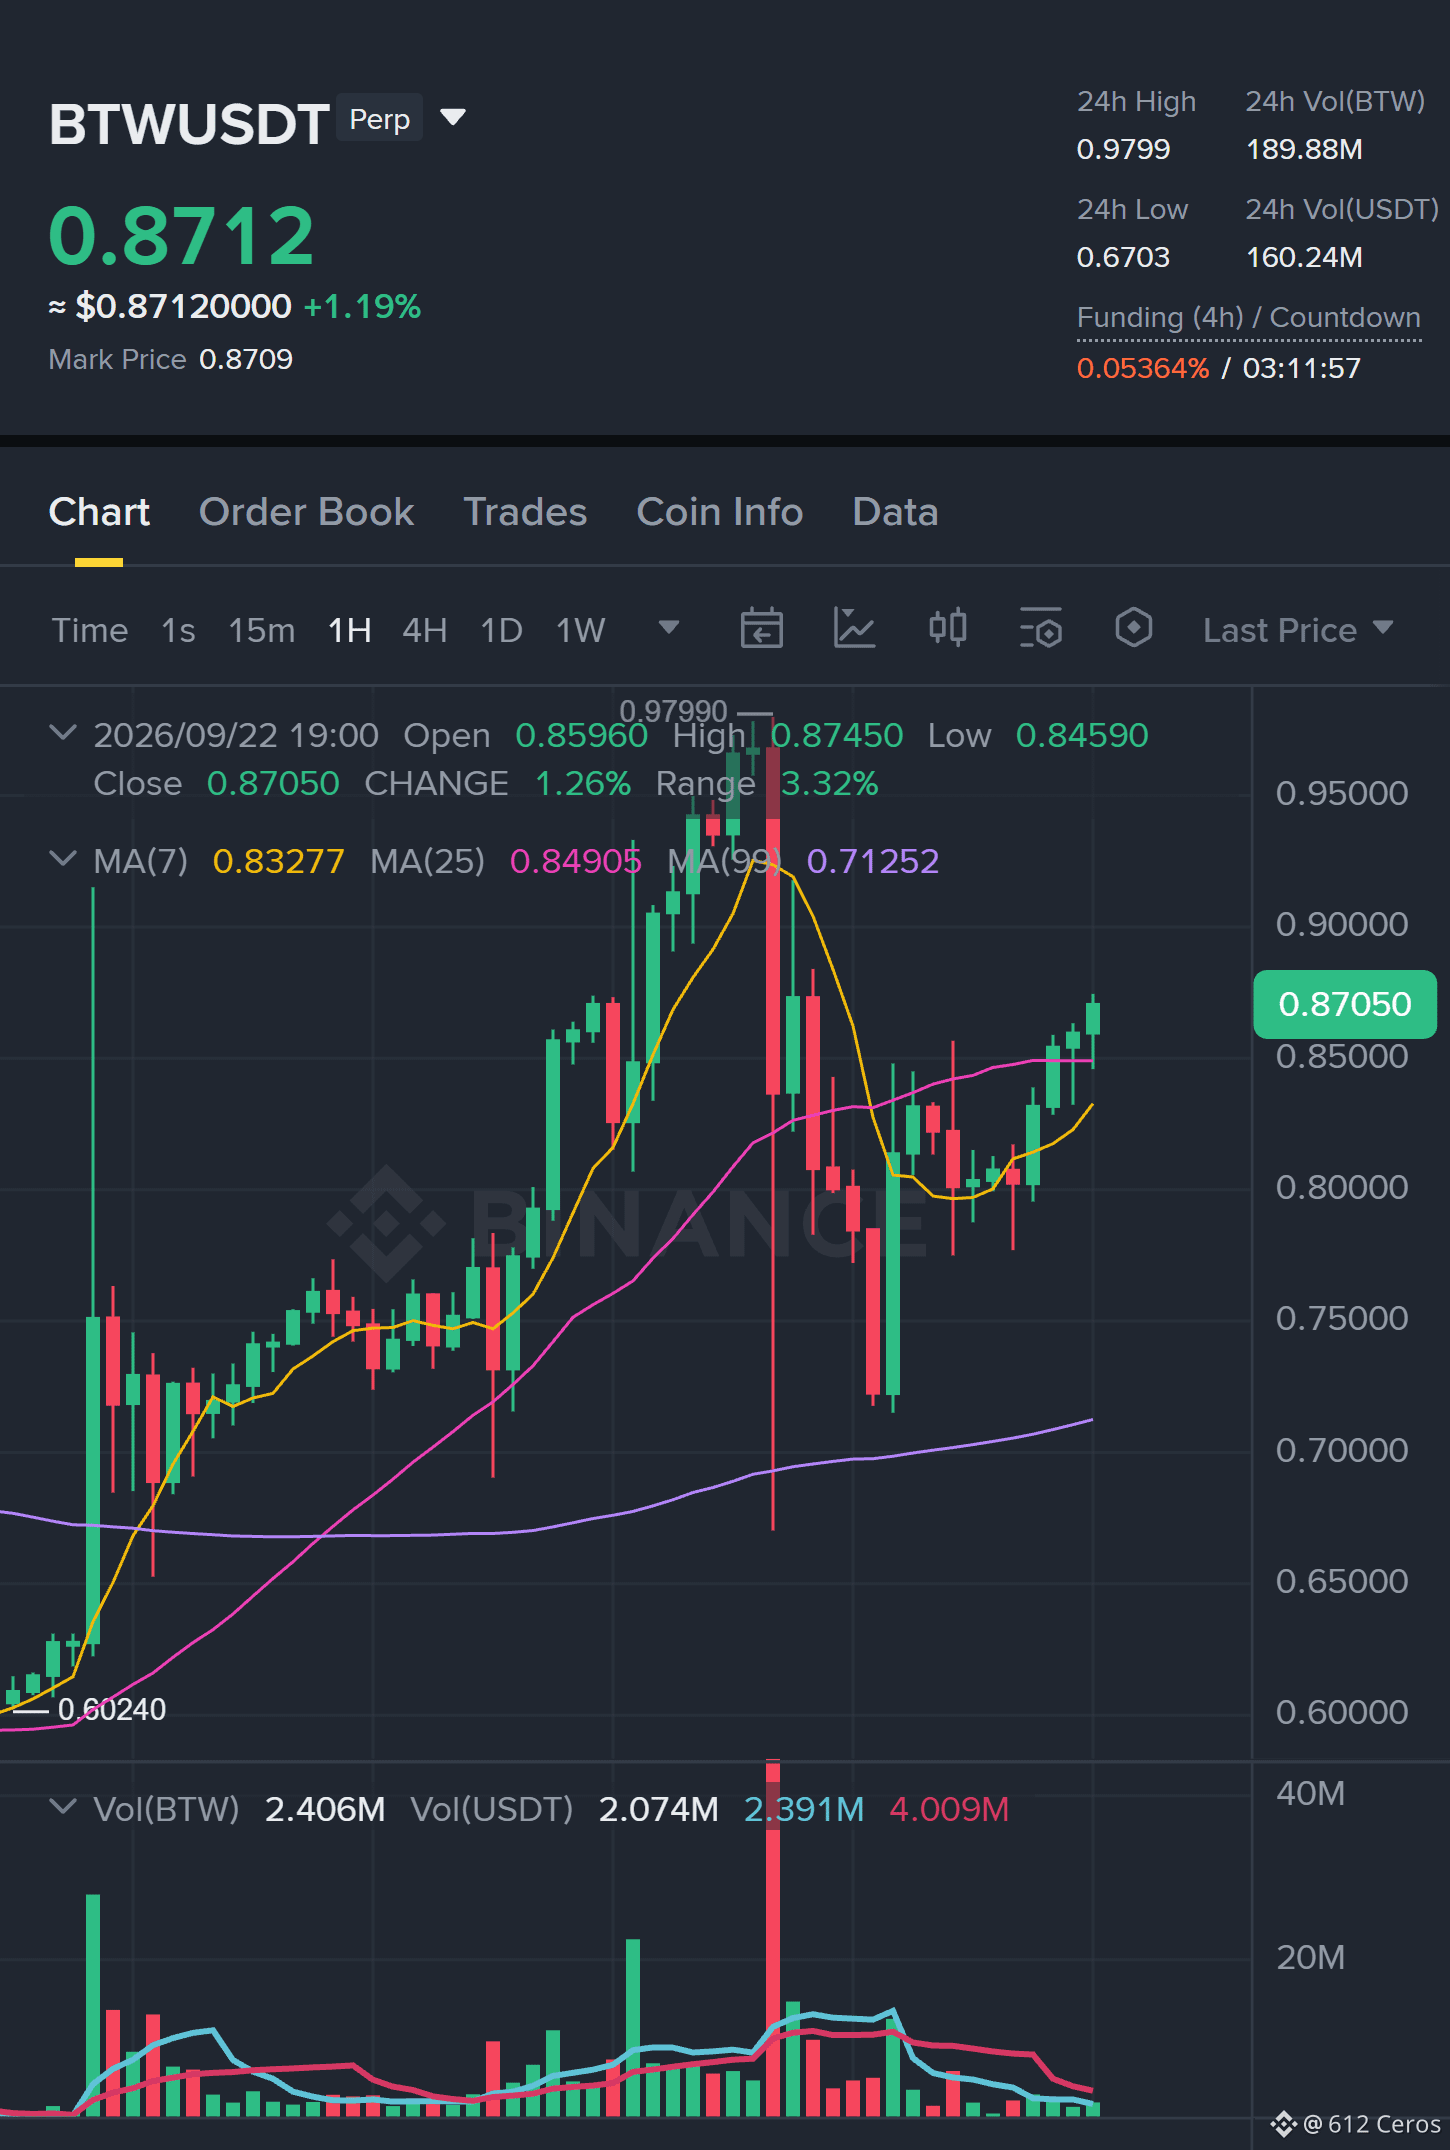
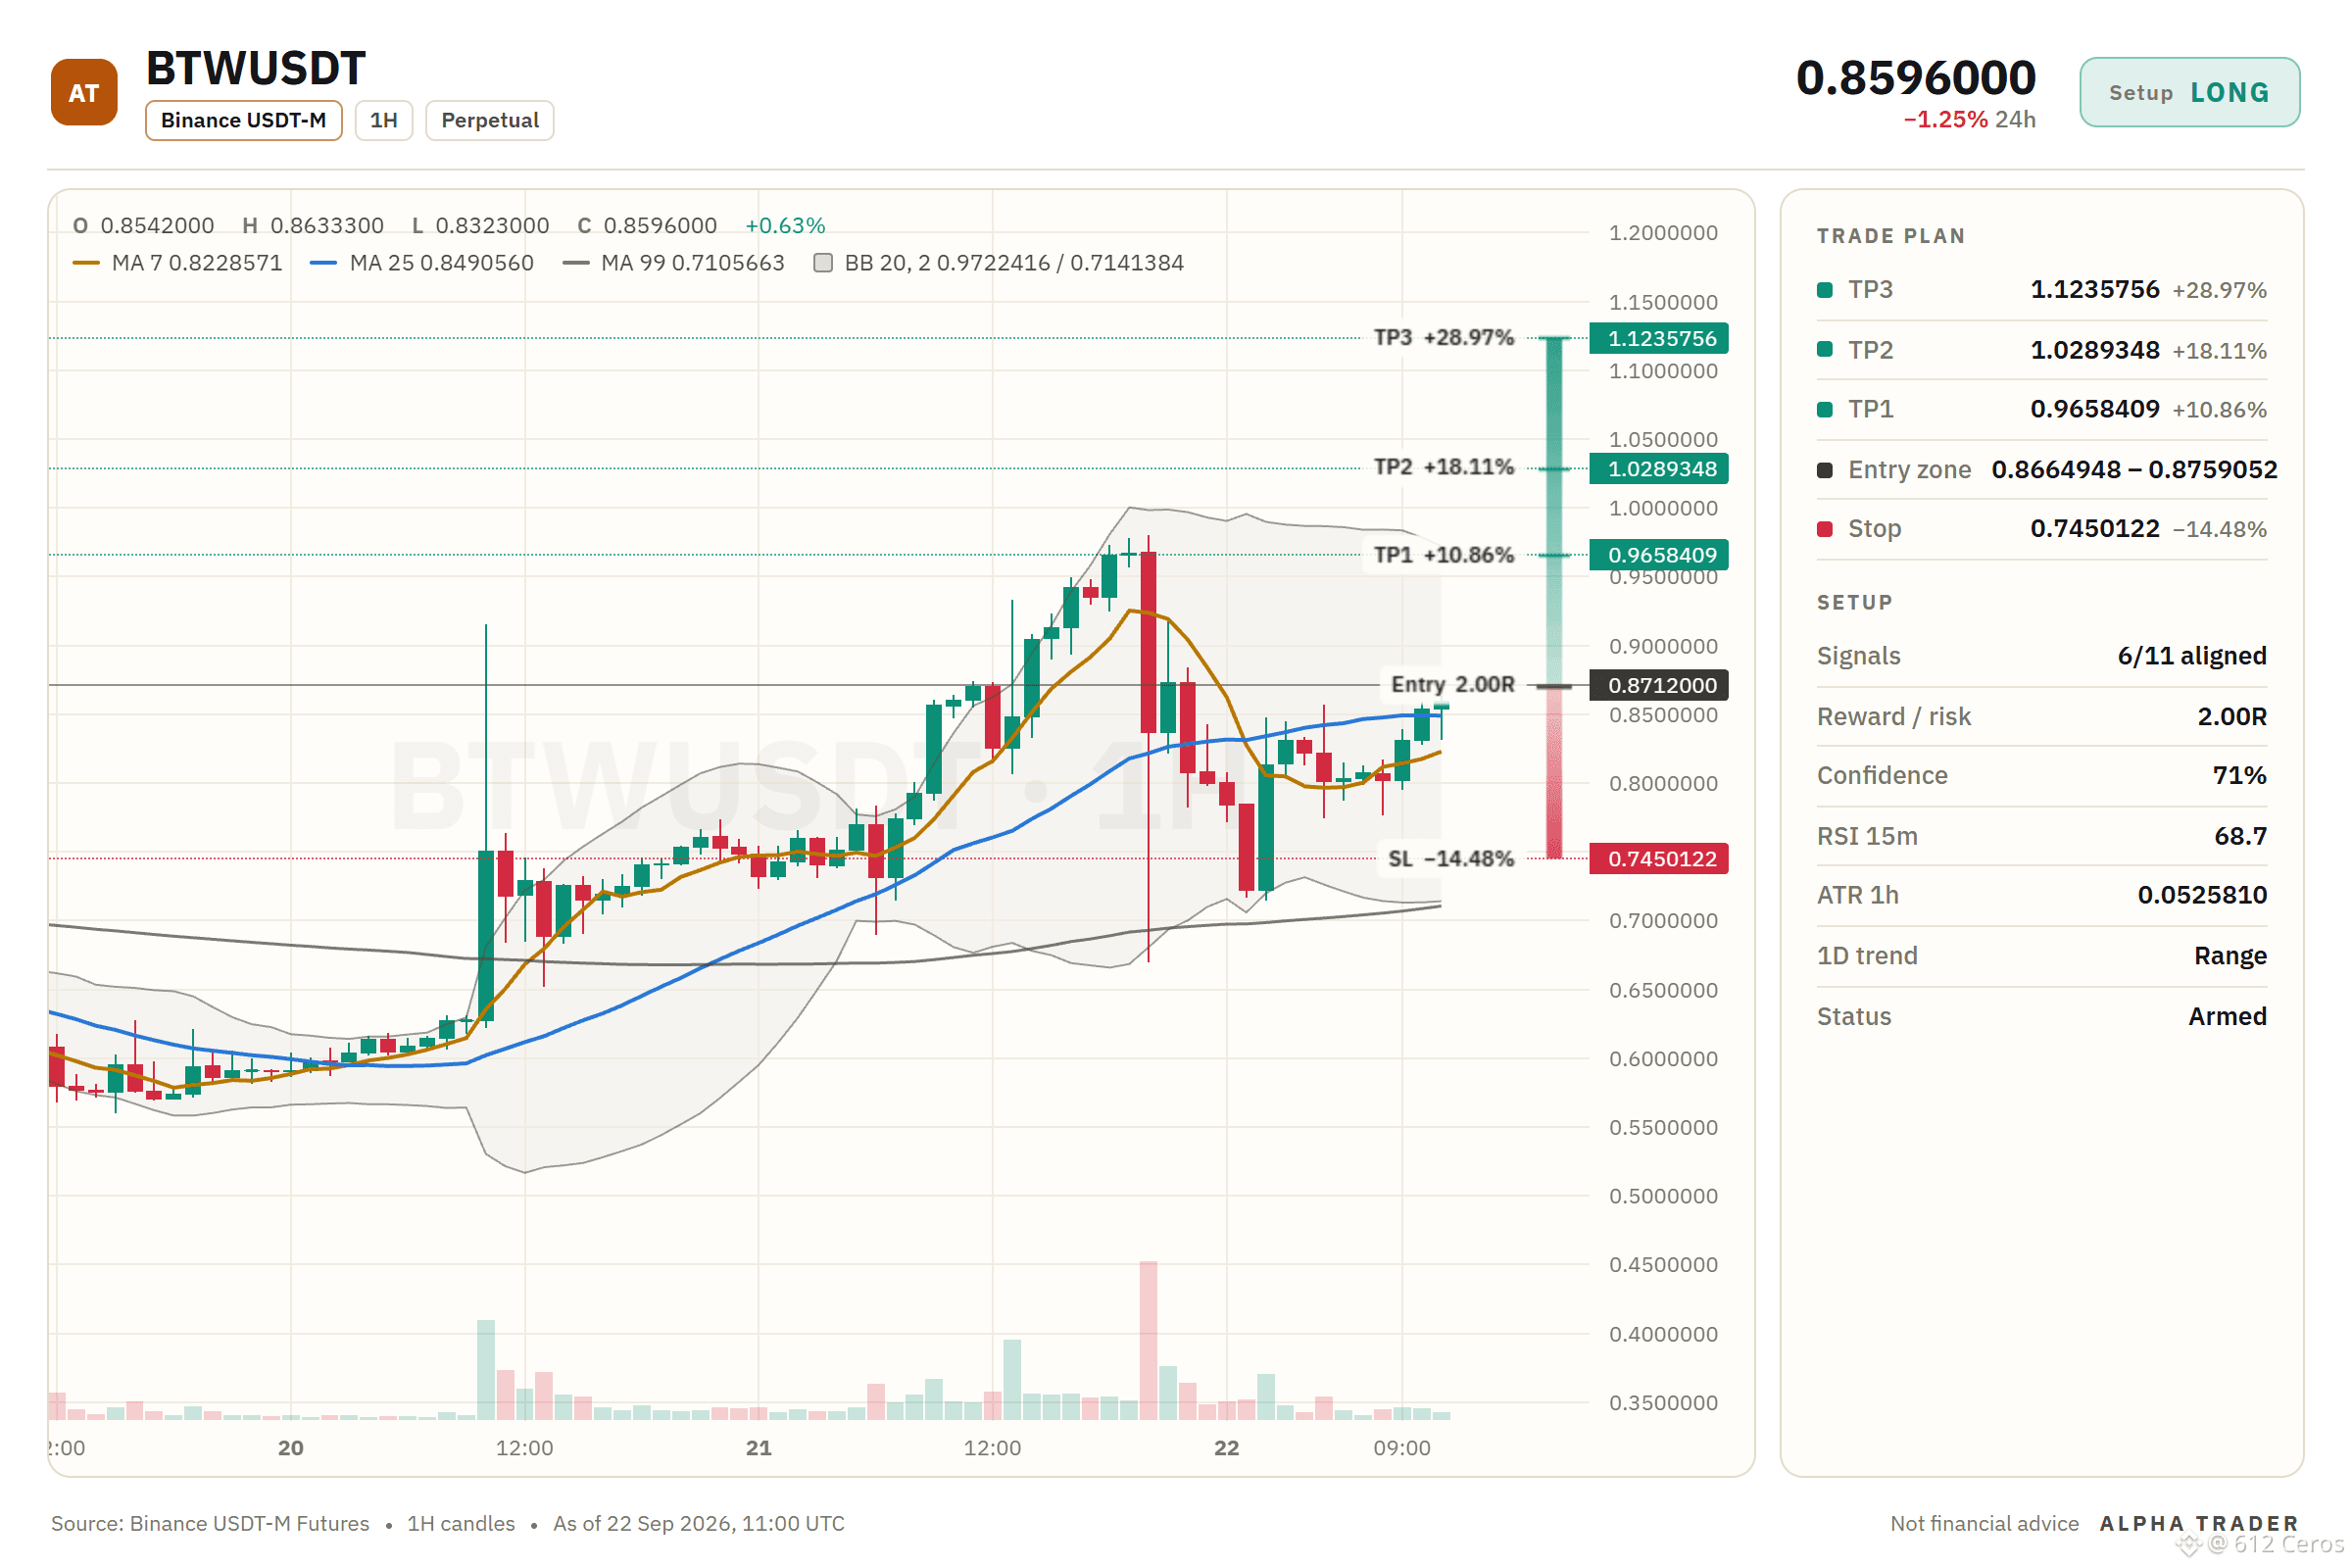
🟢 $BTW /USDT | Bias: LONG (Strong) | 6/11 signals aligned
Technical verdict: STRONG LONG. 6 of 11 signals aligned, 1 against.
✅ 4h trend: price > EMA50 > EMA200, bullish stack
✅ 1h trend: price > EMA50 > EMA200, bullish stack
✅ 4h RSI: 60.6, bullish momentum (above 55)
✅ 1h RSI: 55.9, bullish momentum (above 55)
⚠️ RSI extreme in a range: RSI z-score +2.59 in a range, fade-the-high risk
Q: Why long when the daily trend is range and RSI is overextended?
A: 4h and 1h price sit above both EMAs with bullish stacks and 4h RSI at 60.6.
Q: Where exactly do I enter?
A: The 1h price is 0.8712000, with a valid zone between 0.8664948 and 0.8759052.
Q: When is this trade invalid?
A: A close below 0.6615895 invalidates the setup, as the 1h price is only 0.8712000 above the SL.
Entry: 0.8664948 – 0.8759052 | SL: 0.7450122
TP1: 0.9658409 | TP2: 1.0289348 | TP3: 1.1235756
💬 What is your entry level if you are leaning short into this range?
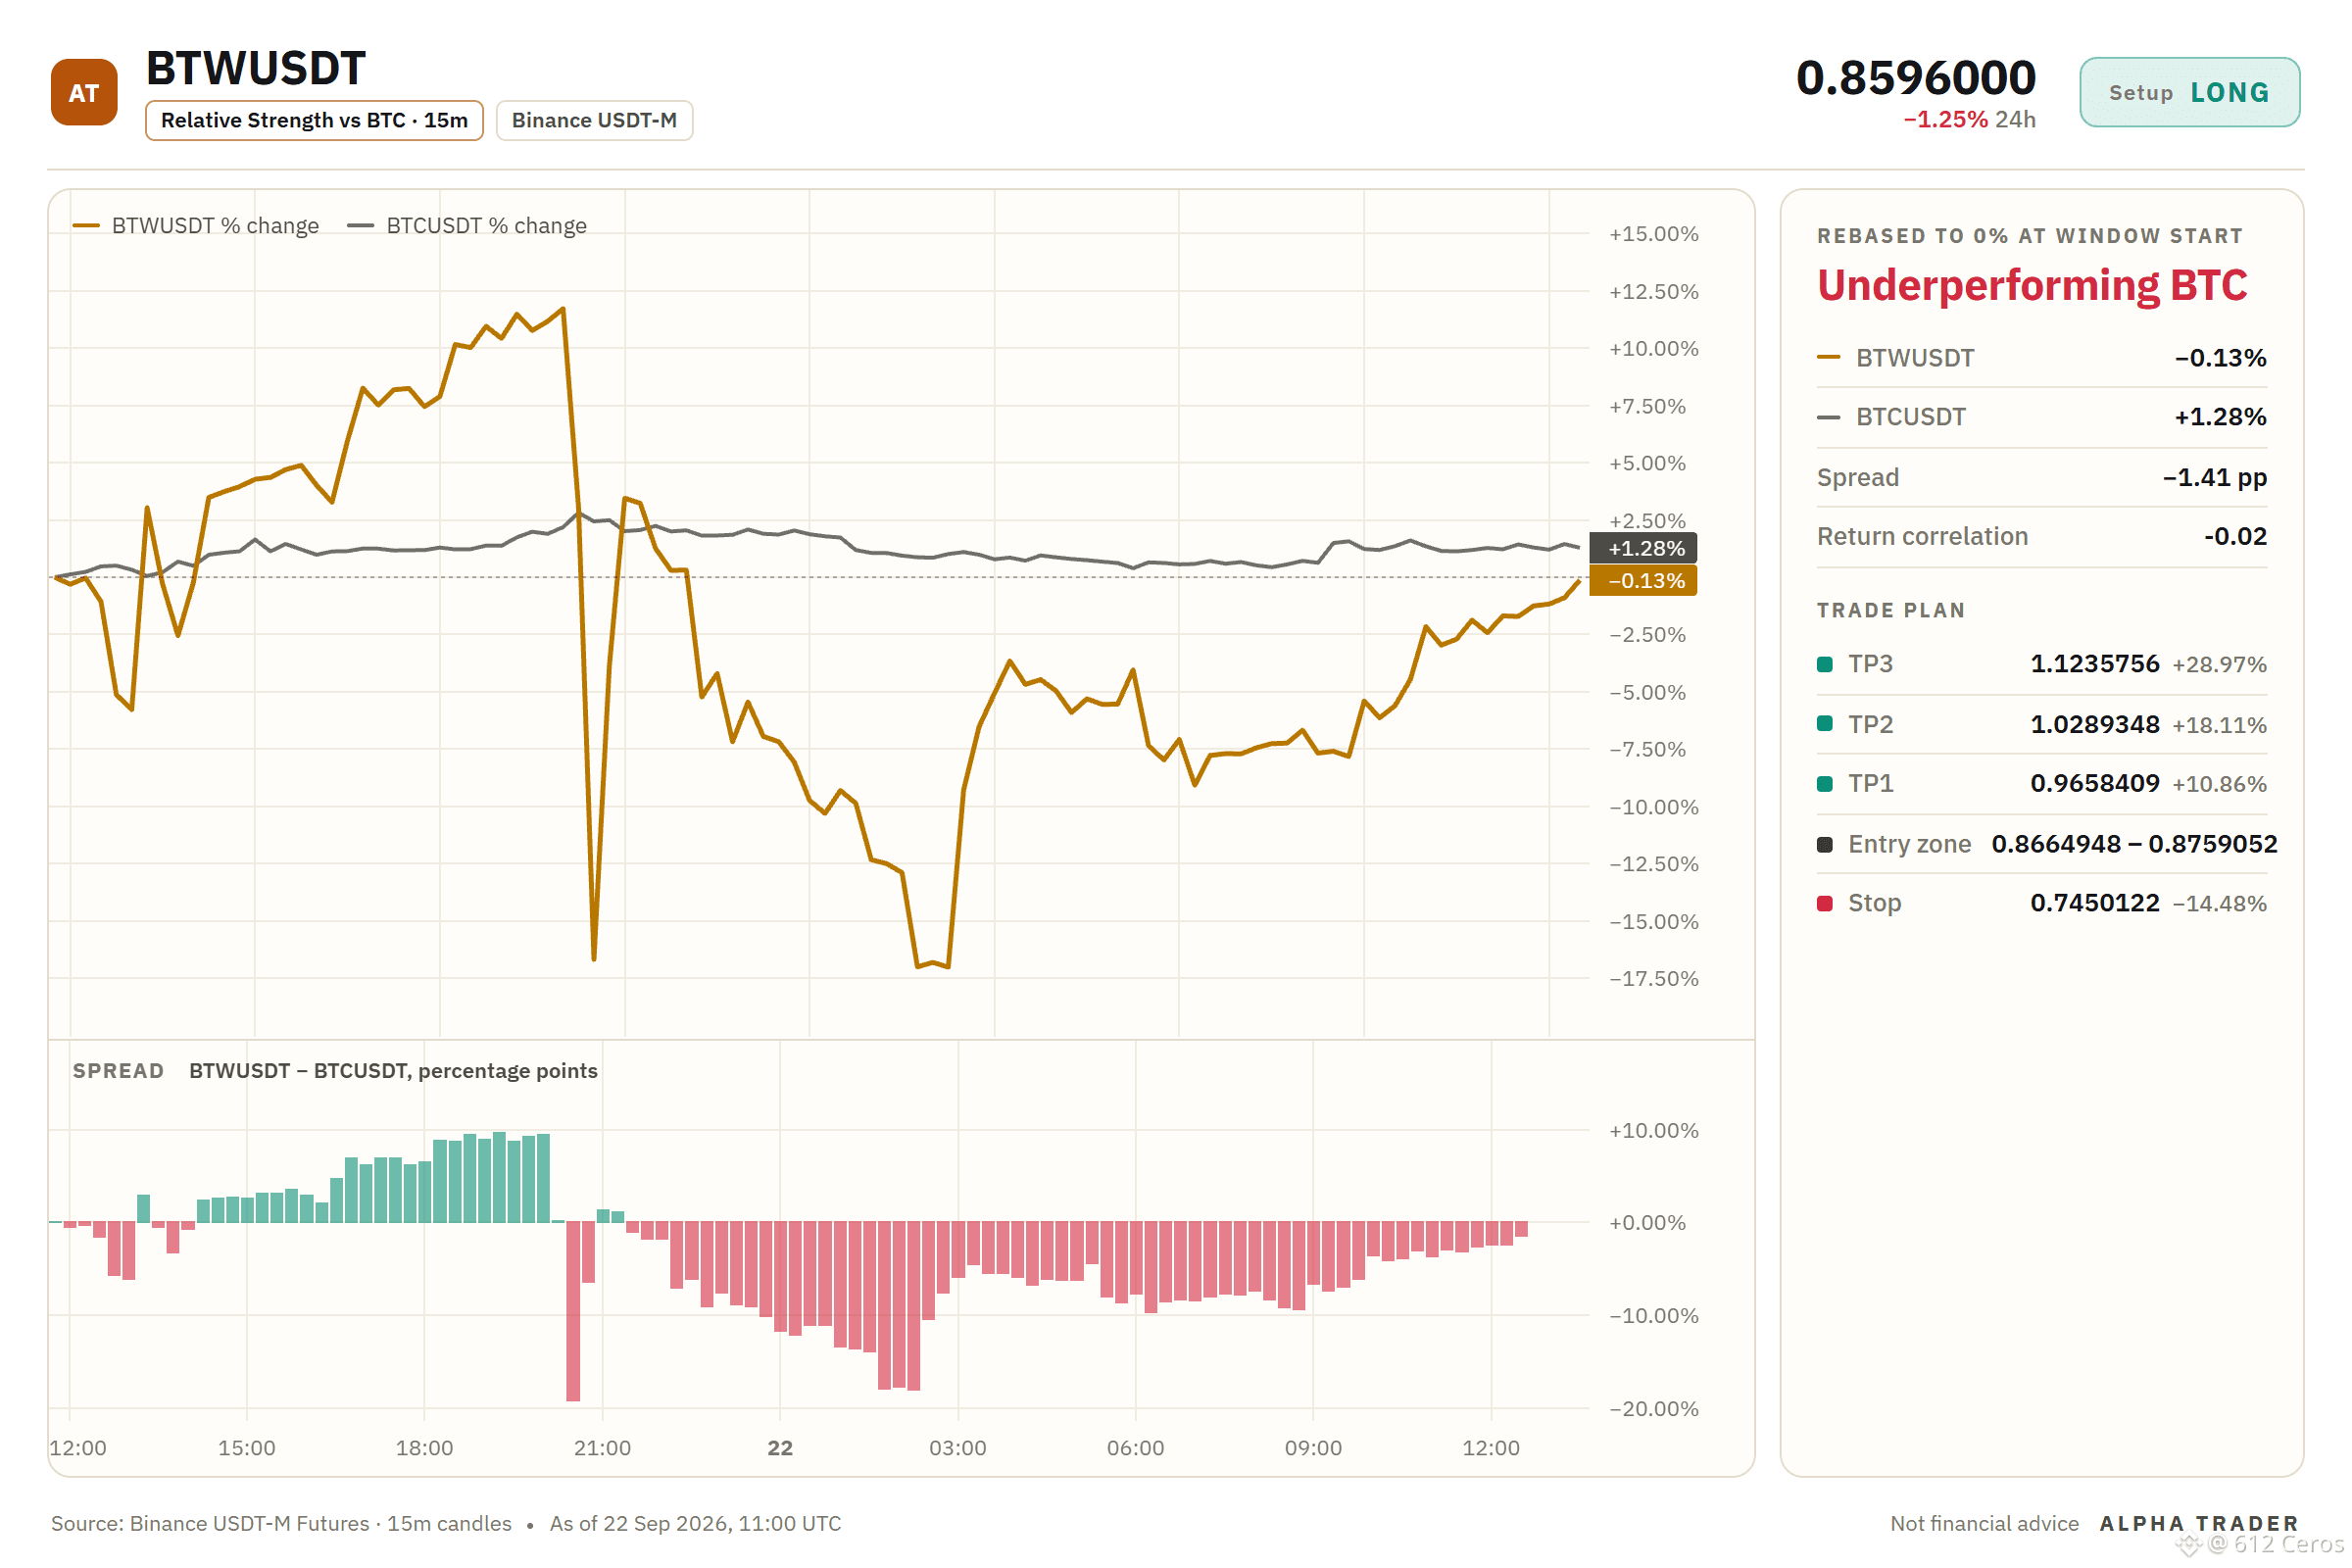
Full setup on the chart 👇
{future}(BTWUSDT)
⚠️ Personal market analysis only. NFA — manage risk and DYOR.
Educational content, not investment advice or a recommendation to buy, sell, deposit, or withdraw any asset. No paid promotion or referral/affiliate links.
Range breaks upward when nobody expects it
🟢 $BTW /USDT | Bias: LONG (Strong) | 6/11 signals aligned
Technical verdict: STRONG LONG. 6 of 11 signals aligned, 1 against.
✅ 4h trend: price > EMA50 > EMA200, bullish stack
✅ 1h trend: price > EMA50 > EMA200, bullish stack
✅ 4h RSI: 60.6, bullish momentum (above 55)
✅ 1h RSI: 55.9, bullish momentum (above 55)
⚠️ RSI extreme in a range: RSI z-score +2.59 in a range, fade-the-high risk
Q: Why long when the daily trend is range and RSI is overextended?
A: 4h and 1h price sit above both EMAs with bullish stacks and 4h RSI at 60.6.
Q: Where exactly do I enter?
A: The 1h price is 0.8712000, with a valid zone between 0.8664948 and 0.8759052.
Q: When is this trade invalid?
A: A close below 0.6615895 invalidates the setup, as the 1h price is only 0.8712000 above the SL.
Entry: 0.8664948 – 0.8759052 | SL: 0.7450122
TP1: 0.9658409 | TP2: 1.0289348 | TP3: 1.1235756
💬 What is your entry level if you are leaning short into this range?
Full setup on the chart 👇
⚠️ Personal market analysis only. NFA — manage risk and DYOR.
Educational content, not investment advice or a recommendation to buy, sell, deposit, or withdraw any asset. No paid promotion or referral/affiliate links.
🟢 $BTW /USDT | Bias: LONG (Strong) | 6/11 signals aligned
Technical verdict: STRONG LONG. 6 of 11 signals aligned, 1 against.
✅ 4h trend: price > EMA50 > EMA200, bullish stack
✅ 1h trend: price > EMA50 > EMA200, bullish stack
✅ 4h RSI: 60.6, bullish momentum (above 55)
✅ 1h RSI: 55.9, bullish momentum (above 55)
⚠️ RSI extreme in a range: RSI z-score +2.59 in a range, fade-the-high risk
Q: Why long when the daily trend is range and RSI is overextended?
A: 4h and 1h price sit above both EMAs with bullish stacks and 4h RSI at 60.6.
Q: Where exactly do I enter?
A: The 1h price is 0.8712000, with a valid zone between 0.8664948 and 0.8759052.
Q: When is this trade invalid?
A: A close below 0.6615895 invalidates the setup, as the 1h price is only 0.8712000 above the SL.
Entry: 0.8664948 – 0.8759052 | SL: 0.7450122
TP1: 0.9658409 | TP2: 1.0289348 | TP3: 1.1235756
💬 What is your entry level if you are leaning short into this range?
Full setup on the chart 👇
⚠️ Personal market analysis only. NFA — manage risk and DYOR.
Educational content, not investment advice or a recommendation to buy, sell, deposit, or withdraw any asset. No paid promotion or referral/affiliate links.
1
3
2.6k
·
--
Bullish
MARSCOIN long setup: the levels I'm watching
🟢 $MARSCOIN /USDT | Bias: LONG (Strong) | 6/10 signals aligned
Technical verdict: STRONG LONG. 6 of 10 signals aligned, 1 against.
What supports it (6):
• Trend strength (ADX/DI, 15m): ADX 47.5 with buyers in control (DI+ 43.2 vs DI− 6.3)
• 4h RSI: 58.1, bullish momentum (above 55)
• 1h RSI: 71.2, bullish momentum (above 55)
• Short-term momentum (15m): RSI z-score +1.13, last candle +4.99%, buyers pressing
• Relative strength vs BTC: outperforming, +22.64% vs BTC over the last day
• Volume: volume z-score +3.8 on a green candle, demand confirms
What argues against (1):
• Distance from 1h EMA50: +5.0 ATR from the 1h EMA50, overextended with pullback risk
📍 Entry: 0.1287187 – 0.1306813
🎯 TP1: 0.1441209 | TP2: 0.1537349 | TP3: 0.1681558
🛑 SL: 0.1104721
Why I like it:
The daily trend reads range, and 6/10 signals aligned favour the long side. The plan is to work the 0.1287187 – 0.1306813 zone, scale out at 0.1441209 and 0.1537349, and stay patient for 0.1681558. A move through 0.1104721 means the idea is wrong and the stop does its job.
💬 Does MARSCOIN tag 0.1441209 first, or the stop?
See it on the chart 👇
{future}(MARSCOINUSDT)
⚠️ Personal market analysis only. NFA — manage risk and DYOR.
Educational content, not investment advice or a recommendation to buy, sell, deposit, or withdraw any asset. No paid promotion or referral/affiliate links.
MARSCOIN long setup: the levels I'm watching
🟢 $MARSCOIN /USDT | Bias: LONG (Strong) | 6/10 signals aligned
Technical verdict: STRONG LONG. 6 of 10 signals aligned, 1 against.
What supports it (6):
• Trend strength (ADX/DI, 15m): ADX 47.5 with buyers in control (DI+ 43.2 vs DI− 6.3)
• 4h RSI: 58.1, bullish momentum (above 55)
• 1h RSI: 71.2, bullish momentum (above 55)
• Short-term momentum (15m): RSI z-score +1.13, last candle +4.99%, buyers pressing
• Relative strength vs BTC: outperforming, +22.64% vs BTC over the last day
• Volume: volume z-score +3.8 on a green candle, demand confirms
What argues against (1):
• Distance from 1h EMA50: +5.0 ATR from the 1h EMA50, overextended with pullback risk
📍 Entry: 0.1287187 – 0.1306813
🎯 TP1: 0.1441209 | TP2: 0.1537349 | TP3: 0.1681558
🛑 SL: 0.1104721
Why I like it:
The daily trend reads range, and 6/10 signals aligned favour the long side. The plan is to work the 0.1287187 – 0.1306813 zone, scale out at 0.1441209 and 0.1537349, and stay patient for 0.1681558. A move through 0.1104721 means the idea is wrong and the stop does its job.
💬 Does MARSCOIN tag 0.1441209 first, or the stop?
See it on the chart 👇
⚠️ Personal market analysis only. NFA — manage risk and DYOR.
Educational content, not investment advice or a recommendation to buy, sell, deposit, or withdraw any asset. No paid promotion or referral/affiliate links.
🟢 $MARSCOIN /USDT | Bias: LONG (Strong) | 6/10 signals aligned
Technical verdict: STRONG LONG. 6 of 10 signals aligned, 1 against.
What supports it (6):
• Trend strength (ADX/DI, 15m): ADX 47.5 with buyers in control (DI+ 43.2 vs DI− 6.3)
• 4h RSI: 58.1, bullish momentum (above 55)
• 1h RSI: 71.2, bullish momentum (above 55)
• Short-term momentum (15m): RSI z-score +1.13, last candle +4.99%, buyers pressing
• Relative strength vs BTC: outperforming, +22.64% vs BTC over the last day
• Volume: volume z-score +3.8 on a green candle, demand confirms
What argues against (1):
• Distance from 1h EMA50: +5.0 ATR from the 1h EMA50, overextended with pullback risk
📍 Entry: 0.1287187 – 0.1306813
🎯 TP1: 0.1441209 | TP2: 0.1537349 | TP3: 0.1681558
🛑 SL: 0.1104721
Why I like it:
The daily trend reads range, and 6/10 signals aligned favour the long side. The plan is to work the 0.1287187 – 0.1306813 zone, scale out at 0.1441209 and 0.1537349, and stay patient for 0.1681558. A move through 0.1104721 means the idea is wrong and the stop does its job.
💬 Does MARSCOIN tag 0.1441209 first, or the stop?
See it on the chart 👇
⚠️ Personal market analysis only. NFA — manage risk and DYOR.
Educational content, not investment advice or a recommendation to buy, sell, deposit, or withdraw any asset. No paid promotion or referral/affiliate links.
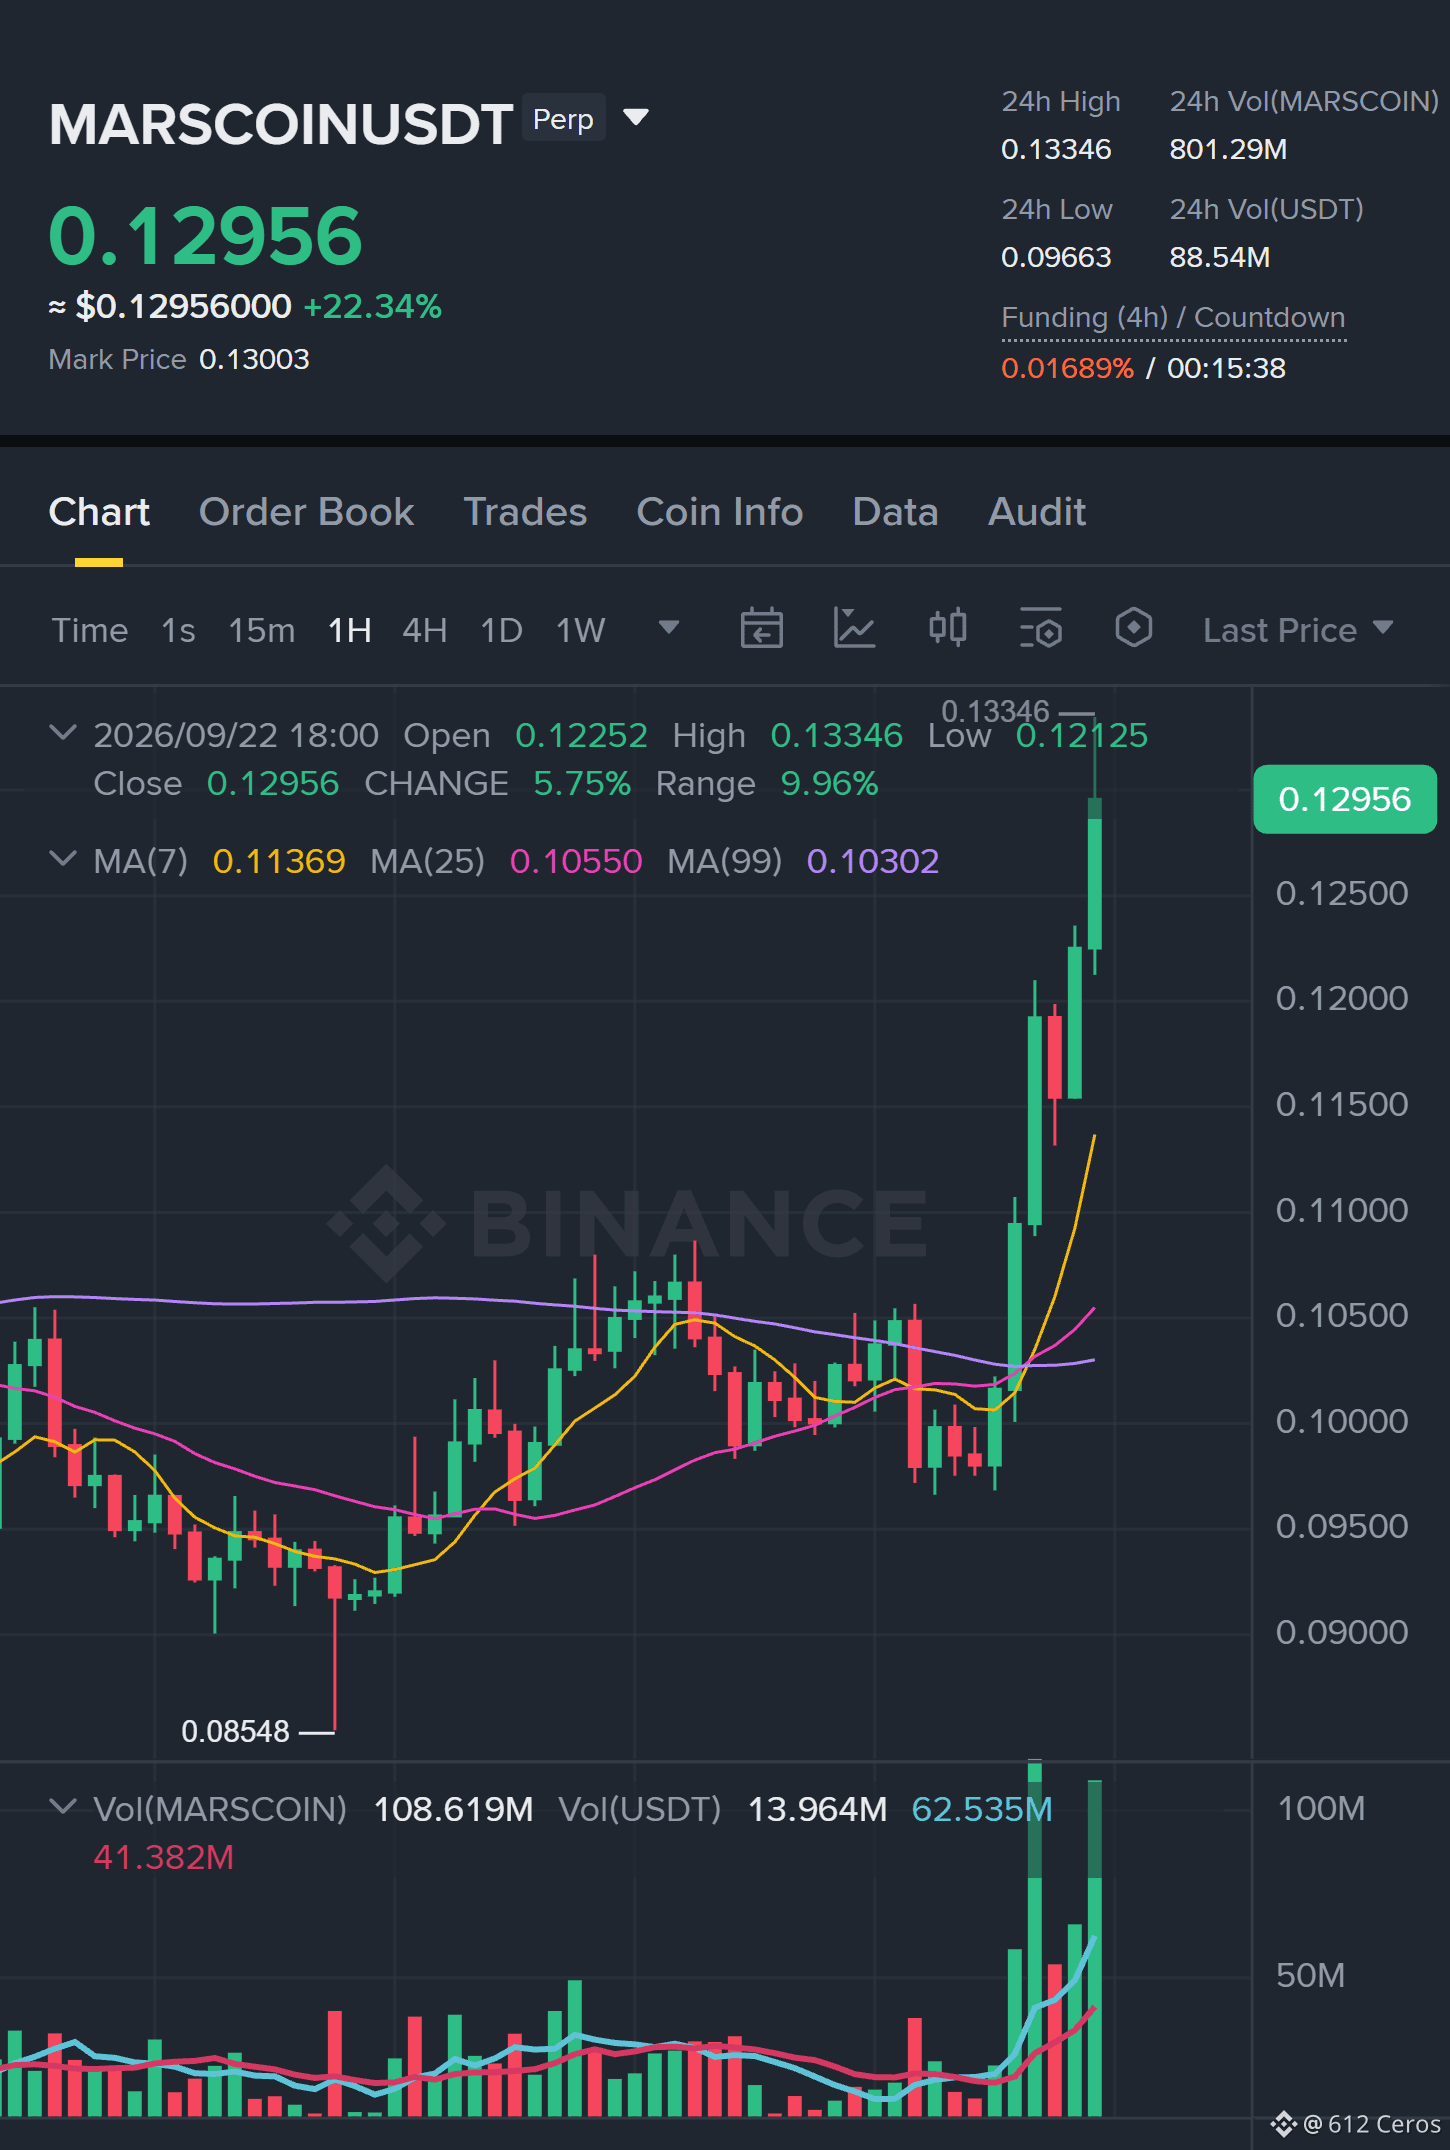
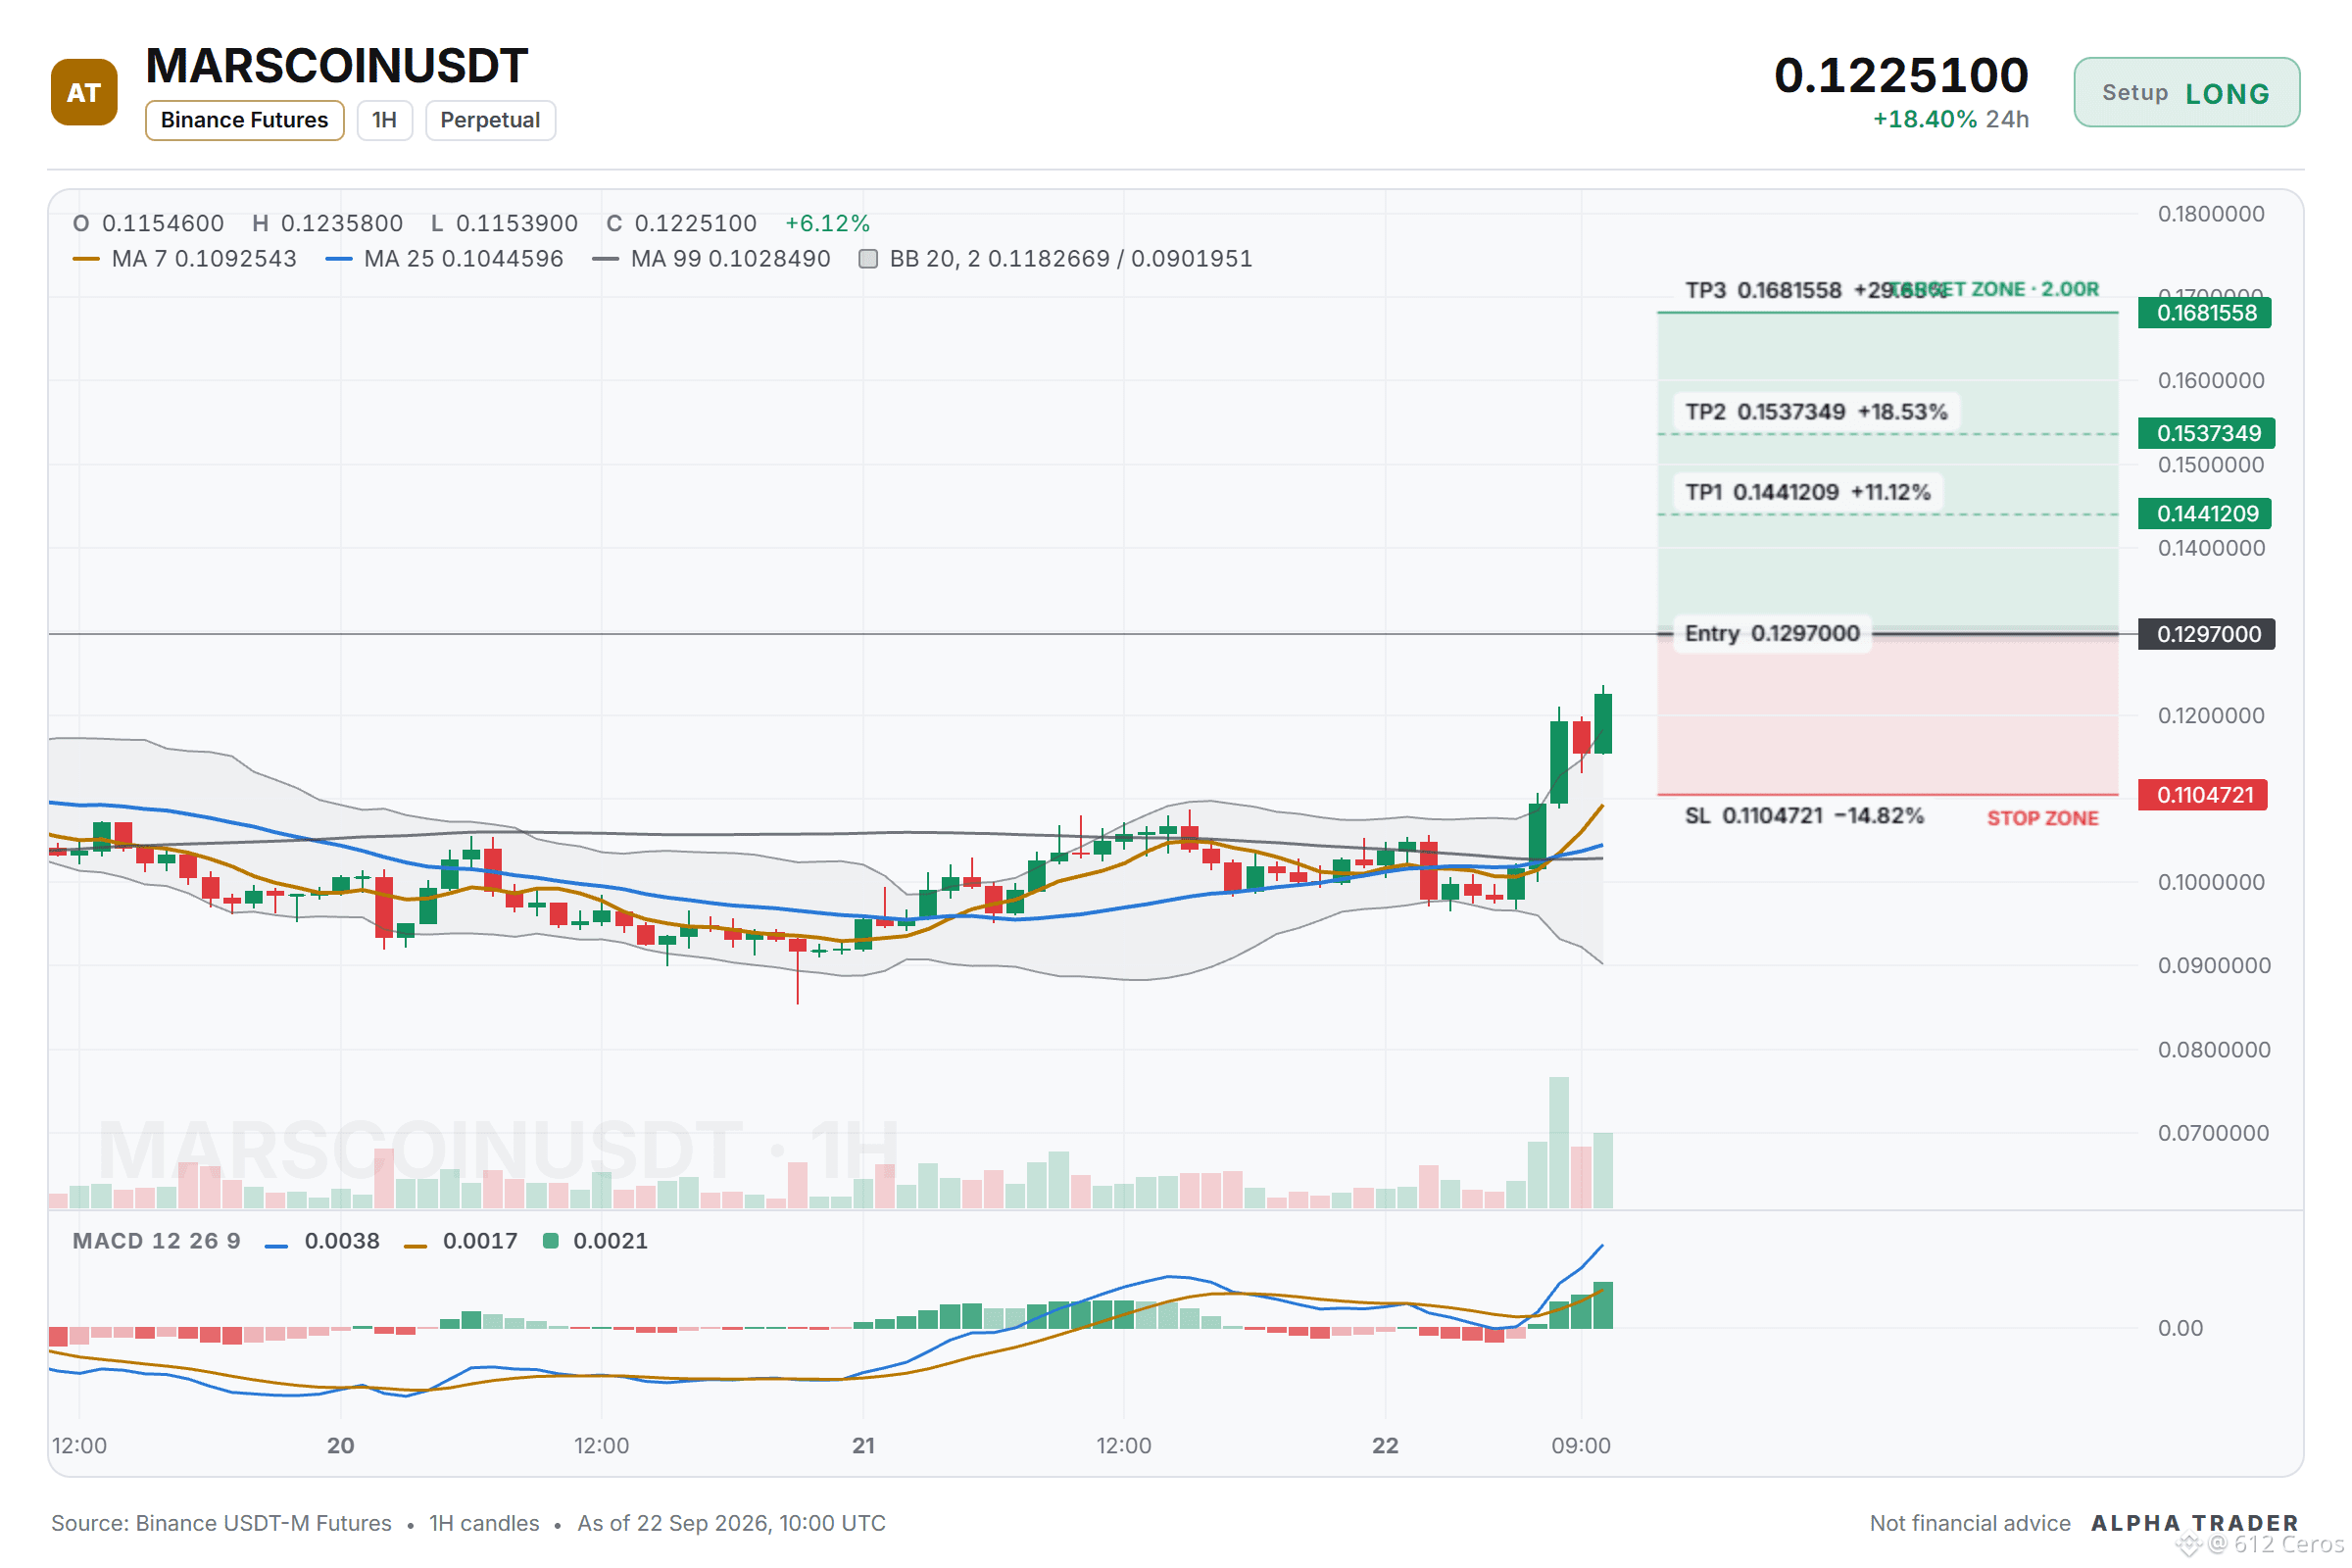
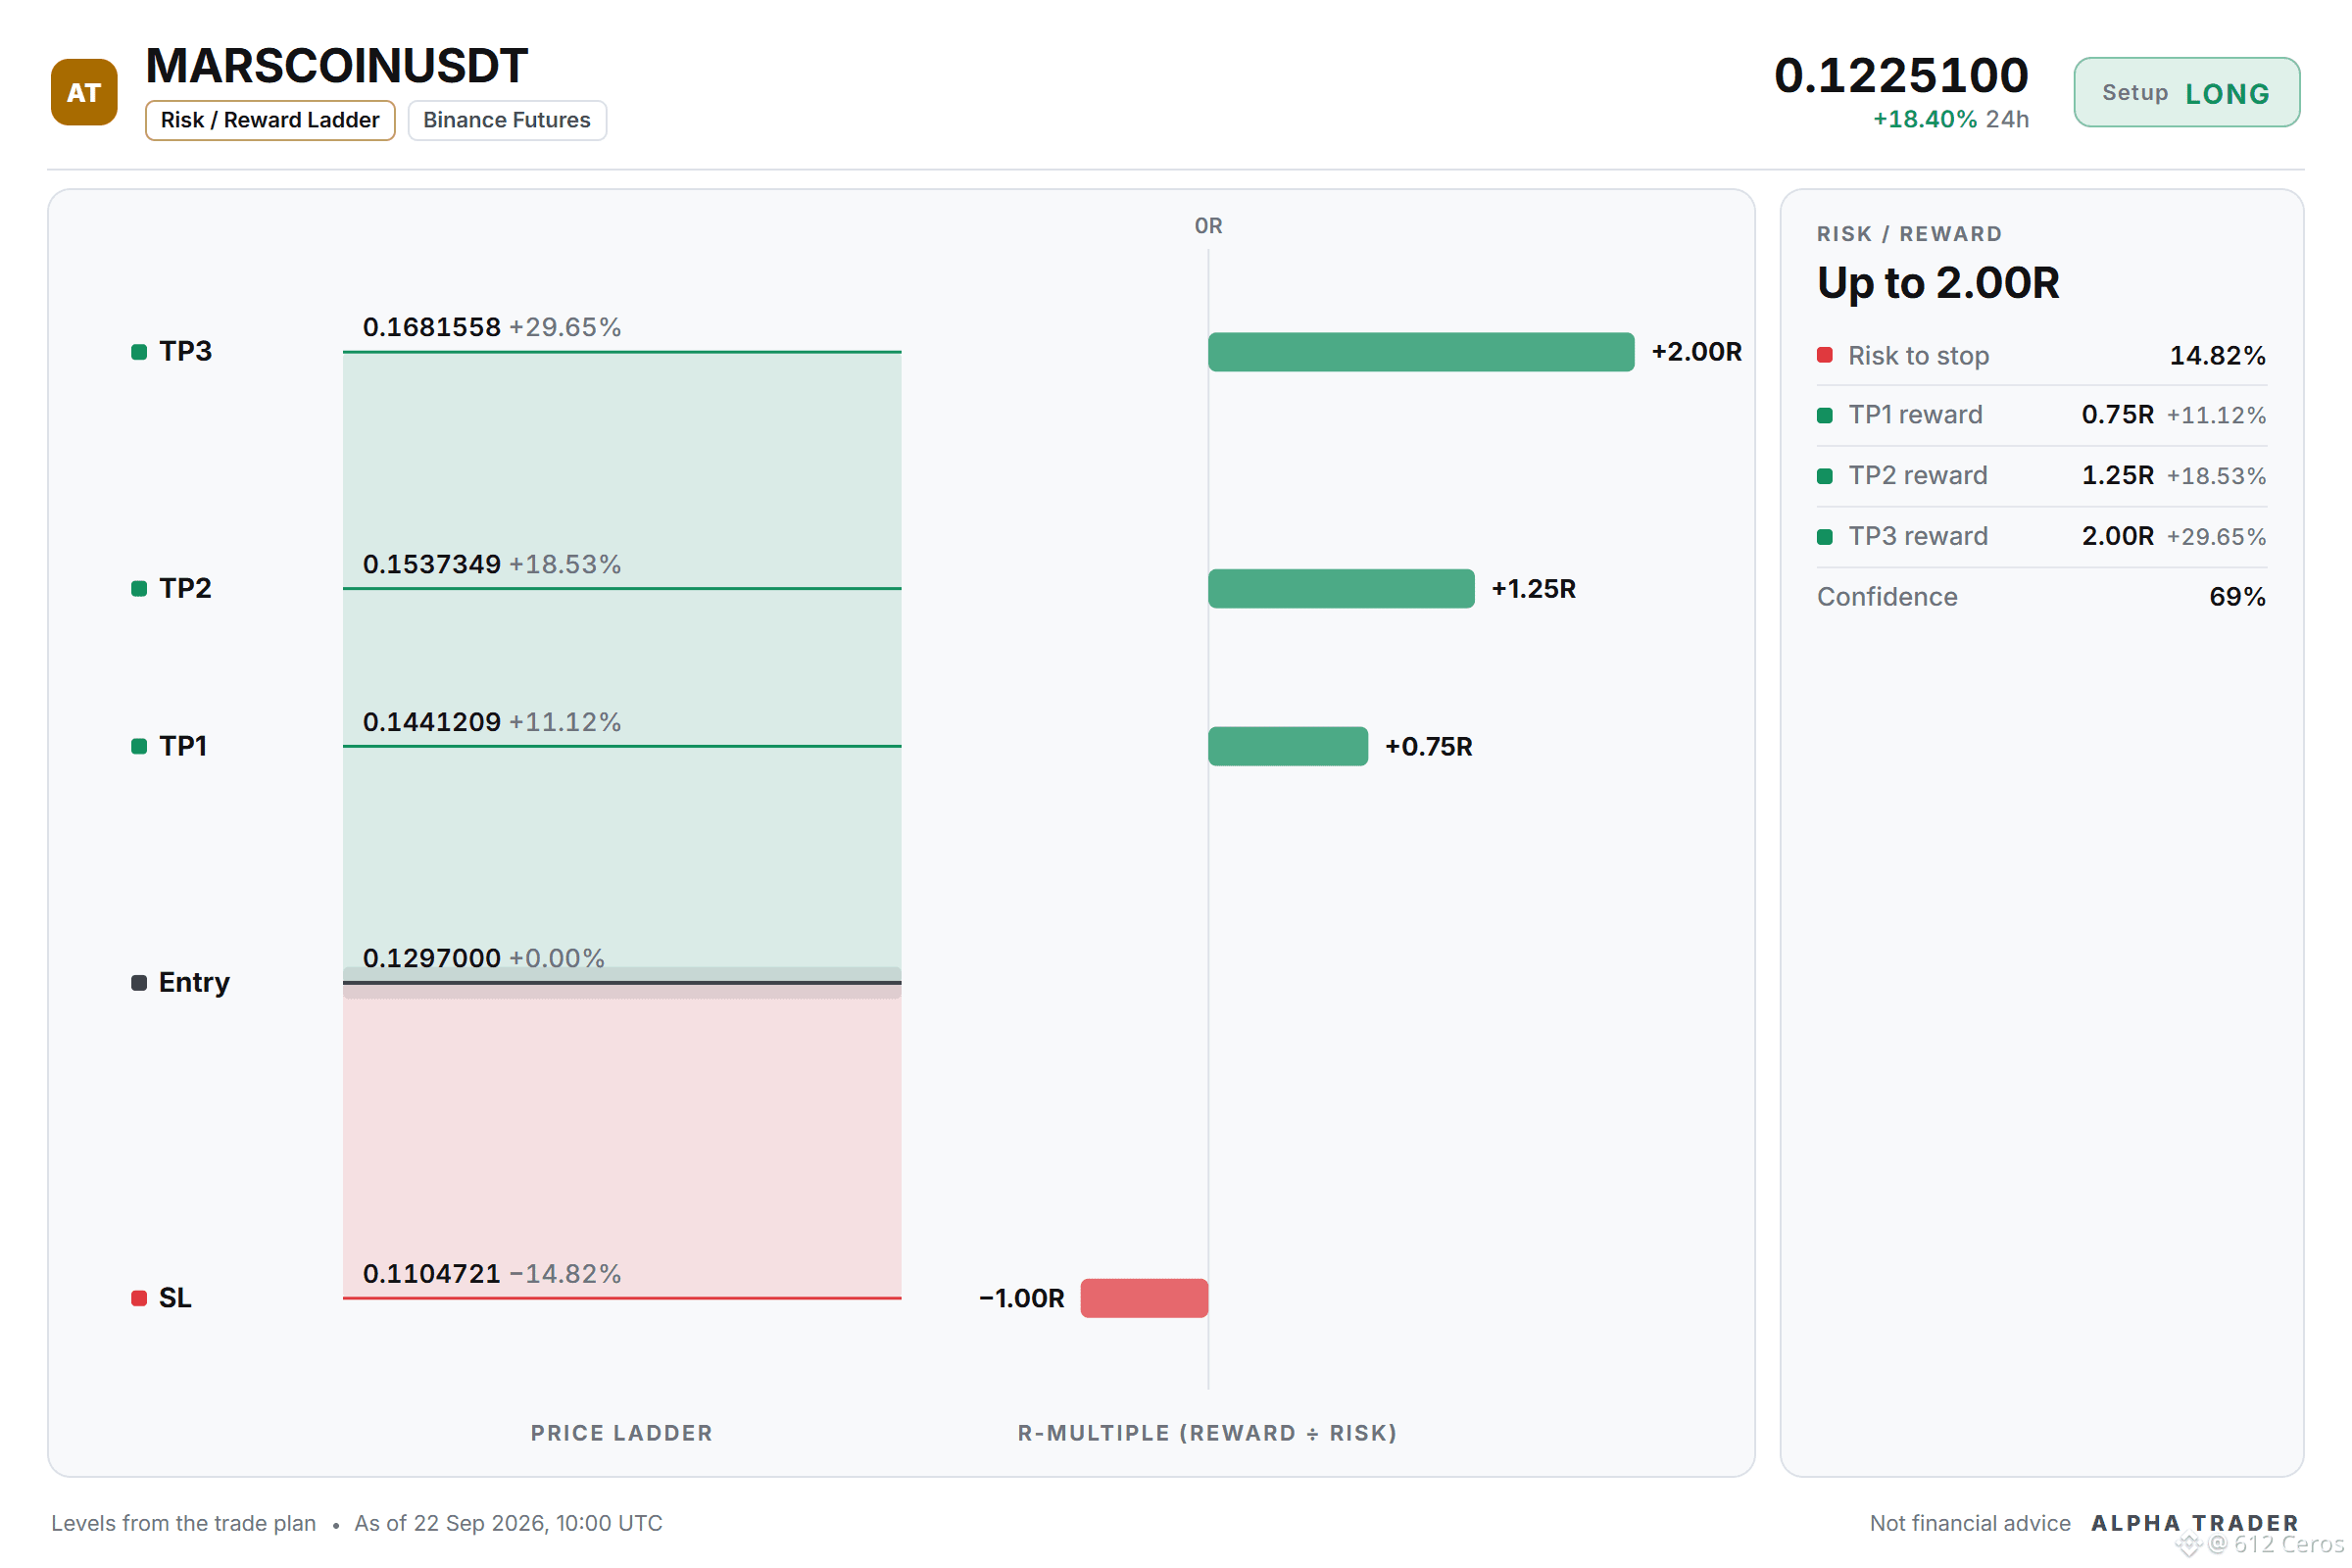
1
1.9k
·
--
Bullish
ZEC long setup: the levels I'm watching
📊 $ZEC /USDT · Bias: LONG (Strong) · 6/12 signals aligned
Technical verdict: STRONG LONG. 6 of 12 signals aligned, 1 against.
What supports it (6):
• Daily trend: price > EMA50 > EMA200, bullish stack
• 4h trend: price > EMA50 > EMA200, bullish stack
• 1h trend: price > EMA50 > EMA200, bullish stack
• Trend strength (ADX/DI, 15m): ADX 34.8 with buyers in control (DI+ 27.0 vs DI− 13.6)
• 4h RSI: 57.1, bullish momentum (above 55)
• 1h RSI: 55.2, bullish momentum (above 55)
What argues against (1):
• Relative strength vs BTC: underperforming, −3.94% vs BTC over the last day
Price map:
🎯 TP3: 1635.21
🎯 TP2: 1587.40
🎯 TP1: 1555.52
📍 Entry: 1504.32 – 1511.10
🛑 SL: 1443.96
Why I like it:
The daily trend reads bullish, and 6/12 signals aligned favour the long side. The plan is to work the 1504.32 – 1511.10 zone, scale out at 1555.52 and 1587.40, and stay patient for 1635.21. A move through 1443.96 means the idea is wrong and the stop does its job.
Your call:
Does ZEC tag 1555.52 first, or the stop?
Chart with every level 👇
{future}(ZECUSDT)
⚠️ Personal market analysis only. NFA — manage risk and DYOR.
Educational content, not investment advice or a recommendation to buy, sell, deposit, or withdraw any asset. No paid promotion or referral/affiliate links.
ZEC long setup: the levels I'm watching
📊 $ZEC /USDT · Bias: LONG (Strong) · 6/12 signals aligned
Technical verdict: STRONG LONG. 6 of 12 signals aligned, 1 against.
What supports it (6):
• Daily trend: price > EMA50 > EMA200, bullish stack
• 4h trend: price > EMA50 > EMA200, bullish stack
• 1h trend: price > EMA50 > EMA200, bullish stack
• Trend strength (ADX/DI, 15m): ADX 34.8 with buyers in control (DI+ 27.0 vs DI− 13.6)
• 4h RSI: 57.1, bullish momentum (above 55)
• 1h RSI: 55.2, bullish momentum (above 55)
What argues against (1):
• Relative strength vs BTC: underperforming, −3.94% vs BTC over the last day
Price map:
🎯 TP3: 1635.21
🎯 TP2: 1587.40
🎯 TP1: 1555.52
📍 Entry: 1504.32 – 1511.10
🛑 SL: 1443.96
Why I like it:
The daily trend reads bullish, and 6/12 signals aligned favour the long side. The plan is to work the 1504.32 – 1511.10 zone, scale out at 1555.52 and 1587.40, and stay patient for 1635.21. A move through 1443.96 means the idea is wrong and the stop does its job.
Your call:
Does ZEC tag 1555.52 first, or the stop?
Chart with every level 👇
⚠️ Personal market analysis only. NFA — manage risk and DYOR.
Educational content, not investment advice or a recommendation to buy, sell, deposit, or withdraw any asset. No paid promotion or referral/affiliate links.
📊 $ZEC /USDT · Bias: LONG (Strong) · 6/12 signals aligned
Technical verdict: STRONG LONG. 6 of 12 signals aligned, 1 against.
What supports it (6):
• Daily trend: price > EMA50 > EMA200, bullish stack
• 4h trend: price > EMA50 > EMA200, bullish stack
• 1h trend: price > EMA50 > EMA200, bullish stack
• Trend strength (ADX/DI, 15m): ADX 34.8 with buyers in control (DI+ 27.0 vs DI− 13.6)
• 4h RSI: 57.1, bullish momentum (above 55)
• 1h RSI: 55.2, bullish momentum (above 55)
What argues against (1):
• Relative strength vs BTC: underperforming, −3.94% vs BTC over the last day
Price map:
🎯 TP3: 1635.21
🎯 TP2: 1587.40
🎯 TP1: 1555.52
📍 Entry: 1504.32 – 1511.10
🛑 SL: 1443.96
Why I like it:
The daily trend reads bullish, and 6/12 signals aligned favour the long side. The plan is to work the 1504.32 – 1511.10 zone, scale out at 1555.52 and 1587.40, and stay patient for 1635.21. A move through 1443.96 means the idea is wrong and the stop does its job.
Your call:
Does ZEC tag 1555.52 first, or the stop?
Chart with every level 👇
⚠️ Personal market analysis only. NFA — manage risk and DYOR.
Educational content, not investment advice or a recommendation to buy, sell, deposit, or withdraw any asset. No paid promotion or referral/affiliate links.
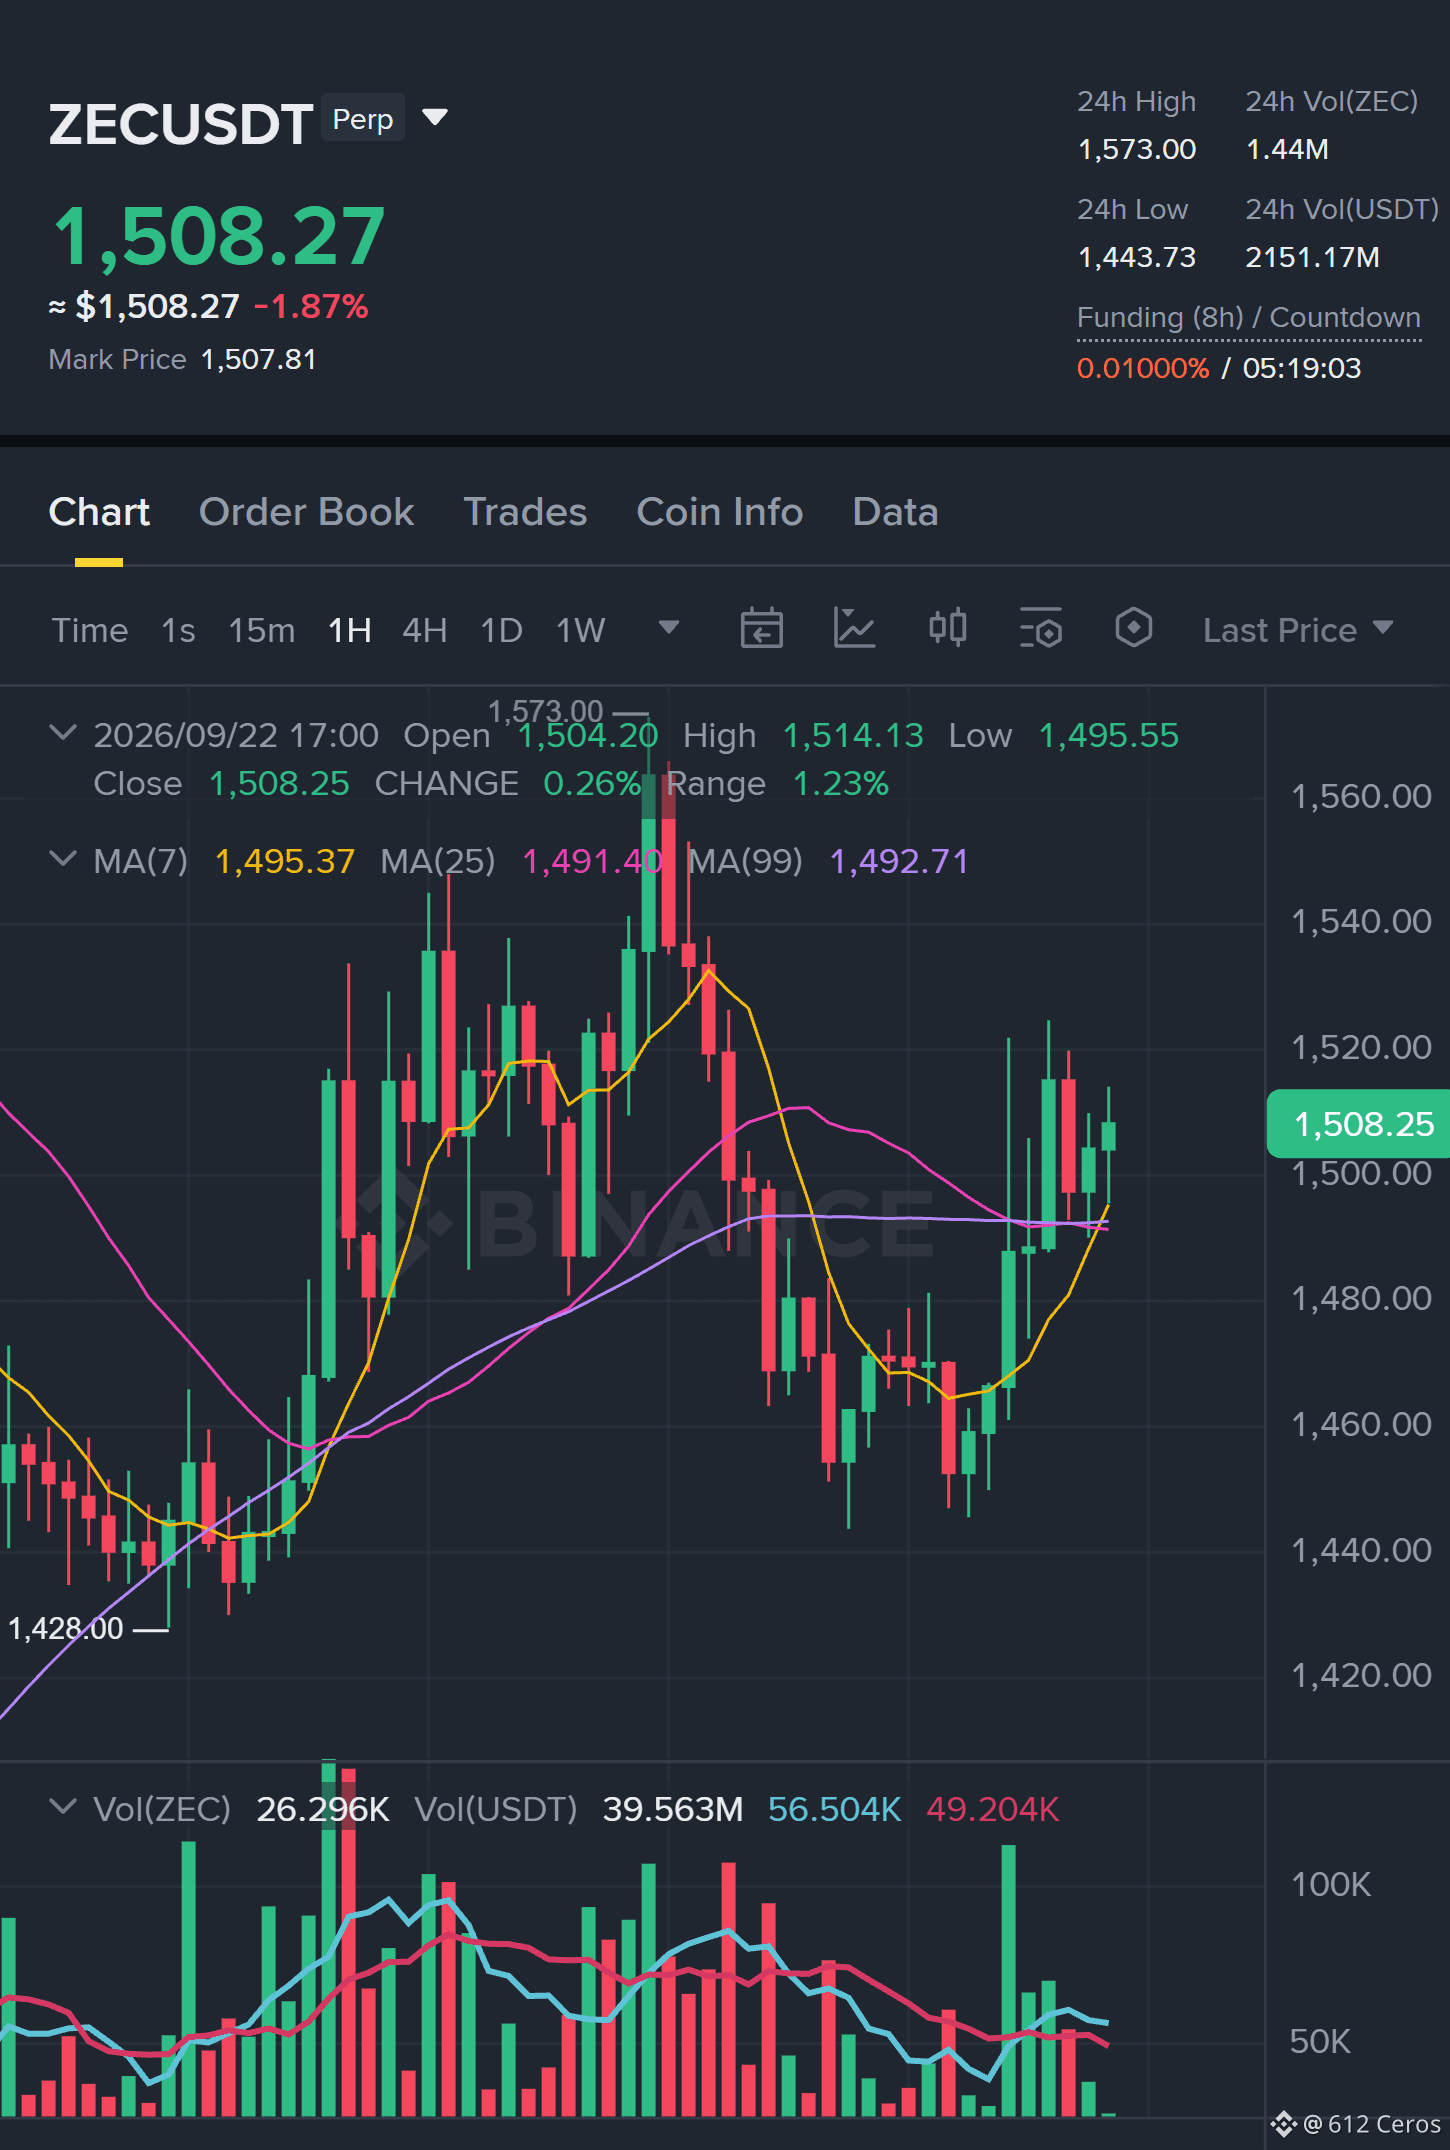
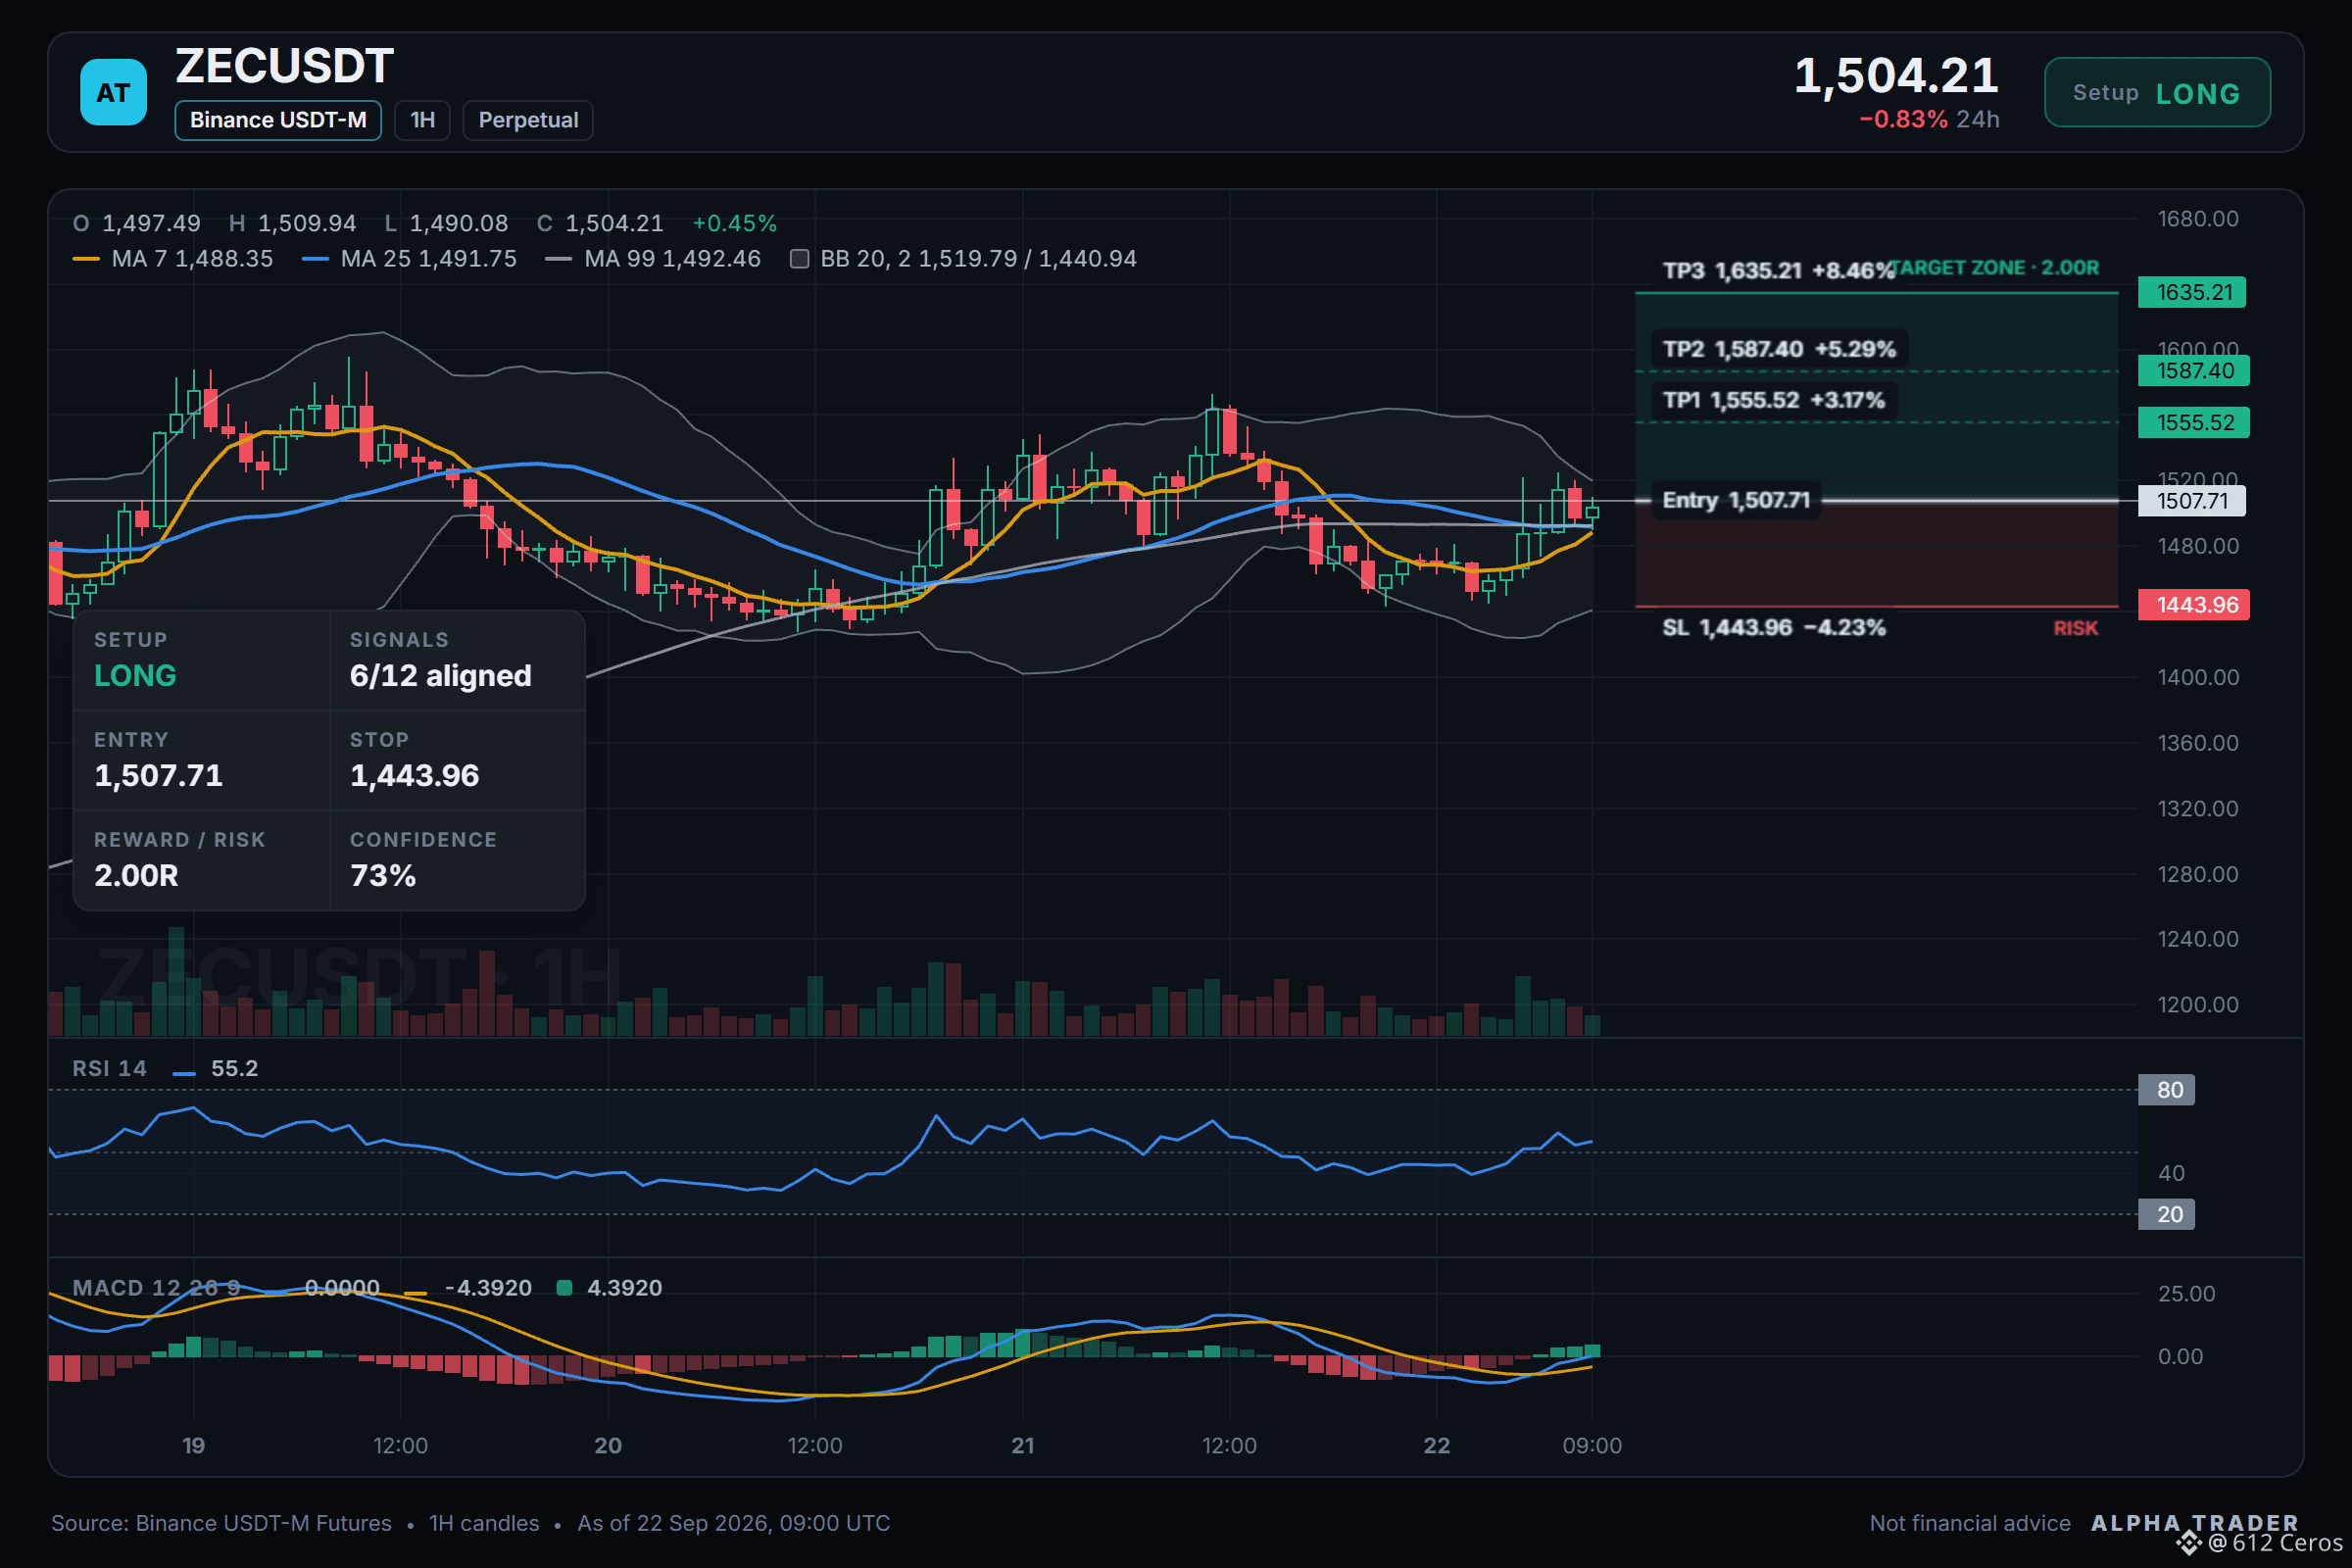
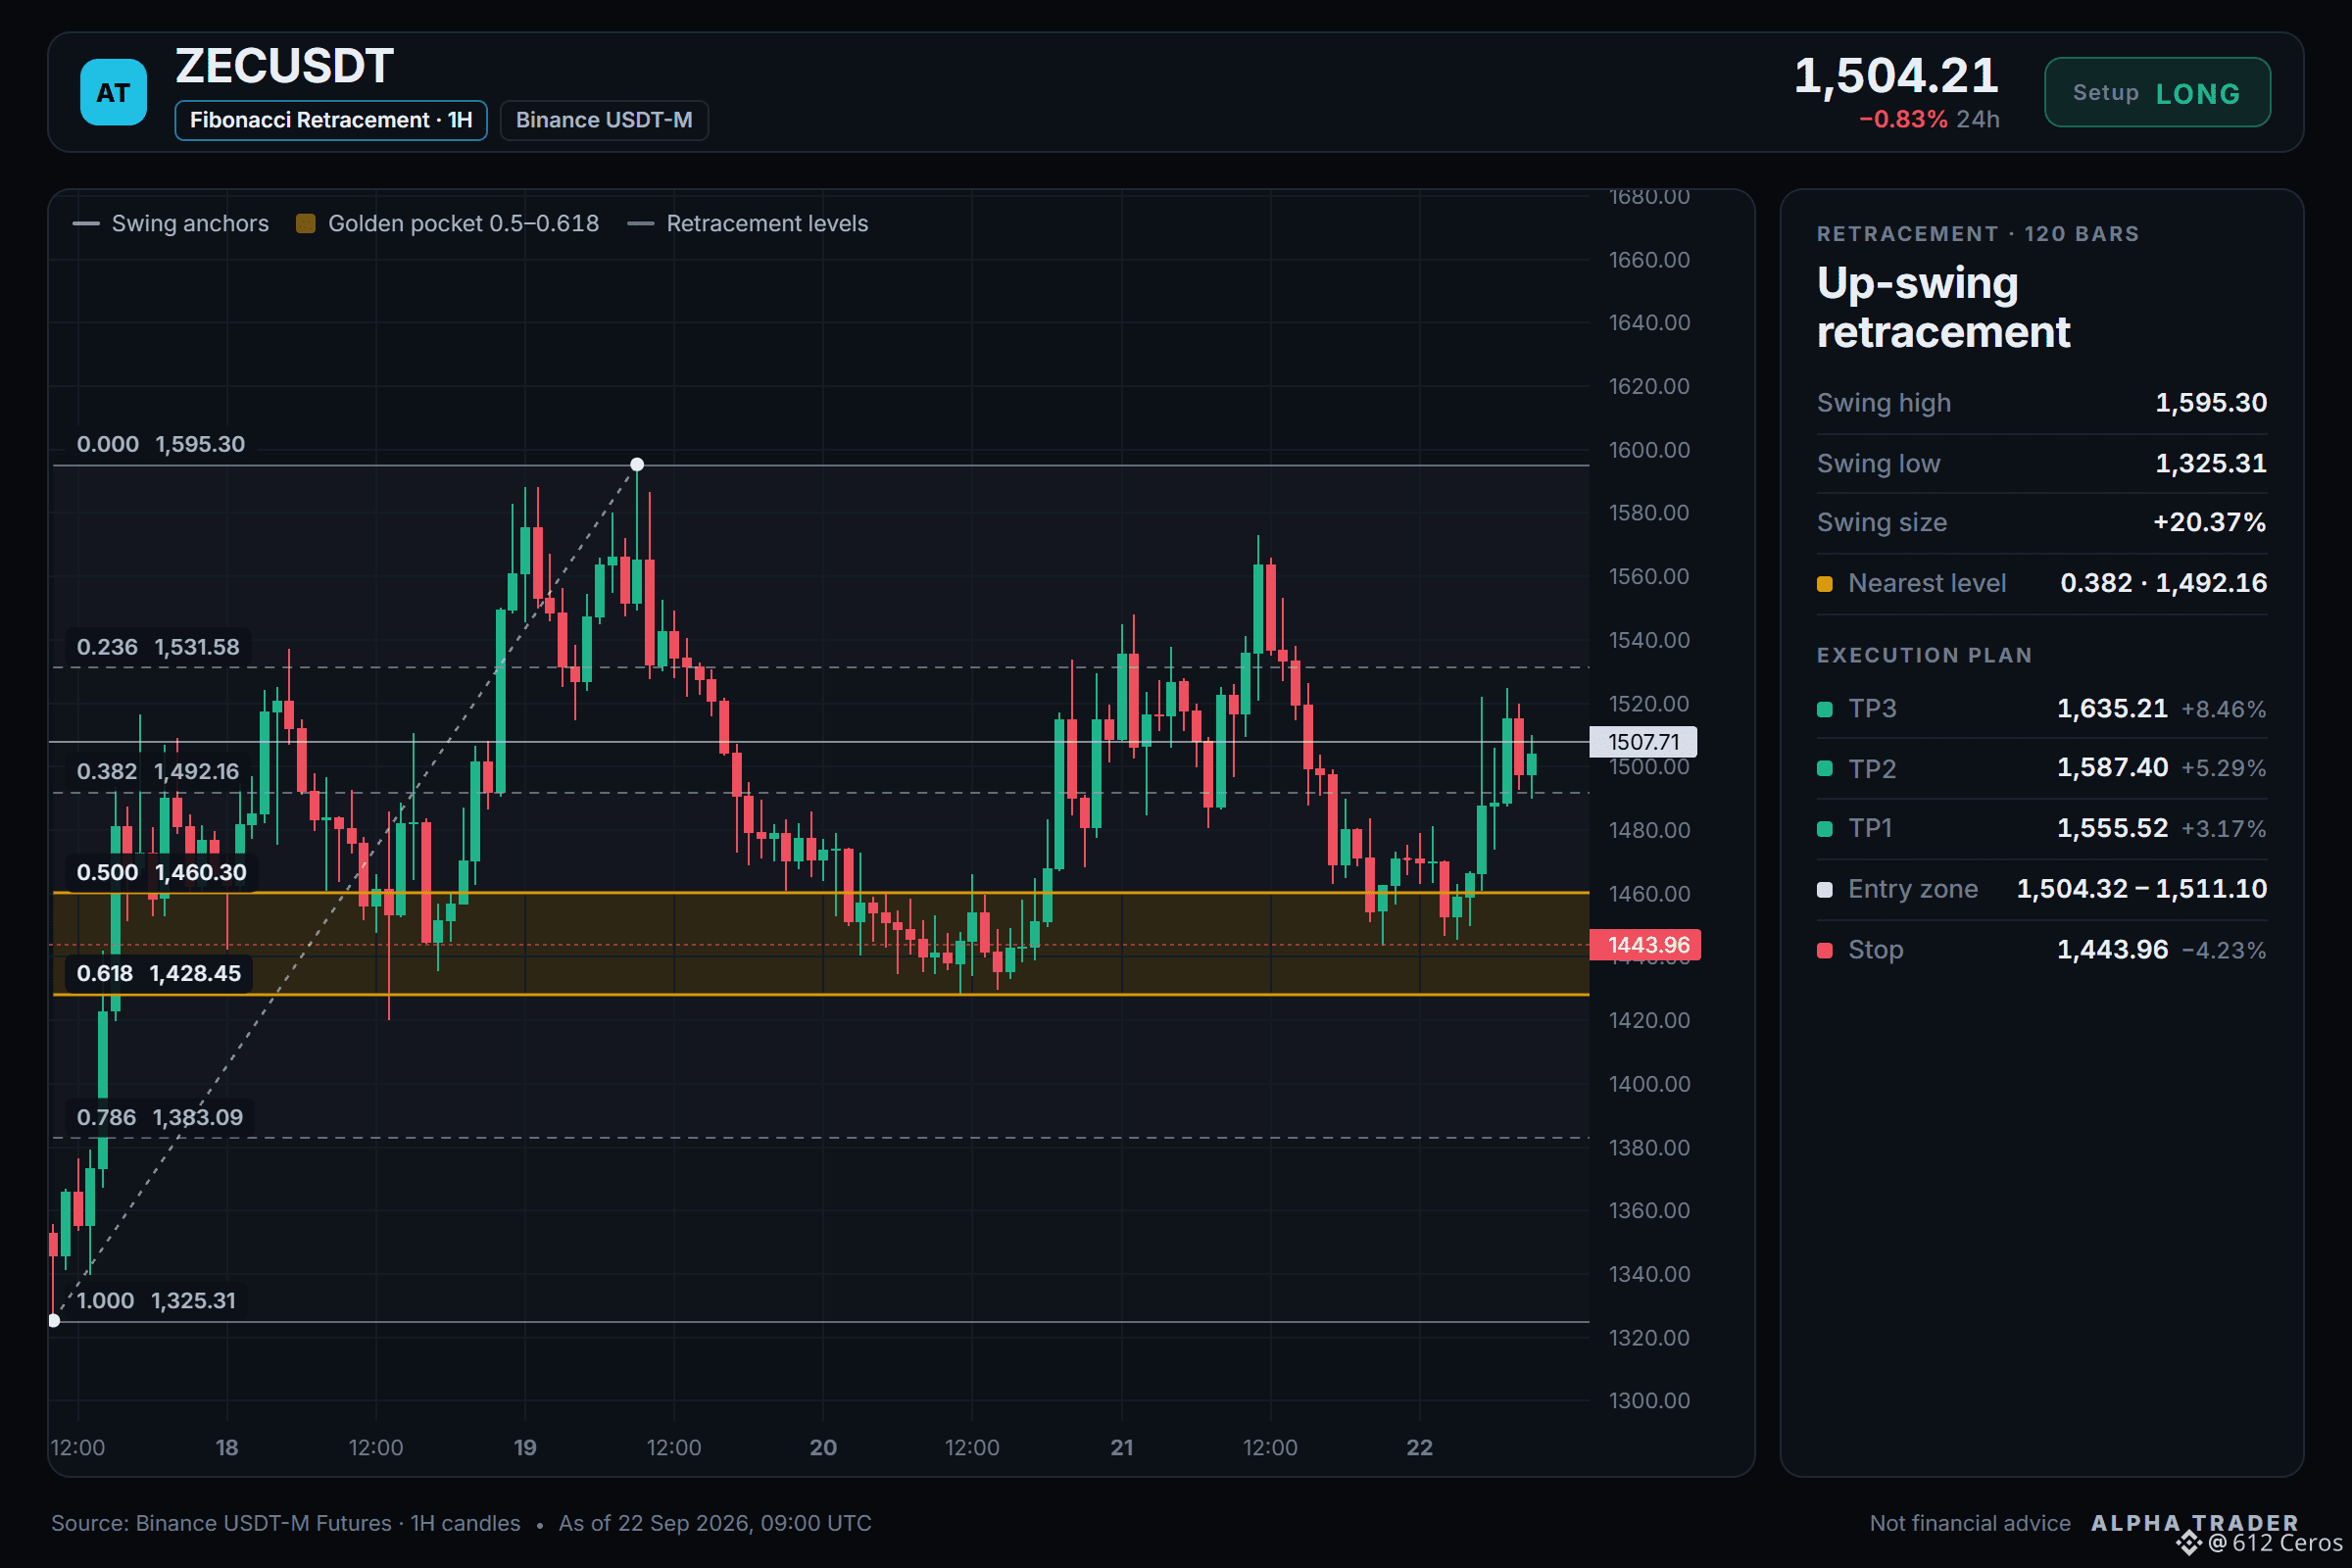
4
2.6k
·
--
Bullish
ONG daily trend intact with 6/12 signals aligned
📊 $ONG /USDT · Bias: LONG (Strong) · 6/12 signals aligned
Pre-trade checklist: 6/12 signals aligned
✅ Daily trend: price > EMA50 > EMA200, bullish stack
✅ 4h trend: price > EMA50 > EMA200, bullish stack
✅ 1h trend: price > EMA50 > EMA200, bullish stack
✅ 4h RSI: 69.8, bullish momentum (above 55)
✅ 1h RSI: 62.1, bullish momentum (above 55)
⚠️ Invalidation: the idea is wrong beyond 0.0817295
Bottom line: Verdict: LONG (Strong, 6/12 signals aligned). The strongest supporting factors are the daily bullish stack (price above EMA50 and EMA200) and the 4h bullish stack, while the main against factor is the 15m trend strength showing no directional trend (ADX 12.3).
Setup levels:
Entry: 0.0913946 – 0.0917454
SL: 0.0879696
TP1: 0.0942703
TP2: 0.0960705
TP3: 0.0987707
Debate:
Where would you place your stop for this ONG long, tighter or wider than 0.0879696?
See it on the chart 👇
{future}(ONGUSDT)
⚠️ Personal market analysis only. NFA — manage risk and DYOR.
Educational content, not investment advice or a recommendation to buy, sell, deposit, or withdraw any asset. No paid promotion or referral/affiliate links.
ONG daily trend intact with 6/12 signals aligned
📊 $ONG /USDT · Bias: LONG (Strong) · 6/12 signals aligned
Pre-trade checklist: 6/12 signals aligned
✅ Daily trend: price > EMA50 > EMA200, bullish stack
✅ 4h trend: price > EMA50 > EMA200, bullish stack
✅ 1h trend: price > EMA50 > EMA200, bullish stack
✅ 4h RSI: 69.8, bullish momentum (above 55)
✅ 1h RSI: 62.1, bullish momentum (above 55)
⚠️ Invalidation: the idea is wrong beyond 0.0817295
Bottom line: Verdict: LONG (Strong, 6/12 signals aligned). The strongest supporting factors are the daily bullish stack (price above EMA50 and EMA200) and the 4h bullish stack, while the main against factor is the 15m trend strength showing no directional trend (ADX 12.3).
Setup levels:
Entry: 0.0913946 – 0.0917454
SL: 0.0879696
TP1: 0.0942703
TP2: 0.0960705
TP3: 0.0987707
Debate:
Where would you place your stop for this ONG long, tighter or wider than 0.0879696?
See it on the chart 👇
⚠️ Personal market analysis only. NFA — manage risk and DYOR.
Educational content, not investment advice or a recommendation to buy, sell, deposit, or withdraw any asset. No paid promotion or referral/affiliate links.
📊 $ONG /USDT · Bias: LONG (Strong) · 6/12 signals aligned
Pre-trade checklist: 6/12 signals aligned
✅ Daily trend: price > EMA50 > EMA200, bullish stack
✅ 4h trend: price > EMA50 > EMA200, bullish stack
✅ 1h trend: price > EMA50 > EMA200, bullish stack
✅ 4h RSI: 69.8, bullish momentum (above 55)
✅ 1h RSI: 62.1, bullish momentum (above 55)
⚠️ Invalidation: the idea is wrong beyond 0.0817295
Bottom line: Verdict: LONG (Strong, 6/12 signals aligned). The strongest supporting factors are the daily bullish stack (price above EMA50 and EMA200) and the 4h bullish stack, while the main against factor is the 15m trend strength showing no directional trend (ADX 12.3).
Setup levels:
Entry: 0.0913946 – 0.0917454
SL: 0.0879696
TP1: 0.0942703
TP2: 0.0960705
TP3: 0.0987707
Debate:
Where would you place your stop for this ONG long, tighter or wider than 0.0879696?
See it on the chart 👇
⚠️ Personal market analysis only. NFA — manage risk and DYOR.
Educational content, not investment advice or a recommendation to buy, sell, deposit, or withdraw any asset. No paid promotion or referral/affiliate links.
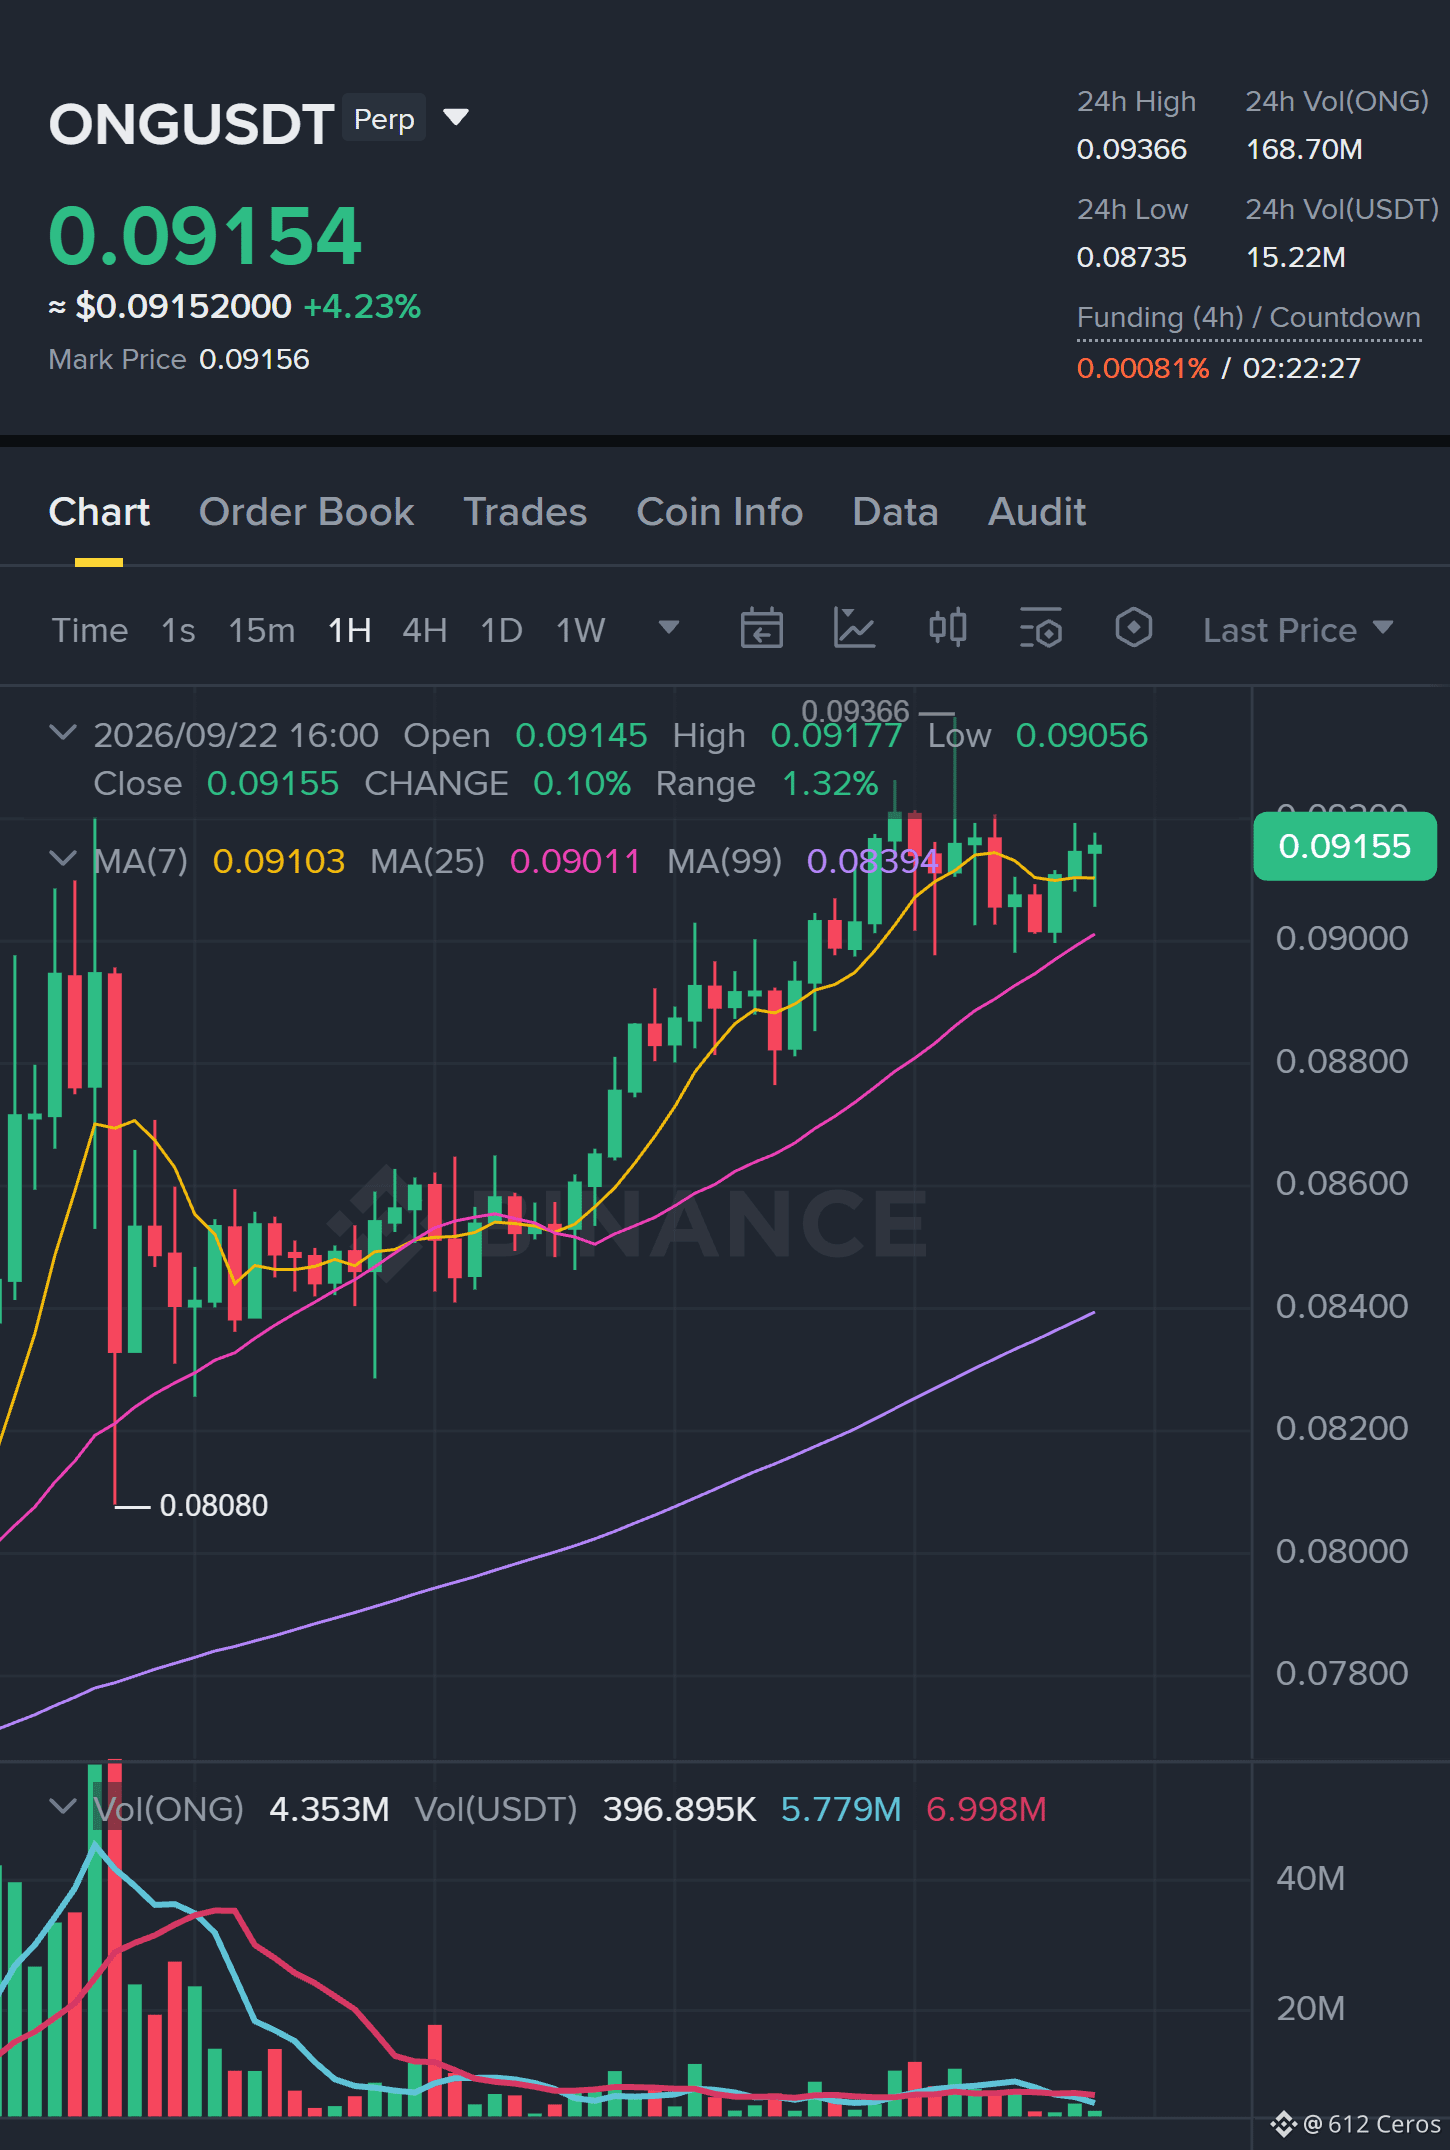
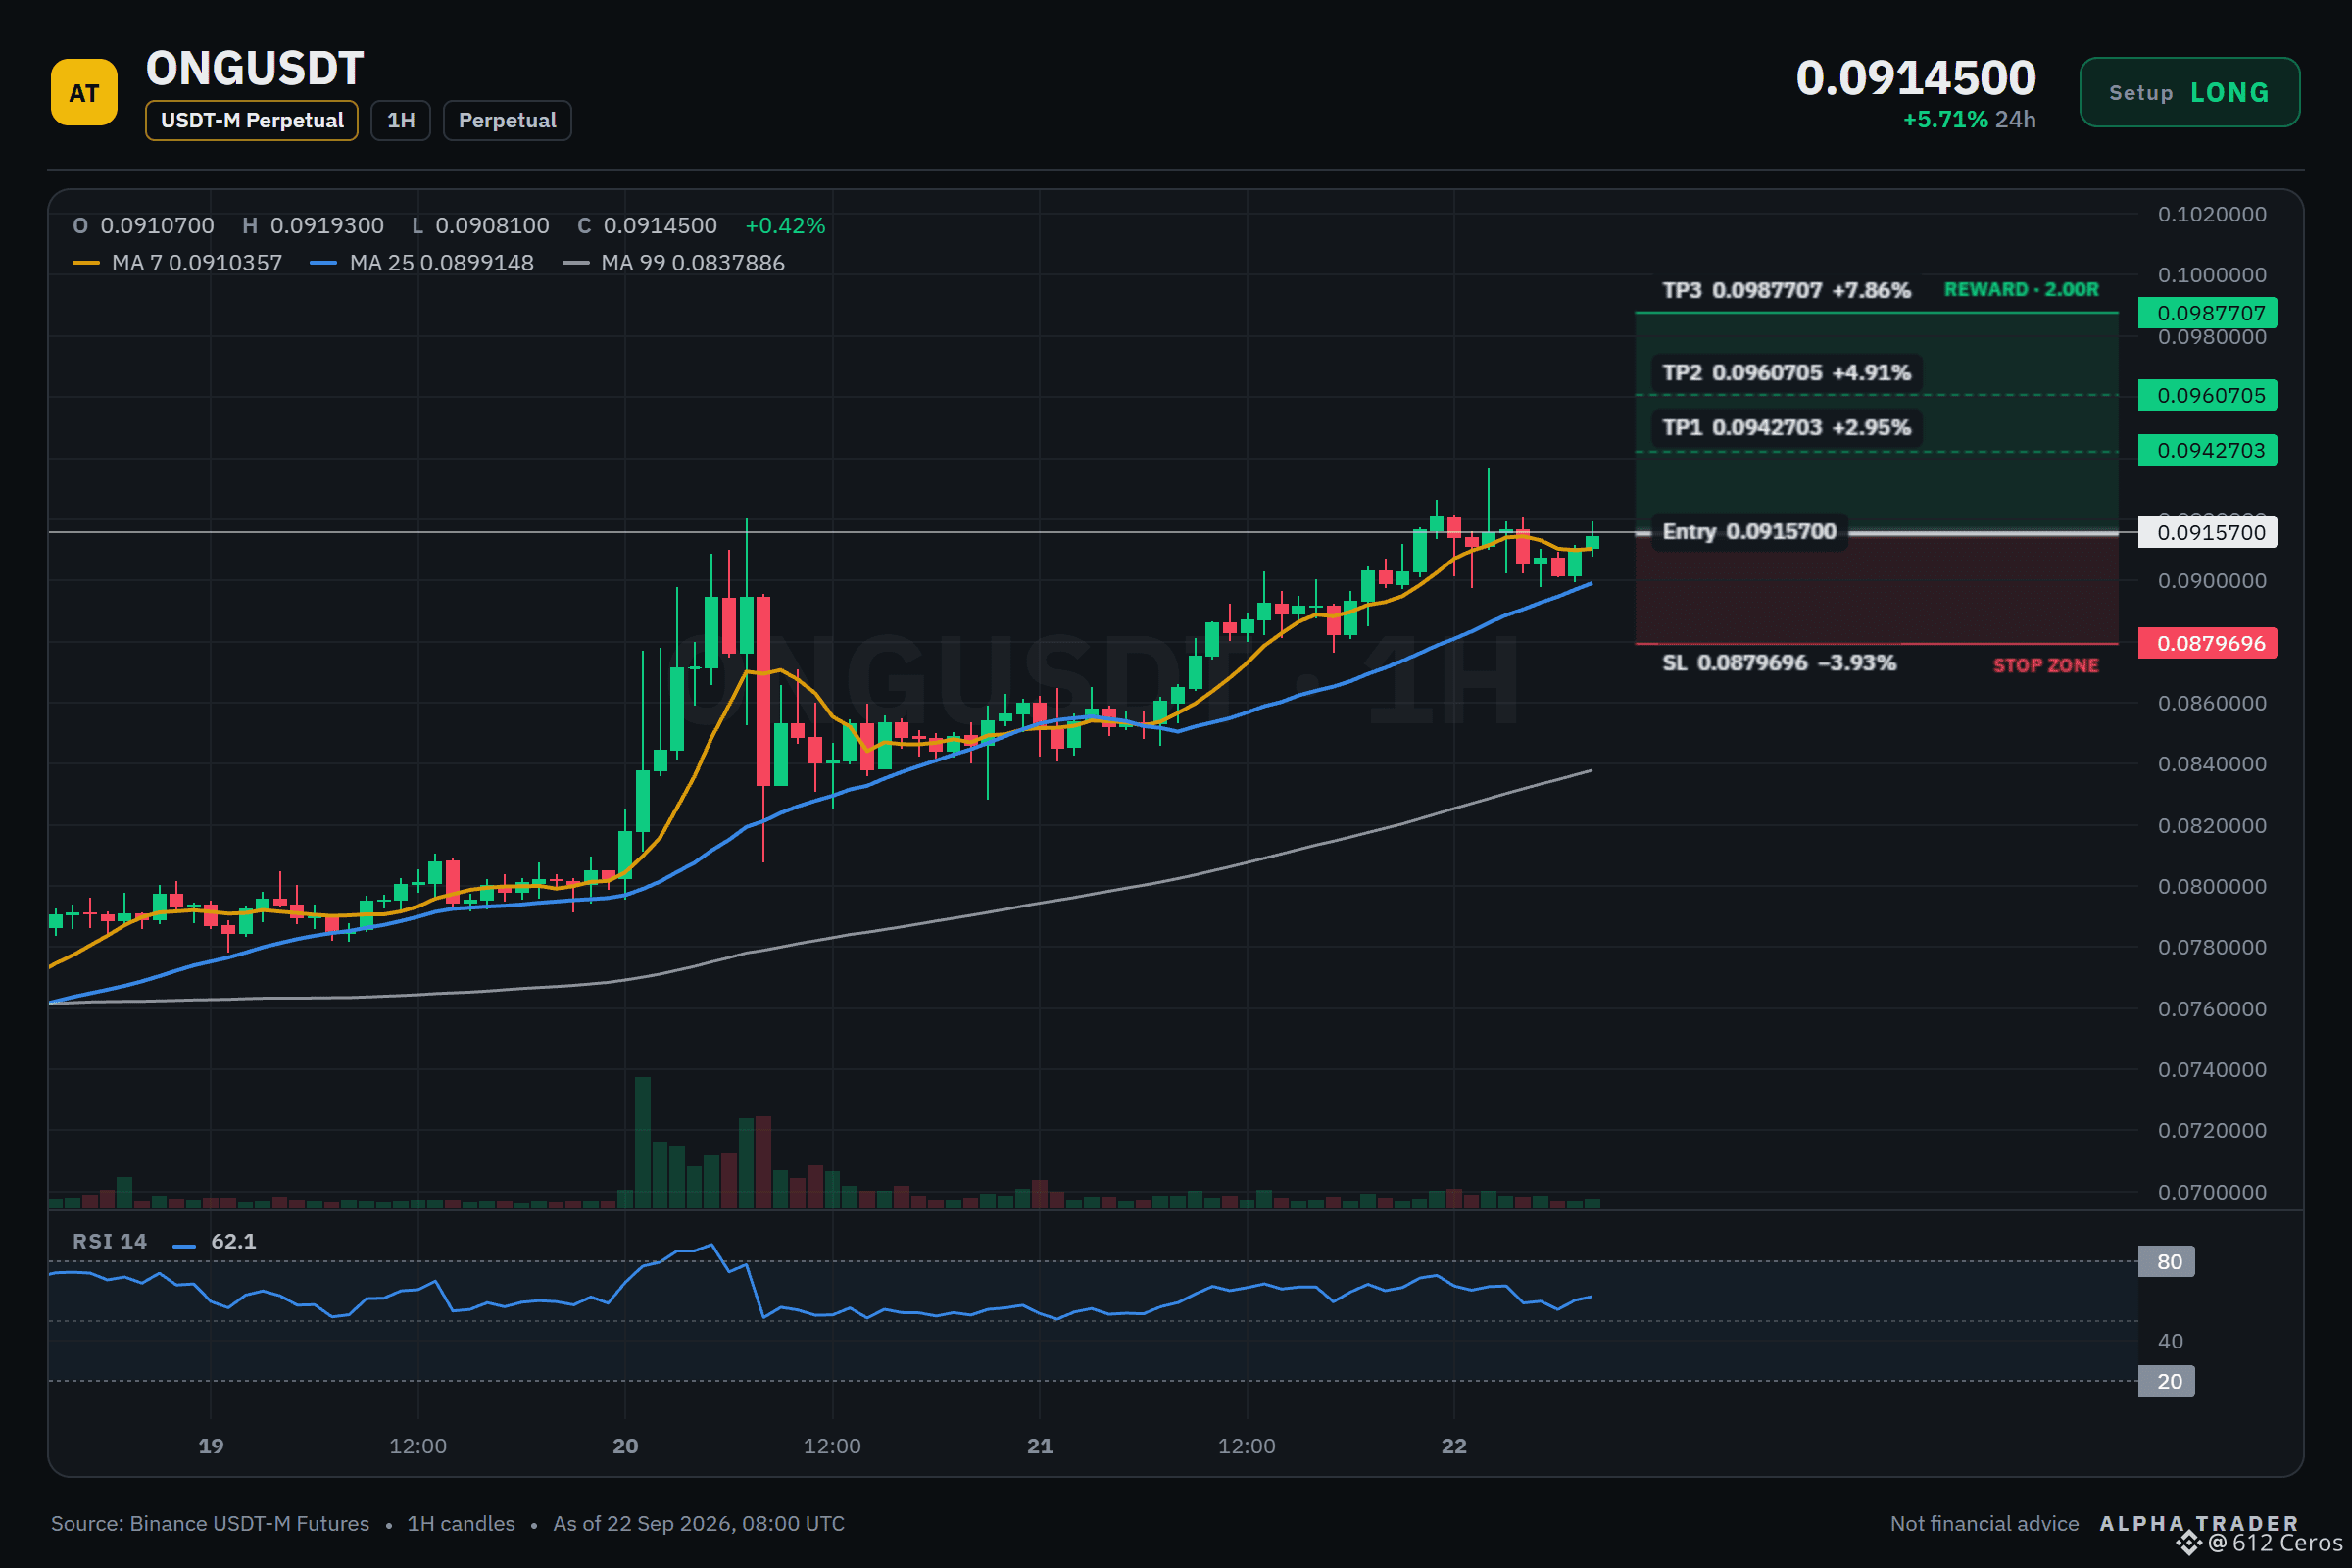
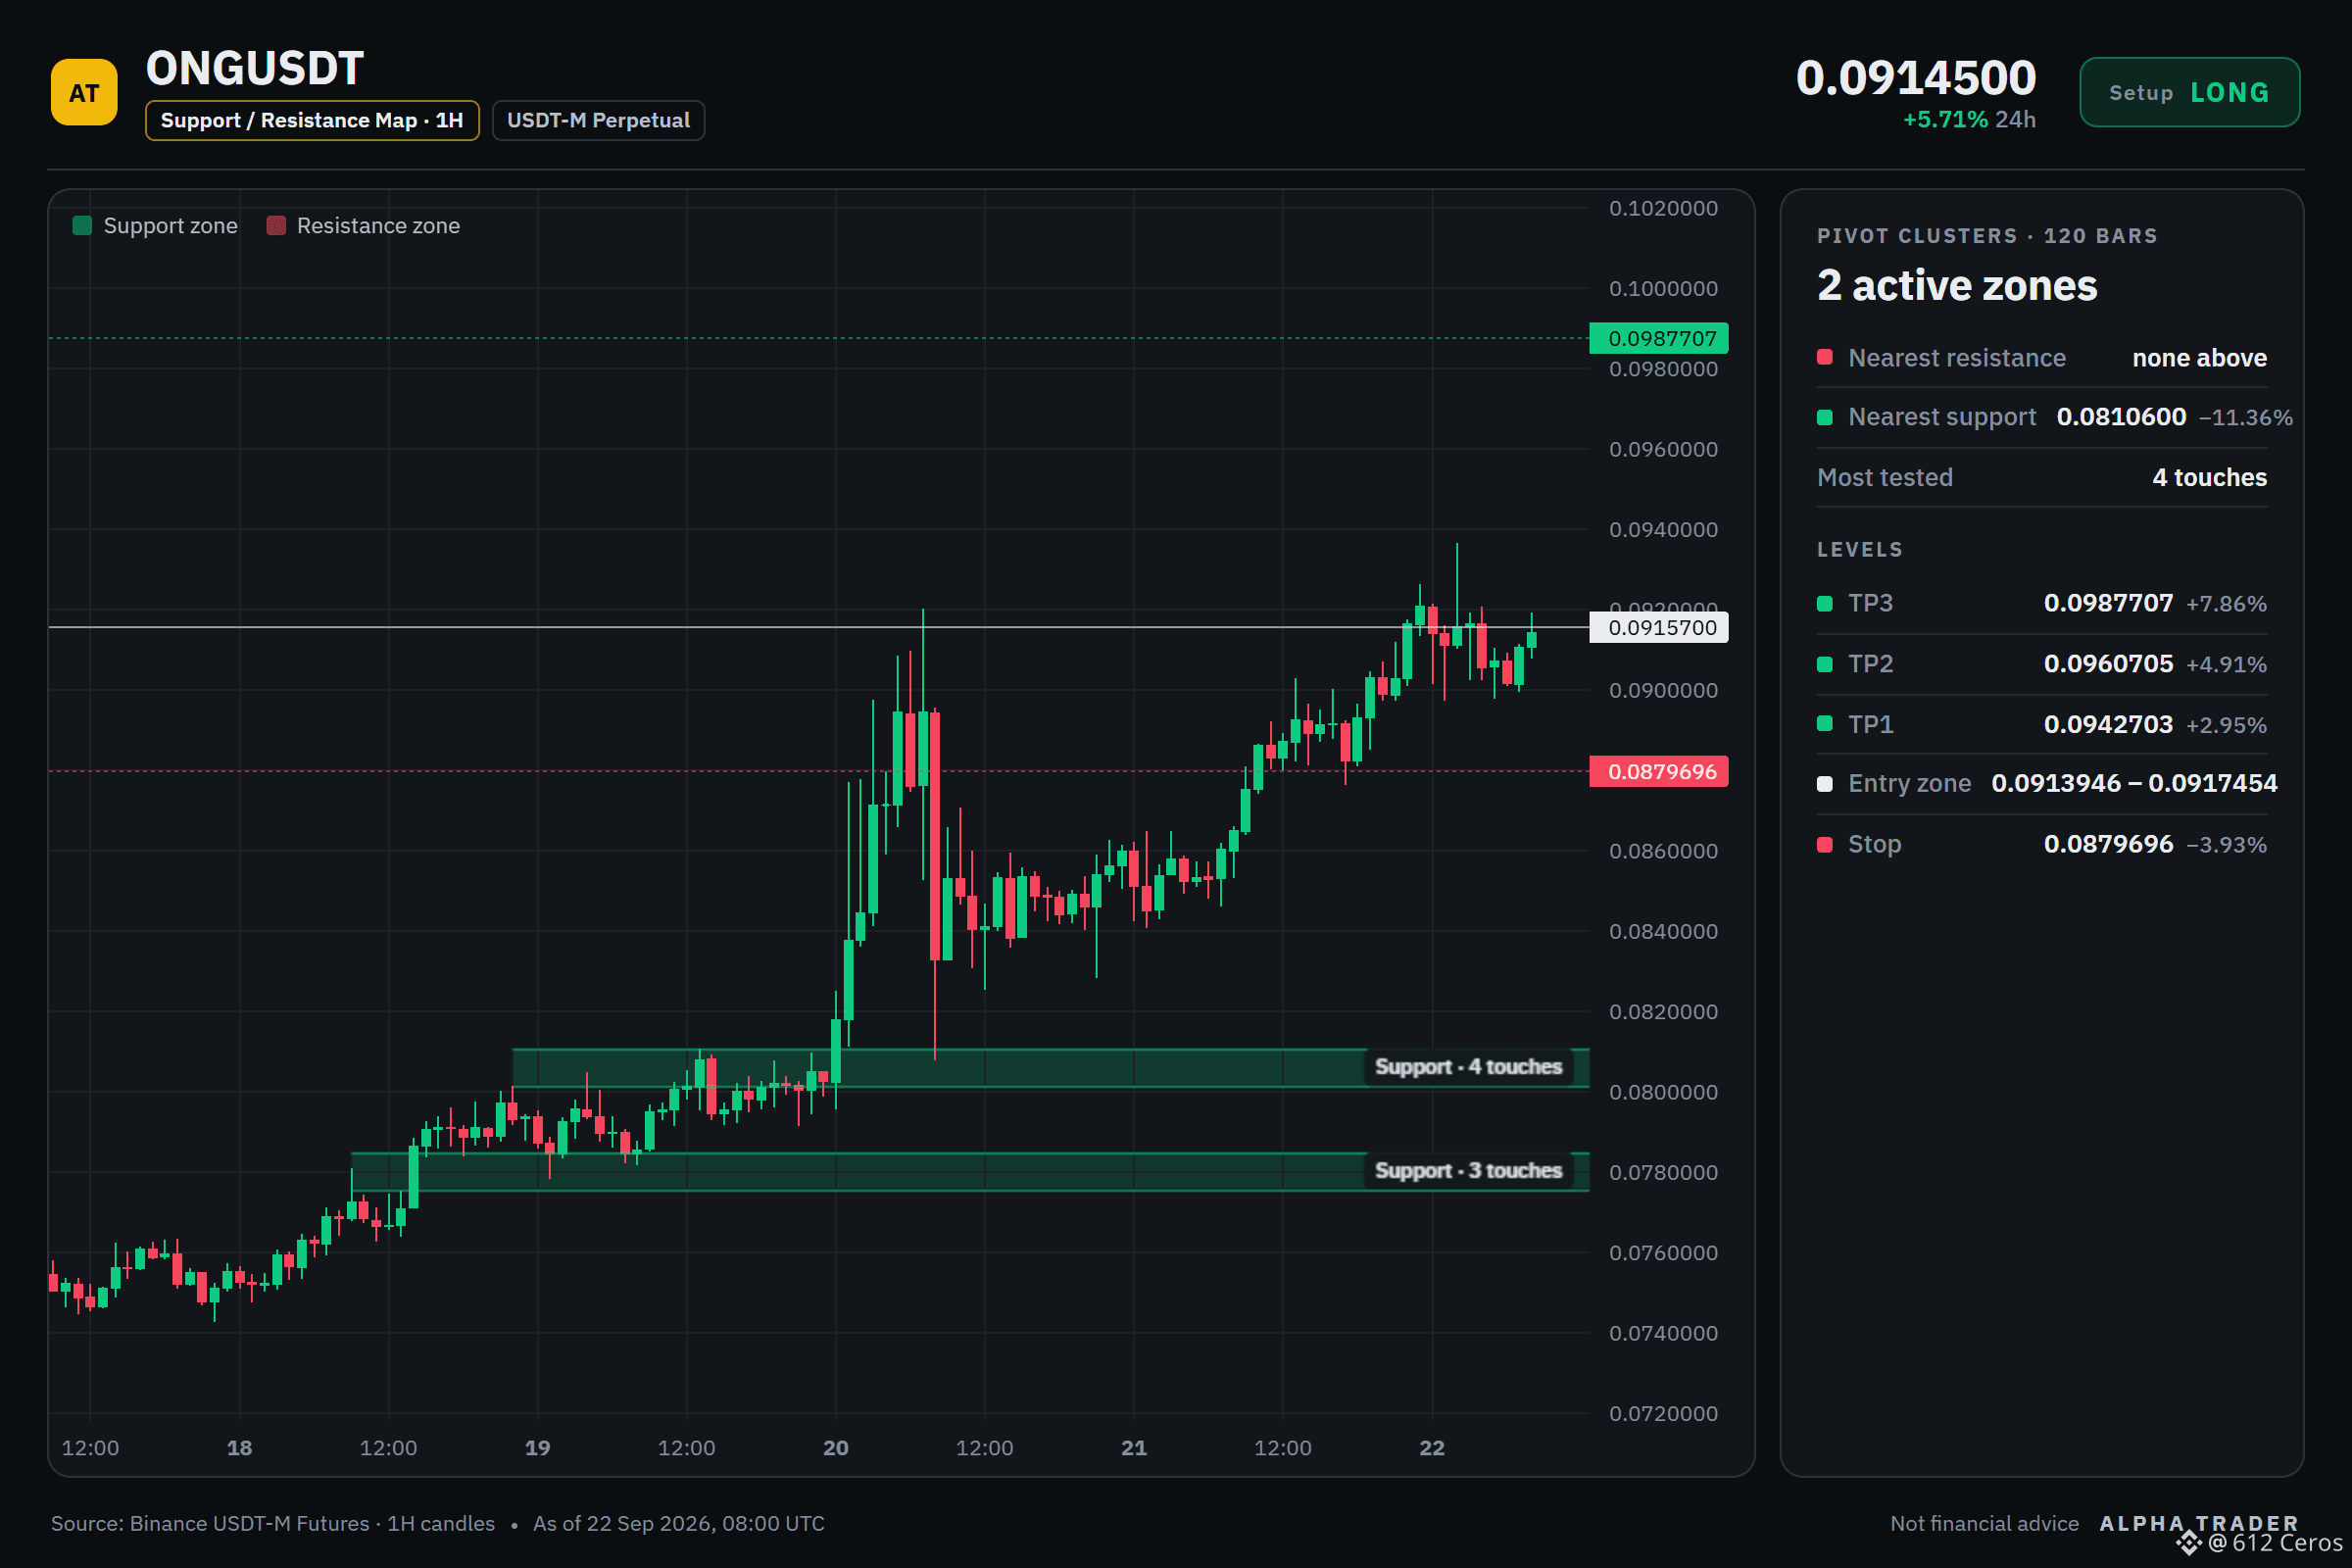
3
1.8k
·
--
Bullish
$USELESS /USDT - 🟢 Bias: LONG (Strong) · 7/12 signals aligned
USELESS is the only play that matters right now.
Technical verdict: STRONG LONG. 7 of 12 signals aligned, 1 against.
What supports it (7):
• Daily trend: price > EMA50 > EMA200, bullish stack
• 4h trend: price > EMA50 > EMA200, bullish stack
• 1h trend: price > EMA50 > EMA200, bullish stack
What argues against (1):
• Volume: volume z-score +2.2 on a red candle, supply confirms
Entry: 0.2962422 – 0.2998178 | SL: 0.2645726
TP1: 0.3231230 | TP2: 0.3398517 | TP3: 0.3649447
USELESS is in a confirmed bullish trend across daily, 4h, and 1h timeframes with the price above all EMAs, and the ADX at 29.8 shows buyers firmly in control with DI+ at 34.9 versus DI- at 10.0.
Where do you set your stop if this breaks the daily trend? I'm looking at 0.2645726 but I want to hear your level.
Click here to view the chart 👇️
{future}(USELESSUSDT)
⚠️ Personal market analysis only. NFA — manage risk and DYOR.
Educational content, not investment advice or a recommendation to buy, sell, deposit, or withdraw any asset. No paid promotion or referral/affiliate links.
$USELESS /USDT - 🟢 Bias: LONG (Strong) · 7/12 signals aligned
USELESS is the only play that matters right now.
Technical verdict: STRONG LONG. 7 of 12 signals aligned, 1 against.
What supports it (7):
• Daily trend: price > EMA50 > EMA200, bullish stack
• 4h trend: price > EMA50 > EMA200, bullish stack
• 1h trend: price > EMA50 > EMA200, bullish stack
What argues against (1):
• Volume: volume z-score +2.2 on a red candle, supply confirms
Entry: 0.2962422 – 0.2998178 | SL: 0.2645726
TP1: 0.3231230 | TP2: 0.3398517 | TP3: 0.3649447
USELESS is in a confirmed bullish trend across daily, 4h, and 1h timeframes with the price above all EMAs, and the ADX at 29.8 shows buyers firmly in control with DI+ at 34.9 versus DI- at 10.0.
Where do you set your stop if this breaks the daily trend? I'm looking at 0.2645726 but I want to hear your level.
Click here to view the chart 👇️
⚠️ Personal market analysis only. NFA — manage risk and DYOR.
Educational content, not investment advice or a recommendation to buy, sell, deposit, or withdraw any asset. No paid promotion or referral/affiliate links.
USELESS is the only play that matters right now.
Technical verdict: STRONG LONG. 7 of 12 signals aligned, 1 against.
What supports it (7):
• Daily trend: price > EMA50 > EMA200, bullish stack
• 4h trend: price > EMA50 > EMA200, bullish stack
• 1h trend: price > EMA50 > EMA200, bullish stack
What argues against (1):
• Volume: volume z-score +2.2 on a red candle, supply confirms
Entry: 0.2962422 – 0.2998178 | SL: 0.2645726
TP1: 0.3231230 | TP2: 0.3398517 | TP3: 0.3649447
USELESS is in a confirmed bullish trend across daily, 4h, and 1h timeframes with the price above all EMAs, and the ADX at 29.8 shows buyers firmly in control with DI+ at 34.9 versus DI- at 10.0.
Where do you set your stop if this breaks the daily trend? I'm looking at 0.2645726 but I want to hear your level.
Click here to view the chart 👇️
⚠️ Personal market analysis only. NFA — manage risk and DYOR.
Educational content, not investment advice or a recommendation to buy, sell, deposit, or withdraw any asset. No paid promotion or referral/affiliate links.
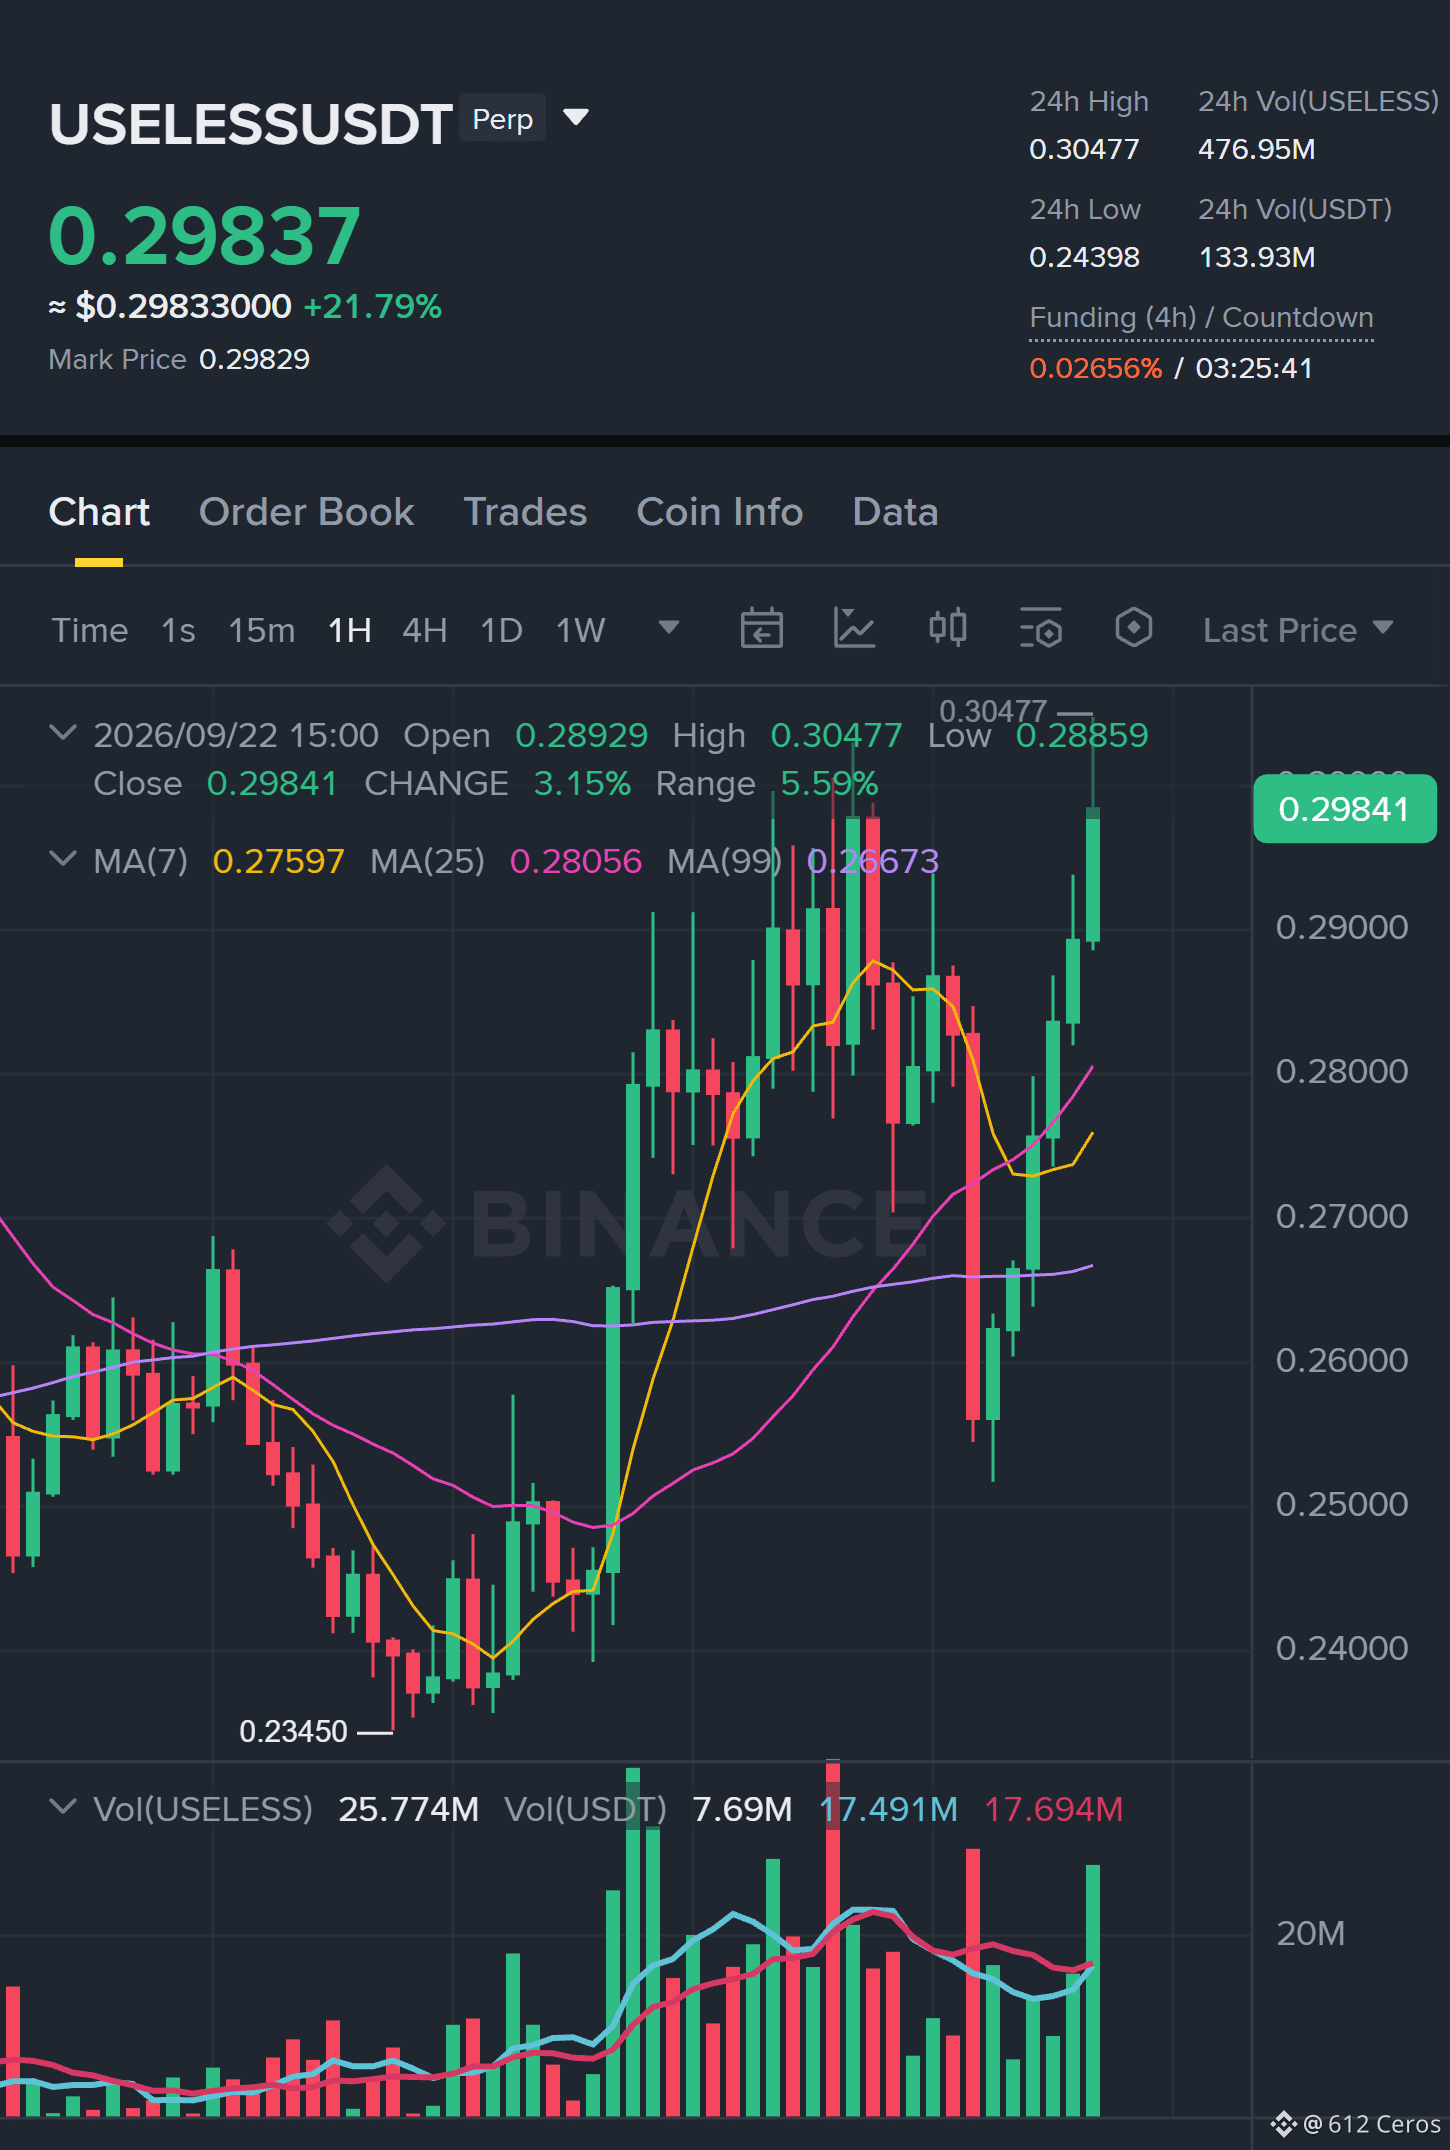
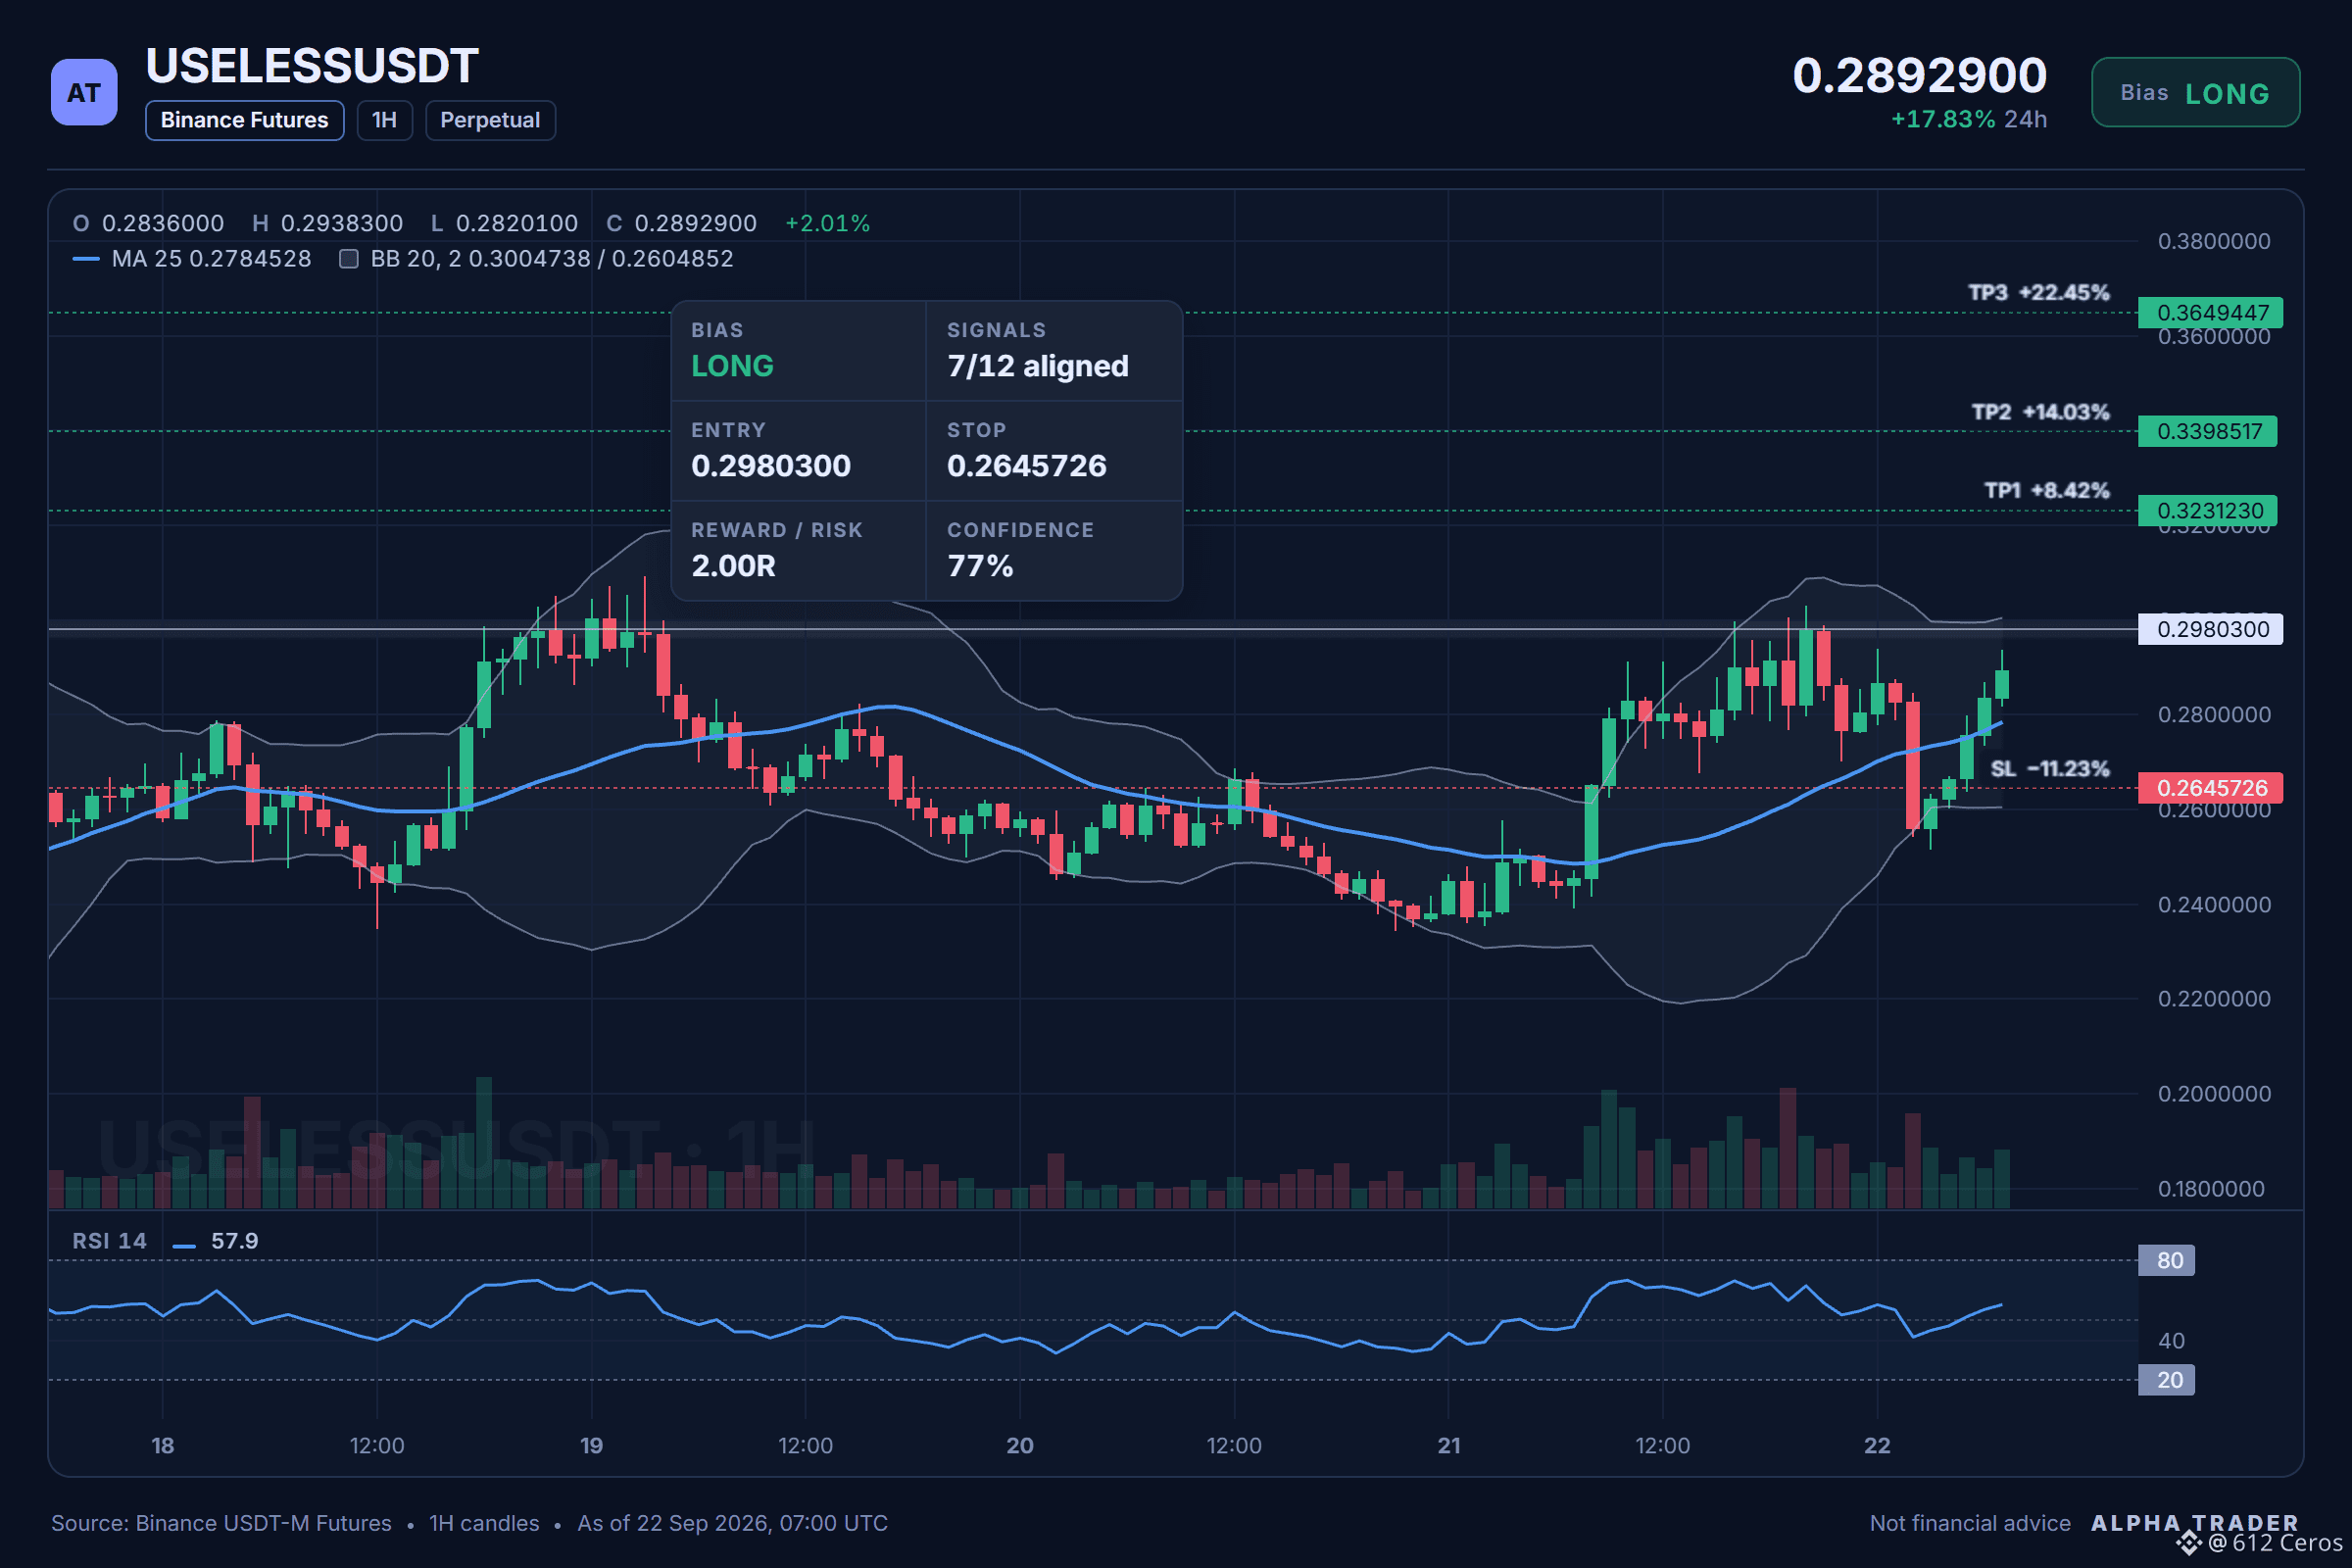
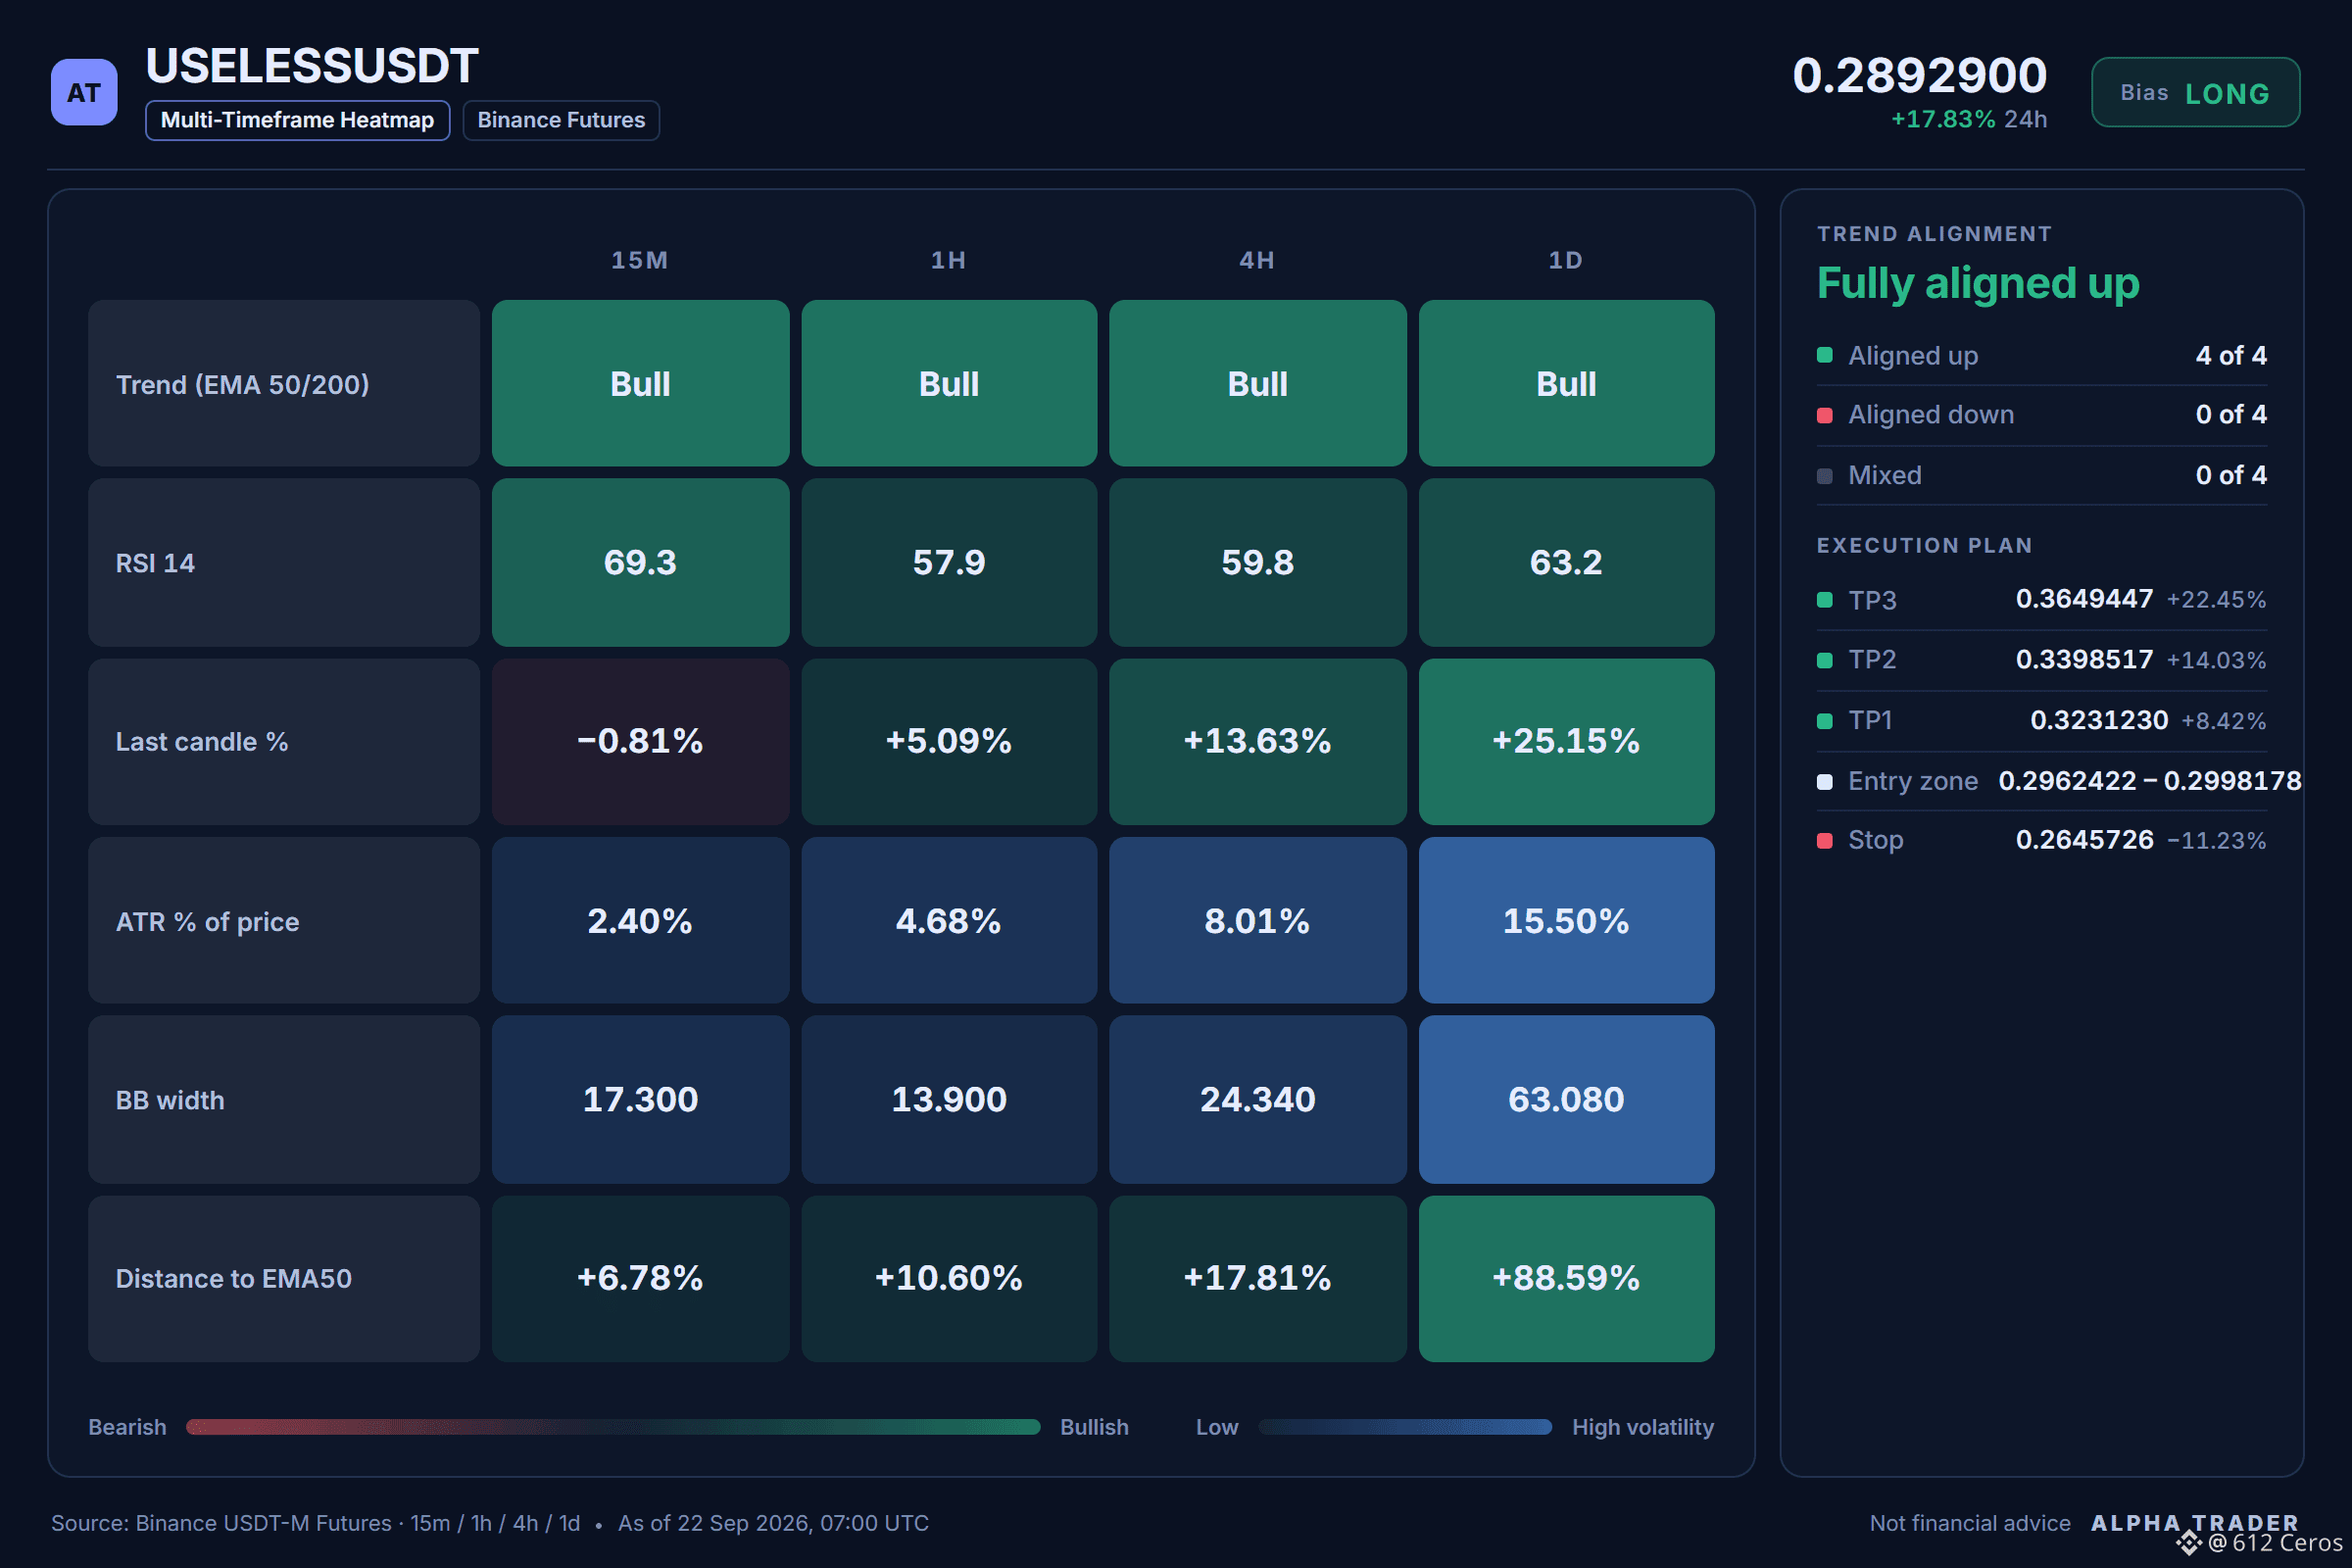
5
4
3.3k
·
--
Bearish
XAU's daily bearish stack is not a myth if you read the EMAs.
🔴 $XAU /USDT | Bias: SHORT (Strong) | 7/12 signals aligned
Technical verdict: STRONG SHORT. 7 of 12 signals aligned, 0 against.
What supports it (7):
• Daily trend: price < EMA50 < EMA200, bearish stack
• 4h trend: price < EMA50 < EMA200, bearish stack
• Trend strength (ADX/DI, 15m): ADX 29.5 with sellers in control (DI+ 11.9 vs DI− 25.0)
• 4h RSI: 44.9, bearish momentum (below 45)
No factor points the other way right now.
Q: Why short XAU instead of going long on a bounce?
A: The daily trend is bearish and the 1h price is below a bearish 4h stack, with a 77.6 confidence score.
Q: Where is the precise entry zone?
A: The 1h price is 4318.25, with a valid entry between 4316.27 and 4320.23 against the 4372.66 invalid level.
Q: When does this setup become wrong?
A: A break above 4353.12 invalidates the short, as the price would be trading back above the 1h entry high.
Price map:
🛑 SL: 4353.12
📍 Entry: 4316.27 – 4320.23
🎯 TP1: 4292.10
🎯 TP2: 4274.66
🎯 TP3: 4248.51
Debate:
What is your entry if XAU breaks above 4353.12 before reaching 4316.27?
Click here to view the chart 👇️
{future}(XAUUSDT)
⚠️ Personal market analysis only. NFA — manage risk and DYOR.
Educational content, not investment advice or a recommendation to buy, sell, deposit, or withdraw any asset. No paid promotion or referral/affiliate links.
XAU's daily bearish stack is not a myth if you read the EMAs.
🔴 $XAU /USDT | Bias: SHORT (Strong) | 7/12 signals aligned
Technical verdict: STRONG SHORT. 7 of 12 signals aligned, 0 against.
What supports it (7):
• Daily trend: price < EMA50 < EMA200, bearish stack
• 4h trend: price < EMA50 < EMA200, bearish stack
• Trend strength (ADX/DI, 15m): ADX 29.5 with sellers in control (DI+ 11.9 vs DI− 25.0)
• 4h RSI: 44.9, bearish momentum (below 45)
No factor points the other way right now.
Q: Why short XAU instead of going long on a bounce?
A: The daily trend is bearish and the 1h price is below a bearish 4h stack, with a 77.6 confidence score.
Q: Where is the precise entry zone?
A: The 1h price is 4318.25, with a valid entry between 4316.27 and 4320.23 against the 4372.66 invalid level.
Q: When does this setup become wrong?
A: A break above 4353.12 invalidates the short, as the price would be trading back above the 1h entry high.
Price map:
🛑 SL: 4353.12
📍 Entry: 4316.27 – 4320.23
🎯 TP1: 4292.10
🎯 TP2: 4274.66
🎯 TP3: 4248.51
Debate:
What is your entry if XAU breaks above 4353.12 before reaching 4316.27?
Click here to view the chart 👇️
⚠️ Personal market analysis only. NFA — manage risk and DYOR.
Educational content, not investment advice or a recommendation to buy, sell, deposit, or withdraw any asset. No paid promotion or referral/affiliate links.
🔴 $XAU /USDT | Bias: SHORT (Strong) | 7/12 signals aligned
Technical verdict: STRONG SHORT. 7 of 12 signals aligned, 0 against.
What supports it (7):
• Daily trend: price < EMA50 < EMA200, bearish stack
• 4h trend: price < EMA50 < EMA200, bearish stack
• Trend strength (ADX/DI, 15m): ADX 29.5 with sellers in control (DI+ 11.9 vs DI− 25.0)
• 4h RSI: 44.9, bearish momentum (below 45)
No factor points the other way right now.
Q: Why short XAU instead of going long on a bounce?
A: The daily trend is bearish and the 1h price is below a bearish 4h stack, with a 77.6 confidence score.
Q: Where is the precise entry zone?
A: The 1h price is 4318.25, with a valid entry between 4316.27 and 4320.23 against the 4372.66 invalid level.
Q: When does this setup become wrong?
A: A break above 4353.12 invalidates the short, as the price would be trading back above the 1h entry high.
Price map:
🛑 SL: 4353.12
📍 Entry: 4316.27 – 4320.23
🎯 TP1: 4292.10
🎯 TP2: 4274.66
🎯 TP3: 4248.51
Debate:
What is your entry if XAU breaks above 4353.12 before reaching 4316.27?
Click here to view the chart 👇️
⚠️ Personal market analysis only. NFA — manage risk and DYOR.
Educational content, not investment advice or a recommendation to buy, sell, deposit, or withdraw any asset. No paid promotion or referral/affiliate links.
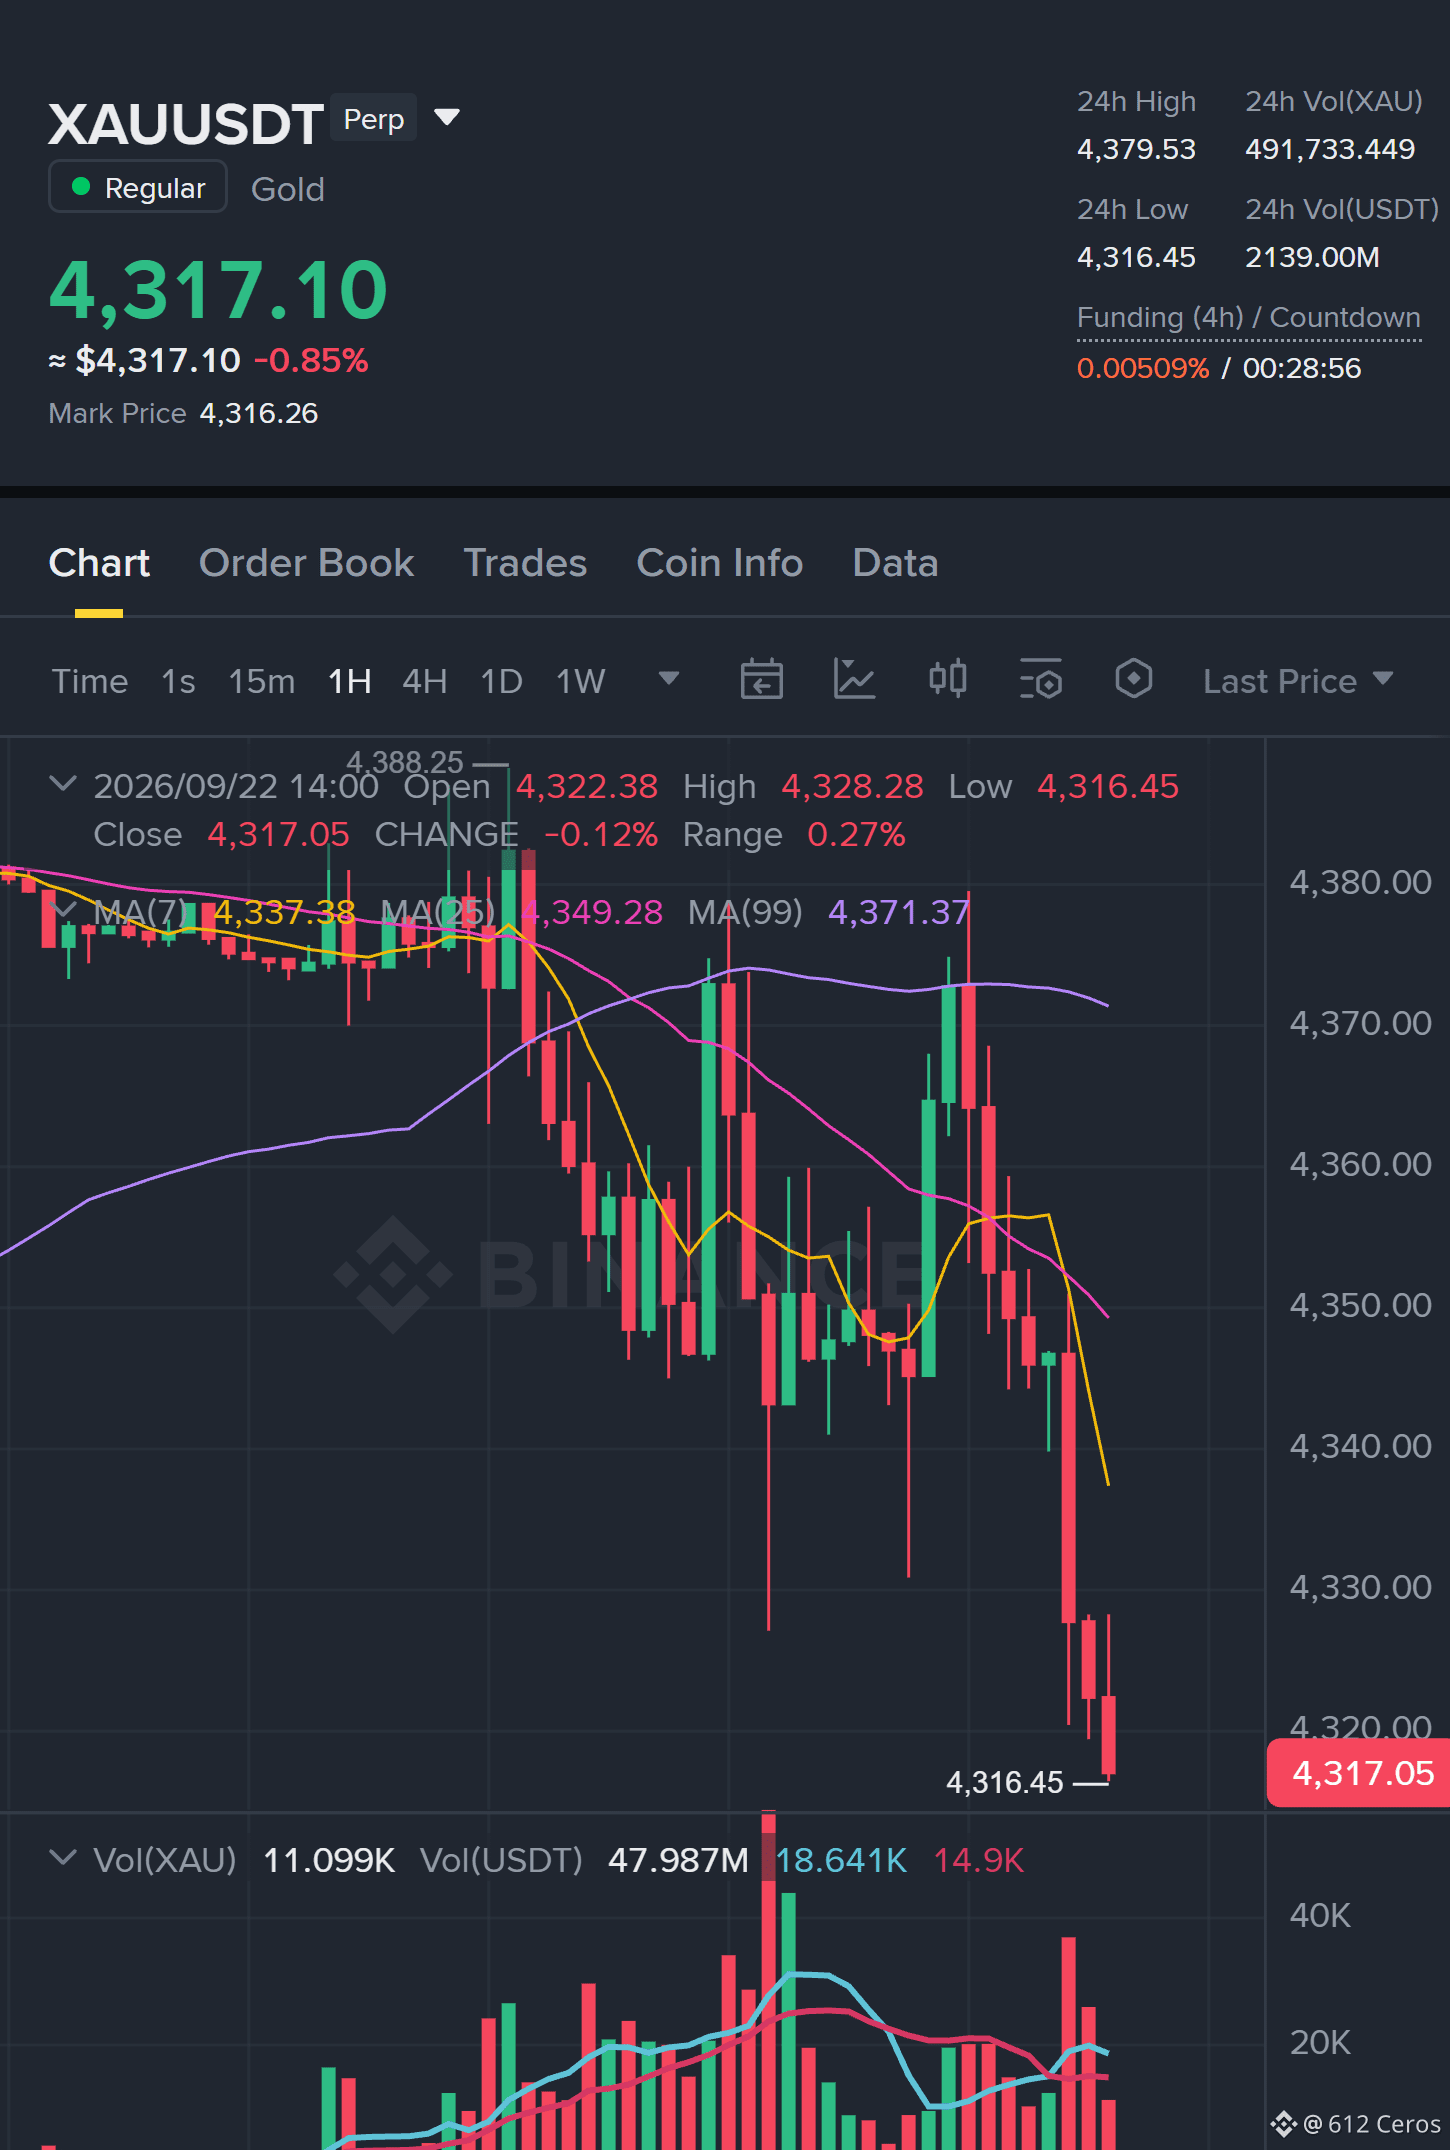
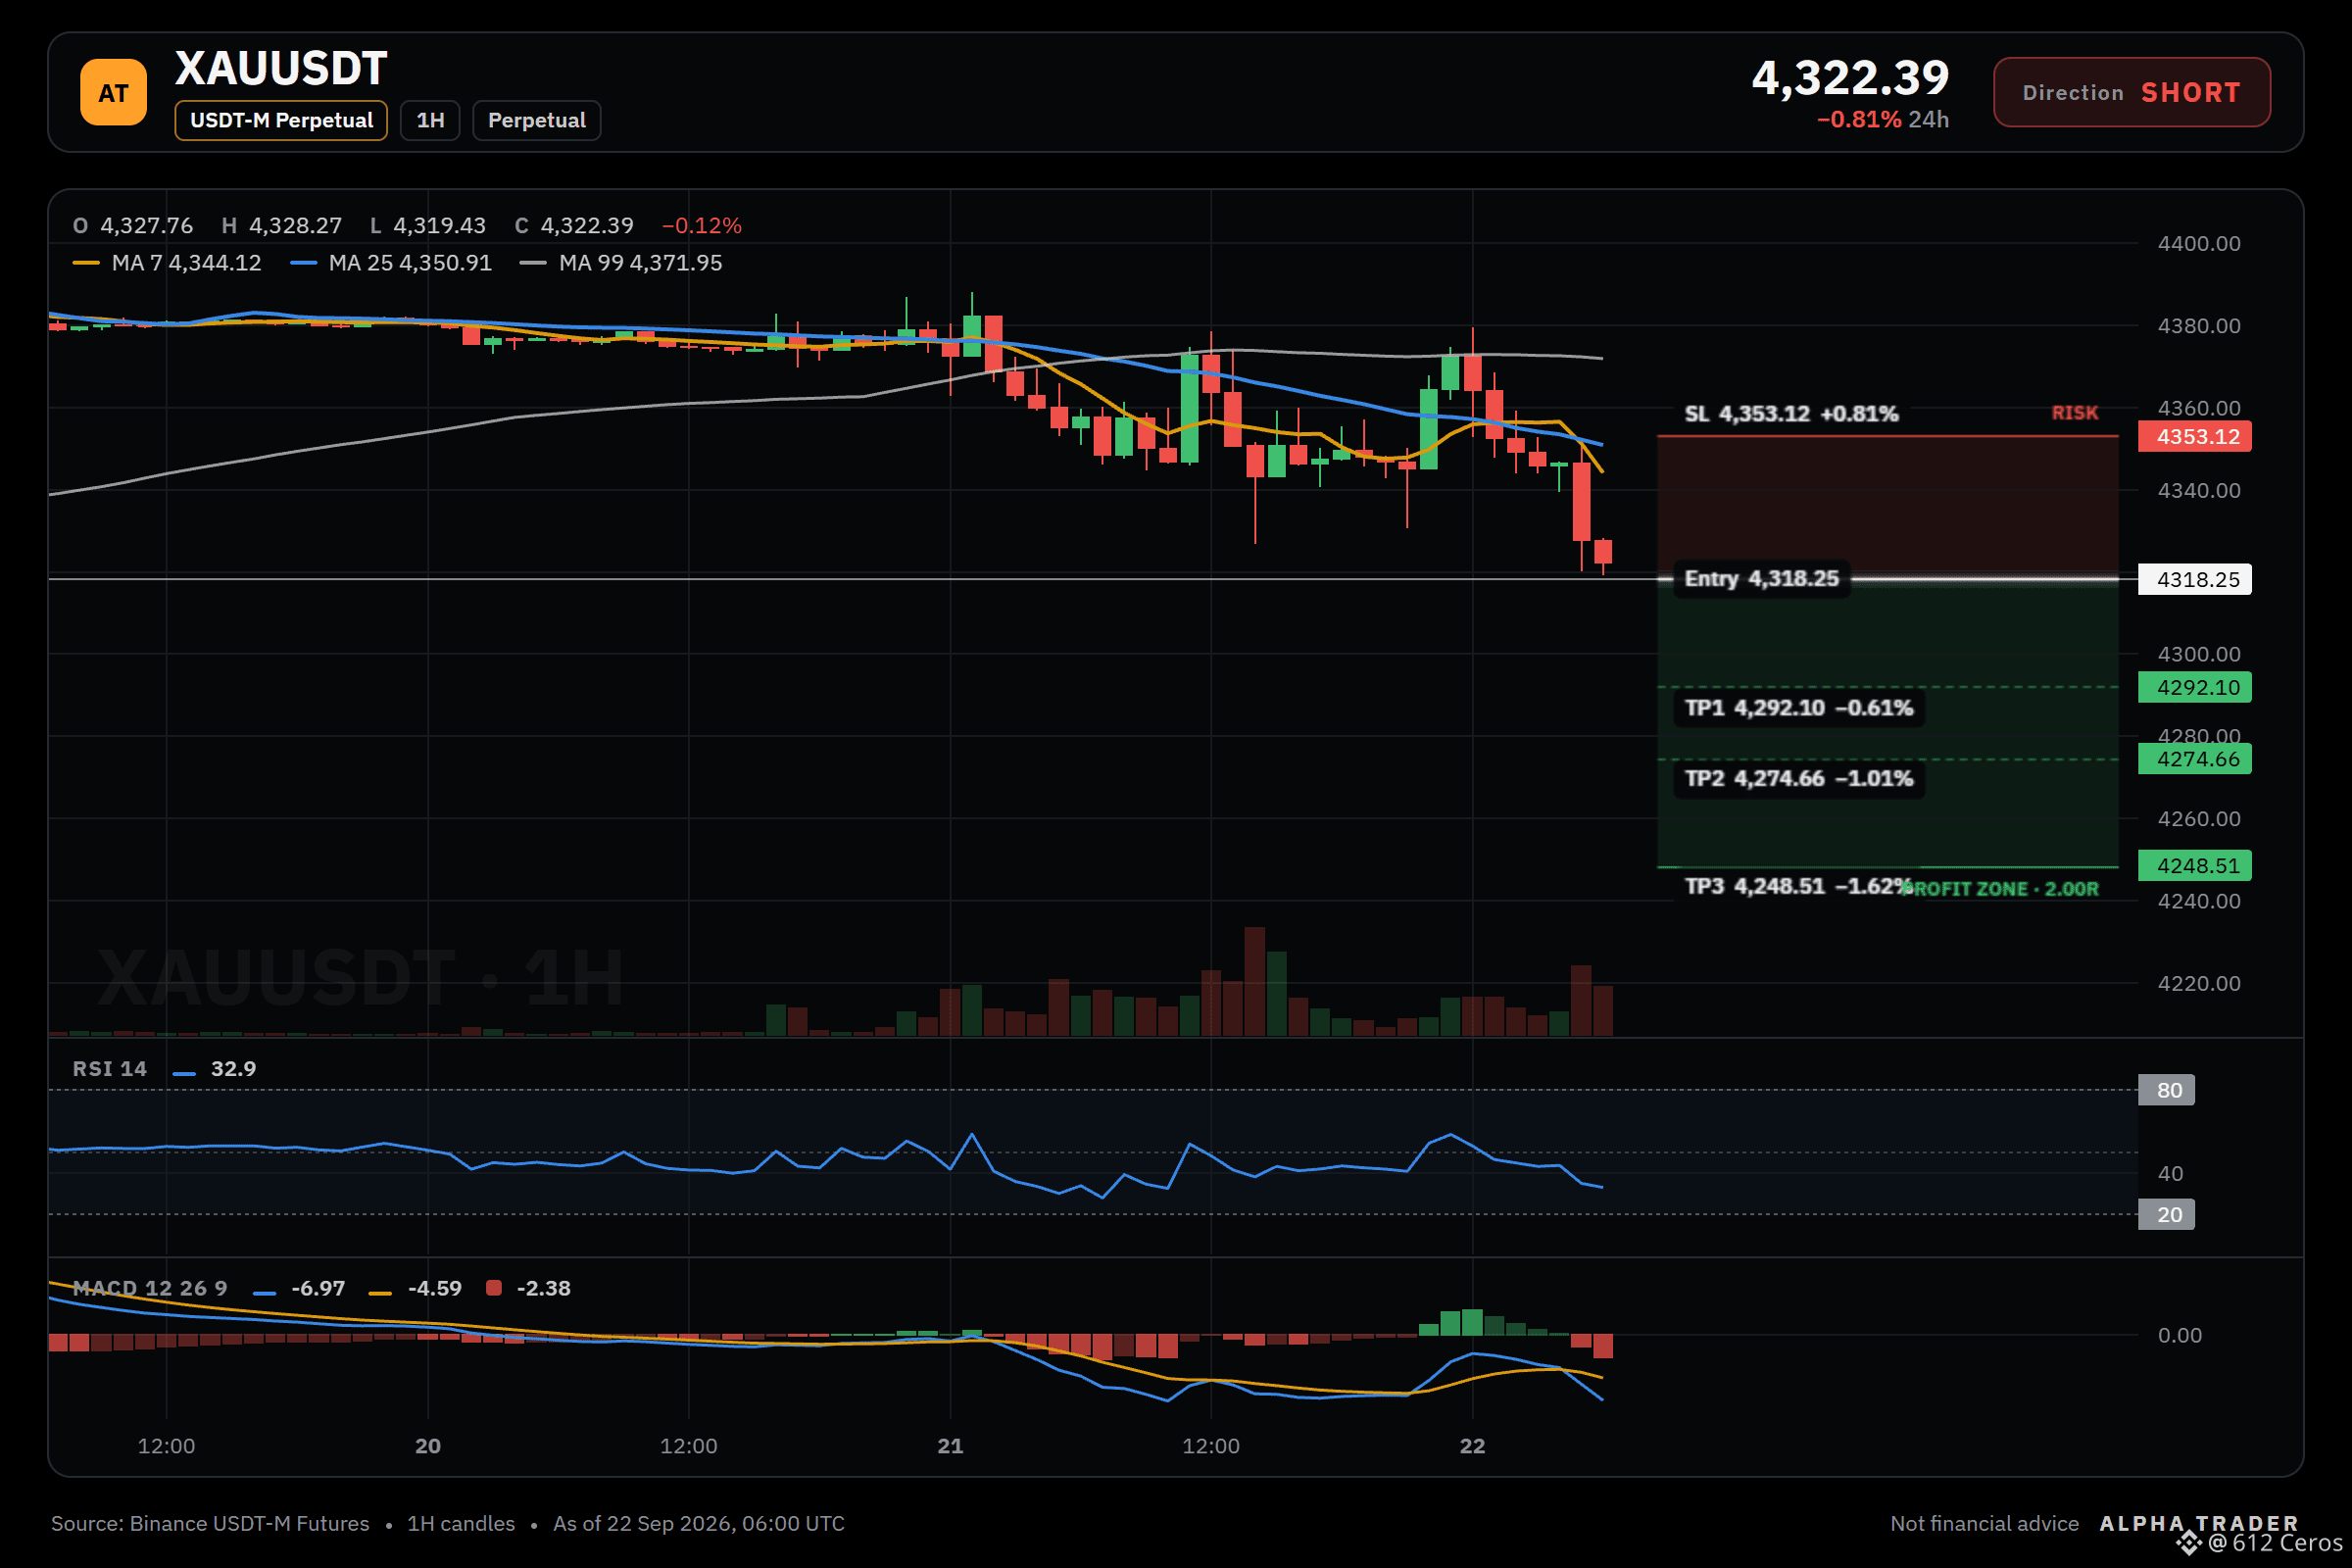
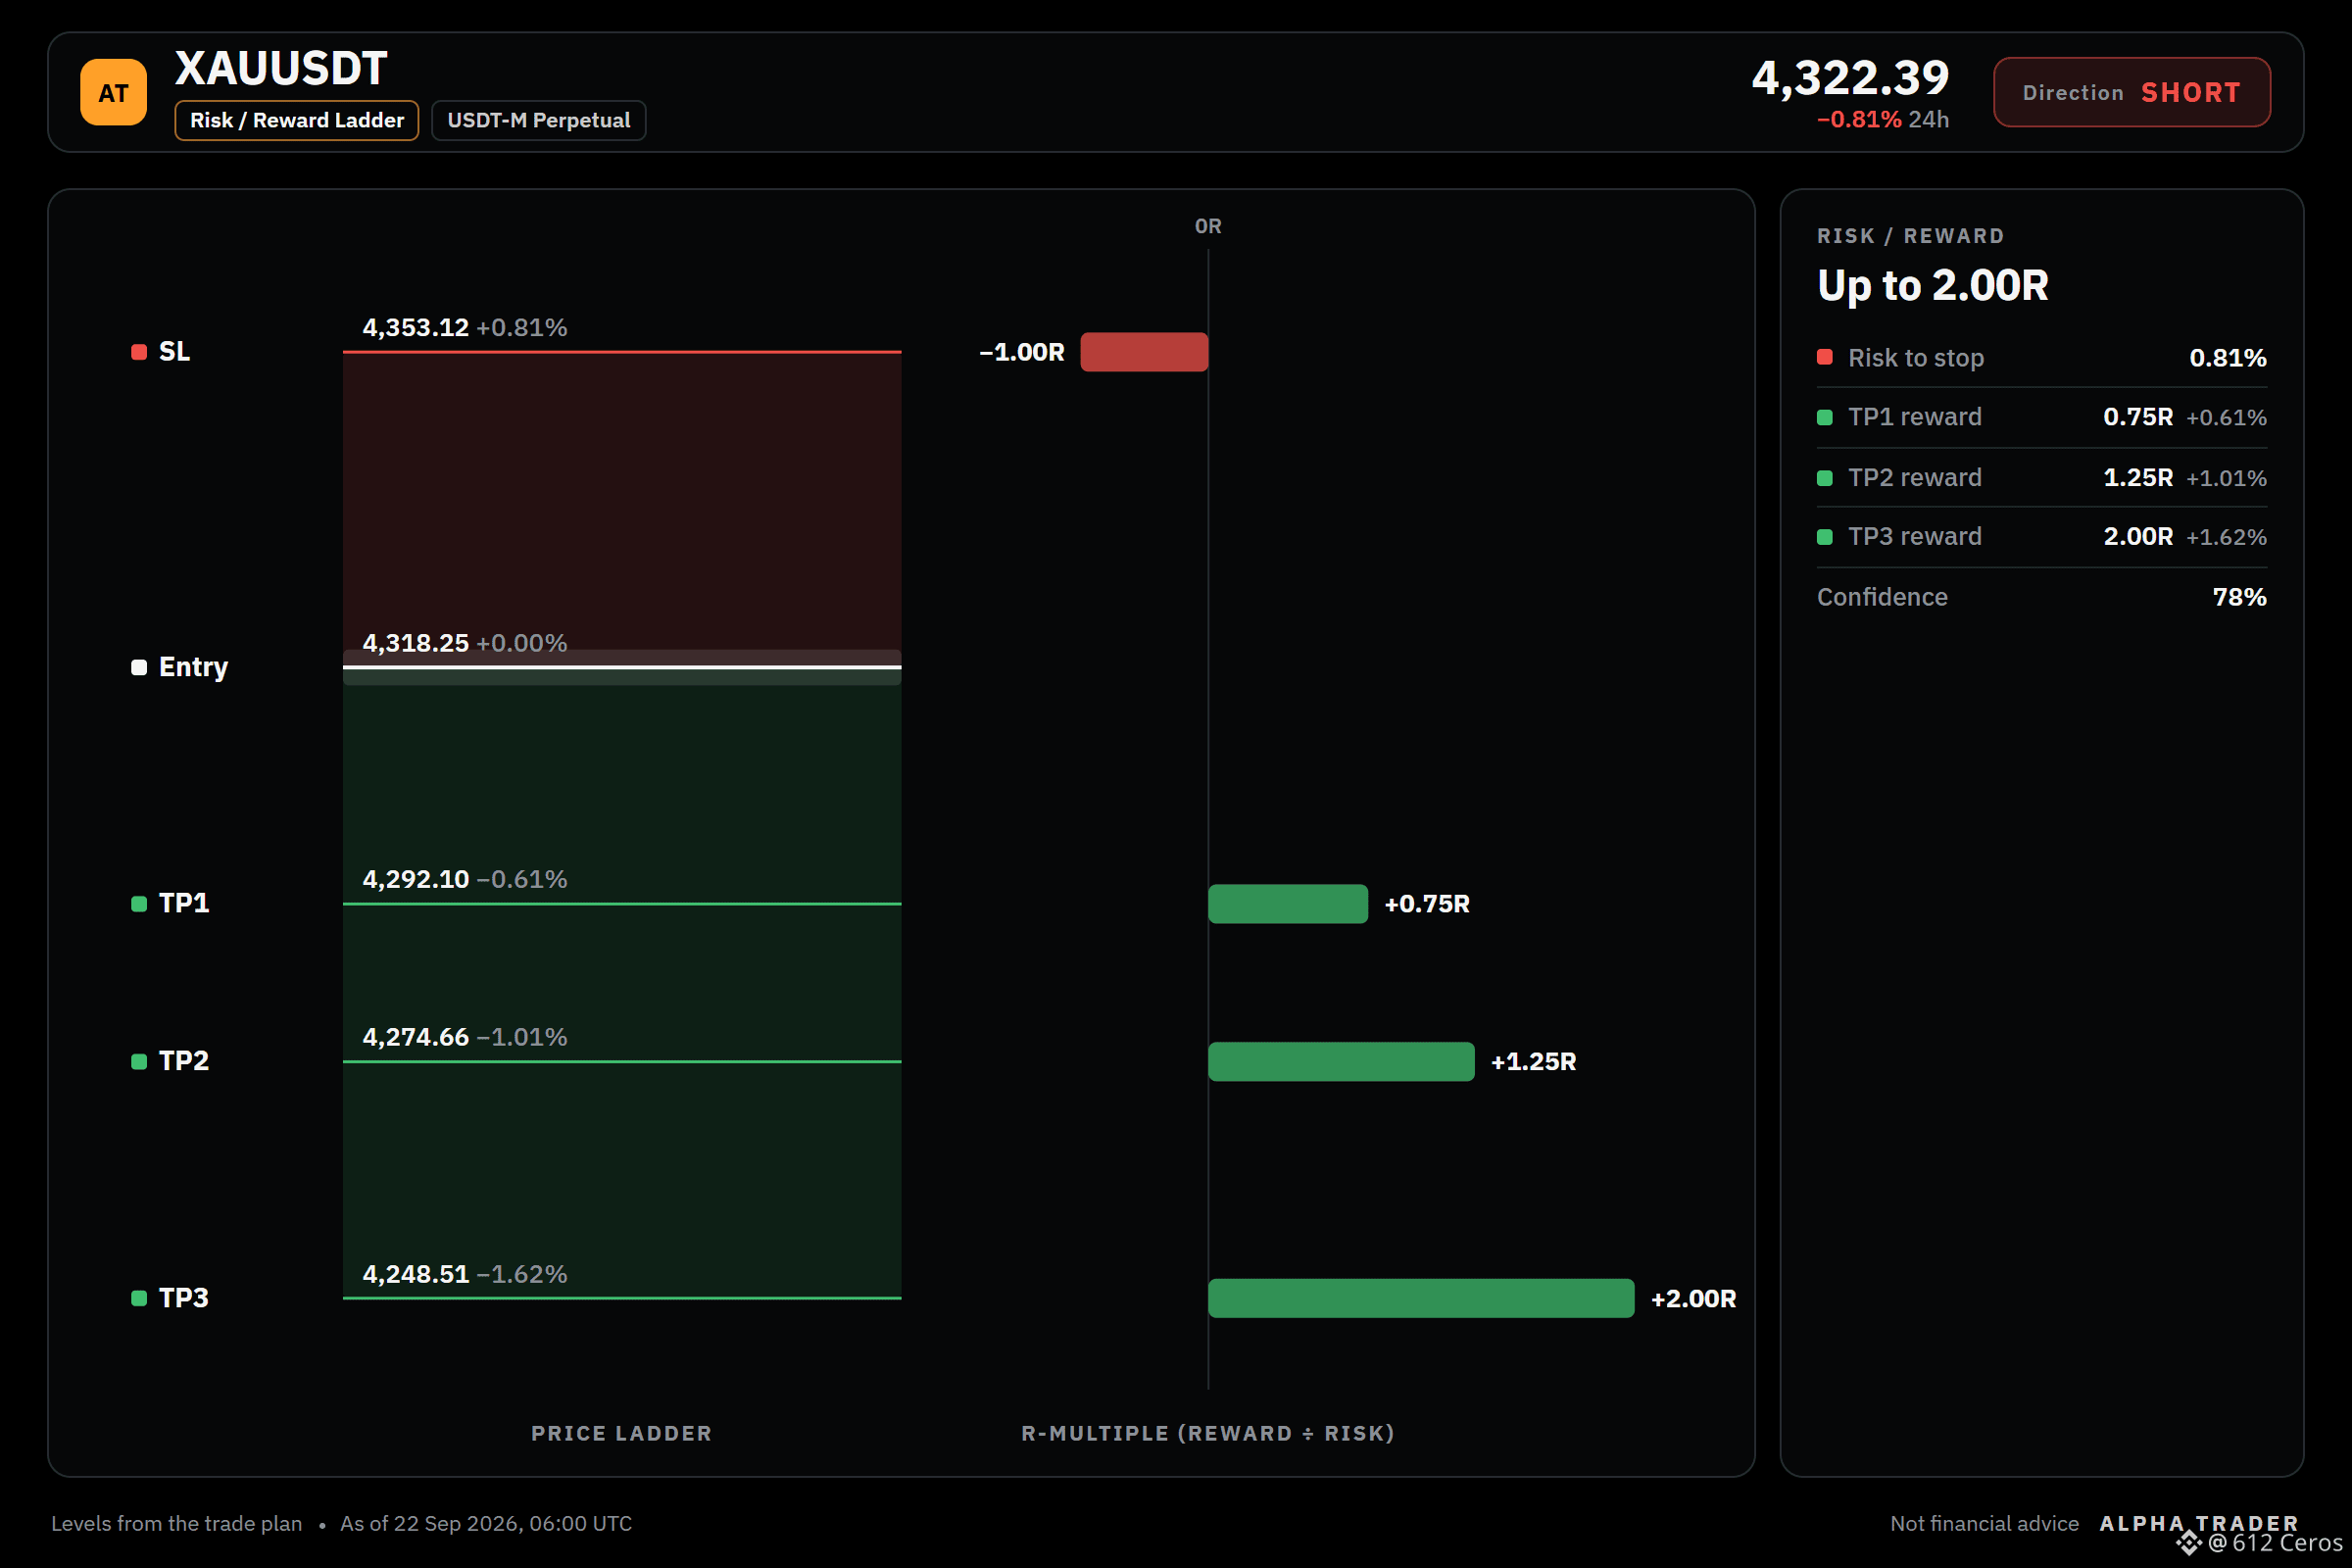
1
1.6k
Log in to explore more content
Join global crypto users on Binance Square
⚡️ Get latest and useful information about crypto.
💬 Trusted by the world’s largest crypto exchange.
👍 Discover real insights from verified creators.
Email / Phone number
Trending Topics
AIStocksWhatNext
1M views
7,015 Discussing
Share & Win Traffic Reward in our Trending Hashtag Campaign
✨Topic: What Other Investment Opportunities Remain as AI Stocks Keep Rising?
👉How to Join:
Publish a short post or article with hashtag #AIStocksWhatNext
Share whether you’re bullish or bearish, and post your AI stock holdings or trade — using the trade widget may improve your eligibility.
You can also strengthen your post by sharing data or charts, and avoiding AI-generated images.
✍️Create content based on the below angles:
- Nvidia says chip sales will double next year, and top AI companies keep hitting record revenue, the compute spend behind it is just as staggering. Is AI demand really taking off? And how long can it last? AI stocks are up across the board. Is this a real breakout, or just a short-term bounce?
- Industry leaders are calling to slow down AI development, while Trump plans to build an “AI Force”, claiming AI could account for 25% of U.S. GDP in the future. Whose side are you on? Will state-level backing be a long-term win for AI stocks?
- Are you buying AI stocks? Share your AI-related trade/holdings with our trade sharing widget.
⏰Campaign Period:
- 2026-09-22 7:00 - 2026-09-24 4:00 UTC
🎁Reward:
- Qualified posts that comply with the above guidelines and contain more than 100 words will be reviewed and may receive a random traffic boost of 500 to 3,000 views. You will receive a notification from your feed secretary if your post is selected.
- Get a chance to have your article featured on Binance Square Official
Need ideas for your post? Visit the topic page #AIStocksWhatNext or the Square Guide on How to Post for Better Reach.
Binance Square Official
·609 Likes
·1.8M views
BitcoinRejectedAt$87,300Twice
0 views
0 Discussing
BCHJumps28%OnCMEFuturesListing
22,962 views
659 Discussing