
612 Ceros
30.2k Posts
 LIVE
612 Ceros
 Square Verified+
Report
Block User
📊 Crypto strategist | Market signals daily | Trade smart, not emotional. Find me on X: @612Ceros
Open Trade

BNB Holder
High-Frequency Trader
5.1 Years
57 Following
180.2K+ Followers
229.8K+ Liked
Posts
Portfolio
All
Quotes
Live
·
--
Bearish
The daily range hides a short bias
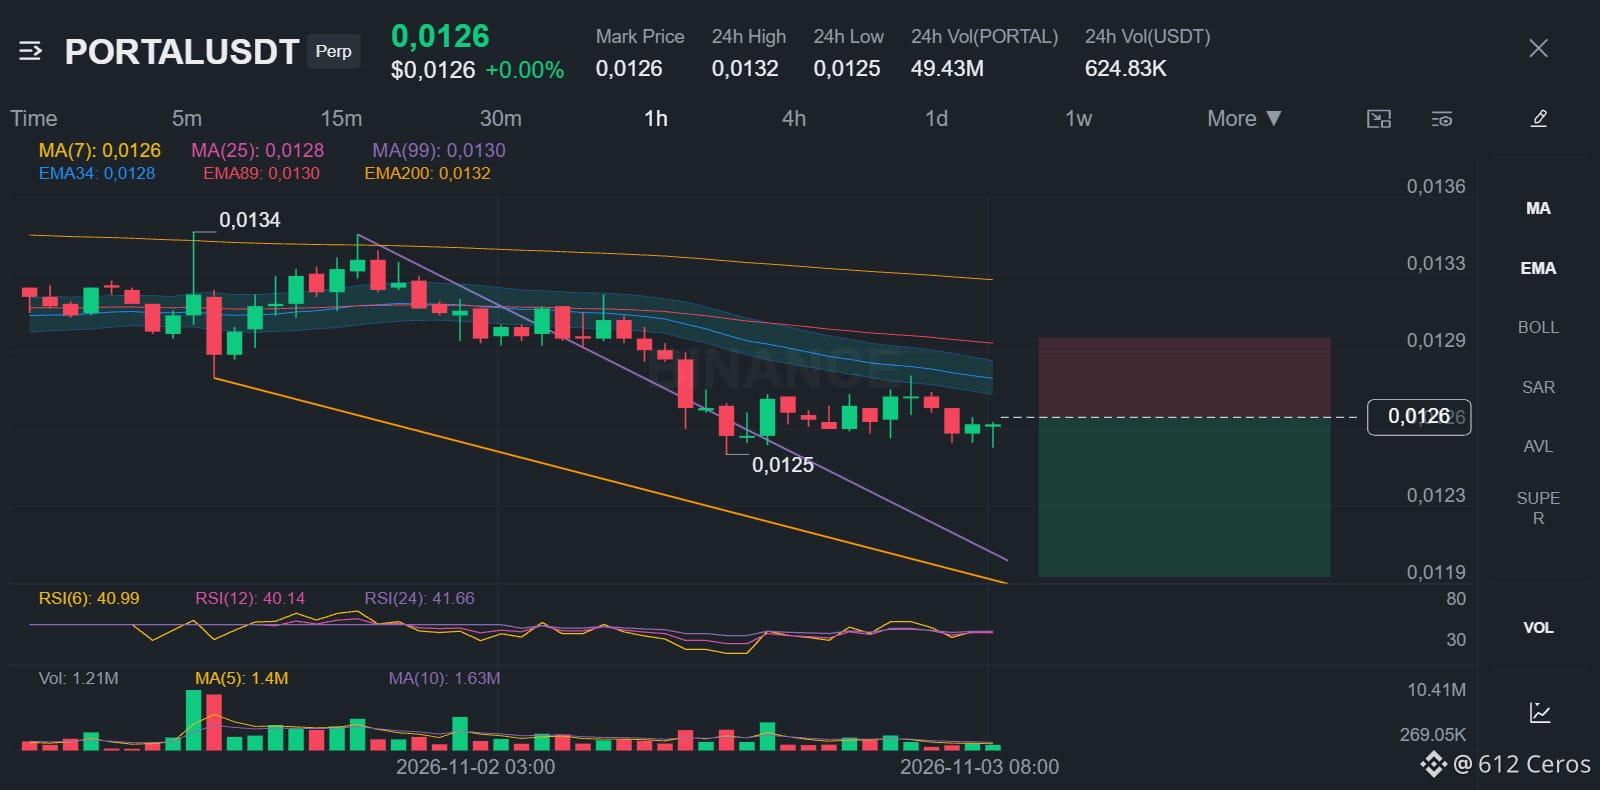
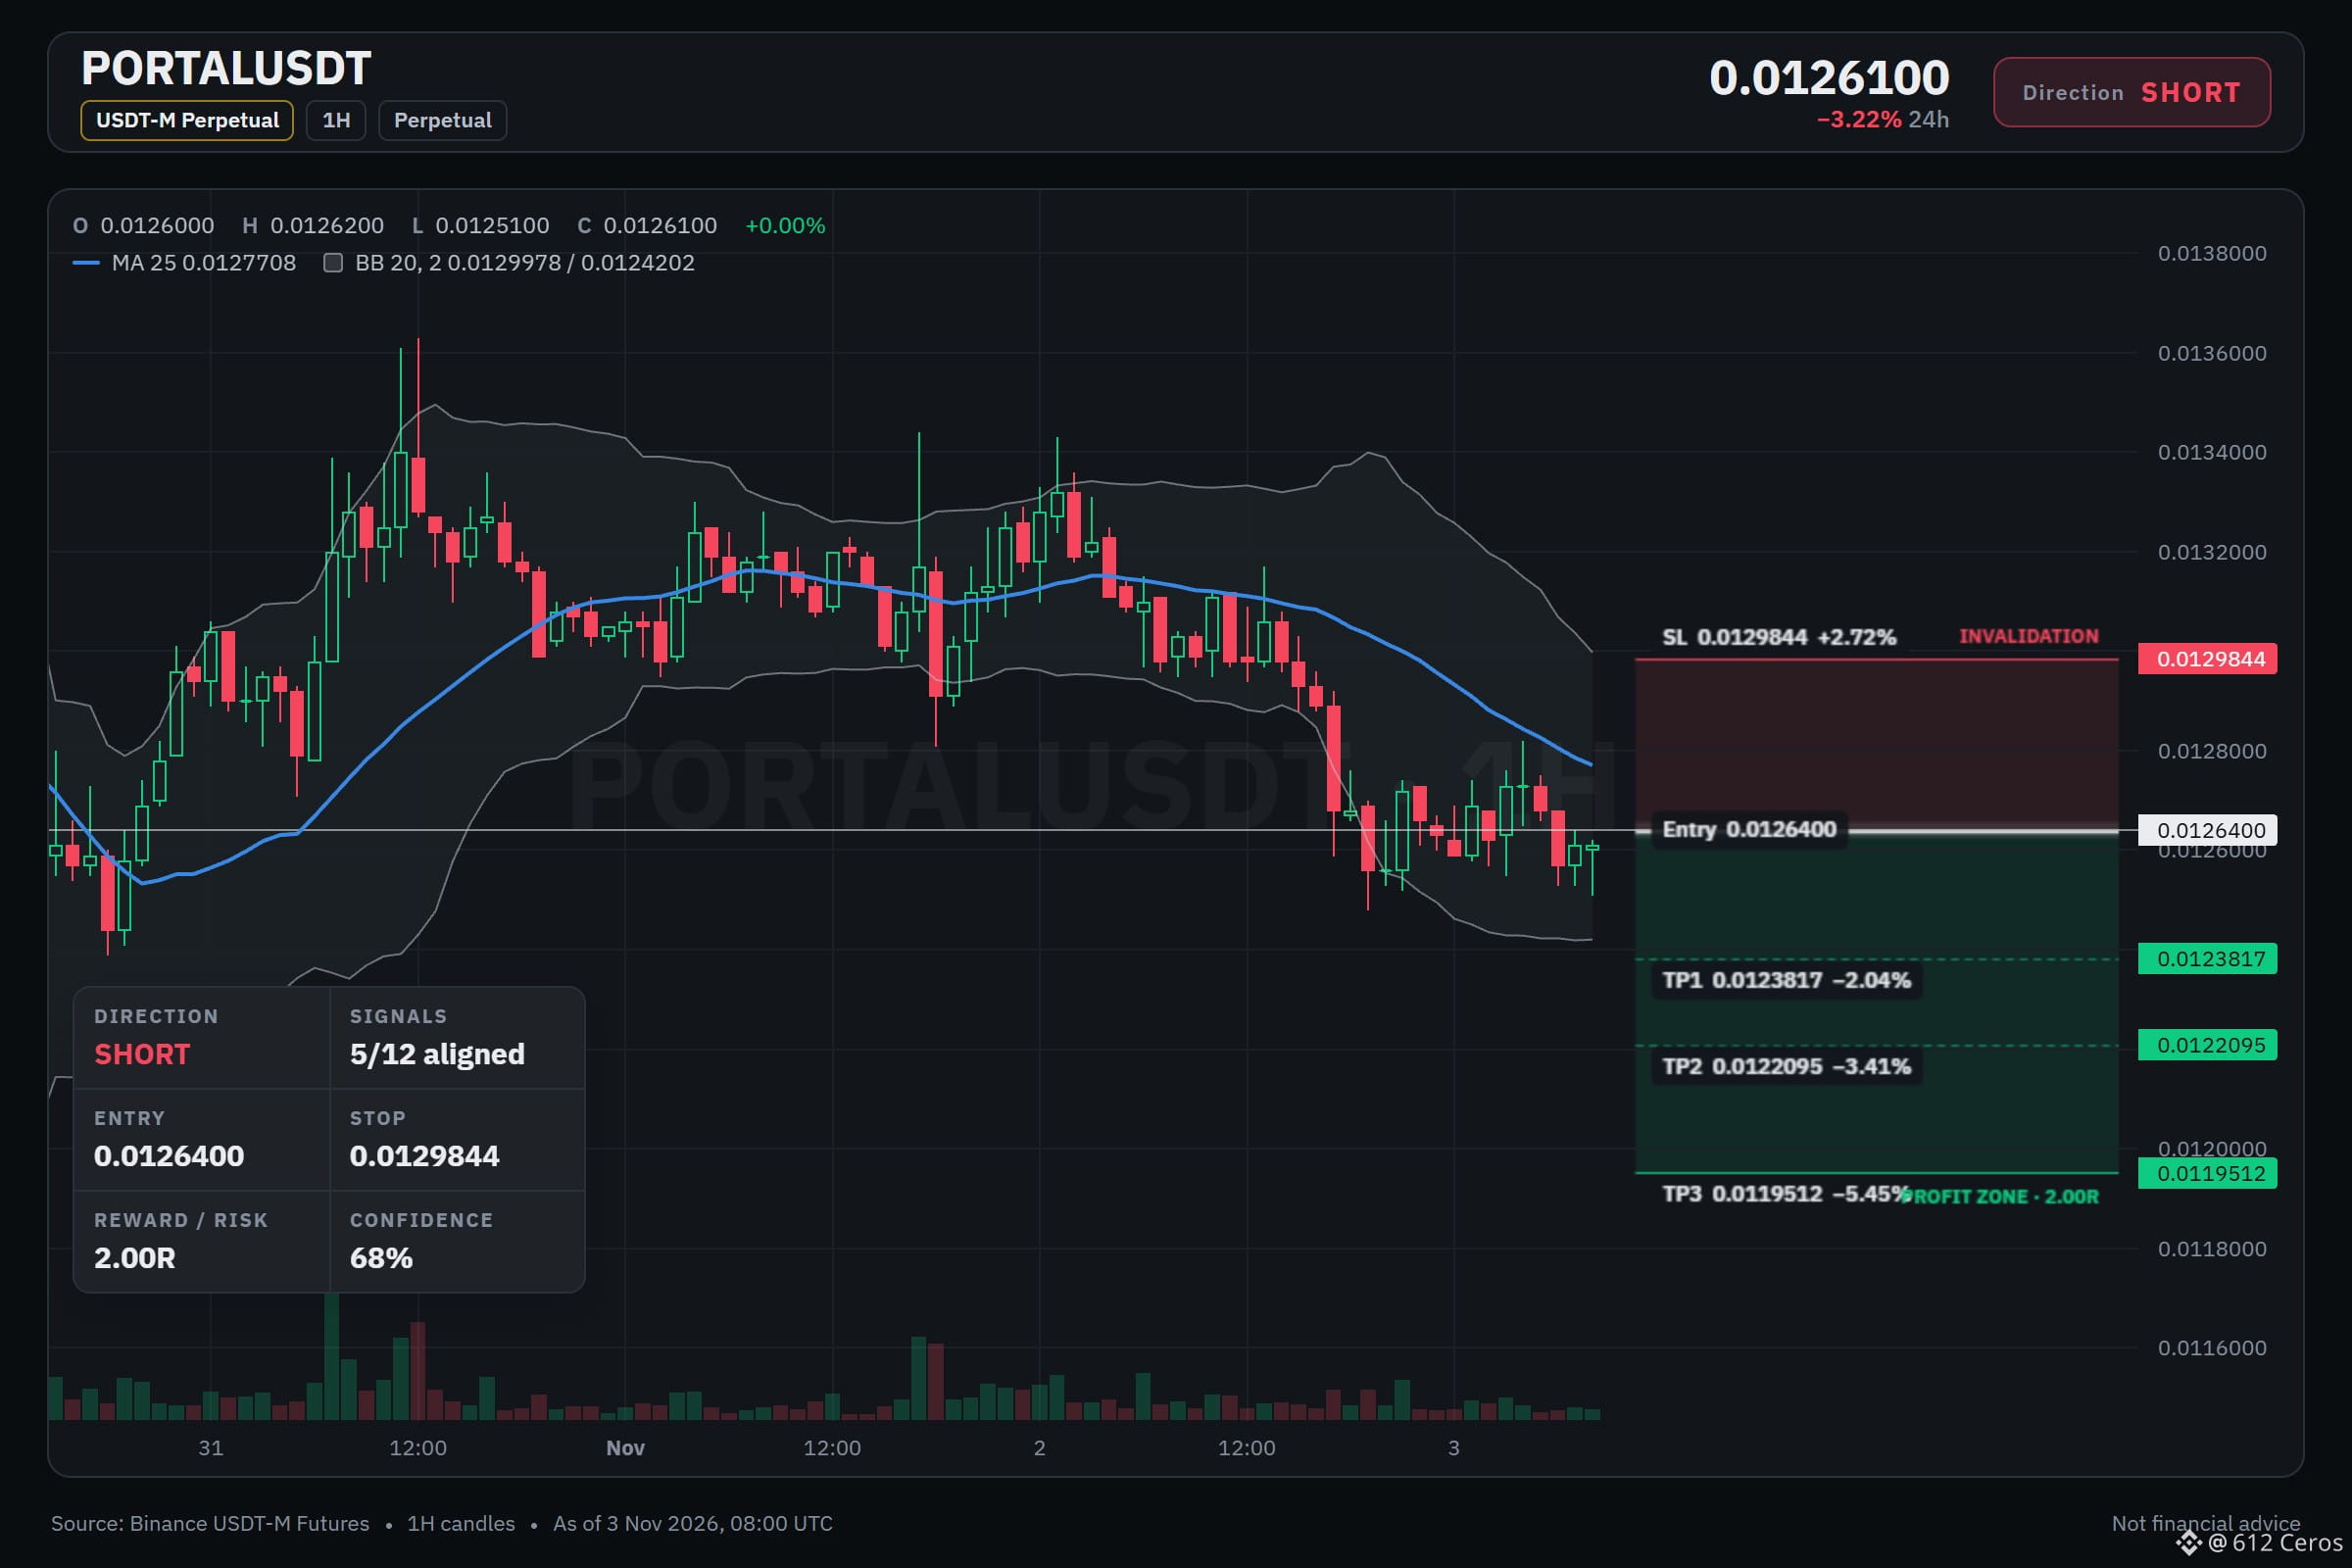
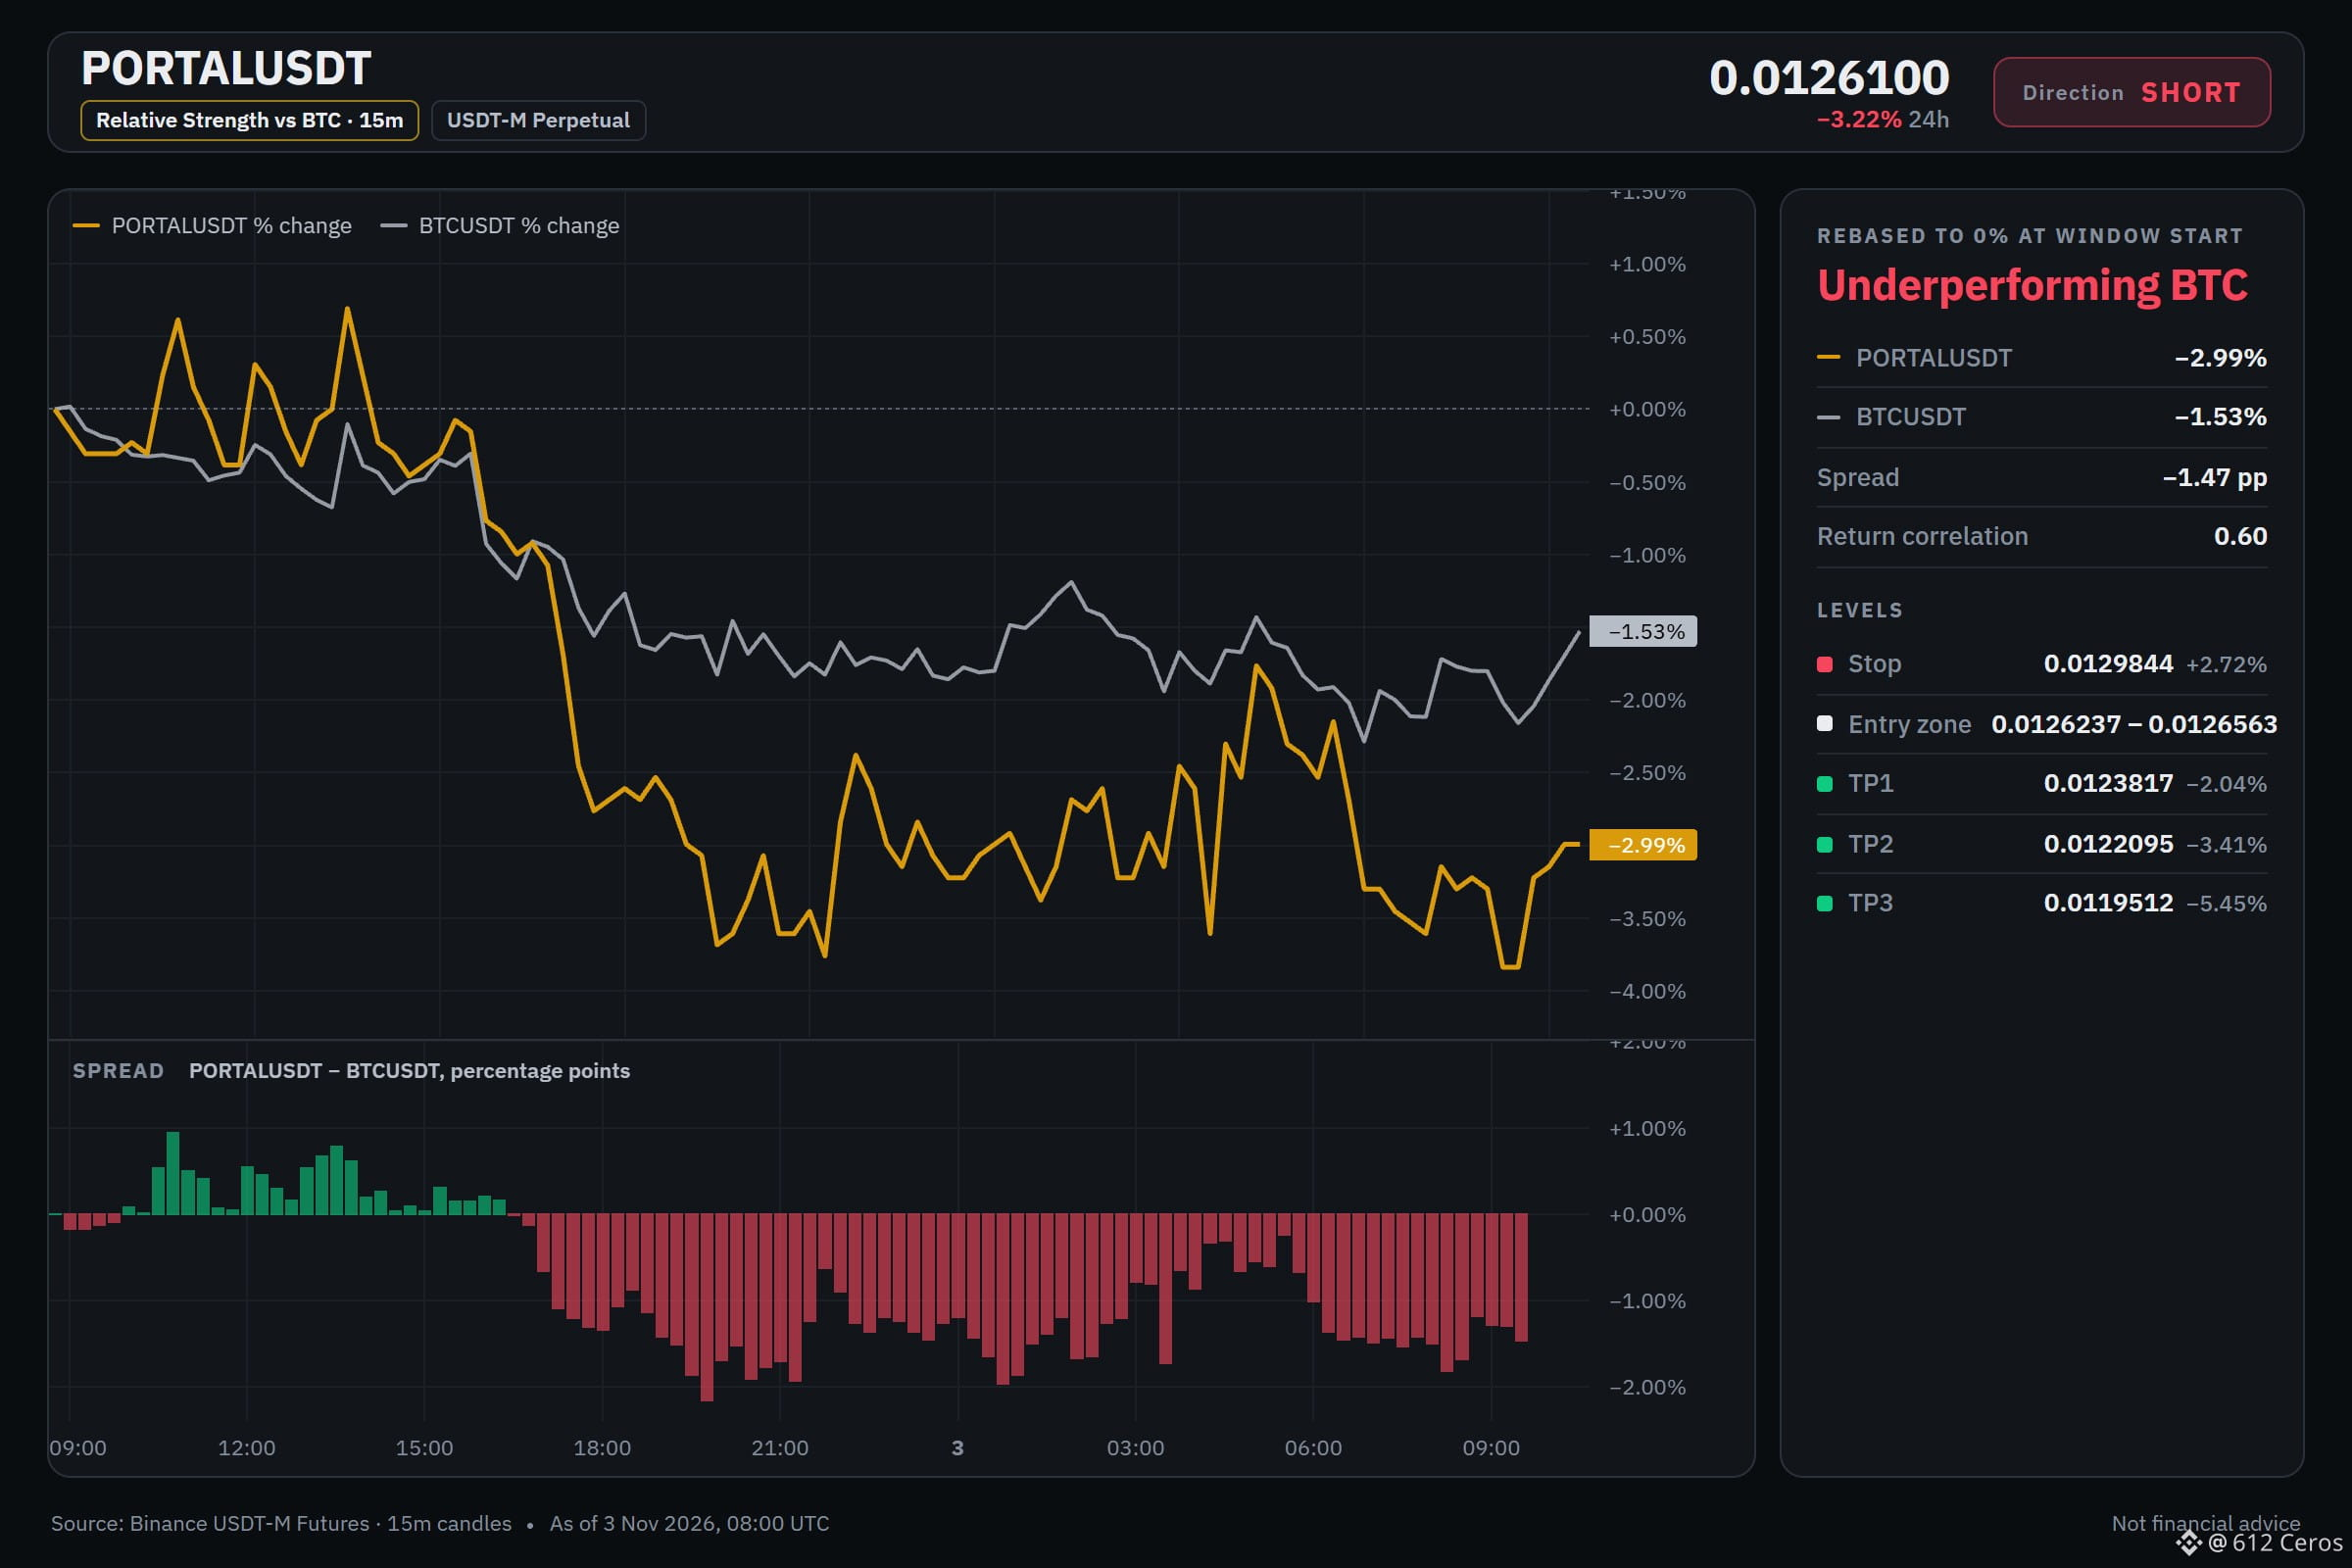
🔴 SHORT $PORTAL /USDT: expecting price to go DOWN
Bias: SHORT · Leaning
Entry: 0.0126237 – 0.0126563
TP1: 0.0123817 (-2.0%)
TP2: 0.0122095 (-3.4%)
TP3: 0.0119512 (-5.4%)
SL: 0.0129844 (+2.7%)
Plan: enter only inside the zone, close 50% at TP1, 25% at TP2, 25% at TP3, and move the stop to entry after TP1.
Note: moderate conviction only, keep size light.
Why SHORT? 5/12 signals agree, 0 against.
• 4h trend down (below EMA50 & EMA200)
• 1h trend down (below EMA50 & EMA200)
• Sellers have the momentum (4h RSI 39.5)
Quick PORTAL read:
1/3 The daily trend is range, but the 4h stack is bearish, so the swing bias favors short trades.
2/3 The 1h and 4h RSI readings sit below 45, meaning sellers keep momentum.
3/3 If the daily trend breaks above the EMA200 or if 1h momentum flips above 50, the idea fails.
What level would you use to invalidate this short?
Full setup on the chart below.
{future}(PORTALUSDT)
📲 Want more of my latest signals? Join me here:
[https://app.binance.com/uni-qr/D26WbL9t](https://app.binance.com/uni-qr/D26WbL9t)
⚠️ Personal market analysis only. NFA — manage risk and DYOR.
Educational content, not investment advice or a recommendation to buy, sell, deposit, or withdraw any asset. No paid promotion or referral/affiliate links.
The daily range hides a short bias
🔴 SHORT $PORTAL /USDT: expecting price to go DOWN
Bias: SHORT · Leaning
Entry: 0.0126237 – 0.0126563
TP1: 0.0123817 (-2.0%)
TP2: 0.0122095 (-3.4%)
TP3: 0.0119512 (-5.4%)
SL: 0.0129844 (+2.7%)
Plan: enter only inside the zone, close 50% at TP1, 25% at TP2, 25% at TP3, and move the stop to entry after TP1.
Note: moderate conviction only, keep size light.
Why SHORT? 5/12 signals agree, 0 against.
• 4h trend down (below EMA50 & EMA200)
• 1h trend down (below EMA50 & EMA200)
• Sellers have the momentum (4h RSI 39.5)
Quick PORTAL read:
1/3 The daily trend is range, but the 4h stack is bearish, so the swing bias favors short trades.
2/3 The 1h and 4h RSI readings sit below 45, meaning sellers keep momentum.
3/3 If the daily trend breaks above the EMA200 or if 1h momentum flips above 50, the idea fails.
What level would you use to invalidate this short?
Full setup on the chart below.
📲 Want more of my latest signals? Join me here:
https://app.binance.com/uni-qr/D26WbL9t
⚠️ Personal market analysis only. NFA — manage risk and DYOR.
Educational content, not investment advice or a recommendation to buy, sell, deposit, or withdraw any asset. No paid promotion or referral/affiliate links.
🔴 SHORT $PORTAL /USDT: expecting price to go DOWN
Bias: SHORT · Leaning
Entry: 0.0126237 – 0.0126563
TP1: 0.0123817 (-2.0%)
TP2: 0.0122095 (-3.4%)
TP3: 0.0119512 (-5.4%)
SL: 0.0129844 (+2.7%)
Plan: enter only inside the zone, close 50% at TP1, 25% at TP2, 25% at TP3, and move the stop to entry after TP1.
Note: moderate conviction only, keep size light.
Why SHORT? 5/12 signals agree, 0 against.
• 4h trend down (below EMA50 & EMA200)
• 1h trend down (below EMA50 & EMA200)
• Sellers have the momentum (4h RSI 39.5)
Quick PORTAL read:
1/3 The daily trend is range, but the 4h stack is bearish, so the swing bias favors short trades.
2/3 The 1h and 4h RSI readings sit below 45, meaning sellers keep momentum.
3/3 If the daily trend breaks above the EMA200 or if 1h momentum flips above 50, the idea fails.
What level would you use to invalidate this short?
Full setup on the chart below.
📲 Want more of my latest signals? Join me here:
https://app.binance.com/uni-qr/D26WbL9t
⚠️ Personal market analysis only. NFA — manage risk and DYOR.
Educational content, not investment advice or a recommendation to buy, sell, deposit, or withdraw any asset. No paid promotion or referral/affiliate links.
1
1
279
·
--
Bearish
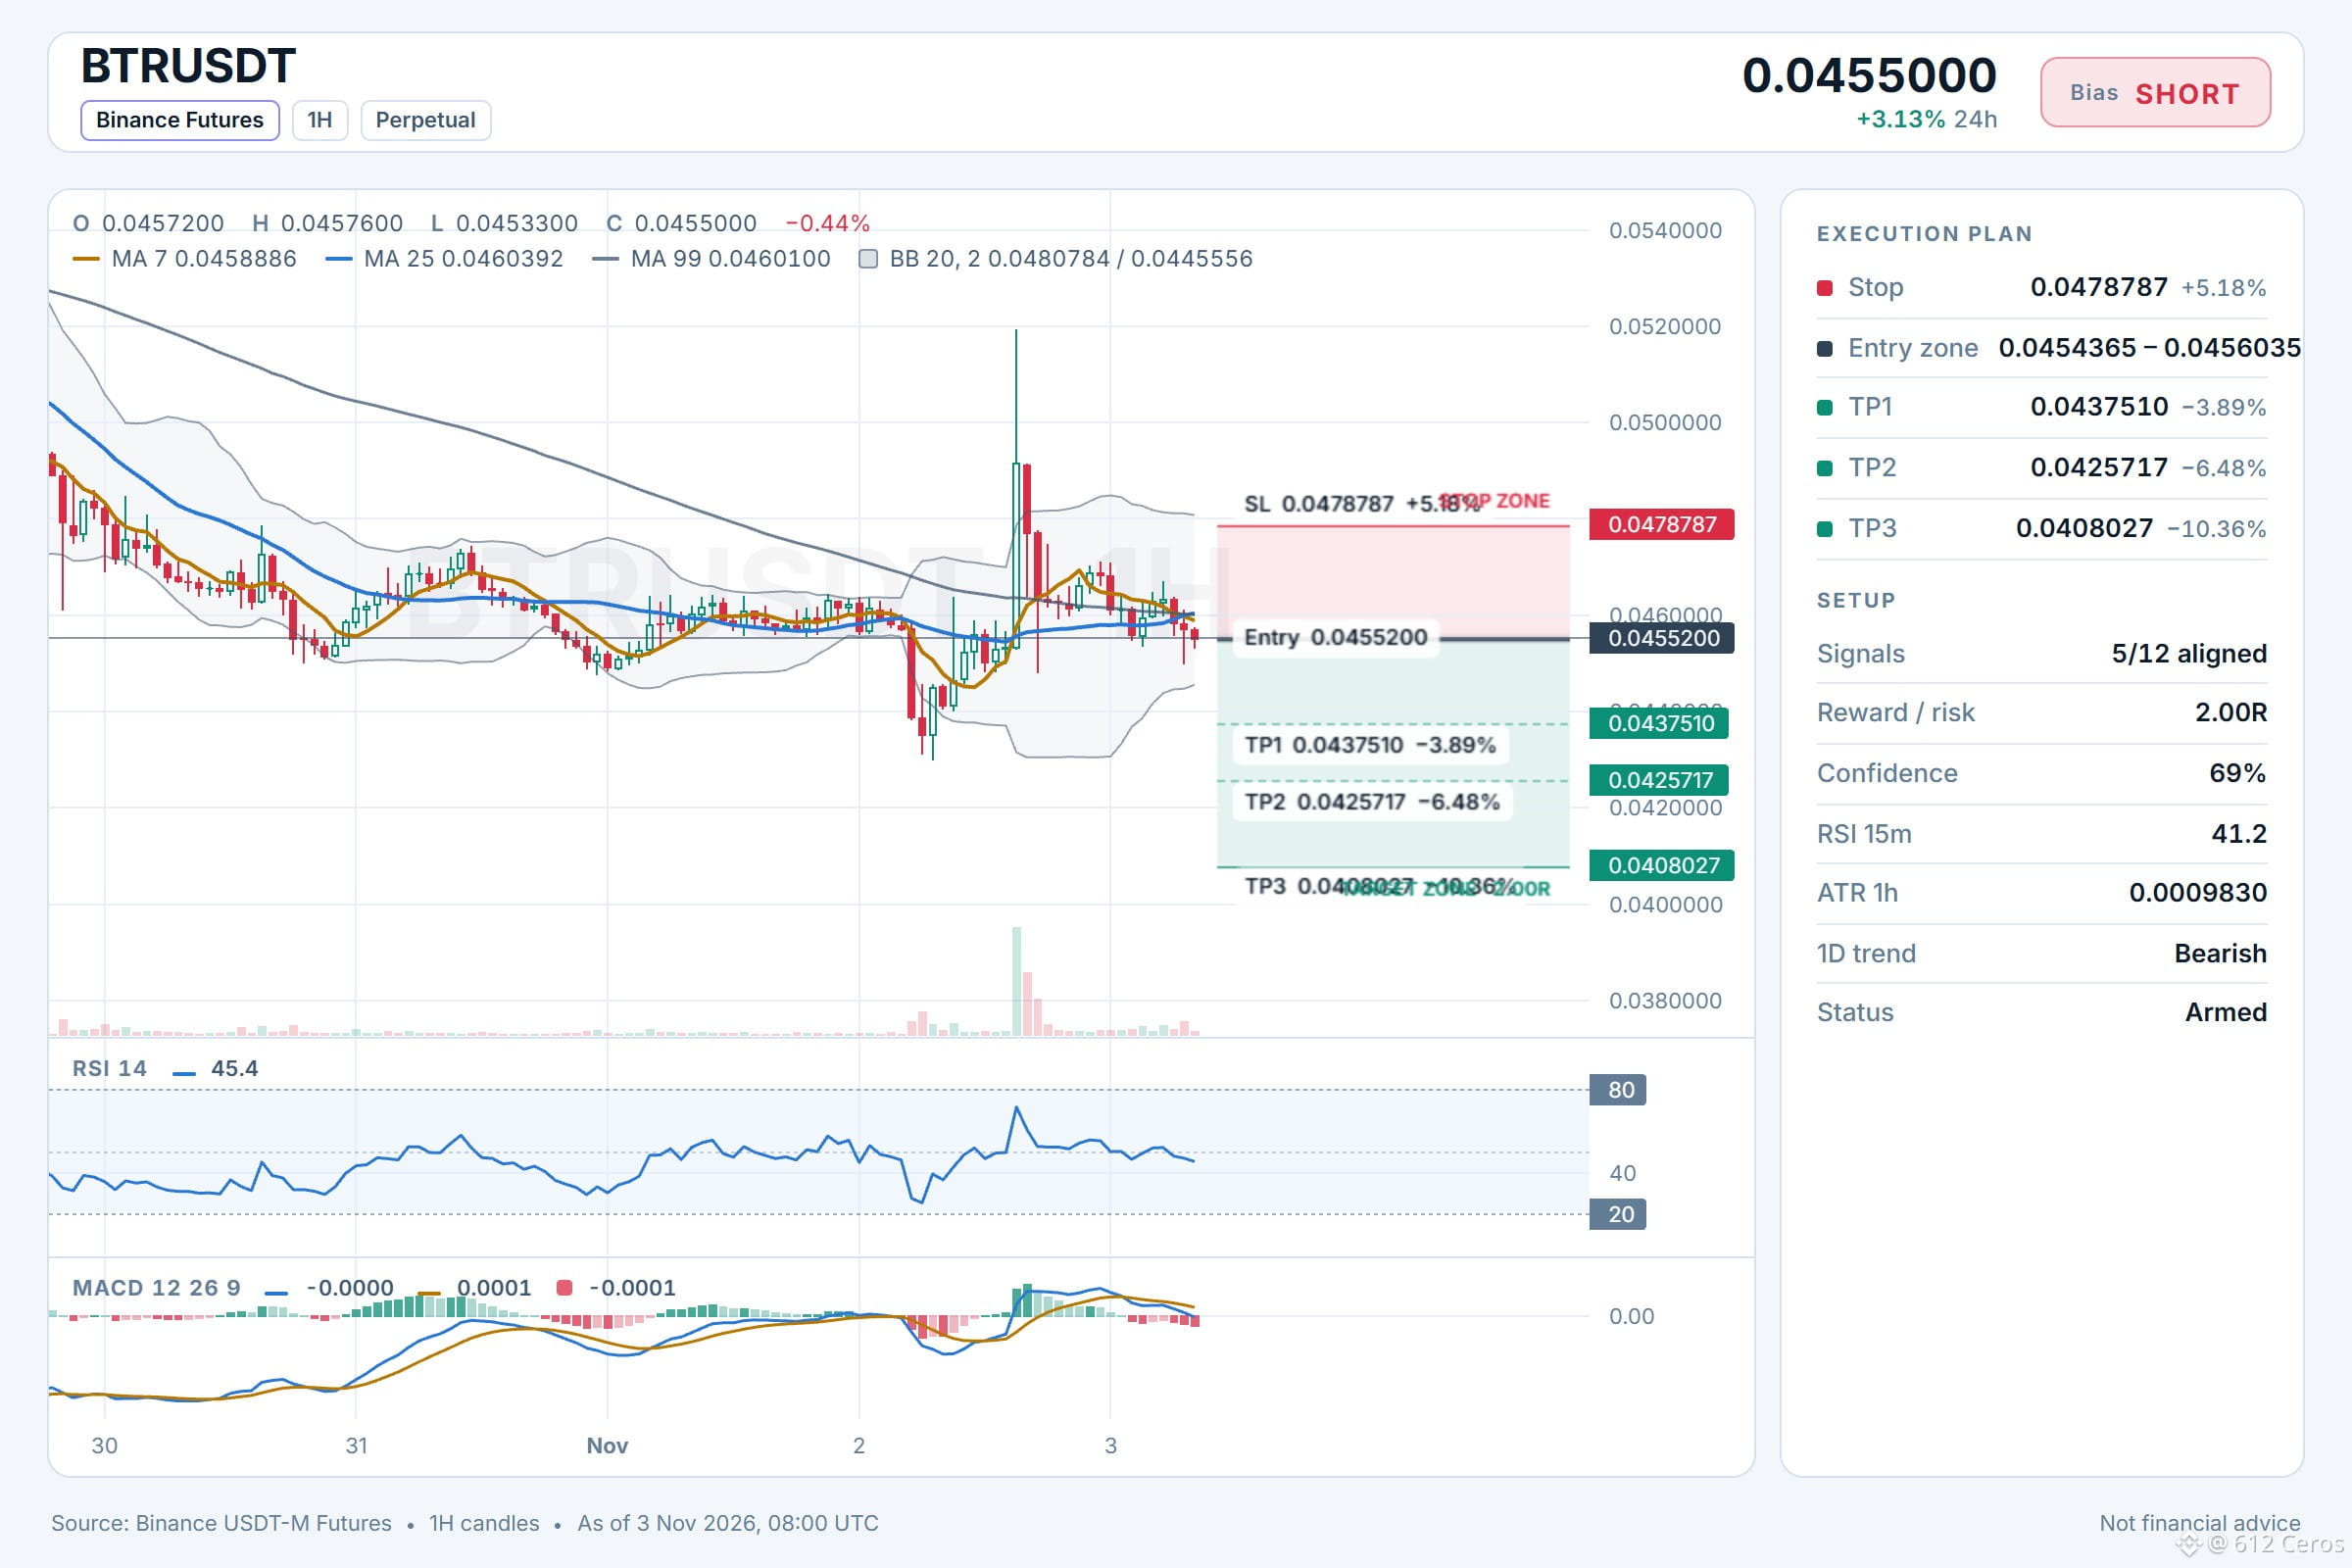
Is BTR ready to drop as the bearish stack deepens?
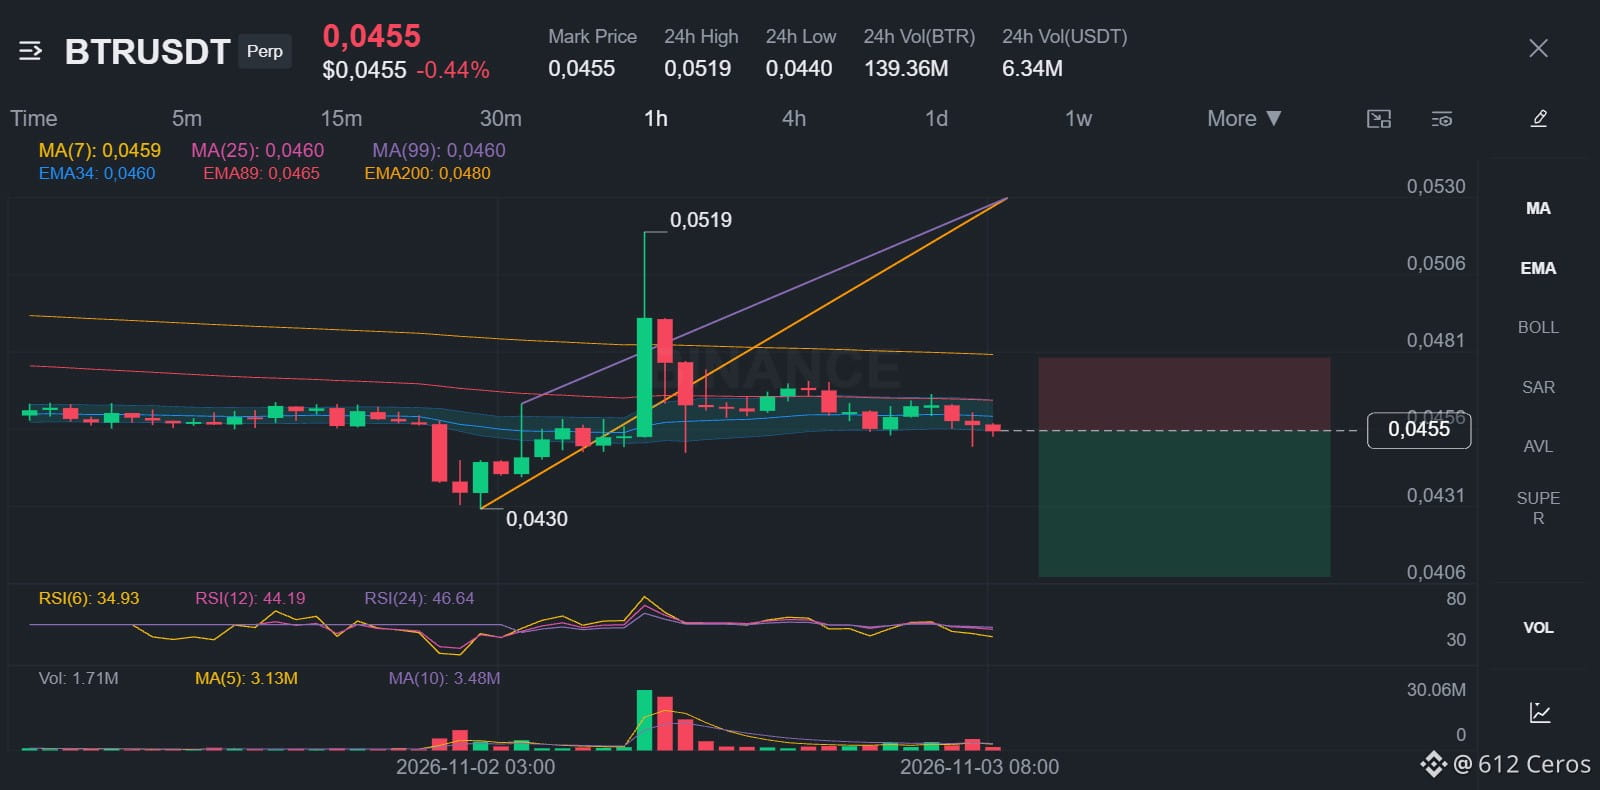
🔴 SHORT $BTR /USDT: expecting price to go DOWN
Bias: SHORT · Leaning
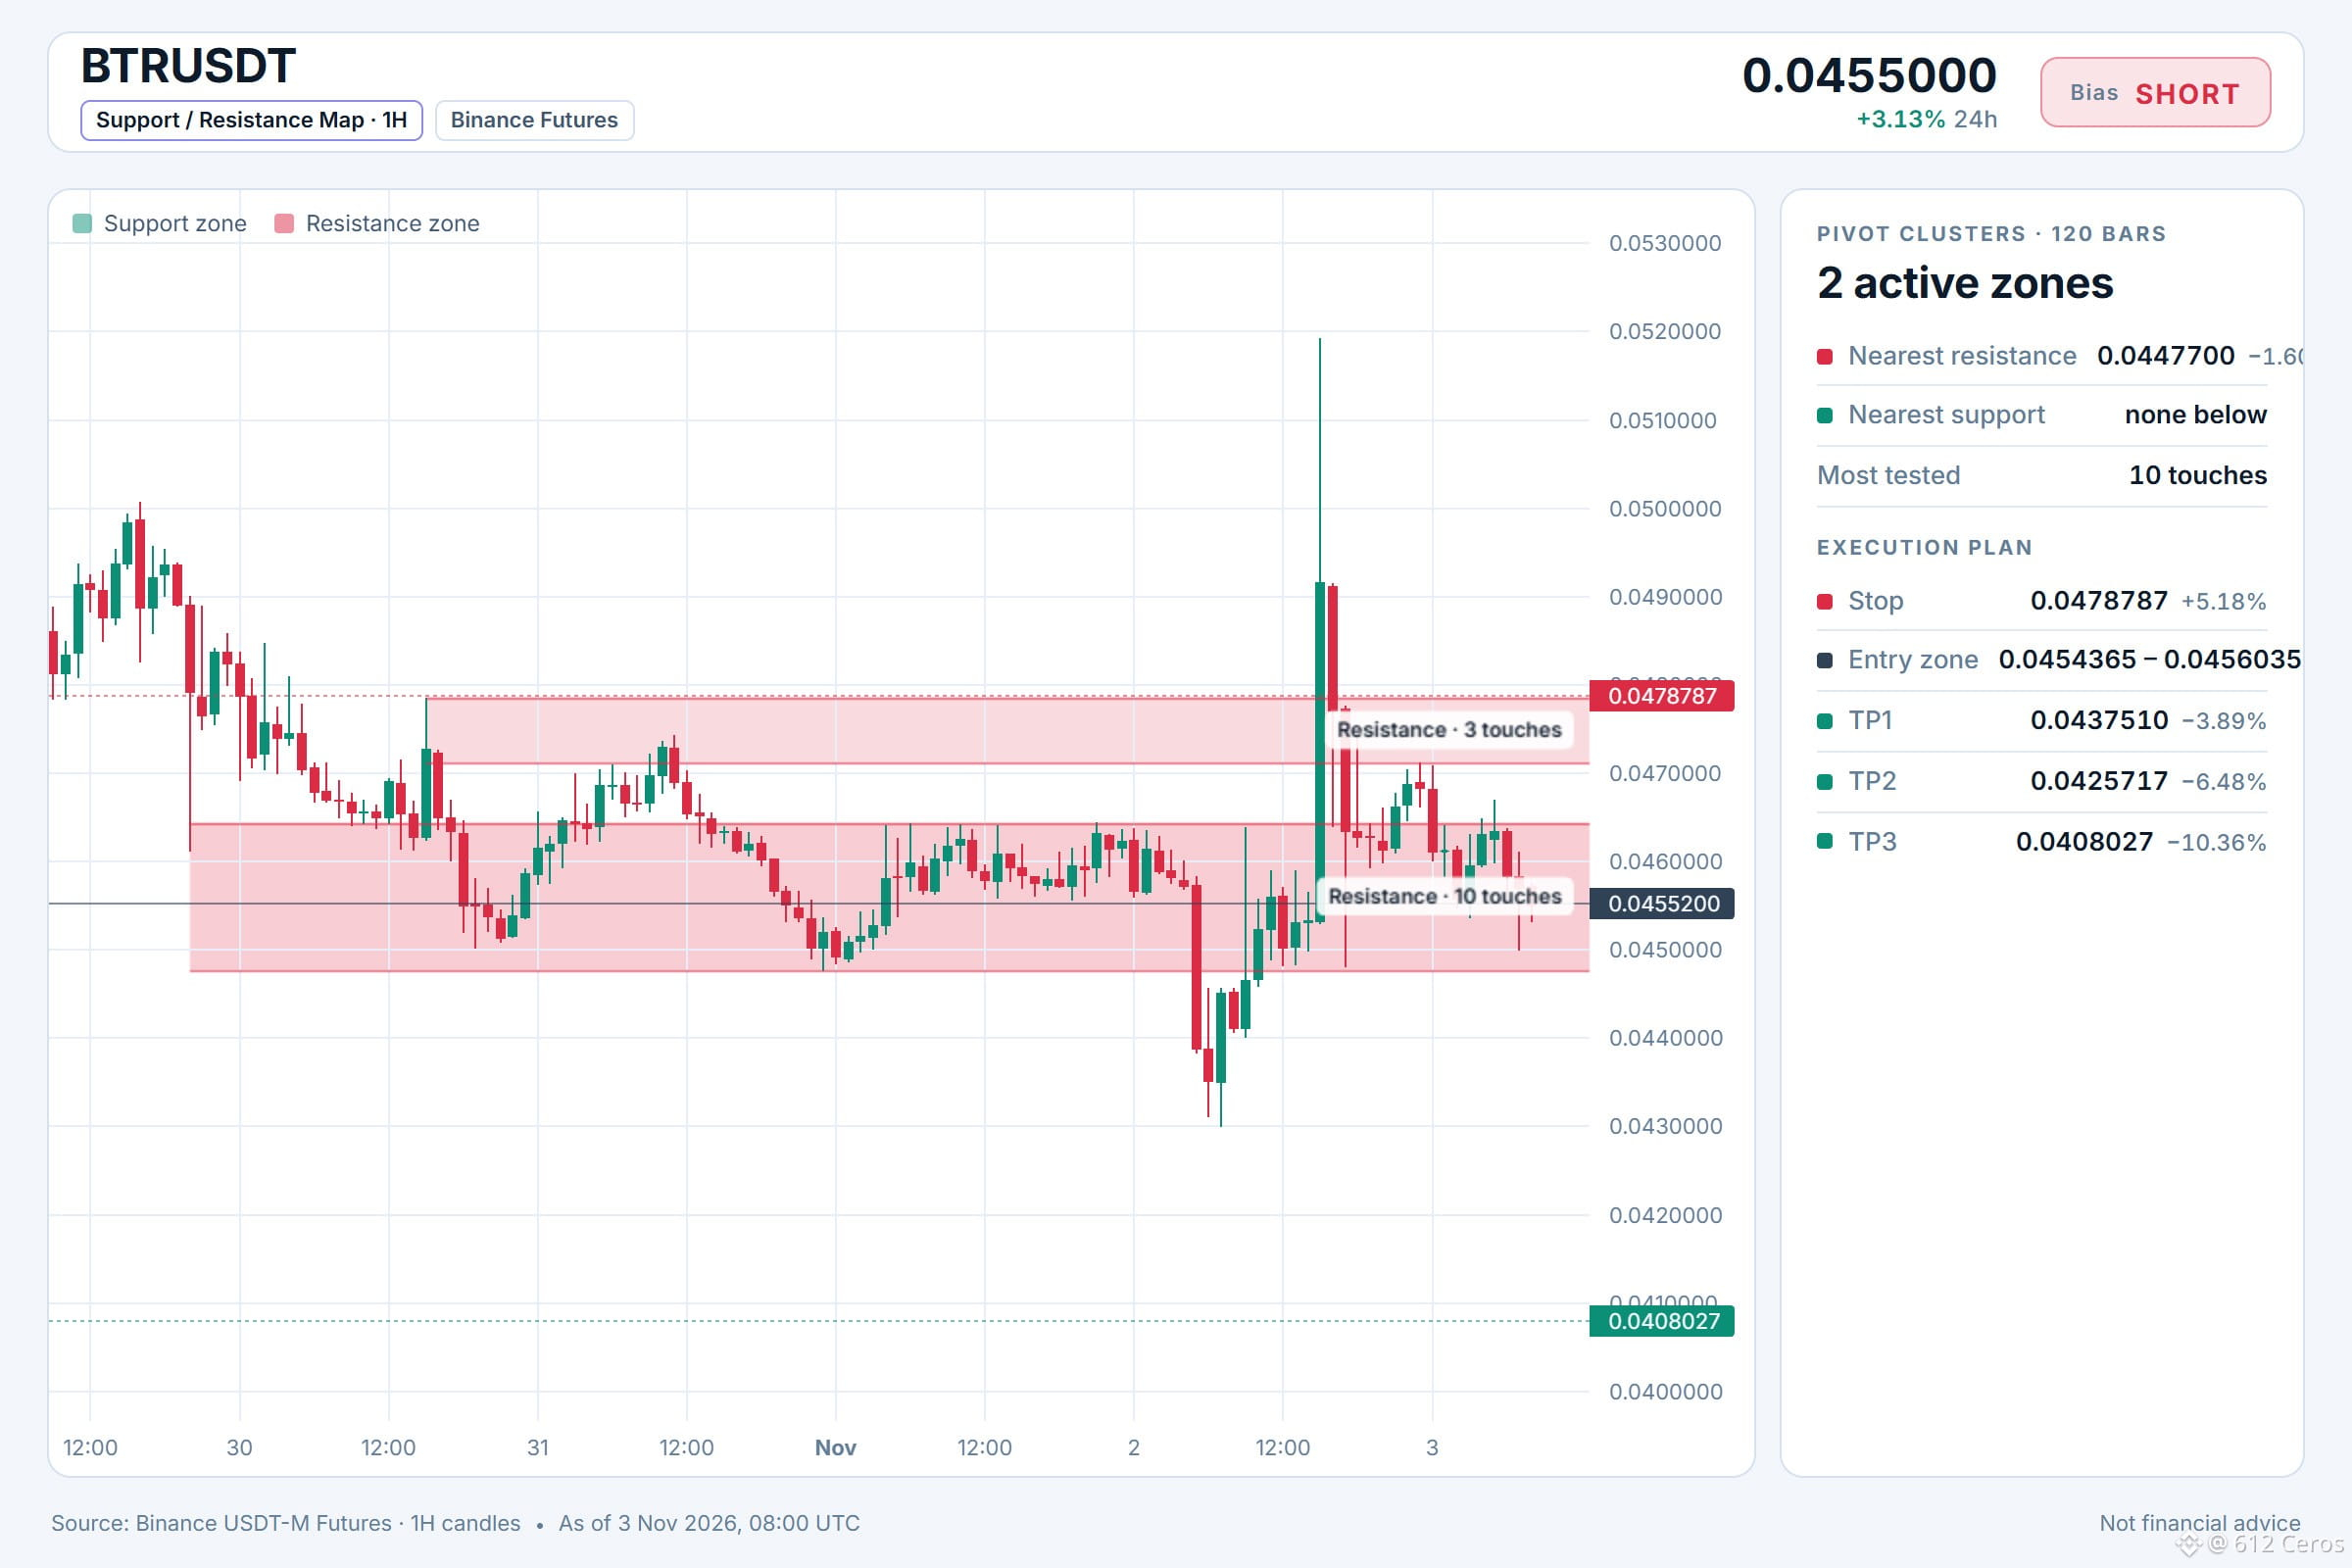
Entry: 0.0454365 – 0.0456035
TP1: 0.0437510 (-3.9%)
TP2: 0.0425717 (-6.5%)
TP3: 0.0408027 (-10.4%)
SL: 0.0478787 (+5.2%)
Plan: enter only inside the zone, close 50% at TP1, 25% at TP2, 25% at TP3, and move the stop to entry after TP1.
Note: moderate conviction only, keep size light.
Why SHORT? 5/12 signals agree, 1 against.
• Daily trend down (below EMA50 & EMA200)
• 4h trend down (below EMA50 & EMA200)
• 1h trend down (below EMA50 & EMA200)
Risk: Stronger than BTC (+3.38% 24h vs BTC)
Plan A:
If the idea works, the 1h price pushes toward the entry level at 0.0454365, then toward TP1 at 0.0437510 as the daily trend remains bearish and the 4h bearish stack holds.
Plan B (invalidation):
If the 1h price moves back above the daily EMA200 and holds there, the trend turns neutral, so I would close the position and stop the trade at the stop level 0.0478787.
Where would you place your stop on this short?
Levels mapped on the chart below.
{future}(BTRUSDT)
📲 Want more of my latest signals? Join me here:
[https://app.binance.com/uni-qr/D26WbL9t](https://app.binance.com/uni-qr/D26WbL9t)
⚠️ Personal market analysis only. NFA — manage risk and DYOR.
Educational content, not investment advice or a recommendation to buy, sell, deposit, or withdraw any asset. No paid promotion or referral/affiliate links.
Is BTR ready to drop as the bearish stack deepens?
🔴 SHORT $BTR /USDT: expecting price to go DOWN
Bias: SHORT · Leaning
Entry: 0.0454365 – 0.0456035
TP1: 0.0437510 (-3.9%)
TP2: 0.0425717 (-6.5%)
TP3: 0.0408027 (-10.4%)
SL: 0.0478787 (+5.2%)
Plan: enter only inside the zone, close 50% at TP1, 25% at TP2, 25% at TP3, and move the stop to entry after TP1.
Note: moderate conviction only, keep size light.
Why SHORT? 5/12 signals agree, 1 against.
• Daily trend down (below EMA50 & EMA200)
• 4h trend down (below EMA50 & EMA200)
• 1h trend down (below EMA50 & EMA200)
Risk: Stronger than BTC (+3.38% 24h vs BTC)
Plan A:
If the idea works, the 1h price pushes toward the entry level at 0.0454365, then toward TP1 at 0.0437510 as the daily trend remains bearish and the 4h bearish stack holds.
Plan B (invalidation):
If the 1h price moves back above the daily EMA200 and holds there, the trend turns neutral, so I would close the position and stop the trade at the stop level 0.0478787.
Where would you place your stop on this short?
Levels mapped on the chart below.
📲 Want more of my latest signals? Join me here:
https://app.binance.com/uni-qr/D26WbL9t
⚠️ Personal market analysis only. NFA — manage risk and DYOR.
Educational content, not investment advice or a recommendation to buy, sell, deposit, or withdraw any asset. No paid promotion or referral/affiliate links.
🔴 SHORT $BTR /USDT: expecting price to go DOWN
Bias: SHORT · Leaning
Entry: 0.0454365 – 0.0456035
TP1: 0.0437510 (-3.9%)
TP2: 0.0425717 (-6.5%)
TP3: 0.0408027 (-10.4%)
SL: 0.0478787 (+5.2%)
Plan: enter only inside the zone, close 50% at TP1, 25% at TP2, 25% at TP3, and move the stop to entry after TP1.
Note: moderate conviction only, keep size light.
Why SHORT? 5/12 signals agree, 1 against.
• Daily trend down (below EMA50 & EMA200)
• 4h trend down (below EMA50 & EMA200)
• 1h trend down (below EMA50 & EMA200)
Risk: Stronger than BTC (+3.38% 24h vs BTC)
Plan A:
If the idea works, the 1h price pushes toward the entry level at 0.0454365, then toward TP1 at 0.0437510 as the daily trend remains bearish and the 4h bearish stack holds.
Plan B (invalidation):
If the 1h price moves back above the daily EMA200 and holds there, the trend turns neutral, so I would close the position and stop the trade at the stop level 0.0478787.
Where would you place your stop on this short?
Levels mapped on the chart below.
📲 Want more of my latest signals? Join me here:
https://app.binance.com/uni-qr/D26WbL9t
⚠️ Personal market analysis only. NFA — manage risk and DYOR.
Educational content, not investment advice or a recommendation to buy, sell, deposit, or withdraw any asset. No paid promotion or referral/affiliate links.
1
265
·
--
Bearish
The coin is trapped below a bearish stack.
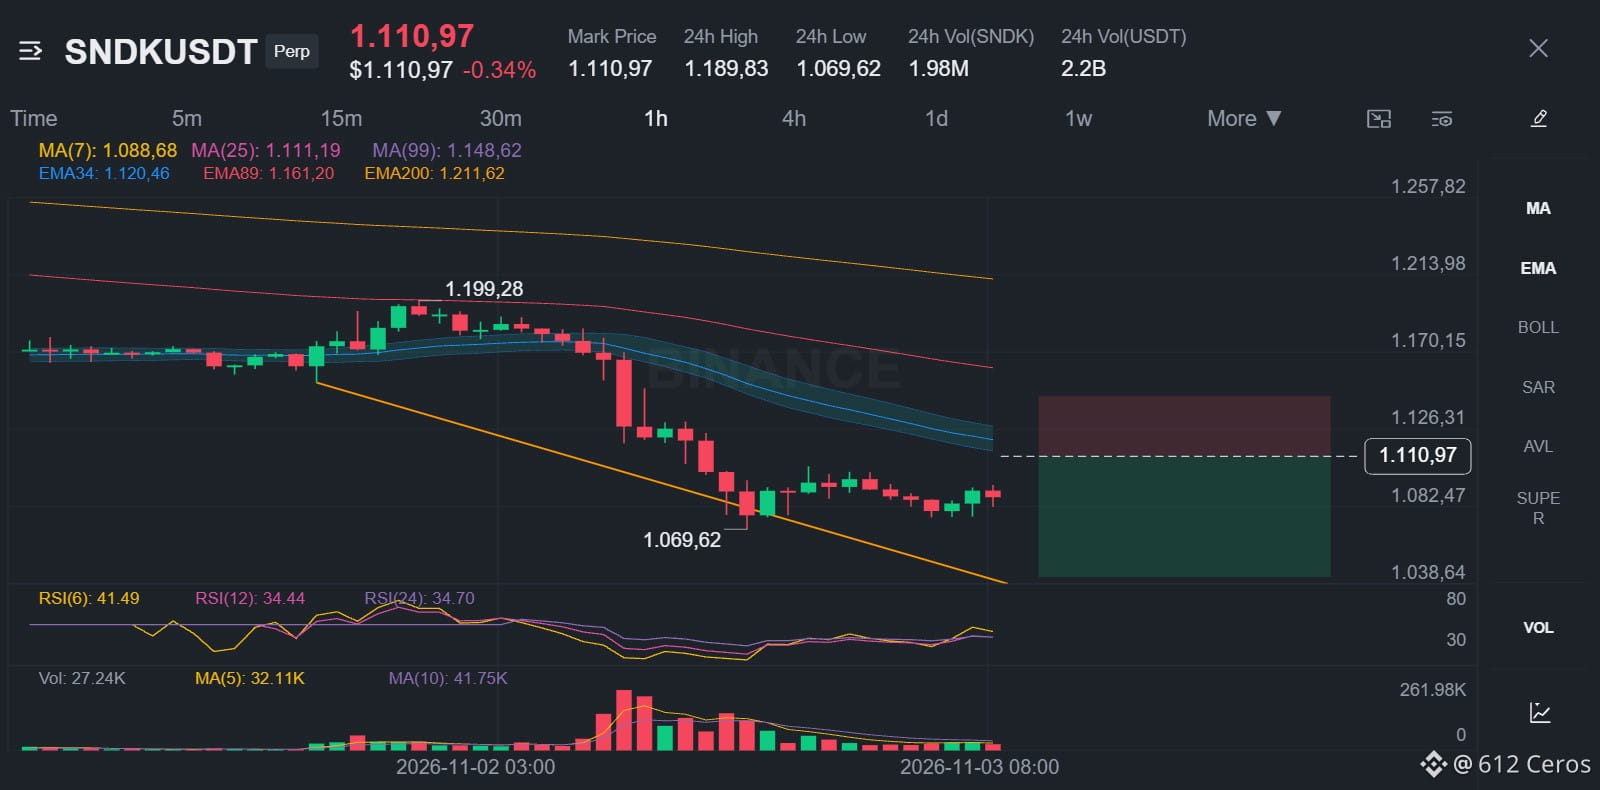
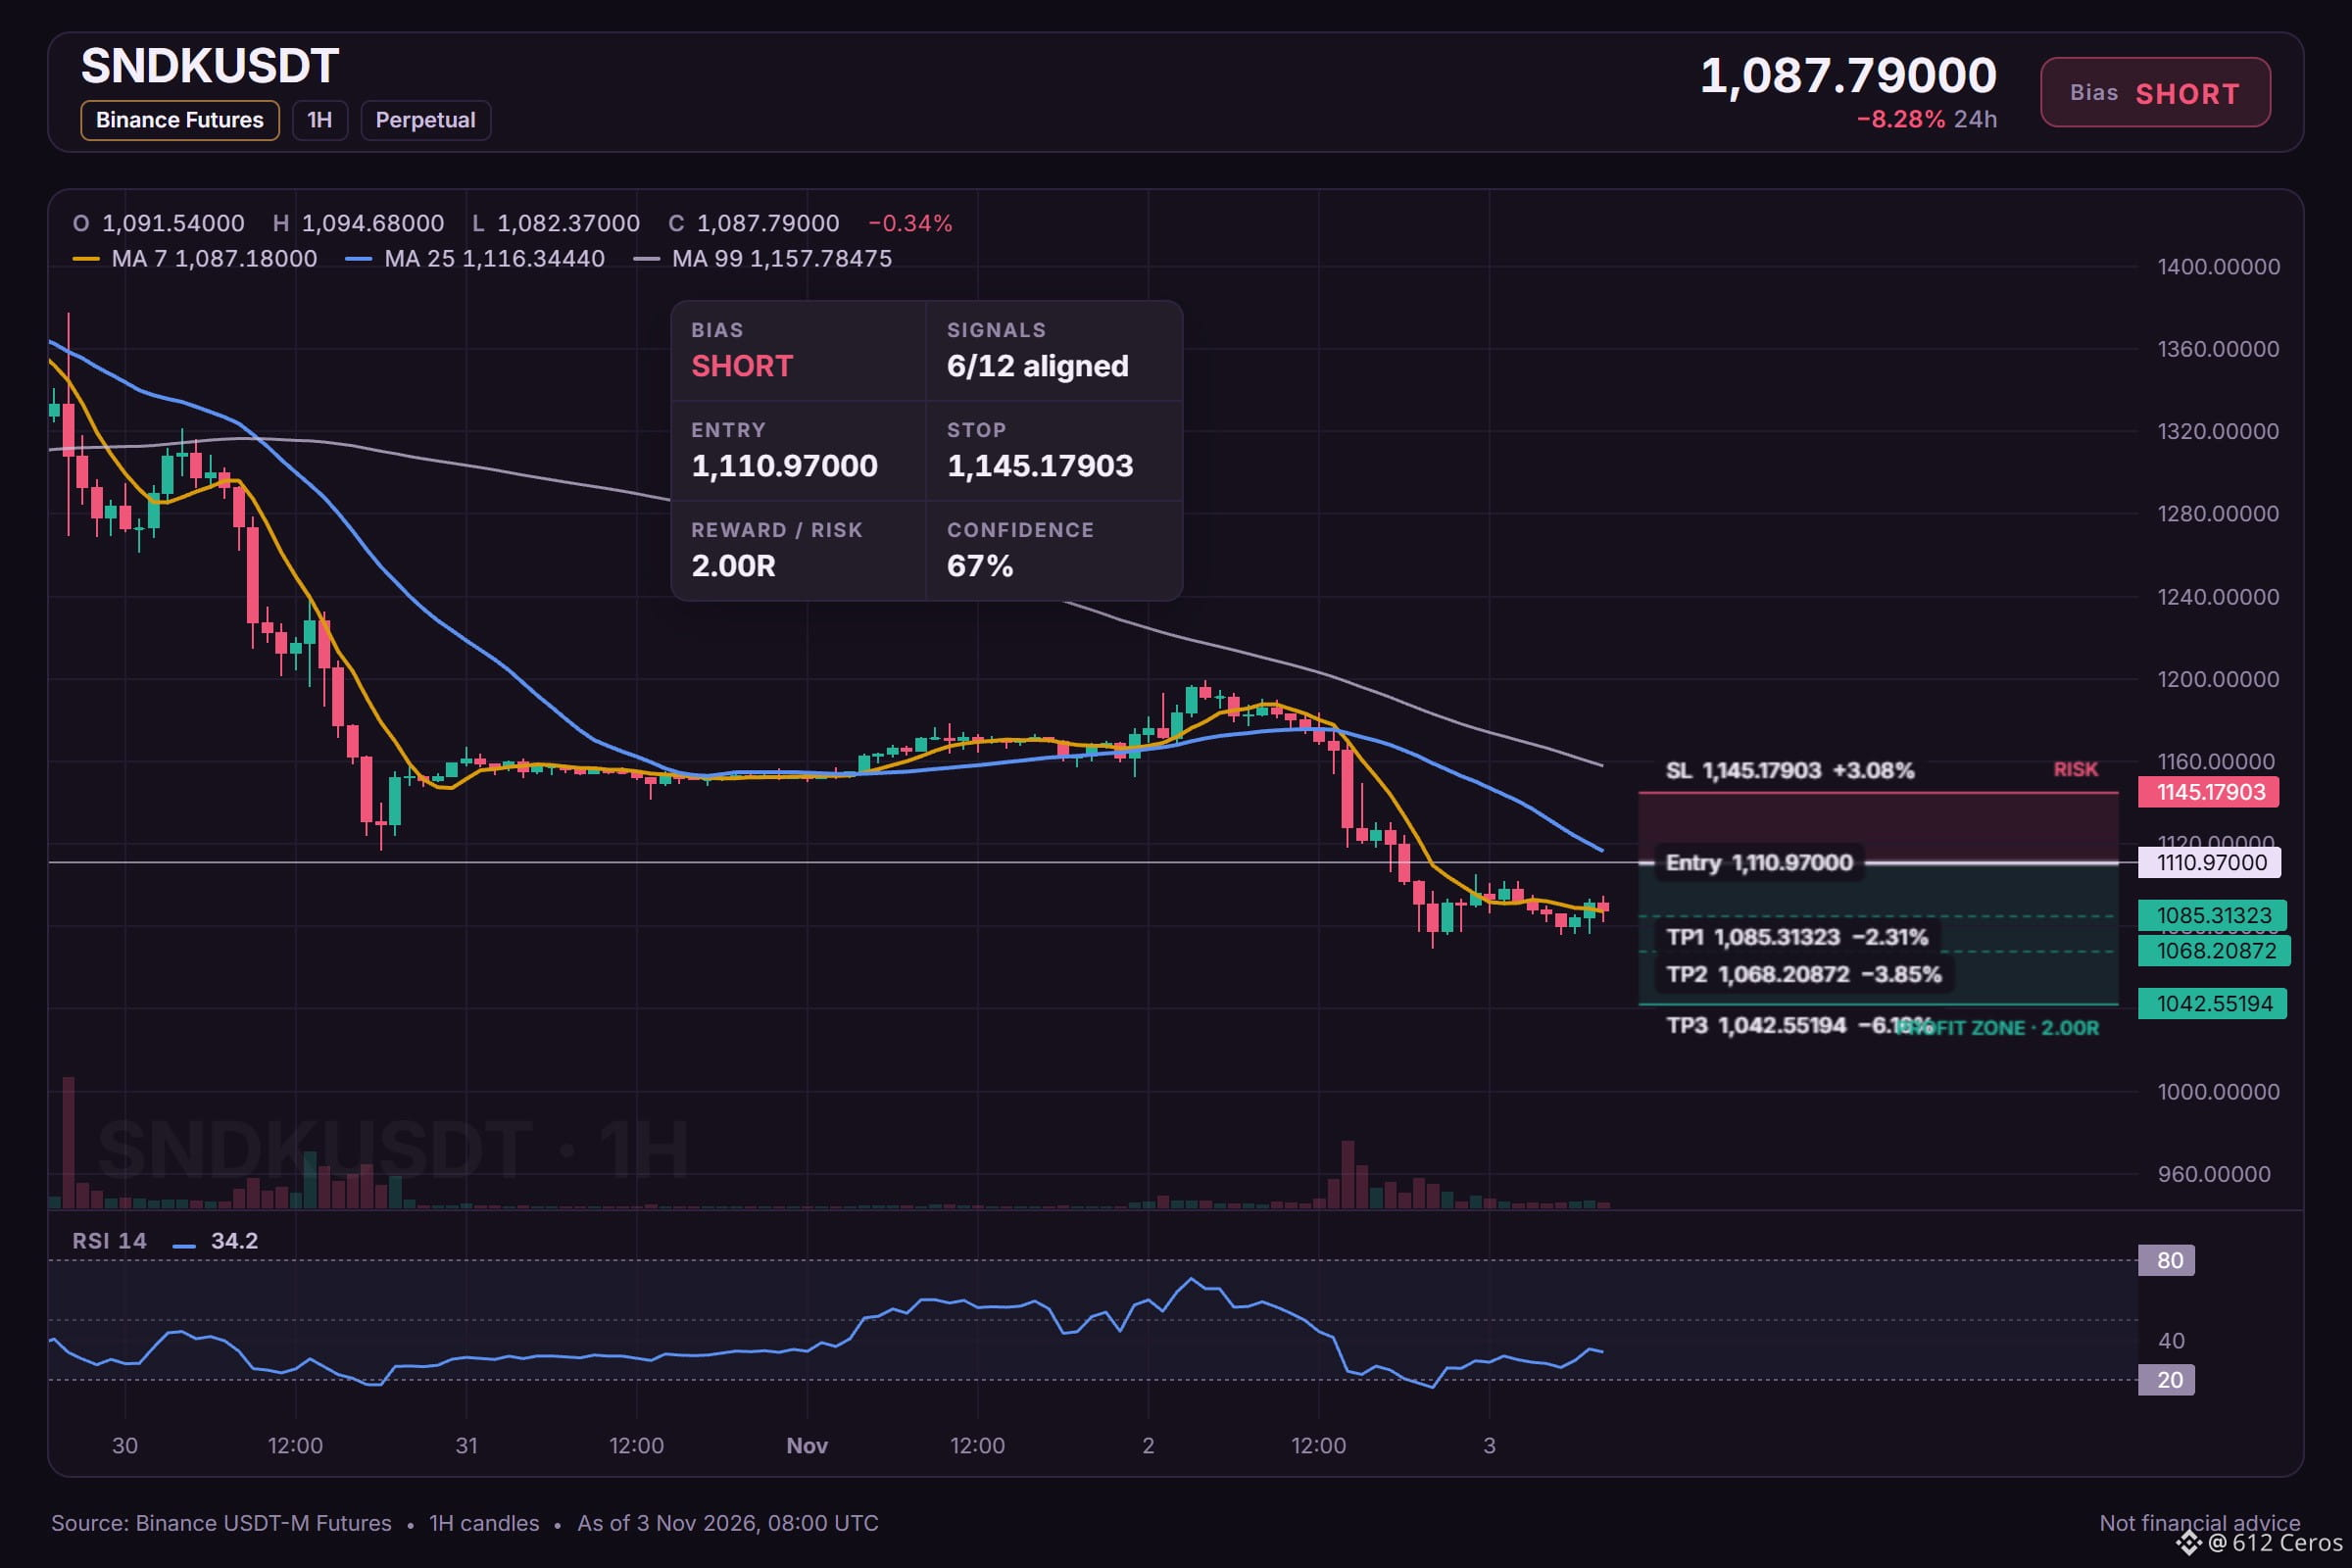
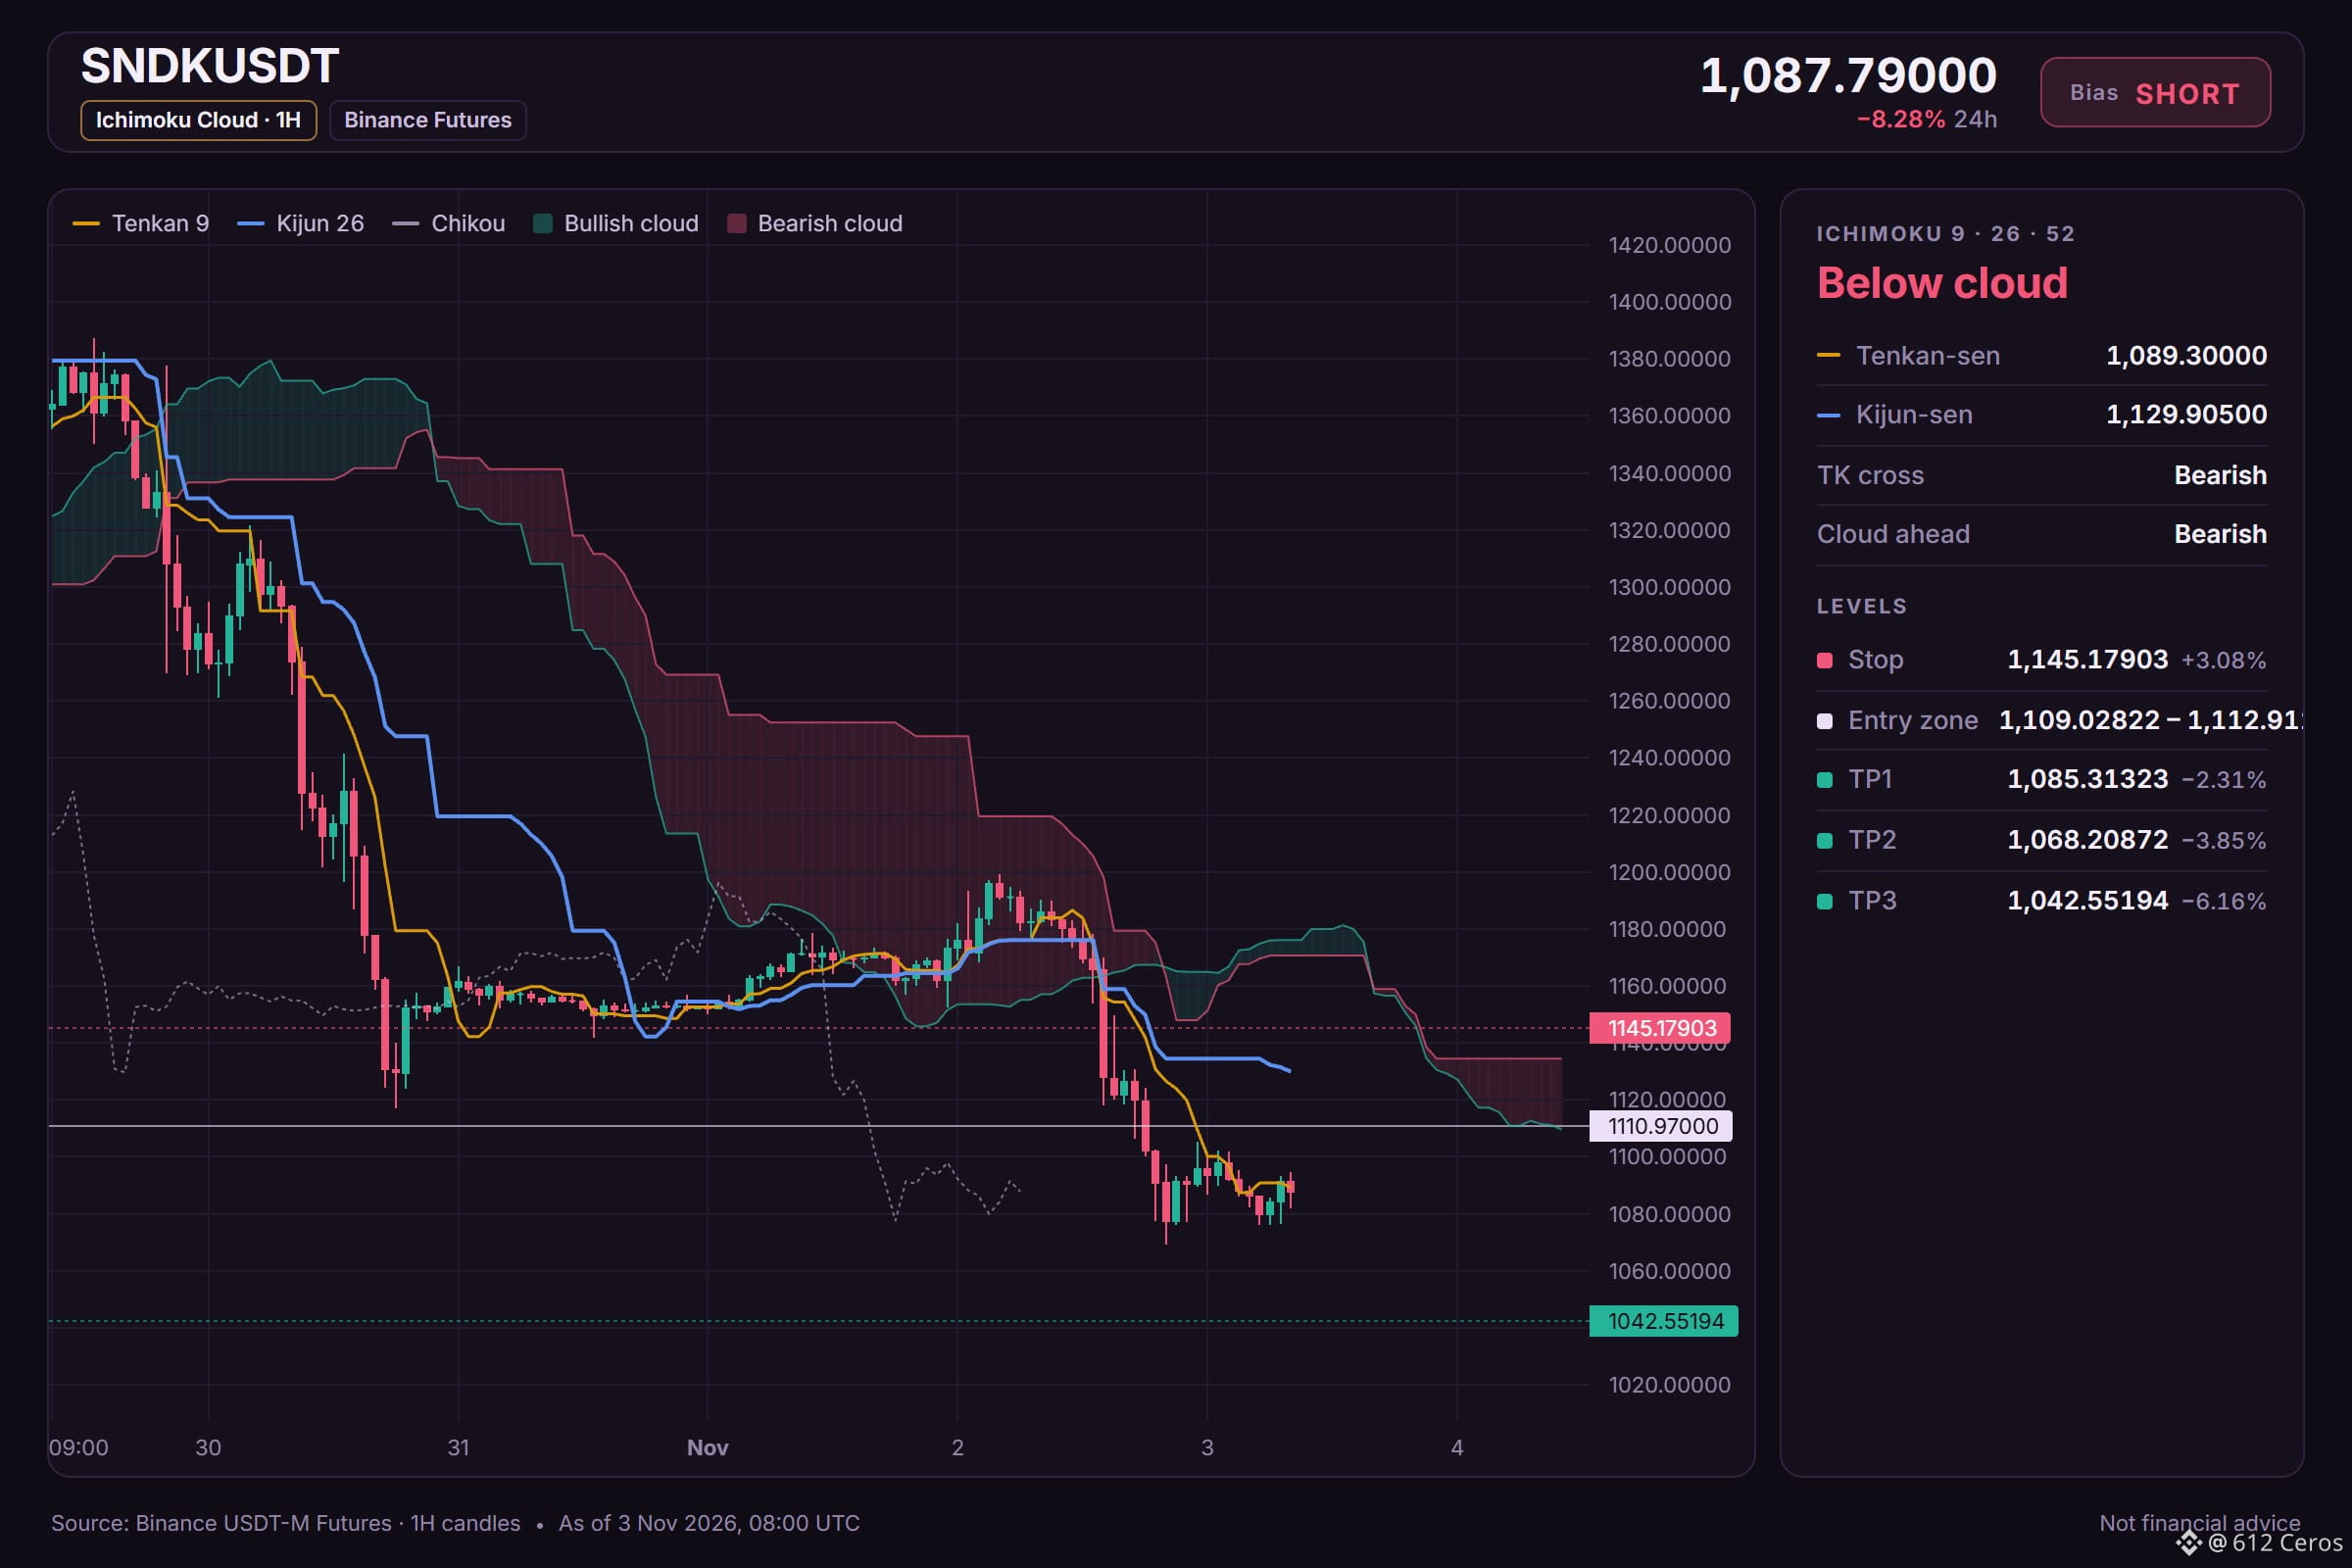
🔴 SHORT $SNDK /USDT: expecting price to go DOWN
Bias: SHORT · Strong
Entry: 1109.02822 – 1112.91178
TP1: 1085.31323 (-2.3%)
TP2: 1068.20872 (-3.8%)
TP3: 1042.55194 (-6.2%)
SL: 1145.17903 (+3.1%)
Plan: enter only inside the zone, close 50% at TP1, 25% at TP2, 25% at TP3, and move the stop to entry after TP1.
Why SHORT? SNDK checklist: 6/12 agree, 2 against.
• Daily trend down (below EMA50 & EMA200)
• 4h trend down (below EMA50 & EMA200)
• 1h trend down (below EMA50 & EMA200)
Watch: Buyers are driving the move (15m ADX 25.2)
Watch: The idea is wrong if price reaches the stop at 1145.17903
Bottom line: The daily, 4h, and 1h bearish stacks show the trend is down, but the 15m ADX shows buyers are driving the move.
What level would make you take the opposite side?
Full setup on the chart below.
{future}(SNDKUSDT)
📲 Want more of my latest signals? Join me here:
[https://app.binance.com/uni-qr/D26WbL9t](https://app.binance.com/uni-qr/D26WbL9t)
⚠️ Personal market analysis only. NFA — manage risk and DYOR.
Educational content, not investment advice or a recommendation to buy, sell, deposit, or withdraw any asset. No paid promotion or referral/affiliate links.
The coin is trapped below a bearish stack.
🔴 SHORT $SNDK /USDT: expecting price to go DOWN
Bias: SHORT · Strong
Entry: 1109.02822 – 1112.91178
TP1: 1085.31323 (-2.3%)
TP2: 1068.20872 (-3.8%)
TP3: 1042.55194 (-6.2%)
SL: 1145.17903 (+3.1%)
Plan: enter only inside the zone, close 50% at TP1, 25% at TP2, 25% at TP3, and move the stop to entry after TP1.
Why SHORT? SNDK checklist: 6/12 agree, 2 against.
• Daily trend down (below EMA50 & EMA200)
• 4h trend down (below EMA50 & EMA200)
• 1h trend down (below EMA50 & EMA200)
Watch: Buyers are driving the move (15m ADX 25.2)
Watch: The idea is wrong if price reaches the stop at 1145.17903
Bottom line: The daily, 4h, and 1h bearish stacks show the trend is down, but the 15m ADX shows buyers are driving the move.
What level would make you take the opposite side?
Full setup on the chart below.
📲 Want more of my latest signals? Join me here:
https://app.binance.com/uni-qr/D26WbL9t
⚠️ Personal market analysis only. NFA — manage risk and DYOR.
Educational content, not investment advice or a recommendation to buy, sell, deposit, or withdraw any asset. No paid promotion or referral/affiliate links.
🔴 SHORT $SNDK /USDT: expecting price to go DOWN
Bias: SHORT · Strong
Entry: 1109.02822 – 1112.91178
TP1: 1085.31323 (-2.3%)
TP2: 1068.20872 (-3.8%)
TP3: 1042.55194 (-6.2%)
SL: 1145.17903 (+3.1%)
Plan: enter only inside the zone, close 50% at TP1, 25% at TP2, 25% at TP3, and move the stop to entry after TP1.
Why SHORT? SNDK checklist: 6/12 agree, 2 against.
• Daily trend down (below EMA50 & EMA200)
• 4h trend down (below EMA50 & EMA200)
• 1h trend down (below EMA50 & EMA200)
Watch: Buyers are driving the move (15m ADX 25.2)
Watch: The idea is wrong if price reaches the stop at 1145.17903
Bottom line: The daily, 4h, and 1h bearish stacks show the trend is down, but the 15m ADX shows buyers are driving the move.
What level would make you take the opposite side?
Full setup on the chart below.
📲 Want more of my latest signals? Join me here:
https://app.binance.com/uni-qr/D26WbL9t
⚠️ Personal market analysis only. NFA — manage risk and DYOR.
Educational content, not investment advice or a recommendation to buy, sell, deposit, or withdraw any asset. No paid promotion or referral/affiliate links.
1
287
·
--
Bearish
WIF short setup: the levels I'm watching
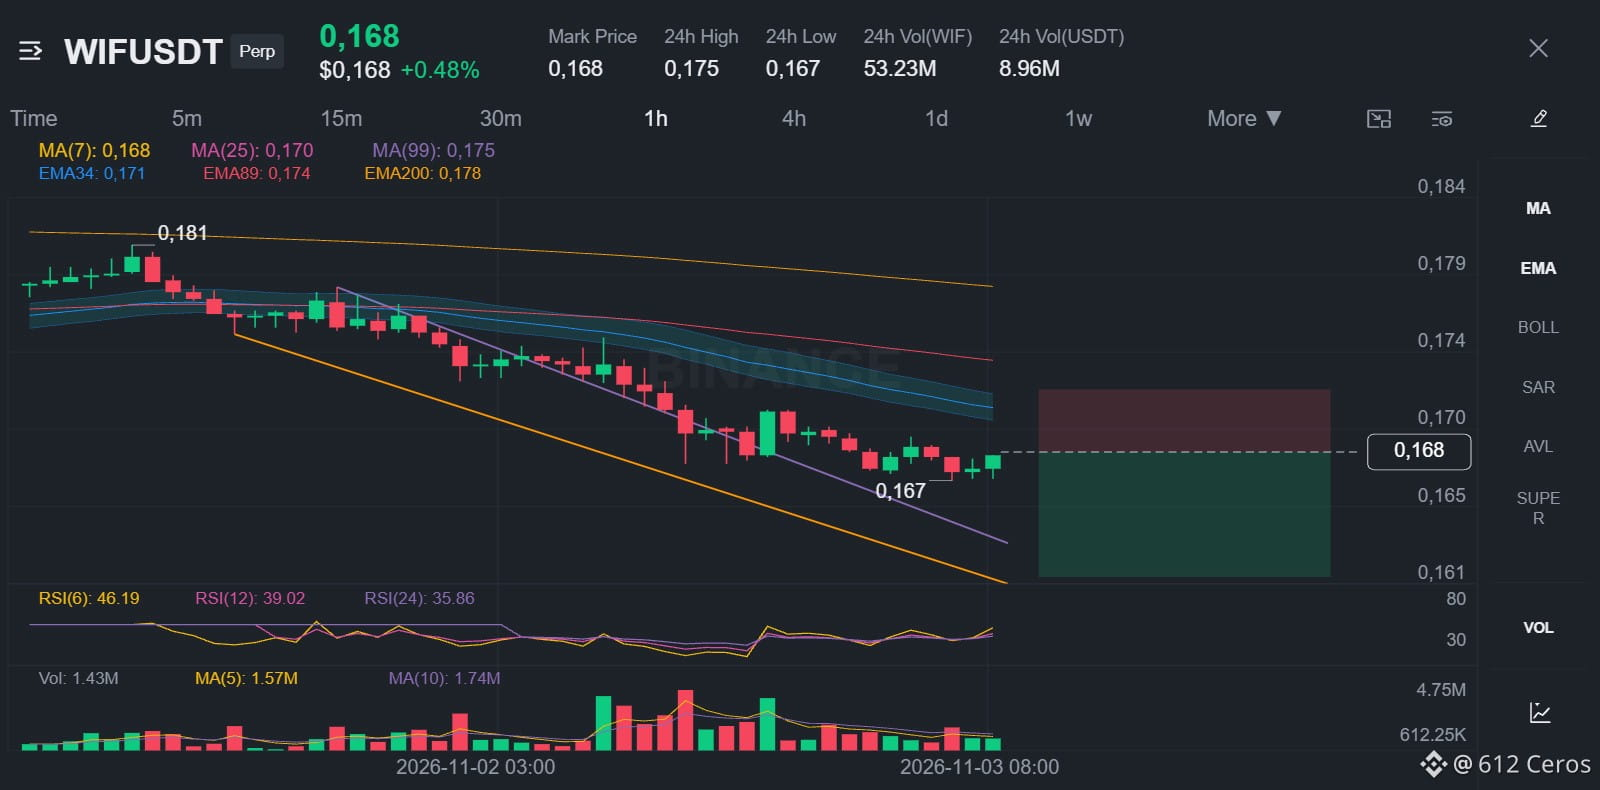
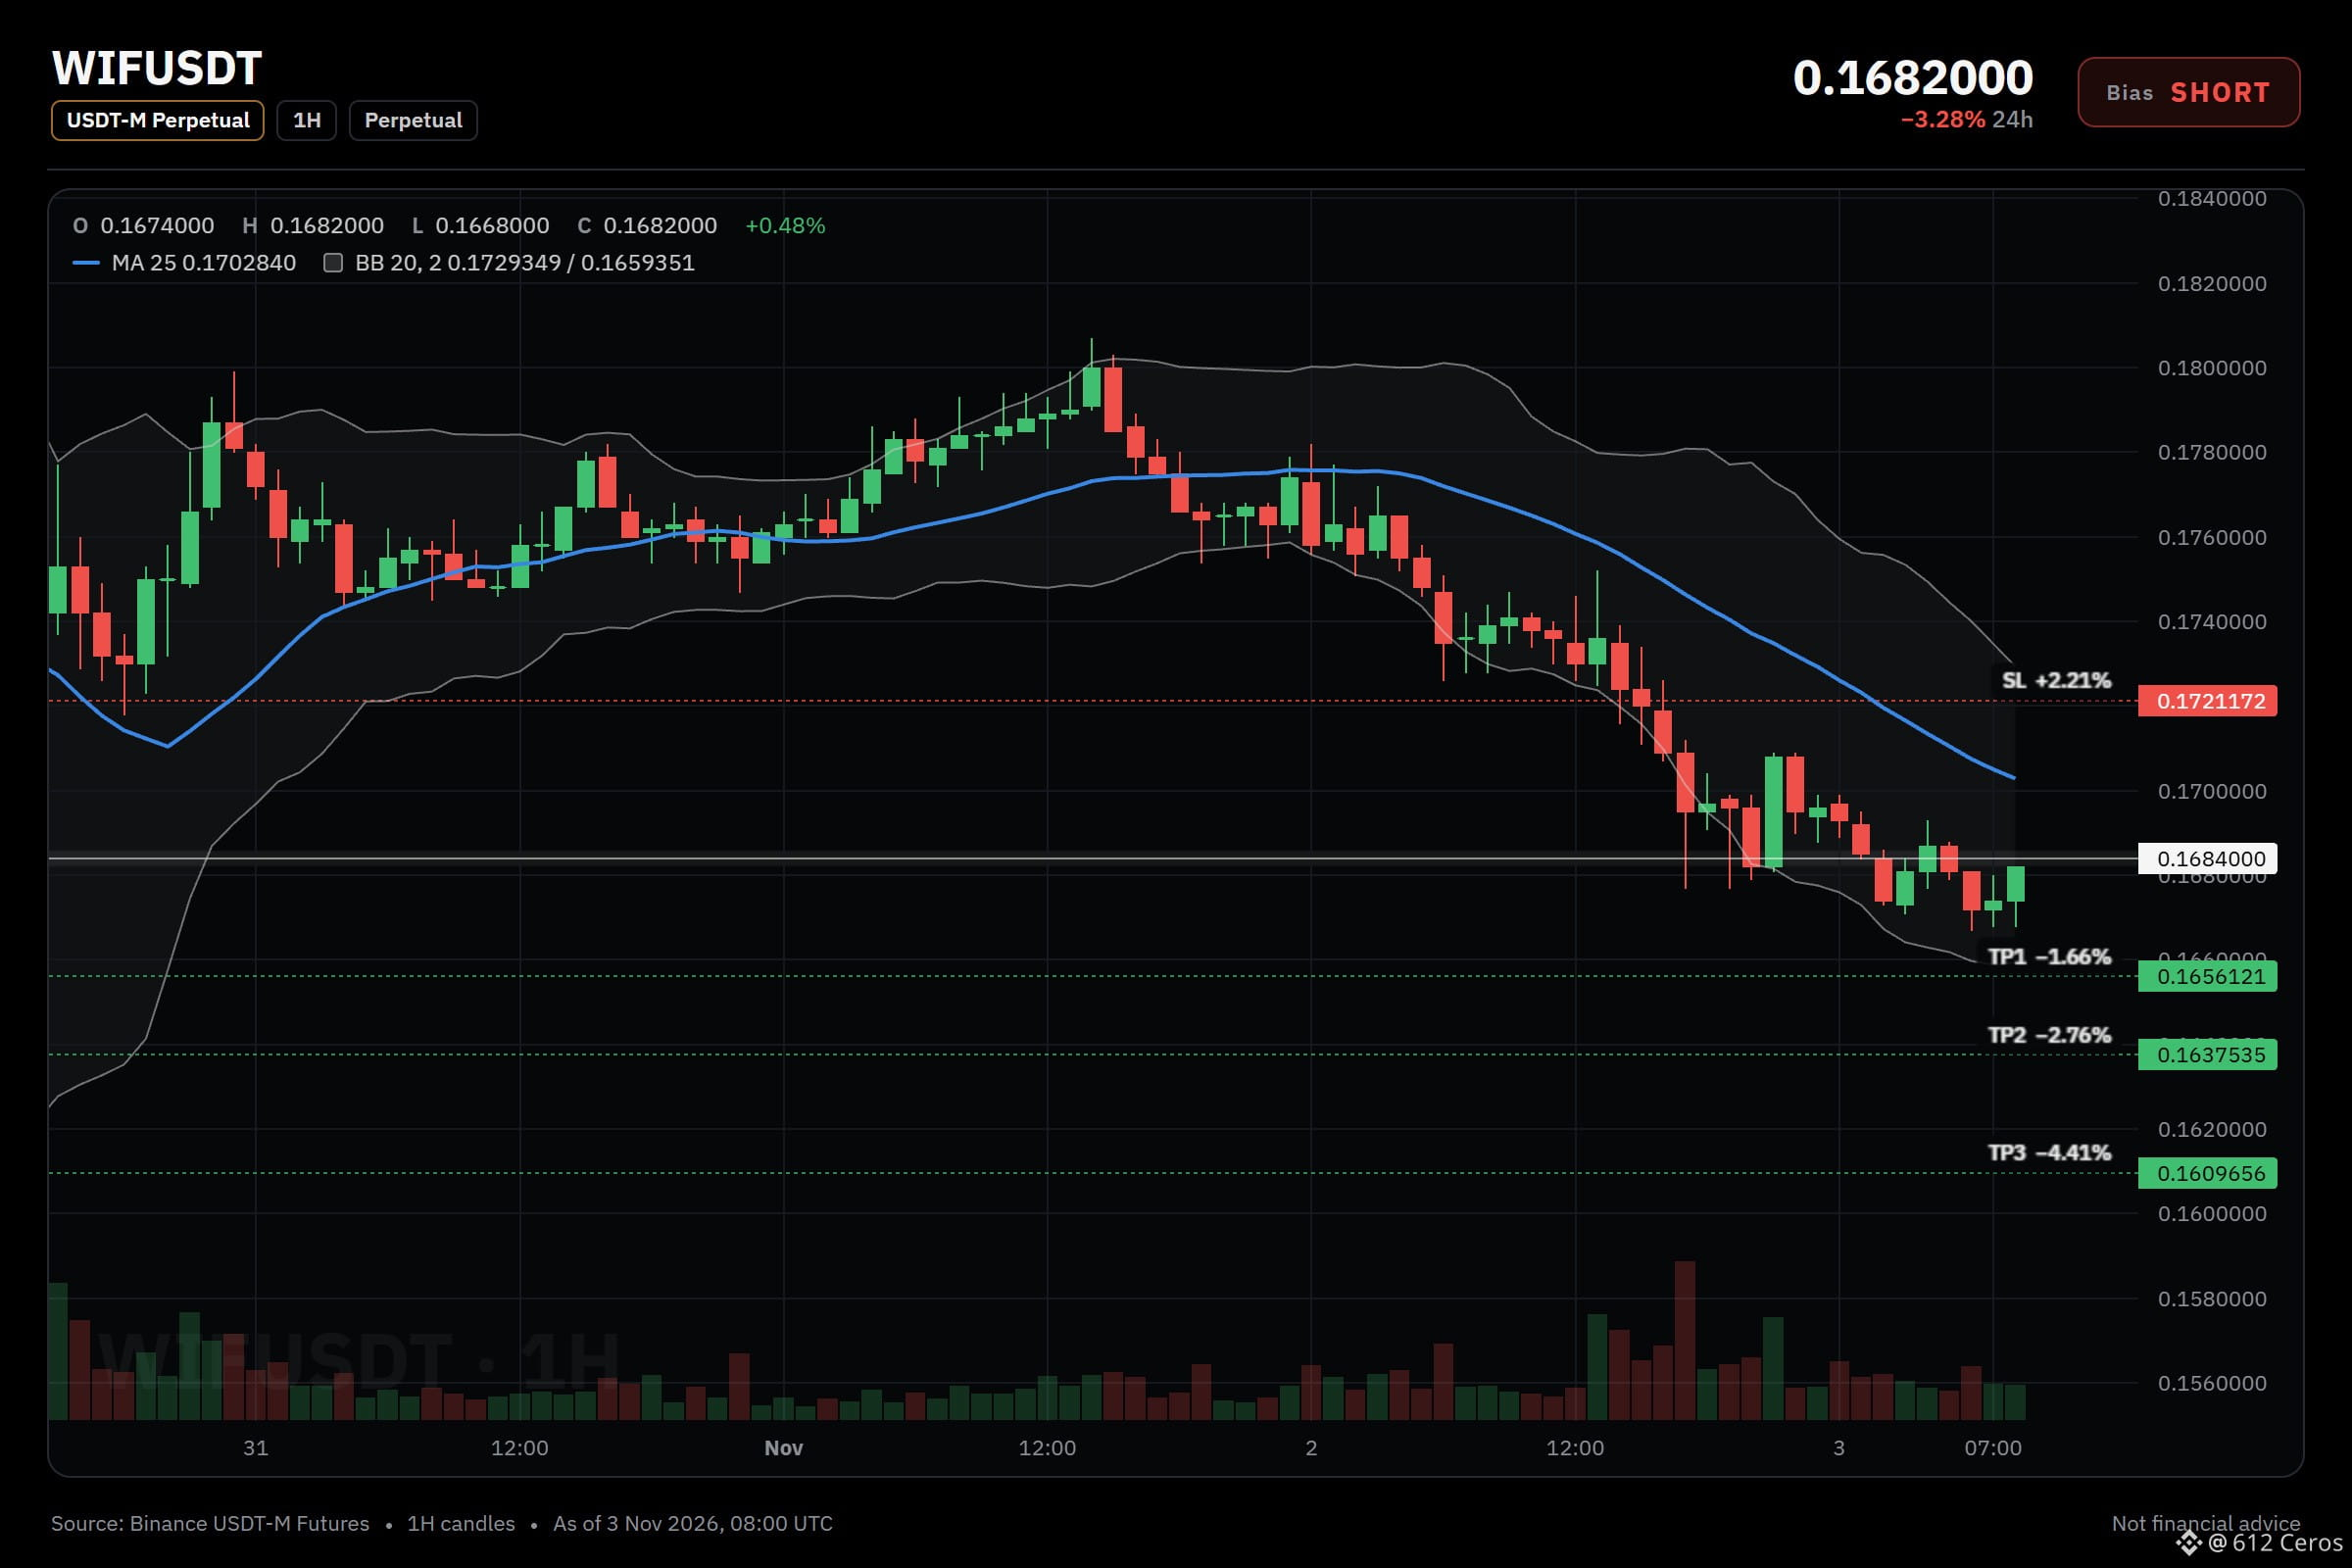
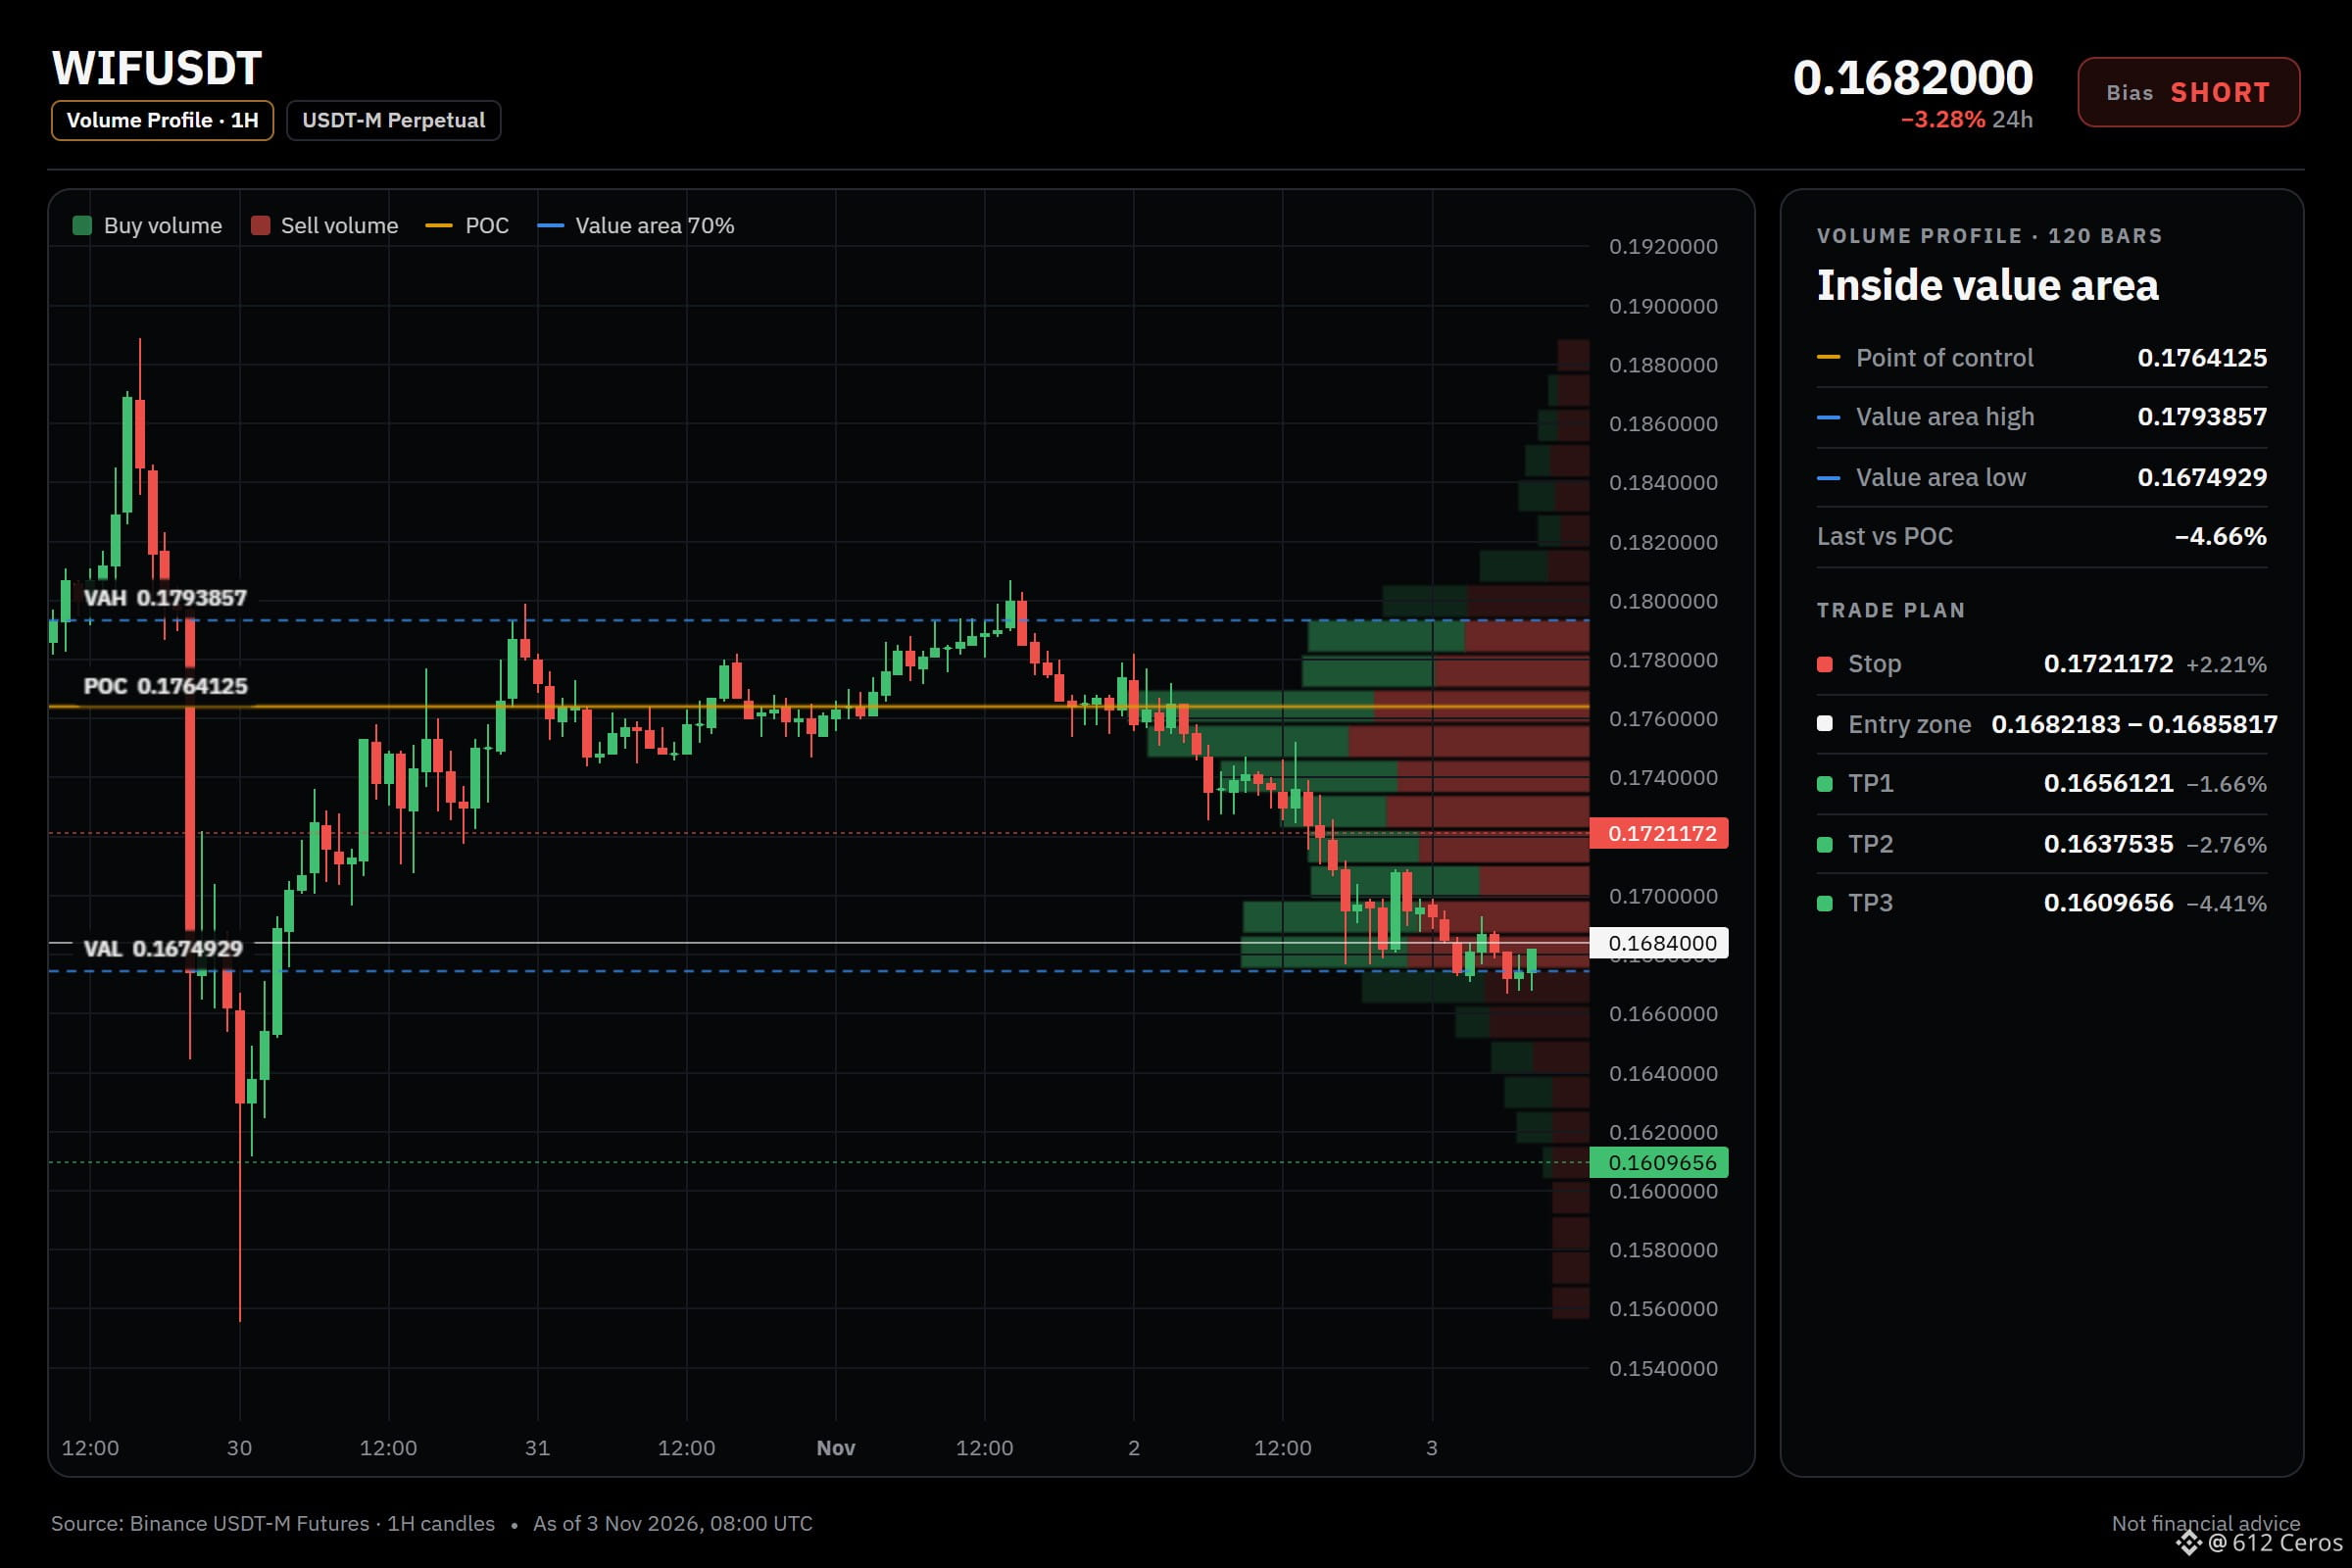
🔴 SHORT $WIF /USDT: expecting price to go DOWN
Bias: SHORT · Strong
Entry: 0.1682183 – 0.1685817
TP1: 0.1656121 (-1.7%)
TP2: 0.1637535 (-2.8%)
TP3: 0.1609656 (-4.4%)
SL: 0.1721172 (+2.2%)
Plan: enter only inside the zone, close 50% at TP1, 25% at TP2, 25% at TP3, and move the stop to entry after TP1.
Why SHORT? 7/12 signals agree, 0 against.
• Daily trend down (below EMA50 & EMA200)
• 4h trend down (below EMA50 & EMA200)
• 1h trend down (below EMA50 & EMA200)
In plain words:
The daily trend reads bearish, and 7/12 signals aligned favour the short side. The plan is to work the 0.1682183 – 0.1685817 zone, scale out at 0.1656121 and 0.1637535, and stay patient for 0.1609656. A move through 0.1721172 means the idea is wrong and the stop does its job.
Does WIF tag 0.1656121 first, or the stop?
Chart with every level below.
{future}(WIFUSDT)
📲 Want more of my latest signals? Join me here:
[https://app.binance.com/uni-qr/D26WbL9t](https://app.binance.com/uni-qr/D26WbL9t)
⚠️ Personal market analysis only. NFA — manage risk and DYOR.
Educational content, not investment advice or a recommendation to buy, sell, deposit, or withdraw any asset. No paid promotion or referral/affiliate links.
WIF short setup: the levels I'm watching
🔴 SHORT $WIF /USDT: expecting price to go DOWN
Bias: SHORT · Strong
Entry: 0.1682183 – 0.1685817
TP1: 0.1656121 (-1.7%)
TP2: 0.1637535 (-2.8%)
TP3: 0.1609656 (-4.4%)
SL: 0.1721172 (+2.2%)
Plan: enter only inside the zone, close 50% at TP1, 25% at TP2, 25% at TP3, and move the stop to entry after TP1.
Why SHORT? 7/12 signals agree, 0 against.
• Daily trend down (below EMA50 & EMA200)
• 4h trend down (below EMA50 & EMA200)
• 1h trend down (below EMA50 & EMA200)
In plain words:
The daily trend reads bearish, and 7/12 signals aligned favour the short side. The plan is to work the 0.1682183 – 0.1685817 zone, scale out at 0.1656121 and 0.1637535, and stay patient for 0.1609656. A move through 0.1721172 means the idea is wrong and the stop does its job.
Does WIF tag 0.1656121 first, or the stop?
Chart with every level below.
📲 Want more of my latest signals? Join me here:
https://app.binance.com/uni-qr/D26WbL9t
⚠️ Personal market analysis only. NFA — manage risk and DYOR.
Educational content, not investment advice or a recommendation to buy, sell, deposit, or withdraw any asset. No paid promotion or referral/affiliate links.
🔴 SHORT $WIF /USDT: expecting price to go DOWN
Bias: SHORT · Strong
Entry: 0.1682183 – 0.1685817
TP1: 0.1656121 (-1.7%)
TP2: 0.1637535 (-2.8%)
TP3: 0.1609656 (-4.4%)
SL: 0.1721172 (+2.2%)
Plan: enter only inside the zone, close 50% at TP1, 25% at TP2, 25% at TP3, and move the stop to entry after TP1.
Why SHORT? 7/12 signals agree, 0 against.
• Daily trend down (below EMA50 & EMA200)
• 4h trend down (below EMA50 & EMA200)
• 1h trend down (below EMA50 & EMA200)
In plain words:
The daily trend reads bearish, and 7/12 signals aligned favour the short side. The plan is to work the 0.1682183 – 0.1685817 zone, scale out at 0.1656121 and 0.1637535, and stay patient for 0.1609656. A move through 0.1721172 means the idea is wrong and the stop does its job.
Does WIF tag 0.1656121 first, or the stop?
Chart with every level below.
📲 Want more of my latest signals? Join me here:
https://app.binance.com/uni-qr/D26WbL9t
⚠️ Personal market analysis only. NFA — manage risk and DYOR.
Educational content, not investment advice or a recommendation to buy, sell, deposit, or withdraw any asset. No paid promotion or referral/affiliate links.
1
303
·
--
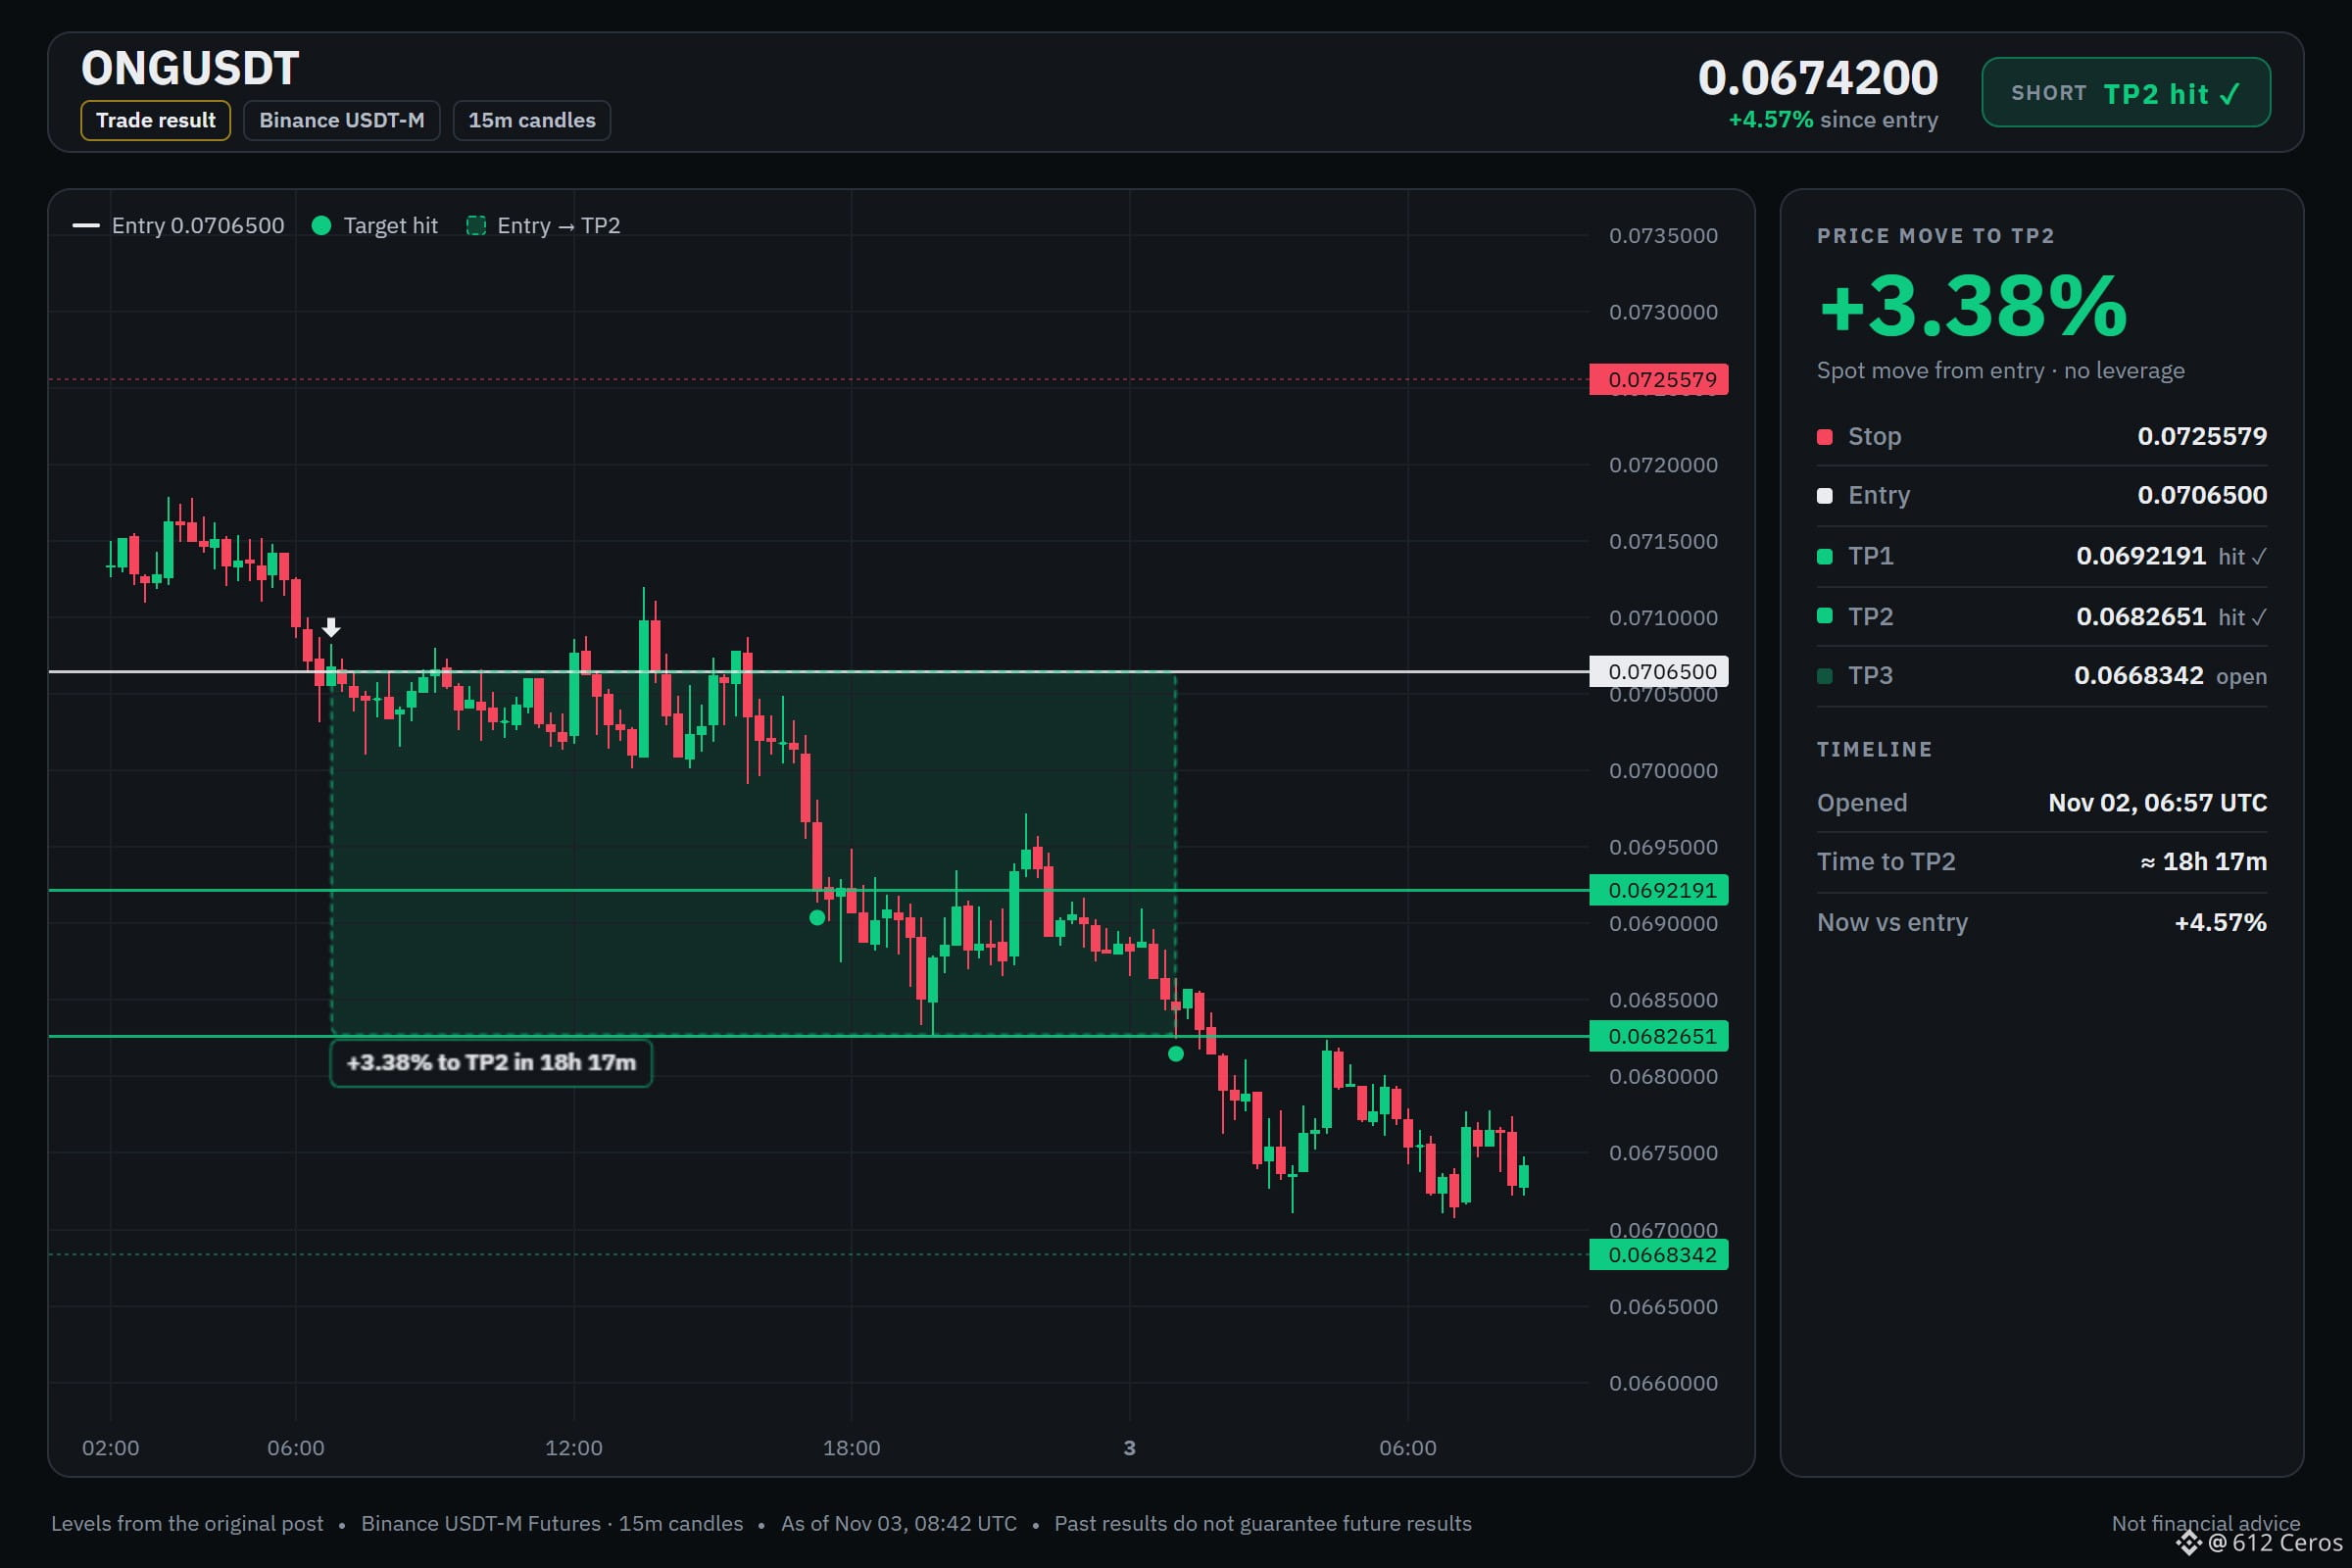
ONGUSDT short setup reached TP2. Spot price moved +3.38% from entry over about 18h 17m. The setup played out as planned. Always manage risk and size positions appropriately.
ONGUSDT short setup reached TP2. Spot price moved +3.38% from entry over about 18h 17m. The setup played out as planned. Always manage risk and size positions appropriately.
612 Ceros
·
--
BearishONG keeps falling when the trend flips.
🔴 SHORT $ONG /USDT: expecting price to go DOWN
Bias: SHORT · Leaning
Entry: 0.0705670 – 0.0707330
TP1: 0.0692191 (-2.0%)
TP2: 0.0682651 (-3.4%)
TP3: 0.0668342 (-5.4%)
SL: 0.0725579 (+2.7%)
Plan: enter only inside the zone, close 50% at TP1, 25% at TP2, 25% at TP3, and move the stop to entry after TP1.
Note: moderate conviction only, keep size light.
Why SHORT? 5/12 signals agree, 0 against.
• 4h trend down (below EMA50 & EMA200)
• 1h trend down (below EMA50 & EMA200)
• Sellers are pushing right now (−0.10% 15m candle)
Q: Why short when the daily trend is range?
A: The 4h trend shows a bearish stack, which signals short-term down momentum.
Q: When is this trade wrong?
A: The stop is at 0.0725579, which invalidates the bearish 4h stack.
Where do you set your level for ONG?
Full setup on the chart below.
📲 Want more of my latest signals? Join me here:
https://app.binance.com/uni-qr/D26WbL9t
⚠️ Personal market analysis only. NFA — manage risk and DYOR.
Educational content, not investment advice or a recommendation to buy, sell, deposit, or withdraw any asset. No paid promotion or referral/affiliate links.
🔴 SHORT $ONG /USDT: expecting price to go DOWN
Bias: SHORT · Leaning
Entry: 0.0705670 – 0.0707330
TP1: 0.0692191 (-2.0%)
TP2: 0.0682651 (-3.4%)
TP3: 0.0668342 (-5.4%)
SL: 0.0725579 (+2.7%)
Plan: enter only inside the zone, close 50% at TP1, 25% at TP2, 25% at TP3, and move the stop to entry after TP1.
Note: moderate conviction only, keep size light.
Why SHORT? 5/12 signals agree, 0 against.
• 4h trend down (below EMA50 & EMA200)
• 1h trend down (below EMA50 & EMA200)
• Sellers are pushing right now (−0.10% 15m candle)
Q: Why short when the daily trend is range?
A: The 4h trend shows a bearish stack, which signals short-term down momentum.
Q: When is this trade wrong?
A: The stop is at 0.0725579, which invalidates the bearish 4h stack.
Where do you set your level for ONG?
Full setup on the chart below.
📲 Want more of my latest signals? Join me here:
https://app.binance.com/uni-qr/D26WbL9t
⚠️ Personal market analysis only. NFA — manage risk and DYOR.
Educational content, not investment advice or a recommendation to buy, sell, deposit, or withdraw any asset. No paid promotion or referral/affiliate links.
2
583
·
--
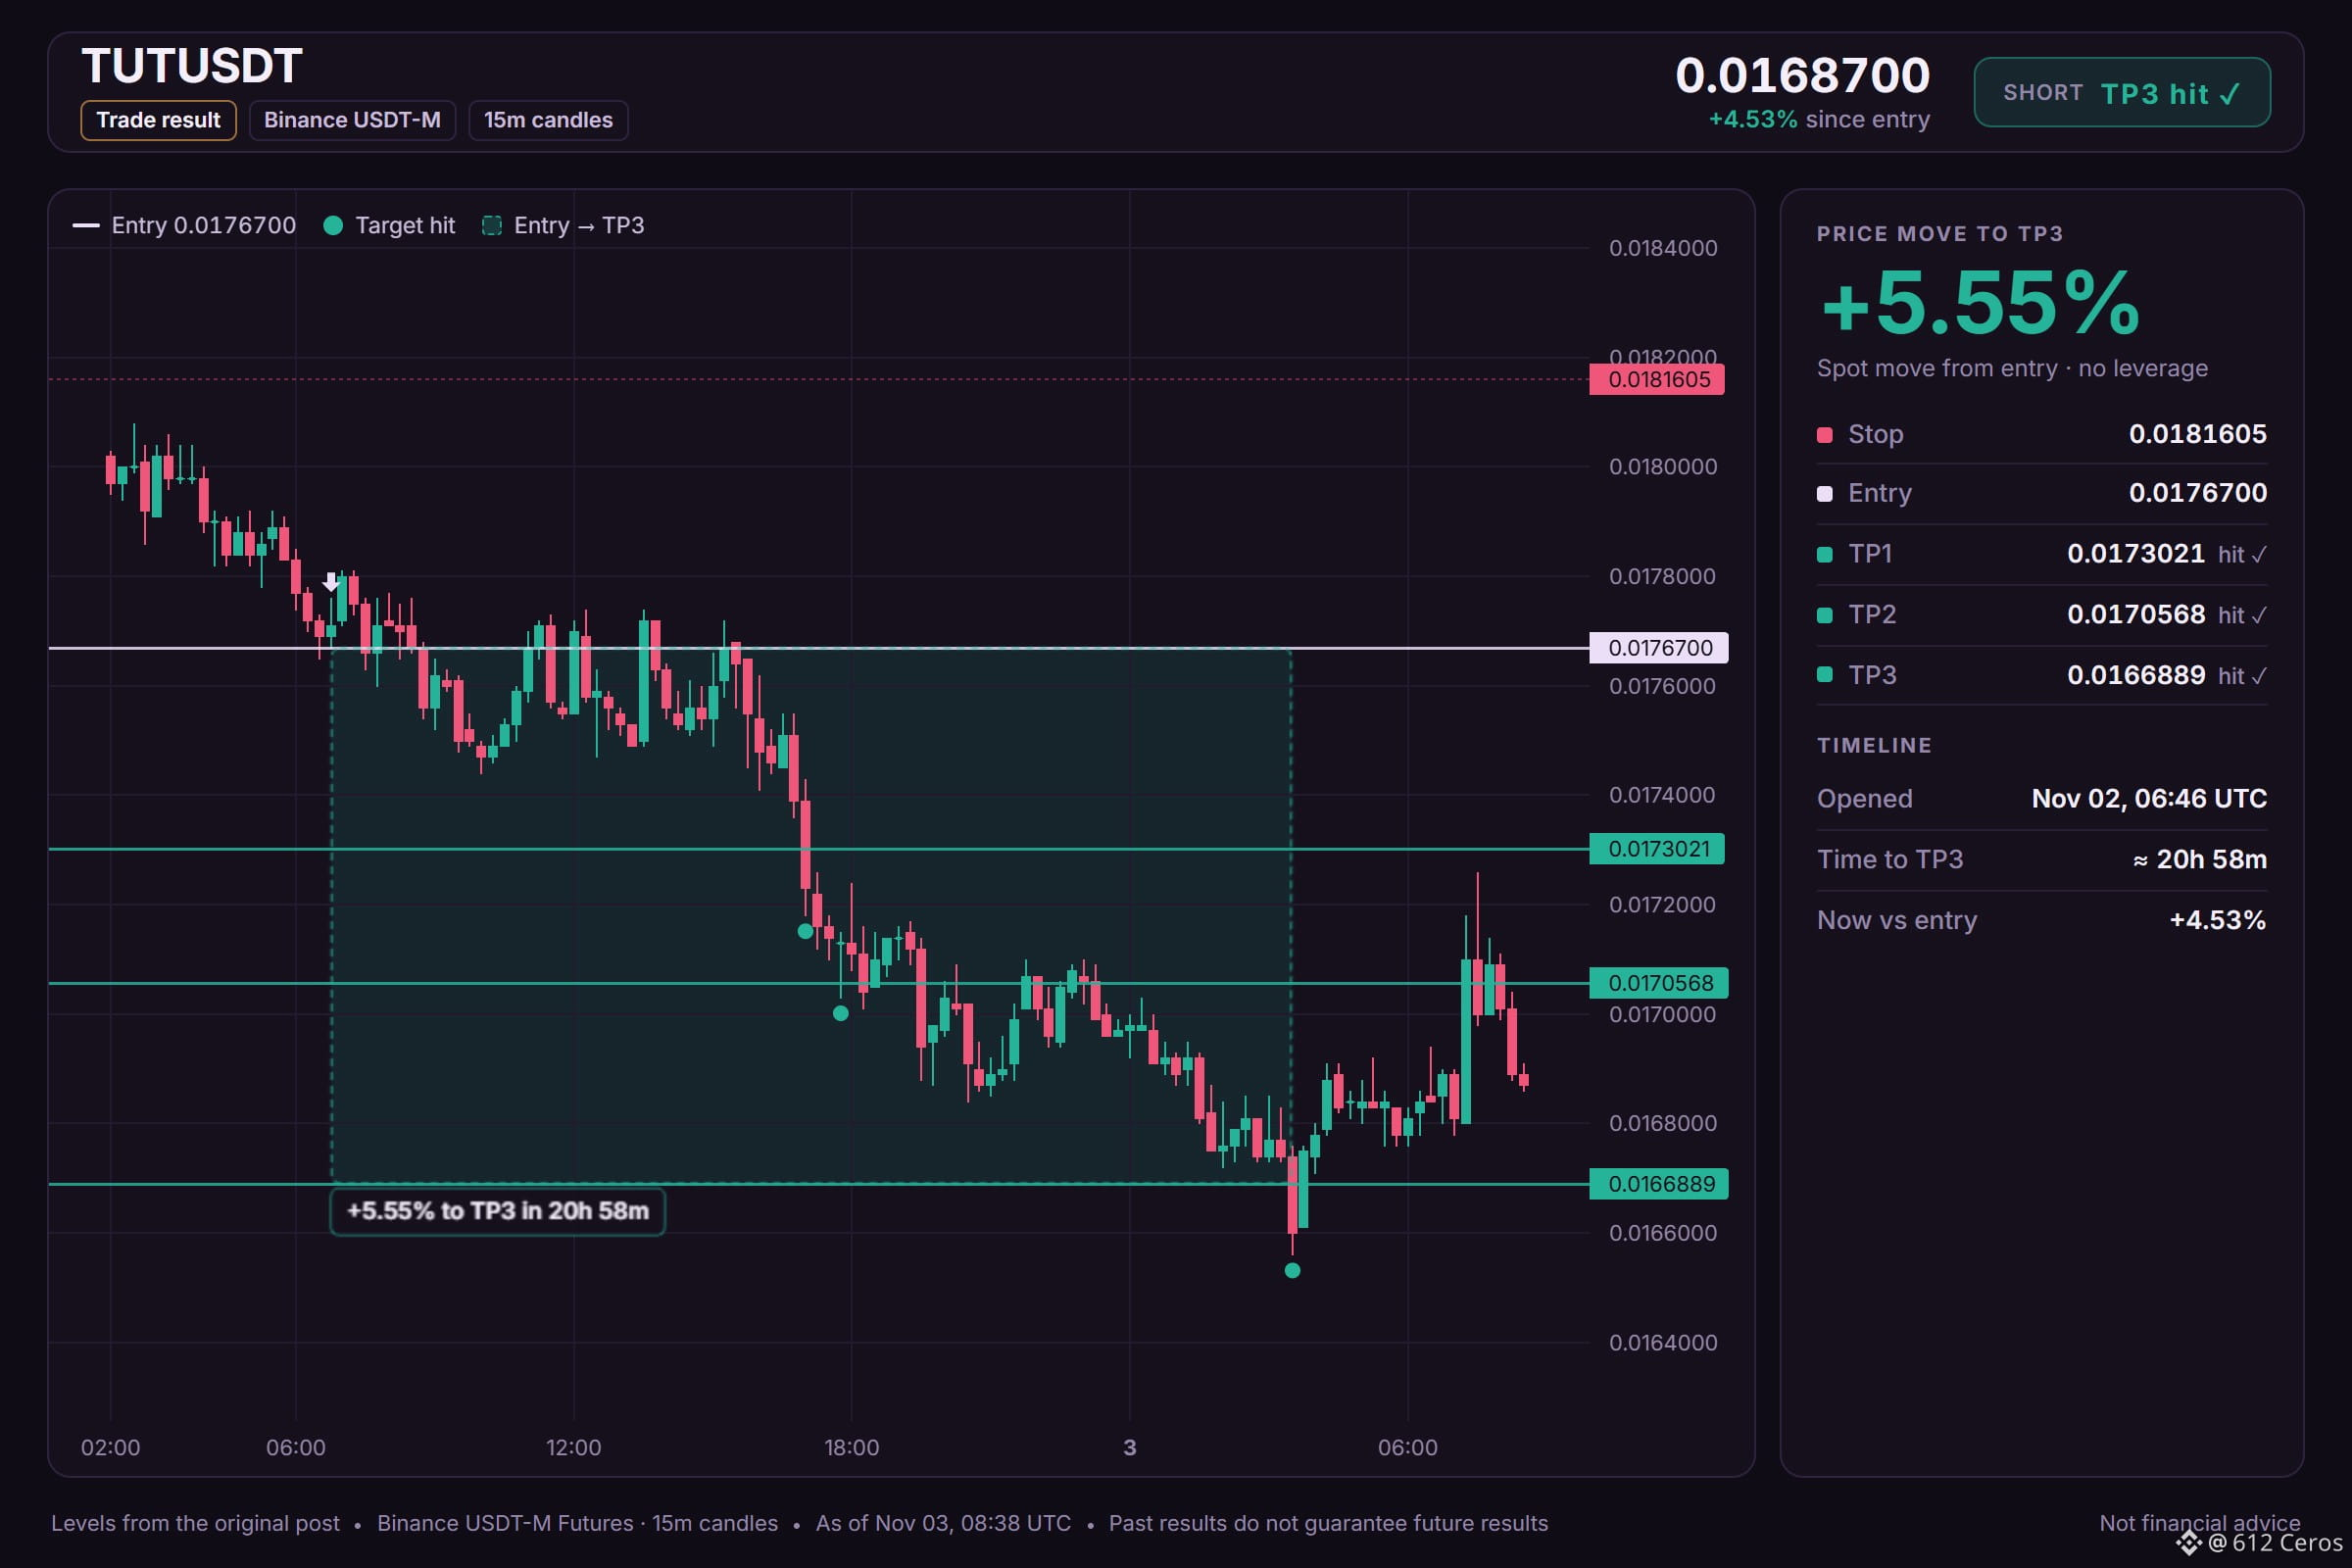
TUTUSDT short setup hit TP3. Spot move of +5.55% from entry in about 20h 58m. No leverage used. As always, manage your risk and size positions carefully. 📉🕒
TUTUSDT short setup hit TP3. Spot move of +5.55% from entry in about 20h 58m. No leverage used. As always, manage your risk and size positions carefully. 📉🕒
612 Ceros
·
--
BearishTUT short setup: the levels I'm watching
🔴 SHORT $TUT /USDT: expecting price to go DOWN
Bias: SHORT · Leaning
Entry: 0.0176457 – 0.0176943
TP1: 0.0173021 (-2.1%)
TP2: 0.0170568 (-3.5%)
TP3: 0.0166889 (-5.6%)
SL: 0.0181605 (+2.8%)
Plan: enter only inside the zone, close 50% at TP1, 25% at TP2, 25% at TP3, and move the stop to entry after TP1.
Note: moderate conviction only, keep size light.
Why SHORT? 5/12 signals agree, 0 against.
• 4h trend down (below EMA50 & EMA200)
• 1h trend down (below EMA50 & EMA200)
• Sellers are driving the move (15m ADX 25.8)
Why now?
The daily trend reads range, and 5/12 signals aligned favour the short side. The plan is to work the 0.0176457 – 0.0176943 zone, scale out at 0.0173021 and 0.0170568, and stay patient for 0.0166889. A move through 0.0181605 means the idea is wrong and the stop does its job.
Does TUT tag 0.0173021 first, or the stop?
Full setup on the chart below.
📲 Want more of my latest signals? Join me here:
https://app.binance.com/uni-qr/D26WbL9t
⚠️ Personal market analysis only. NFA — manage risk and DYOR.
Educational content, not investment advice or a recommendation to buy, sell, deposit, or withdraw any asset. No paid promotion or referral/affiliate links.
🔴 SHORT $TUT /USDT: expecting price to go DOWN
Bias: SHORT · Leaning
Entry: 0.0176457 – 0.0176943
TP1: 0.0173021 (-2.1%)
TP2: 0.0170568 (-3.5%)
TP3: 0.0166889 (-5.6%)
SL: 0.0181605 (+2.8%)
Plan: enter only inside the zone, close 50% at TP1, 25% at TP2, 25% at TP3, and move the stop to entry after TP1.
Note: moderate conviction only, keep size light.
Why SHORT? 5/12 signals agree, 0 against.
• 4h trend down (below EMA50 & EMA200)
• 1h trend down (below EMA50 & EMA200)
• Sellers are driving the move (15m ADX 25.8)
Why now?
The daily trend reads range, and 5/12 signals aligned favour the short side. The plan is to work the 0.0176457 – 0.0176943 zone, scale out at 0.0173021 and 0.0170568, and stay patient for 0.0166889. A move through 0.0181605 means the idea is wrong and the stop does its job.
Does TUT tag 0.0173021 first, or the stop?
Full setup on the chart below.
📲 Want more of my latest signals? Join me here:
https://app.binance.com/uni-qr/D26WbL9t
⚠️ Personal market analysis only. NFA — manage risk and DYOR.
Educational content, not investment advice or a recommendation to buy, sell, deposit, or withdraw any asset. No paid promotion or referral/affiliate links.
1
431
·
--
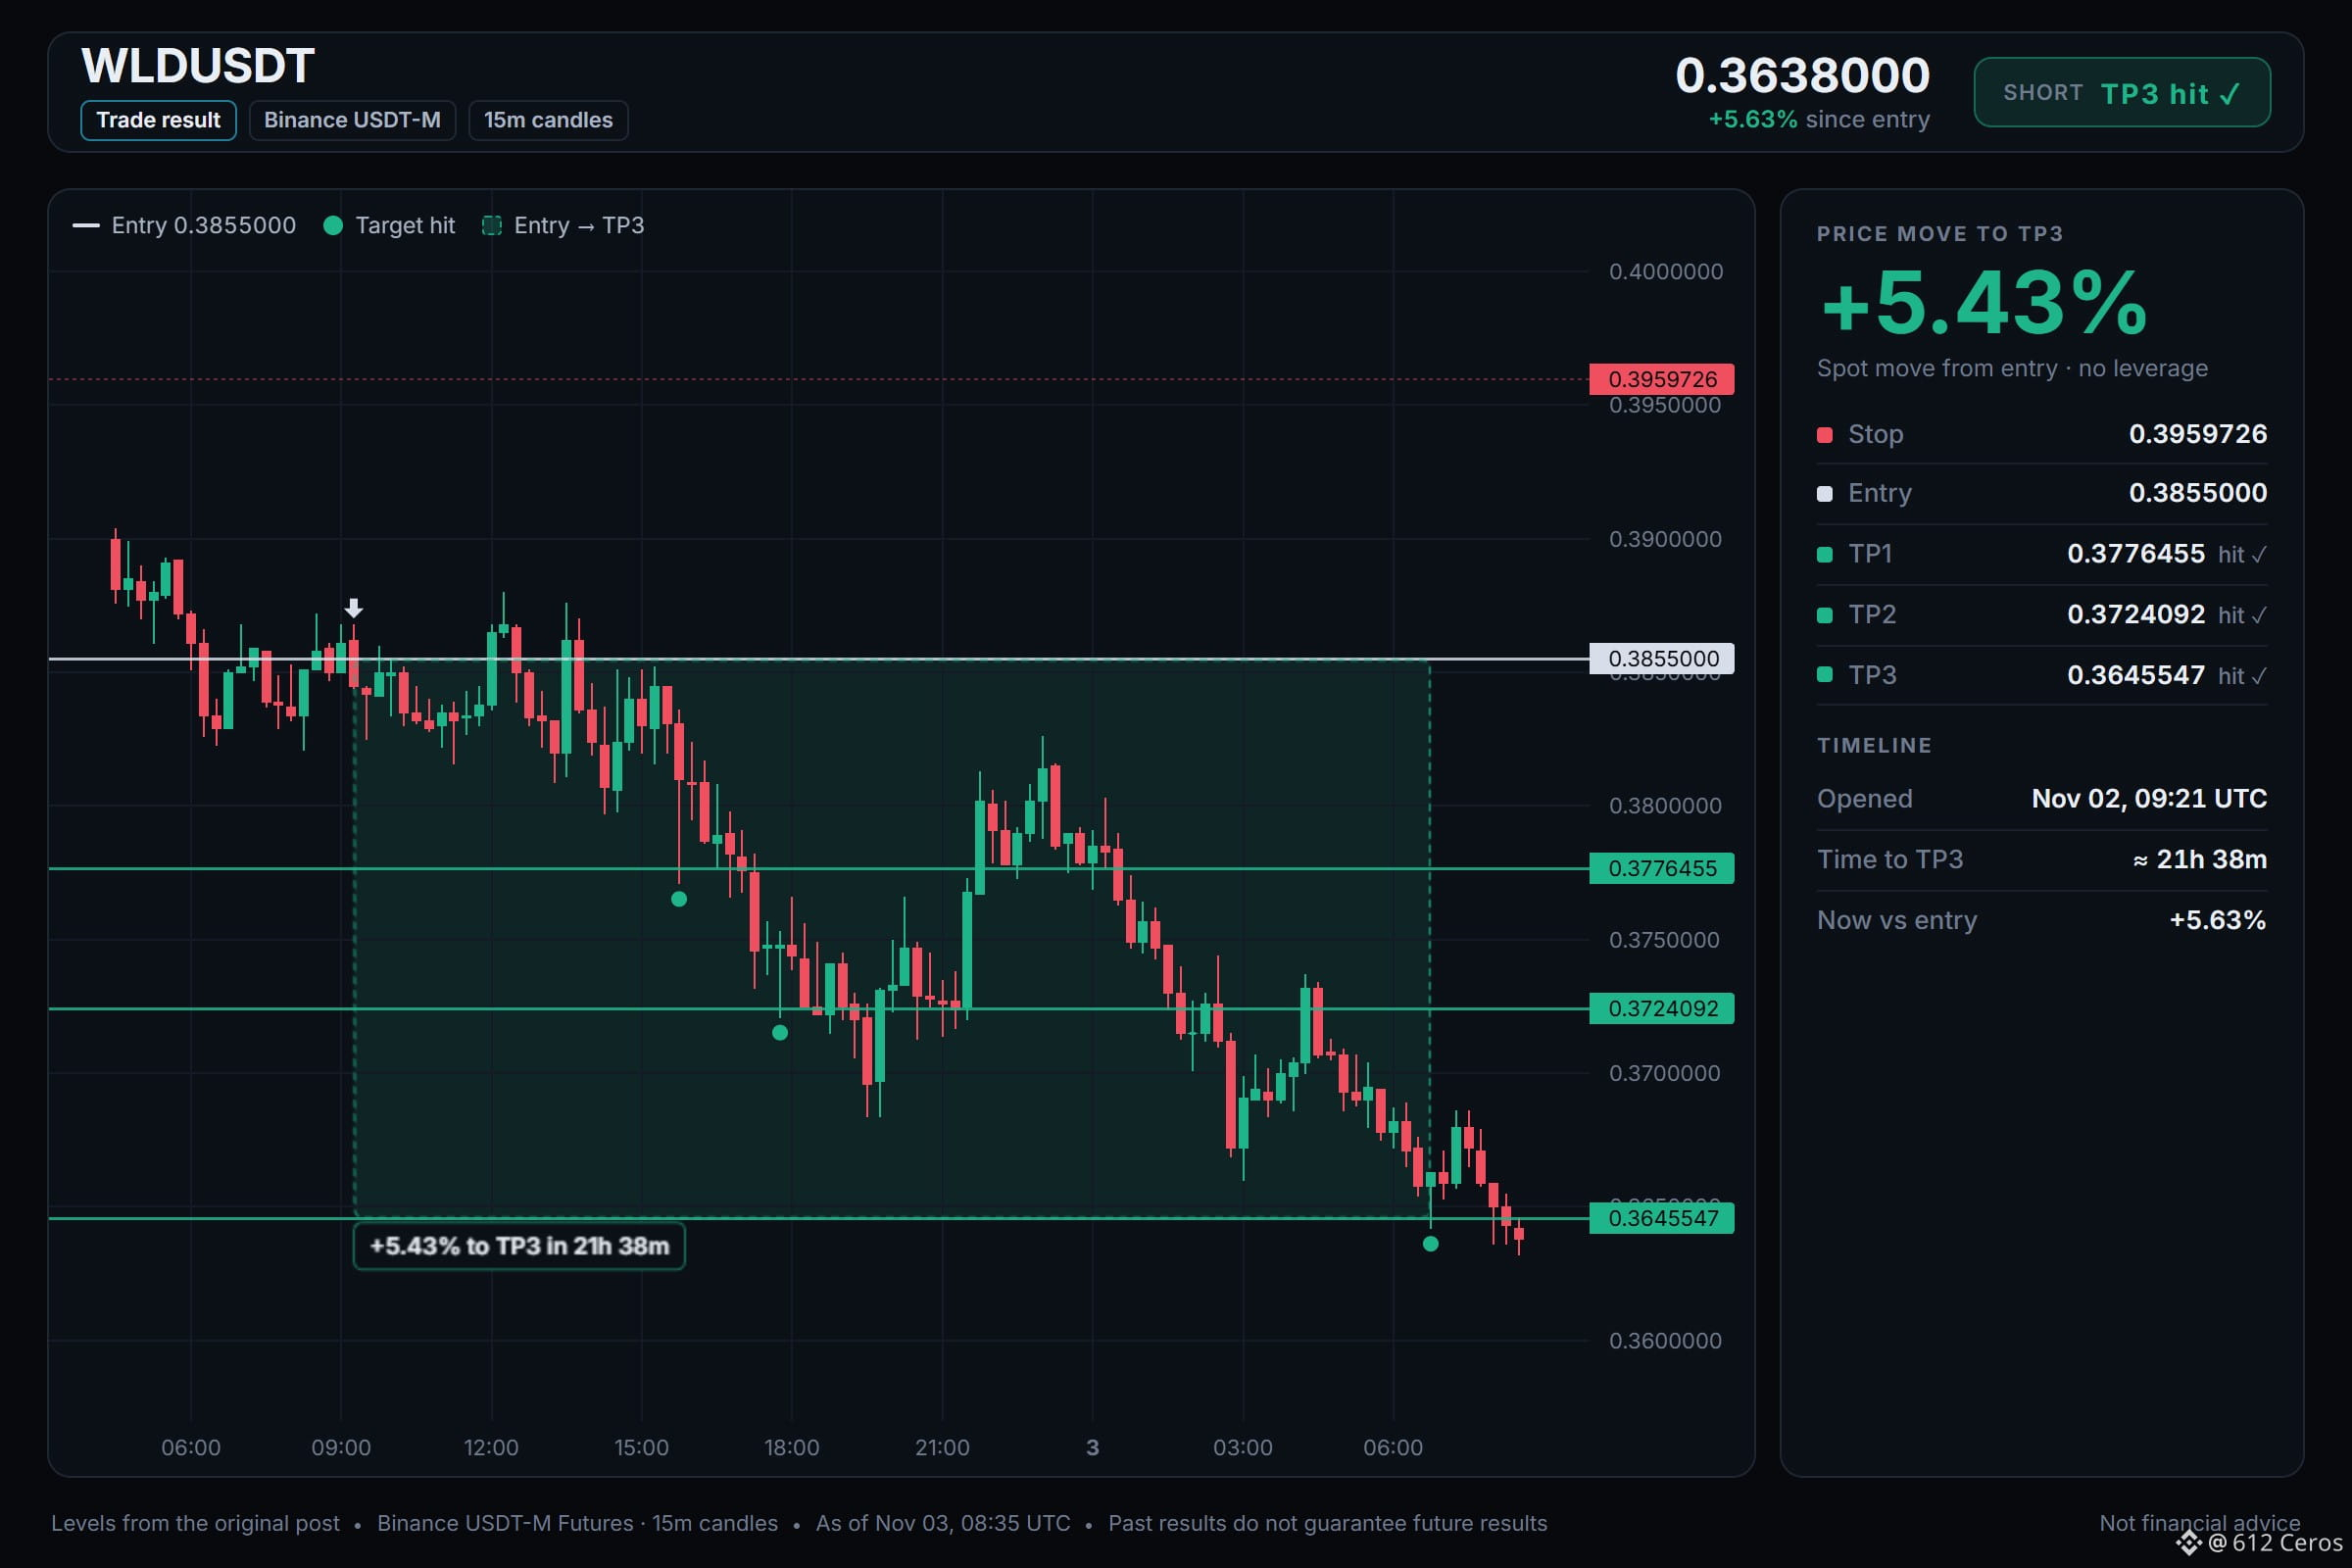
WLDUSDT short setup hit TP3 📉 Spot price moved +5.43% from entry over about 21h 38m. Good execution on this one. Always manage your risk and size positions responsibly.
WLDUSDT short setup hit TP3 📉 Spot price moved +5.43% from entry over about 21h 38m. Good execution on this one. Always manage your risk and size positions responsibly.
612 Ceros
·
--
BearishWLD is rolling over as the 4h trend turns down.
🔴 SHORT $WLD /USDT: expecting price to go DOWN
Bias: SHORT · Strong
Entry: 0.3849484 – 0.3860516
TP1: 0.3776455 (-2.0%)
TP2: 0.3724092 (-3.4%)
TP3: 0.3645547 (-5.4%)
SL: 0.3959726 (+2.7%)
Plan: enter only inside the zone, close 50% at TP1, 25% at TP2, 25% at TP3, and move the stop to entry after TP1.
Why SHORT? 6/12 signals agree, 1 against.
• 4h trend down (below EMA50 & EMA200)
• 1h trend down (below EMA50 & EMA200)
• Sellers are driving the move (15m ADX 25.5)
Risk: BTC is rising, this coin follows (corr 0.74)
Trade note: WLD
I'm watching for a short entry at 0.3849484. The 4h trend shows price below both the 50 and 200 EMA with a bearish stack, and the 1h RSI at 35.8 shows sellers have momentum. My invalidation is a break above 0.3959726.
Where would you place your stop on this level?
Levels mapped on the chart below.
📲 Want more of my latest signals? Join me here:
https://app.binance.com/uni-qr/D26WbL9t
⚠️ Personal market analysis only. NFA — manage risk and DYOR.
Educational content, not investment advice or a recommendation to buy, sell, deposit, or withdraw any asset. No paid promotion or referral/affiliate links.
🔴 SHORT $WLD /USDT: expecting price to go DOWN
Bias: SHORT · Strong
Entry: 0.3849484 – 0.3860516
TP1: 0.3776455 (-2.0%)
TP2: 0.3724092 (-3.4%)
TP3: 0.3645547 (-5.4%)
SL: 0.3959726 (+2.7%)
Plan: enter only inside the zone, close 50% at TP1, 25% at TP2, 25% at TP3, and move the stop to entry after TP1.
Why SHORT? 6/12 signals agree, 1 against.
• 4h trend down (below EMA50 & EMA200)
• 1h trend down (below EMA50 & EMA200)
• Sellers are driving the move (15m ADX 25.5)
Risk: BTC is rising, this coin follows (corr 0.74)
Trade note: WLD
I'm watching for a short entry at 0.3849484. The 4h trend shows price below both the 50 and 200 EMA with a bearish stack, and the 1h RSI at 35.8 shows sellers have momentum. My invalidation is a break above 0.3959726.
Where would you place your stop on this level?
Levels mapped on the chart below.
📲 Want more of my latest signals? Join me here:
https://app.binance.com/uni-qr/D26WbL9t
⚠️ Personal market analysis only. NFA — manage risk and DYOR.
Educational content, not investment advice or a recommendation to buy, sell, deposit, or withdraw any asset. No paid promotion or referral/affiliate links.
1
724
·
--
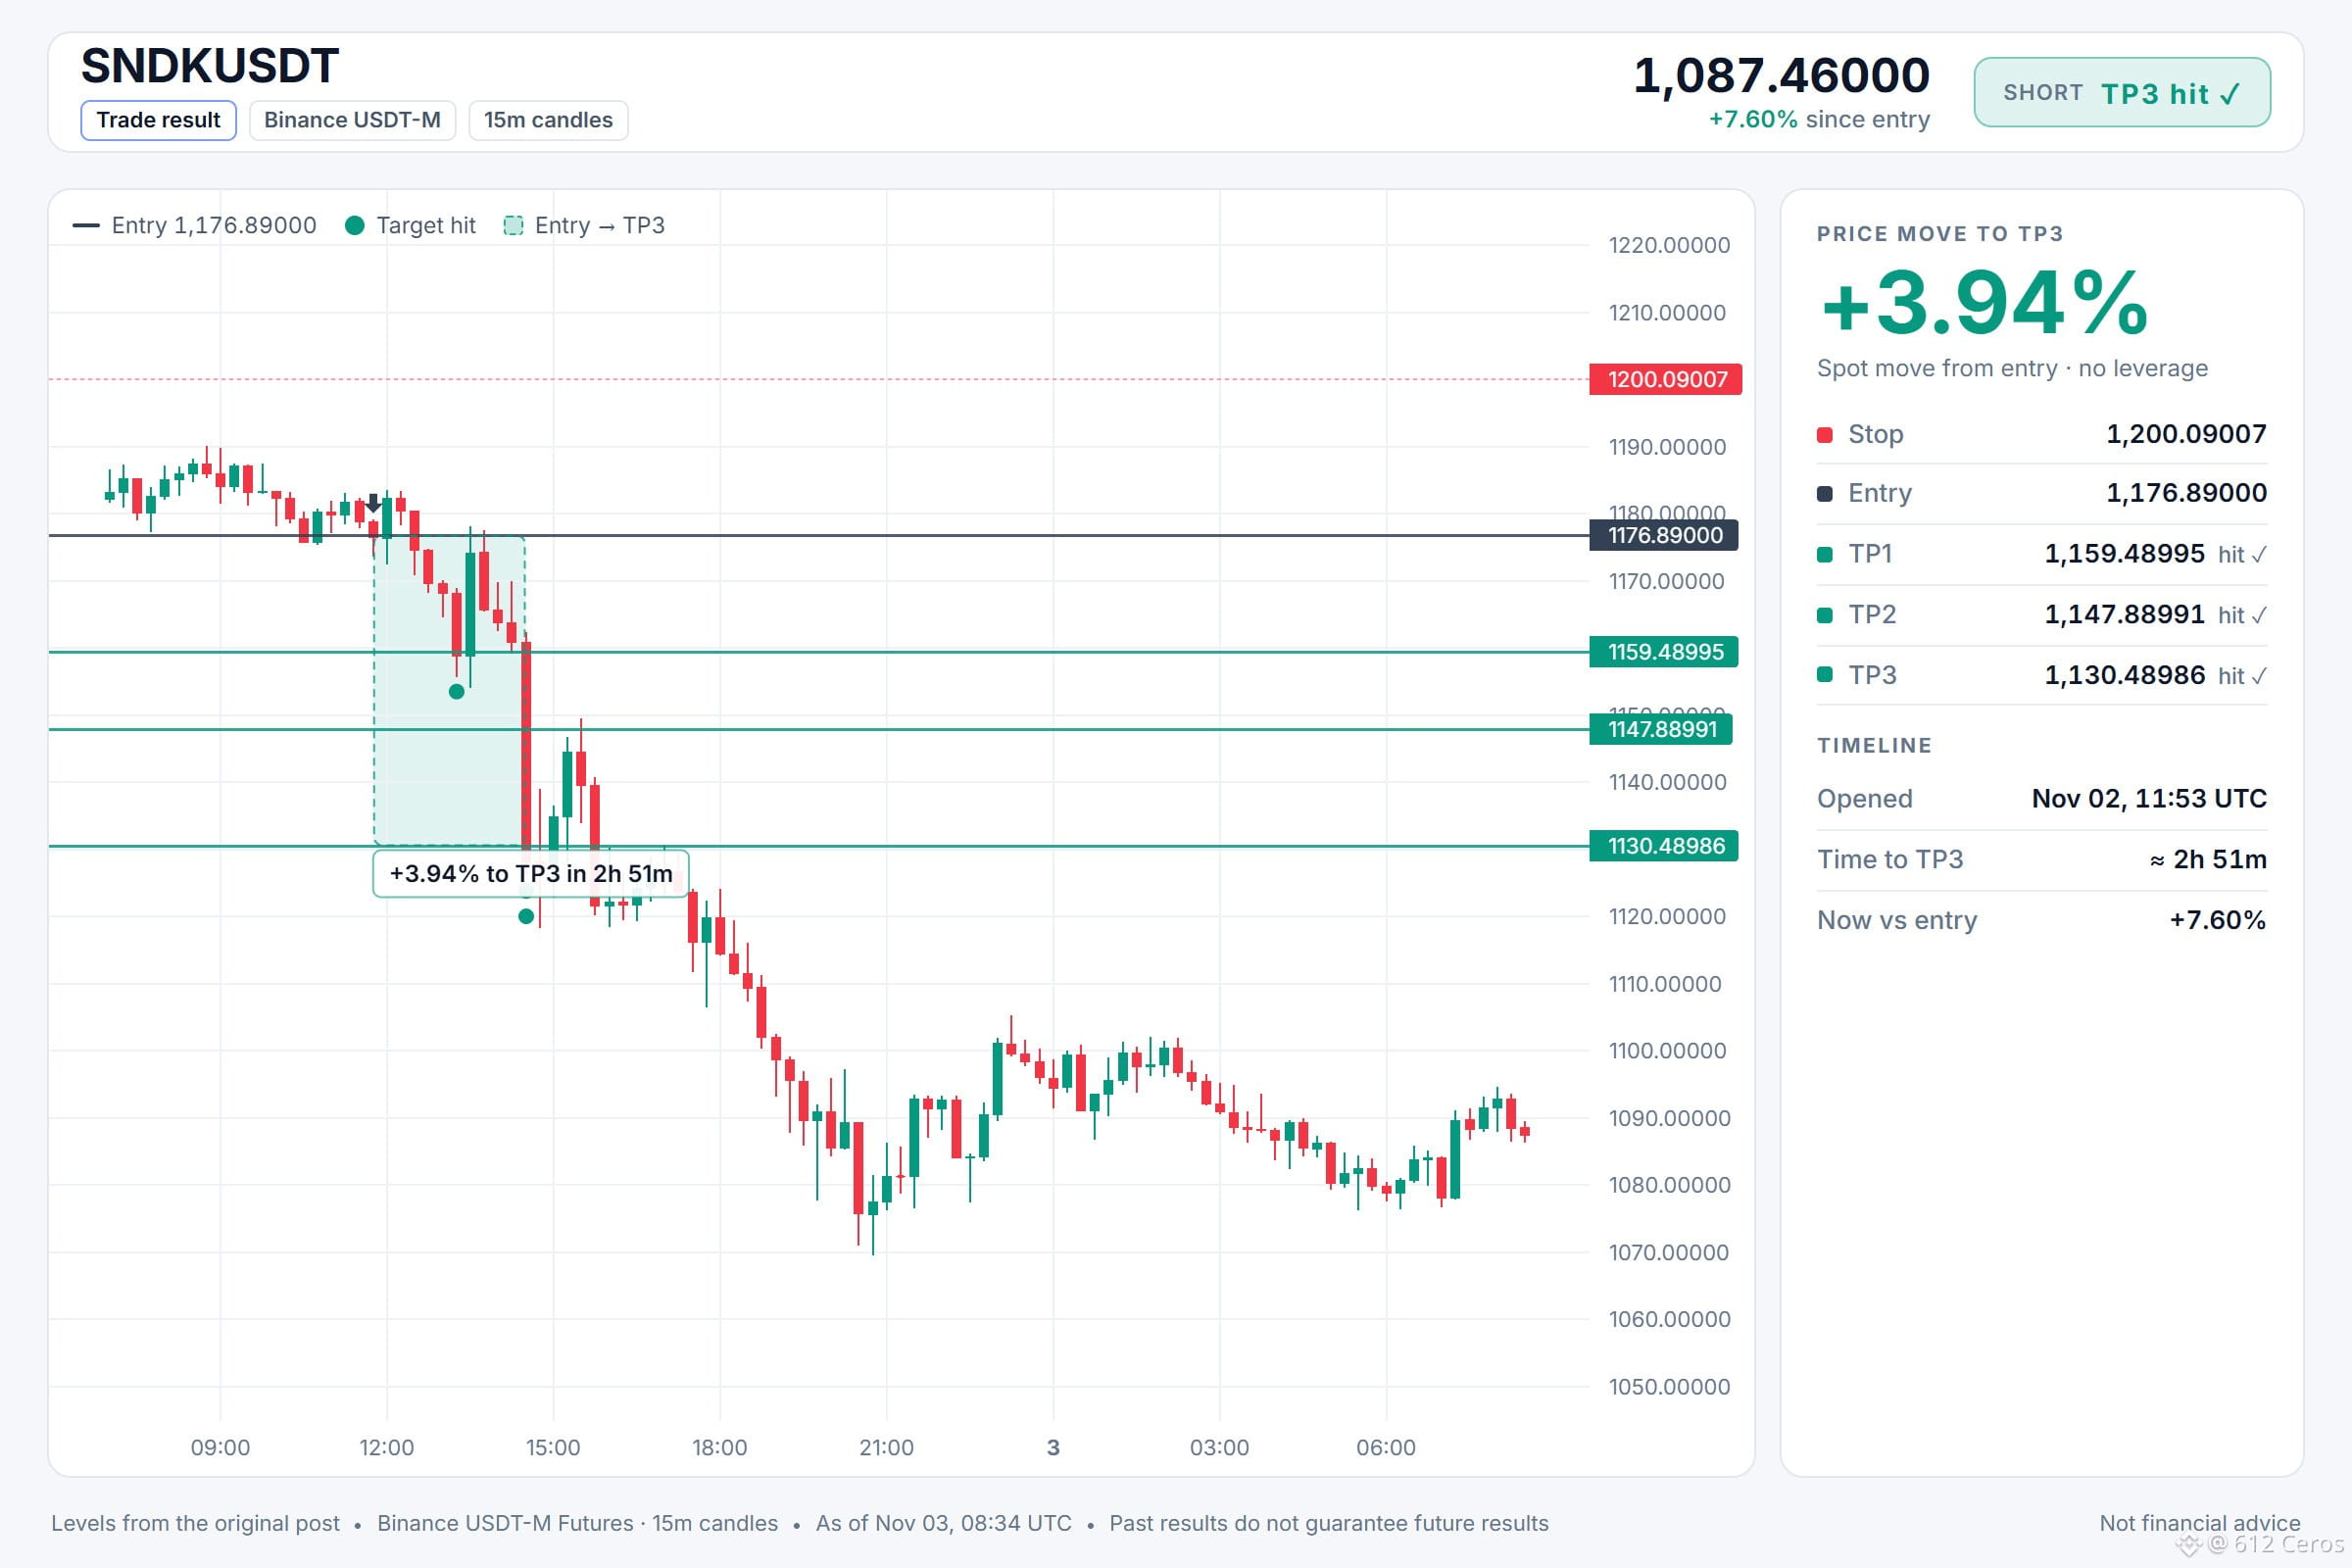
Short setup on SNDKUSDT hit TP3 📉. Price moved +3.94% from entry in about 2h 51m. Spot move, no leverage used. Always manage your risk.
Short setup on SNDKUSDT hit TP3 📉. Price moved +3.94% from entry in about 2h 51m. Spot move, no leverage used. Always manage your risk.
612 Ceros
·
--
BearishSNDK shows a bearish daily stack with five aligned signals.
🔴 SHORT $SNDK /USDT: expecting price to go DOWN
Bias: SHORT · Leaning
Entry: 1175.58005 – 1178.19995
TP1: 1159.48995 (-1.5%)
TP2: 1147.88991 (-2.5%)
TP3: 1130.48986 (-3.9%)
SL: 1200.09007 (+2.0%)
Plan: enter only inside the zone, close 50% at TP1, 25% at TP2, 25% at TP3, and move the stop to entry after TP1.
Note: moderate conviction only, keep size light.
Why SHORT? 5/12 signals agree, 0 against.
• Daily trend down (below EMA50 & EMA200)
• 4h trend down (below EMA50 & EMA200)
• 1h trend down (below EMA50 & EMA200)
Bear path:
If price holds below the 1h EMA50, the 4h bearish stack suggests a push toward the 1h price level.
What kills it:
A 1h close above the daily EMA200 would invalidate the setup, so I would exit.
Where would you set a tight stop for this short?
Full setup on the chart below.
📲 Want more of my latest signals? Join me here:
https://app.binance.com/uni-qr/D26WbL9t
⚠️ Personal market analysis only. NFA — manage risk and DYOR.
Educational content, not investment advice or a recommendation to buy, sell, deposit, or withdraw any asset. No paid promotion or referral/affiliate links.
🔴 SHORT $SNDK /USDT: expecting price to go DOWN
Bias: SHORT · Leaning
Entry: 1175.58005 – 1178.19995
TP1: 1159.48995 (-1.5%)
TP2: 1147.88991 (-2.5%)
TP3: 1130.48986 (-3.9%)
SL: 1200.09007 (+2.0%)
Plan: enter only inside the zone, close 50% at TP1, 25% at TP2, 25% at TP3, and move the stop to entry after TP1.
Note: moderate conviction only, keep size light.
Why SHORT? 5/12 signals agree, 0 against.
• Daily trend down (below EMA50 & EMA200)
• 4h trend down (below EMA50 & EMA200)
• 1h trend down (below EMA50 & EMA200)
Bear path:
If price holds below the 1h EMA50, the 4h bearish stack suggests a push toward the 1h price level.
What kills it:
A 1h close above the daily EMA200 would invalidate the setup, so I would exit.
Where would you set a tight stop for this short?
Full setup on the chart below.
📲 Want more of my latest signals? Join me here:
https://app.binance.com/uni-qr/D26WbL9t
⚠️ Personal market analysis only. NFA — manage risk and DYOR.
Educational content, not investment advice or a recommendation to buy, sell, deposit, or withdraw any asset. No paid promotion or referral/affiliate links.
1
374
·
--
Bearish
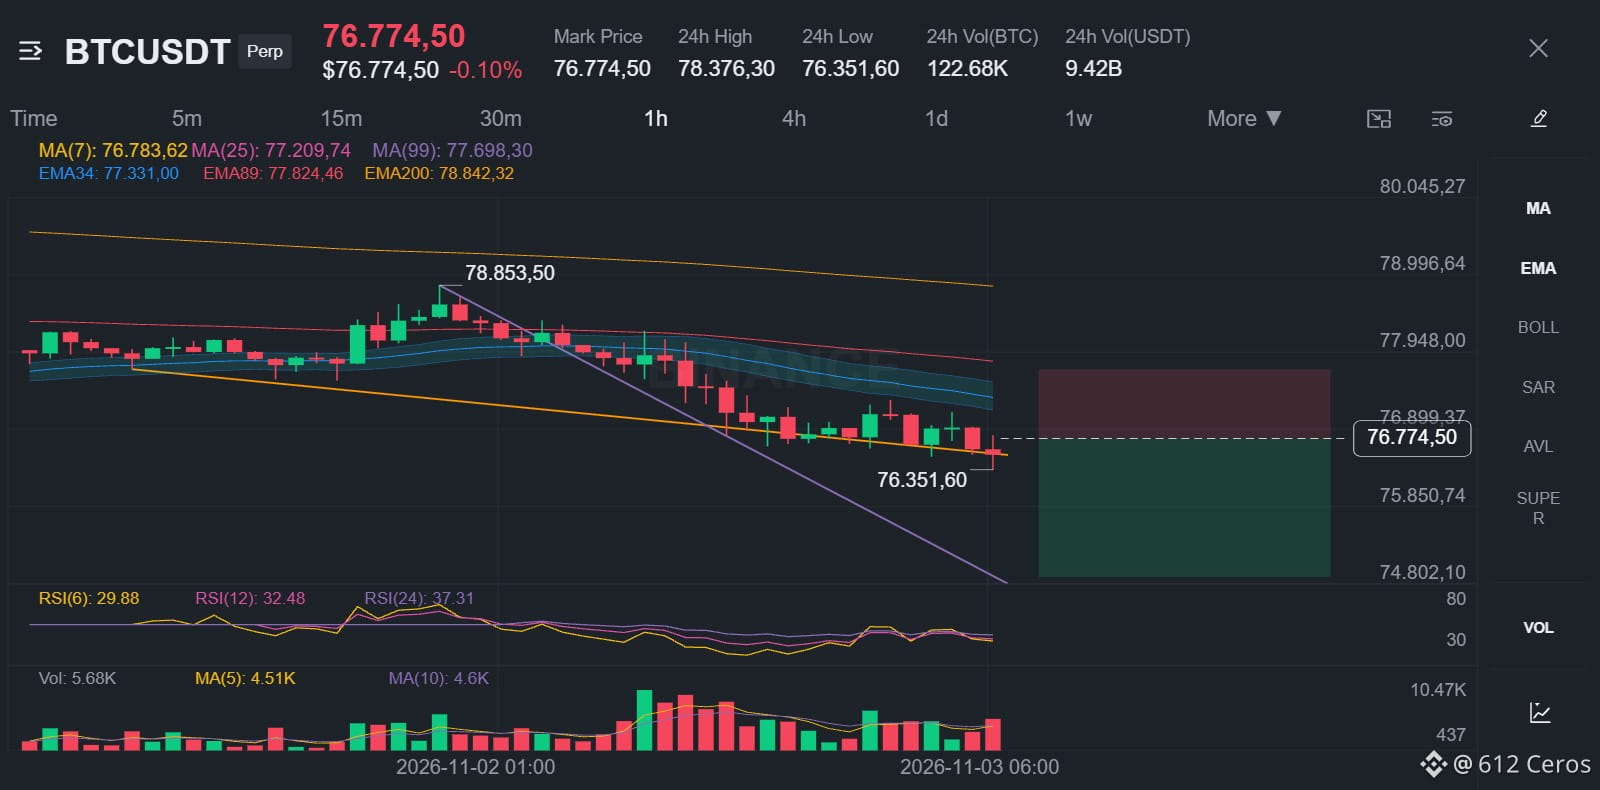
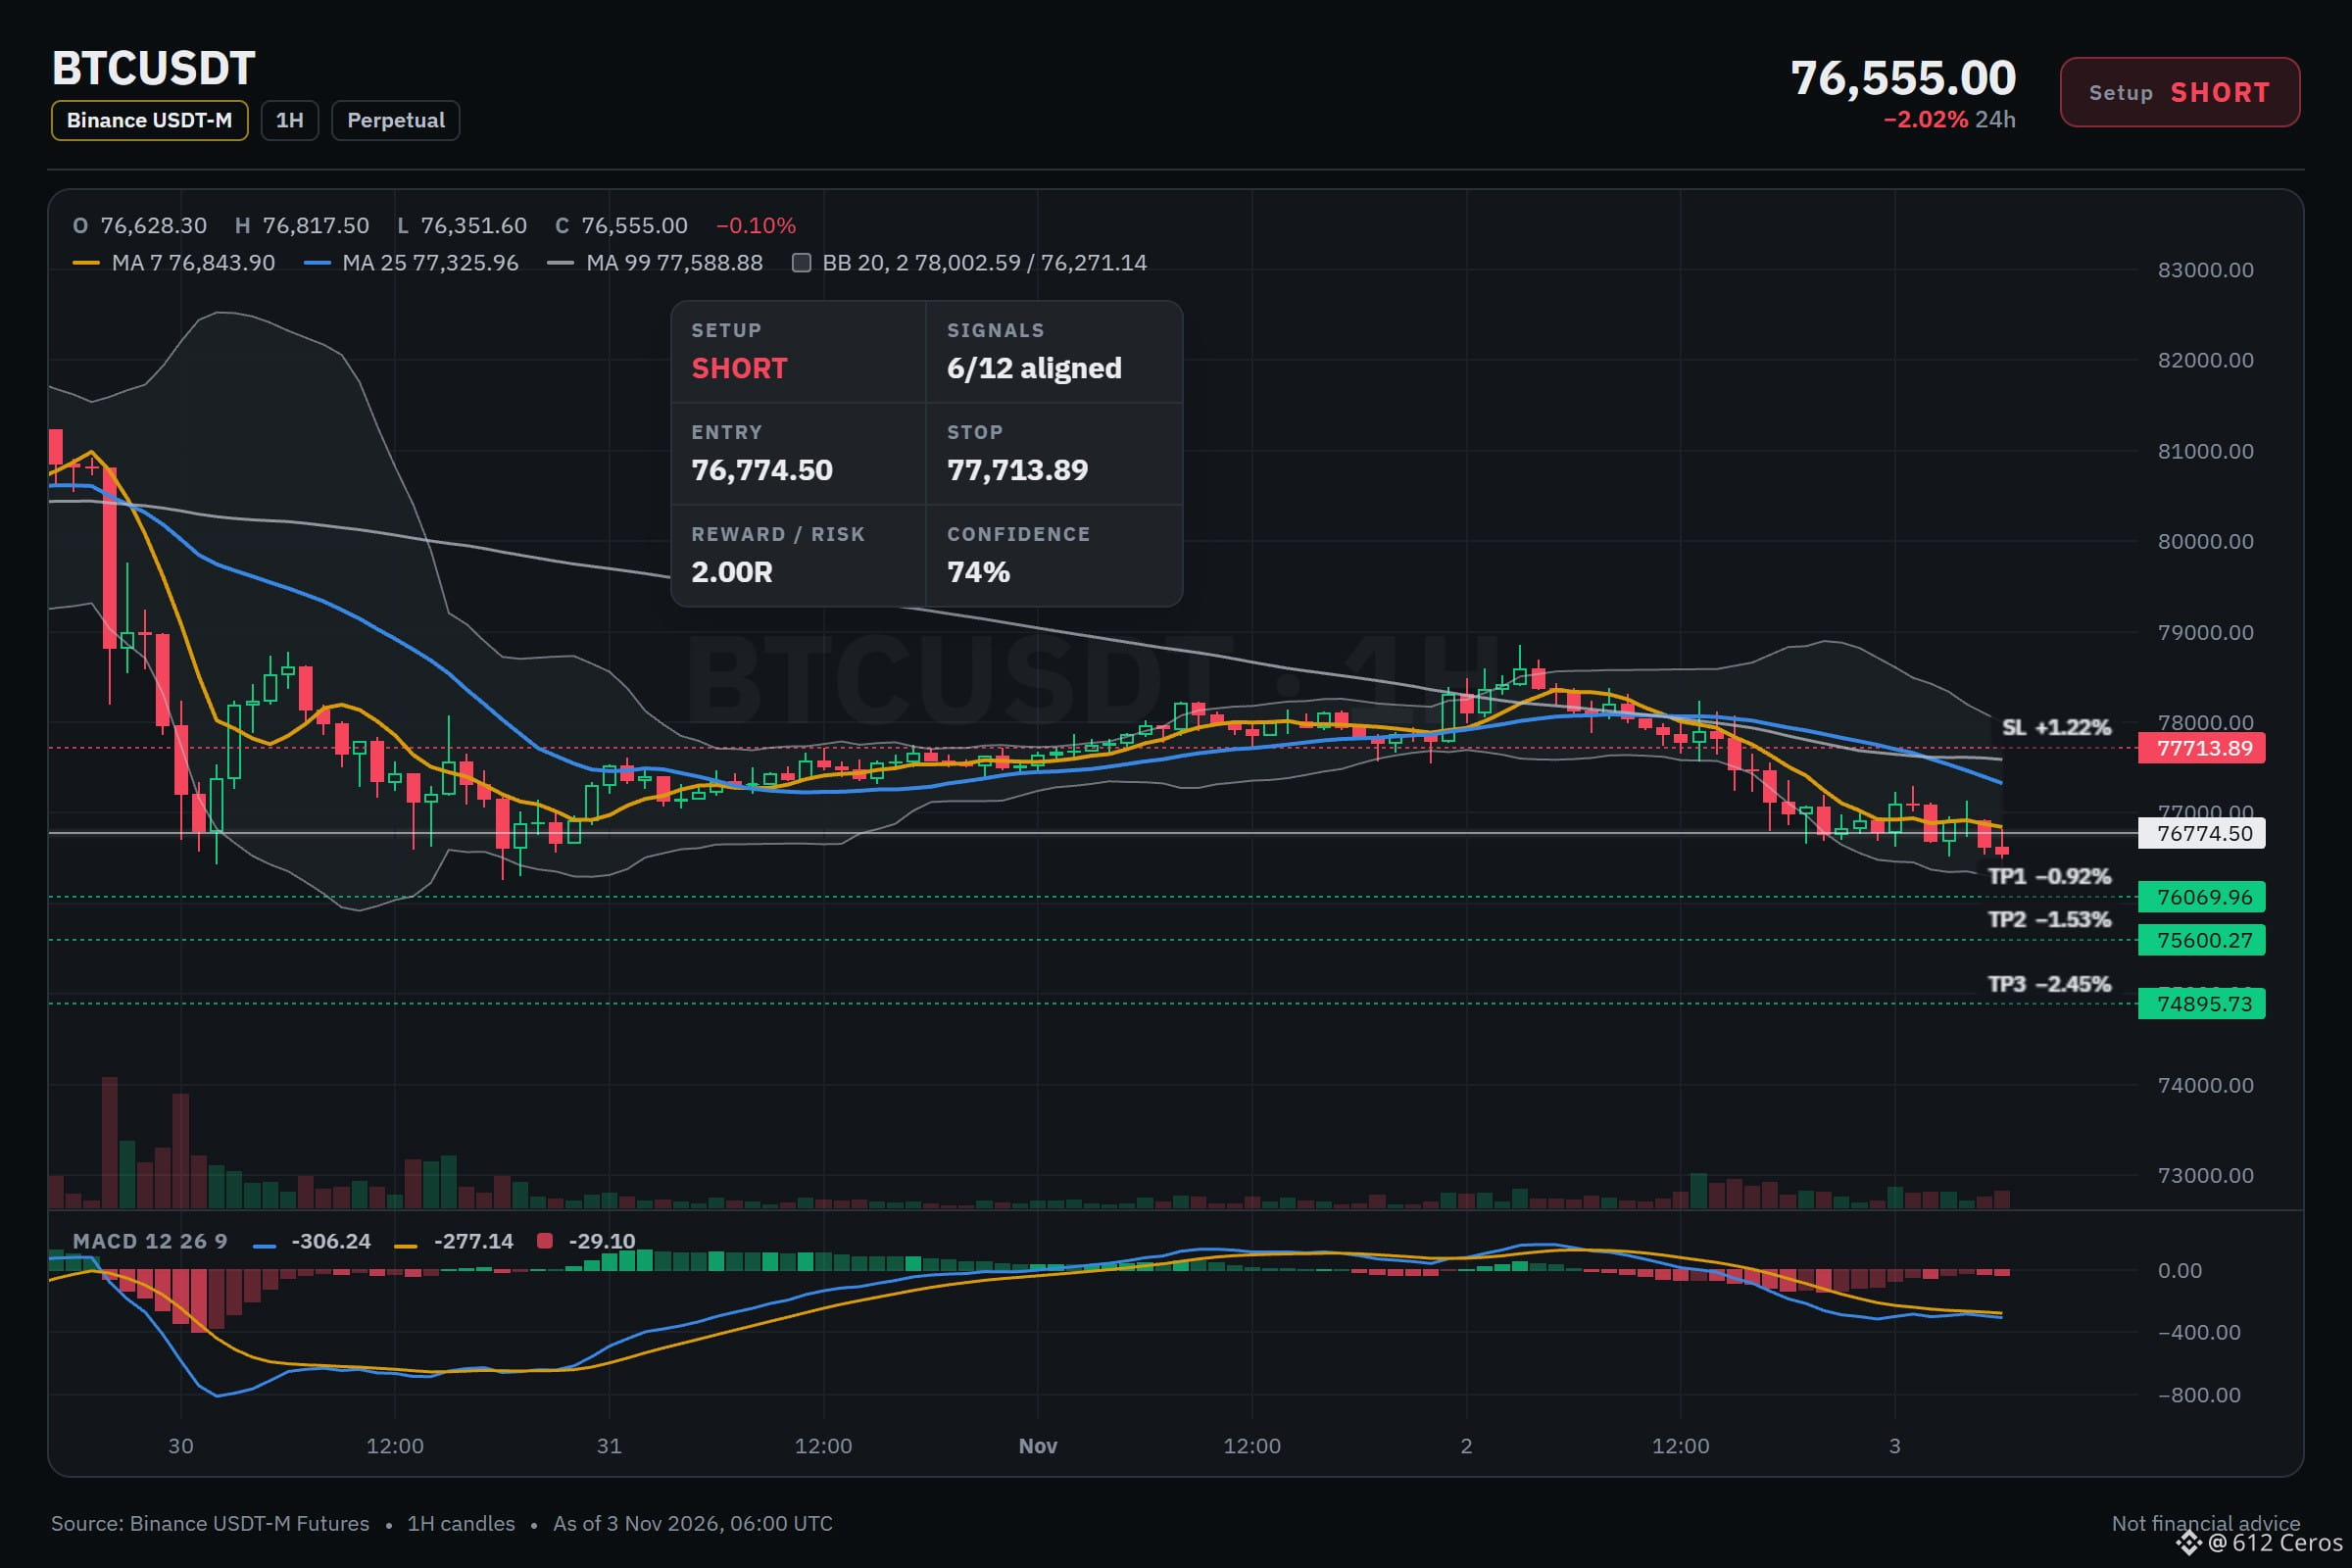
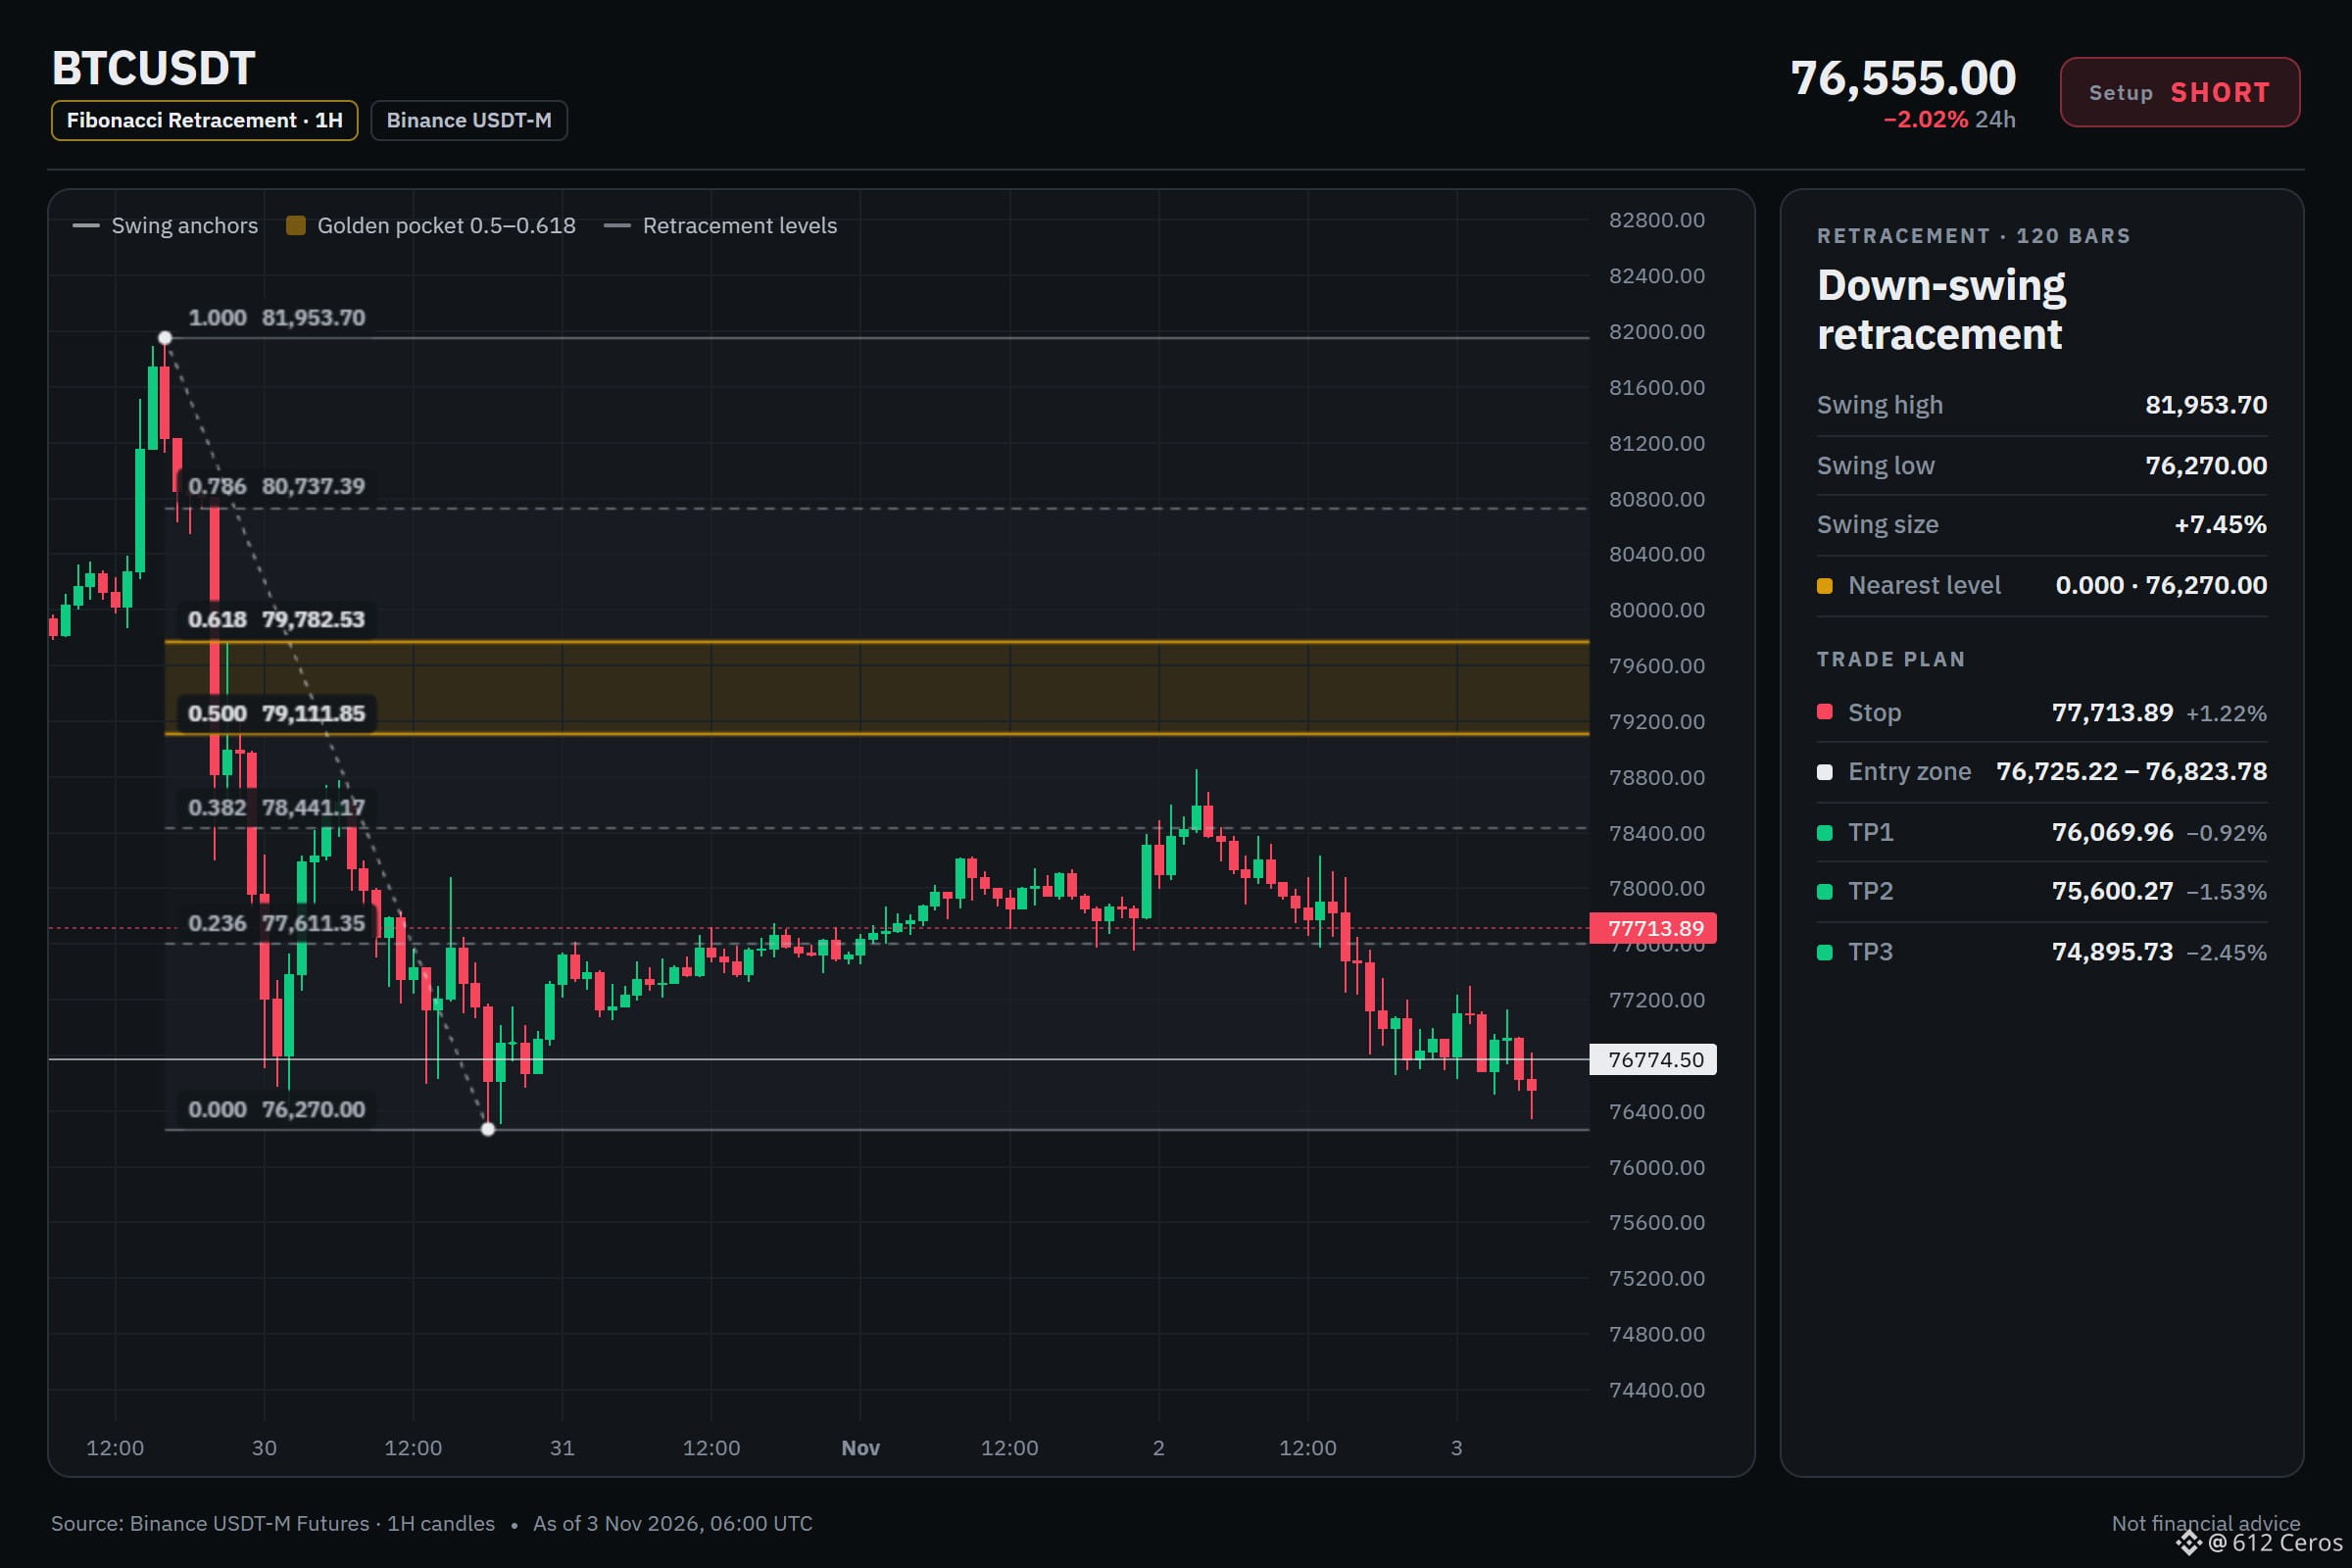
🔴 SHORT $BTC /USDT: expecting price to go DOWN
Bias: SHORT · Strong
Entry: 76725.22 – 76823.78
TP1: 76069.96 (-0.9%)
TP2: 75600.27 (-1.5%)
TP3: 74895.73 (-2.4%)
SL: 77713.89 (+1.2%)
Plan: enter only inside the zone, close 50% at TP1, 25% at TP2, 25% at TP3, and move the stop to entry after TP1.
4h bearish stack holds on BTC
Why SHORT? 6/12 signals agree, 0 against.
• 4h trend down (below EMA50 & EMA200)
• 1h trend down (below EMA50 & EMA200)
• Sellers are driving the move (15m ADX 24.5)
BTC is below the EMA50 and EMA200 on the 4h chart, confirming the swing trend is down. The 1h chart shows the same bearish stack and sellers are in control with ADX 24.5 and DI− at 30.7.
Where do you want your invalidation on BTC?
Full setup on the chart below.
{future}(BTCUSDT)
📲 Want more of my latest signals? Join me here:
[https://app.binance.com/uni-qr/D26WbL9t](https://app.binance.com/uni-qr/D26WbL9t)
⚠️ Personal market analysis only. NFA — manage risk and DYOR.
Educational content, not investment advice or a recommendation to buy, sell, deposit, or withdraw any asset. No paid promotion or referral/affiliate links.
🔴 SHORT $BTC /USDT: expecting price to go DOWN
Bias: SHORT · Strong
Entry: 76725.22 – 76823.78
TP1: 76069.96 (-0.9%)
TP2: 75600.27 (-1.5%)
TP3: 74895.73 (-2.4%)
SL: 77713.89 (+1.2%)
Plan: enter only inside the zone, close 50% at TP1, 25% at TP2, 25% at TP3, and move the stop to entry after TP1.
4h bearish stack holds on BTC
Why SHORT? 6/12 signals agree, 0 against.
• 4h trend down (below EMA50 & EMA200)
• 1h trend down (below EMA50 & EMA200)
• Sellers are driving the move (15m ADX 24.5)
BTC is below the EMA50 and EMA200 on the 4h chart, confirming the swing trend is down. The 1h chart shows the same bearish stack and sellers are in control with ADX 24.5 and DI− at 30.7.
Where do you want your invalidation on BTC?
Full setup on the chart below.
📲 Want more of my latest signals? Join me here:
https://app.binance.com/uni-qr/D26WbL9t
⚠️ Personal market analysis only. NFA — manage risk and DYOR.
Educational content, not investment advice or a recommendation to buy, sell, deposit, or withdraw any asset. No paid promotion or referral/affiliate links.
Bias: SHORT · Strong
Entry: 76725.22 – 76823.78
TP1: 76069.96 (-0.9%)
TP2: 75600.27 (-1.5%)
TP3: 74895.73 (-2.4%)
SL: 77713.89 (+1.2%)
Plan: enter only inside the zone, close 50% at TP1, 25% at TP2, 25% at TP3, and move the stop to entry after TP1.
4h bearish stack holds on BTC
Why SHORT? 6/12 signals agree, 0 against.
• 4h trend down (below EMA50 & EMA200)
• 1h trend down (below EMA50 & EMA200)
• Sellers are driving the move (15m ADX 24.5)
BTC is below the EMA50 and EMA200 on the 4h chart, confirming the swing trend is down. The 1h chart shows the same bearish stack and sellers are in control with ADX 24.5 and DI− at 30.7.
Where do you want your invalidation on BTC?
Full setup on the chart below.
📲 Want more of my latest signals? Join me here:
https://app.binance.com/uni-qr/D26WbL9t
⚠️ Personal market analysis only. NFA — manage risk and DYOR.
Educational content, not investment advice or a recommendation to buy, sell, deposit, or withdraw any asset. No paid promotion or referral/affiliate links.
1
628
·
--
Bearish
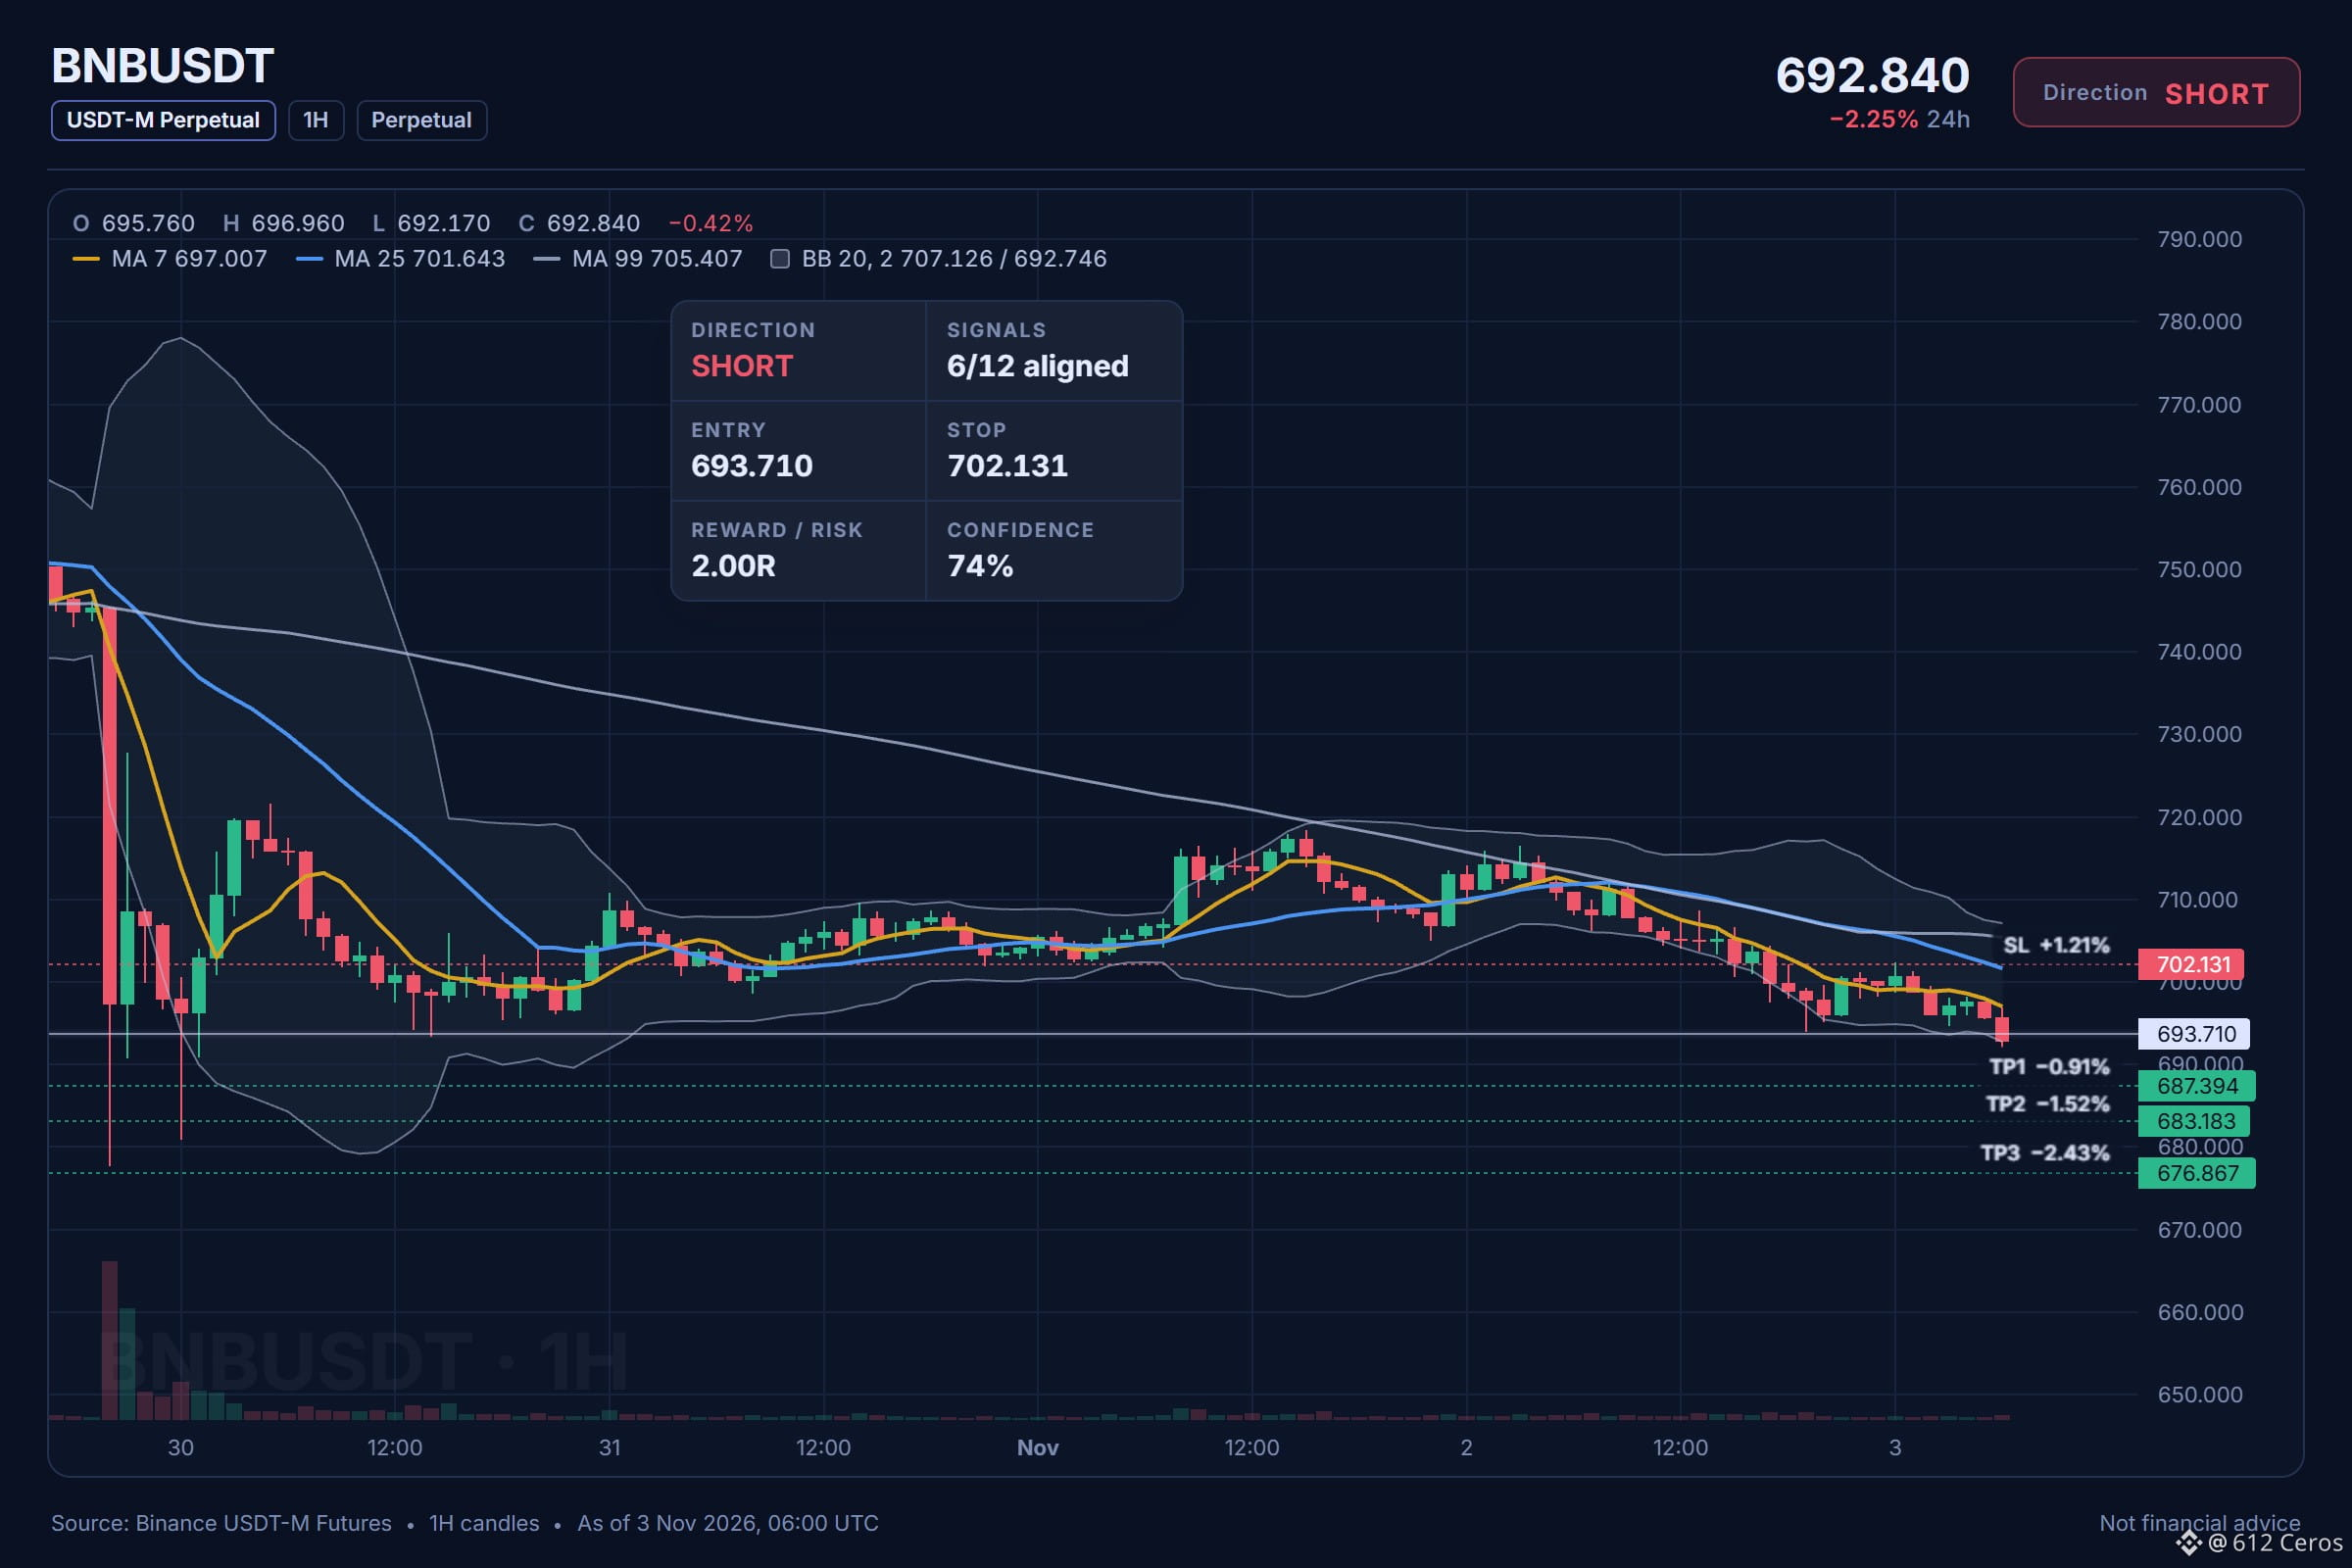
BNB is ignoring the daily range and sliding
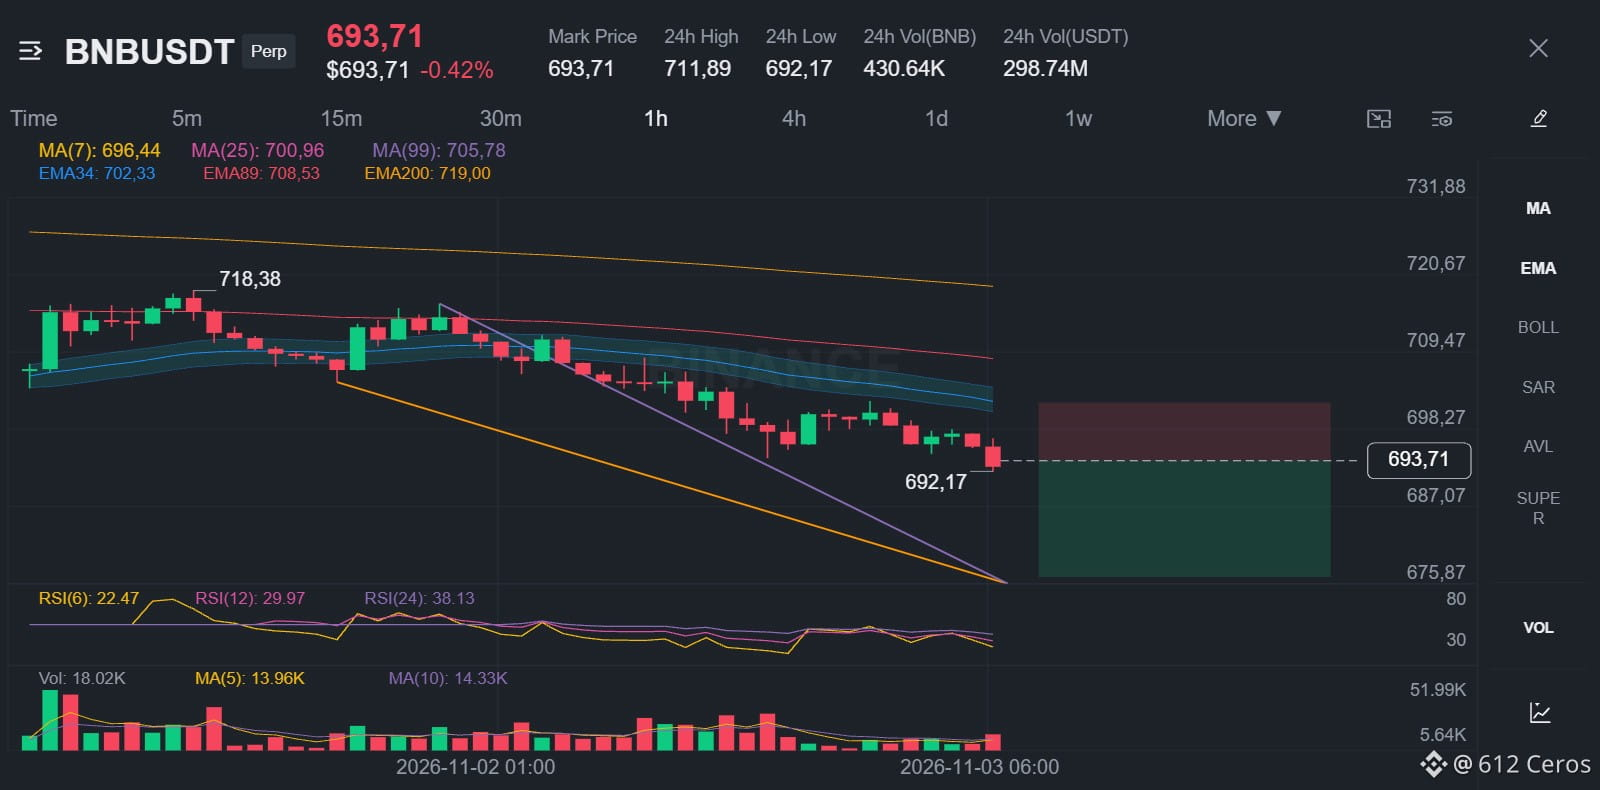
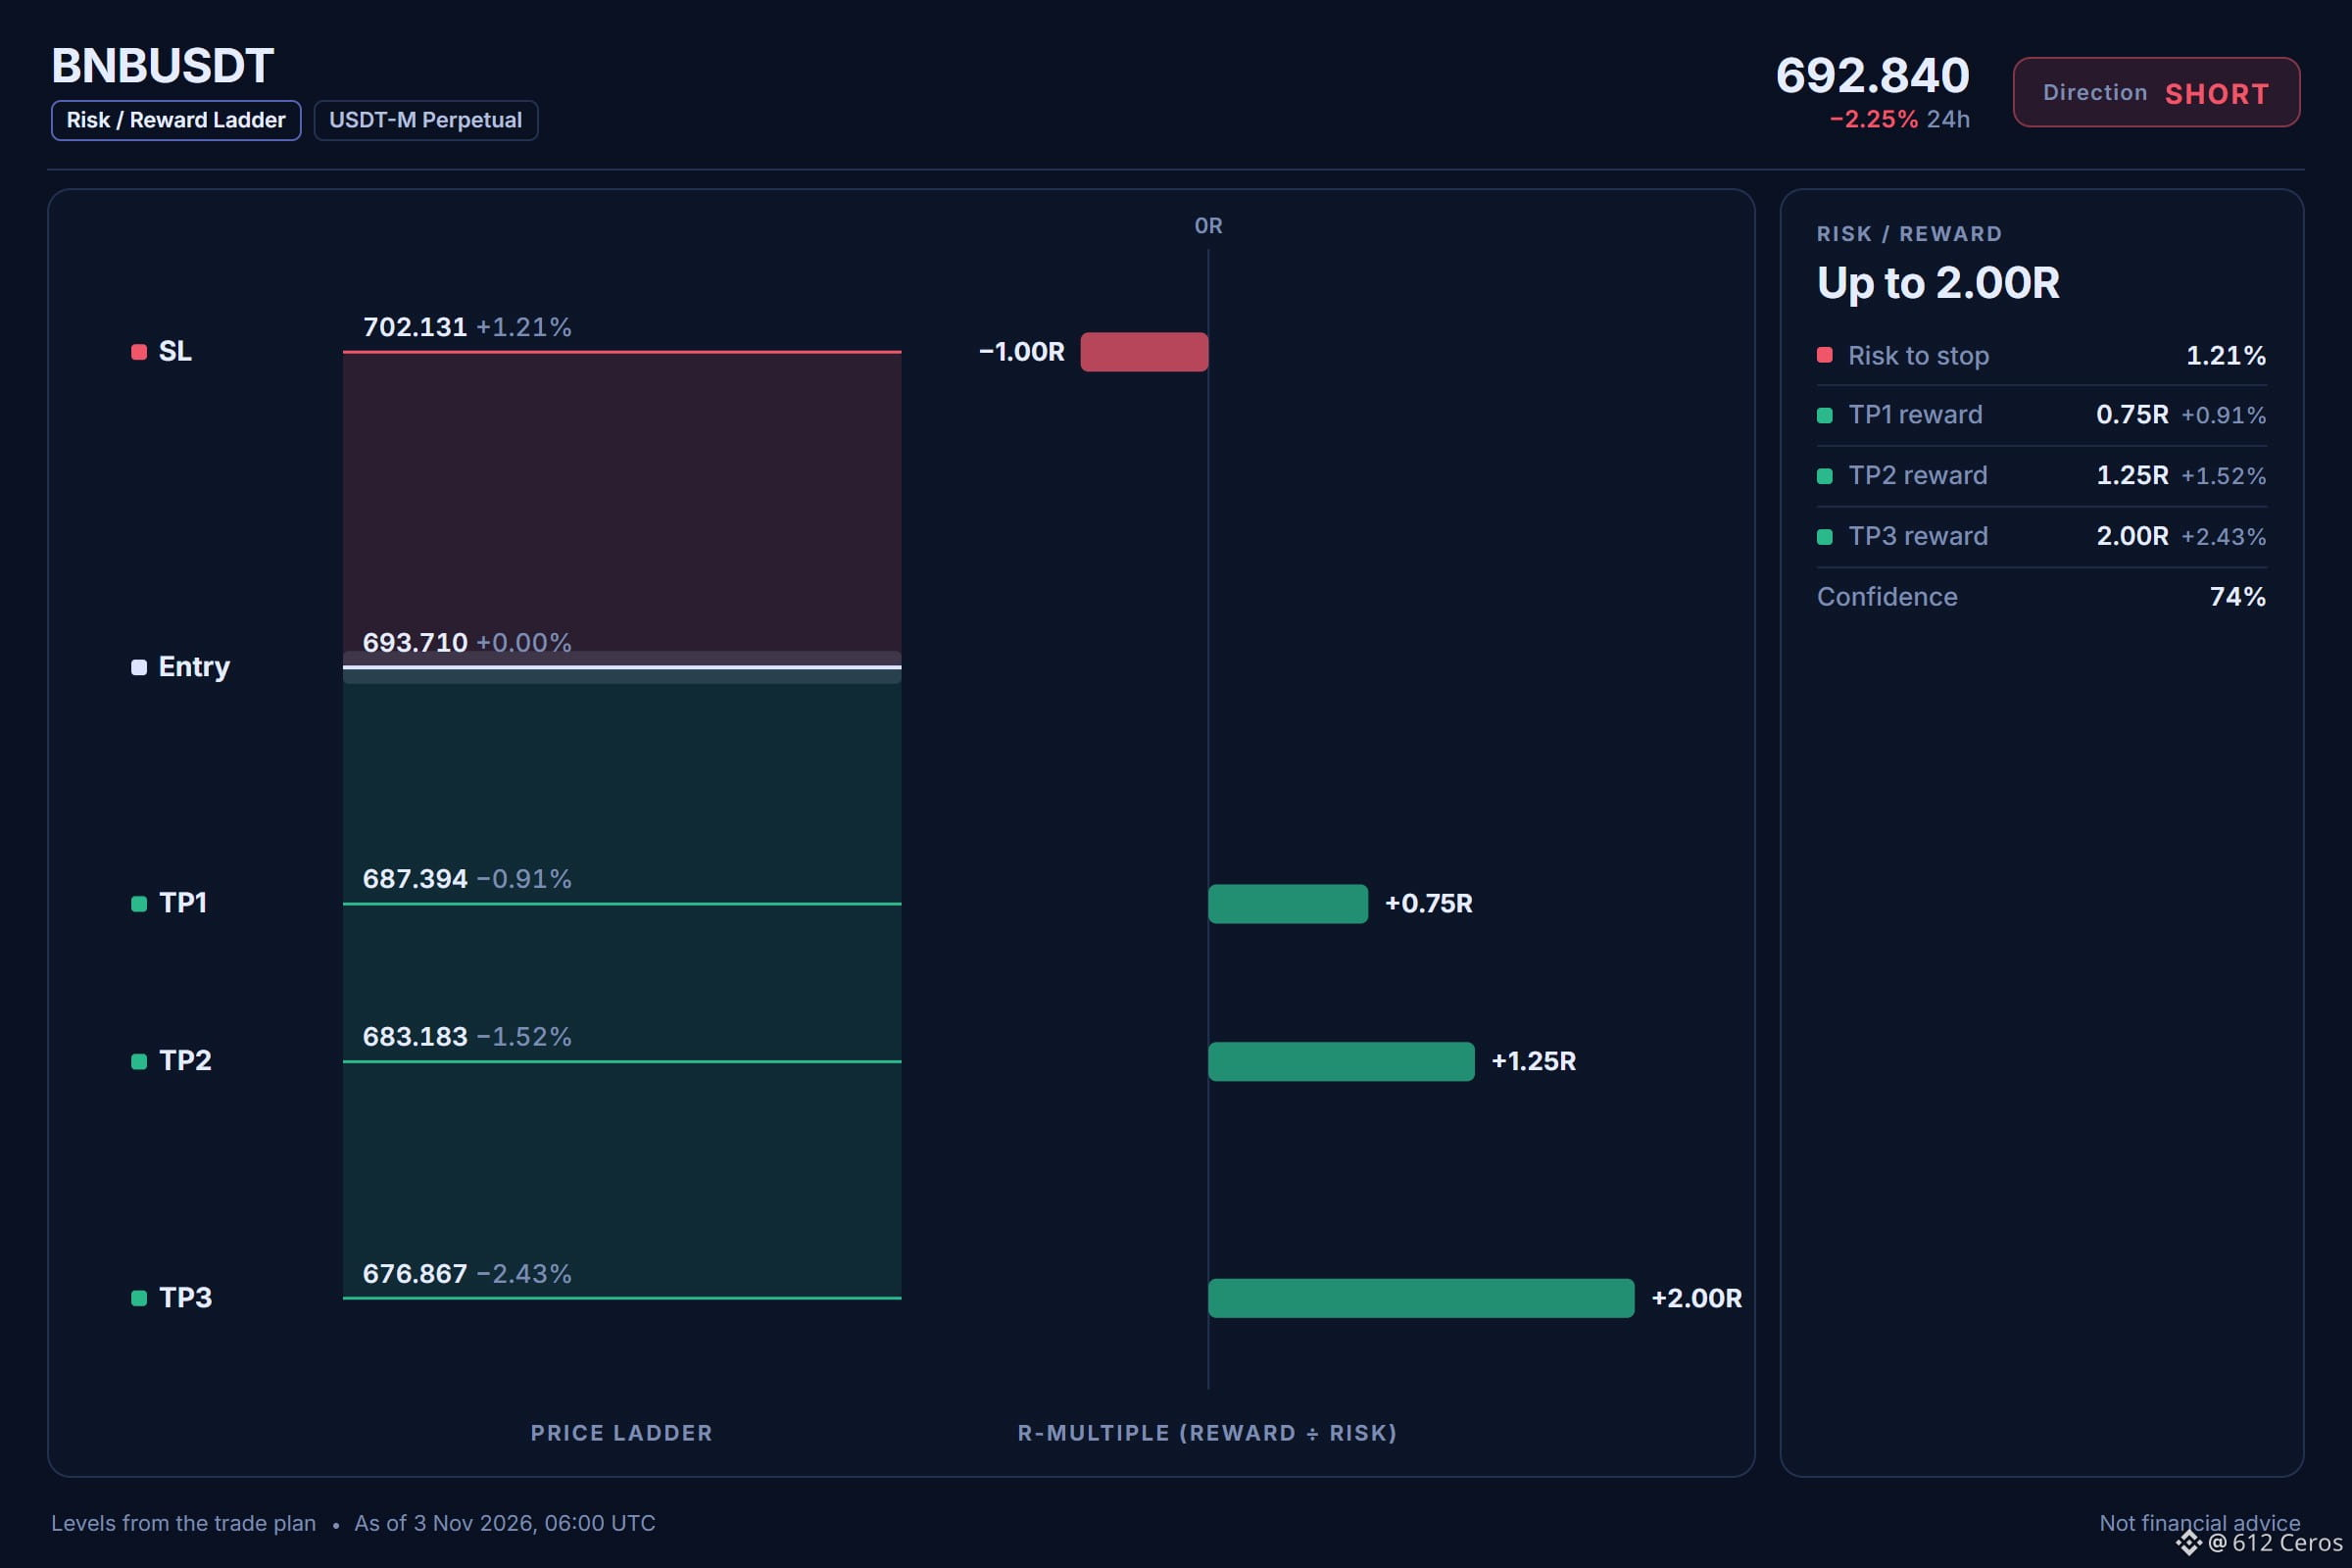
🔴 SHORT $BNB /USDT: expecting price to go DOWN
Bias: SHORT · Strong
Entry: 693.272 – 694.148
TP1: 687.394 (-0.9%)
TP2: 683.183 (-1.5%)
TP3: 676.867 (-2.4%)
SL: 702.131 (+1.2%)
Plan: enter only inside the zone, close 50% at TP1, 25% at TP2, 25% at TP3, and move the stop to entry after TP1.
Why SHORT? 6/12 signals agree, 0 against.
• 4h trend down (below EMA50 & EMA200)
• 1h trend down (below EMA50 & EMA200)
• Sellers are driving the move (15m ADX 29.9)
In plain words:
The 1h price is below both its EMA50 and EMA200, a bearish stack that has held through the recent bounce. Sellers are in control on the 4h trend and the 1h trend, with the 1h RSI at 30.9 showing continued bearish momentum. The 4h RSI is also below 45 at 37.5, confirming the short-term slide. The 15m ADX reads 29.9 with the DI minus at 36.3 far above the DI plus at 12.6, meaning the selling pressure is dominant and driving the move. BTC is trending bearish and the correlation sits at 0.84, so BNB tends to follow that weakness.
Where would you place your own invalidation level?
Full setup on the chart below.
{future}(BNBUSDT)
📲 Want more of my latest signals? Join me here:
[https://app.binance.com/uni-qr/D26WbL9t](https://app.binance.com/uni-qr/D26WbL9t)
⚠️ Personal market analysis only. NFA — manage risk and DYOR.
Educational content, not investment advice or a recommendation to buy, sell, deposit, or withdraw any asset. No paid promotion or referral/affiliate links.
BNB is ignoring the daily range and sliding
🔴 SHORT $BNB /USDT: expecting price to go DOWN
Bias: SHORT · Strong
Entry: 693.272 – 694.148
TP1: 687.394 (-0.9%)
TP2: 683.183 (-1.5%)
TP3: 676.867 (-2.4%)
SL: 702.131 (+1.2%)
Plan: enter only inside the zone, close 50% at TP1, 25% at TP2, 25% at TP3, and move the stop to entry after TP1.
Why SHORT? 6/12 signals agree, 0 against.
• 4h trend down (below EMA50 & EMA200)
• 1h trend down (below EMA50 & EMA200)
• Sellers are driving the move (15m ADX 29.9)
In plain words:
The 1h price is below both its EMA50 and EMA200, a bearish stack that has held through the recent bounce. Sellers are in control on the 4h trend and the 1h trend, with the 1h RSI at 30.9 showing continued bearish momentum. The 4h RSI is also below 45 at 37.5, confirming the short-term slide. The 15m ADX reads 29.9 with the DI minus at 36.3 far above the DI plus at 12.6, meaning the selling pressure is dominant and driving the move. BTC is trending bearish and the correlation sits at 0.84, so BNB tends to follow that weakness.
Where would you place your own invalidation level?
Full setup on the chart below.
📲 Want more of my latest signals? Join me here:
https://app.binance.com/uni-qr/D26WbL9t
⚠️ Personal market analysis only. NFA — manage risk and DYOR.
Educational content, not investment advice or a recommendation to buy, sell, deposit, or withdraw any asset. No paid promotion or referral/affiliate links.
🔴 SHORT $BNB /USDT: expecting price to go DOWN
Bias: SHORT · Strong
Entry: 693.272 – 694.148
TP1: 687.394 (-0.9%)
TP2: 683.183 (-1.5%)
TP3: 676.867 (-2.4%)
SL: 702.131 (+1.2%)
Plan: enter only inside the zone, close 50% at TP1, 25% at TP2, 25% at TP3, and move the stop to entry after TP1.
Why SHORT? 6/12 signals agree, 0 against.
• 4h trend down (below EMA50 & EMA200)
• 1h trend down (below EMA50 & EMA200)
• Sellers are driving the move (15m ADX 29.9)
In plain words:
The 1h price is below both its EMA50 and EMA200, a bearish stack that has held through the recent bounce. Sellers are in control on the 4h trend and the 1h trend, with the 1h RSI at 30.9 showing continued bearish momentum. The 4h RSI is also below 45 at 37.5, confirming the short-term slide. The 15m ADX reads 29.9 with the DI minus at 36.3 far above the DI plus at 12.6, meaning the selling pressure is dominant and driving the move. BTC is trending bearish and the correlation sits at 0.84, so BNB tends to follow that weakness.
Where would you place your own invalidation level?
Full setup on the chart below.
📲 Want more of my latest signals? Join me here:
https://app.binance.com/uni-qr/D26WbL9t
⚠️ Personal market analysis only. NFA — manage risk and DYOR.
Educational content, not investment advice or a recommendation to buy, sell, deposit, or withdraw any asset. No paid promotion or referral/affiliate links.
476
·
--
Bearish
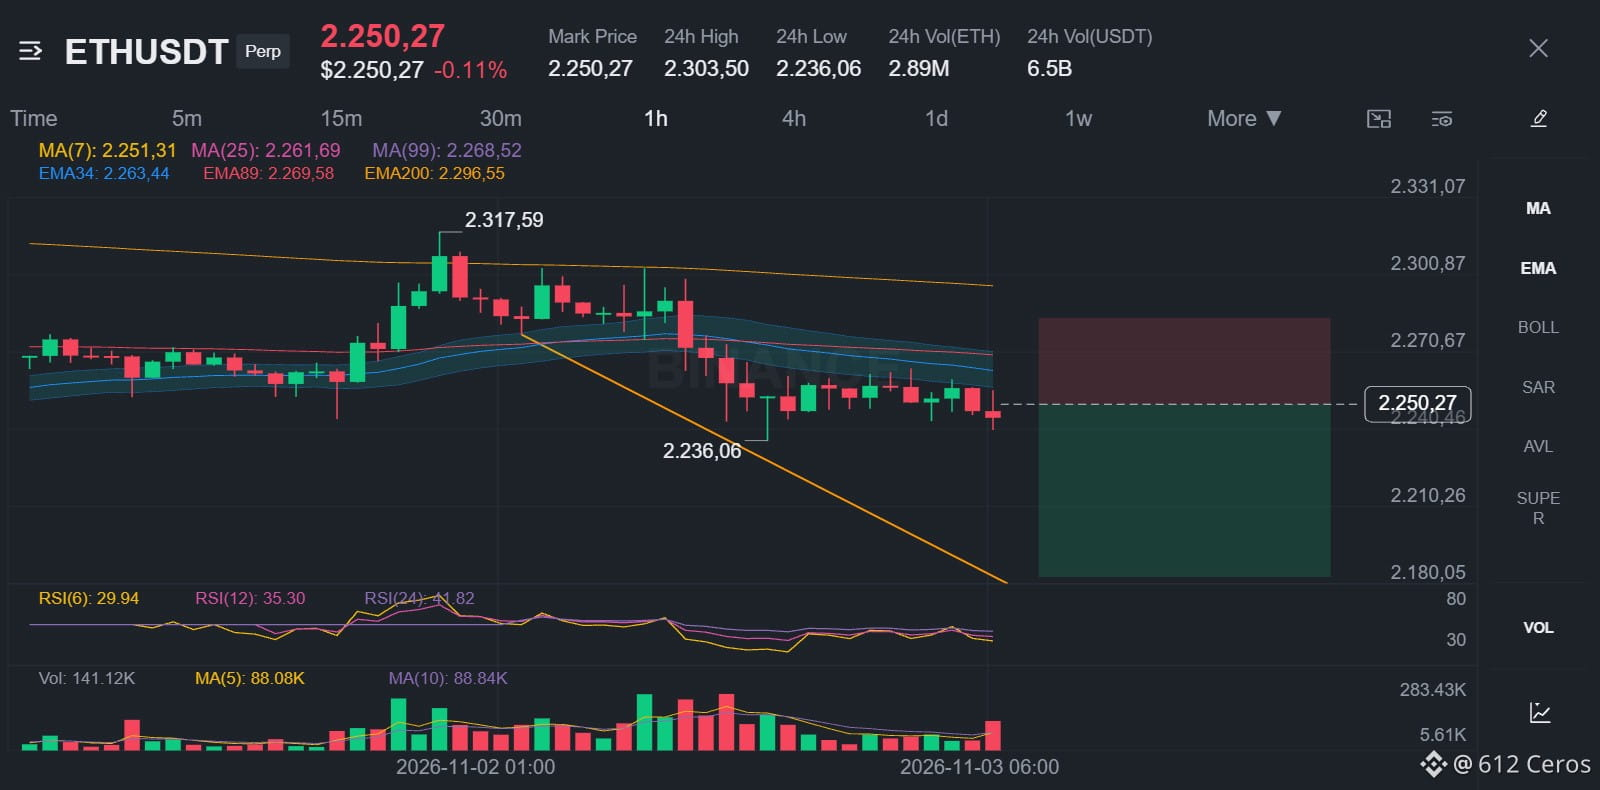
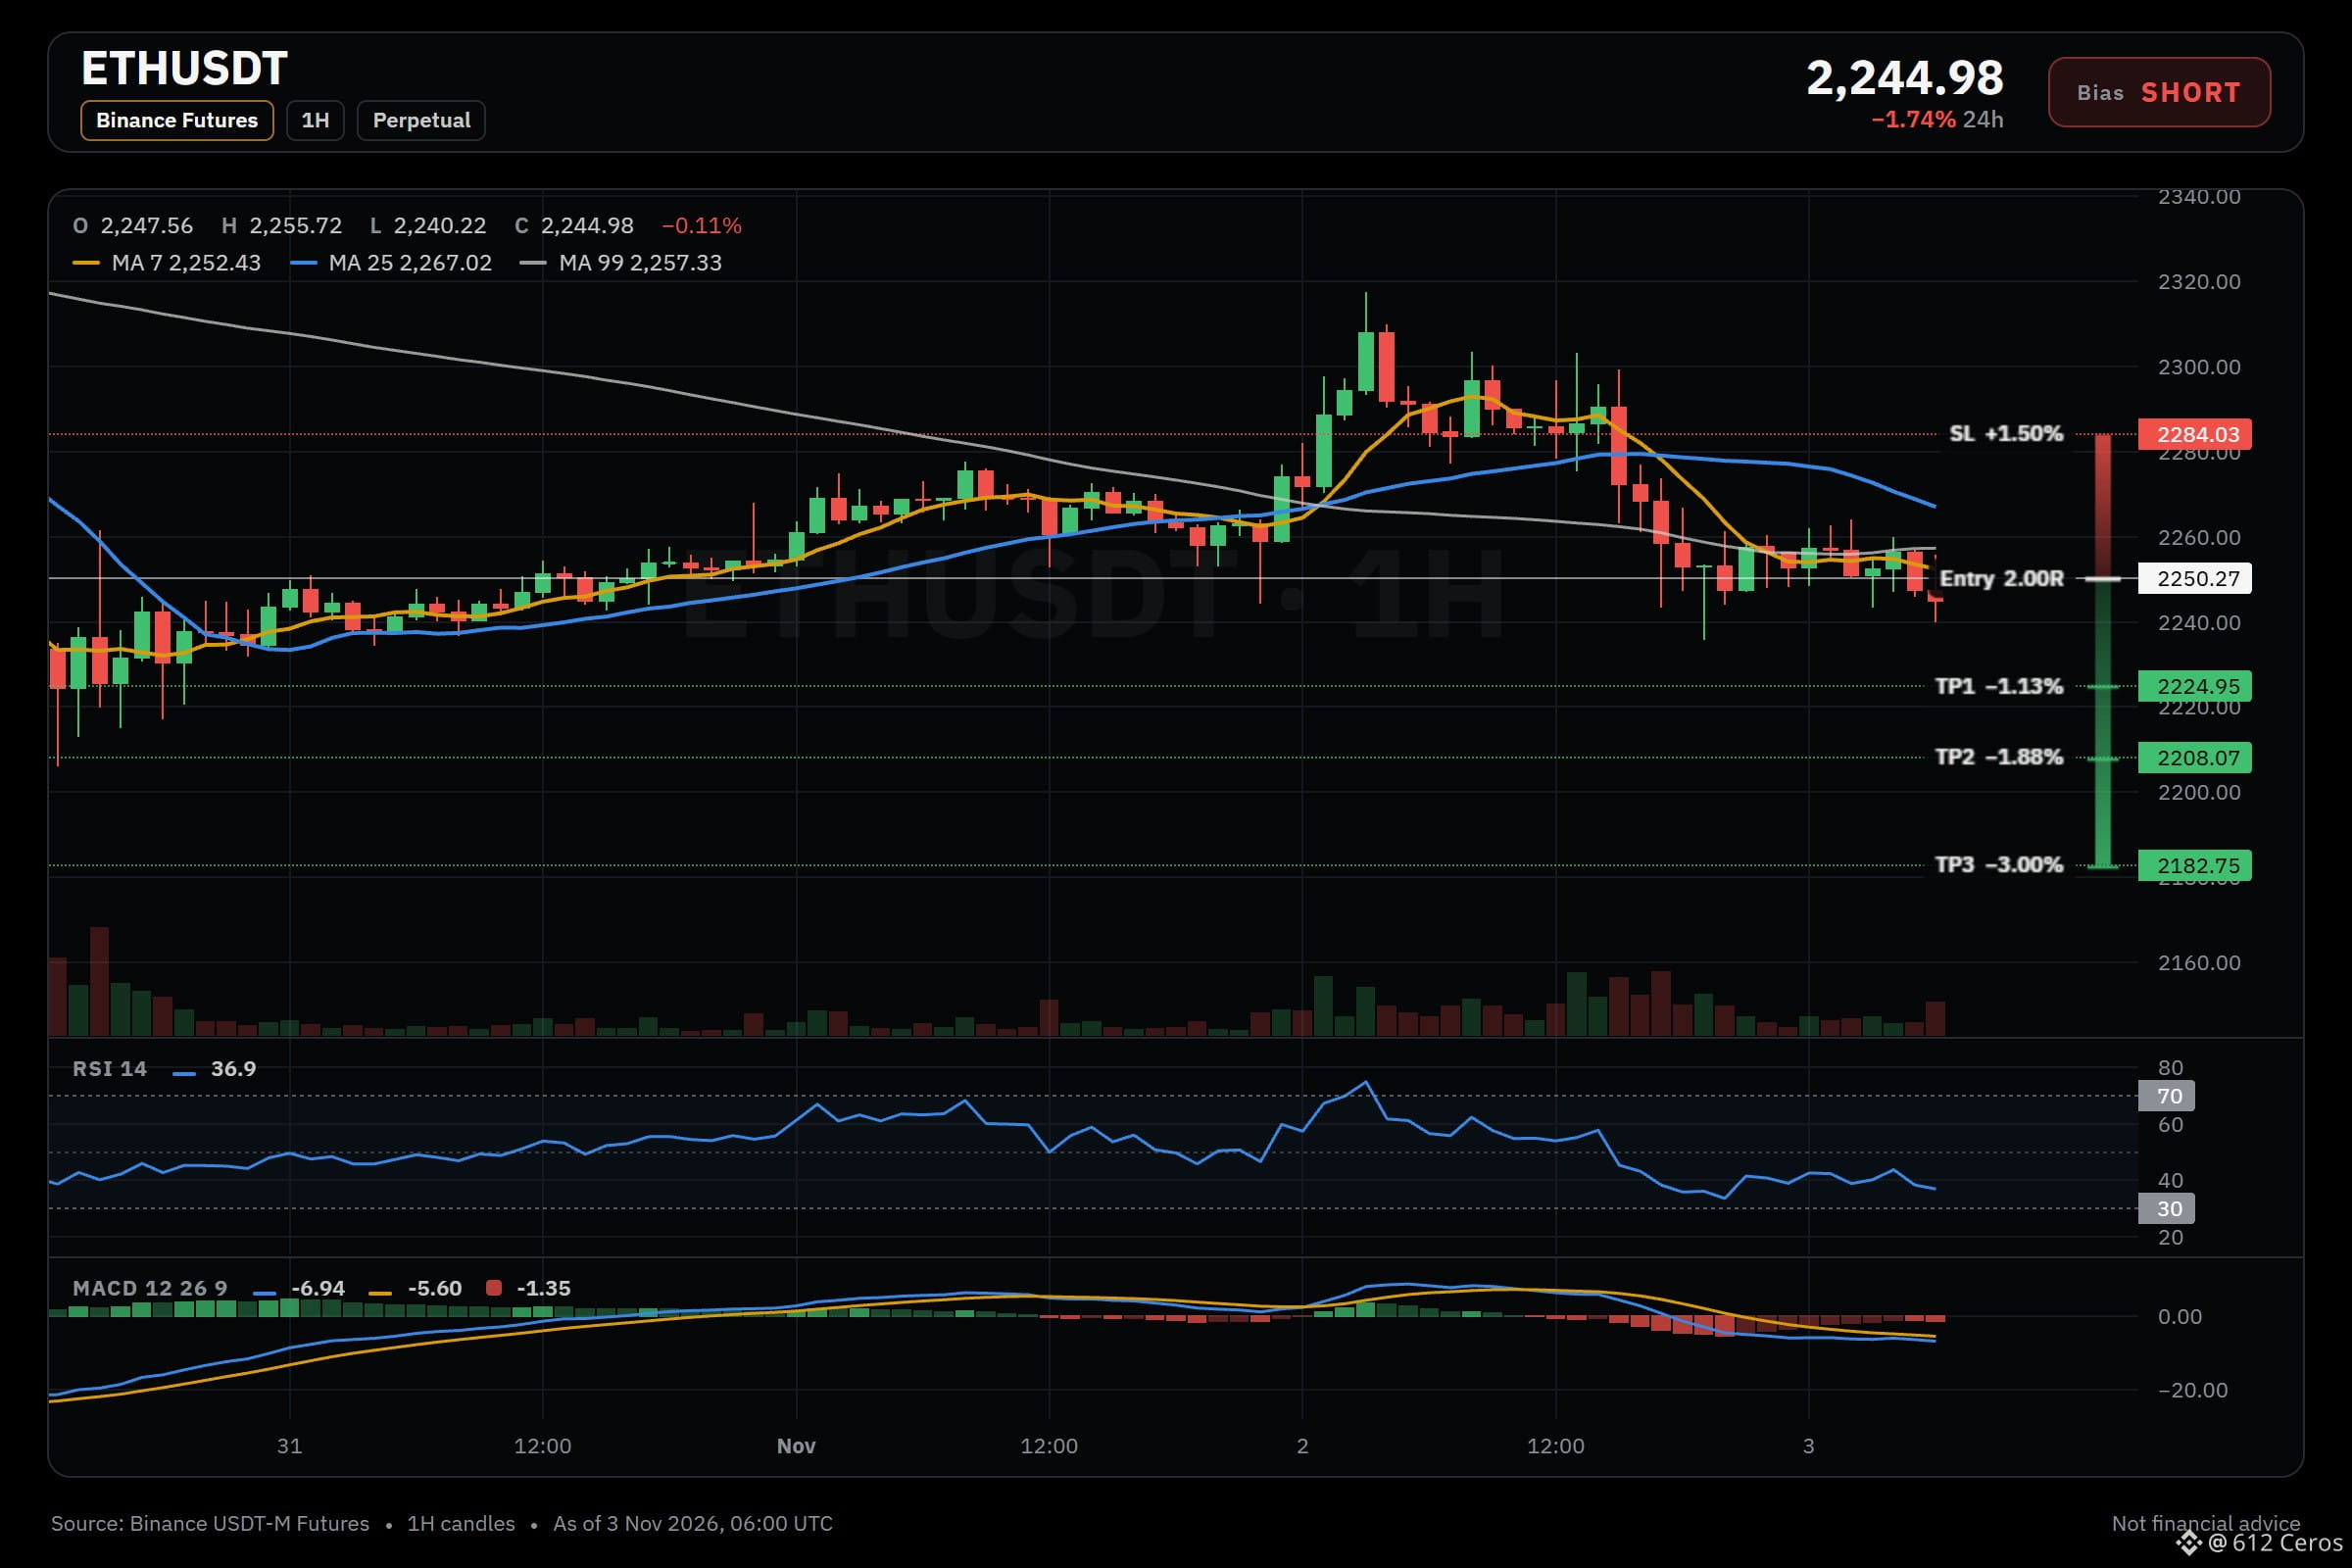
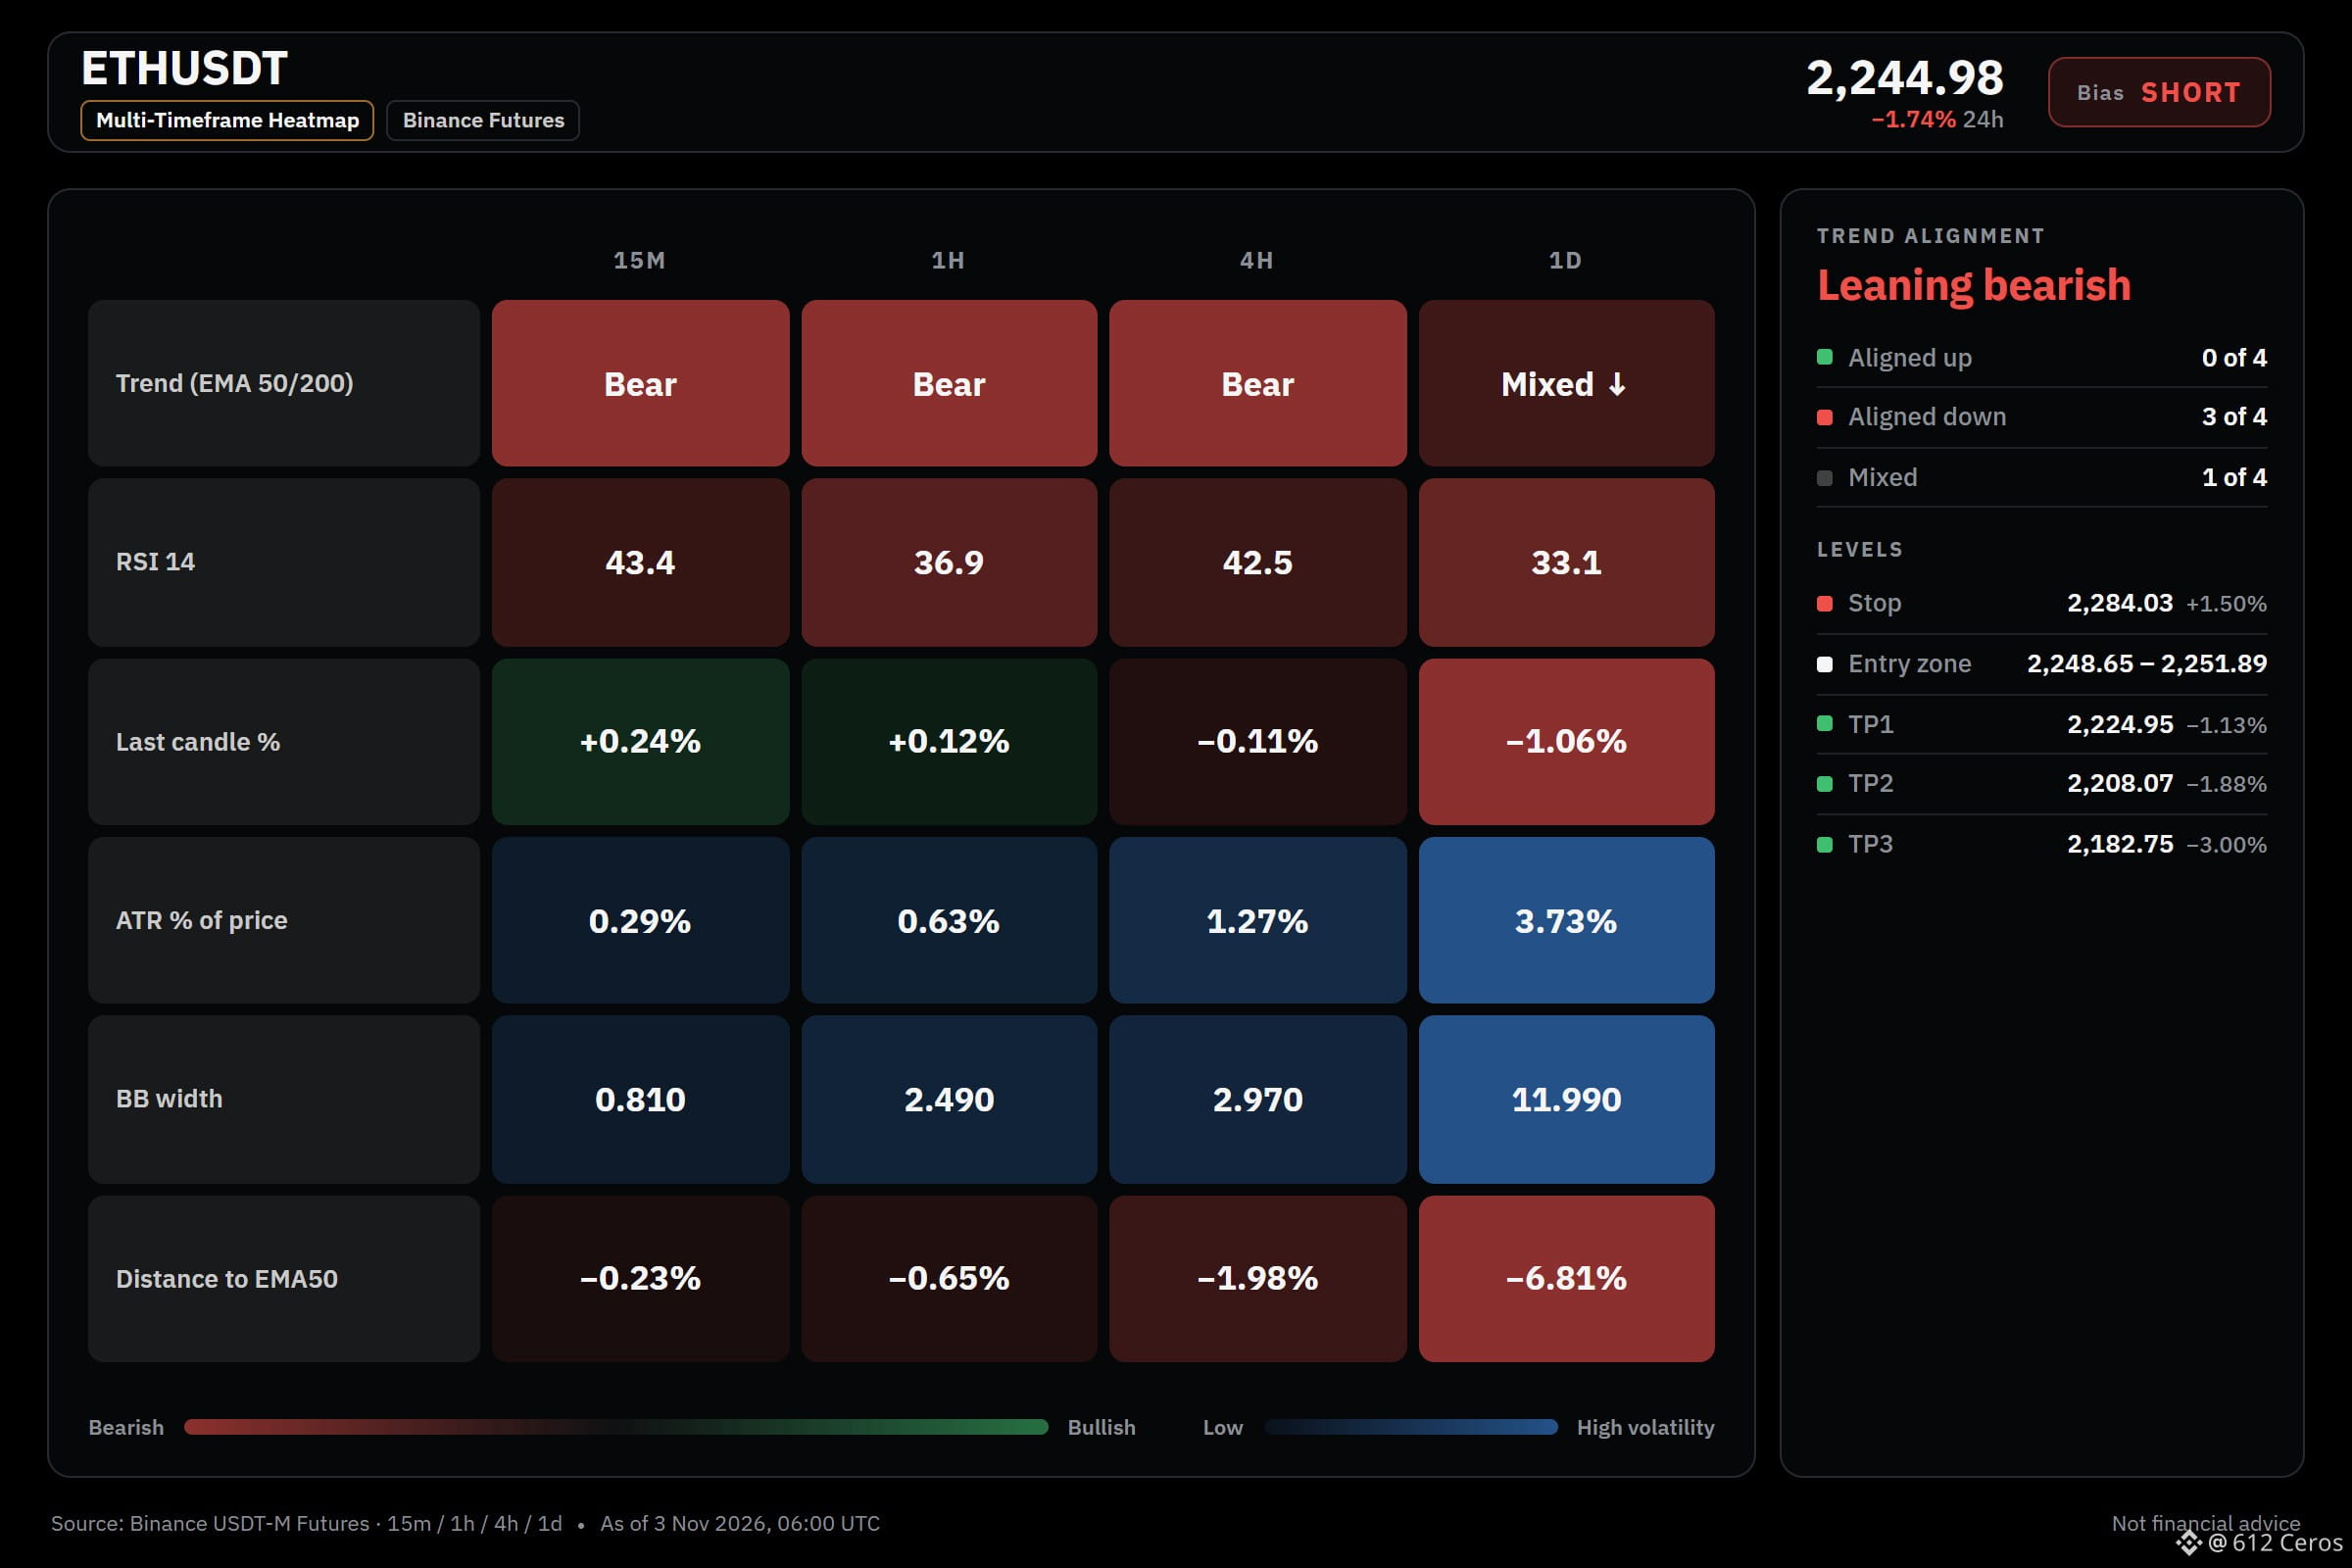
ETH is sliding below its bearish 4h stack
🔴 SHORT $ETH /USDT: expecting price to go DOWN
Bias: SHORT · Leaning
Entry: 2248.65 – 2251.89
TP1: 2224.95 (-1.1%)
TP2: 2208.07 (-1.9%)
TP3: 2182.75 (-3.0%)
SL: 2284.03 (+1.5%)
Plan: enter only inside the zone, close 50% at TP1, 25% at TP2, 25% at TP3, and move the stop to entry after TP1.
Note: moderate conviction only, keep size light.
Why SHORT? 5/12 signals agree, 0 against.
• 4h trend down (below EMA50 & EMA200)
• 1h trend down (below EMA50 & EMA200)
• BTC is falling, this coin follows (corr 0.90)
If it plays out:
Price should keep falling toward 2224.95 and 2208.07 if the 4h trend stays down.
If it fails:
A close above 2284.03 would prove sellers are losing control and I would exit the short.
What level would make you hesitate on this short?
Full setup on the chart below.
{future}(ETHUSDT)
📲 Want more of my latest signals? Join me here:
[https://app.binance.com/uni-qr/D26WbL9t](https://app.binance.com/uni-qr/D26WbL9t)
⚠️ Personal market analysis only. NFA — manage risk and DYOR.
Educational content, not investment advice or a recommendation to buy, sell, deposit, or withdraw any asset. No paid promotion or referral/affiliate links.
ETH is sliding below its bearish 4h stack
🔴 SHORT $ETH /USDT: expecting price to go DOWN
Bias: SHORT · Leaning
Entry: 2248.65 – 2251.89
TP1: 2224.95 (-1.1%)
TP2: 2208.07 (-1.9%)
TP3: 2182.75 (-3.0%)
SL: 2284.03 (+1.5%)
Plan: enter only inside the zone, close 50% at TP1, 25% at TP2, 25% at TP3, and move the stop to entry after TP1.
Note: moderate conviction only, keep size light.
Why SHORT? 5/12 signals agree, 0 against.
• 4h trend down (below EMA50 & EMA200)
• 1h trend down (below EMA50 & EMA200)
• BTC is falling, this coin follows (corr 0.90)
If it plays out:
Price should keep falling toward 2224.95 and 2208.07 if the 4h trend stays down.
If it fails:
A close above 2284.03 would prove sellers are losing control and I would exit the short.
What level would make you hesitate on this short?
Full setup on the chart below.
📲 Want more of my latest signals? Join me here:
https://app.binance.com/uni-qr/D26WbL9t
⚠️ Personal market analysis only. NFA — manage risk and DYOR.
Educational content, not investment advice or a recommendation to buy, sell, deposit, or withdraw any asset. No paid promotion or referral/affiliate links.
🔴 SHORT $ETH /USDT: expecting price to go DOWN
Bias: SHORT · Leaning
Entry: 2248.65 – 2251.89
TP1: 2224.95 (-1.1%)
TP2: 2208.07 (-1.9%)
TP3: 2182.75 (-3.0%)
SL: 2284.03 (+1.5%)
Plan: enter only inside the zone, close 50% at TP1, 25% at TP2, 25% at TP3, and move the stop to entry after TP1.
Note: moderate conviction only, keep size light.
Why SHORT? 5/12 signals agree, 0 against.
• 4h trend down (below EMA50 & EMA200)
• 1h trend down (below EMA50 & EMA200)
• BTC is falling, this coin follows (corr 0.90)
If it plays out:
Price should keep falling toward 2224.95 and 2208.07 if the 4h trend stays down.
If it fails:
A close above 2284.03 would prove sellers are losing control and I would exit the short.
What level would make you hesitate on this short?
Full setup on the chart below.
📲 Want more of my latest signals? Join me here:
https://app.binance.com/uni-qr/D26WbL9t
⚠️ Personal market analysis only. NFA — manage risk and DYOR.
Educational content, not investment advice or a recommendation to buy, sell, deposit, or withdraw any asset. No paid promotion or referral/affiliate links.
1
437
·
--
Bearish
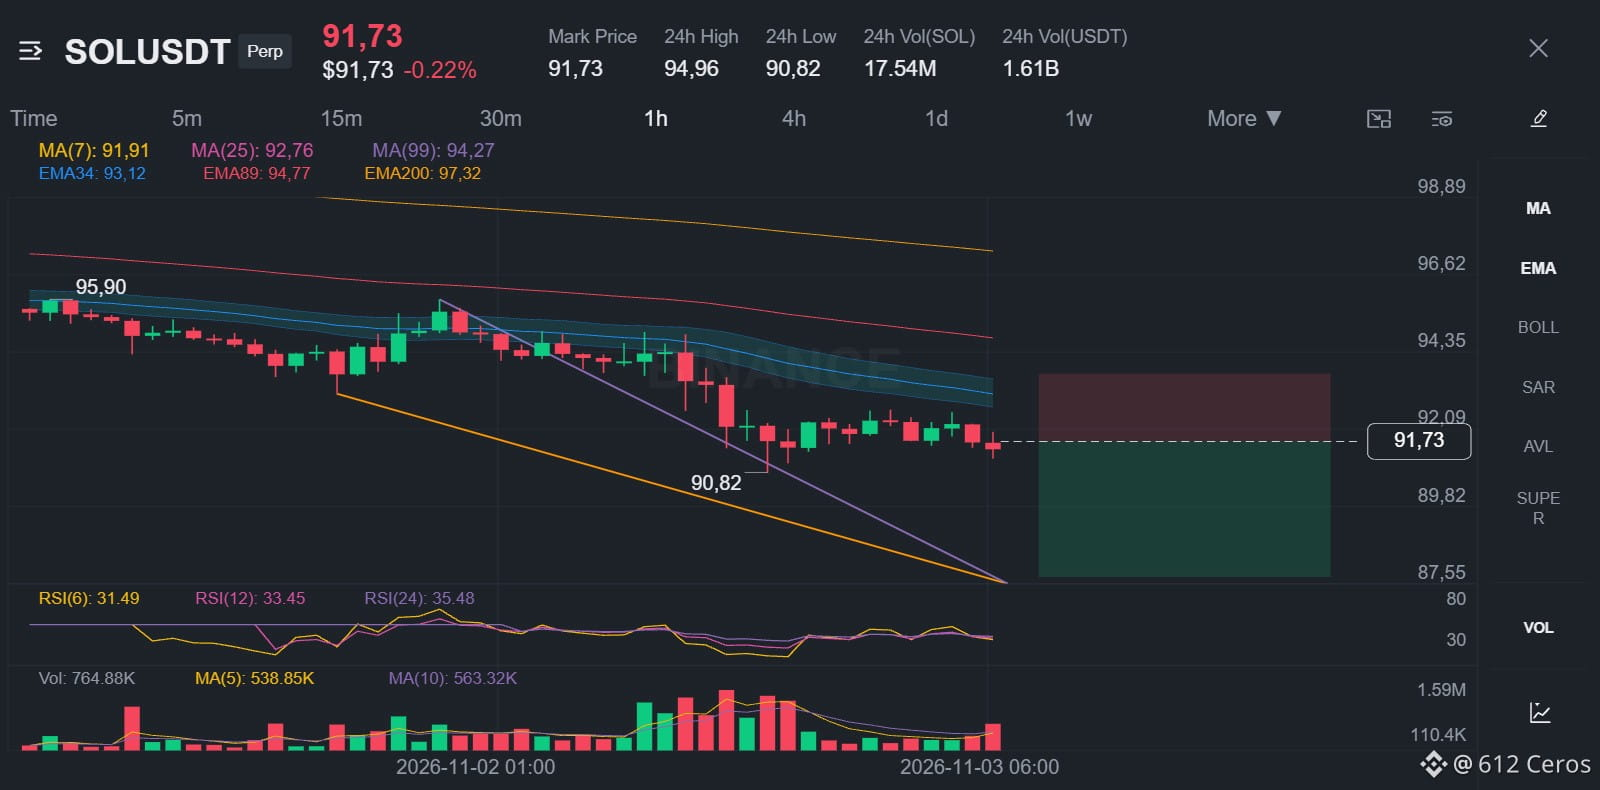
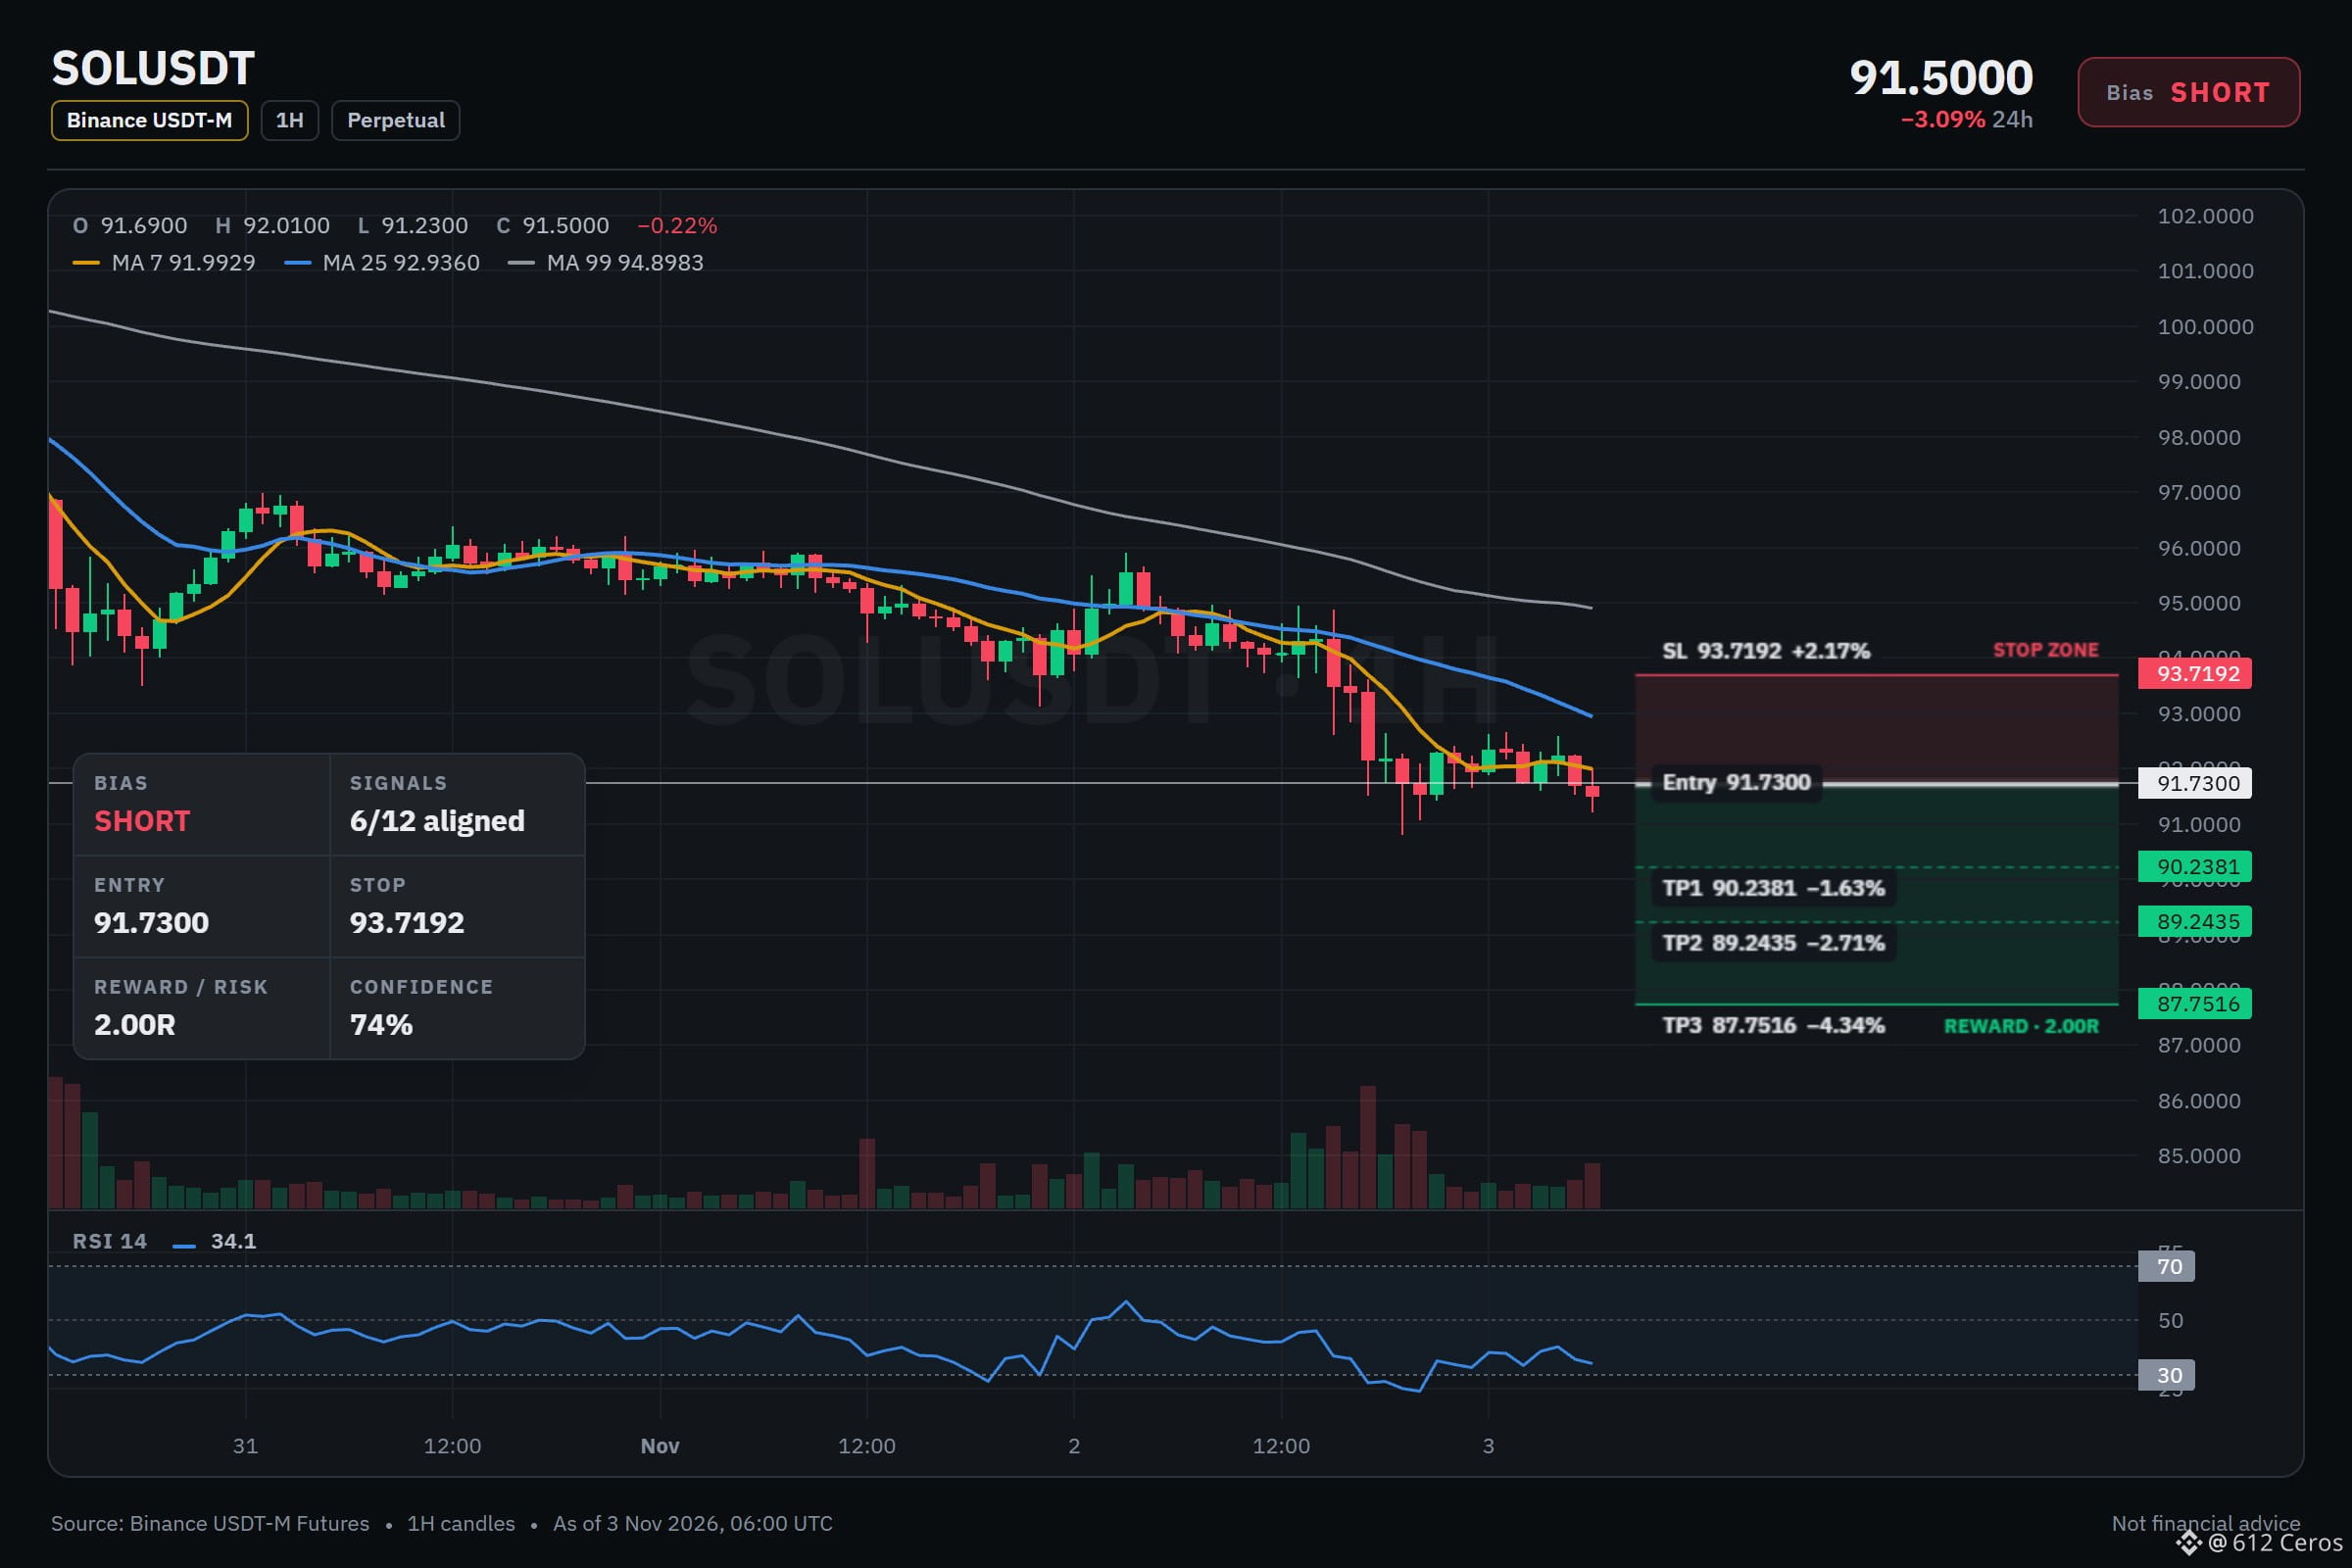
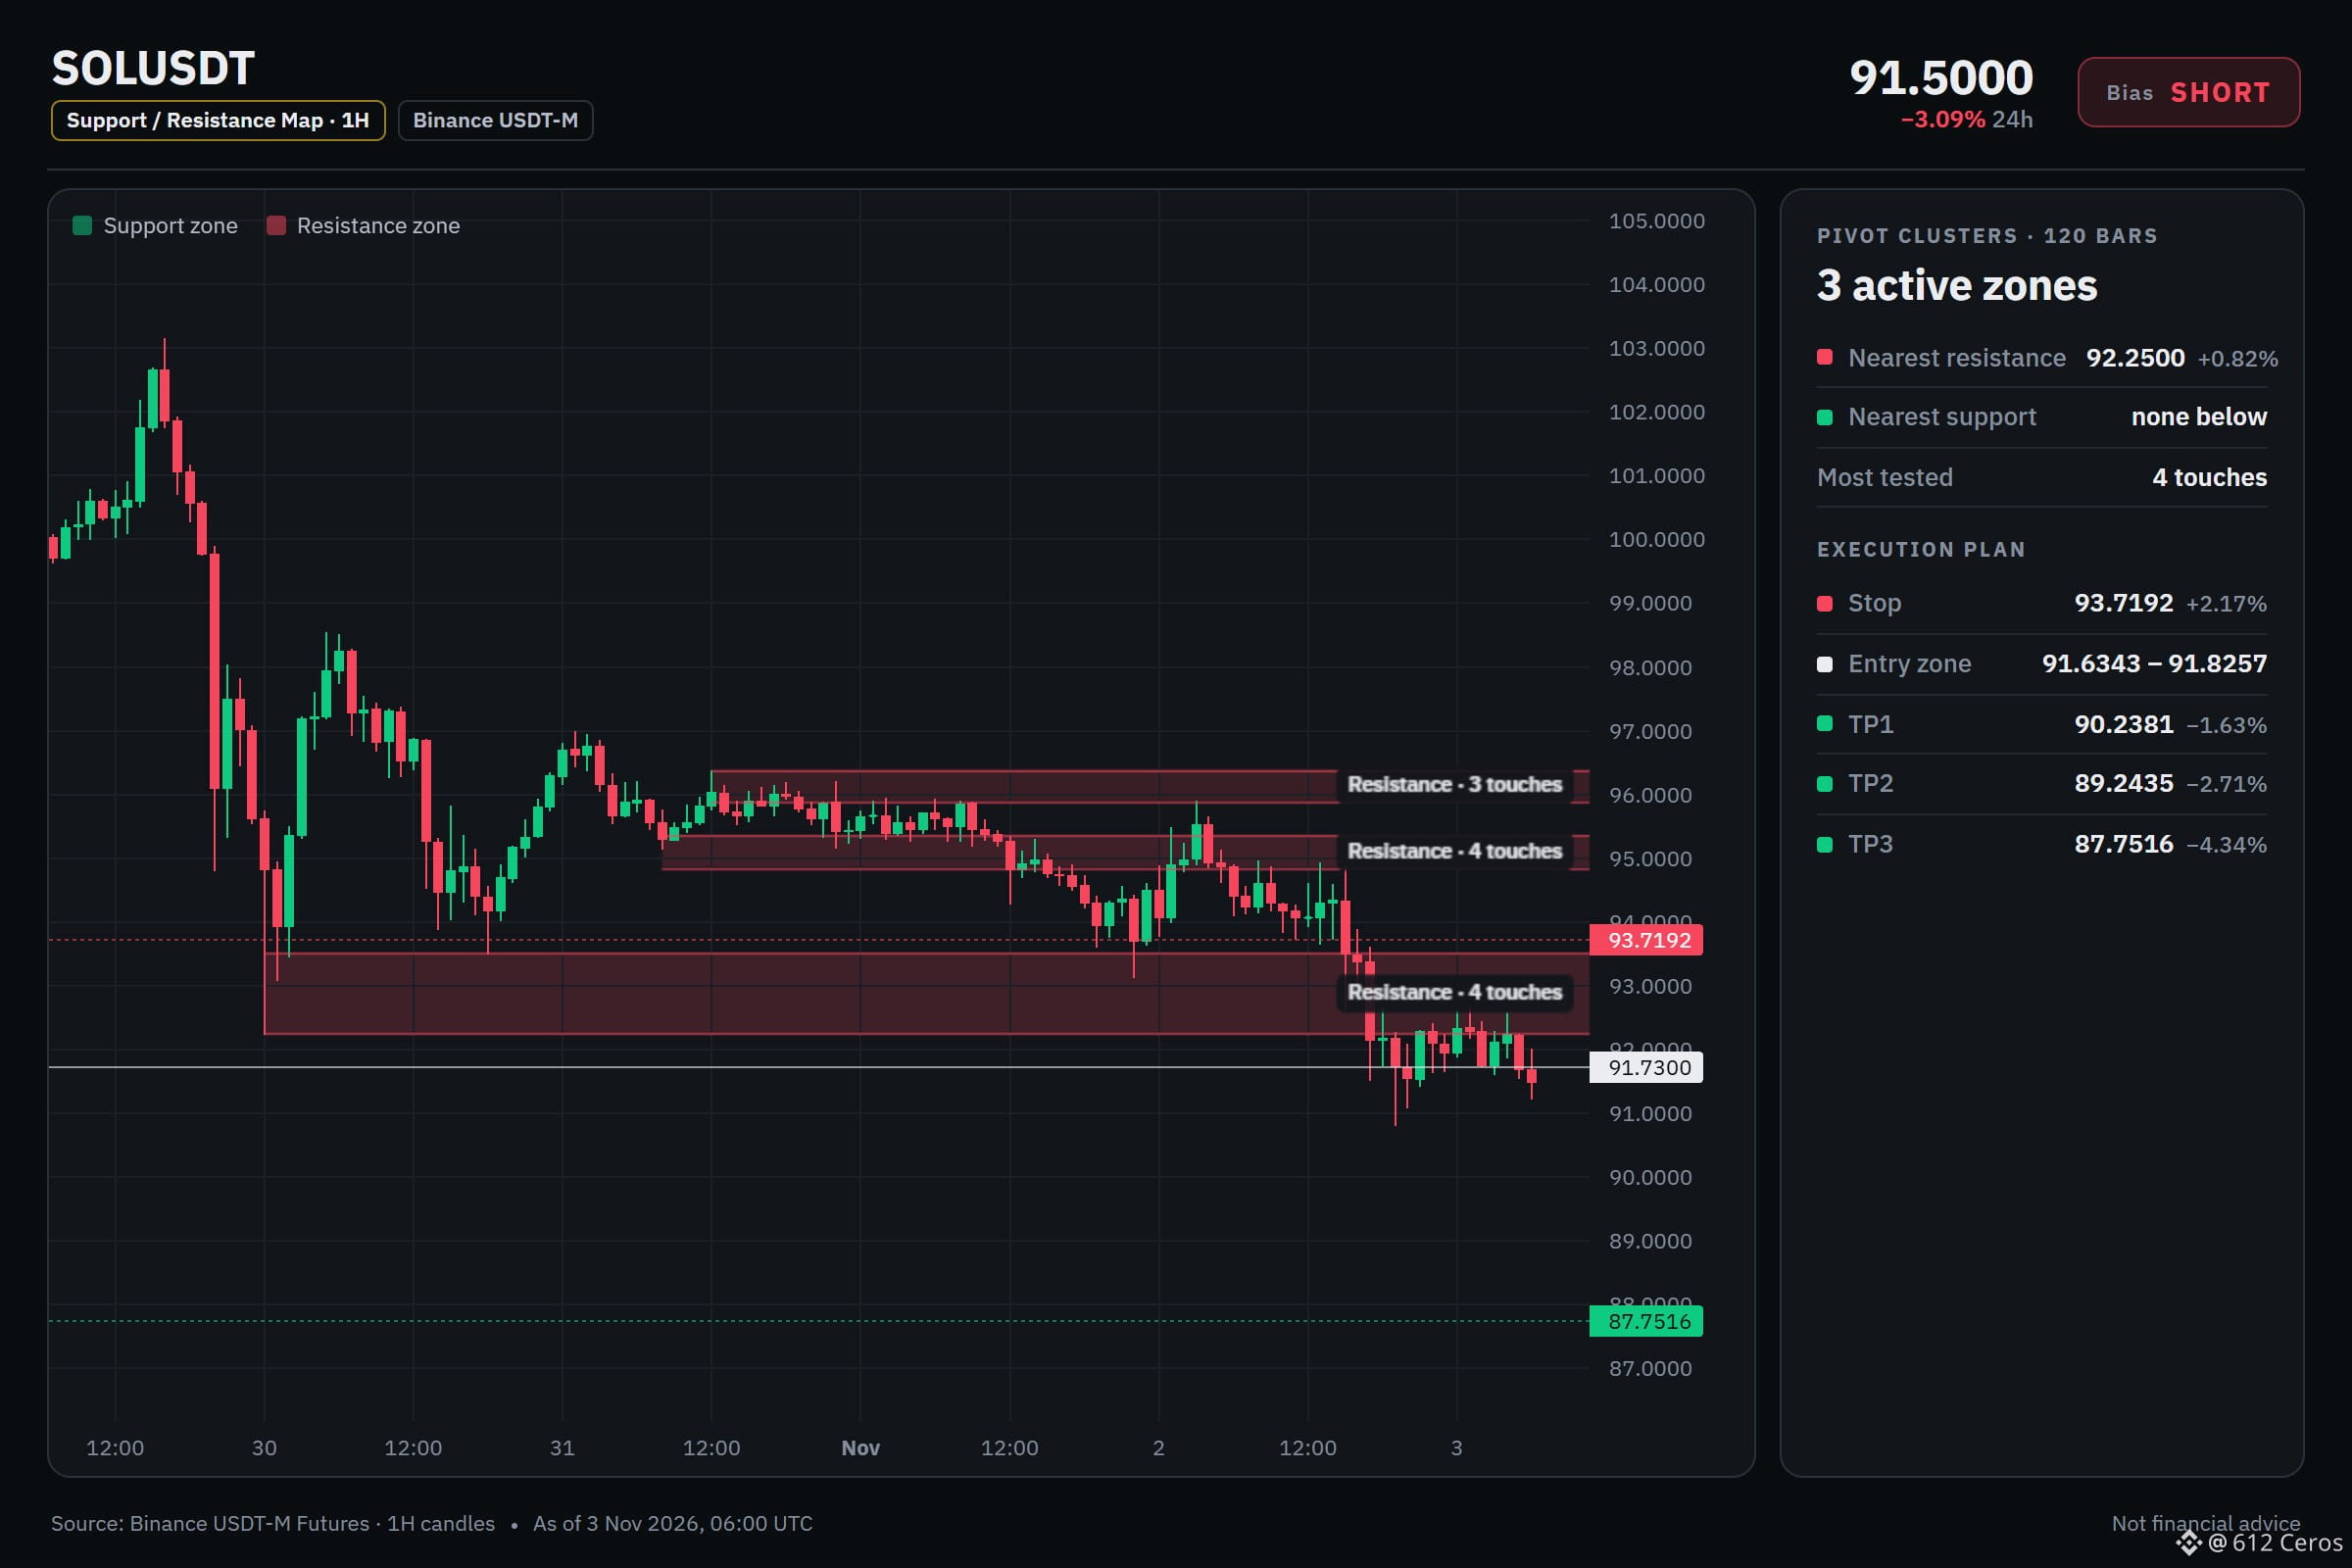
SOL is sliding below stacked EMAs on the 4h.
🔴 SHORT $SOL /USDT: expecting price to go DOWN
Bias: SHORT · Strong
Entry: 91.6343 – 91.8257
TP1: 90.2381 (-1.6%)
TP2: 89.2435 (-2.7%)
TP3: 87.7516 (-4.3%)
SL: 93.7192 (+2.2%)
Plan: enter only inside the zone, close 50% at TP1, 25% at TP2, 25% at TP3, and move the stop to entry after TP1.
Why SHORT? 6/12 signals agree, 0 against.
• 4h trend down (below EMA50 & EMA200)
• 1h trend down (below EMA50 & EMA200)
• Sellers are driving the move (15m ADX 20.4)
The short version:
1. The 4h trend shows price below EMA50 and EMA200, a bearish stack meaning the swing trend is down.
2. The 1h trend also shows price below EMA50 and EMA200, a bearish stack meaning the short-term trend is down.
3. The 1h RSI is 34.1, bearish momentum because it is below 45, so sellers have the momentum.
What level would you use as an invalidation?
Full setup on the chart below.
{future}(SOLUSDT)
📲 Want more of my latest signals? Join me here:
[https://app.binance.com/uni-qr/D26WbL9t](https://app.binance.com/uni-qr/D26WbL9t)
⚠️ Personal market analysis only. NFA — manage risk and DYOR.
Educational content, not investment advice or a recommendation to buy, sell, deposit, or withdraw any asset. No paid promotion or referral/affiliate links.
SOL is sliding below stacked EMAs on the 4h.
🔴 SHORT $SOL /USDT: expecting price to go DOWN
Bias: SHORT · Strong
Entry: 91.6343 – 91.8257
TP1: 90.2381 (-1.6%)
TP2: 89.2435 (-2.7%)
TP3: 87.7516 (-4.3%)
SL: 93.7192 (+2.2%)
Plan: enter only inside the zone, close 50% at TP1, 25% at TP2, 25% at TP3, and move the stop to entry after TP1.
Why SHORT? 6/12 signals agree, 0 against.
• 4h trend down (below EMA50 & EMA200)
• 1h trend down (below EMA50 & EMA200)
• Sellers are driving the move (15m ADX 20.4)
The short version:
1. The 4h trend shows price below EMA50 and EMA200, a bearish stack meaning the swing trend is down.
2. The 1h trend also shows price below EMA50 and EMA200, a bearish stack meaning the short-term trend is down.
3. The 1h RSI is 34.1, bearish momentum because it is below 45, so sellers have the momentum.
What level would you use as an invalidation?
Full setup on the chart below.
📲 Want more of my latest signals? Join me here:
https://app.binance.com/uni-qr/D26WbL9t
⚠️ Personal market analysis only. NFA — manage risk and DYOR.
Educational content, not investment advice or a recommendation to buy, sell, deposit, or withdraw any asset. No paid promotion or referral/affiliate links.
🔴 SHORT $SOL /USDT: expecting price to go DOWN
Bias: SHORT · Strong
Entry: 91.6343 – 91.8257
TP1: 90.2381 (-1.6%)
TP2: 89.2435 (-2.7%)
TP3: 87.7516 (-4.3%)
SL: 93.7192 (+2.2%)
Plan: enter only inside the zone, close 50% at TP1, 25% at TP2, 25% at TP3, and move the stop to entry after TP1.
Why SHORT? 6/12 signals agree, 0 against.
• 4h trend down (below EMA50 & EMA200)
• 1h trend down (below EMA50 & EMA200)
• Sellers are driving the move (15m ADX 20.4)
The short version:
1. The 4h trend shows price below EMA50 and EMA200, a bearish stack meaning the swing trend is down.
2. The 1h trend also shows price below EMA50 and EMA200, a bearish stack meaning the short-term trend is down.
3. The 1h RSI is 34.1, bearish momentum because it is below 45, so sellers have the momentum.
What level would you use as an invalidation?
Full setup on the chart below.
📲 Want more of my latest signals? Join me here:
https://app.binance.com/uni-qr/D26WbL9t
⚠️ Personal market analysis only. NFA — manage risk and DYOR.
Educational content, not investment advice or a recommendation to buy, sell, deposit, or withdraw any asset. No paid promotion or referral/affiliate links.
552
·
--
Bearish
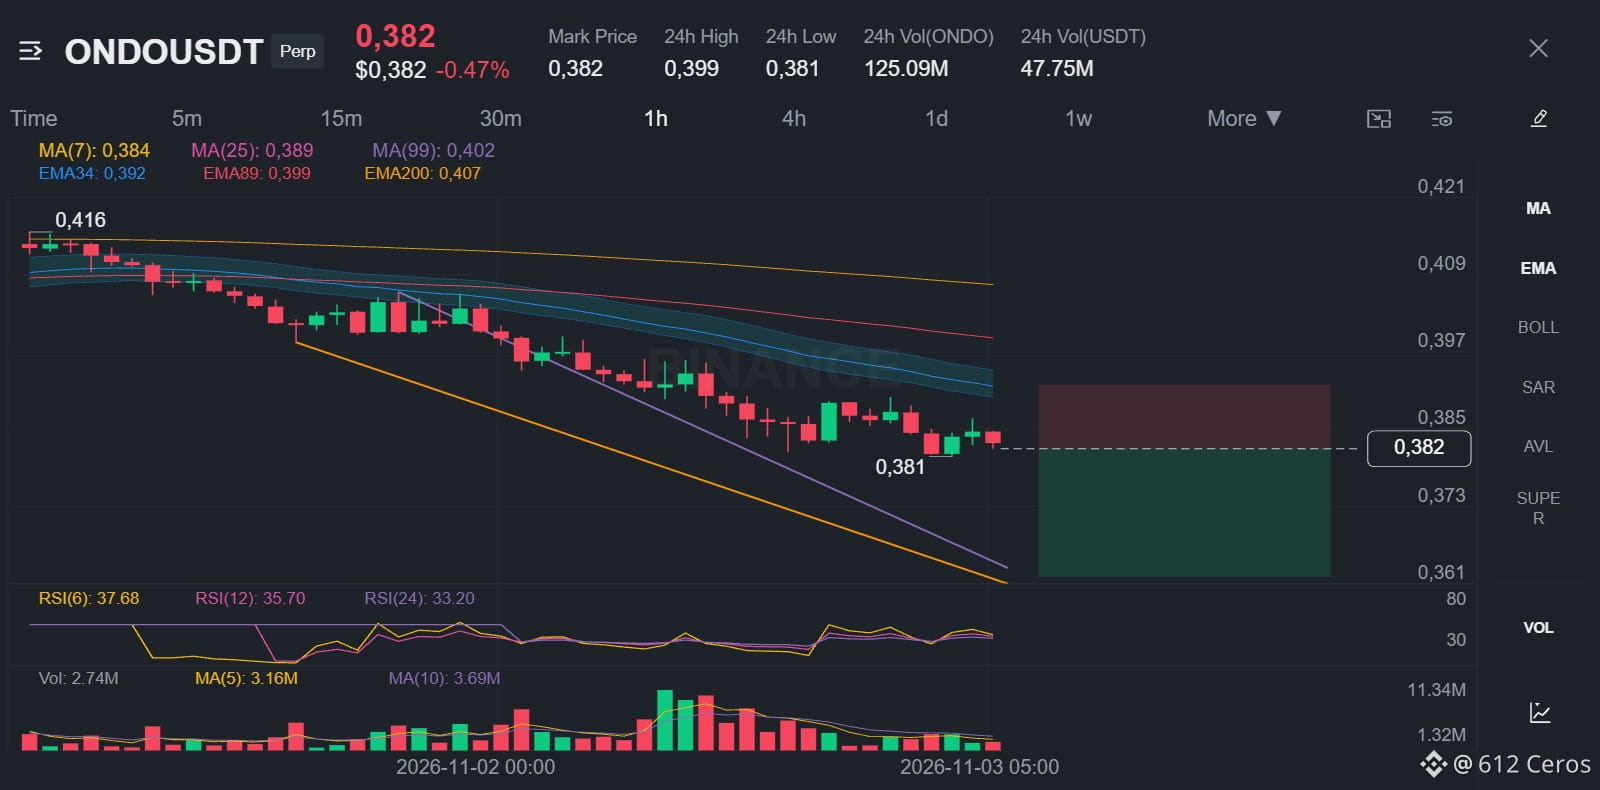
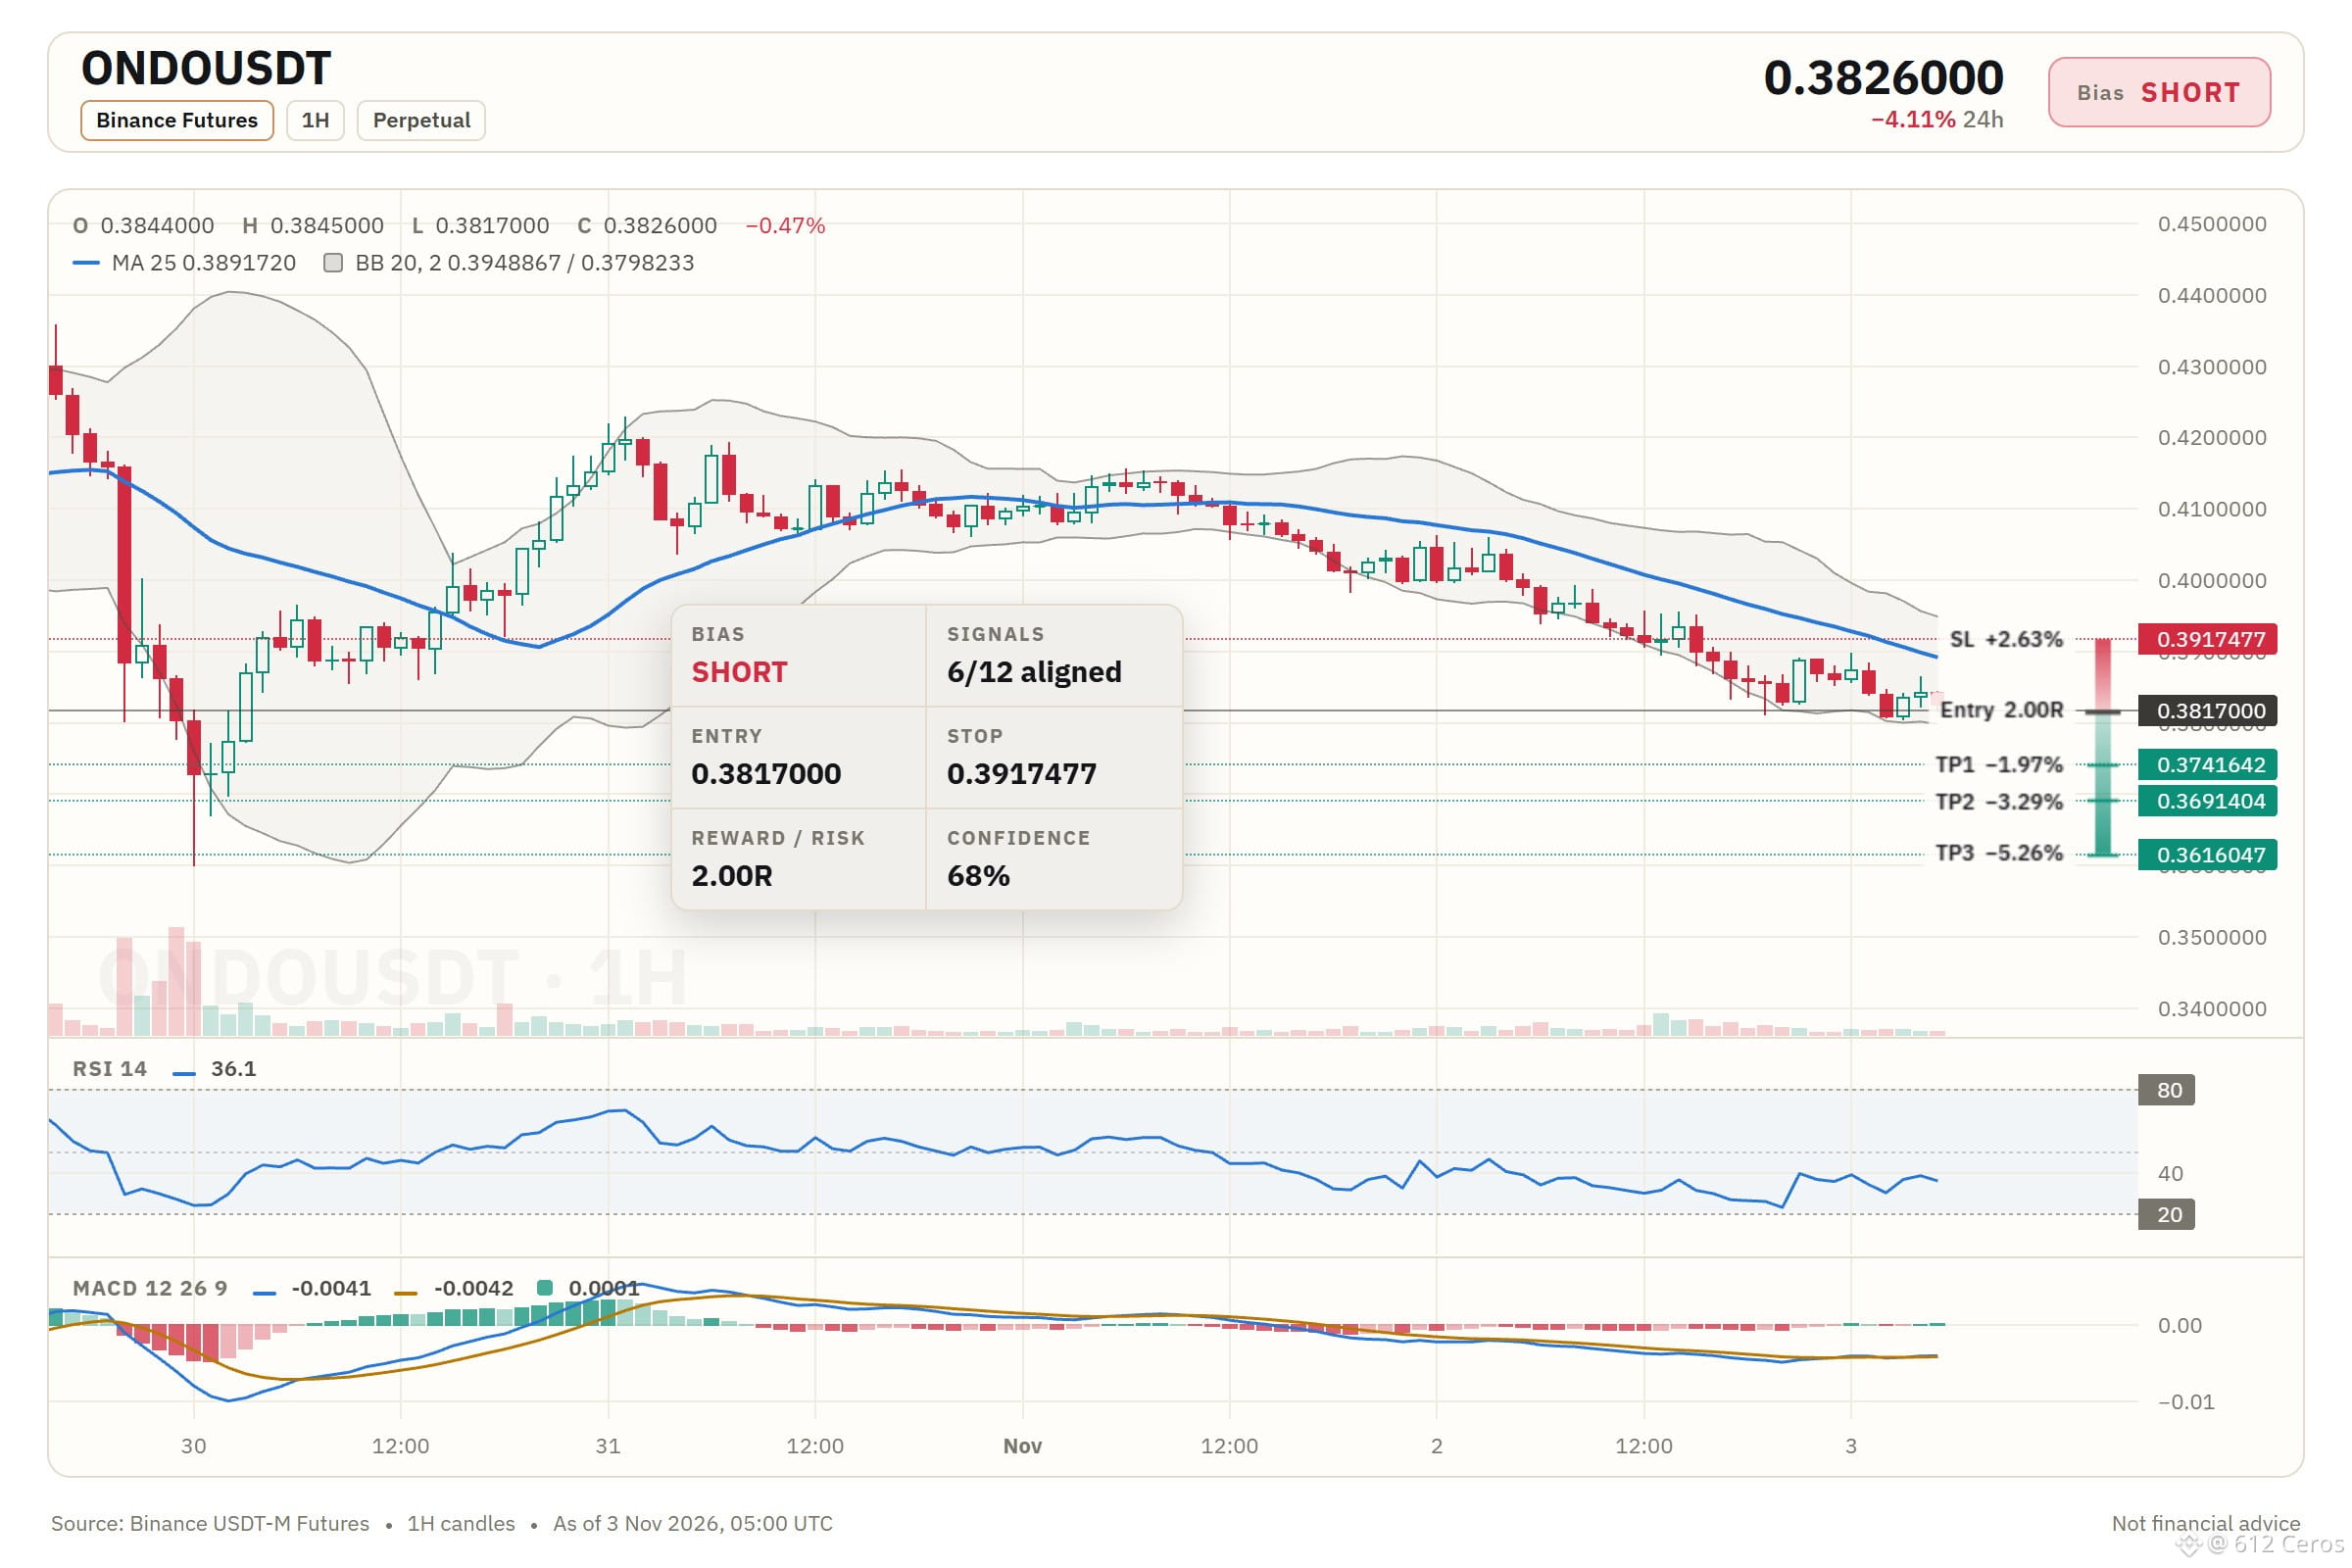
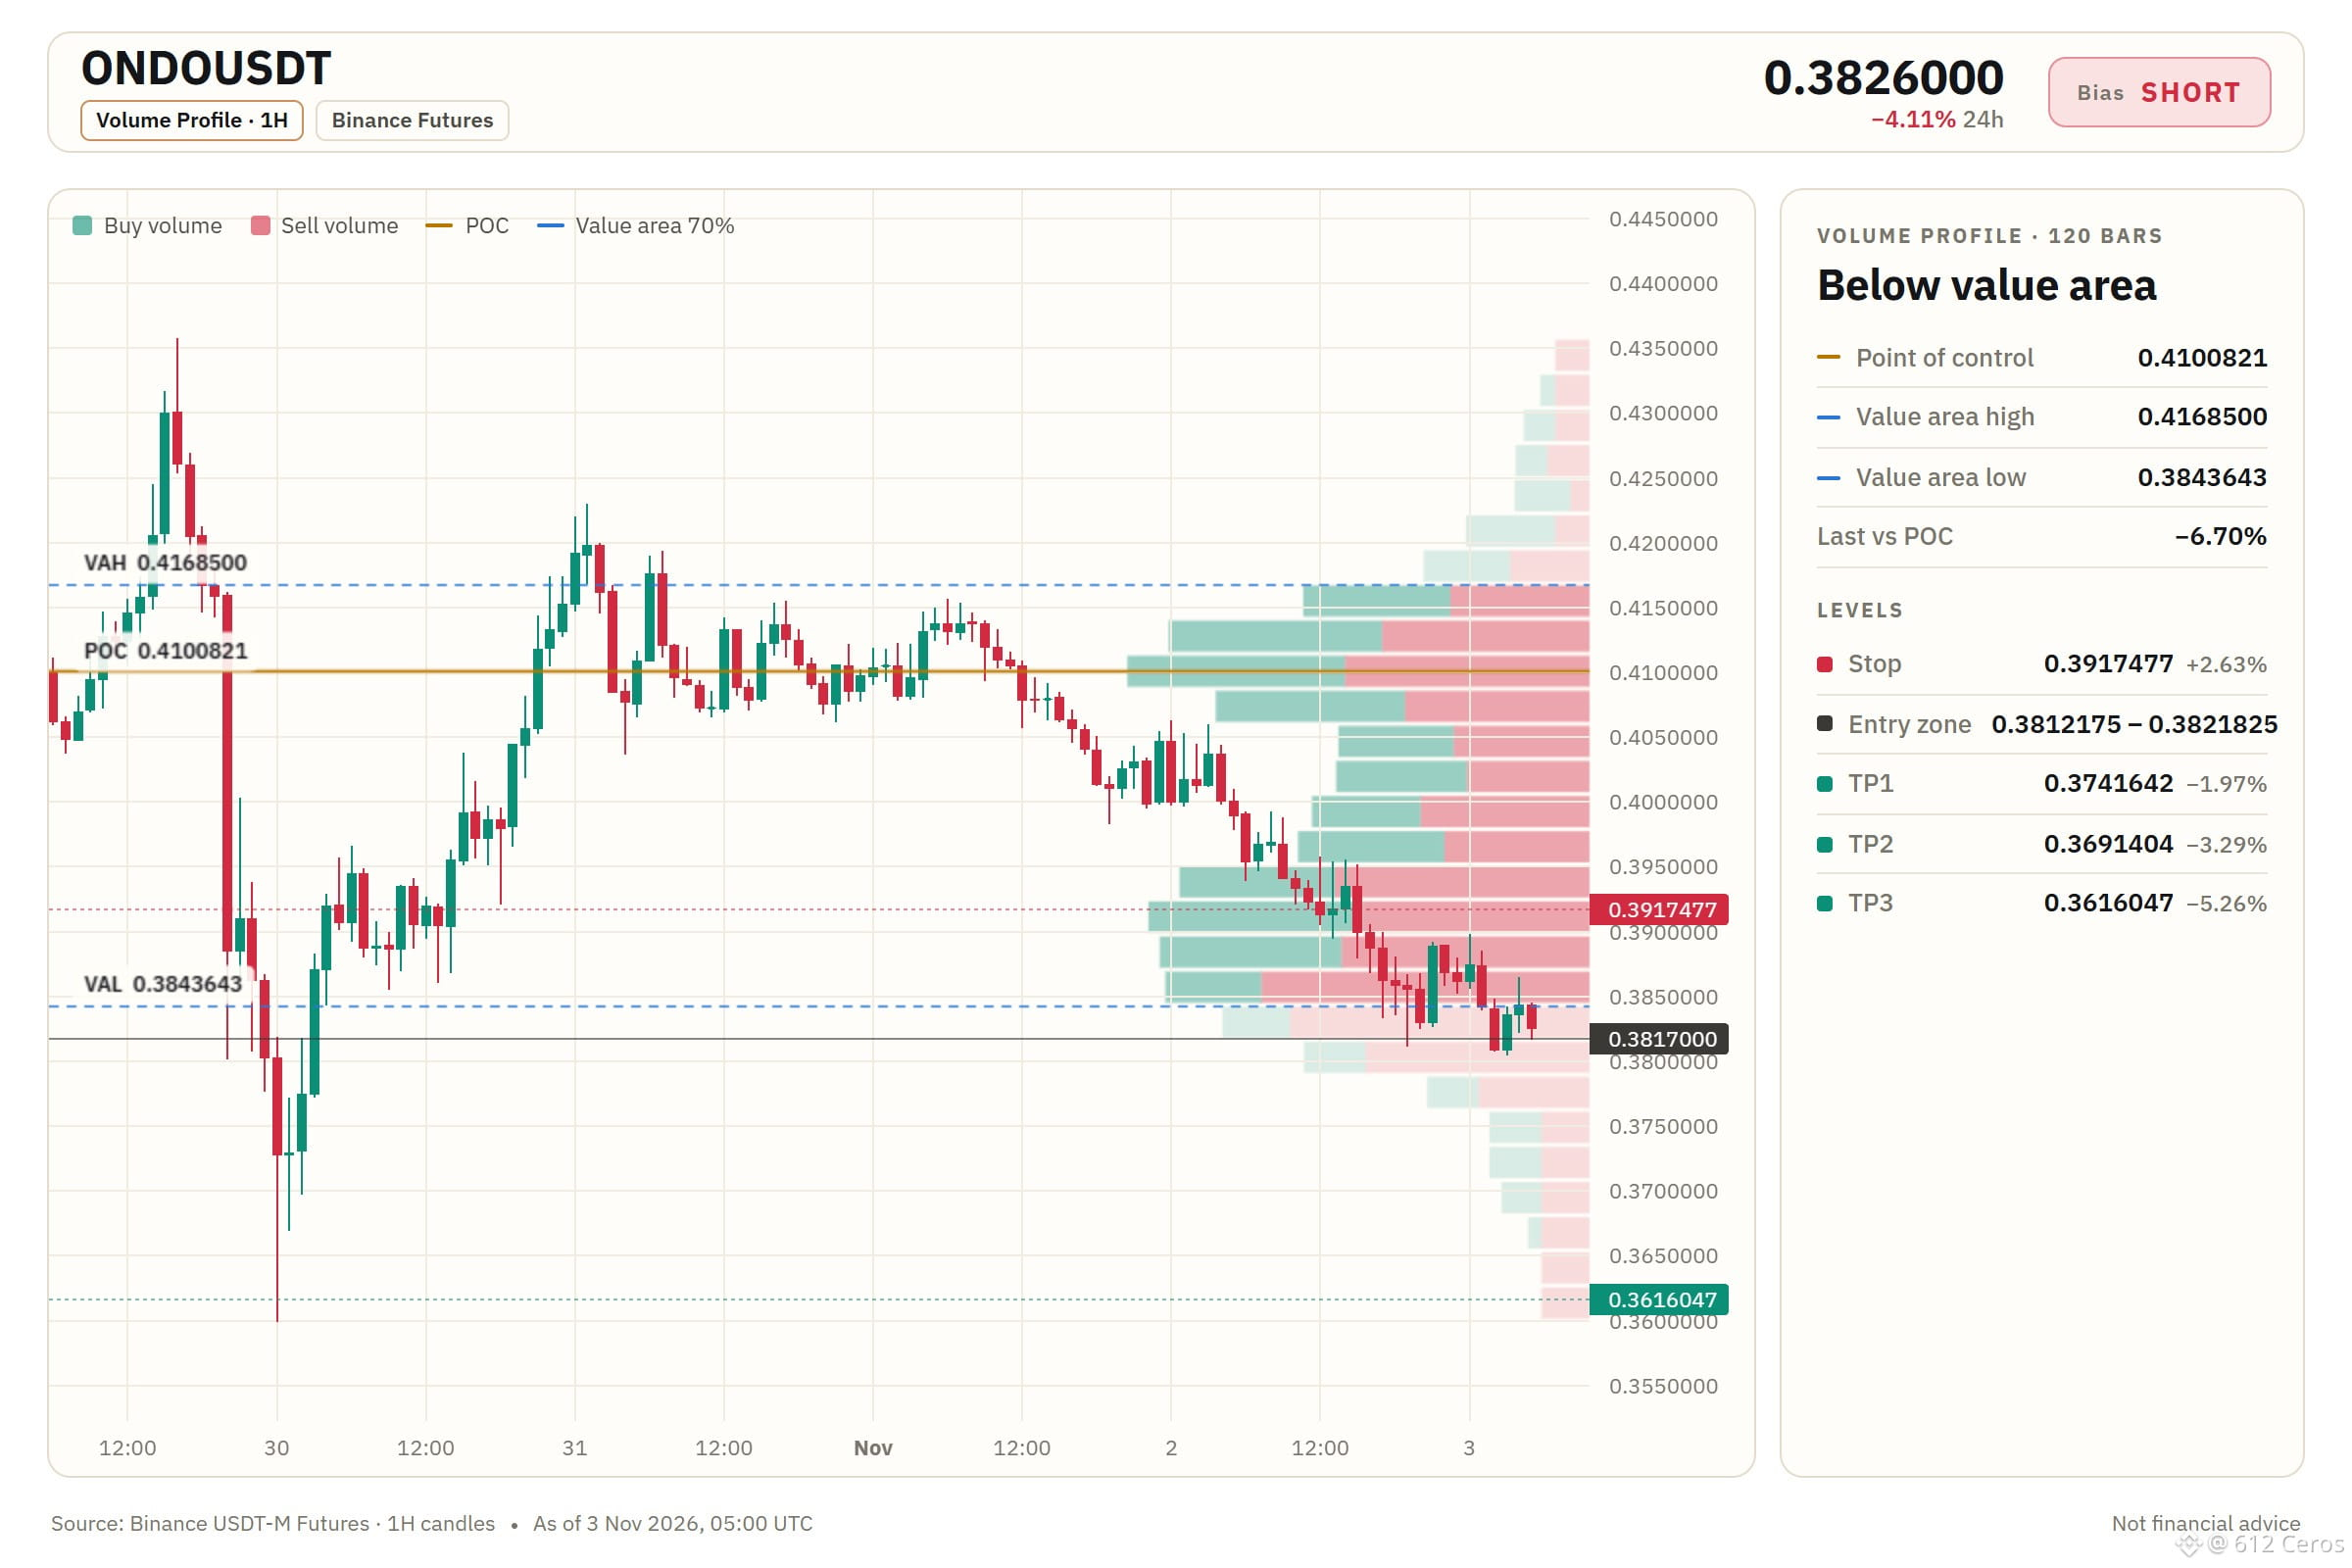
🔴 SHORT $ONDO /USDT: expecting price to go DOWN
Bias: SHORT · Strong
Entry: 0.3812175 – 0.3821825
TP1: 0.3741642 (-2.0%)
TP2: 0.3691404 (-3.3%)
TP3: 0.3616047 (-5.3%)
SL: 0.3917477 (+2.6%)
Plan: enter only inside the zone, close 50% at TP1, 25% at TP2, 25% at TP3, and move the stop to entry after TP1.
Is ONDO set to extend its 4h slide?
Why SHORT? 6/12 signals agree, 1 against.
• 4h trend down (below EMA50 & EMA200)
• 1h trend down (below EMA50 & EMA200)
• BTC is falling, this coin follows (corr 0.80)
Risk: Far below its average, bounce likely (−3.1 ATR from 1h EMA50)
The 4h trend shows price below EMA50 below EMA200, a bearish stack that means the swing trend is down.
Where would you place your short invalidation?
Levels mapped on the chart below.
{future}(ONDOUSDT)
📲 Want more of my latest signals? Join me here:
[https://app.binance.com/uni-qr/D26WbL9t](https://app.binance.com/uni-qr/D26WbL9t)
⚠️ Personal market analysis only. NFA — manage risk and DYOR.
Educational content, not investment advice or a recommendation to buy, sell, deposit, or withdraw any asset. No paid promotion or referral/affiliate links.
🔴 SHORT $ONDO /USDT: expecting price to go DOWN
Bias: SHORT · Strong
Entry: 0.3812175 – 0.3821825
TP1: 0.3741642 (-2.0%)
TP2: 0.3691404 (-3.3%)
TP3: 0.3616047 (-5.3%)
SL: 0.3917477 (+2.6%)
Plan: enter only inside the zone, close 50% at TP1, 25% at TP2, 25% at TP3, and move the stop to entry after TP1.
Is ONDO set to extend its 4h slide?
Why SHORT? 6/12 signals agree, 1 against.
• 4h trend down (below EMA50 & EMA200)
• 1h trend down (below EMA50 & EMA200)
• BTC is falling, this coin follows (corr 0.80)
Risk: Far below its average, bounce likely (−3.1 ATR from 1h EMA50)
The 4h trend shows price below EMA50 below EMA200, a bearish stack that means the swing trend is down.
Where would you place your short invalidation?
Levels mapped on the chart below.
📲 Want more of my latest signals? Join me here:
https://app.binance.com/uni-qr/D26WbL9t
⚠️ Personal market analysis only. NFA — manage risk and DYOR.
Educational content, not investment advice or a recommendation to buy, sell, deposit, or withdraw any asset. No paid promotion or referral/affiliate links.
Bias: SHORT · Strong
Entry: 0.3812175 – 0.3821825
TP1: 0.3741642 (-2.0%)
TP2: 0.3691404 (-3.3%)
TP3: 0.3616047 (-5.3%)
SL: 0.3917477 (+2.6%)
Plan: enter only inside the zone, close 50% at TP1, 25% at TP2, 25% at TP3, and move the stop to entry after TP1.
Is ONDO set to extend its 4h slide?
Why SHORT? 6/12 signals agree, 1 against.
• 4h trend down (below EMA50 & EMA200)
• 1h trend down (below EMA50 & EMA200)
• BTC is falling, this coin follows (corr 0.80)
Risk: Far below its average, bounce likely (−3.1 ATR from 1h EMA50)
The 4h trend shows price below EMA50 below EMA200, a bearish stack that means the swing trend is down.
Where would you place your short invalidation?
Levels mapped on the chart below.
📲 Want more of my latest signals? Join me here:
https://app.binance.com/uni-qr/D26WbL9t
⚠️ Personal market analysis only. NFA — manage risk and DYOR.
Educational content, not investment advice or a recommendation to buy, sell, deposit, or withdraw any asset. No paid promotion or referral/affiliate links.
575
·
--
Bearish
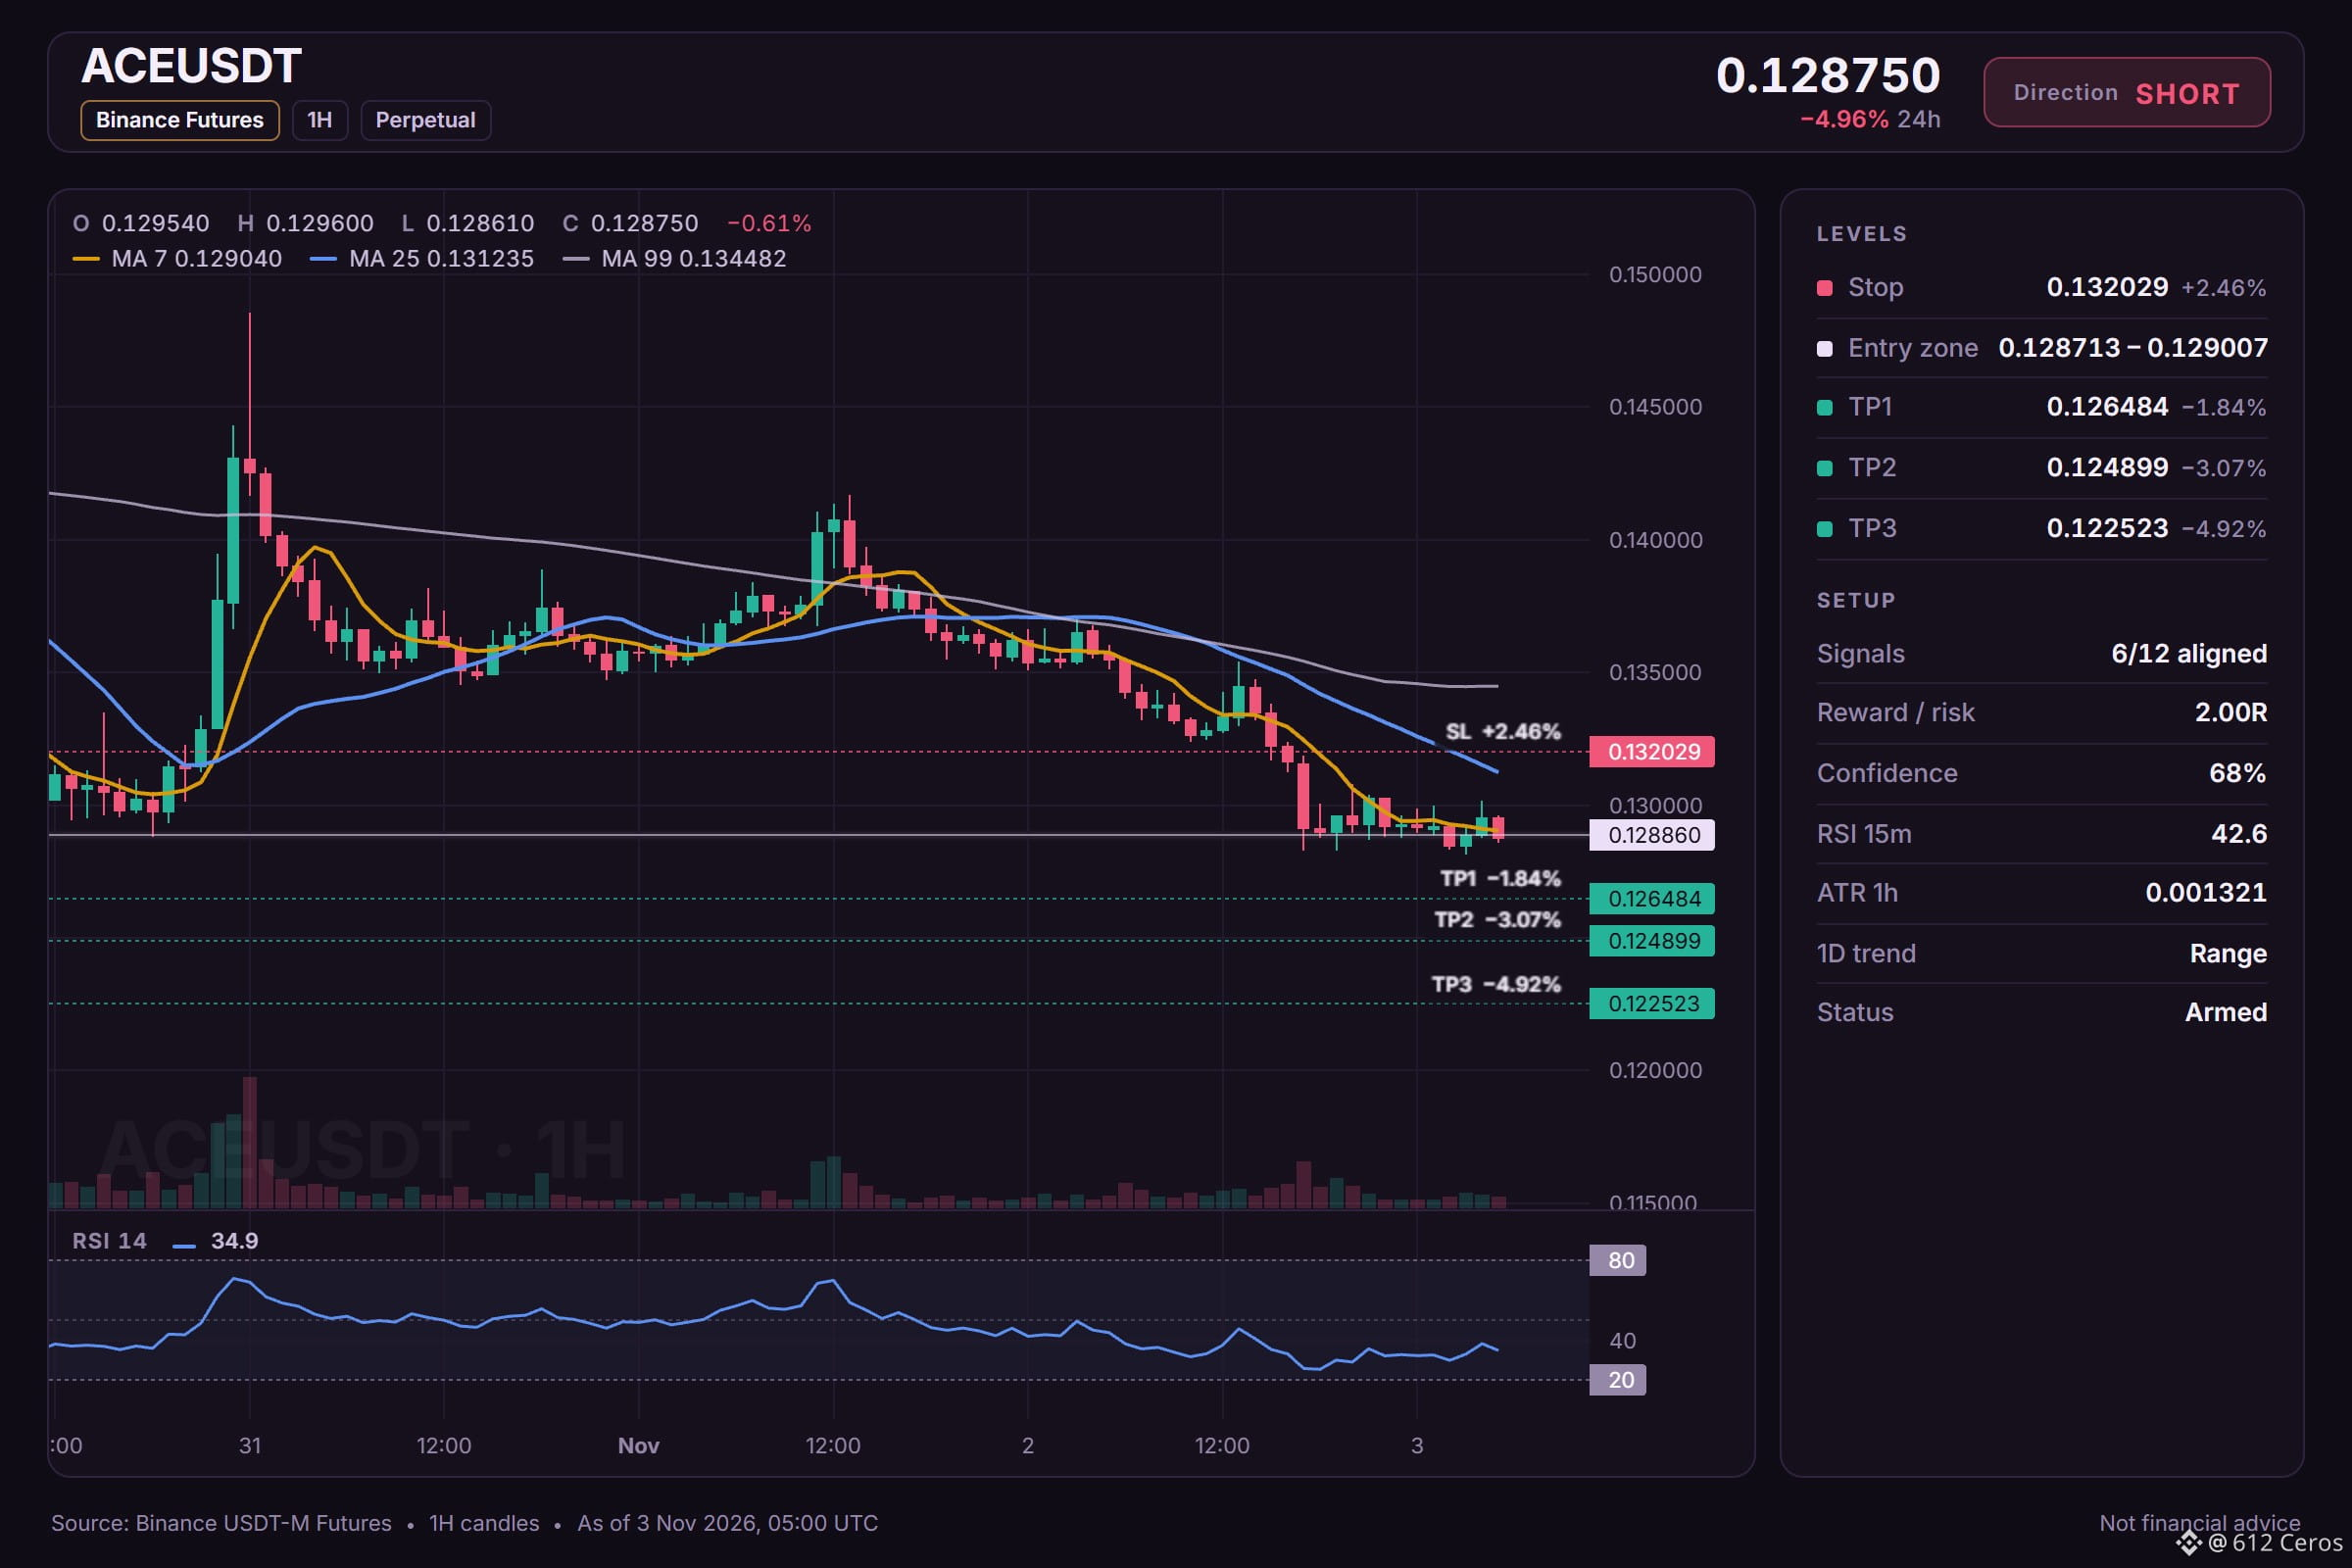
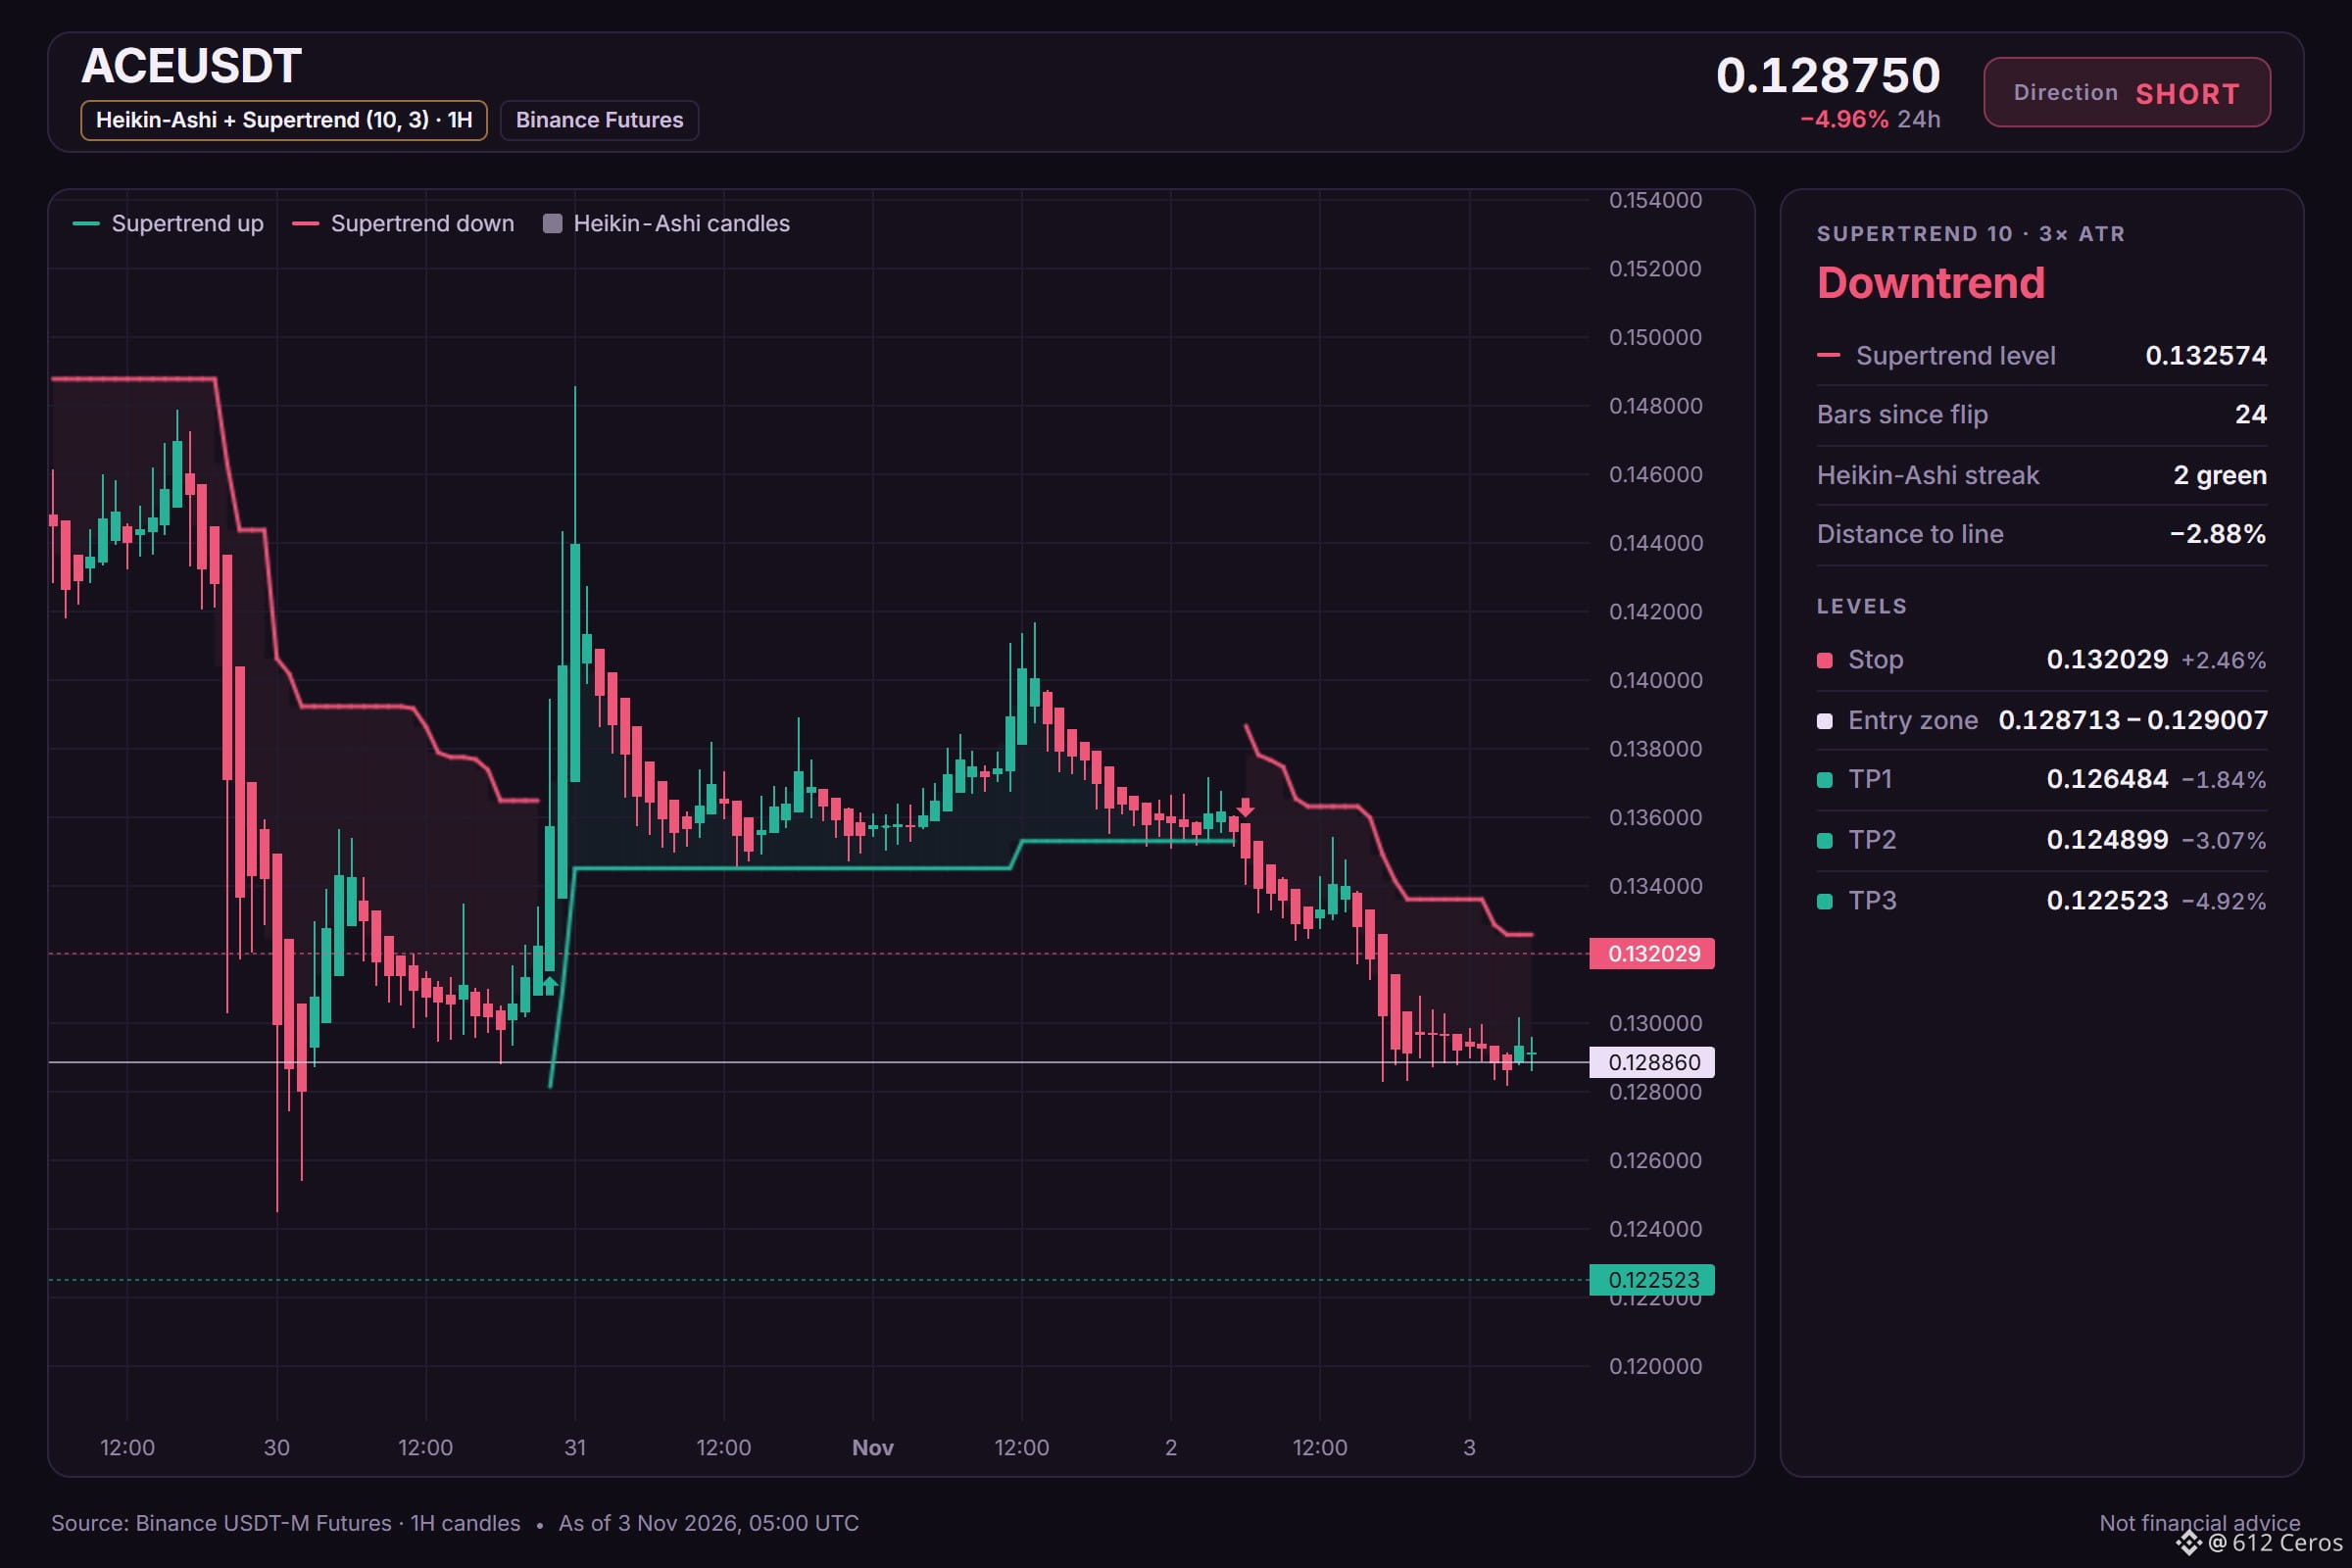
ACE short setup: the levels I'm watching
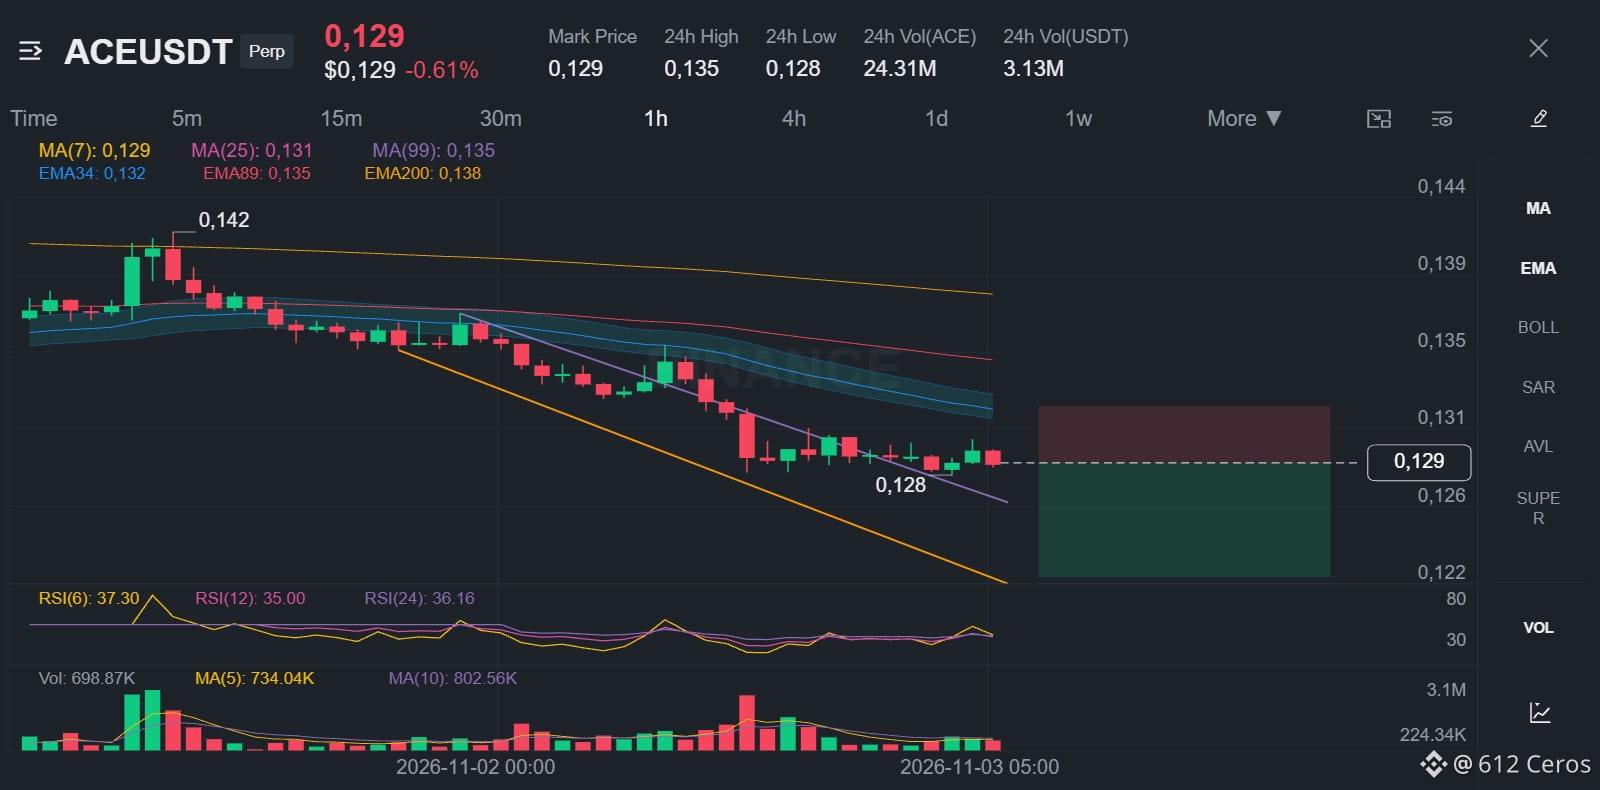
🔴 SHORT $ACE /USDT: expecting price to go DOWN
Bias: SHORT · Strong
Entry: 0.128713 – 0.129007
TP1: 0.126484 (-1.8%)
TP2: 0.124899 (-3.1%)
TP3: 0.122523 (-4.9%)
SL: 0.132029 (+2.5%)
Plan: enter only inside the zone, close 50% at TP1, 25% at TP2, 25% at TP3, and move the stop to entry after TP1.
Why SHORT? 6/12 signals agree, 1 against.
• 4h trend down (below EMA50 & EMA200)
• 1h trend down (below EMA50 & EMA200)
• BTC is falling, this coin follows (corr 0.62)
Risk: Far below its average, bounce likely (−3.0 ATR from 1h EMA50)
Why I like it:
The daily trend reads range, and 6/12 signals aligned favour the short side. The plan is to work the 0.128713 – 0.129007 zone, scale out at 0.126484 and 0.124899, and stay patient for 0.122523. A move through 0.132029 means the idea is wrong and the stop does its job.
Does ACE tag 0.126484 first, or the stop?
Levels mapped on the chart below.
{future}(ACEUSDT)
📲 Want more of my latest signals? Join me here:
[https://app.binance.com/uni-qr/D26WbL9t](https://app.binance.com/uni-qr/D26WbL9t)
⚠️ Personal market analysis only. NFA — manage risk and DYOR.
Educational content, not investment advice or a recommendation to buy, sell, deposit, or withdraw any asset. No paid promotion or referral/affiliate links.
ACE short setup: the levels I'm watching
🔴 SHORT $ACE /USDT: expecting price to go DOWN
Bias: SHORT · Strong
Entry: 0.128713 – 0.129007
TP1: 0.126484 (-1.8%)
TP2: 0.124899 (-3.1%)
TP3: 0.122523 (-4.9%)
SL: 0.132029 (+2.5%)
Plan: enter only inside the zone, close 50% at TP1, 25% at TP2, 25% at TP3, and move the stop to entry after TP1.
Why SHORT? 6/12 signals agree, 1 against.
• 4h trend down (below EMA50 & EMA200)
• 1h trend down (below EMA50 & EMA200)
• BTC is falling, this coin follows (corr 0.62)
Risk: Far below its average, bounce likely (−3.0 ATR from 1h EMA50)
Why I like it:
The daily trend reads range, and 6/12 signals aligned favour the short side. The plan is to work the 0.128713 – 0.129007 zone, scale out at 0.126484 and 0.124899, and stay patient for 0.122523. A move through 0.132029 means the idea is wrong and the stop does its job.
Does ACE tag 0.126484 first, or the stop?
Levels mapped on the chart below.
📲 Want more of my latest signals? Join me here:
https://app.binance.com/uni-qr/D26WbL9t
⚠️ Personal market analysis only. NFA — manage risk and DYOR.
Educational content, not investment advice or a recommendation to buy, sell, deposit, or withdraw any asset. No paid promotion or referral/affiliate links.
🔴 SHORT $ACE /USDT: expecting price to go DOWN
Bias: SHORT · Strong
Entry: 0.128713 – 0.129007
TP1: 0.126484 (-1.8%)
TP2: 0.124899 (-3.1%)
TP3: 0.122523 (-4.9%)
SL: 0.132029 (+2.5%)
Plan: enter only inside the zone, close 50% at TP1, 25% at TP2, 25% at TP3, and move the stop to entry after TP1.
Why SHORT? 6/12 signals agree, 1 against.
• 4h trend down (below EMA50 & EMA200)
• 1h trend down (below EMA50 & EMA200)
• BTC is falling, this coin follows (corr 0.62)
Risk: Far below its average, bounce likely (−3.0 ATR from 1h EMA50)
Why I like it:
The daily trend reads range, and 6/12 signals aligned favour the short side. The plan is to work the 0.128713 – 0.129007 zone, scale out at 0.126484 and 0.124899, and stay patient for 0.122523. A move through 0.132029 means the idea is wrong and the stop does its job.
Does ACE tag 0.126484 first, or the stop?
Levels mapped on the chart below.
📲 Want more of my latest signals? Join me here:
https://app.binance.com/uni-qr/D26WbL9t
⚠️ Personal market analysis only. NFA — manage risk and DYOR.
Educational content, not investment advice or a recommendation to buy, sell, deposit, or withdraw any asset. No paid promotion or referral/affiliate links.
1
584
·
--
Bearish
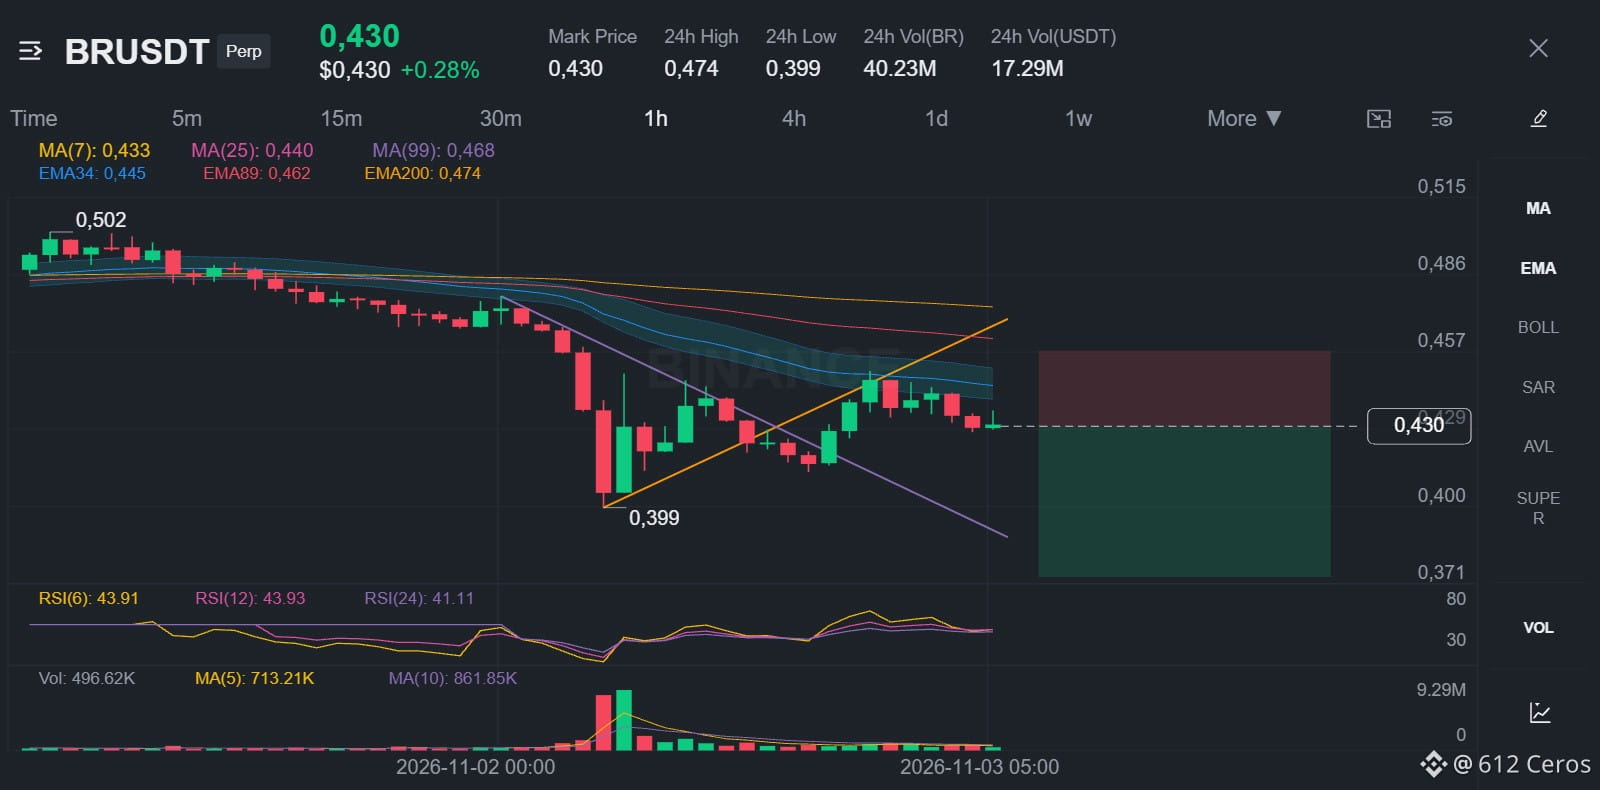
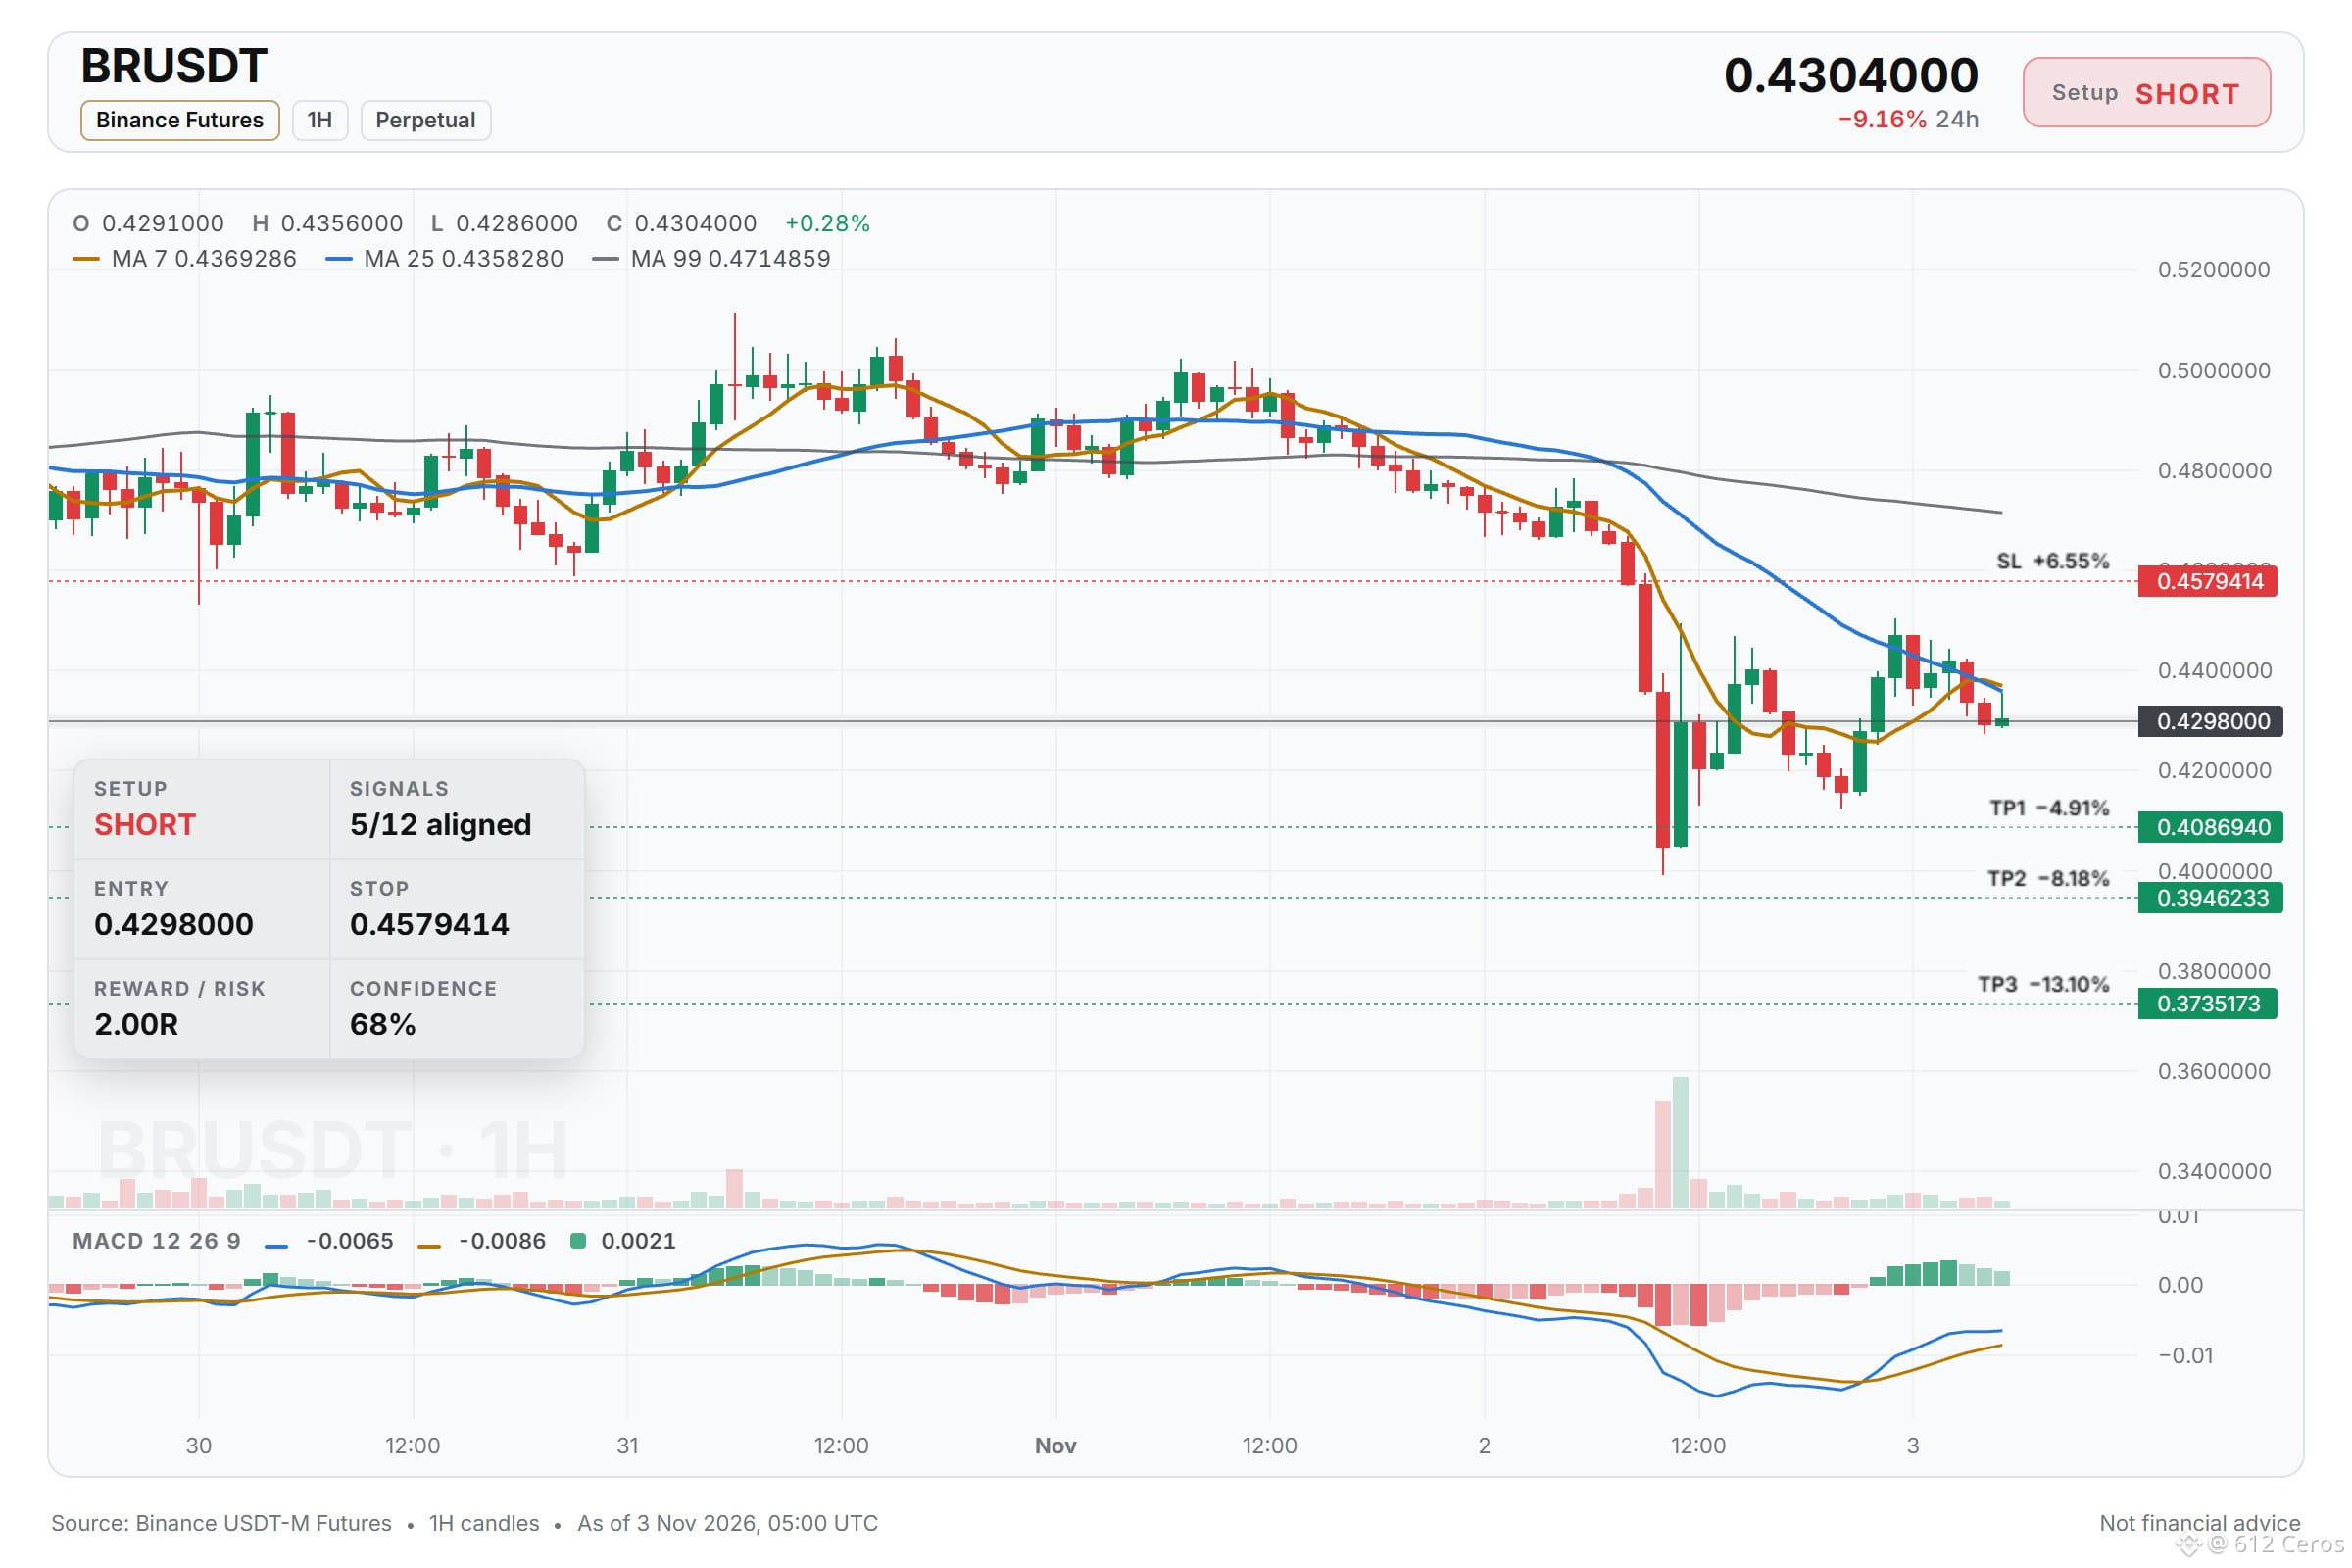
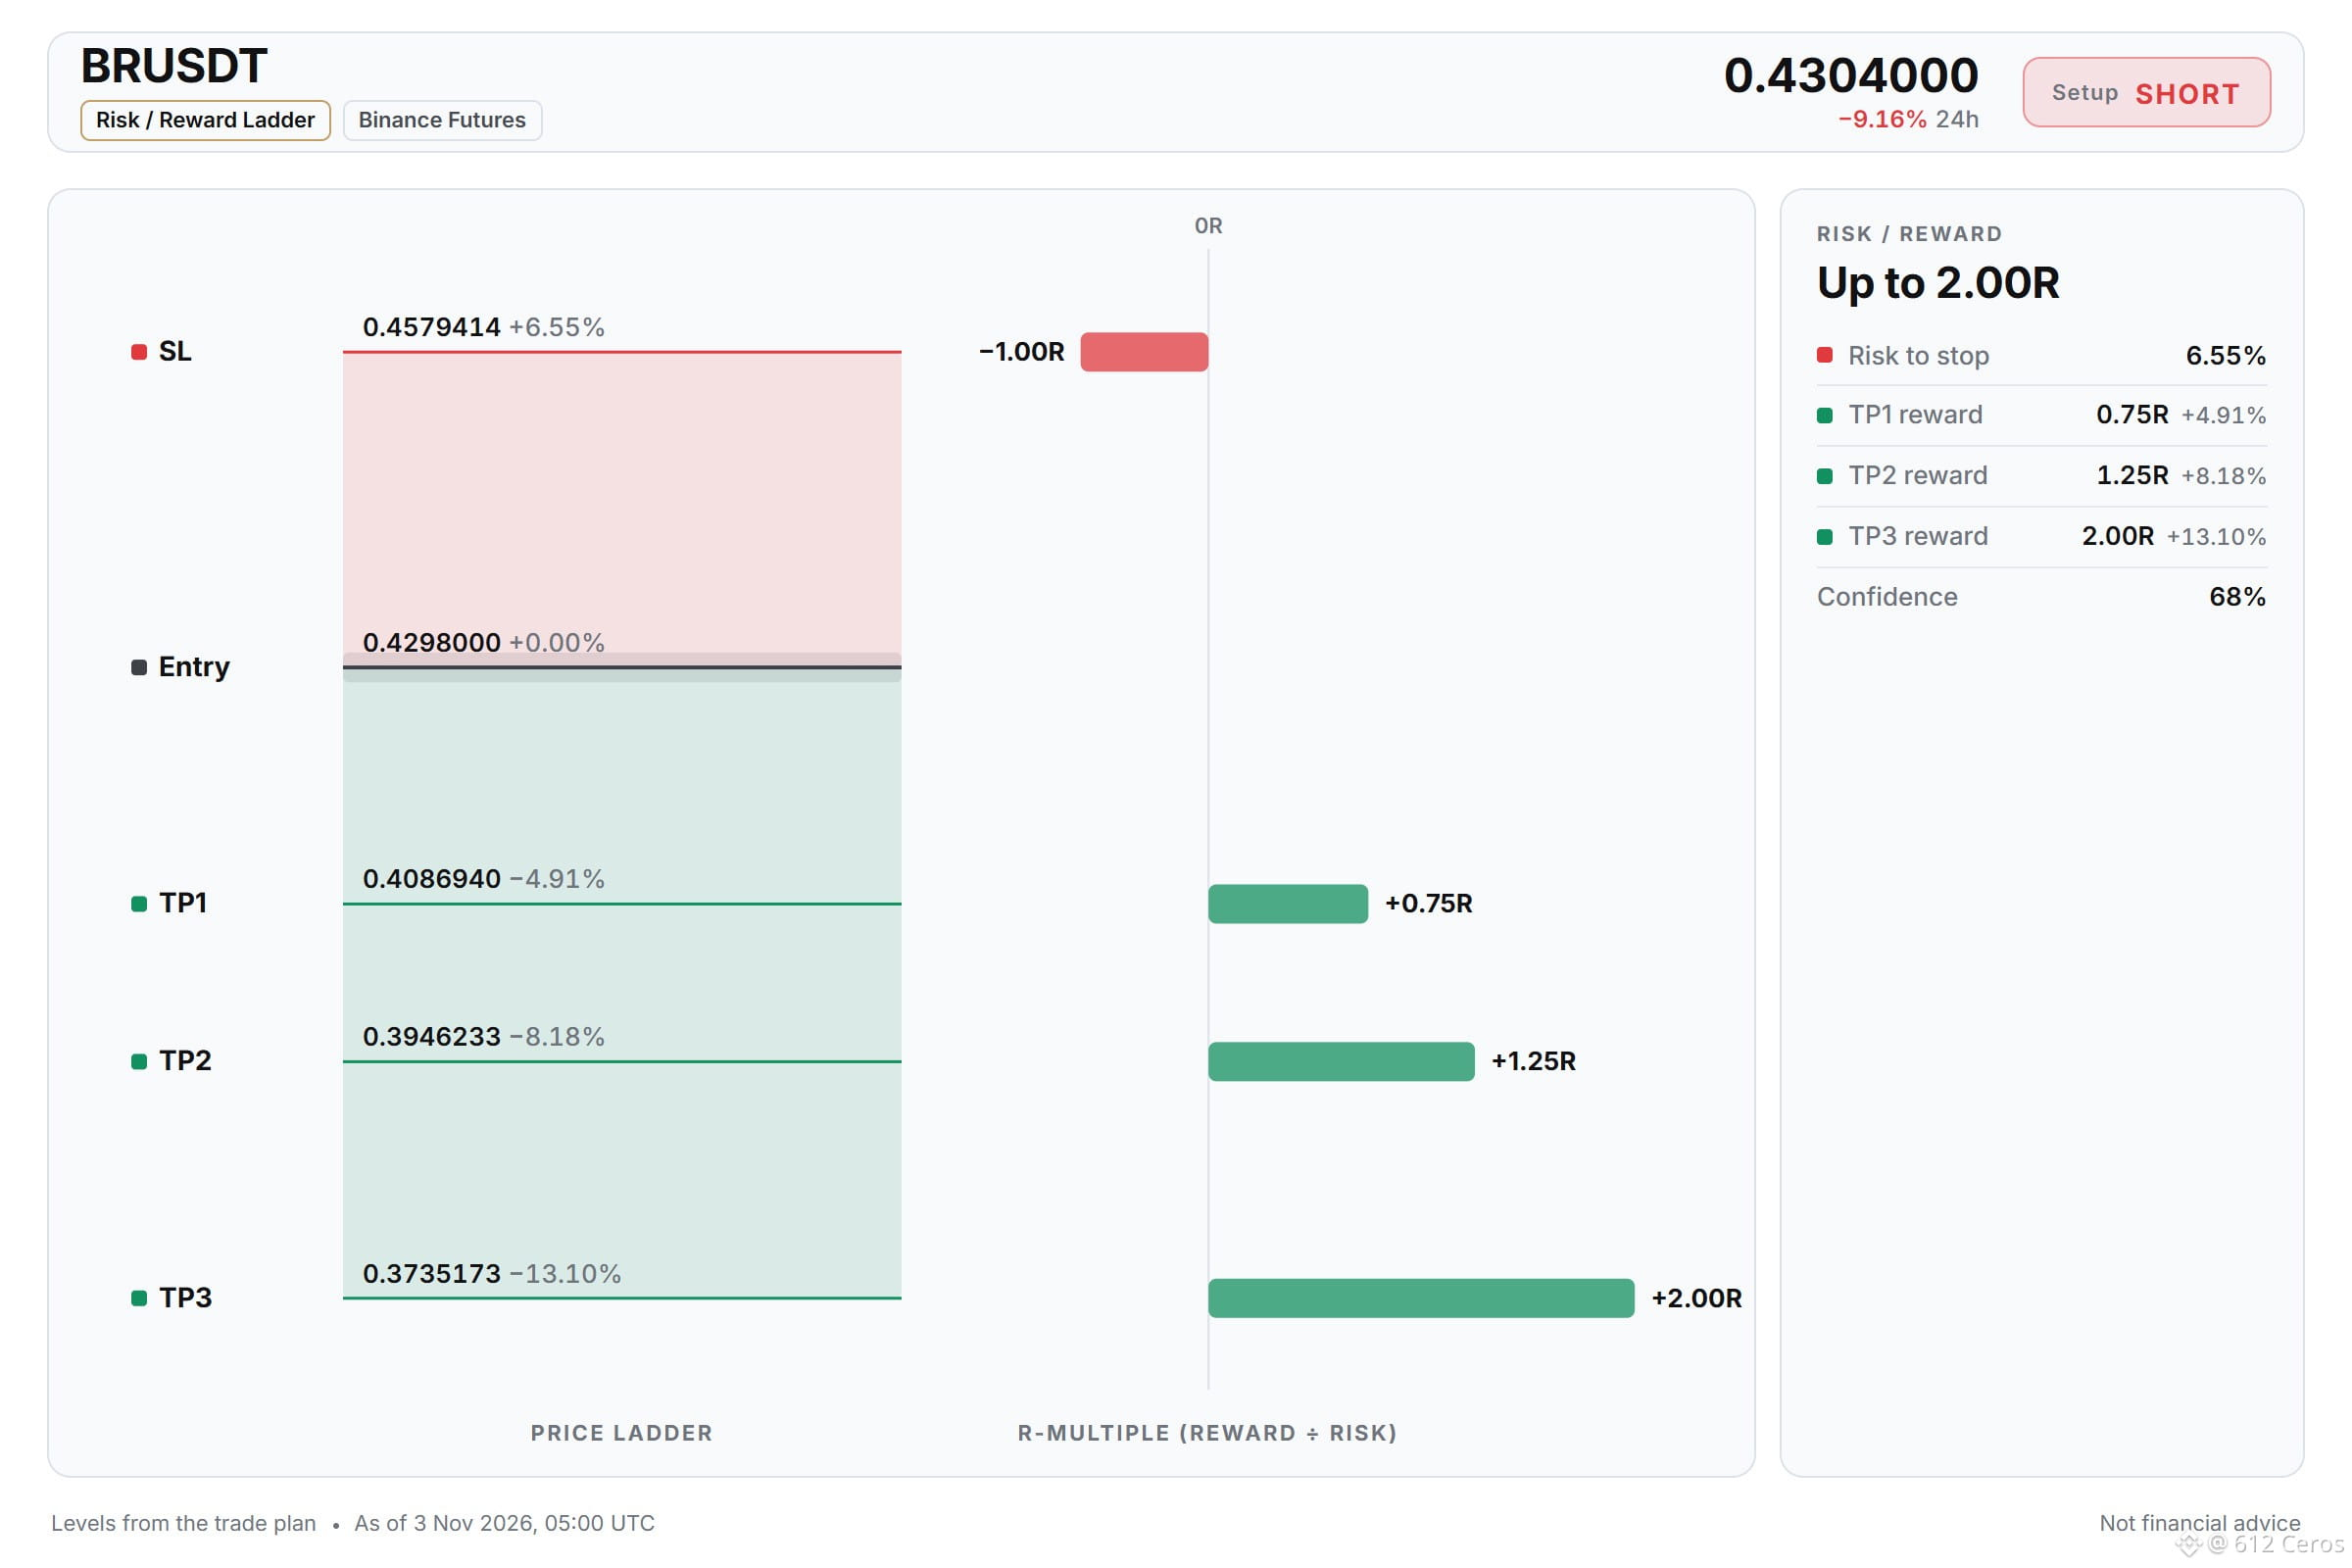
4h bearish stack holds on BR
🔴 SHORT $BR /USDT: expecting price to go DOWN
Bias: SHORT · Leaning
Entry: 0.4284733 – 0.4311267
TP1: 0.4086940 (-4.9%)
TP2: 0.3946233 (-8.2%)
TP3: 0.3735173 (-13.1%)
SL: 0.4579414 (+6.5%)
Plan: enter only inside the zone, close 50% at TP1, 25% at TP2, 25% at TP3, and move the stop to entry after TP1.
Note: moderate conviction only, keep size light.
Why SHORT? 5/12 signals agree, 0 against.
• 4h trend down (below EMA50 & EMA200)
• 1h trend down (below EMA50 & EMA200)
• Sellers have the momentum (4h RSI 39.9)
Journal note: BR
I'm watching BR for a short entry. The 4h price sits below a bearish EMA stack, and the 1h price is also below its stack, meaning both swings are down. I want to see sellers keep control with the 1h RSI below 45, while the daily trend remains mixed in a range.
Where would you place your invalidation level?
Full setup on the chart below.
{future}(BRUSDT)
📲 Want more of my latest signals? Join me here:
[https://app.binance.com/uni-qr/D26WbL9t](https://app.binance.com/uni-qr/D26WbL9t)
⚠️ Personal market analysis only. NFA — manage risk and DYOR.
Educational content, not investment advice or a recommendation to buy, sell, deposit, or withdraw any asset. No paid promotion or referral/affiliate links.
4h bearish stack holds on BR
🔴 SHORT $BR /USDT: expecting price to go DOWN
Bias: SHORT · Leaning
Entry: 0.4284733 – 0.4311267
TP1: 0.4086940 (-4.9%)
TP2: 0.3946233 (-8.2%)
TP3: 0.3735173 (-13.1%)
SL: 0.4579414 (+6.5%)
Plan: enter only inside the zone, close 50% at TP1, 25% at TP2, 25% at TP3, and move the stop to entry after TP1.
Note: moderate conviction only, keep size light.
Why SHORT? 5/12 signals agree, 0 against.
• 4h trend down (below EMA50 & EMA200)
• 1h trend down (below EMA50 & EMA200)
• Sellers have the momentum (4h RSI 39.9)
Journal note: BR
I'm watching BR for a short entry. The 4h price sits below a bearish EMA stack, and the 1h price is also below its stack, meaning both swings are down. I want to see sellers keep control with the 1h RSI below 45, while the daily trend remains mixed in a range.
Where would you place your invalidation level?
Full setup on the chart below.
📲 Want more of my latest signals? Join me here:
https://app.binance.com/uni-qr/D26WbL9t
⚠️ Personal market analysis only. NFA — manage risk and DYOR.
Educational content, not investment advice or a recommendation to buy, sell, deposit, or withdraw any asset. No paid promotion or referral/affiliate links.
🔴 SHORT $BR /USDT: expecting price to go DOWN
Bias: SHORT · Leaning
Entry: 0.4284733 – 0.4311267
TP1: 0.4086940 (-4.9%)
TP2: 0.3946233 (-8.2%)
TP3: 0.3735173 (-13.1%)
SL: 0.4579414 (+6.5%)
Plan: enter only inside the zone, close 50% at TP1, 25% at TP2, 25% at TP3, and move the stop to entry after TP1.
Note: moderate conviction only, keep size light.
Why SHORT? 5/12 signals agree, 0 against.
• 4h trend down (below EMA50 & EMA200)
• 1h trend down (below EMA50 & EMA200)
• Sellers have the momentum (4h RSI 39.9)
Journal note: BR
I'm watching BR for a short entry. The 4h price sits below a bearish EMA stack, and the 1h price is also below its stack, meaning both swings are down. I want to see sellers keep control with the 1h RSI below 45, while the daily trend remains mixed in a range.
Where would you place your invalidation level?
Full setup on the chart below.
📲 Want more of my latest signals? Join me here:
https://app.binance.com/uni-qr/D26WbL9t
⚠️ Personal market analysis only. NFA — manage risk and DYOR.
Educational content, not investment advice or a recommendation to buy, sell, deposit, or withdraw any asset. No paid promotion or referral/affiliate links.
668
·
--
Bearish
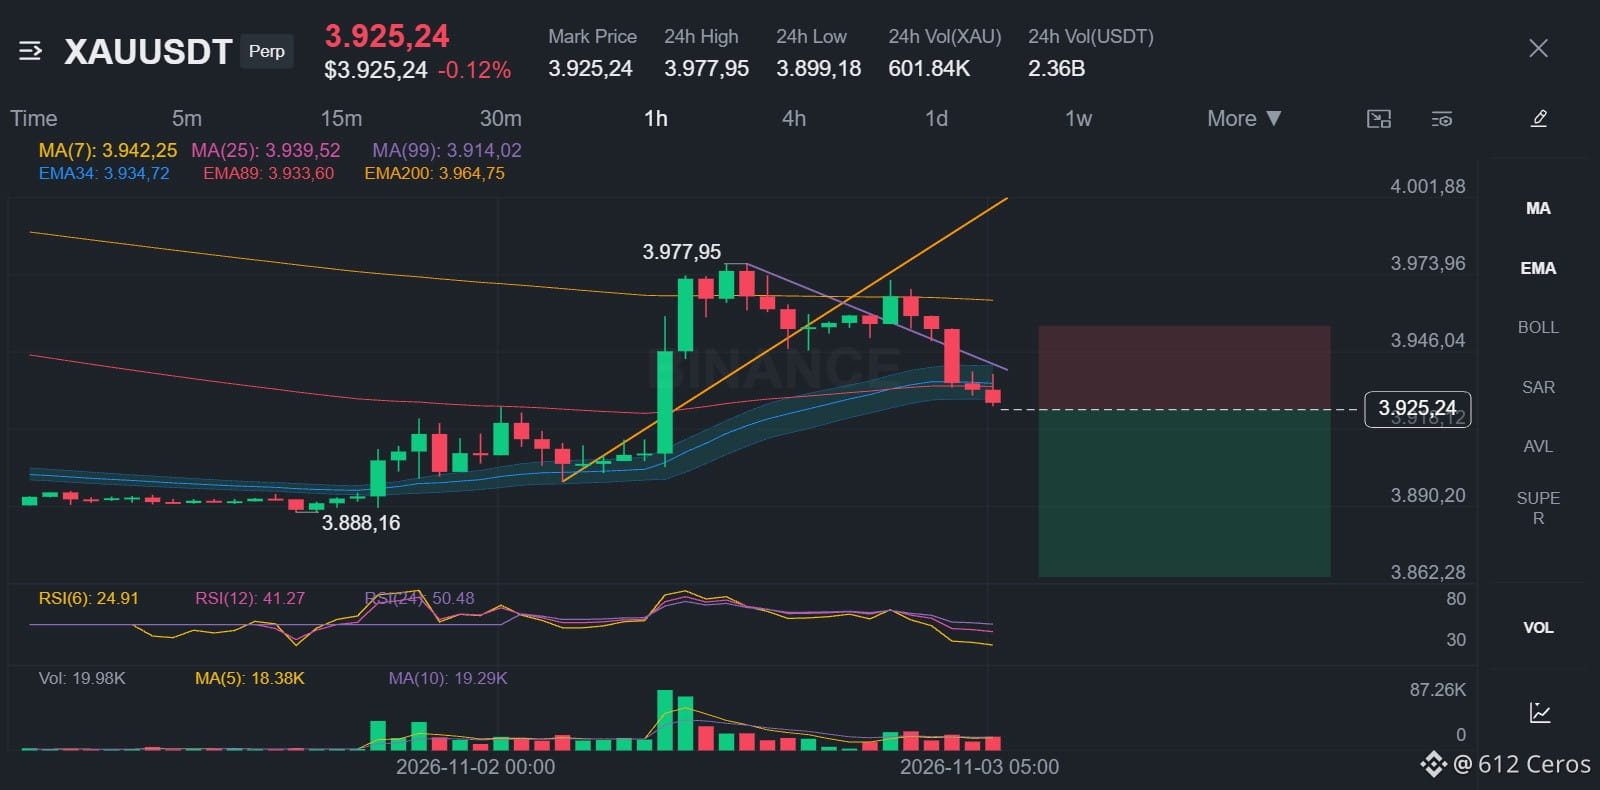
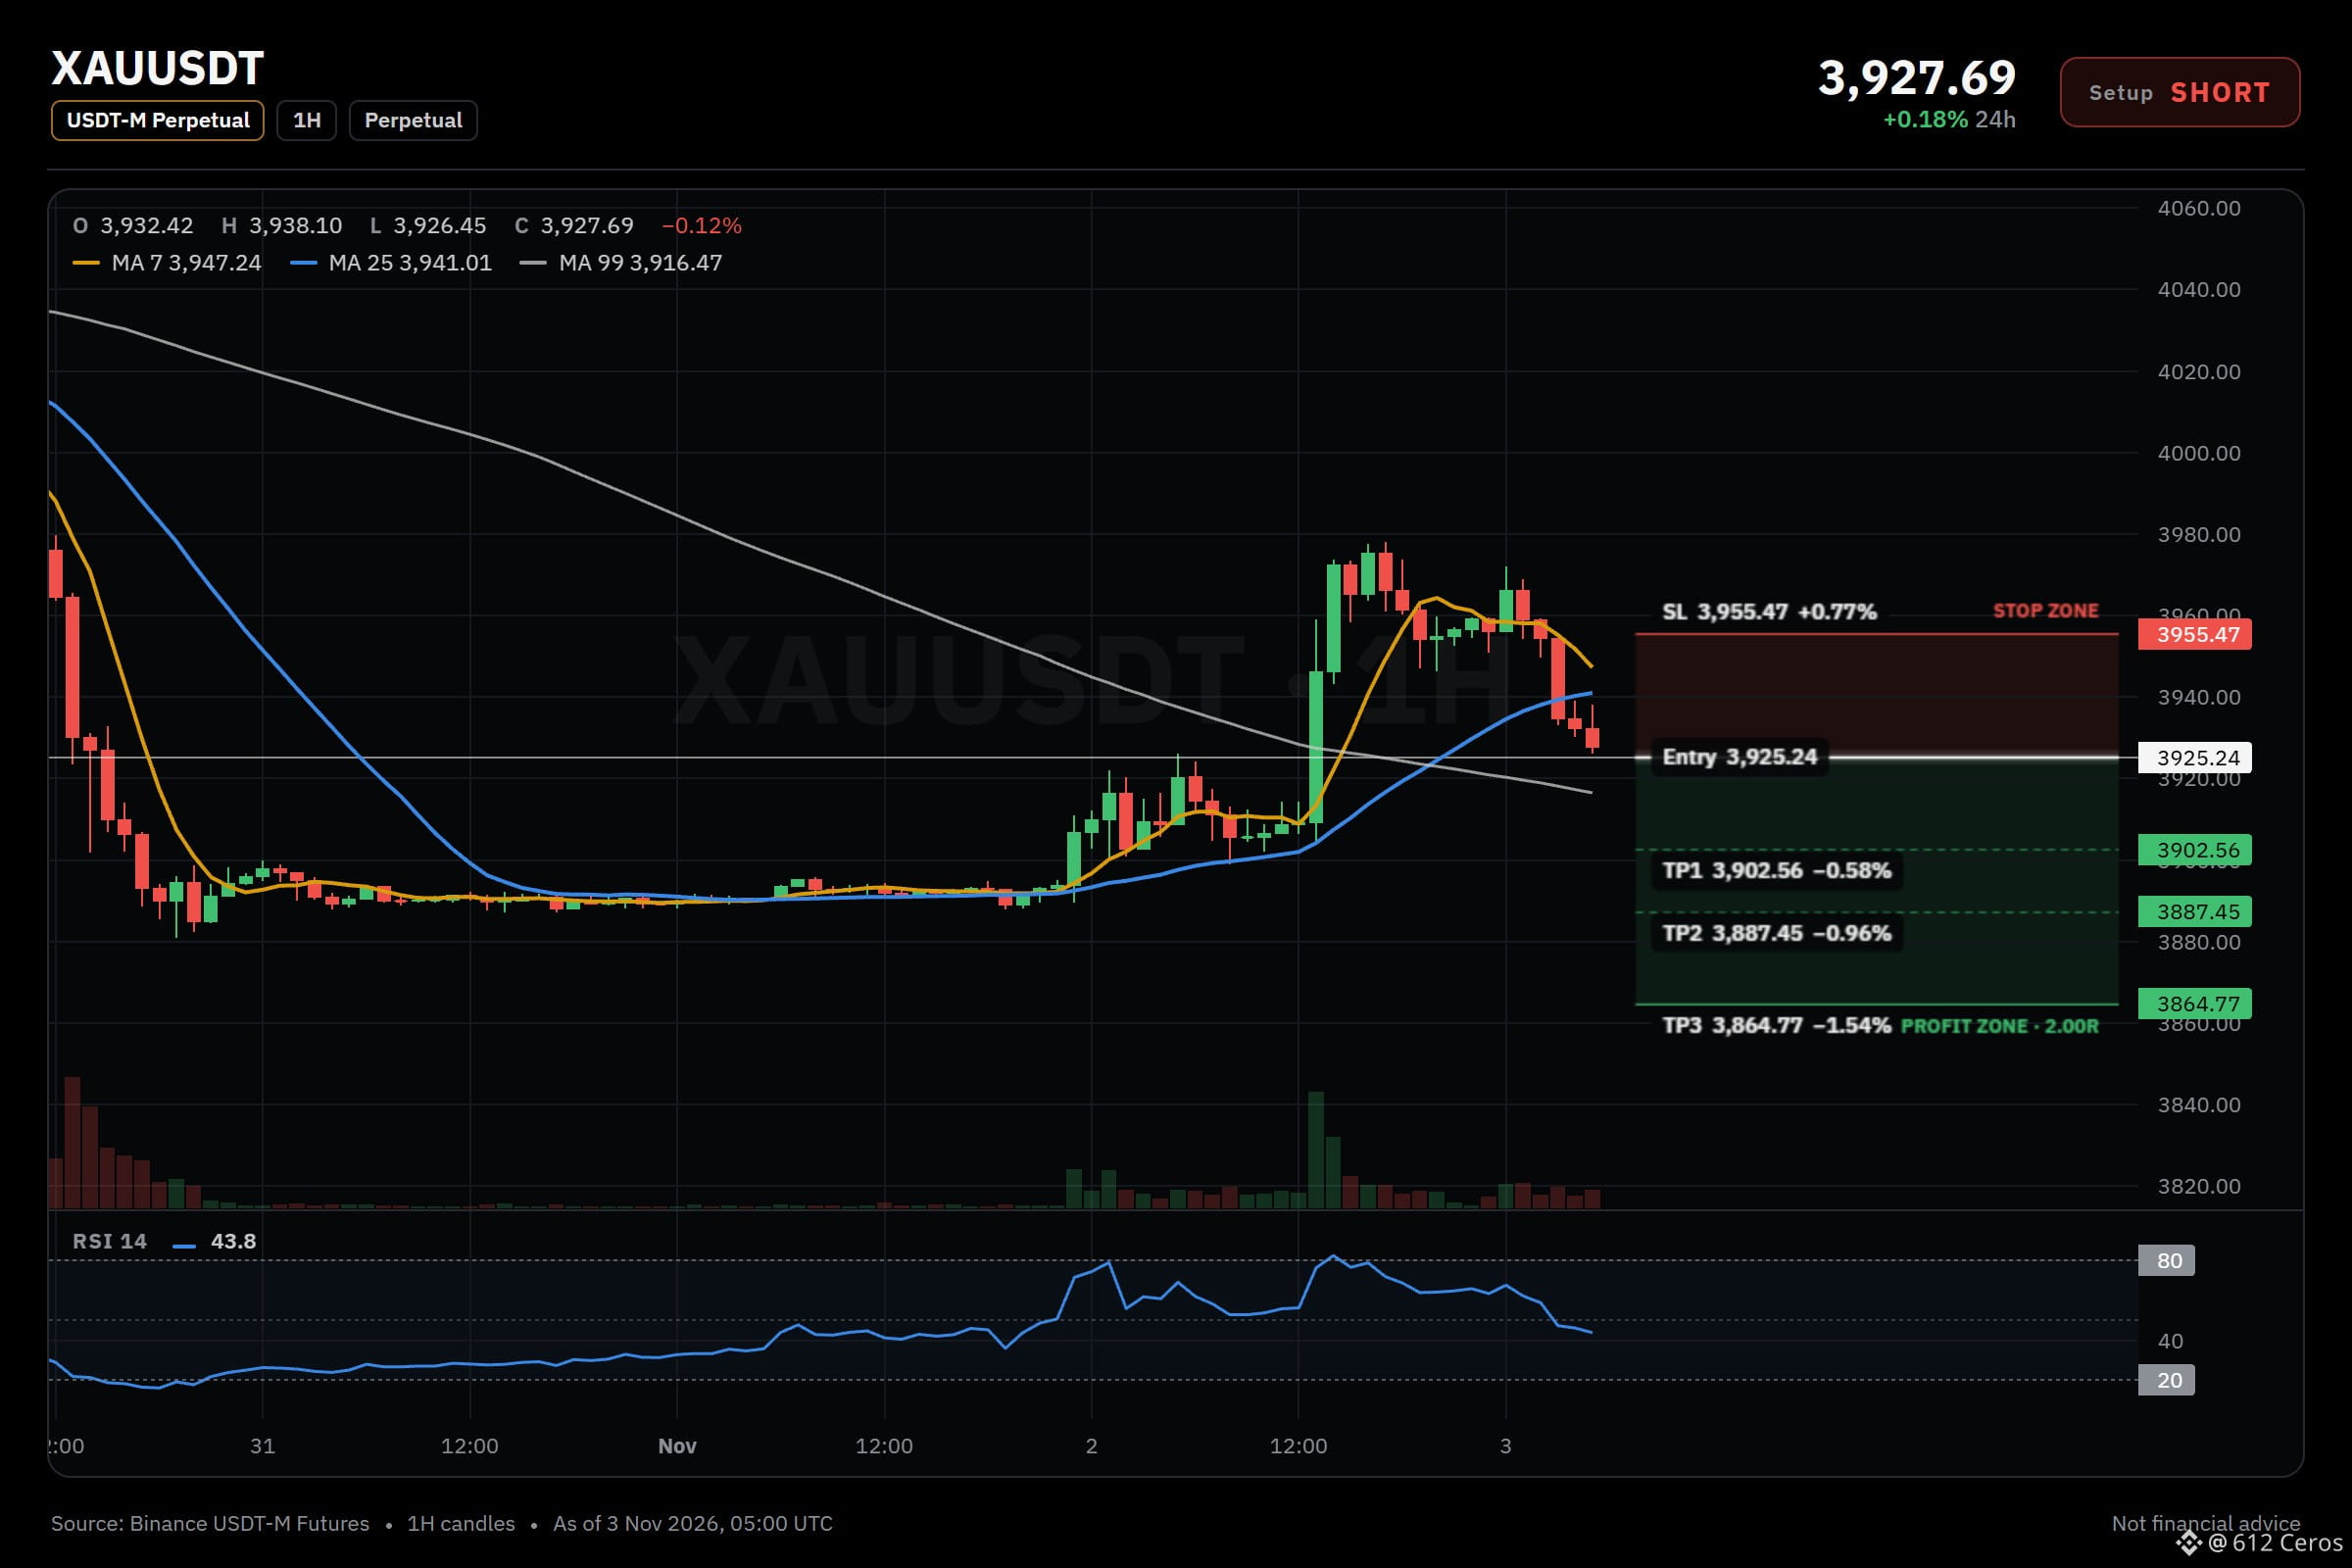
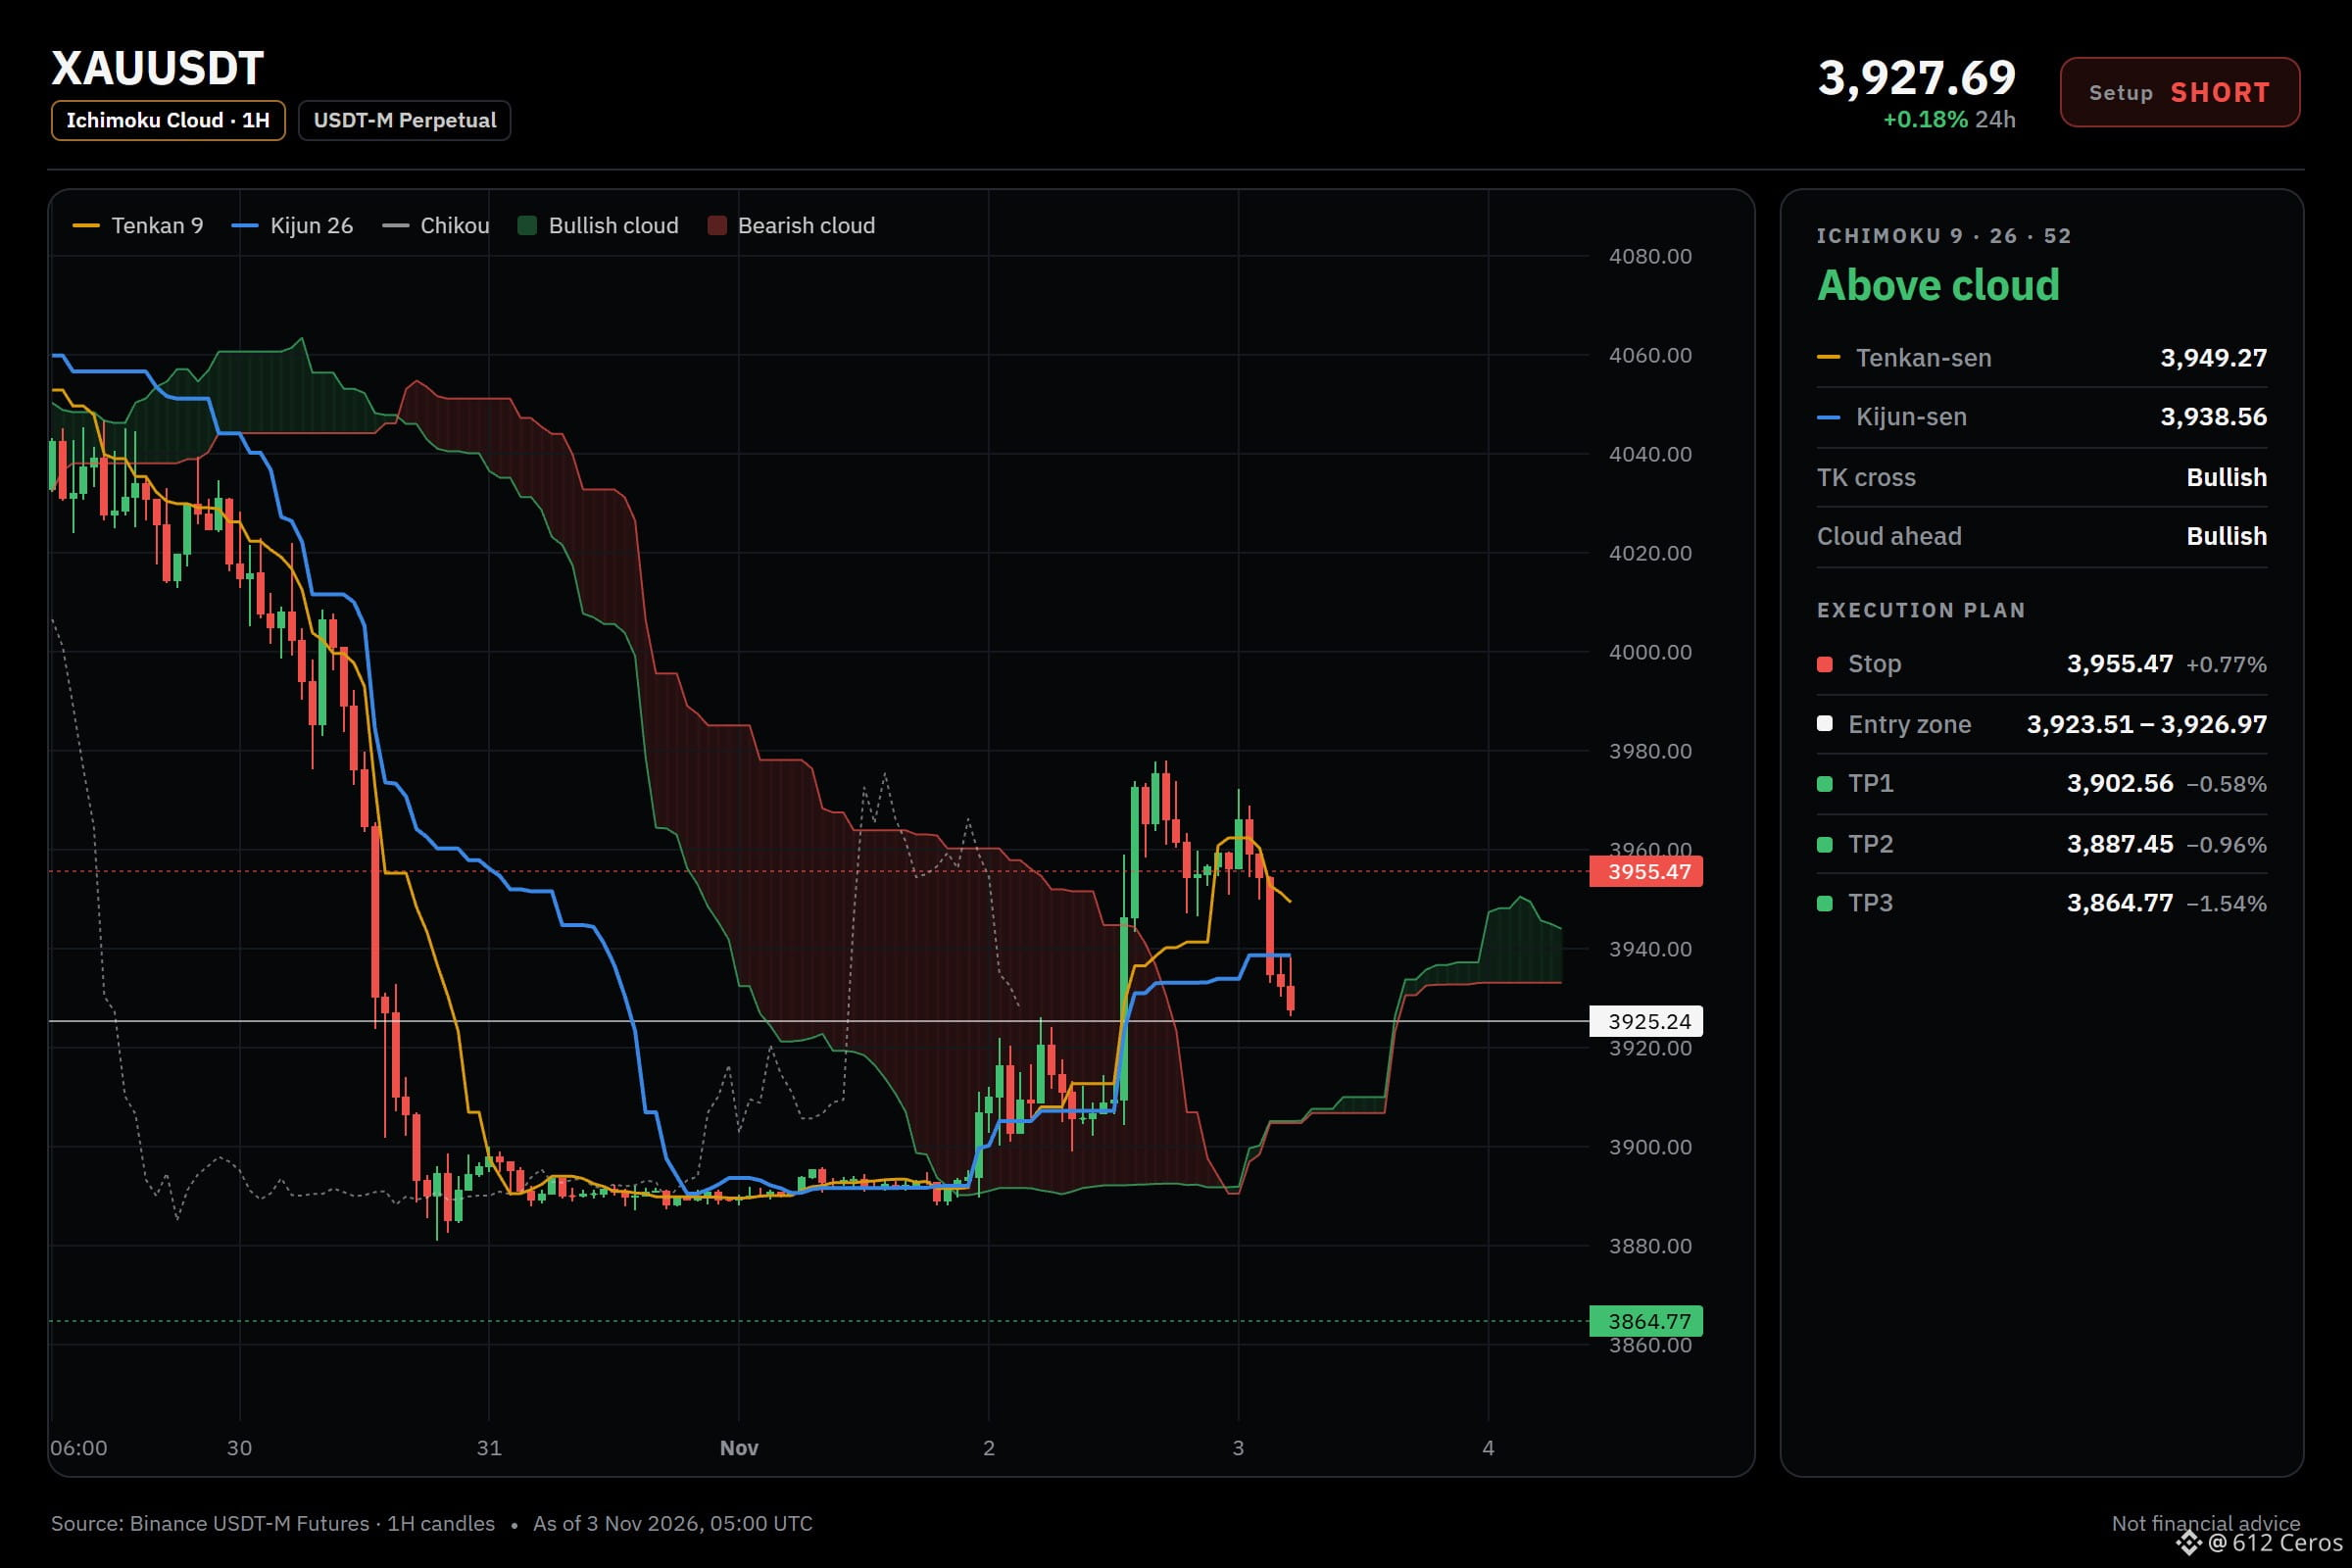
XAU holds below stacked moving averages
🔴 SHORT $XAU /USDT: expecting price to go DOWN
Bias: SHORT · Strong
Entry: 3923.51 – 3926.97
TP1: 3902.56 (-0.6%)
TP2: 3887.45 (-1.0%)
TP3: 3864.77 (-1.5%)
SL: 3955.47 (+0.8%)
Plan: enter only inside the zone, close 50% at TP1, 25% at TP2, 25% at TP3, and move the stop to entry after TP1.
Why SHORT? 6/12 signals agree, 1 against.
• Daily trend down (below EMA50 & EMA200)
• 4h trend down (below EMA50 & EMA200)
• 1h trend down (below EMA50 & EMA200)
Risk: Stronger than BTC (+2.28% 24h vs BTC)
Bear path:
Price should slide toward 3902 and 3887 as the three timeframes stay bearish and sellers are driving the move.
What kills it:
A break above 3955.47 would prove the setup wrong and I would exit immediately.
What level would you invalidate this short at?
Full setup on the chart below.
{future}(XAUUSDT)
📲 Want more of my latest signals? Join me here:
[https://app.binance.com/uni-qr/D26WbL9t](https://app.binance.com/uni-qr/D26WbL9t)
⚠️ Personal market analysis only. NFA — manage risk and DYOR.
Educational content, not investment advice or a recommendation to buy, sell, deposit, or withdraw any asset. No paid promotion or referral/affiliate links.
XAU holds below stacked moving averages
🔴 SHORT $XAU /USDT: expecting price to go DOWN
Bias: SHORT · Strong
Entry: 3923.51 – 3926.97
TP1: 3902.56 (-0.6%)
TP2: 3887.45 (-1.0%)
TP3: 3864.77 (-1.5%)
SL: 3955.47 (+0.8%)
Plan: enter only inside the zone, close 50% at TP1, 25% at TP2, 25% at TP3, and move the stop to entry after TP1.
Why SHORT? 6/12 signals agree, 1 against.
• Daily trend down (below EMA50 & EMA200)
• 4h trend down (below EMA50 & EMA200)
• 1h trend down (below EMA50 & EMA200)
Risk: Stronger than BTC (+2.28% 24h vs BTC)
Bear path:
Price should slide toward 3902 and 3887 as the three timeframes stay bearish and sellers are driving the move.
What kills it:
A break above 3955.47 would prove the setup wrong and I would exit immediately.
What level would you invalidate this short at?
Full setup on the chart below.
📲 Want more of my latest signals? Join me here:
https://app.binance.com/uni-qr/D26WbL9t
⚠️ Personal market analysis only. NFA — manage risk and DYOR.
Educational content, not investment advice or a recommendation to buy, sell, deposit, or withdraw any asset. No paid promotion or referral/affiliate links.
🔴 SHORT $XAU /USDT: expecting price to go DOWN
Bias: SHORT · Strong
Entry: 3923.51 – 3926.97
TP1: 3902.56 (-0.6%)
TP2: 3887.45 (-1.0%)
TP3: 3864.77 (-1.5%)
SL: 3955.47 (+0.8%)
Plan: enter only inside the zone, close 50% at TP1, 25% at TP2, 25% at TP3, and move the stop to entry after TP1.
Why SHORT? 6/12 signals agree, 1 against.
• Daily trend down (below EMA50 & EMA200)
• 4h trend down (below EMA50 & EMA200)
• 1h trend down (below EMA50 & EMA200)
Risk: Stronger than BTC (+2.28% 24h vs BTC)
Bear path:
Price should slide toward 3902 and 3887 as the three timeframes stay bearish and sellers are driving the move.
What kills it:
A break above 3955.47 would prove the setup wrong and I would exit immediately.
What level would you invalidate this short at?
Full setup on the chart below.
📲 Want more of my latest signals? Join me here:
https://app.binance.com/uni-qr/D26WbL9t
⚠️ Personal market analysis only. NFA — manage risk and DYOR.
Educational content, not investment advice or a recommendation to buy, sell, deposit, or withdraw any asset. No paid promotion or referral/affiliate links.
356
·
--
Bearish
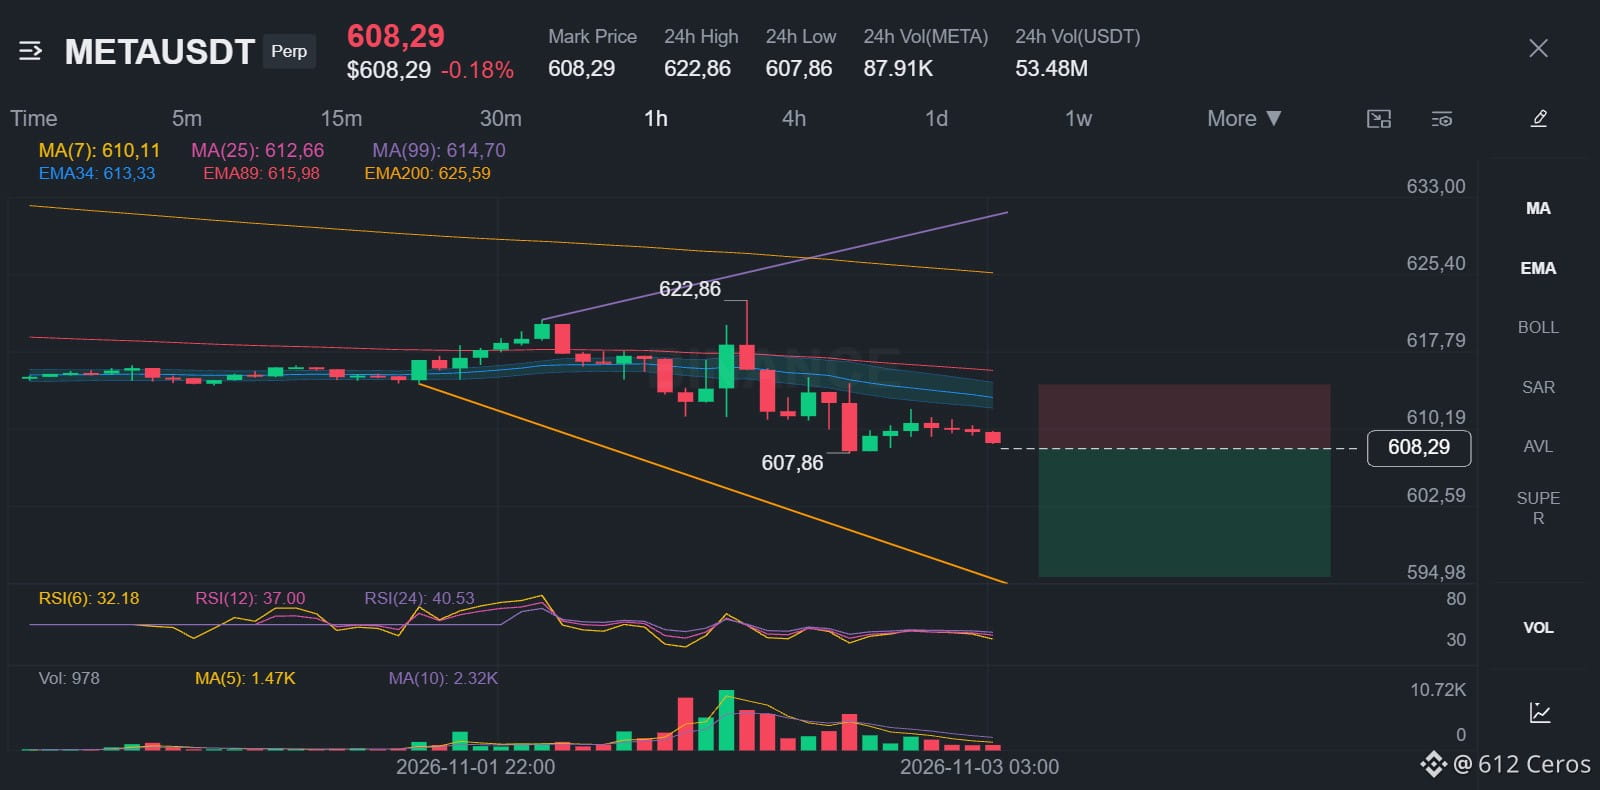
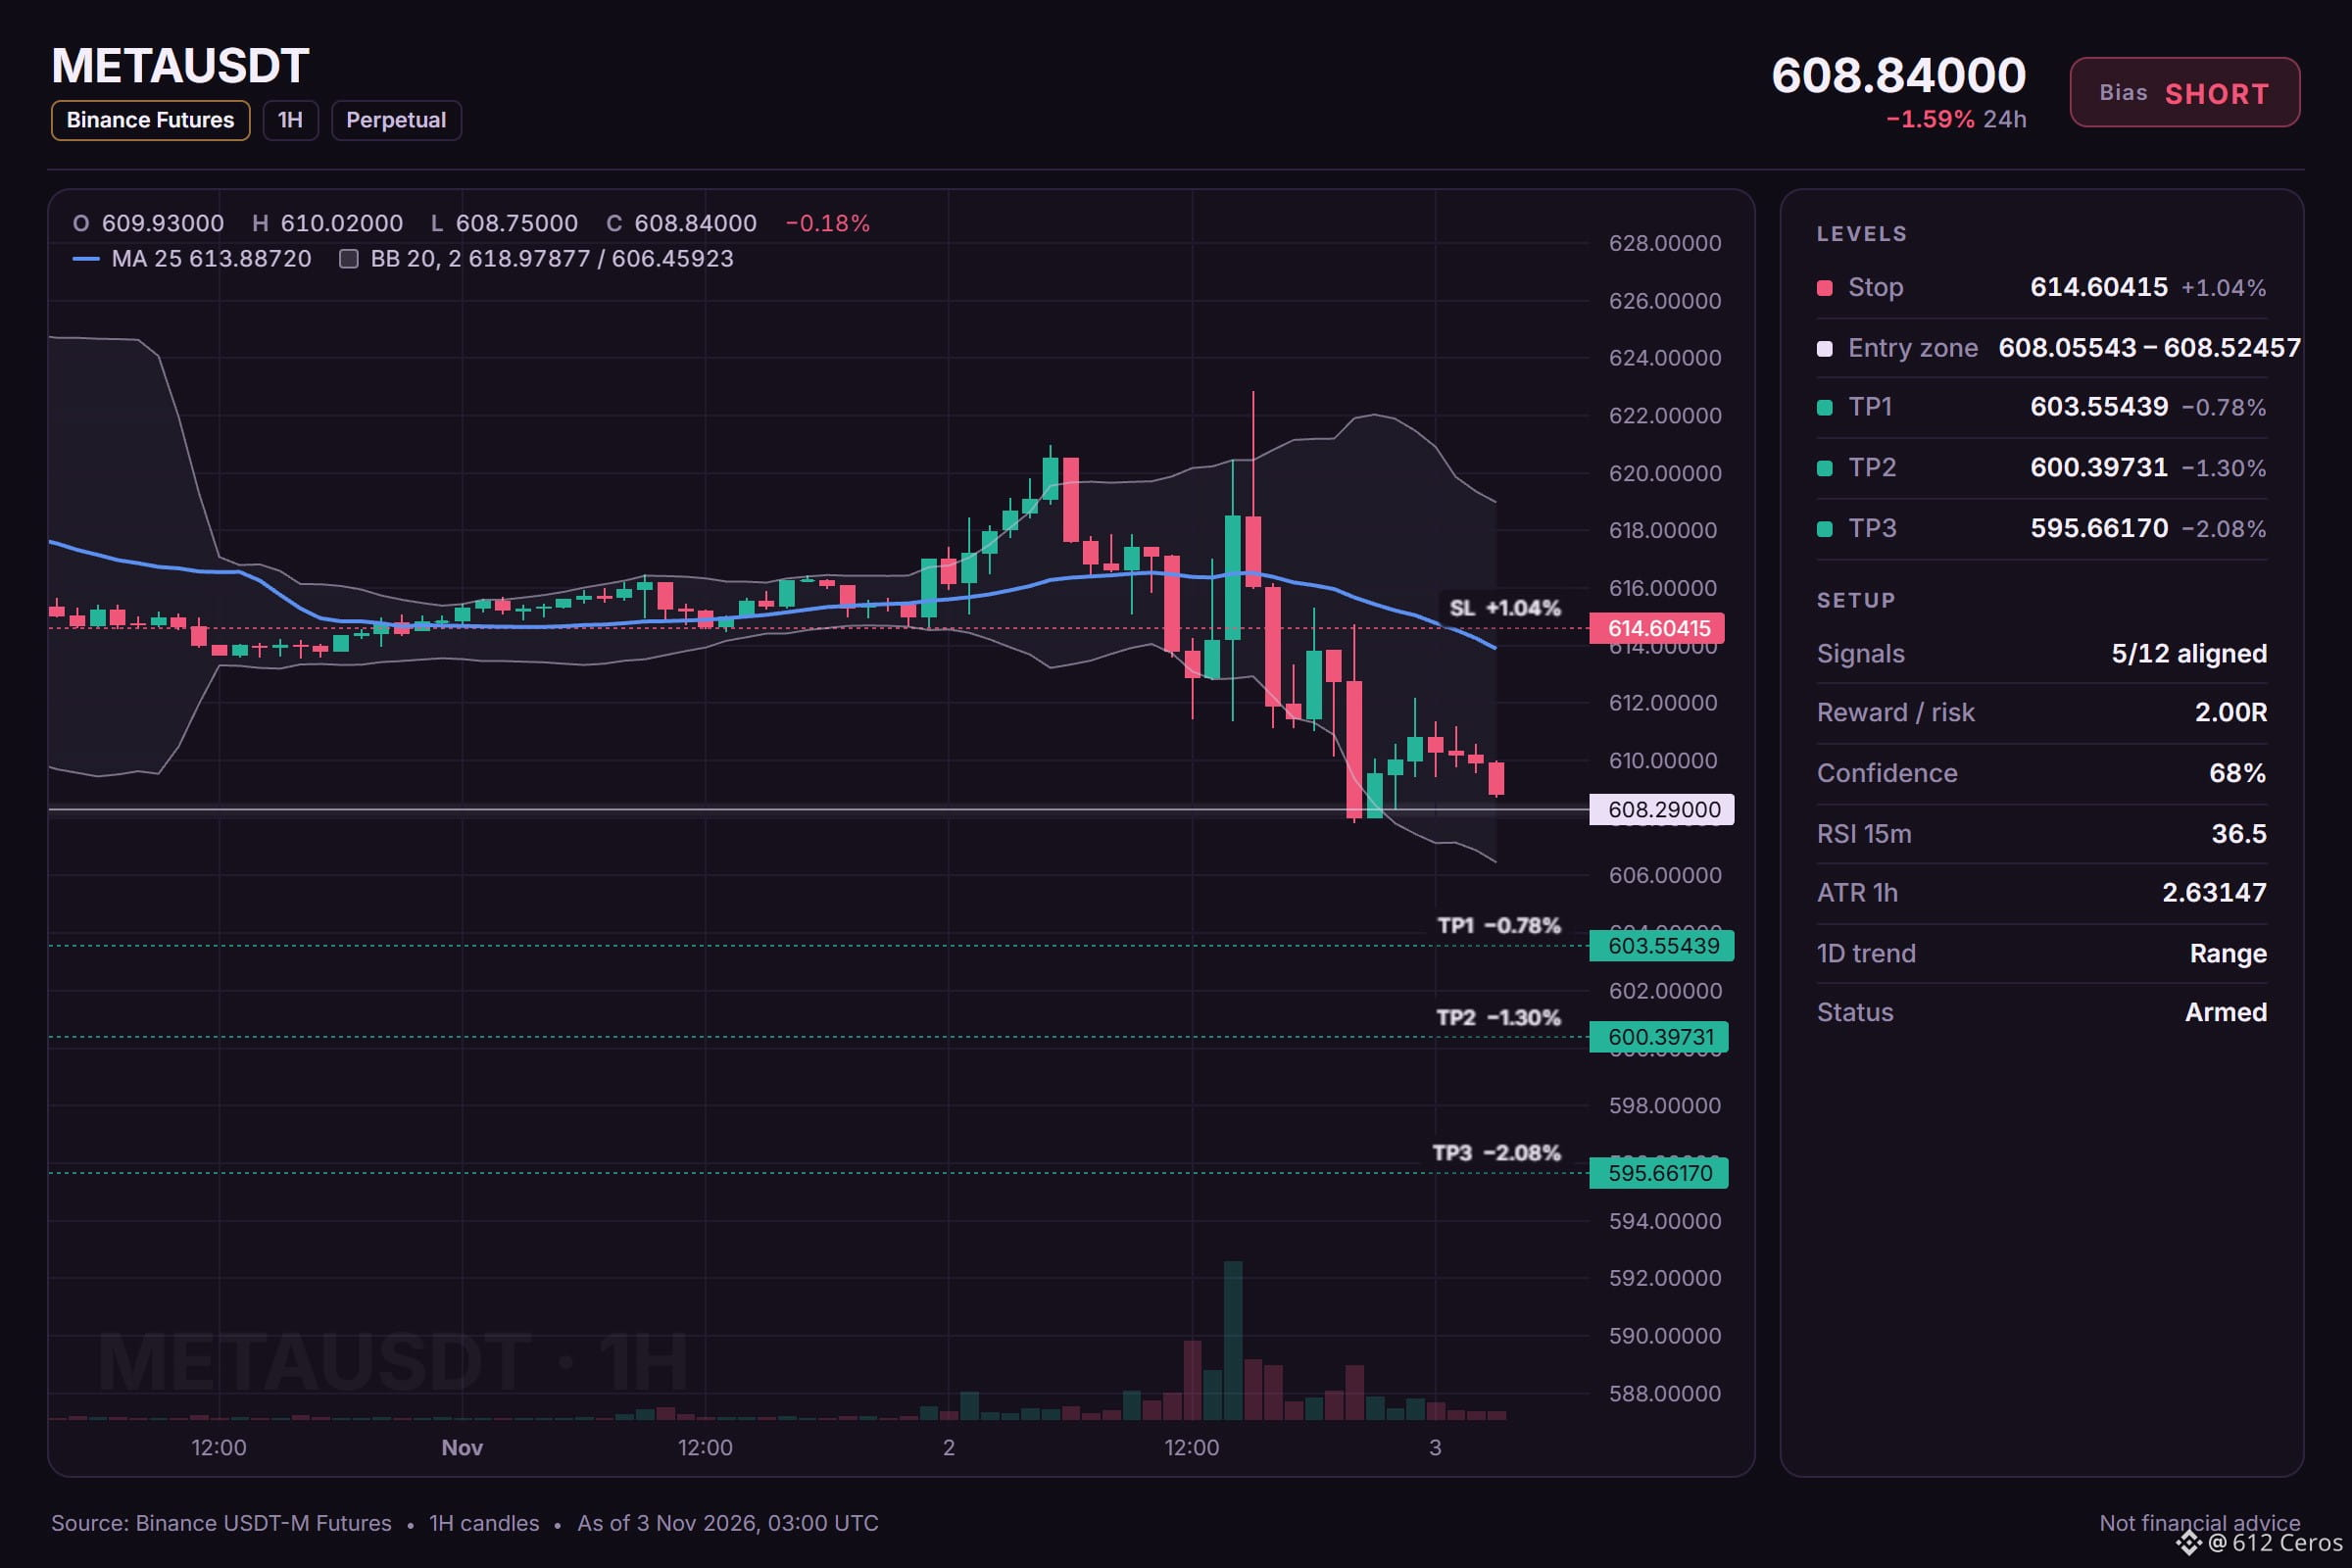
🔴 SHORT $META /USDT: expecting price to go DOWN
Bias: SHORT · Leaning
Entry: 608.05543 – 608.52457
TP1: 603.55439 (-0.8%)
TP2: 600.39731 (-1.3%)
TP3: 595.66170 (-2.1%)
SL: 614.60415 (+1.0%)
Plan: enter only inside the zone, close 50% at TP1, 25% at TP2, 25% at TP3, and move the stop to entry after TP1.
Note: moderate conviction only, keep size light.
META is sliding below its bearish 4h stack
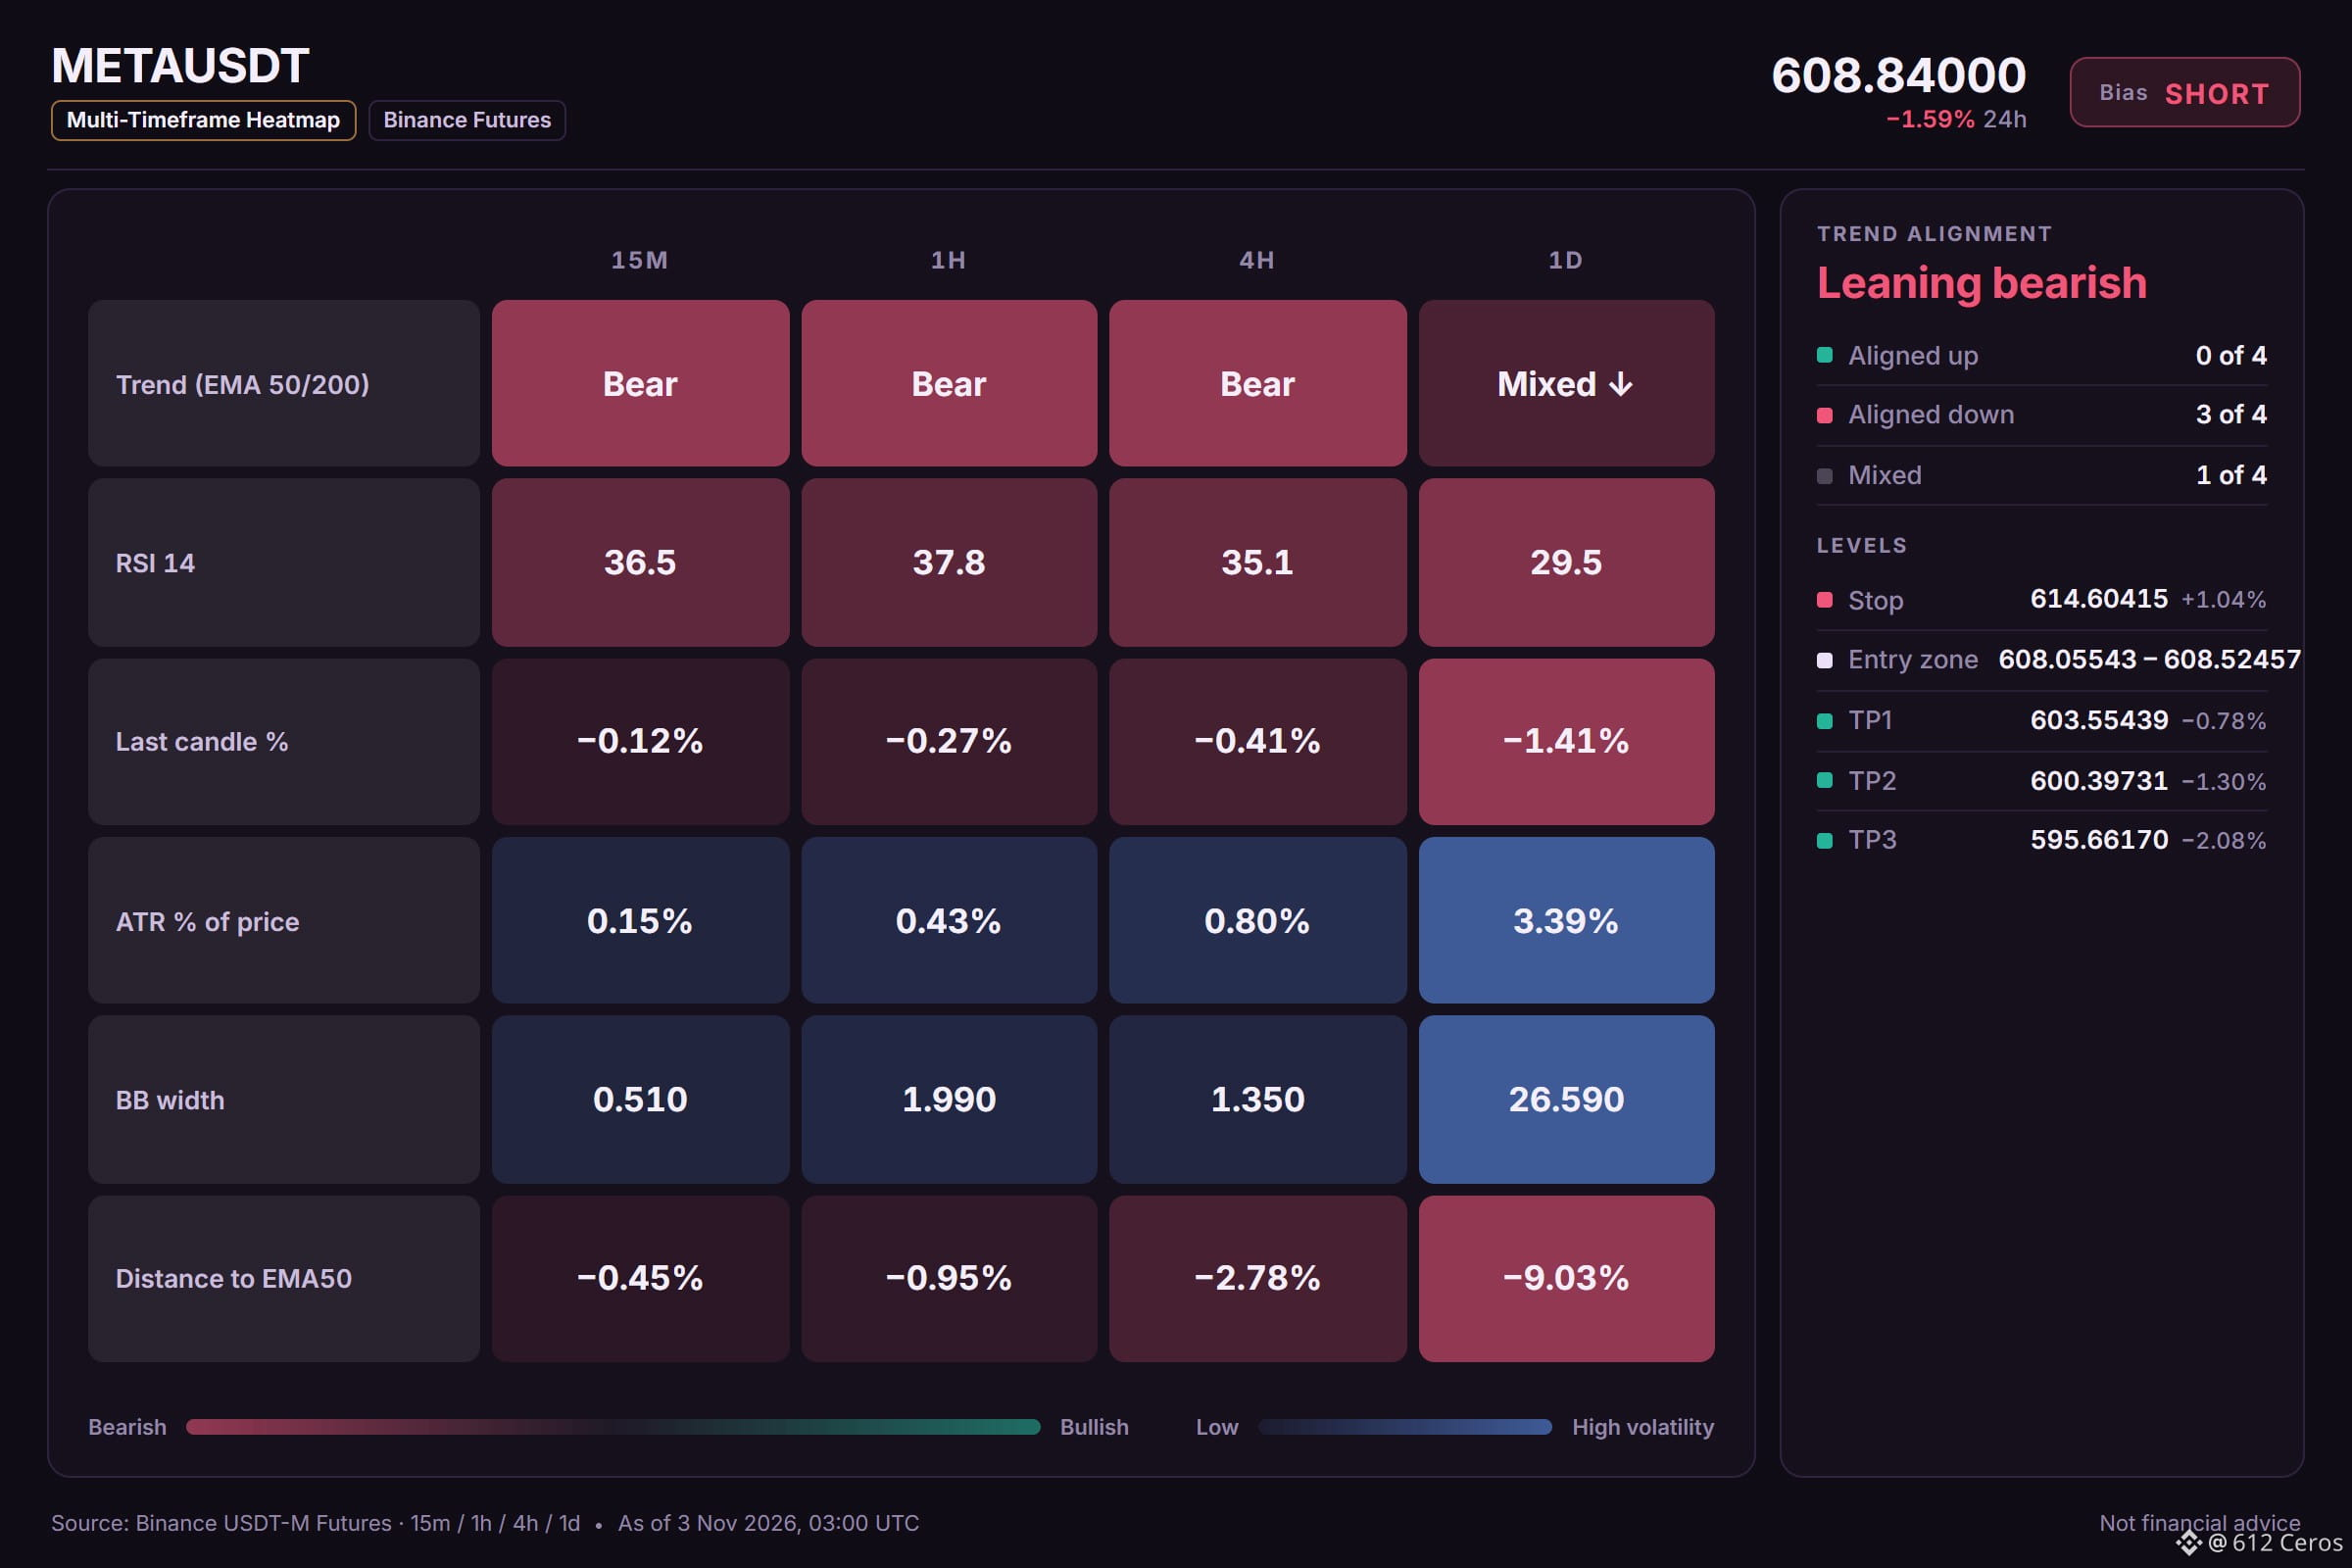
Why SHORT? 5/12 signals agree, 0 against.
• 4h trend down (below EMA50 & EMA200)
• 1h trend down (below EMA50 & EMA200)
• Sellers have the momentum (4h RSI 35.1)
The 4h trend shows price below EMA50 and EMA200 in a bearish stack, confirming sellers control the swing. The 1h trend mirrors this with price below EMA50 and EMA200 in a bearish stack.
Do you disagree with this short setup?
Chart with every level below.
{future}(METAUSDT)
📲 Want more of my latest signals? Join me here:
[https://app.binance.com/uni-qr/D26WbL9t](https://app.binance.com/uni-qr/D26WbL9t)
⚠️ Personal market analysis only. NFA — manage risk and DYOR.
Educational content, not investment advice or a recommendation to buy, sell, deposit, or withdraw any asset. No paid promotion or referral/affiliate links.
🔴 SHORT $META /USDT: expecting price to go DOWN
Bias: SHORT · Leaning
Entry: 608.05543 – 608.52457
TP1: 603.55439 (-0.8%)
TP2: 600.39731 (-1.3%)
TP3: 595.66170 (-2.1%)
SL: 614.60415 (+1.0%)
Plan: enter only inside the zone, close 50% at TP1, 25% at TP2, 25% at TP3, and move the stop to entry after TP1.
Note: moderate conviction only, keep size light.
META is sliding below its bearish 4h stack
Why SHORT? 5/12 signals agree, 0 against.
• 4h trend down (below EMA50 & EMA200)
• 1h trend down (below EMA50 & EMA200)
• Sellers have the momentum (4h RSI 35.1)
The 4h trend shows price below EMA50 and EMA200 in a bearish stack, confirming sellers control the swing. The 1h trend mirrors this with price below EMA50 and EMA200 in a bearish stack.
Do you disagree with this short setup?
Chart with every level below.
📲 Want more of my latest signals? Join me here:
https://app.binance.com/uni-qr/D26WbL9t
⚠️ Personal market analysis only. NFA — manage risk and DYOR.
Educational content, not investment advice or a recommendation to buy, sell, deposit, or withdraw any asset. No paid promotion or referral/affiliate links.
Bias: SHORT · Leaning
Entry: 608.05543 – 608.52457
TP1: 603.55439 (-0.8%)
TP2: 600.39731 (-1.3%)
TP3: 595.66170 (-2.1%)
SL: 614.60415 (+1.0%)
Plan: enter only inside the zone, close 50% at TP1, 25% at TP2, 25% at TP3, and move the stop to entry after TP1.
Note: moderate conviction only, keep size light.
META is sliding below its bearish 4h stack
Why SHORT? 5/12 signals agree, 0 against.
• 4h trend down (below EMA50 & EMA200)
• 1h trend down (below EMA50 & EMA200)
• Sellers have the momentum (4h RSI 35.1)
The 4h trend shows price below EMA50 and EMA200 in a bearish stack, confirming sellers control the swing. The 1h trend mirrors this with price below EMA50 and EMA200 in a bearish stack.
Do you disagree with this short setup?
Chart with every level below.
📲 Want more of my latest signals? Join me here:
https://app.binance.com/uni-qr/D26WbL9t
⚠️ Personal market analysis only. NFA — manage risk and DYOR.
Educational content, not investment advice or a recommendation to buy, sell, deposit, or withdraw any asset. No paid promotion or referral/affiliate links.
1
835
·
--
Bearish
Can the daily bearish stack turn the 1h pullback into a short entry?
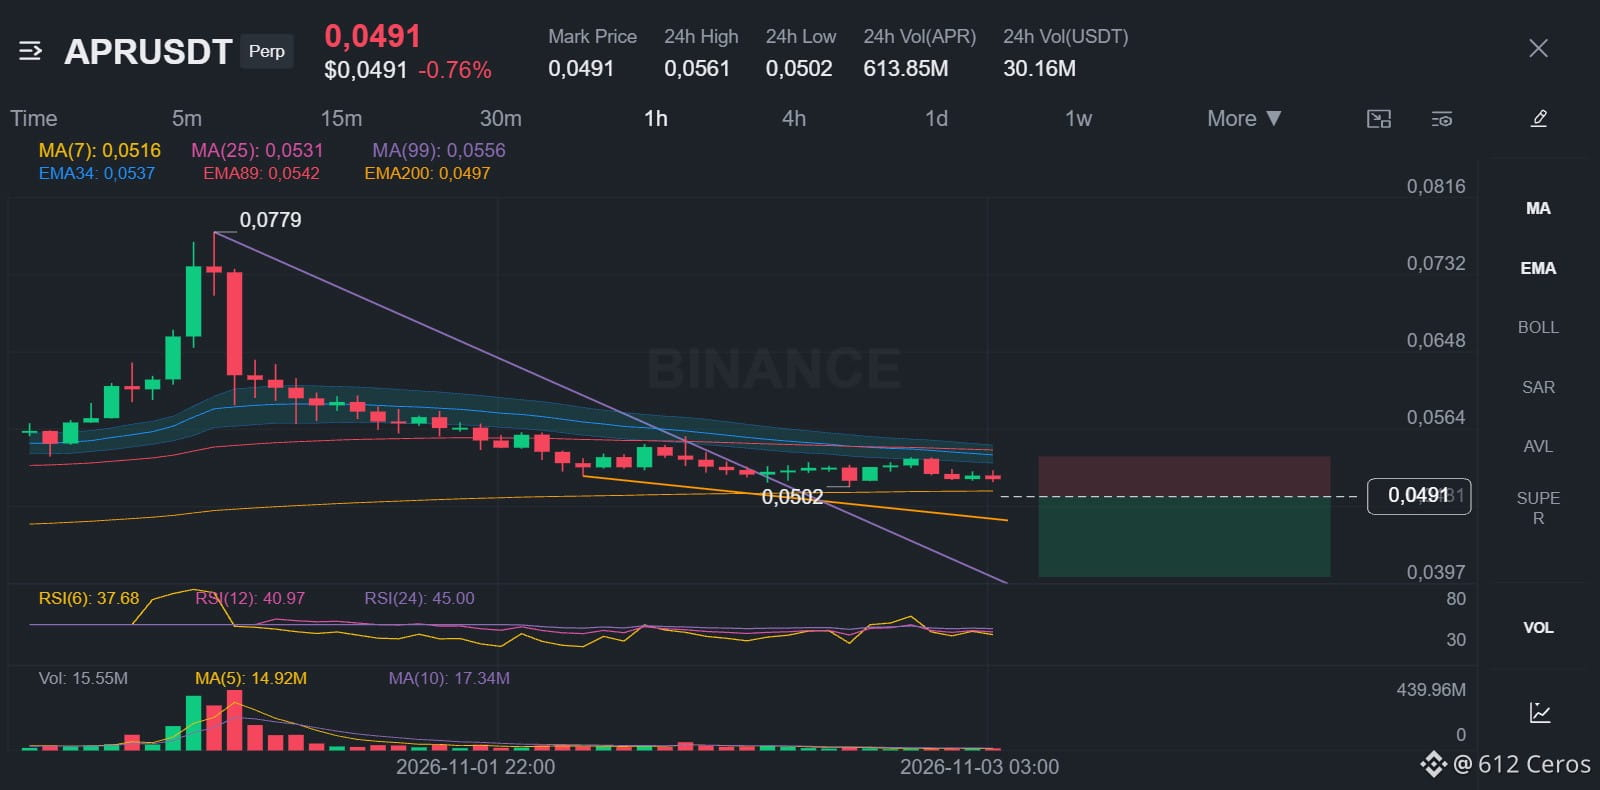
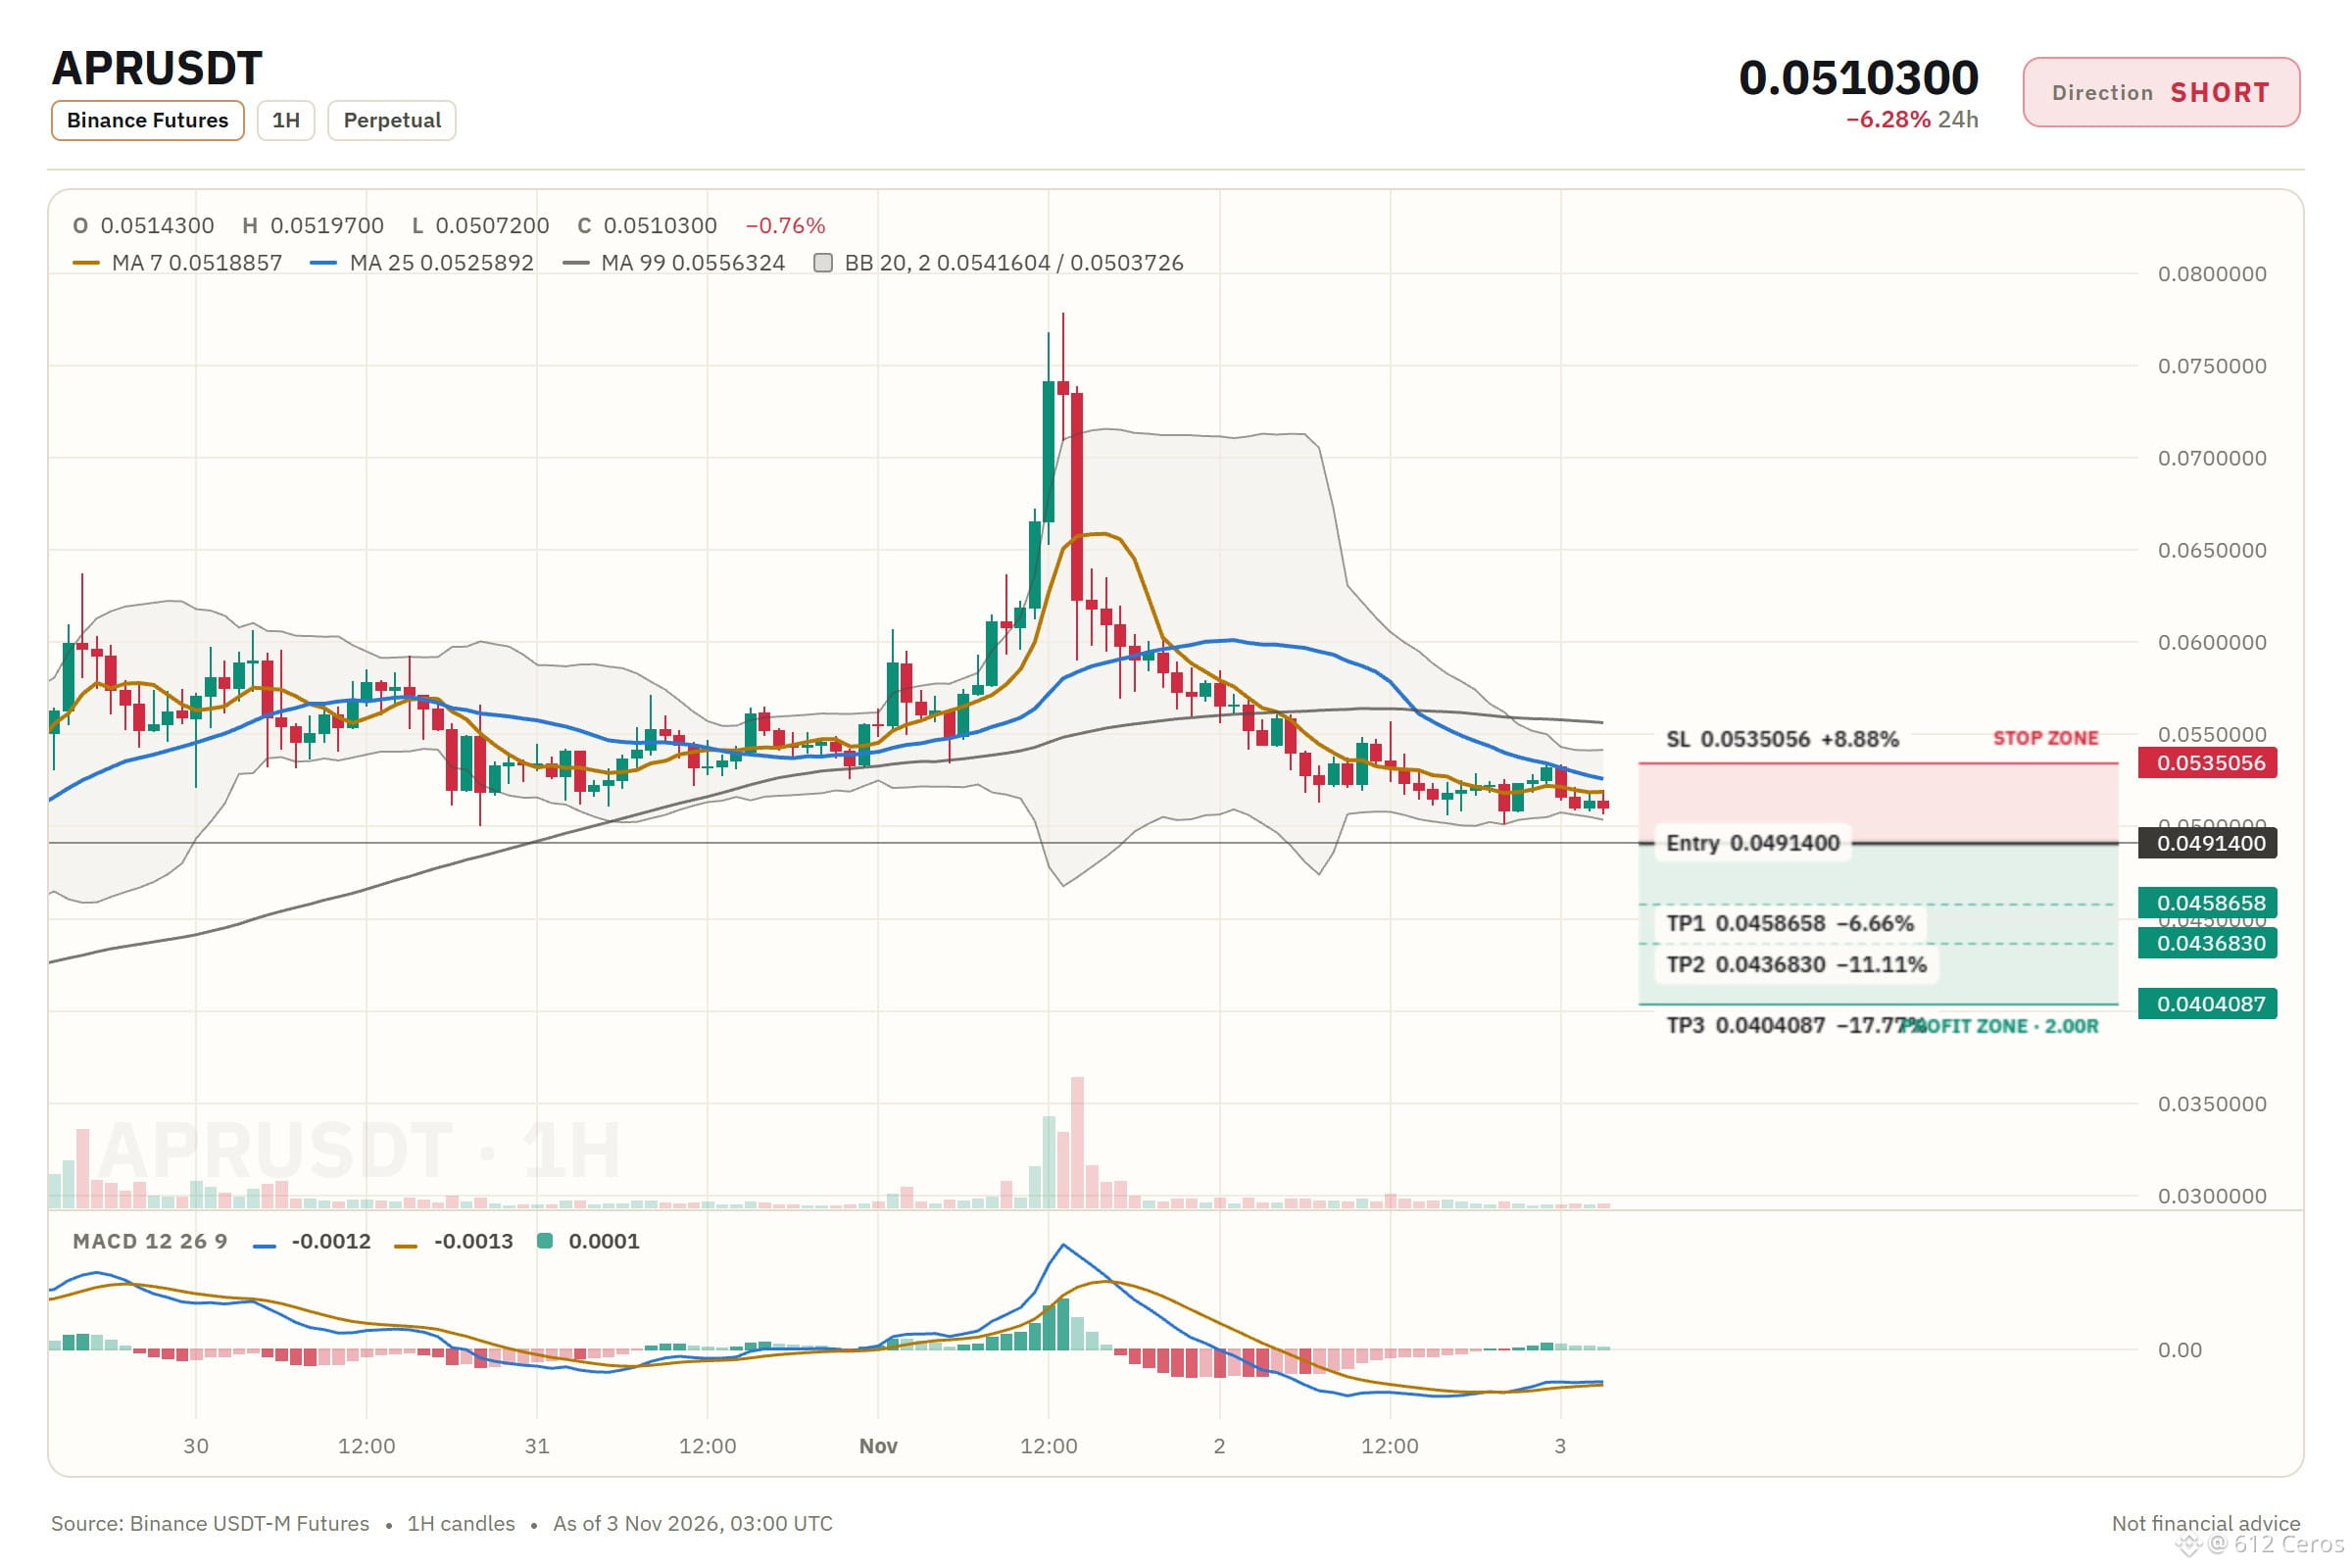
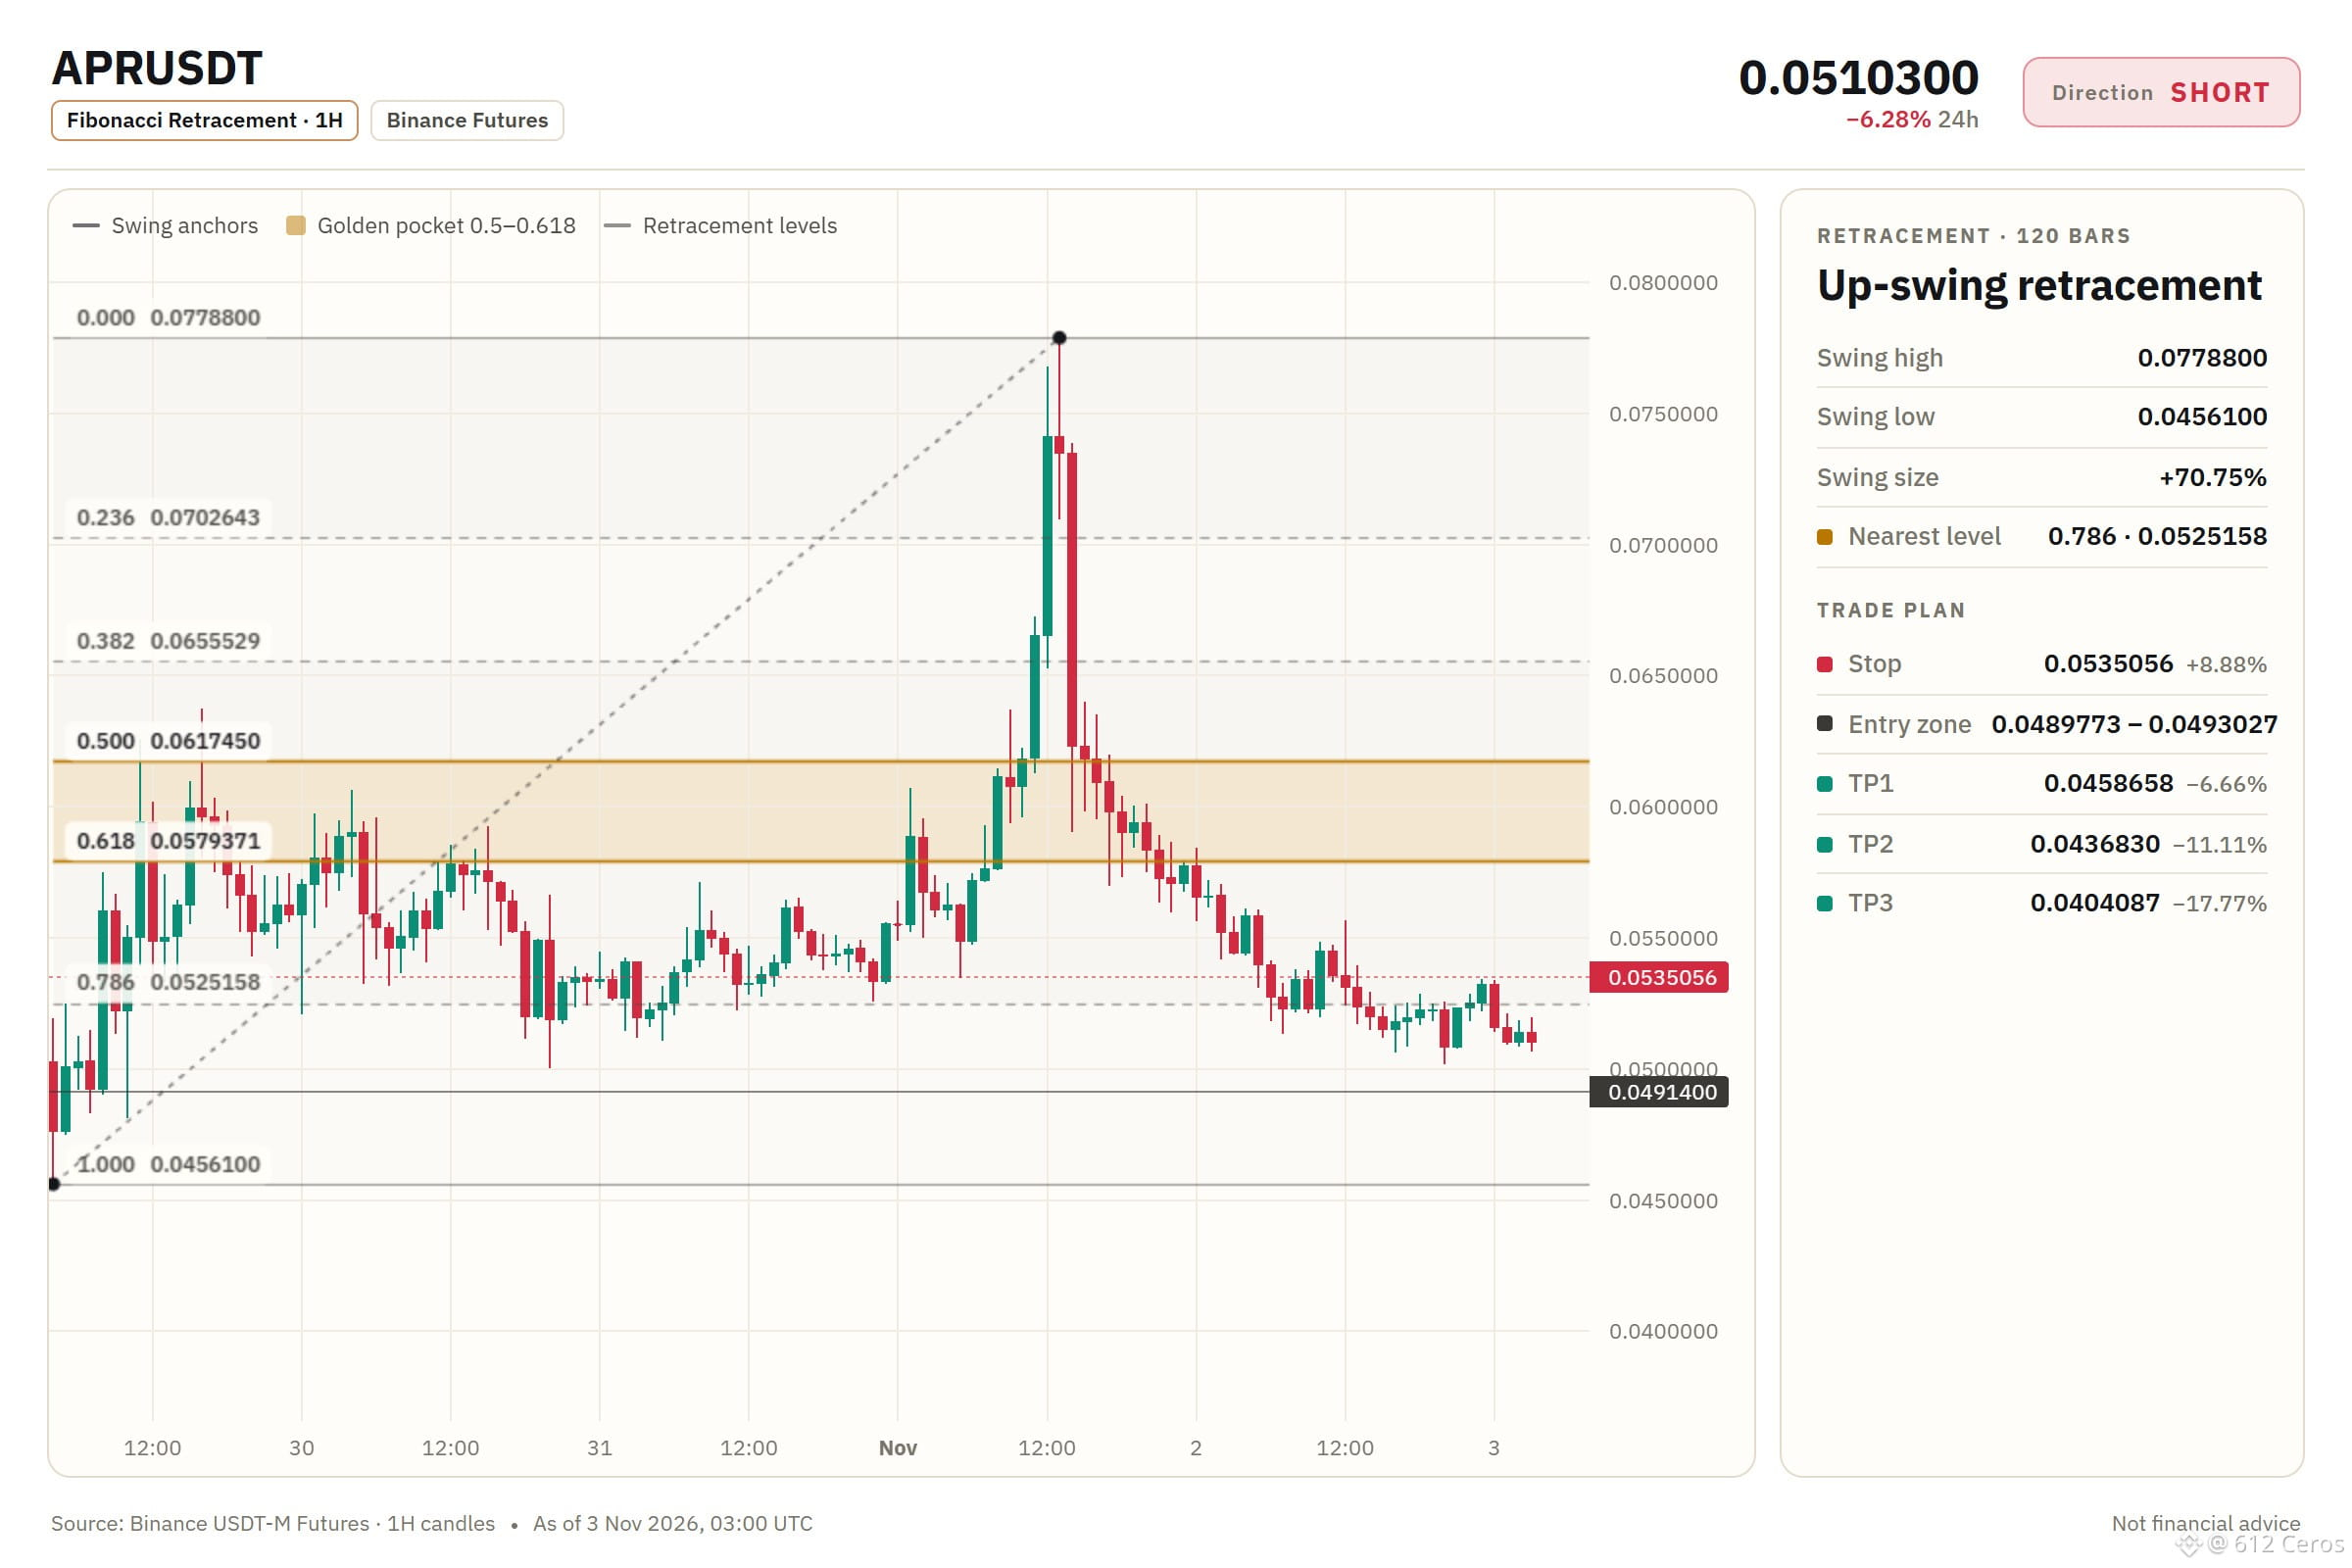
🔴 SHORT $APR /USDT: expecting price to go DOWN
Bias: SHORT · Leaning
Entry: 0.0489773 – 0.0493027
TP1: 0.0458658 (-6.7%)
TP2: 0.0436830 (-11.1%)
TP3: 0.0404087 (-17.8%)
SL: 0.0535056 (+8.9%)
Plan: enter only inside the zone, close 50% at TP1, 25% at TP2, 25% at TP3, and move the stop to entry after TP1.
Note: moderate conviction only, keep size light.
Why SHORT? What I checked: 5/12 agree, 0 against.
• Daily trend down (below EMA50 & EMA200)
• 4h trend down (below EMA50 & EMA200)
• Sellers have the momentum (1h RSI 40.2)
Watch: The idea is wrong if price reaches the stop at 0.0535056
Bottom line: The daily and 4h bearish stacks support the short, but the 1h trend is mixed and momentum is weak, so conviction is moderate and some factors disagree.
Where do you place your invalidation if this entry does not hold?
Levels mapped on the chart below.
{future}(APRUSDT)
📲 Want more of my latest signals? Join me here:
[https://app.binance.com/uni-qr/D26WbL9t](https://app.binance.com/uni-qr/D26WbL9t)
⚠️ Personal market analysis only. NFA — manage risk and DYOR.
Educational content, not investment advice or a recommendation to buy, sell, deposit, or withdraw any asset. No paid promotion or referral/affiliate links.
Can the daily bearish stack turn the 1h pullback into a short entry?
🔴 SHORT $APR /USDT: expecting price to go DOWN
Bias: SHORT · Leaning
Entry: 0.0489773 – 0.0493027
TP1: 0.0458658 (-6.7%)
TP2: 0.0436830 (-11.1%)
TP3: 0.0404087 (-17.8%)
SL: 0.0535056 (+8.9%)
Plan: enter only inside the zone, close 50% at TP1, 25% at TP2, 25% at TP3, and move the stop to entry after TP1.
Note: moderate conviction only, keep size light.
Why SHORT? What I checked: 5/12 agree, 0 against.
• Daily trend down (below EMA50 & EMA200)
• 4h trend down (below EMA50 & EMA200)
• Sellers have the momentum (1h RSI 40.2)
Watch: The idea is wrong if price reaches the stop at 0.0535056
Bottom line: The daily and 4h bearish stacks support the short, but the 1h trend is mixed and momentum is weak, so conviction is moderate and some factors disagree.
Where do you place your invalidation if this entry does not hold?
Levels mapped on the chart below.
📲 Want more of my latest signals? Join me here:
https://app.binance.com/uni-qr/D26WbL9t
⚠️ Personal market analysis only. NFA — manage risk and DYOR.
Educational content, not investment advice or a recommendation to buy, sell, deposit, or withdraw any asset. No paid promotion or referral/affiliate links.
🔴 SHORT $APR /USDT: expecting price to go DOWN
Bias: SHORT · Leaning
Entry: 0.0489773 – 0.0493027
TP1: 0.0458658 (-6.7%)
TP2: 0.0436830 (-11.1%)
TP3: 0.0404087 (-17.8%)
SL: 0.0535056 (+8.9%)
Plan: enter only inside the zone, close 50% at TP1, 25% at TP2, 25% at TP3, and move the stop to entry after TP1.
Note: moderate conviction only, keep size light.
Why SHORT? What I checked: 5/12 agree, 0 against.
• Daily trend down (below EMA50 & EMA200)
• 4h trend down (below EMA50 & EMA200)
• Sellers have the momentum (1h RSI 40.2)
Watch: The idea is wrong if price reaches the stop at 0.0535056
Bottom line: The daily and 4h bearish stacks support the short, but the 1h trend is mixed and momentum is weak, so conviction is moderate and some factors disagree.
Where do you place your invalidation if this entry does not hold?
Levels mapped on the chart below.
📲 Want more of my latest signals? Join me here:
https://app.binance.com/uni-qr/D26WbL9t
⚠️ Personal market analysis only. NFA — manage risk and DYOR.
Educational content, not investment advice or a recommendation to buy, sell, deposit, or withdraw any asset. No paid promotion or referral/affiliate links.
1
641
·
--
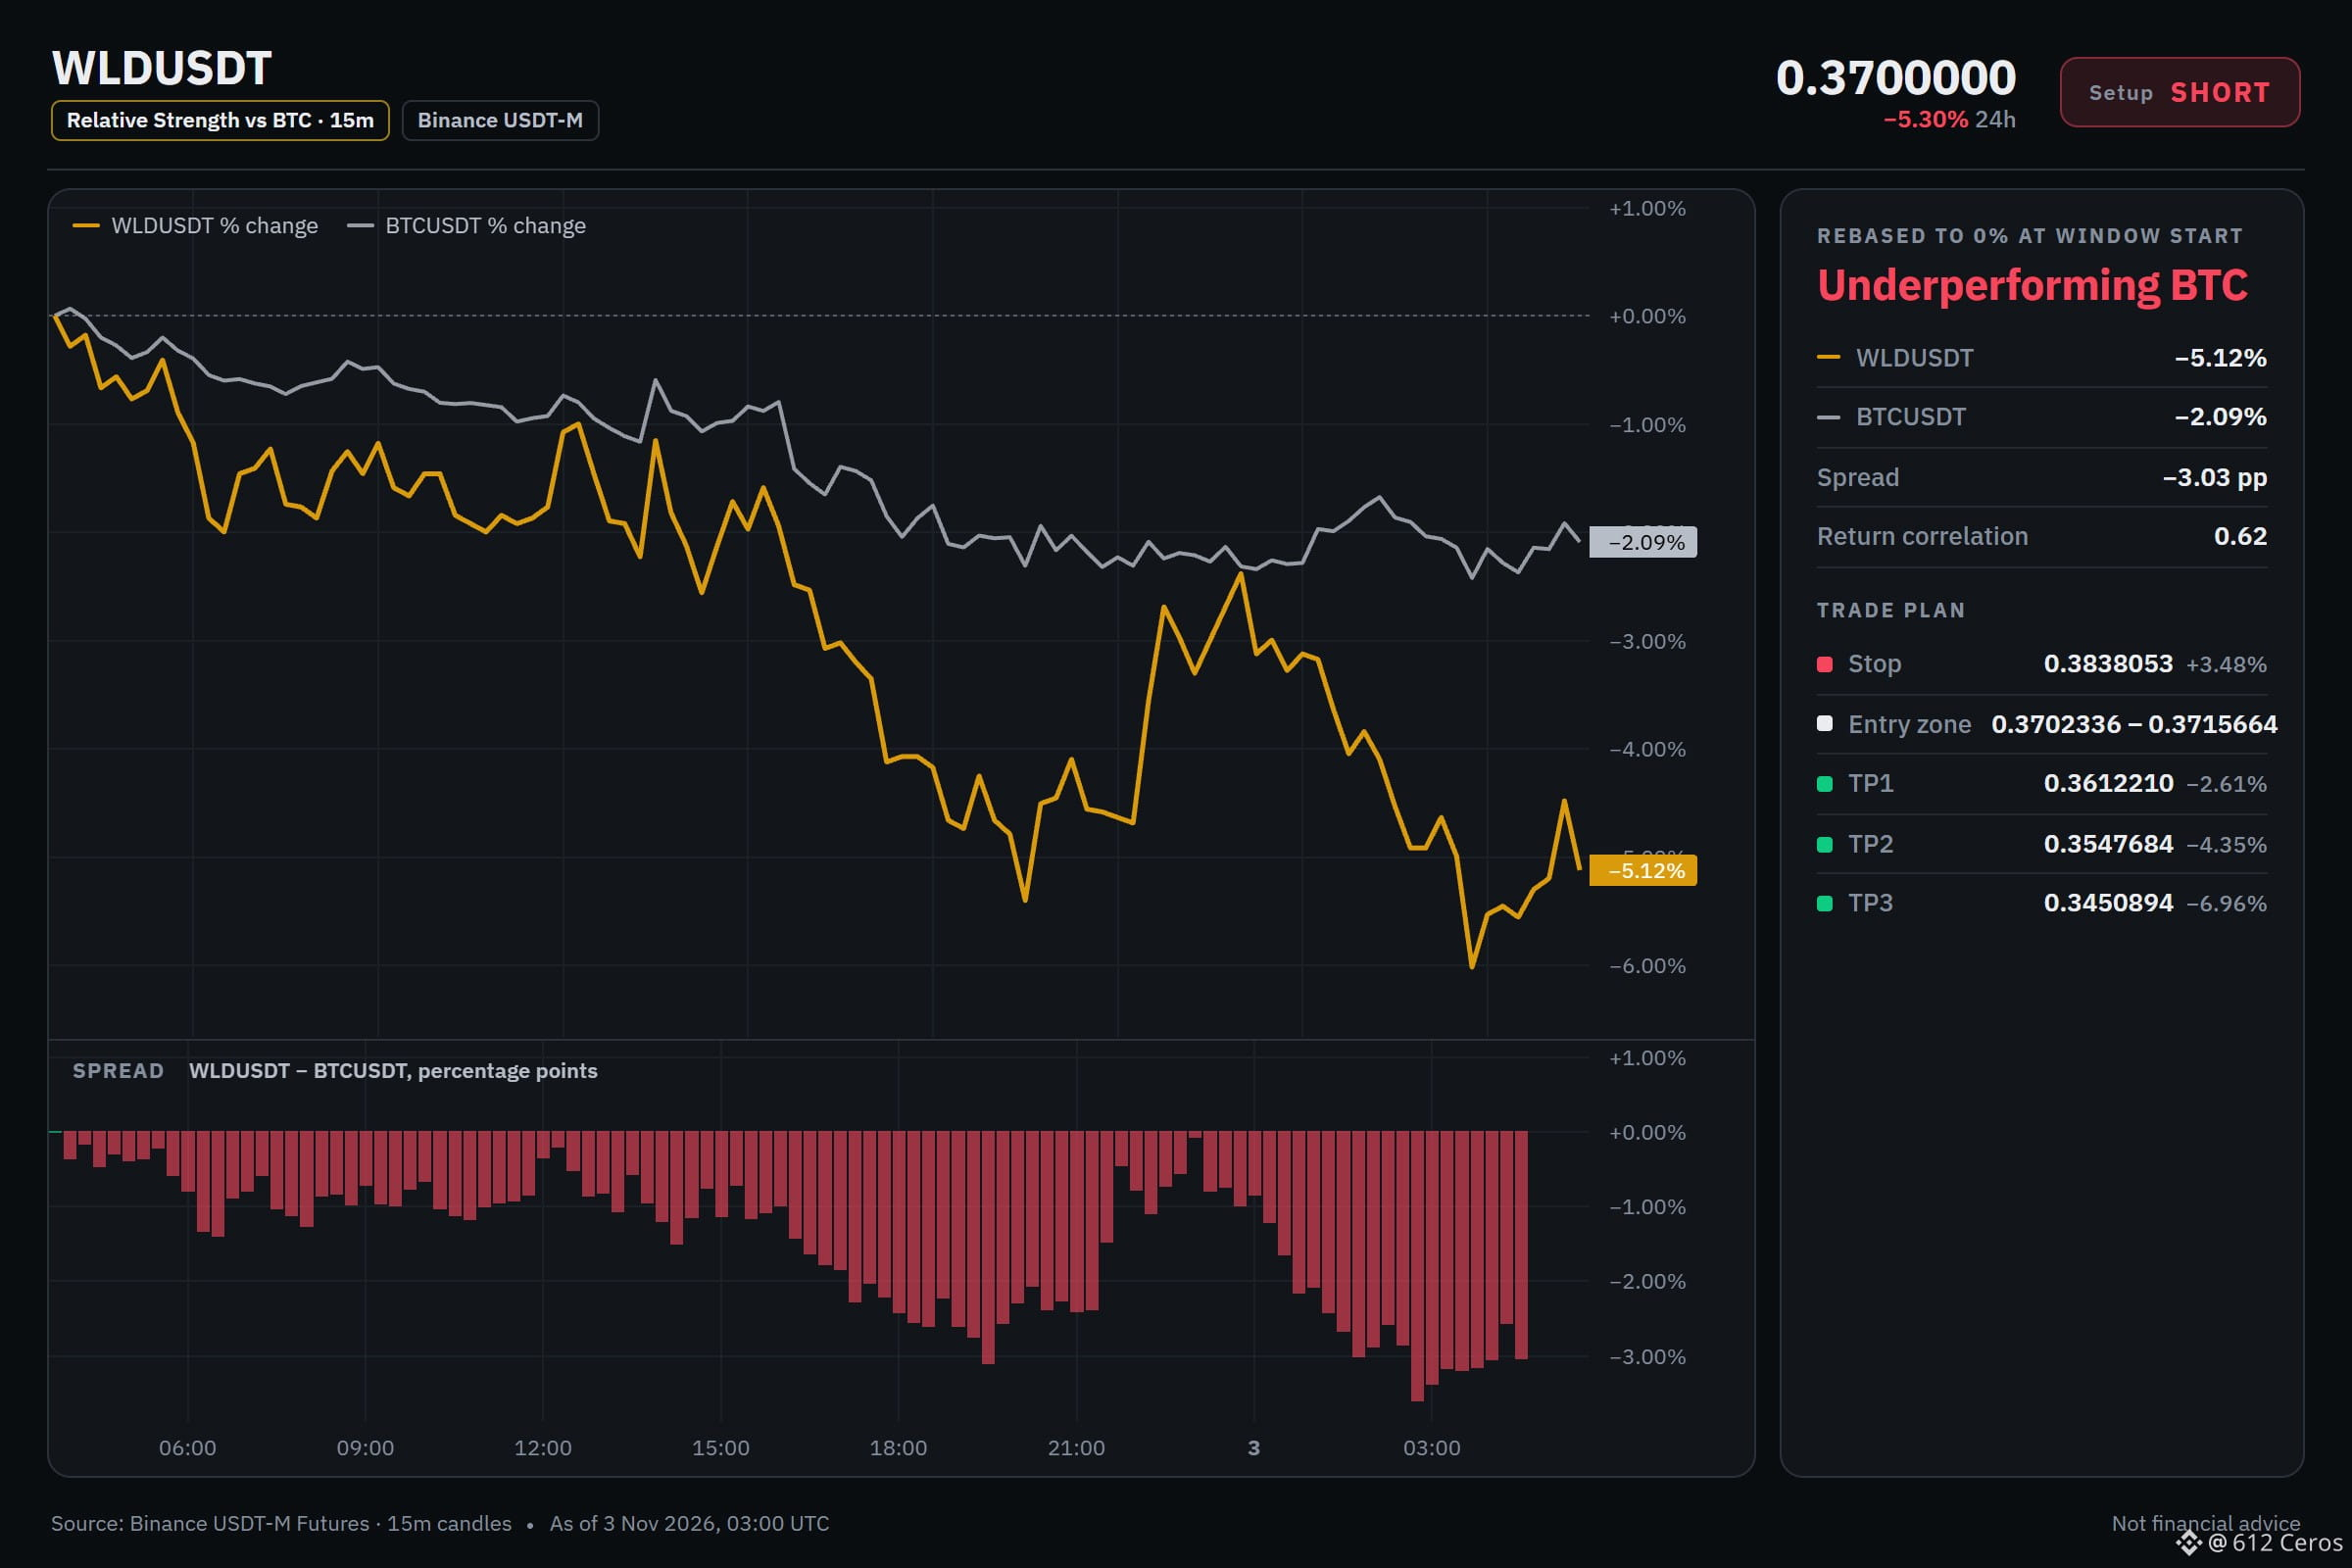
Bearish
WLD keeps sliding below stacked moving averages
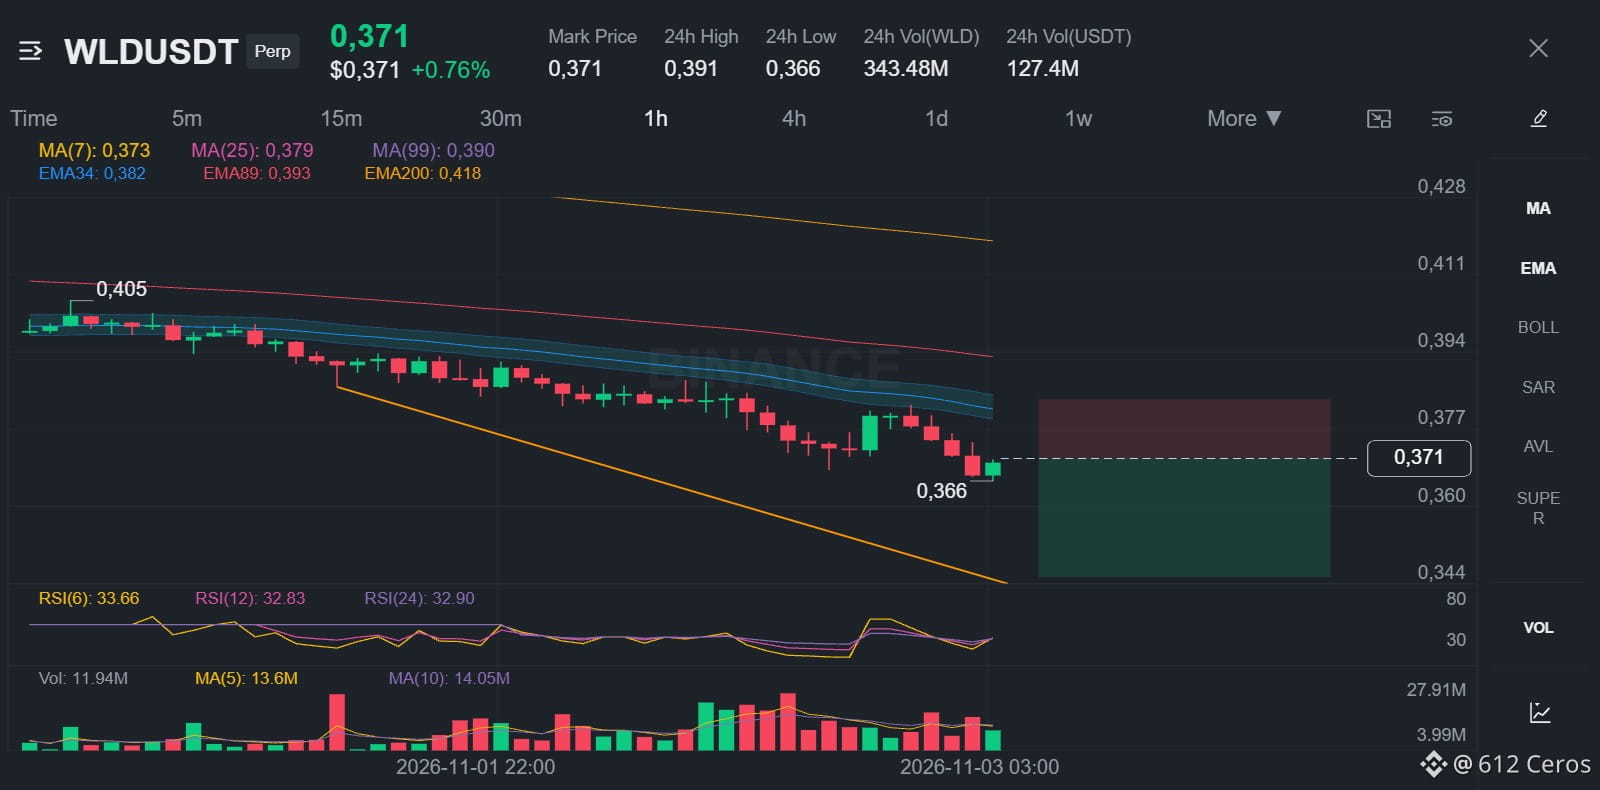
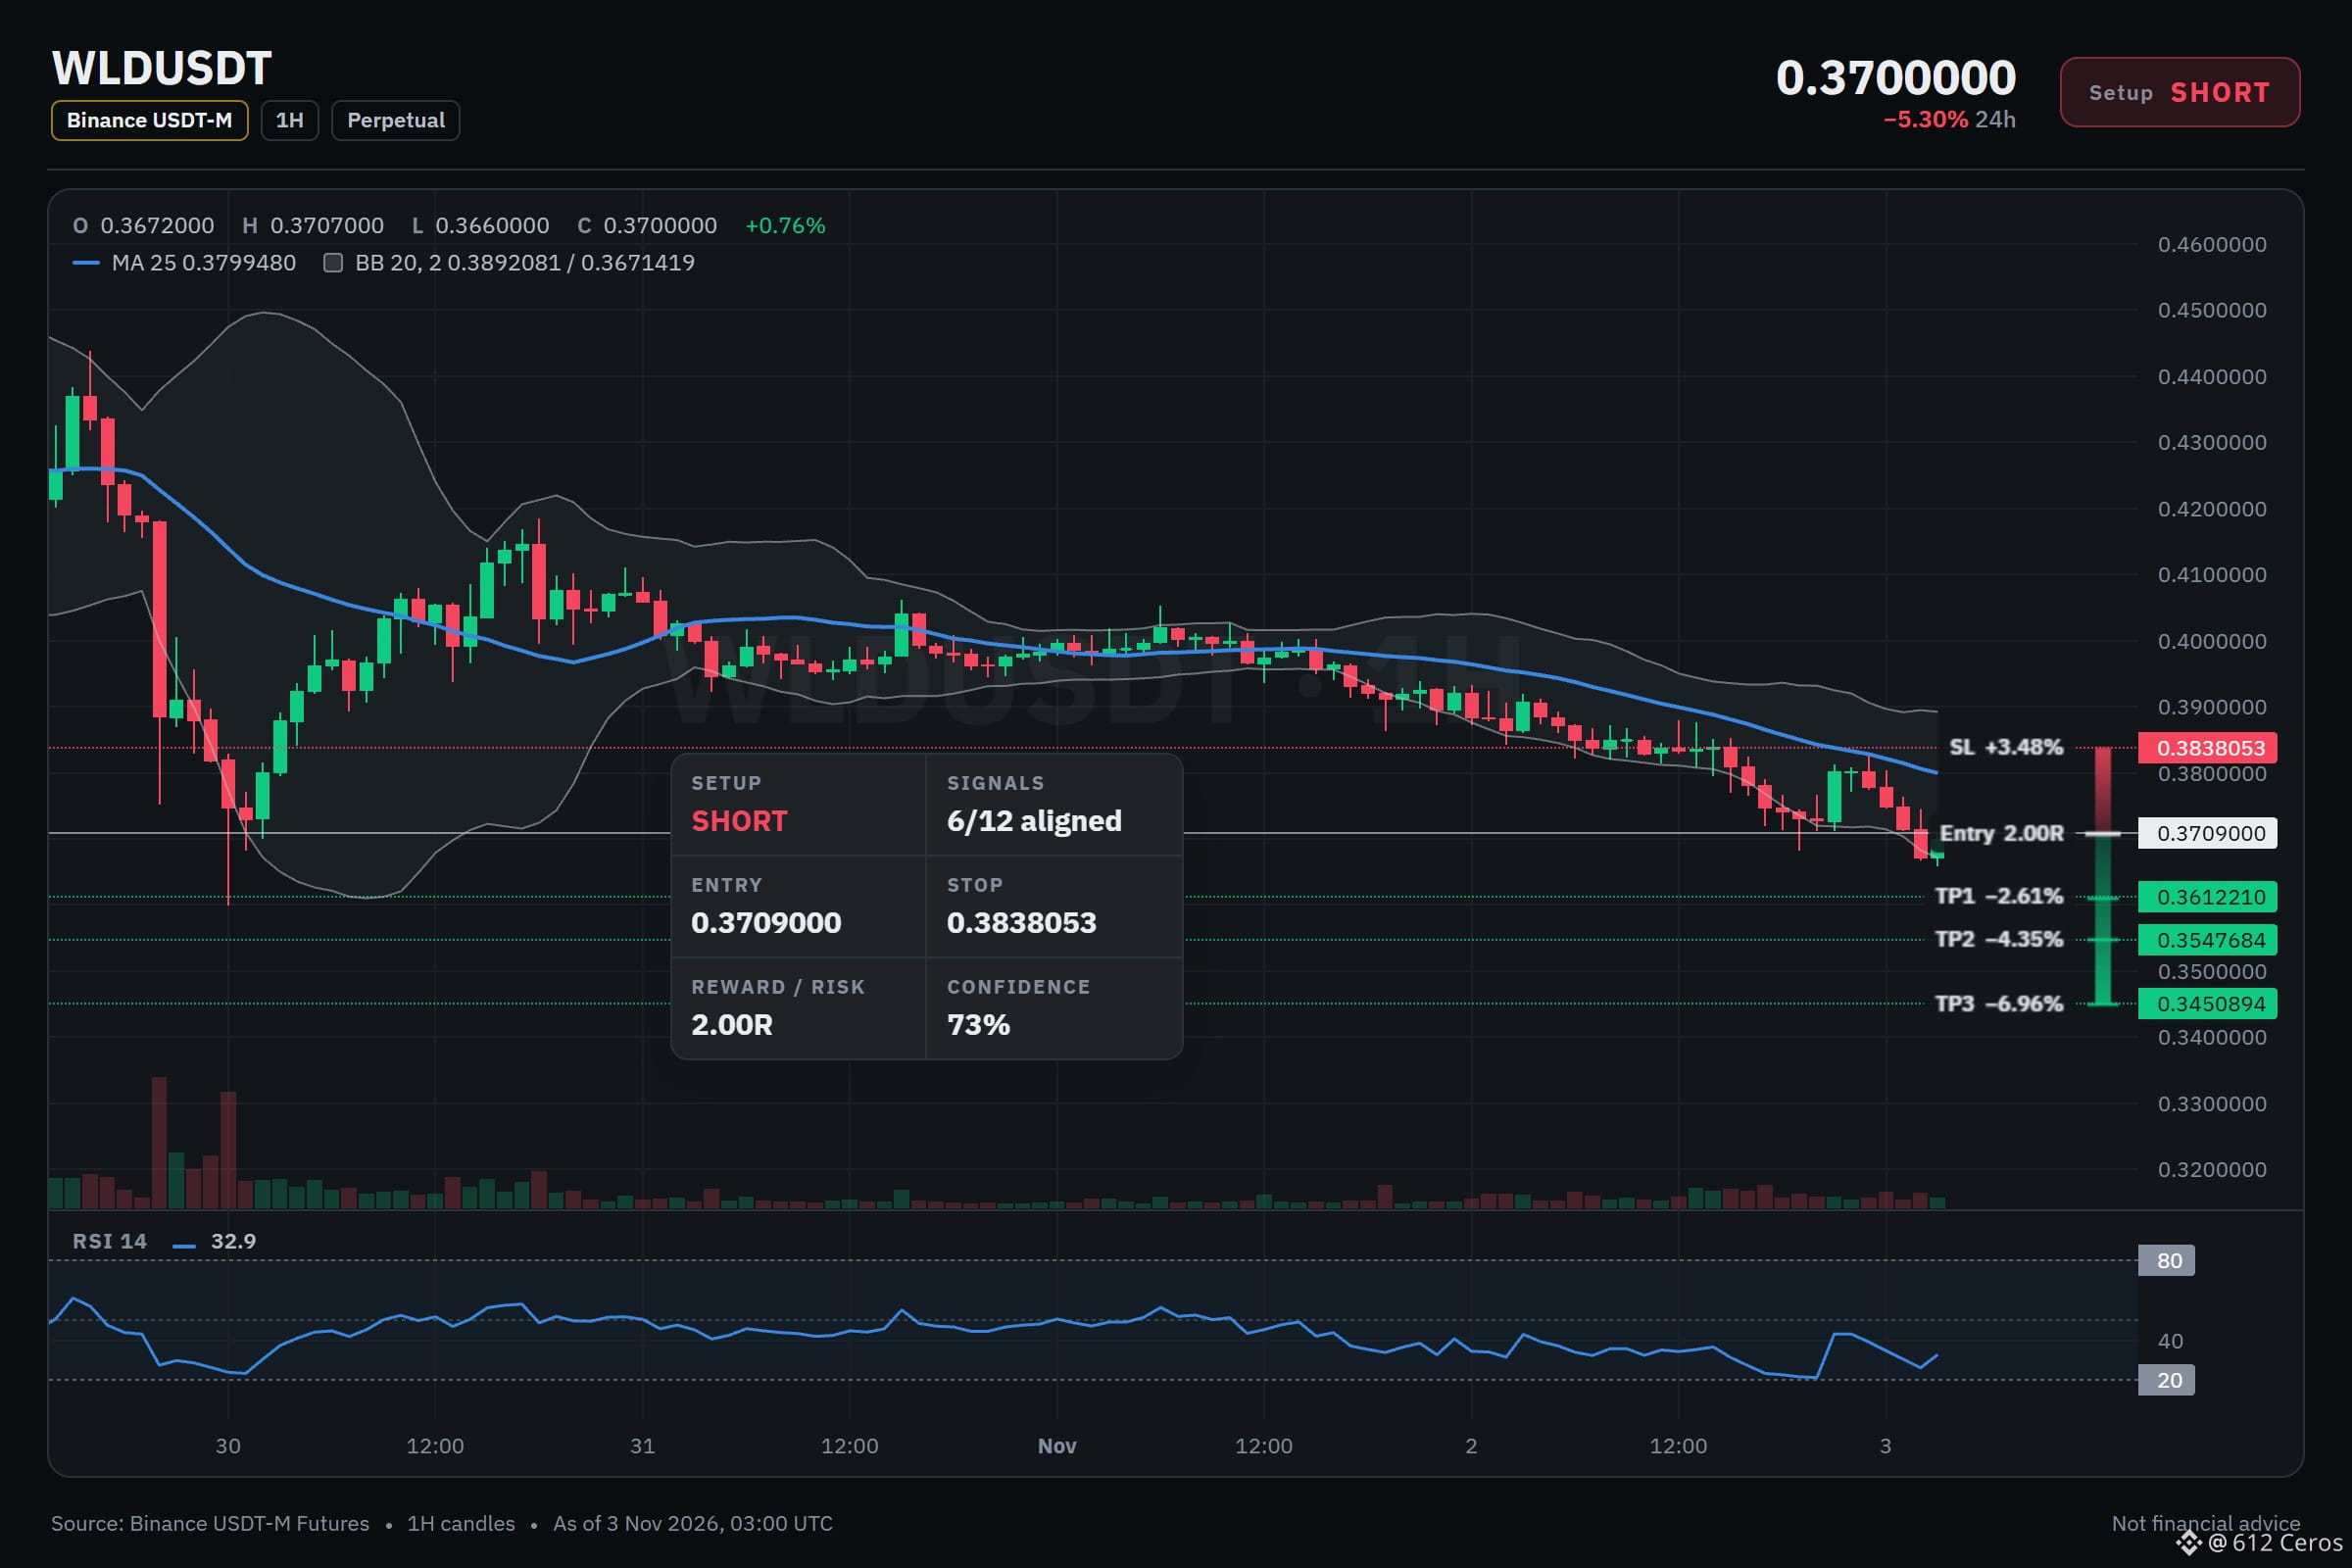
🔴 SHORT $WLD /USDT: expecting price to go DOWN
Bias: SHORT · Strong
Entry: 0.3702336 – 0.3715664
TP1: 0.3612210 (-2.6%)
TP2: 0.3547684 (-4.3%)
TP3: 0.3450894 (-7.0%)
SL: 0.3838053 (+3.5%)
Plan: enter only inside the zone, close 50% at TP1, 25% at TP2, 25% at TP3, and move the stop to entry after TP1.
Why SHORT? 6/12 signals agree, 0 against.
• 4h trend down (below EMA50 & EMA200)
• 1h trend down (below EMA50 & EMA200)
• Sellers are driving the move (15m ADX 23.3)
Quick WLD read:
1. the 1h price sits below EMA50 and EMA200, bearish stack, trend is down
2. 1h RSI at 32.9 shows bearish momentum, sellers are in control
3. the daily trend is range, so a break above EMA50 would make this idea wrong
What level would you place your stop at?
Chart with every level below.
{future}(WLDUSDT)
📲 Want more of my latest signals? Join me here:
[https://app.binance.com/uni-qr/D26WbL9t](https://app.binance.com/uni-qr/D26WbL9t)
⚠️ Personal market analysis only. NFA — manage risk and DYOR.
Educational content, not investment advice or a recommendation to buy, sell, deposit, or withdraw any asset. No paid promotion or referral/affiliate links.
WLD keeps sliding below stacked moving averages
🔴 SHORT $WLD /USDT: expecting price to go DOWN
Bias: SHORT · Strong
Entry: 0.3702336 – 0.3715664
TP1: 0.3612210 (-2.6%)
TP2: 0.3547684 (-4.3%)
TP3: 0.3450894 (-7.0%)
SL: 0.3838053 (+3.5%)
Plan: enter only inside the zone, close 50% at TP1, 25% at TP2, 25% at TP3, and move the stop to entry after TP1.
Why SHORT? 6/12 signals agree, 0 against.
• 4h trend down (below EMA50 & EMA200)
• 1h trend down (below EMA50 & EMA200)
• Sellers are driving the move (15m ADX 23.3)
Quick WLD read:
1. the 1h price sits below EMA50 and EMA200, bearish stack, trend is down
2. 1h RSI at 32.9 shows bearish momentum, sellers are in control
3. the daily trend is range, so a break above EMA50 would make this idea wrong
What level would you place your stop at?
Chart with every level below.
📲 Want more of my latest signals? Join me here:
https://app.binance.com/uni-qr/D26WbL9t
⚠️ Personal market analysis only. NFA — manage risk and DYOR.
Educational content, not investment advice or a recommendation to buy, sell, deposit, or withdraw any asset. No paid promotion or referral/affiliate links.
🔴 SHORT $WLD /USDT: expecting price to go DOWN
Bias: SHORT · Strong
Entry: 0.3702336 – 0.3715664
TP1: 0.3612210 (-2.6%)
TP2: 0.3547684 (-4.3%)
TP3: 0.3450894 (-7.0%)
SL: 0.3838053 (+3.5%)
Plan: enter only inside the zone, close 50% at TP1, 25% at TP2, 25% at TP3, and move the stop to entry after TP1.
Why SHORT? 6/12 signals agree, 0 against.
• 4h trend down (below EMA50 & EMA200)
• 1h trend down (below EMA50 & EMA200)
• Sellers are driving the move (15m ADX 23.3)
Quick WLD read:
1. the 1h price sits below EMA50 and EMA200, bearish stack, trend is down
2. 1h RSI at 32.9 shows bearish momentum, sellers are in control
3. the daily trend is range, so a break above EMA50 would make this idea wrong
What level would you place your stop at?
Chart with every level below.
📲 Want more of my latest signals? Join me here:
https://app.binance.com/uni-qr/D26WbL9t
⚠️ Personal market analysis only. NFA — manage risk and DYOR.
Educational content, not investment advice or a recommendation to buy, sell, deposit, or withdraw any asset. No paid promotion or referral/affiliate links.
4
571
·
--
Bearish
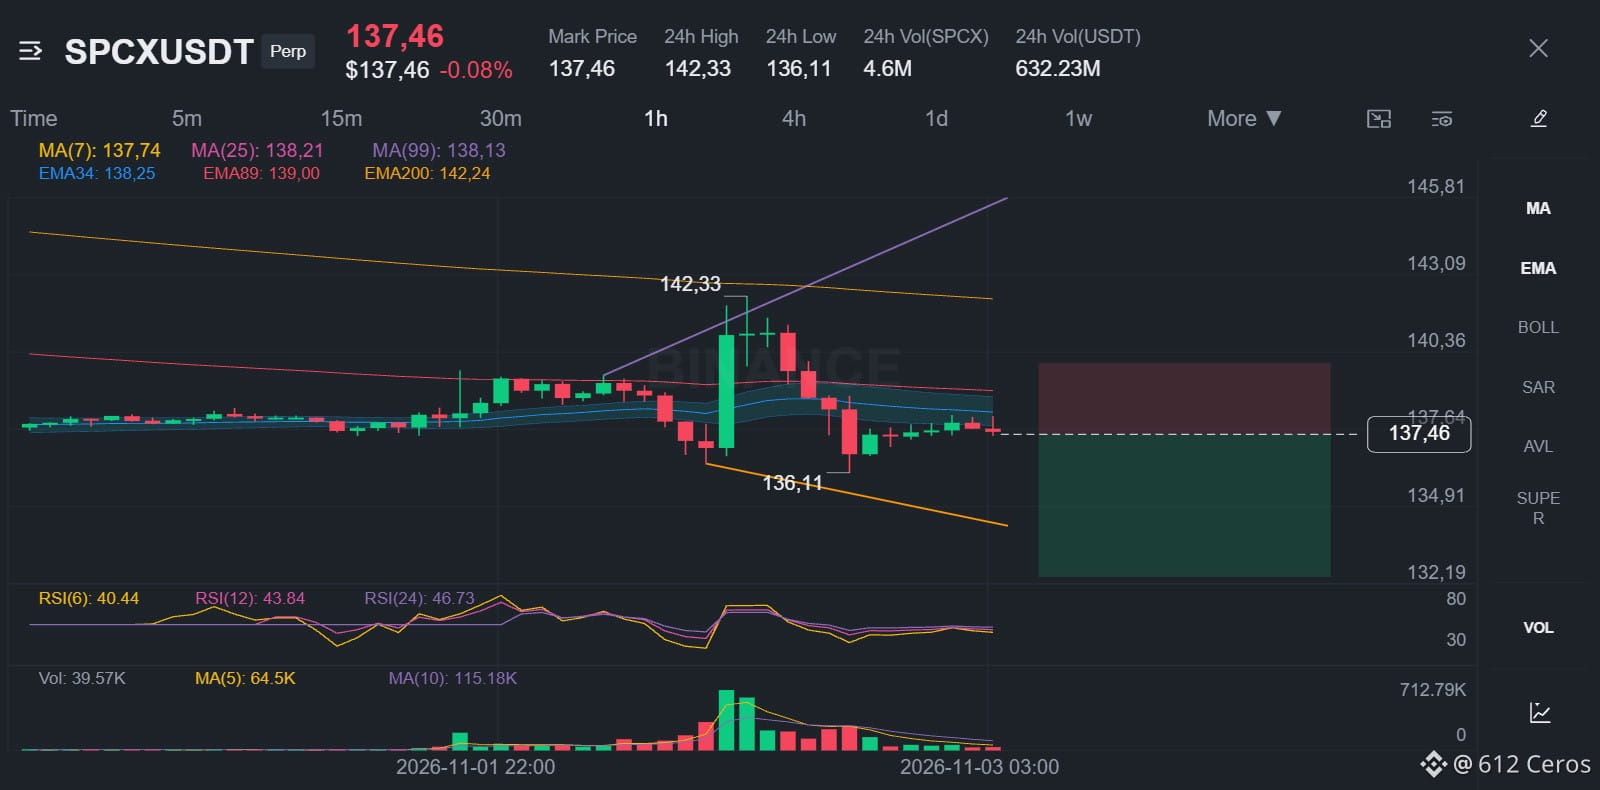
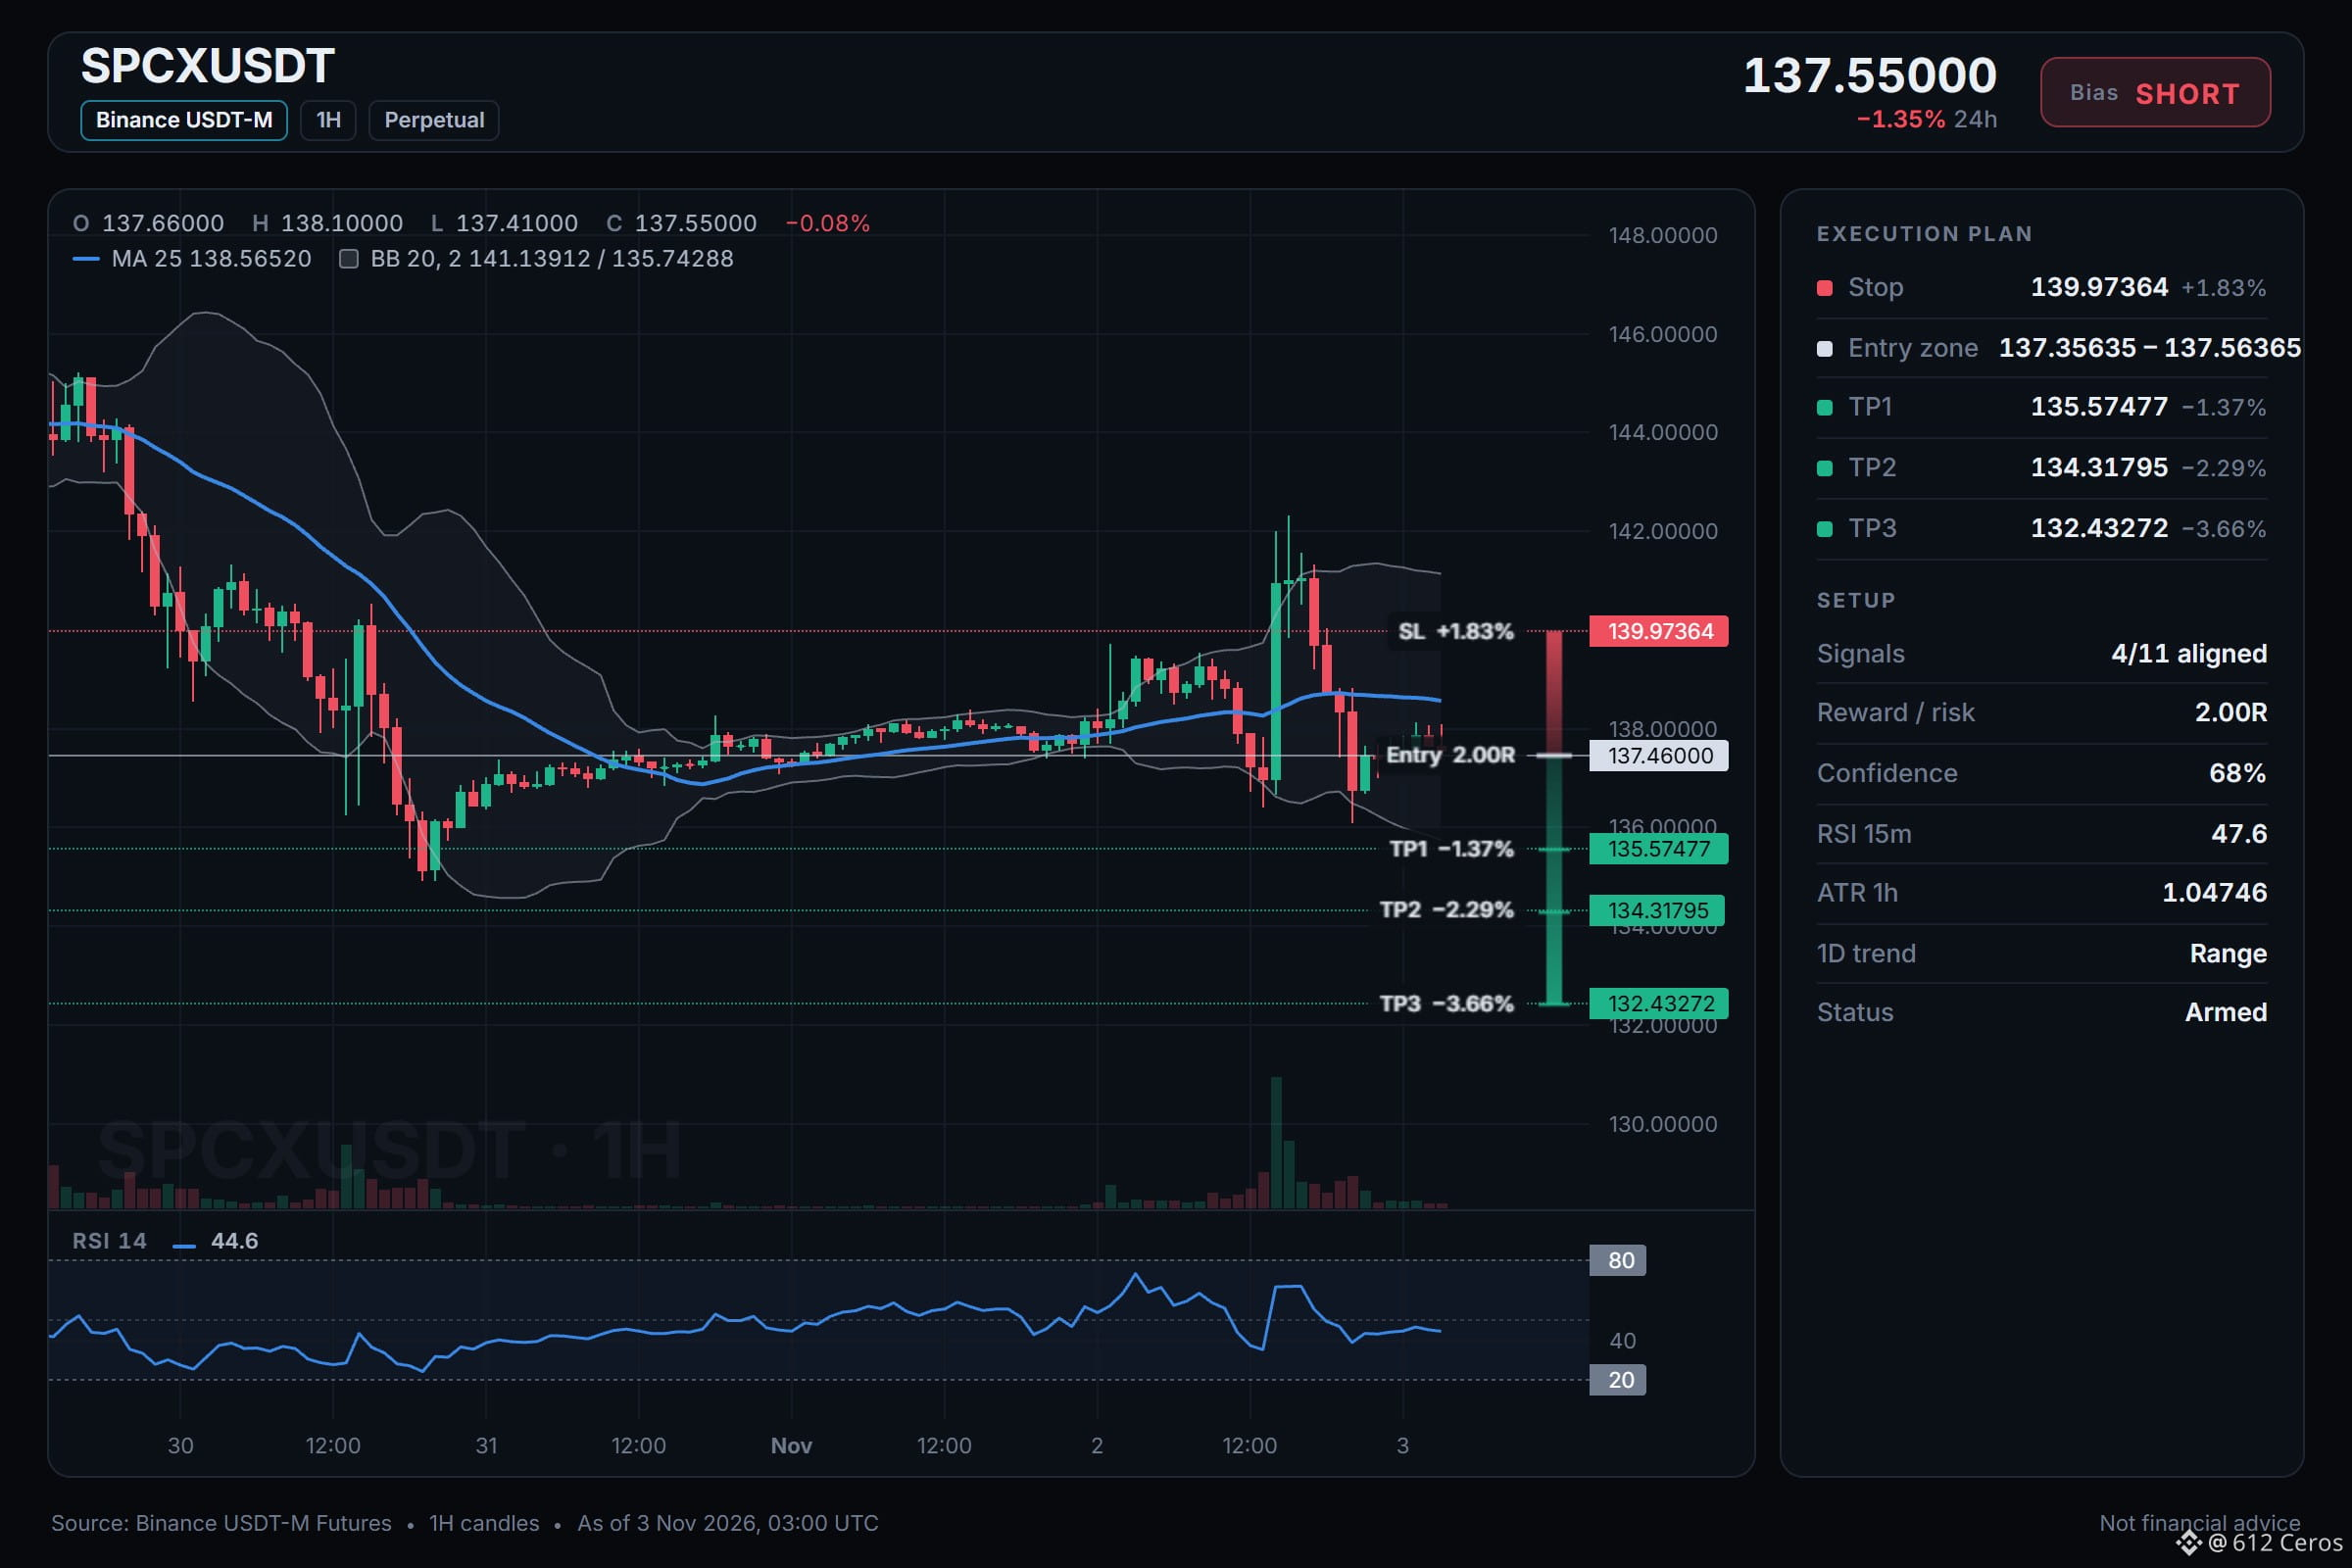
Range markets still let short setups work
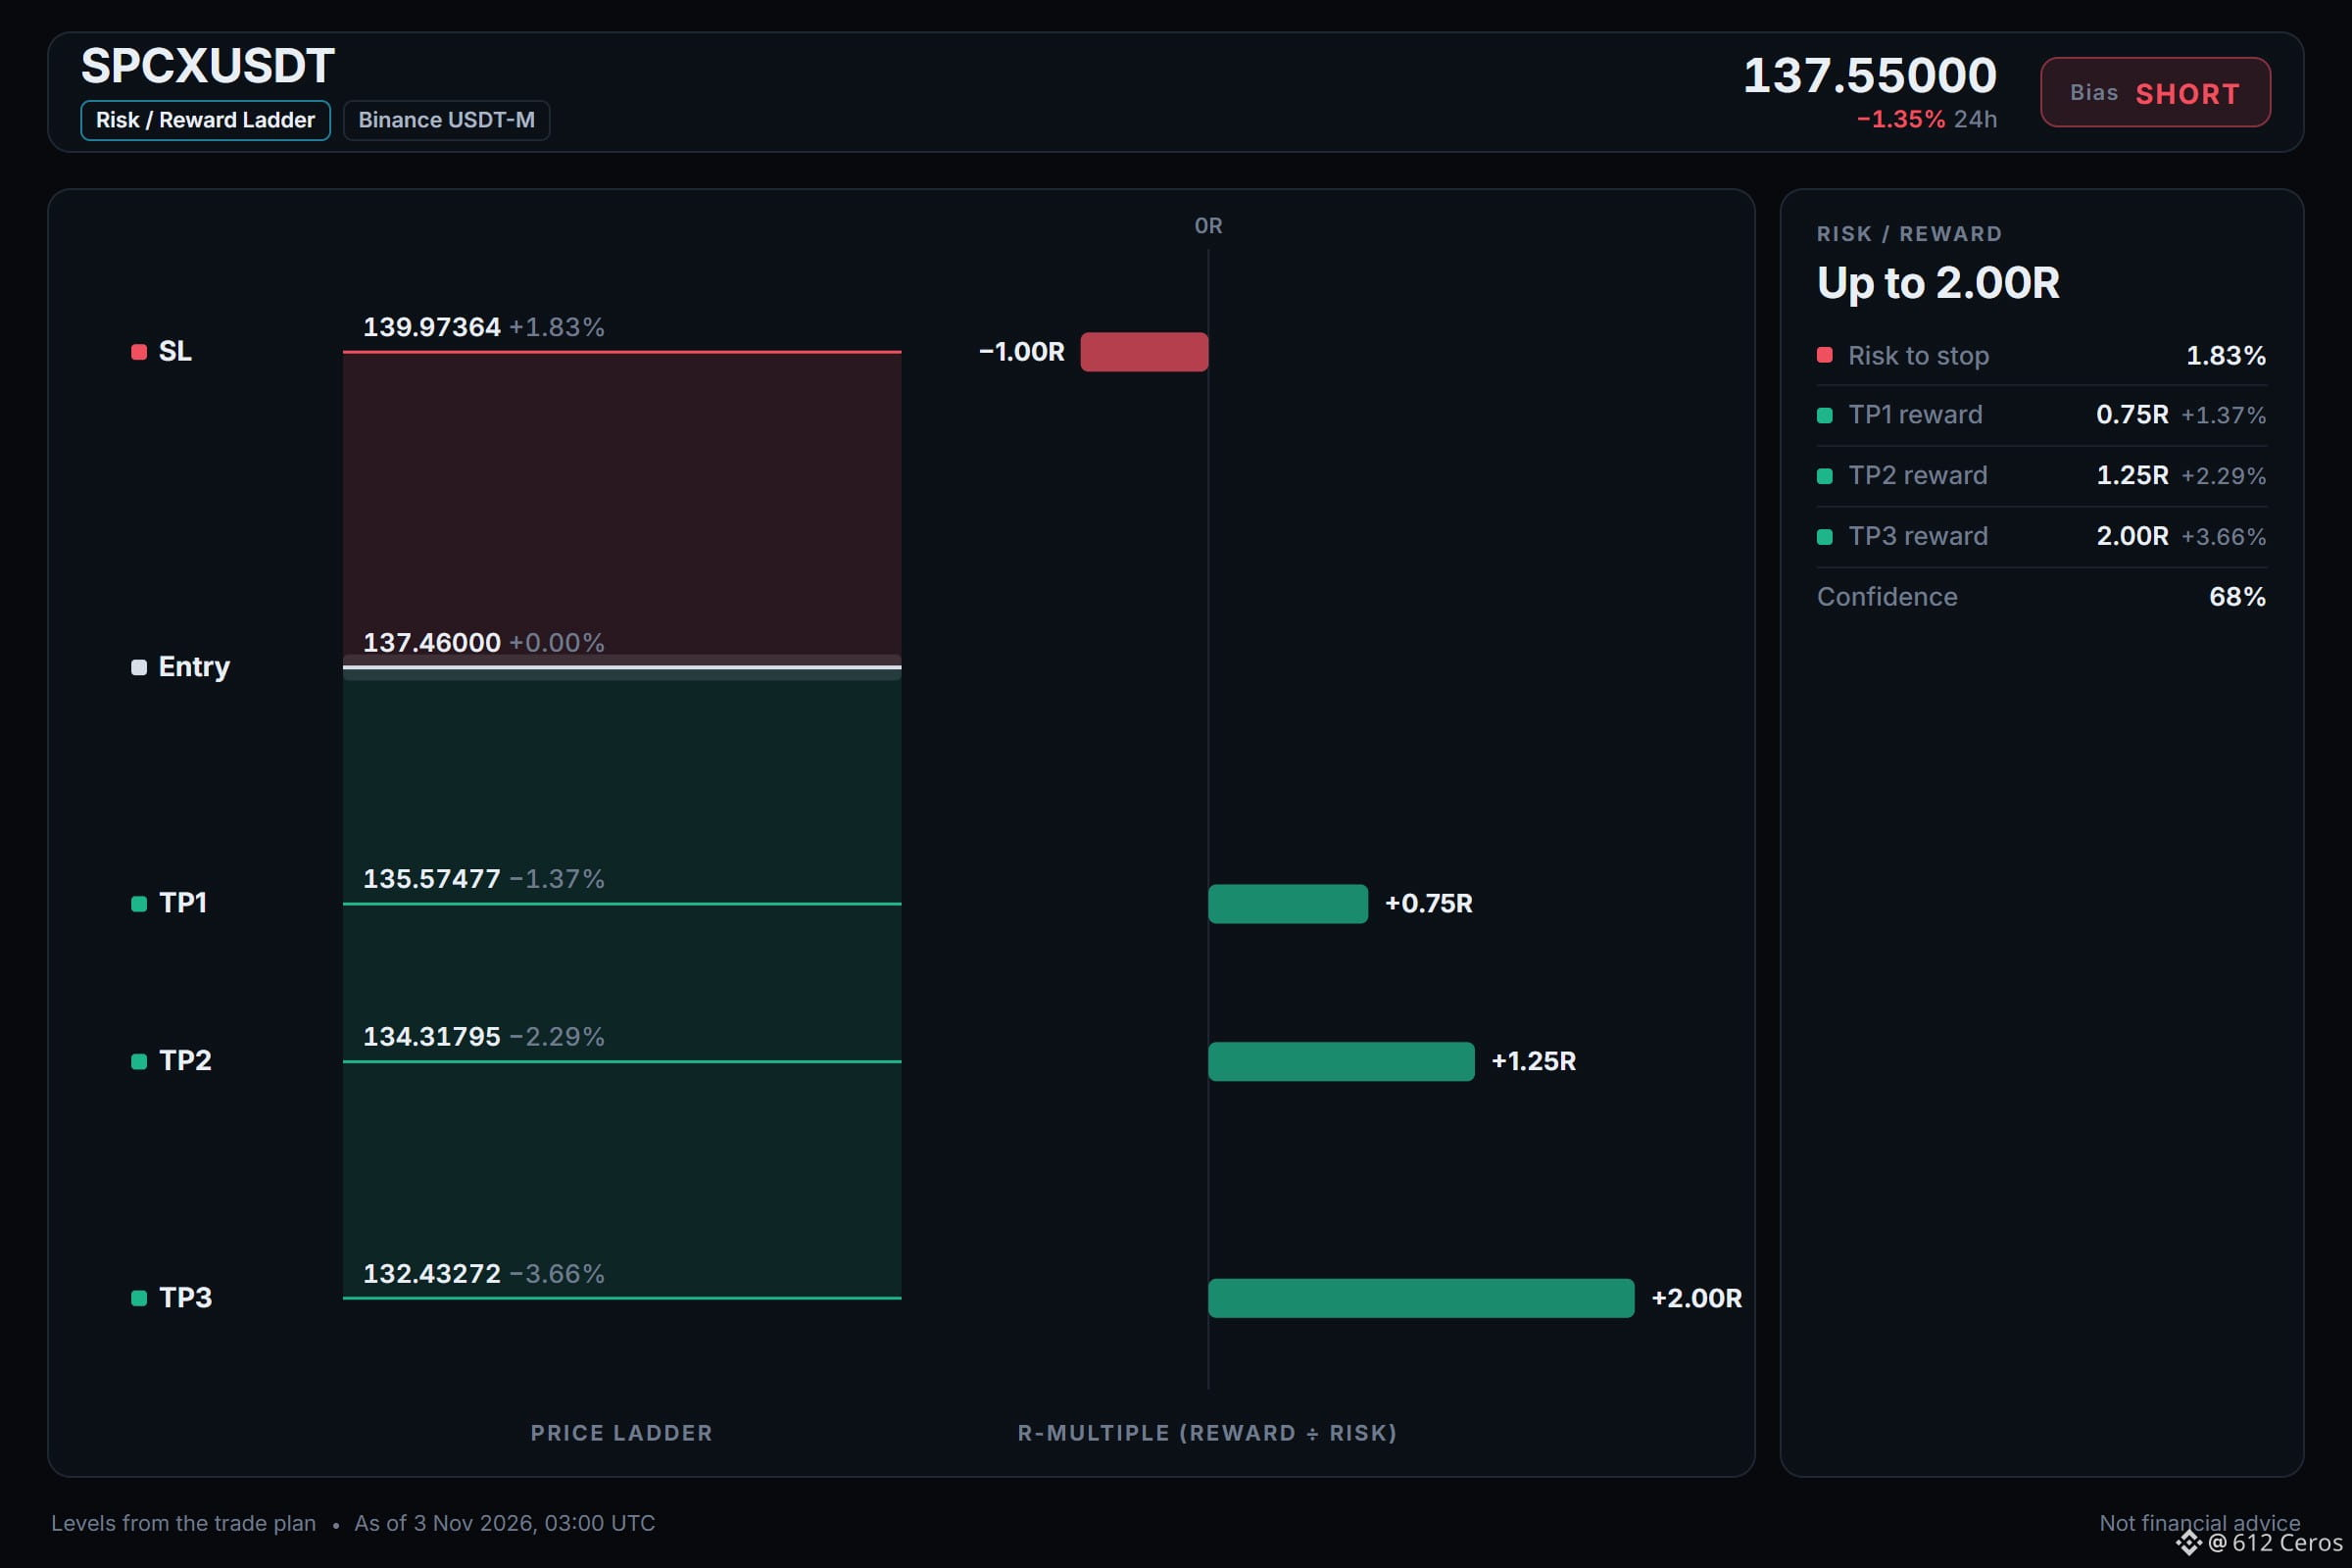
🔴 SHORT $SPCX /USDT: expecting price to go DOWN
Bias: SHORT · Leaning
Entry: 137.35635 – 137.56365
TP1: 135.57477 (-1.4%)
TP2: 134.31795 (-2.3%)
TP3: 132.43272 (-3.7%)
SL: 139.97364 (+1.8%)
Plan: enter only inside the zone, close 50% at TP1, 25% at TP2, 25% at TP3, and move the stop to entry after TP1.
Note: moderate conviction only, keep size light.
Why SHORT? 4/11 signals agree, 0 against.
• 4h trend down (below EMA50 & EMA200)
• 1h trend down (below EMA50 & EMA200)
• Sellers have the momentum (4h RSI 42.1)
Q: Why short when the daily trend is range?
A: The 4h trend is down with price below stacked averages.
Q: When is this direction wrong?
A: A 4h close above 139.97364 invalidates the setup.
Where do you set your level for this trade?
Full setup on the chart below.
{future}(SPCXUSDT)
📲 Want more of my latest signals? Join me here:
[https://app.binance.com/uni-qr/D26WbL9t](https://app.binance.com/uni-qr/D26WbL9t)
⚠️ Personal market analysis only. NFA — manage risk and DYOR.
Educational content, not investment advice or a recommendation to buy, sell, deposit, or withdraw any asset. No paid promotion or referral/affiliate links.
Range markets still let short setups work
🔴 SHORT $SPCX /USDT: expecting price to go DOWN
Bias: SHORT · Leaning
Entry: 137.35635 – 137.56365
TP1: 135.57477 (-1.4%)
TP2: 134.31795 (-2.3%)
TP3: 132.43272 (-3.7%)
SL: 139.97364 (+1.8%)
Plan: enter only inside the zone, close 50% at TP1, 25% at TP2, 25% at TP3, and move the stop to entry after TP1.
Note: moderate conviction only, keep size light.
Why SHORT? 4/11 signals agree, 0 against.
• 4h trend down (below EMA50 & EMA200)
• 1h trend down (below EMA50 & EMA200)
• Sellers have the momentum (4h RSI 42.1)
Q: Why short when the daily trend is range?
A: The 4h trend is down with price below stacked averages.
Q: When is this direction wrong?
A: A 4h close above 139.97364 invalidates the setup.
Where do you set your level for this trade?
Full setup on the chart below.
📲 Want more of my latest signals? Join me here:
https://app.binance.com/uni-qr/D26WbL9t
⚠️ Personal market analysis only. NFA — manage risk and DYOR.
Educational content, not investment advice or a recommendation to buy, sell, deposit, or withdraw any asset. No paid promotion or referral/affiliate links.
🔴 SHORT $SPCX /USDT: expecting price to go DOWN
Bias: SHORT · Leaning
Entry: 137.35635 – 137.56365
TP1: 135.57477 (-1.4%)
TP2: 134.31795 (-2.3%)
TP3: 132.43272 (-3.7%)
SL: 139.97364 (+1.8%)
Plan: enter only inside the zone, close 50% at TP1, 25% at TP2, 25% at TP3, and move the stop to entry after TP1.
Note: moderate conviction only, keep size light.
Why SHORT? 4/11 signals agree, 0 against.
• 4h trend down (below EMA50 & EMA200)
• 1h trend down (below EMA50 & EMA200)
• Sellers have the momentum (4h RSI 42.1)
Q: Why short when the daily trend is range?
A: The 4h trend is down with price below stacked averages.
Q: When is this direction wrong?
A: A 4h close above 139.97364 invalidates the setup.
Where do you set your level for this trade?
Full setup on the chart below.
📲 Want more of my latest signals? Join me here:
https://app.binance.com/uni-qr/D26WbL9t
⚠️ Personal market analysis only. NFA — manage risk and DYOR.
Educational content, not investment advice or a recommendation to buy, sell, deposit, or withdraw any asset. No paid promotion or referral/affiliate links.
384
Log in to explore more content
Join global crypto users on Binance Square
⚡️ Get latest and useful information about crypto.
💬 Trusted by the world’s largest crypto exchange.
👍 Discover real insights from verified creators.
Email / Phone number
Trending Topics
BinanceReopensWithdrawalsForMoreAssets
24,812 views
678 Discussing
Security Incident | Recovery Update #6: Withdrawals Reopen for More Assets (2026-11-03)
Binance Announcement
·168 Likes
·472.9k views
AppleReportsMixedResults
16,776 views
501 Discussing
BinanceHourlyDepositsExceedWithdrawals
4,693 views
170 Discussing