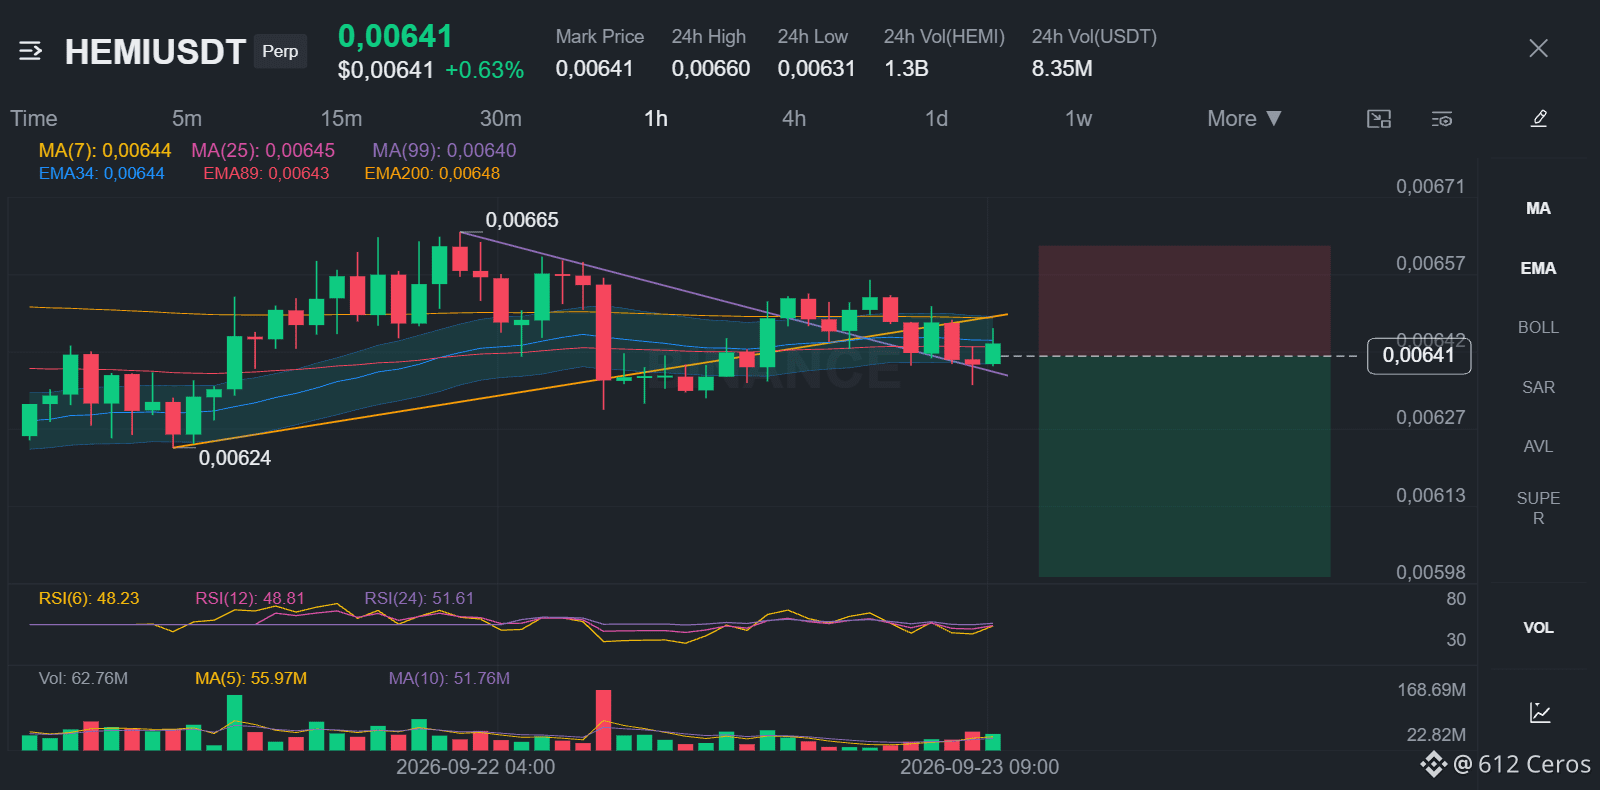
HEMI keeps sliding below its daily moving averages.
📊 $HEMI /USDT · Bias: SHORT (Leaning) · 4/12 signals aligned
⚠️ Leaning only: 8 of 12 signals are still undecided. Keep size light.
What I checked: 4/12 signals aligned
✔️ Daily trend: price < EMA50 < EMA200, bearish stack
✔️ 4h trend: price < EMA50 < EMA200, bearish stack
✔️ 1h trend: price < EMA50 < EMA200, bearish stack
✔️ Trend strength (ADX/DI, 15m): ADX 22.0 with sellers in control (DI+ 14.1 vs DI− 27.7)
👀 Invalidation: the idea is wrong beyond 0.0067155
Bottom line: The setup leans short with 4 of 12 signals aligned. The strongest supports are the bearish daily stack (price below EMA50 and EMA200) and the bearish 1h stack (same structure), plus a 15m ADX of 22.0 with sellers controlling (DI- 27.7 vs DI+ 14.1). The main against factor is that BTC correlation sits at a neutral 0.25, which limits external drive. Conviction is moderate because some factors still disagree.
Level map:
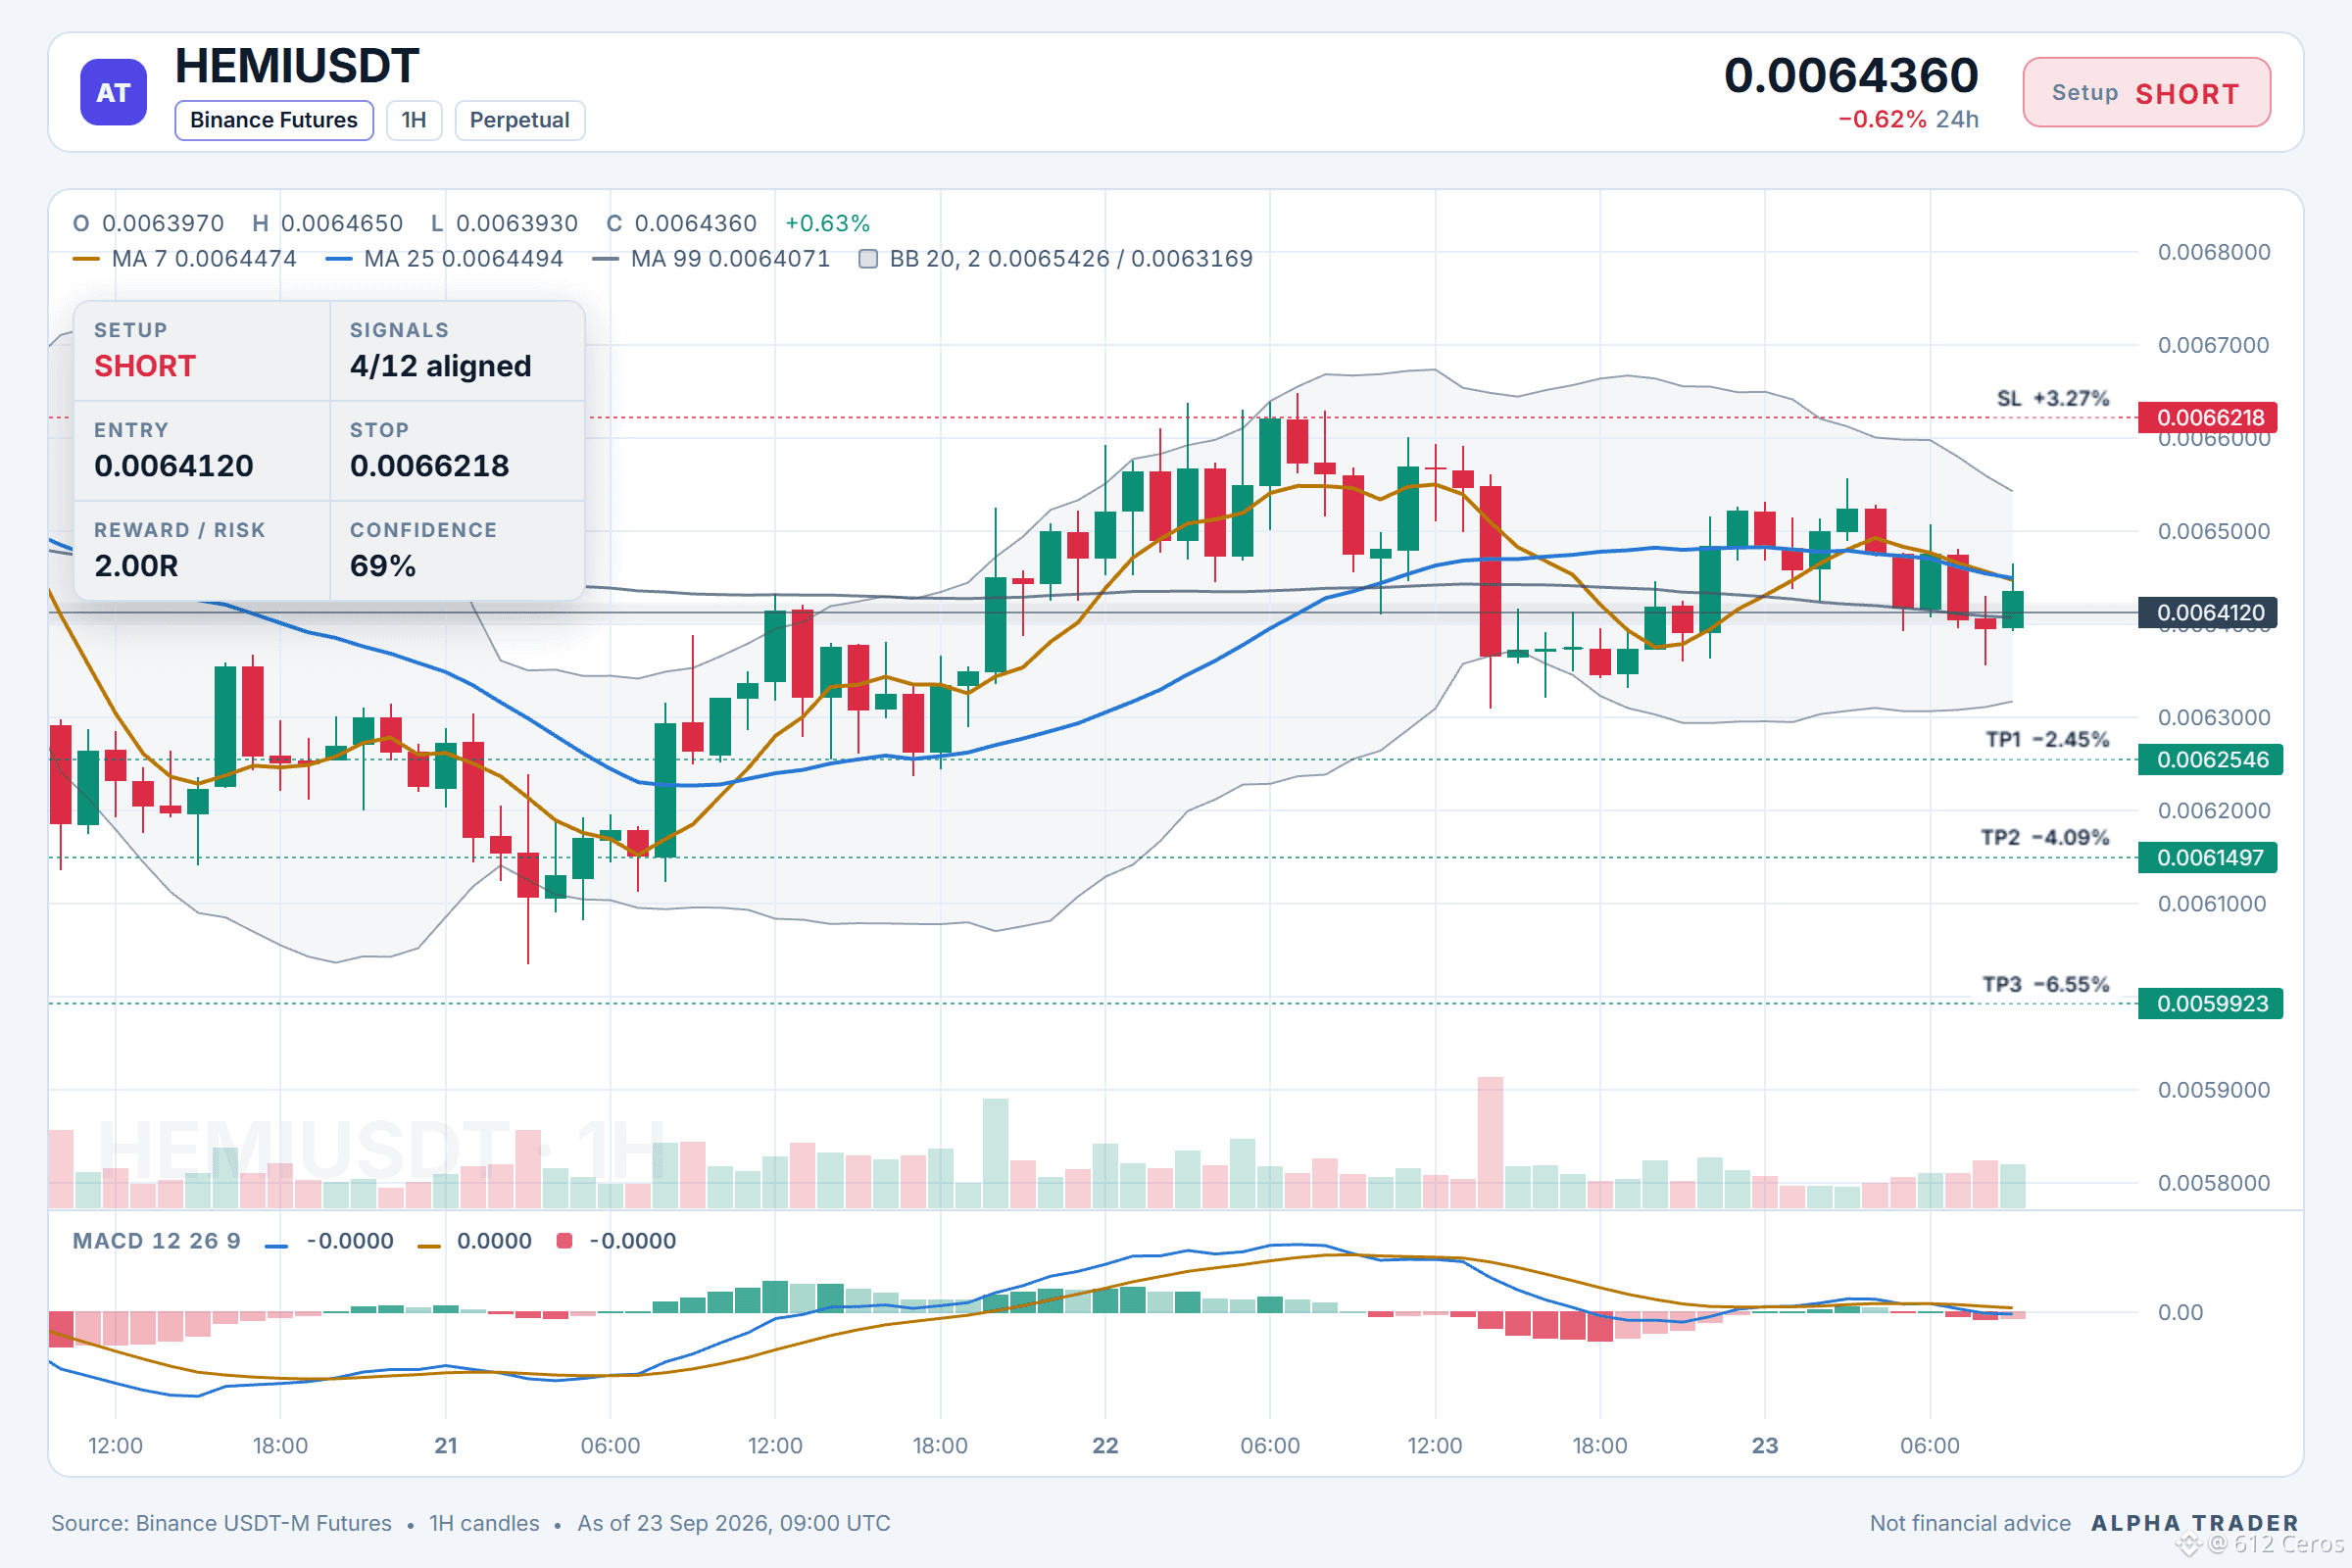
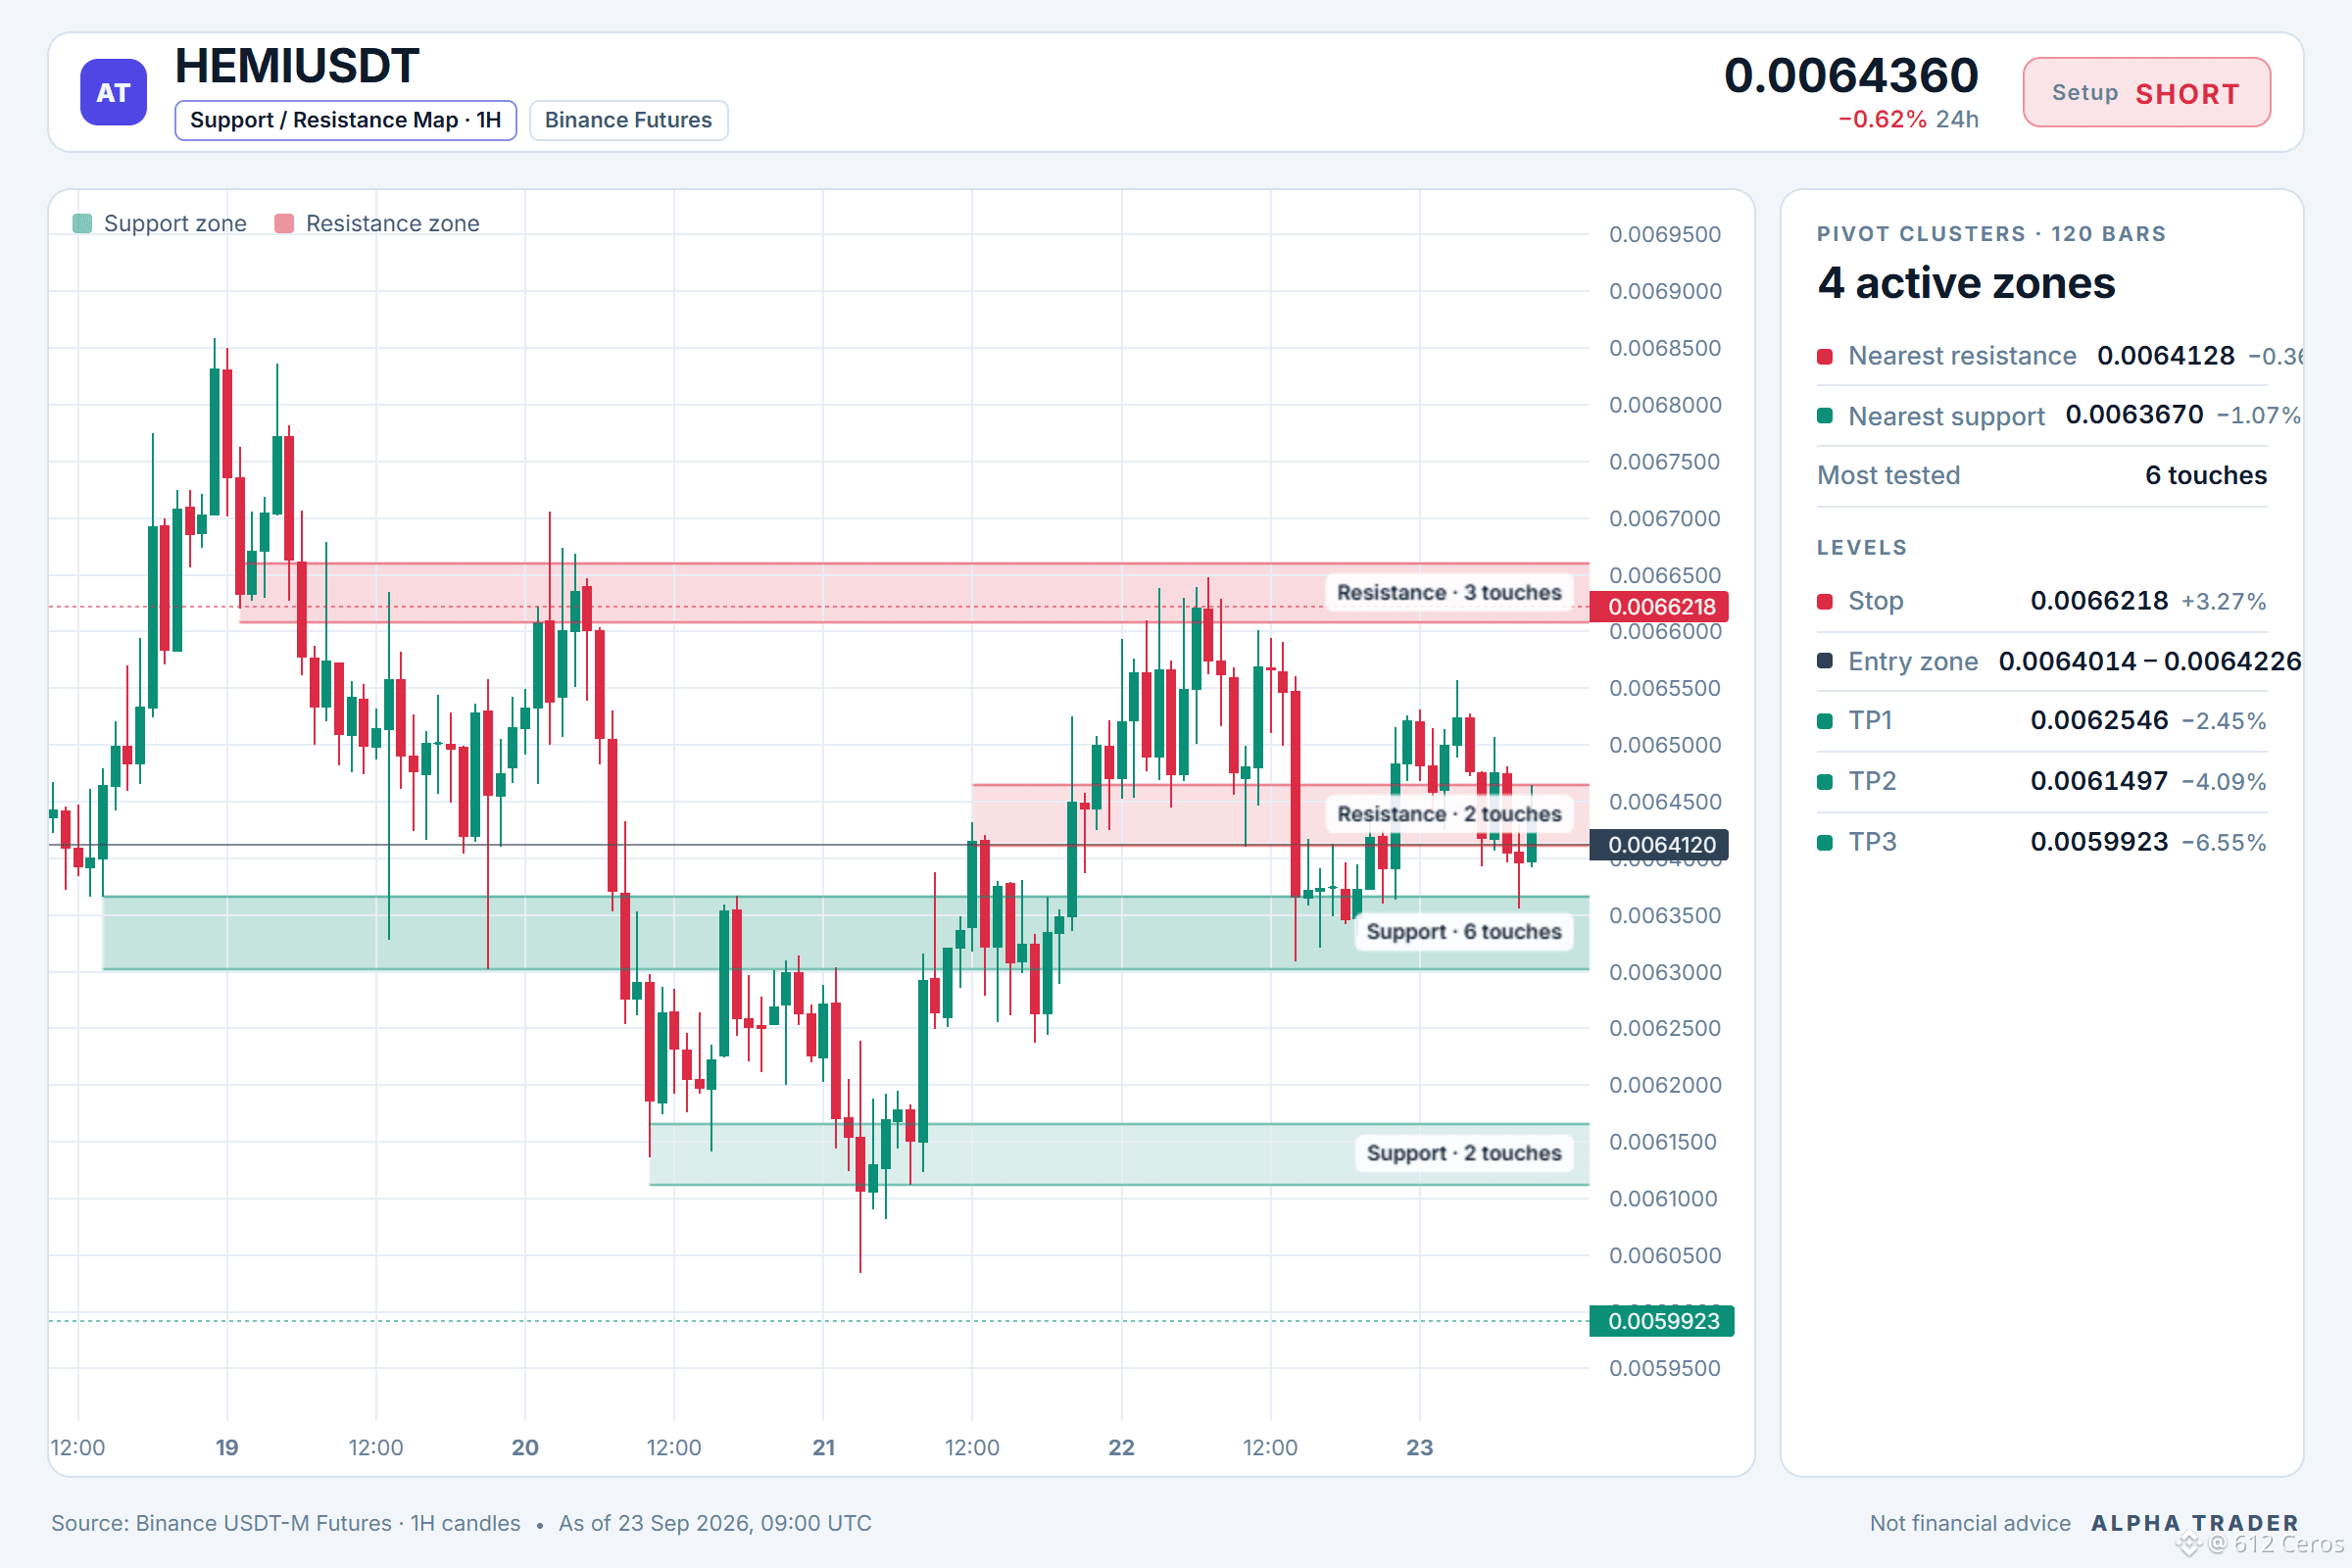
🛑 SL: 0.0066218
📍 Entry: 0.0064014 – 0.0064226
🎯 TP1: 0.0062546
🎯 TP2: 0.0061497
🎯 TP3: 0.0059923
Your call:
Where do you place your HEMI short stop if the 1h price pushes above 0.0064226?
Chart with every level 👇
⚠️ Personal market analysis only. NFA — manage risk and DYOR.
Educational content, not investment advice or a recommendation to buy, sell, deposit, or withdraw any asset. No paid promotion or referral/affiliate links.
📊 $HEMI /USDT · Bias: SHORT (Leaning) · 4/12 signals aligned
⚠️ Leaning only: 8 of 12 signals are still undecided. Keep size light.
What I checked: 4/12 signals aligned
✔️ Daily trend: price < EMA50 < EMA200, bearish stack
✔️ 4h trend: price < EMA50 < EMA200, bearish stack
✔️ 1h trend: price < EMA50 < EMA200, bearish stack
✔️ Trend strength (ADX/DI, 15m): ADX 22.0 with sellers in control (DI+ 14.1 vs DI− 27.7)
👀 Invalidation: the idea is wrong beyond 0.0067155
Bottom line: The setup leans short with 4 of 12 signals aligned. The strongest supports are the bearish daily stack (price below EMA50 and EMA200) and the bearish 1h stack (same structure), plus a 15m ADX of 22.0 with sellers controlling (DI- 27.7 vs DI+ 14.1). The main against factor is that BTC correlation sits at a neutral 0.25, which limits external drive. Conviction is moderate because some factors still disagree.
Level map:
🛑 SL: 0.0066218
📍 Entry: 0.0064014 – 0.0064226
🎯 TP1: 0.0062546
🎯 TP2: 0.0061497
🎯 TP3: 0.0059923
Your call:
Where do you place your HEMI short stop if the 1h price pushes above 0.0064226?
Chart with every level 👇
⚠️ Personal market analysis only. NFA — manage risk and DYOR.
Educational content, not investment advice or a recommendation to buy, sell, deposit, or withdraw any asset. No paid promotion or referral/affiliate links.