
玖玖说Web3
589 Posts
 LIVE
LIVE玖玖说Web3
6年在圈子的经验,公众号:比特雷达。取每日CF资讯
8 Following
1.8K+ Followers
229 Liked
Posts
All
Live
See translation
🚨 OKX突然发出重要提醒!
部分高风险存款,最长可能审查15天!
群组:点击进入玖玖的粉丝群
很多人看到“15天审核”可能第一反应就是:OKX是不是开始大规模冻结资金了?其实并不是。OKX这次针对的是部分被系统标记为“高风险”的存款,并不代表所有充值都会进入审核,更不是全平台账户冻结。
如果一笔存款触发强化合规审查,资金可能需要等待最长15天才能完成处理。
为什么会这样?
核心还是风险控制。
交易所需要对部分资金来源进行进一步核查,以满足反洗钱、客户身份识别等合规要求。需要注意的是,OKX目前并没有公开具体哪些交易一定会被标记为高风险。
所以,网上如果有人直接告诉你“某种转账必定被审核”,都需要谨慎看待。真正值得普通用户注意的是:过去大家习惯了链上转账几分钟甚至几秒到账,但进入交易平台后,资金并不一定能够立即使用。
一旦触发强化审核,时间成本可能突然增加。
这对于需要及时使用资金的人来说,影响尤其明显。
所以如果你发现自己的存款进入审核状态,先不要恐慌,也不要反复操作。最重要的是查看账户状态、平台通知以及后续处理要求。
这件事背后其实还有一个更大的变化:
加密资产正在越来越深地进入合规体系。
过去大家更关注“转账快不快”,现在平台越来越关注“这笔资金从哪里来、经过哪里、是否存在风险”。
所以以后做链上转账,除了看手续费和速度,也要开始考虑合规与资金到账时间。
👀 是否触发审核
👀 审核需要多久
👀 平台是否要求补充资料
15天并不意味着所有人都会等15天,但它提醒了市场:加密资产转移并不等于资金能够即时使用。
点击头像观看直播 + 加入玖玖聊天群获取每日策略🚀
#OKX #加密资产 #Web3
部分高风险存款,最长可能审查15天!
群组:点击进入玖玖的粉丝群
很多人看到“15天审核”可能第一反应就是:OKX是不是开始大规模冻结资金了?其实并不是。OKX这次针对的是部分被系统标记为“高风险”的存款,并不代表所有充值都会进入审核,更不是全平台账户冻结。
如果一笔存款触发强化合规审查,资金可能需要等待最长15天才能完成处理。
为什么会这样?
核心还是风险控制。
交易所需要对部分资金来源进行进一步核查,以满足反洗钱、客户身份识别等合规要求。需要注意的是,OKX目前并没有公开具体哪些交易一定会被标记为高风险。
所以,网上如果有人直接告诉你“某种转账必定被审核”,都需要谨慎看待。真正值得普通用户注意的是:过去大家习惯了链上转账几分钟甚至几秒到账,但进入交易平台后,资金并不一定能够立即使用。
一旦触发强化审核,时间成本可能突然增加。
这对于需要及时使用资金的人来说,影响尤其明显。
所以如果你发现自己的存款进入审核状态,先不要恐慌,也不要反复操作。最重要的是查看账户状态、平台通知以及后续处理要求。
这件事背后其实还有一个更大的变化:
加密资产正在越来越深地进入合规体系。
过去大家更关注“转账快不快”,现在平台越来越关注“这笔资金从哪里来、经过哪里、是否存在风险”。
所以以后做链上转账,除了看手续费和速度,也要开始考虑合规与资金到账时间。
👀 是否触发审核
👀 审核需要多久
👀 平台是否要求补充资料
15天并不意味着所有人都会等15天,但它提醒了市场:加密资产转移并不等于资金能够即时使用。
点击头像观看直播 + 加入玖玖聊天群获取每日策略🚀
#OKX #加密资产 #Web3
🚨 $42.4 million just frozen?
Thai businessman sues Tether—without a court order, can USDT be frozen unilaterally?
Group: 点击进入玖玖的粉丝群
👀 One-sentence recap: Two Thai businessmen have officially filed a lawsuit against Tether. The reason: their $42.4 million USDT was frozen, and the freeze happened with no authorization from any court.
📊 Data speaks: This isn’t a small amount—$42.4 million, roughly on the scale of 300 million RMB in assets. It was frozen on the spot. The core question the plaintiffs raise is simple: on what grounds does Tether freeze a user’s assets unilaterally without a court order?
🔥 What’s behind the numbers: Tether’s ability to freeze has long existed. In the past, it was usually used in coordination with law enforcement to crack down on criminal funds. But this time, the dispute is about “procedural justice”—even if the goal is to stop illegal money, if the process skips the judicial procedure and freezes ordinary users’ assets directly, who protects users’ rights?
💡 What’s truly worth watching isn’t just the $42.4 million itself, but the “trust structure” of stablecoins being reconsidered: users hold USDT believing they’re holding on-chain assets, but the issuer actually holds the power to “freeze with one click.” So for supposedly decentralized stablecoins, who really controls the assets?
⚠️ Cold splash of reality: This is currently only at the lawsuit stage. Tether will most likely defend itself by saying it acted to “comply with law-enforcement anti–money laundering” requirements, and in similar past cases, most lawsuits ended without clear results. Don’t jump to conclusions yet—but this is worth every token holder thinking about: do your stablecoins really fully belong to you?
👀 Do you think a stablecoin issuer has the right to freeze users’ assets without a court order? Let’s discuss in the comments below 👇
Click the avatar to join the Jiujiu chat group for daily strategies 🚀
#稳定币 #USDT #加密市场
Thai businessman sues Tether—without a court order, can USDT be frozen unilaterally?
Group: 点击进入玖玖的粉丝群
👀 One-sentence recap: Two Thai businessmen have officially filed a lawsuit against Tether. The reason: their $42.4 million USDT was frozen, and the freeze happened with no authorization from any court.
📊 Data speaks: This isn’t a small amount—$42.4 million, roughly on the scale of 300 million RMB in assets. It was frozen on the spot. The core question the plaintiffs raise is simple: on what grounds does Tether freeze a user’s assets unilaterally without a court order?
🔥 What’s behind the numbers: Tether’s ability to freeze has long existed. In the past, it was usually used in coordination with law enforcement to crack down on criminal funds. But this time, the dispute is about “procedural justice”—even if the goal is to stop illegal money, if the process skips the judicial procedure and freezes ordinary users’ assets directly, who protects users’ rights?
💡 What’s truly worth watching isn’t just the $42.4 million itself, but the “trust structure” of stablecoins being reconsidered: users hold USDT believing they’re holding on-chain assets, but the issuer actually holds the power to “freeze with one click.” So for supposedly decentralized stablecoins, who really controls the assets?
⚠️ Cold splash of reality: This is currently only at the lawsuit stage. Tether will most likely defend itself by saying it acted to “comply with law-enforcement anti–money laundering” requirements, and in similar past cases, most lawsuits ended without clear results. Don’t jump to conclusions yet—but this is worth every token holder thinking about: do your stablecoins really fully belong to you?
👀 Do you think a stablecoin issuer has the right to freeze users’ assets without a court order? Let’s discuss in the comments below 👇
Click the avatar to join the Jiujiu chat group for daily strategies 🚀
#稳定币 #USDT #加密市场

🚨 SOL Breaks Downward Wedge
Targeting $400 — ETF Holdings Surpass $1B, Are Institutions Serious This Time?
Group: 点击进入玖玖的粉丝群
👀 One-sentence event: On September 2, Solana carved out a key pattern. After the downward wedge was broken, the price reversed strongly, with the price target pointing to $400. What’s driving this move isn’t retail sentiment—it’s institutions putting real money on the line.
📊 Data speaks: Solana spot ETF holdings have already surpassed the $1B mark. The size of liquid staking tokens, BSOL, has also climbed past $1B. With continuous ETF inflows and a surge in on-chain staking volumes, institutional accumulation is becoming increasingly obvious.
🔥 Behind the numbers: Over the past period, SOL has been moving with market-wide volatility, but ETF funds have been steadily flowing in quietly. Meanwhile, the market has been focused on short-term price action while overlooking this layer. This time, the pattern breakout is essentially a resonance between liquidity and technicals—institutions are not here just to bottom-pick; they’re building positions.
💡 What’s truly worth watching isn’t whether SOL can reach $400, but the fact that ETF holdings have broken through $1B: as the amount of SOL held by institutions via compliant channels keeps growing, SOL’s price-setting power is shifting from the retail market to the institutional market. This is almost the same path as what happened back when BTC and ETH were taken over by ETF capital.
⚠️ Pouring cold water: A breakout doesn’t guarantee a one-way rally. $400 is a target, not a promise. If the broader market remains under pressure, SOL may also pull back to retest and confirm support after the breakout. Don’t chase—wait for the dip and reassess.
👀 Do you think this wave can push SOL up to $400? Let’s talk in the comments below 👇
Click the avatar to join the Jiujiu chat group for daily strategies 🚀
#solana #SOL #ETF
Targeting $400 — ETF Holdings Surpass $1B, Are Institutions Serious This Time?
Group: 点击进入玖玖的粉丝群
👀 One-sentence event: On September 2, Solana carved out a key pattern. After the downward wedge was broken, the price reversed strongly, with the price target pointing to $400. What’s driving this move isn’t retail sentiment—it’s institutions putting real money on the line.
📊 Data speaks: Solana spot ETF holdings have already surpassed the $1B mark. The size of liquid staking tokens, BSOL, has also climbed past $1B. With continuous ETF inflows and a surge in on-chain staking volumes, institutional accumulation is becoming increasingly obvious.
🔥 Behind the numbers: Over the past period, SOL has been moving with market-wide volatility, but ETF funds have been steadily flowing in quietly. Meanwhile, the market has been focused on short-term price action while overlooking this layer. This time, the pattern breakout is essentially a resonance between liquidity and technicals—institutions are not here just to bottom-pick; they’re building positions.
💡 What’s truly worth watching isn’t whether SOL can reach $400, but the fact that ETF holdings have broken through $1B: as the amount of SOL held by institutions via compliant channels keeps growing, SOL’s price-setting power is shifting from the retail market to the institutional market. This is almost the same path as what happened back when BTC and ETH were taken over by ETF capital.
⚠️ Pouring cold water: A breakout doesn’t guarantee a one-way rally. $400 is a target, not a promise. If the broader market remains under pressure, SOL may also pull back to retest and confirm support after the breakout. Don’t chase—wait for the dip and reassess.
👀 Do you think this wave can push SOL up to $400? Let’s talk in the comments below 👇
Click the avatar to join the Jiujiu chat group for daily strategies 🚀
#solana #SOL #ETF

🚨 Major event! Is the world’s largest Bitcoin vault company being “swept out” by an index?
Group: 点击进入玖玖的粉丝群
Strategy (formerly MicroStrategy) has officially sent a letter to MSCI, requesting it withdraw a new index screening rule. MSCI’s own backtesting shows that the rule would directly exclude companies with heavy Bitcoin holdings from global investable market indexes—and Strategy is precisely the largest Bitcoin holder in the world, with 845,050 BTC and an average cost of $80,318.
Once the rule takes effect, massive passive funds tracking MSCI indexes will be forced to sell their MSTR positions. This isn’t an active bearish move—it’s a “rule-based selloff.” The index won’t play anymore, so the money has to leave.
Cross-check: On one side, Bitcoin ETF fund flows have seen net inflows for 11 straight days; on the other, MSCI is considering kicking Bitcoin vault companies out of its index. Institutions are splitting between “buying Bitcoin directly” and “buying Bitcoin stocks.” The market is recalibrating the correct way to express “Bitcoin exposure.”
A company being rejected by an index for holding too much Bitcoin— is this a risk warning, or a lag in the traditional framework? Bitcoin’s accounting treatment and index treatment are happening at the same time.
Risk alert: If MSCI pushes ahead, MSTR and similar coin stocks will face near-term pressure; if it withdraws the rule, it would be a structural positive. Keep a close watch on the official response in September.
👀 Do you think MSCI should keep Bitcoin vault companies in the index? Let’s discuss in the comments!
Click the avatar to watch the live broadcast, and join the Jiujiu chat group to get daily strategies 🚀
#美股 #Bitcoin August up 23% outperformed gold stock market
Group: 点击进入玖玖的粉丝群
Strategy (formerly MicroStrategy) has officially sent a letter to MSCI, requesting it withdraw a new index screening rule. MSCI’s own backtesting shows that the rule would directly exclude companies with heavy Bitcoin holdings from global investable market indexes—and Strategy is precisely the largest Bitcoin holder in the world, with 845,050 BTC and an average cost of $80,318.
Once the rule takes effect, massive passive funds tracking MSCI indexes will be forced to sell their MSTR positions. This isn’t an active bearish move—it’s a “rule-based selloff.” The index won’t play anymore, so the money has to leave.
Cross-check: On one side, Bitcoin ETF fund flows have seen net inflows for 11 straight days; on the other, MSCI is considering kicking Bitcoin vault companies out of its index. Institutions are splitting between “buying Bitcoin directly” and “buying Bitcoin stocks.” The market is recalibrating the correct way to express “Bitcoin exposure.”
A company being rejected by an index for holding too much Bitcoin— is this a risk warning, or a lag in the traditional framework? Bitcoin’s accounting treatment and index treatment are happening at the same time.
Risk alert: If MSCI pushes ahead, MSTR and similar coin stocks will face near-term pressure; if it withdraws the rule, it would be a structural positive. Keep a close watch on the official response in September.
👀 Do you think MSCI should keep Bitcoin vault companies in the index? Let’s discuss in the comments!
Click the avatar to watch the live broadcast, and join the Jiujiu chat group to get daily strategies 🚀
#美股 #Bitcoin August up 23% outperformed gold stock market

🚨 A major asset management giant quietly puts HYPE into a Nasdaq crypto index ETF, and the price jumps immediately—who will be the next one for institutions to “flip the switch”?
Event introduction: Brazilian asset manager Hashdex’s latest rebalancing has officially added Hyperliquid ecosystem token HYPE to its holdings in the Nasdaq crypto index ETF. The Nasdaq crypto index this ETF tracks has long been dominated by top assets like BTC and ETH, and HYPE is one of the few “new faces” that managed to squeeze into the list.
Making it concrete: After the news broke, HYPE surged noticeably in the short term, directly gaining institutional, index-level exposure. Previously, inflows into ETFs related to HYPE had already exceeded market expectations; now, with the index inclusion layered on top, it’s equivalent to upgrading from “community narrative” to “institutional allocation.”
Cross-analysis: This signal has two layers: first, the crypto index is no longer only watching the top ten by market cap—high-liquidity ecosystem tokens are being accepted by mainstream capital; second, Hashdex and other established asset managers are rebalancing frequently, suggesting that product innovation and compliance channels are opening up in tandem. HYPE isn’t an isolated case—more “outsider” tokens may be brought into the mainstream later.
Elevator pitch: Institutional entry is never a one-day event, but every time an index adds a token, it’s a “mainstreaming” vote for crypto assets.
Risk hedging: Reminder—index inclusion doesn’t automatically mean blind bullishness. Short-term price momentum can be volatile, so don’t let position management get ahead of you.
👀 Which ecosystem token do you think will be included in the next index? Let’s discuss in the comments.
Click the avatar to watch the live stream, and join the Jiujiu chat group to get daily strategies 🚀
#hype #DeFi #Web3
Group: 点击进入玖玖的粉丝群
Event introduction: Brazilian asset manager Hashdex’s latest rebalancing has officially added Hyperliquid ecosystem token HYPE to its holdings in the Nasdaq crypto index ETF. The Nasdaq crypto index this ETF tracks has long been dominated by top assets like BTC and ETH, and HYPE is one of the few “new faces” that managed to squeeze into the list.
Making it concrete: After the news broke, HYPE surged noticeably in the short term, directly gaining institutional, index-level exposure. Previously, inflows into ETFs related to HYPE had already exceeded market expectations; now, with the index inclusion layered on top, it’s equivalent to upgrading from “community narrative” to “institutional allocation.”
Cross-analysis: This signal has two layers: first, the crypto index is no longer only watching the top ten by market cap—high-liquidity ecosystem tokens are being accepted by mainstream capital; second, Hashdex and other established asset managers are rebalancing frequently, suggesting that product innovation and compliance channels are opening up in tandem. HYPE isn’t an isolated case—more “outsider” tokens may be brought into the mainstream later.
Elevator pitch: Institutional entry is never a one-day event, but every time an index adds a token, it’s a “mainstreaming” vote for crypto assets.
Risk hedging: Reminder—index inclusion doesn’t automatically mean blind bullishness. Short-term price momentum can be volatile, so don’t let position management get ahead of you.
👀 Which ecosystem token do you think will be included in the next index? Let’s discuss in the comments.
Click the avatar to watch the live stream, and join the Jiujiu chat group to get daily strategies 🚀
#hype #DeFi #Web3
Group: 点击进入玖玖的粉丝群
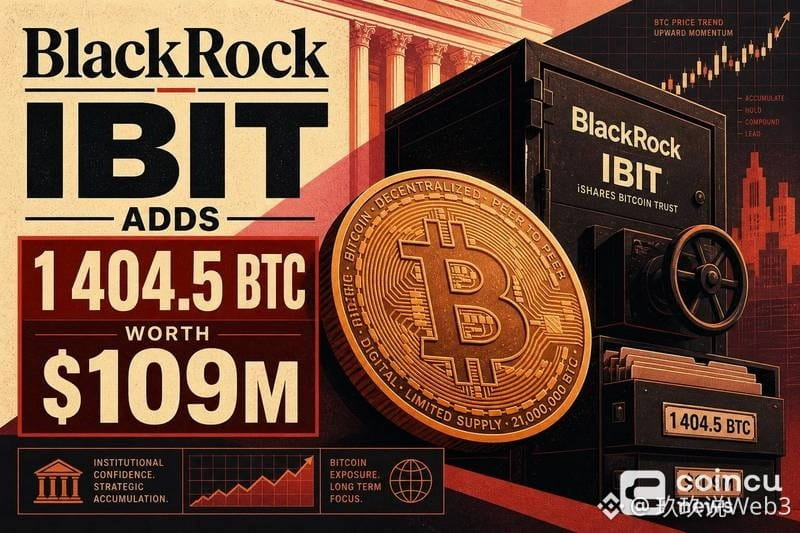
🚨 BlackRock’s iShares Bitcoin Trust (IBIT) added 1,404.5 BTC in a single day—worth about $109 million. When the market falls, the big players are scooping—are you game?
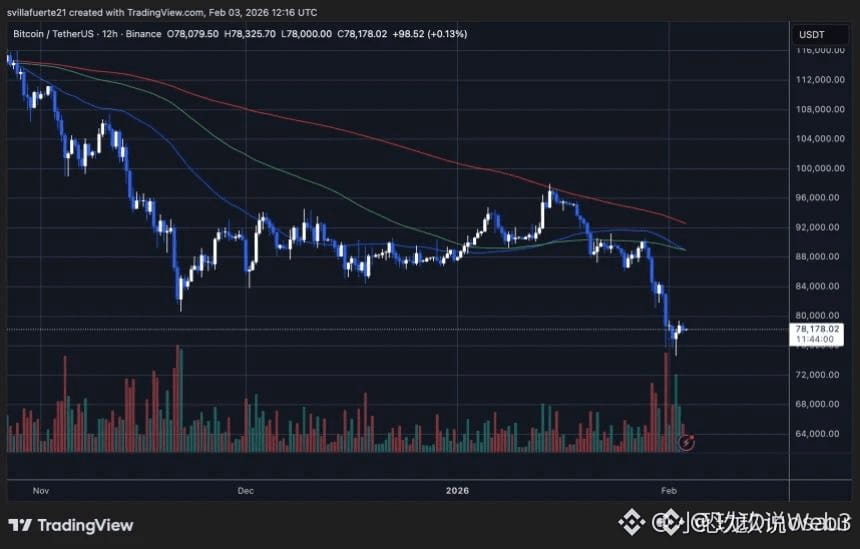
Right when Bitcoin dipped to around 77,000, it was reported that BlackRock’s iShares Bitcoin Trust (IBIT) saw a daily increase of 1,404.5 BTC. At the current price, that’s approximately $109 million. This isn’t pocket change—one buy can gobble up a lot of sell-side liquidity.
Let’s make it concrete: what does 1,404.5 BTC really mean? At $77,000 per coin, it’s about $108 million in hard cash—and that figure doesn’t even include inflows into other ETF funds at the same time. The moves of the world’s largest asset manager are always a gauge of institutional sentiment.
Cross-analysis: on the other side, Ethereum ETFs have already seen net inflows for 11 consecutive days. Both of the two mainstream asset ETFs are continuously attracting capital, suggesting that institutional money isn’t exiting—it’s using pullbacks to rotate and build positions. While retail traders panic-sell, the giants are quietly buying. Every sharp drop is essentially a reshuffling of position structures.
When retail traders are stuck debating short-term up or down, institutions are focused on the long-term logic of asset allocation. In the eyes of mainstream capital, Bitcoin’s position has already returned to what it should be—it’s not going back.
Risk hedging: note that this is a report not confirmed by official sources, and the single-day numbers may have errors. Don’t just go all-in based on one headline. Following along should be tied to your own position management—staggered entries are safer than a one-shot “all in.”
👀 BlackRock is already in—have you matched your position?
Click the avatar to watch the live stream, and join the Jiujiu chat group to get daily strategies 🚀
#以太坊ETF连续11日净流入 #Bitcoin August up 23% outperformed gold stock market
Group: 点击进入玖玖的粉丝群
Right when Bitcoin dipped to around 77,000, it was reported that BlackRock’s iShares Bitcoin Trust (IBIT) saw a daily increase of 1,404.5 BTC. At the current price, that’s approximately $109 million. This isn’t pocket change—one buy can gobble up a lot of sell-side liquidity.
Let’s make it concrete: what does 1,404.5 BTC really mean? At $77,000 per coin, it’s about $108 million in hard cash—and that figure doesn’t even include inflows into other ETF funds at the same time. The moves of the world’s largest asset manager are always a gauge of institutional sentiment.
Cross-analysis: on the other side, Ethereum ETFs have already seen net inflows for 11 consecutive days. Both of the two mainstream asset ETFs are continuously attracting capital, suggesting that institutional money isn’t exiting—it’s using pullbacks to rotate and build positions. While retail traders panic-sell, the giants are quietly buying. Every sharp drop is essentially a reshuffling of position structures.
When retail traders are stuck debating short-term up or down, institutions are focused on the long-term logic of asset allocation. In the eyes of mainstream capital, Bitcoin’s position has already returned to what it should be—it’s not going back.
Risk hedging: note that this is a report not confirmed by official sources, and the single-day numbers may have errors. Don’t just go all-in based on one headline. Following along should be tied to your own position management—staggered entries are safer than a one-shot “all in.”
👀 BlackRock is already in—have you matched your position?
Click the avatar to watch the live stream, and join the Jiujiu chat group to get daily strategies 🚀
#以太坊ETF连续11日净流入 #Bitcoin August up 23% outperformed gold stock market
Group: 点击进入玖玖的粉丝群
BTC-1.02%
IBITETF+0.09%
🚨 Bitcoin falls below $77,000,
Ethereum slips below $2,400, oil prices surge toward $95—yet Bitcoin ETFs are still seeing net inflows. What exactly is the market afraid of?
Group: 点击进入玖玖的粉丝群
Tensions between Iran and the U.S. escalate. As soon as news broke about missile attacks on U.S. military bases, Brent crude jumped straight toward the $95 level, and U.S. Treasury yields also rose to their highest level since January 2025. At the same time, U.S. stock tech sectors came under pressure. Bitcoin dropped below $77,000, while Ethereum lost the $2,400 support level.
Making it concrete: oil prices surged day-on-day, and the 10-year U.S. Treasury yield hit a fresh high since the beginning of this year. Risk assets were broadly pressured—but Bitcoin ETFs still continued to receive sustained net inflows. Money isn’t rushing for an exit in panic.
Cross analysis: geopolitical conflict lifts oil prices and bond yields, directly weighing on risk-asset valuations; however, ETF flows show funds are still buying. This suggests institutions are accumulating in tranches during the downturn. Retail panic versus institutional accumulation is stark. Historically, sharp sell-offs triggered by geopolitical events often fade quickly—what matters is whether the conflict escalates further.
In the short term, geopolitical fear dominates sentiment; in the long term, capital “votes with its feet.” Ultimately, liquidity is what determines the direction.
Hedging risk: if the conflict continues to escalate, oil could challenge the $100 mark, and risk assets may still have a second dip. Don’t rush to go all-in—keep your powder dry and add in batches. Position management will always matter more than prediction.
👀 Do you think this geopolitical shock is a chance to get in, or a reason to keep watching?
Click the avatar to watch the live stream and join the Jiujiu chat group for daily strategies 🚀
#原油 #美联储9月加息概率升至57%
Ethereum slips below $2,400, oil prices surge toward $95—yet Bitcoin ETFs are still seeing net inflows. What exactly is the market afraid of?
Group: 点击进入玖玖的粉丝群
Tensions between Iran and the U.S. escalate. As soon as news broke about missile attacks on U.S. military bases, Brent crude jumped straight toward the $95 level, and U.S. Treasury yields also rose to their highest level since January 2025. At the same time, U.S. stock tech sectors came under pressure. Bitcoin dropped below $77,000, while Ethereum lost the $2,400 support level.
Making it concrete: oil prices surged day-on-day, and the 10-year U.S. Treasury yield hit a fresh high since the beginning of this year. Risk assets were broadly pressured—but Bitcoin ETFs still continued to receive sustained net inflows. Money isn’t rushing for an exit in panic.
Cross analysis: geopolitical conflict lifts oil prices and bond yields, directly weighing on risk-asset valuations; however, ETF flows show funds are still buying. This suggests institutions are accumulating in tranches during the downturn. Retail panic versus institutional accumulation is stark. Historically, sharp sell-offs triggered by geopolitical events often fade quickly—what matters is whether the conflict escalates further.
In the short term, geopolitical fear dominates sentiment; in the long term, capital “votes with its feet.” Ultimately, liquidity is what determines the direction.
Hedging risk: if the conflict continues to escalate, oil could challenge the $100 mark, and risk assets may still have a second dip. Don’t rush to go all-in—keep your powder dry and add in batches. Position management will always matter more than prediction.
👀 Do you think this geopolitical shock is a chance to get in, or a reason to keep watching?
Click the avatar to watch the live stream and join the Jiujiu chat group for daily strategies 🚀
#原油 #美联储9月加息概率升至57%

Verified
🚨 Solana processed 5.2 billion on-chain transactions in August, setting a new all-time high. Does SOL’s valuation logic need to change?
Data released: In August, Solana handled over 5.2 billion non-voting transactions, breaking the historical record across the entire network—up 23% month-over-month from July.
What does 5.2 billion transactions mean? It’s more than 160 million per day. It leaves the previous record far behind. On-chain activity is completely turned up, and ecosystem usage is still accelerating. This isn’t a one-off spike—it’s sustained high-level operation throughout the month.
Cross-check for a clearer picture: The share of DEX spot trading volume relative to centralized exchanges is already approaching the 24% historical milestone—liquidity is migrating from CEXs to the chain, and Solana is one of the biggest beneficiaries of this shift. Behind the record-breaking transaction volumes are real users completing payments, trades, and asset allocation on-chain.
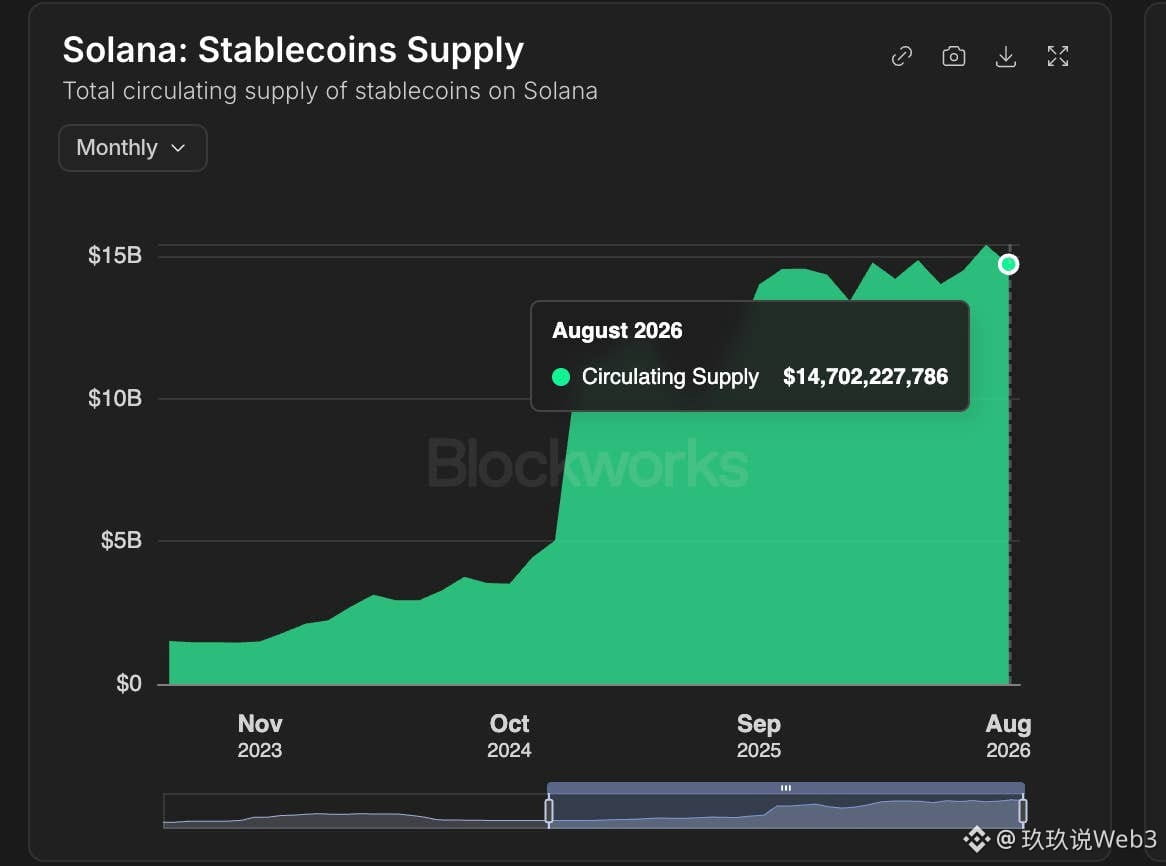
Look at the ecosystem structure as well: The circulation size of stablecoins on Solana continues to grow, and RWA projects are rolling out one after another. The “thickness” of the on-chain economy is completely different from two years ago, when things were mainly propped up by memes.
Usage is the most honest valuation anchor for a public chain. Solana is using data to prove that it’s not just “fast,” but that people truly are using it.
However, high transaction volume doesn’t automatically mean the token price must rise—ecosystem revenue, unlock supply, and sell-pressure all need close monitoring. Don’t get carried away just by a single month’s data; trend confirmation matters more than any one data point.
👀 Do you think this on-chain hype for Solana can support a new high for SOL?
Click the avatar to watch the livestream and join the Jiujiu chat group to get daily strategies 🚀
#solana #DeFi #Web3
Group: 点击进入玖玖的粉丝群
Data released: In August, Solana handled over 5.2 billion non-voting transactions, breaking the historical record across the entire network—up 23% month-over-month from July.
What does 5.2 billion transactions mean? It’s more than 160 million per day. It leaves the previous record far behind. On-chain activity is completely turned up, and ecosystem usage is still accelerating. This isn’t a one-off spike—it’s sustained high-level operation throughout the month.
Cross-check for a clearer picture: The share of DEX spot trading volume relative to centralized exchanges is already approaching the 24% historical milestone—liquidity is migrating from CEXs to the chain, and Solana is one of the biggest beneficiaries of this shift. Behind the record-breaking transaction volumes are real users completing payments, trades, and asset allocation on-chain.
Look at the ecosystem structure as well: The circulation size of stablecoins on Solana continues to grow, and RWA projects are rolling out one after another. The “thickness” of the on-chain economy is completely different from two years ago, when things were mainly propped up by memes.
Usage is the most honest valuation anchor for a public chain. Solana is using data to prove that it’s not just “fast,” but that people truly are using it.
However, high transaction volume doesn’t automatically mean the token price must rise—ecosystem revenue, unlock supply, and sell-pressure all need close monitoring. Don’t get carried away just by a single month’s data; trend confirmation matters more than any one data point.
👀 Do you think this on-chain hype for Solana can support a new high for SOL?
Click the avatar to watch the livestream and join the Jiujiu chat group to get daily strategies 🚀
#solana #DeFi #Web3
Group: 点击进入玖玖的粉丝群
Verified
🚨 XRP spot ETF net inflow in August hits $1.67 billion—Goldman has the biggest position. Can you still chase this move?
Institutional buy orders pushed the August inflows of the XRP spot ETF to $1.67 billion, with Goldman’s holdings now the largest in the entire market.
How big is $1.67 billion? It far surpasses any previous weekly record—Goldman alone became the biggest holder, and market-making giants like Jane Street are also continuously adding.
The ETF channel is becoming the hardest entry point for XRP capital. Institutional participation is no longer just a slogan—it’s real, with tangible positions.
Even more intriguing is the cross-data: XRP is up 40% over two weeks, yet open interest in futures contracts has actually declined—suggesting this rally is driven more by spot institutional buying than by leveraged speculation. The structure is healthier than many expect. Spot-driven upside also tends to make pullbacks more resilient.
Add Ripple’s continued rollout in institutional custody and tokenized assets, and XRP is building a “dual-wheel path” of ETF capital plus an institutional ecosystem.
Once Wall Street’s ETF funds begin queuing up, XRP’s narrative shifts from “litigation concept” to “institutional allocation of assets”—the biggest identity change of this cycle.
But monthly inflows don’t equal daily inflows, and ETF money can just as easily rotate out. Before chasing, think clearly about where your stop-loss level is—don’t treat an institution’s position as your own belief.
👀 Will you allocate to XRP alongside institutions, or wait for a pullback to get on board?
Click the avatar to watch the livestream, and join the Jiuji chat group to get daily strategies 🚀
#XRP两周上涨40%未平仓合约下降 #xrp #Ripple
Group: 点击进入玖玖的粉丝群
Institutional buy orders pushed the August inflows of the XRP spot ETF to $1.67 billion, with Goldman’s holdings now the largest in the entire market.
How big is $1.67 billion? It far surpasses any previous weekly record—Goldman alone became the biggest holder, and market-making giants like Jane Street are also continuously adding.
The ETF channel is becoming the hardest entry point for XRP capital. Institutional participation is no longer just a slogan—it’s real, with tangible positions.
Even more intriguing is the cross-data: XRP is up 40% over two weeks, yet open interest in futures contracts has actually declined—suggesting this rally is driven more by spot institutional buying than by leveraged speculation. The structure is healthier than many expect. Spot-driven upside also tends to make pullbacks more resilient.
Add Ripple’s continued rollout in institutional custody and tokenized assets, and XRP is building a “dual-wheel path” of ETF capital plus an institutional ecosystem.
Once Wall Street’s ETF funds begin queuing up, XRP’s narrative shifts from “litigation concept” to “institutional allocation of assets”—the biggest identity change of this cycle.
But monthly inflows don’t equal daily inflows, and ETF money can just as easily rotate out. Before chasing, think clearly about where your stop-loss level is—don’t treat an institution’s position as your own belief.
👀 Will you allocate to XRP alongside institutions, or wait for a pullback to get on board?
Click the avatar to watch the livestream, and join the Jiuji chat group to get daily strategies 🚀
#XRP两周上涨40%未平仓合约下降 #xrp #Ripple
Group: 点击进入玖玖的粉丝群

Verified
🚨Whales in Wall Street Expose XRP Holdings: Goldman Sachs Q2 Held an XRP ETF Exposure of $87.45M — Jane Street Also Bought $16.64M; What Game Are Institutions Playing?
Group: 点击进入玖玖的粉丝群
The latest disclosure documents show that in Q2, Goldman Sachs held an XRP ETF exposure of $87.45 million, while Jane Street’s position was $16.64 million. Combined, the two add up to over $104 million. The amount isn’t exactly shocking, but the signal matters far more than the numbers themselves—Wall Street investment banks and market makers are placing XRP into compliant allocation portfolios, something that would have been unimaginable just two years ago.
Looking back at recent developments: XRP has risen 40% over the past two weeks. The ETF recorded net inflows of $110 million in a week, setting the strongest record since 2026. Now that Goldman Sachs and Jane Street have appeared on the holdings list, it suggests this wave isn’t just retail investors chasing—institutions are quietly entering via the ETF channel too, and the chip structure is undergoing a real transformation.
What’s truly worth watching isn’t how much Goldman Sachs bought, but the fact that XRP is shifting from “a coin in the shadow of lawsuits” to “an asset on Wall Street’s ETF shelf.” The market narrative has changed, and with it the pricing logic has been rebuilt. Retail investors’ counterparty is no longer other retail—now it’s Wall Street.
Pour cold water: 13F filings have a reporting lag; Q2 positions don’t necessarily mean they were still held in Q3. After XRP surged, open contracts didn’t increase—they actually fell. The risk of short-term pullbacks and position unwinds remains. Don’t get carried away by a single data point; before chasing, think clearly about your exit level.
👀Wall Street big shots are moving in—do you think XRP is truly institutional-grade bullishness, or just another round of hype?
Click the avatar to watch tonight’s live stream and join the Jiuji chat group to get daily strategy 🚀
#XRP两周上涨40%未平仓合约下降 #xrp
Group: 点击进入玖玖的粉丝群
The latest disclosure documents show that in Q2, Goldman Sachs held an XRP ETF exposure of $87.45 million, while Jane Street’s position was $16.64 million. Combined, the two add up to over $104 million. The amount isn’t exactly shocking, but the signal matters far more than the numbers themselves—Wall Street investment banks and market makers are placing XRP into compliant allocation portfolios, something that would have been unimaginable just two years ago.
Looking back at recent developments: XRP has risen 40% over the past two weeks. The ETF recorded net inflows of $110 million in a week, setting the strongest record since 2026. Now that Goldman Sachs and Jane Street have appeared on the holdings list, it suggests this wave isn’t just retail investors chasing—institutions are quietly entering via the ETF channel too, and the chip structure is undergoing a real transformation.
What’s truly worth watching isn’t how much Goldman Sachs bought, but the fact that XRP is shifting from “a coin in the shadow of lawsuits” to “an asset on Wall Street’s ETF shelf.” The market narrative has changed, and with it the pricing logic has been rebuilt. Retail investors’ counterparty is no longer other retail—now it’s Wall Street.
Pour cold water: 13F filings have a reporting lag; Q2 positions don’t necessarily mean they were still held in Q3. After XRP surged, open contracts didn’t increase—they actually fell. The risk of short-term pullbacks and position unwinds remains. Don’t get carried away by a single data point; before chasing, think clearly about your exit level.
👀Wall Street big shots are moving in—do you think XRP is truly institutional-grade bullishness, or just another round of hype?
Click the avatar to watch tonight’s live stream and join the Jiuji chat group to get daily strategy 🚀
#XRP两周上涨40%未平仓合约下降 #xrp

🚨 Ethereum’s monthly chart has just flashed a key signal: the first confirmed “higher high” since the drop that began last August. Can ETH hold its ground this time?
Group: 点击进入玖玖的粉丝群
According to CryptoPotato’s latest analysis, the ETH monthly close has formed the first higher high since the downtrend began—an unmistakable technical strength shift. At the same time, Ethereum ETFs have recorded net inflows for 11 straight trading days, breaking the $100 million mark multiple times in a single day—fund flows and technical signals are rarely syncing like this.
Over the past 11 days, the inflow into Ethereum ETFs has been substantial. Institutions have continued to add through compliant channels, while on-chain “whale” addresses are also accumulating in parallel. ETF capital, on-chain holdings, and the monthly chart structure all point to the same direction: low-price coins are being absorbed systematically—every ETH sold by retail is being steadily picked up by institutions.
What really matters isn’t how much ETH can rise in the short term, but that this round of incoming capital is “allocation-based,” not “speculation-based.” Institutions are treating ETH as a long-term asset to accumulate—which is the hardest logic behind the monthly breakout, and the biggest difference from previous cycles.
But here’s the bucket of cold water: the monthly higher high is only the first step. If the Federal Reserve’s September rate hike lands (probability has risen to 57%), risk assets overall could face pressure, and ETH’s pullback room may also be significant. Chasing higher requires caution—position management matters more than direction guessing.
👀 Do you think this monthly breakout for ETH is a real start or a false breakout? Share your position logic in the comments.
Click the avatar to watch tonight’s live stream, and join the Jiujiu chat group to get daily strategies 🚀
#以太坊ETF连续11日净流入 #ETH
Group: 点击进入玖玖的粉丝群
According to CryptoPotato’s latest analysis, the ETH monthly close has formed the first higher high since the downtrend began—an unmistakable technical strength shift. At the same time, Ethereum ETFs have recorded net inflows for 11 straight trading days, breaking the $100 million mark multiple times in a single day—fund flows and technical signals are rarely syncing like this.
Over the past 11 days, the inflow into Ethereum ETFs has been substantial. Institutions have continued to add through compliant channels, while on-chain “whale” addresses are also accumulating in parallel. ETF capital, on-chain holdings, and the monthly chart structure all point to the same direction: low-price coins are being absorbed systematically—every ETH sold by retail is being steadily picked up by institutions.
What really matters isn’t how much ETH can rise in the short term, but that this round of incoming capital is “allocation-based,” not “speculation-based.” Institutions are treating ETH as a long-term asset to accumulate—which is the hardest logic behind the monthly breakout, and the biggest difference from previous cycles.
But here’s the bucket of cold water: the monthly higher high is only the first step. If the Federal Reserve’s September rate hike lands (probability has risen to 57%), risk assets overall could face pressure, and ETH’s pullback room may also be significant. Chasing higher requires caution—position management matters more than direction guessing.
👀 Do you think this monthly breakout for ETH is a real start or a false breakout? Share your position logic in the comments.
Click the avatar to watch tonight’s live stream, and join the Jiujiu chat group to get daily strategies 🚀
#以太坊ETF连续11日净流入 #ETH
🚨Singapore has made a move: stablecoin issuers must hold 100% reserves and are forbidden from paying interest! Will the world’s strictest stablecoin rules be coming soon?
Group: 点击进入玖玖的粉丝群
Today, the Monetary Authority of Singapore (MAS) released a consultation paper proposing amendments to the Payment Services Act, with the MAS-SCS stablecoin framework slated for official implementation. The core is just three rules: only licensed issuers may call themselves “MAS-regulated stablecoins”; reserves must cover 100% of the outstanding supply, held in safe and liquid assets; and users must be able to redeem at face value within five business days. The harshest rule is—no paying interest or any returns to holders.
Specific details: the pegged currencies are limited to the Singapore dollar or G10 currencies (US dollar, euro); if a token doesn’t meet the requirements, it can only be downgraded to be treated as a regular digital payment token. The consultation window closes on October 16, after which it will move into the legislative process.
Cross-analysis: these rules clearly align with the frameworks in the US and the EU—effectively, Asia’s financial hub is proactively giving stablecoins an official “stamp of legitimacy.” Issuers like Tether and Circle will see increased compliance costs in Singapore, but compliant stablecoins will instead get a passport for cross-border payments and tokenized finance.
What’s truly worth watching isn’t who gets restricted, but that MAS is granting an official identity to “regulated stablecoins”—which means banks and institutions will dare to onboard stablecoins at scale. This is the foundation of the RWA narrative.
A bucket of cold water: between consultation and final implementation there’s still the legislative process, and until October 16 everything is still variable. The ban on returns will deter some capital that wants to earn interest—so it may not be bullish in the short term.
👀 Do you think this round of Singapore’s regulation is a turning point that helps stablecoins break into the mainstream, or a tight set of reins for the industry?
Click the profile picture to watch the live stream, and join the Jiujiu chat group to get daily strategies 🚀
#稳定币 #新加坡 #MAS #加密监管 #RWA
Group: 点击进入玖玖的粉丝群
Today, the Monetary Authority of Singapore (MAS) released a consultation paper proposing amendments to the Payment Services Act, with the MAS-SCS stablecoin framework slated for official implementation. The core is just three rules: only licensed issuers may call themselves “MAS-regulated stablecoins”; reserves must cover 100% of the outstanding supply, held in safe and liquid assets; and users must be able to redeem at face value within five business days. The harshest rule is—no paying interest or any returns to holders.
Specific details: the pegged currencies are limited to the Singapore dollar or G10 currencies (US dollar, euro); if a token doesn’t meet the requirements, it can only be downgraded to be treated as a regular digital payment token. The consultation window closes on October 16, after which it will move into the legislative process.
Cross-analysis: these rules clearly align with the frameworks in the US and the EU—effectively, Asia’s financial hub is proactively giving stablecoins an official “stamp of legitimacy.” Issuers like Tether and Circle will see increased compliance costs in Singapore, but compliant stablecoins will instead get a passport for cross-border payments and tokenized finance.
What’s truly worth watching isn’t who gets restricted, but that MAS is granting an official identity to “regulated stablecoins”—which means banks and institutions will dare to onboard stablecoins at scale. This is the foundation of the RWA narrative.
A bucket of cold water: between consultation and final implementation there’s still the legislative process, and until October 16 everything is still variable. The ban on returns will deter some capital that wants to earn interest—so it may not be bullish in the short term.
👀 Do you think this round of Singapore’s regulation is a turning point that helps stablecoins break into the mainstream, or a tight set of reins for the industry?
Click the profile picture to watch the live stream, and join the Jiujiu chat group to get daily strategies 🚀
#稳定币 #新加坡 #MAS #加密监管 #RWA

🚨 Another listed company has heavily invested in Bitcoin!
$143 million injected, 23,156 BTC acquired!
Group: 点击进入玖玖的粉丝群
Corporate funds are back in action again 👀
Strive’s CEO Matt Cole announced that the company’s latest purchase was 1,800 bitcoins, totaling approximately $143 million, with an average cost of around $79,431. After this transaction was completed, Strive’s Bitcoin holdings reached 23,156 BTC. Based on the reference price at the time of disclosure, the total value is approximately $1.76 billion.
What’s truly worth paying attention to isn’t just how much Strive bought—it’s that institutional-grade capital is returning to the Bitcoin market. At the same time Strive announced its increase, Strategy also ended its nearly two-month pause and resumed investing approximately $370 million to buy Bitcoin.
On the other side, Bitmine recently also completed its largest ETH accumulation since June.
When these moves are viewed together, the market shows a clear shift:
Previously, corporate funds chose to stand by amid high-level volatility. But as the market becomes active again, some listed companies have started to expand their crypto asset reserves once more. 🔥
And Strive’s average buy price this time is about $79,431—actually slightly higher than the spot price of Bitcoin at that time. This suggests the company isn’t waiting for a clear deep pullback; instead, it’s expanding its long-term reserves directly in the current price range.
The logic behind this strategy is actually quite simple:
If Bitcoin continues to rise in the future, the company’s large BTC holdings could help lift both asset value and market valuation in tandem. But the other side is that if Bitcoin experiences sustained declines, the company’s balance sheet and stock price would face dual pressure. ⚠️ This is also the biggest controversy surrounding the “Bitcoin treasury company” model in recent years.
Companies can raise funds through the stock market, then convert that capital into Bitcoin—continuously expanding their holdings. But the problem is that once the market enters a downturn cycle, financing capacity, shareholder dilution, and BTC price volatility all become new pressures.
Tap the avatar to watch the livestream + join the Jiujiu chat group to get daily strategy 🚀
#BTC #Strive #strategy
$143 million injected, 23,156 BTC acquired!
Group: 点击进入玖玖的粉丝群
Corporate funds are back in action again 👀
Strive’s CEO Matt Cole announced that the company’s latest purchase was 1,800 bitcoins, totaling approximately $143 million, with an average cost of around $79,431. After this transaction was completed, Strive’s Bitcoin holdings reached 23,156 BTC. Based on the reference price at the time of disclosure, the total value is approximately $1.76 billion.
What’s truly worth paying attention to isn’t just how much Strive bought—it’s that institutional-grade capital is returning to the Bitcoin market. At the same time Strive announced its increase, Strategy also ended its nearly two-month pause and resumed investing approximately $370 million to buy Bitcoin.
On the other side, Bitmine recently also completed its largest ETH accumulation since June.
When these moves are viewed together, the market shows a clear shift:
Previously, corporate funds chose to stand by amid high-level volatility. But as the market becomes active again, some listed companies have started to expand their crypto asset reserves once more. 🔥
And Strive’s average buy price this time is about $79,431—actually slightly higher than the spot price of Bitcoin at that time. This suggests the company isn’t waiting for a clear deep pullback; instead, it’s expanding its long-term reserves directly in the current price range.
The logic behind this strategy is actually quite simple:
If Bitcoin continues to rise in the future, the company’s large BTC holdings could help lift both asset value and market valuation in tandem. But the other side is that if Bitcoin experiences sustained declines, the company’s balance sheet and stock price would face dual pressure. ⚠️ This is also the biggest controversy surrounding the “Bitcoin treasury company” model in recent years.
Companies can raise funds through the stock market, then convert that capital into Bitcoin—continuously expanding their holdings. But the problem is that once the market enters a downturn cycle, financing capacity, shareholder dilution, and BTC price volatility all become new pressures.
Tap the avatar to watch the livestream + join the Jiujiu chat group to get daily strategy 🚀
#BTC #Strive #strategy
🚨 Bitcoin ETFs Pull in $217 Million in a Single Day! Ethereum ETFs Keep Buying for 11 Straight Days—What Are Funds Rushing For?
Group: 点击进入玖玖的粉丝群
📊 Just happened: This past Monday, U.S. spot Bitcoin ETFs saw a net inflow of $217 million, instantly reversing last Friday’s slump.
Keep in mind: Last Friday, Bitcoin ETFs had just suffered a net outflow of $202 million—and that also ended a nine-day streak of gains that began on August 19. It was the longest consecutive buying run this year. Once the holiday was over, the funds rushed back immediately.
🐋 First, look at the overall picture.
As of the end of August, Bitcoin ETF net assets were hovering near the $100 billion mark—slightly below the level they just surpassed on August 27. Since listing in January 2024, Bitcoin ETFs have accumulated total net inflows of about $55 billion. August was also this year’s best-performing month: the inflow size was more than twice that of April.
📈 But there’s a detail to watch.
Even though August’s price action was hot, in 2026 overall Bitcoin ETFs are still in net outflow territory, with cumulative net outflows of about $2.5 billion. This suggests that capital has been moving around a lot this year—when external macro factors and sentiment shift, funds run back and forth.
🟣 What’s truly eye-catching is Ethereum ETFs.
On Monday, Ethereum ETFs recorded a net inflow of $88 million. The consecutive buying days extended to 11, with cumulative net inflows reaching $1.6 billion—this is the longest continuous buying cycle since the 20-day run in July 2025.
🔍 There’s a story behind this replenishment.
Last Friday’s outflows were linked to hawkish comments made by former Fed governor Warsh during the Jackson Hole meeting. At one point, the market worried that rate-hike expectations would heat up. But Monday’s fund return suggests institutions are treating this pullback as a short-term adjustment—not a trend reversal.
⚠️ But don’t get ahead of yourself.
ETF fund flows are heavily influenced by macro data. The key to whether this trend can continue is the set of economic data expected to be released later this week. If the data is hawkish, funds could retreat again at any time.
How long do you think this institutional fund comeback can last? Feel free to discuss in the comments below👇
Click the profile picture to watch the live stream + join the Jiuji Chat Group for daily strategy 🚀
#美国加密关联股指8月涨8.81% #比特币24小时跌3.4%至7.74万美元 #Fed September rate-hike probability rises to 57%
Group: 点击进入玖玖的粉丝群
📊 Just happened: This past Monday, U.S. spot Bitcoin ETFs saw a net inflow of $217 million, instantly reversing last Friday’s slump.
Keep in mind: Last Friday, Bitcoin ETFs had just suffered a net outflow of $202 million—and that also ended a nine-day streak of gains that began on August 19. It was the longest consecutive buying run this year. Once the holiday was over, the funds rushed back immediately.
🐋 First, look at the overall picture.
As of the end of August, Bitcoin ETF net assets were hovering near the $100 billion mark—slightly below the level they just surpassed on August 27. Since listing in January 2024, Bitcoin ETFs have accumulated total net inflows of about $55 billion. August was also this year’s best-performing month: the inflow size was more than twice that of April.
📈 But there’s a detail to watch.
Even though August’s price action was hot, in 2026 overall Bitcoin ETFs are still in net outflow territory, with cumulative net outflows of about $2.5 billion. This suggests that capital has been moving around a lot this year—when external macro factors and sentiment shift, funds run back and forth.
🟣 What’s truly eye-catching is Ethereum ETFs.
On Monday, Ethereum ETFs recorded a net inflow of $88 million. The consecutive buying days extended to 11, with cumulative net inflows reaching $1.6 billion—this is the longest continuous buying cycle since the 20-day run in July 2025.
🔍 There’s a story behind this replenishment.
Last Friday’s outflows were linked to hawkish comments made by former Fed governor Warsh during the Jackson Hole meeting. At one point, the market worried that rate-hike expectations would heat up. But Monday’s fund return suggests institutions are treating this pullback as a short-term adjustment—not a trend reversal.
⚠️ But don’t get ahead of yourself.
ETF fund flows are heavily influenced by macro data. The key to whether this trend can continue is the set of economic data expected to be released later this week. If the data is hawkish, funds could retreat again at any time.
How long do you think this institutional fund comeback can last? Feel free to discuss in the comments below👇
Click the profile picture to watch the live stream + join the Jiuji Chat Group for daily strategy 🚀
#美国加密关联股指8月涨8.81% #比特币24小时跌3.4%至7.74万美元 #Fed September rate-hike probability rises to 57%

#比特币24小时跌3.4%至7.74万美元
BlackRock cuts the in-kind conversion threshold fee for IBIT by 96%—the “last mile” for institutions buying Bitcoin has been cleared
👉 贝莱德砍费,进群看
BlackRock slashed IBIT’s in-kind conversion threshold fee from $25 million to $1 million, a 96% reduction. Most people didn’t notice this news, but it may be one of the most underappreciated variables in this bull cycle.
The in-kind conversion threshold fee is one of the costs for institutions to exchange real money for BTC spot. Cutting the fee by 96% means smaller institutions and wealth management firms can configure Bitcoin via IBIT at low cost—not by buying ETF shares, but by directly swapping for BTC spot.
Think it through: Why is BlackRock cutting it now? Because it has seen demand. Large institutions are already in; now it’s about opening up the market for “mid-tier” institutions. When the world’s largest asset manager proactively lowers the allocation threshold, it suggests it’s bullish on BTC’s long-term demand—not just chasing management fees.
More importantly, ETF flows are often mentioned, but “in-kind conversion” is the real, money-on-the-table BTC buying. After the threshold is lowered, the amount of in-kind conversions could rise significantly—this is the actual bid.
Is BlackRock cutting the conversion fee a bull-market signal or just normal business practice? Let’s discuss in the comments 👇
Click the avatar to watch the live stream and join the Jiujiu chat group to get daily strategy 🚀
#比特币24小时跌3.4%至7.74万美元 #Bitcoin #BlackRock #IBIT #ETF
BlackRock cuts the in-kind conversion threshold fee for IBIT by 96%—the “last mile” for institutions buying Bitcoin has been cleared
👉 贝莱德砍费,进群看
BlackRock slashed IBIT’s in-kind conversion threshold fee from $25 million to $1 million, a 96% reduction. Most people didn’t notice this news, but it may be one of the most underappreciated variables in this bull cycle.
The in-kind conversion threshold fee is one of the costs for institutions to exchange real money for BTC spot. Cutting the fee by 96% means smaller institutions and wealth management firms can configure Bitcoin via IBIT at low cost—not by buying ETF shares, but by directly swapping for BTC spot.
Think it through: Why is BlackRock cutting it now? Because it has seen demand. Large institutions are already in; now it’s about opening up the market for “mid-tier” institutions. When the world’s largest asset manager proactively lowers the allocation threshold, it suggests it’s bullish on BTC’s long-term demand—not just chasing management fees.
More importantly, ETF flows are often mentioned, but “in-kind conversion” is the real, money-on-the-table BTC buying. After the threshold is lowered, the amount of in-kind conversions could rise significantly—this is the actual bid.
Is BlackRock cutting the conversion fee a bull-market signal or just normal business practice? Let’s discuss in the comments 👇
Click the avatar to watch the live stream and join the Jiujiu chat group to get daily strategy 🚀
#比特币24小时跌3.4%至7.74万美元 #Bitcoin #BlackRock #IBIT #ETF
BTC-1.02%
IBITETF+0.09%
Verified
#布伦特原油涨破90美元
Tensions flare again in the Strait of Hormuz, oil prices surge past 91— but this “war premium” comes fast and disappears even faster
👉 油价冲91,进群看走势
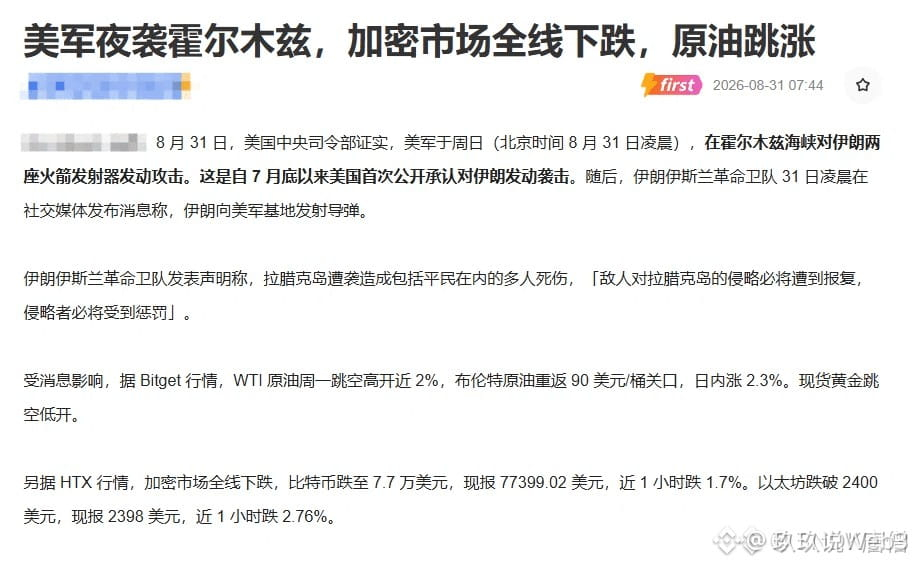
More tense news out of the Strait of Hormuz: oil prices jumped straight to 91. One-fifth of the world’s oil has to pass through here—once anything stirs, prices react instantly. But the real question is: how long can this wave of “war premium” last?
The historical pattern is brutal: oil-price spikes from geopolitical conflicts usually fade quickly when the situation hasn’t escalated into a “supply disruption.” The market may price in a potential supply cutoff, but if it doesn’t actually happen, the premium gets squeezed out. During the Russia-Ukraine conflict in 2022, oil prices surged to 130—and later still fell back to 80.
Flip the perspective: for the crypto market, the real threat from oil-price increases isn’t oil itself—it’s that rising oil pushes inflation higher → the Fed dares not cut rates → liquidity tightens. So every 10% rise in oil adds another layer of macro pressure on BTC—“geopolitical immunity” has an expiration date.
Even more crucial: if the conflict drags on, high oil prices → stubborn inflation → expectations of further rate hikes. What crypto will face won’t be just a “risk-off narrative,” but the hard reality of “liquidity contraction.”
Oil is at 91 now—do you think the conflict will escalate or cool down? Discuss in the comments below 👇
Click the profile icon to watch the livestream, and join the Jiuji Chat Group to get daily strategies 🚀
#布伦特原油涨破90美元 #oil price #Hormuz #geopolitics #BTC
Tensions flare again in the Strait of Hormuz, oil prices surge past 91— but this “war premium” comes fast and disappears even faster
👉 油价冲91,进群看走势
More tense news out of the Strait of Hormuz: oil prices jumped straight to 91. One-fifth of the world’s oil has to pass through here—once anything stirs, prices react instantly. But the real question is: how long can this wave of “war premium” last?
The historical pattern is brutal: oil-price spikes from geopolitical conflicts usually fade quickly when the situation hasn’t escalated into a “supply disruption.” The market may price in a potential supply cutoff, but if it doesn’t actually happen, the premium gets squeezed out. During the Russia-Ukraine conflict in 2022, oil prices surged to 130—and later still fell back to 80.
Flip the perspective: for the crypto market, the real threat from oil-price increases isn’t oil itself—it’s that rising oil pushes inflation higher → the Fed dares not cut rates → liquidity tightens. So every 10% rise in oil adds another layer of macro pressure on BTC—“geopolitical immunity” has an expiration date.
Even more crucial: if the conflict drags on, high oil prices → stubborn inflation → expectations of further rate hikes. What crypto will face won’t be just a “risk-off narrative,” but the hard reality of “liquidity contraction.”
Oil is at 91 now—do you think the conflict will escalate or cool down? Discuss in the comments below 👇
Click the profile icon to watch the livestream, and join the Jiuji Chat Group to get daily strategies 🚀
#布伦特原油涨破90美元 #oil price #Hormuz #geopolitics #BTC
#布伦特原油涨破90美元
The U.S. attacks Iran, oil prices break 90—yet BTC doesn’t blink. But the words “safe haven” may be the most dangerous label of all.
👉 BTC战争免疫,进群看
The U.S. has taken action against Iran. Brent crude oil has broken through 90, and markets worldwide are tense—only BTC remains unmoved. It’s the best-performing asset in August, seemingly “immune” to war.
On the surface, this looks like a win for BTC’s “digital gold” narrative: traditional assets tremble in the face of war, while BTC stays rock-solid. But think carefully—can this “immunity” really be relied on?
Before World War I, gold was also considered the “ultimate safe haven,” only for it to be sold off and turned into cash once the war began. Today’s “war immunity” for BTC exists because the market still hasn’t fully treated it as a real safe-haven asset—it just happens not to have fallen. If the conflict escalates to the point that it impacts global liquidity, BTC’s “risk asset” characteristics could instantly outweigh its “safe haven” traits.
More importantly: oil breaking 90 → inflation expectations heat up → the Fed dares not cut rates → liquidity tightens → all risk assets come under pressure. BTC’s “immunity” is built on the assumption that the conflict won’t last too long. Once that assumption is broken, a catch-up drop could be harsher than anyone else’s.
Is BTC’s war immunity a case of attribute awakening—or an illusion? Let’s talk in the comments 👇
Click the profile to watch the livestream, and join the Jiujiu chat group to get daily strategy 🚀
#布伦特原油涨破90美元 #BTC #geopolitics #safe haven #crude oil
The U.S. attacks Iran, oil prices break 90—yet BTC doesn’t blink. But the words “safe haven” may be the most dangerous label of all.
👉 BTC战争免疫,进群看
The U.S. has taken action against Iran. Brent crude oil has broken through 90, and markets worldwide are tense—only BTC remains unmoved. It’s the best-performing asset in August, seemingly “immune” to war.
On the surface, this looks like a win for BTC’s “digital gold” narrative: traditional assets tremble in the face of war, while BTC stays rock-solid. But think carefully—can this “immunity” really be relied on?
Before World War I, gold was also considered the “ultimate safe haven,” only for it to be sold off and turned into cash once the war began. Today’s “war immunity” for BTC exists because the market still hasn’t fully treated it as a real safe-haven asset—it just happens not to have fallen. If the conflict escalates to the point that it impacts global liquidity, BTC’s “risk asset” characteristics could instantly outweigh its “safe haven” traits.
More importantly: oil breaking 90 → inflation expectations heat up → the Fed dares not cut rates → liquidity tightens → all risk assets come under pressure. BTC’s “immunity” is built on the assumption that the conflict won’t last too long. Once that assumption is broken, a catch-up drop could be harsher than anyone else’s.
Is BTC’s war immunity a case of attribute awakening—or an illusion? Let’s talk in the comments 👇
Click the profile to watch the livestream, and join the Jiujiu chat group to get daily strategy 🚀
#布伦特原油涨破90美元 #BTC #geopolitics #safe haven #crude oil

#波场主网激活tvm布拉格大阪兼容
Launched just two months ago, Robinhood Chain’s revenue beats Ethereum—yet 88% comes from meme coins. How long can this last?
👉 Robinhood Chain逆袭,进群聊
Robinhood Chain has only been live for two months. Its app made $2.66 million in daily revenue, surpassing Ethereum’s $1.27 million and Hyperliquid’s $1.70 million. The numbers look great, but if you break them down: Gmgn (a meme-coin trading terminal) contributed $1.11 million alone. Add Pons and Uniswap, and together they account for 88%.
In other words, this chain’s revenue is almost entirely driven by meme-coin trading. What’s the nature of meme coins? They come fast and go just as fast. Today, Gmgn accounts for 42%. Next month, if the meme craze fades, revenue could be cut by half immediately.
Think of it another way: Robinhood Chain’s real ace isn’t revenue—it’s the “traffic entry point.” Tens of millions of retail users can get on-chain and trade without having to learn wallets. This is exactly what Ethereum lacks most. Revenue is meme-driven, but user stickiness is real.
So the question isn’t “Can Robinhood Chain surpass Ethereum?” It’s “When the meme tide goes out, will its users stay?” If they stay, a new king of L2 emerges; if they don’t, it’s just another fireworks show.
Can Robinhood Chain really threaten Ethereum? Let’s discuss in the comments 👇
Click the profile picture to watch the live stream, and join the Jiujiu chat group to get daily strategies 🚀
#MainnetActivationofTronTVM #BlaGraThisCompatibility #Robinhood #L2 #Ethereum #memeCoin
Launched just two months ago, Robinhood Chain’s revenue beats Ethereum—yet 88% comes from meme coins. How long can this last?
👉 Robinhood Chain逆袭,进群聊
Robinhood Chain has only been live for two months. Its app made $2.66 million in daily revenue, surpassing Ethereum’s $1.27 million and Hyperliquid’s $1.70 million. The numbers look great, but if you break them down: Gmgn (a meme-coin trading terminal) contributed $1.11 million alone. Add Pons and Uniswap, and together they account for 88%.
In other words, this chain’s revenue is almost entirely driven by meme-coin trading. What’s the nature of meme coins? They come fast and go just as fast. Today, Gmgn accounts for 42%. Next month, if the meme craze fades, revenue could be cut by half immediately.
Think of it another way: Robinhood Chain’s real ace isn’t revenue—it’s the “traffic entry point.” Tens of millions of retail users can get on-chain and trade without having to learn wallets. This is exactly what Ethereum lacks most. Revenue is meme-driven, but user stickiness is real.
So the question isn’t “Can Robinhood Chain surpass Ethereum?” It’s “When the meme tide goes out, will its users stay?” If they stay, a new king of L2 emerges; if they don’t, it’s just another fireworks show.
Can Robinhood Chain really threaten Ethereum? Let’s discuss in the comments 👇
Click the profile picture to watch the live stream, and join the Jiujiu chat group to get daily strategies 🚀
#MainnetActivationofTronTVM #BlaGraThisCompatibility #Robinhood #L2 #Ethereum #memeCoin

Verified
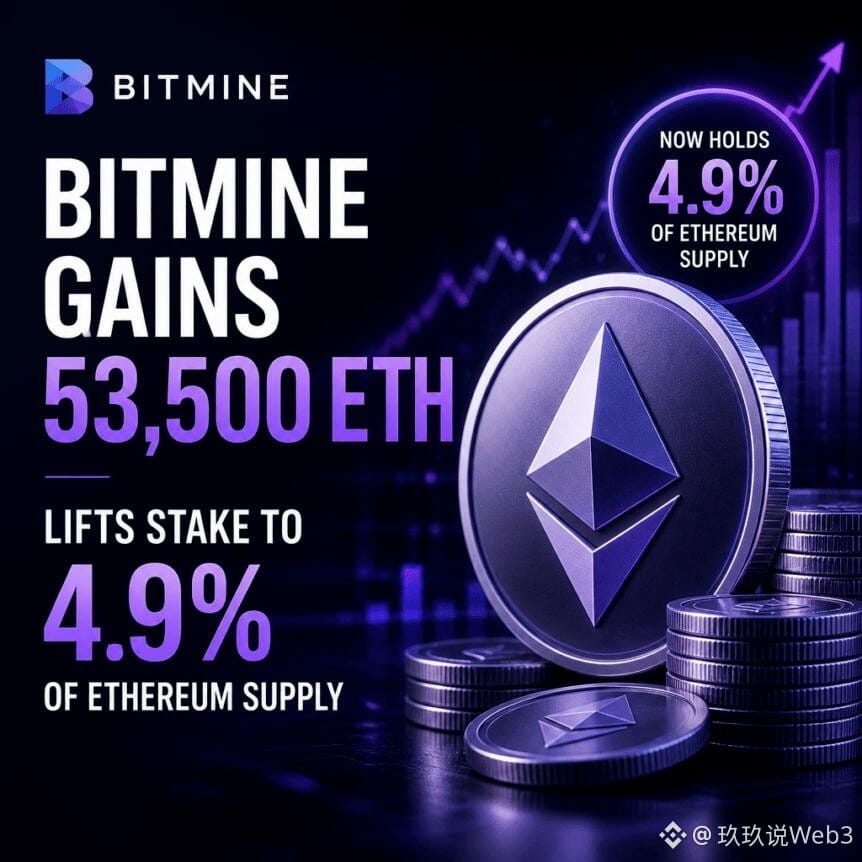
🚨 A mining company has been buying ETH for 65 straight weeks—adding another 53,500 ETH in the latest week to raise its holdings to about 4.9% of Ethereum’s total supply. What exactly have they been seeing?
Group: 点击进入玖玖的粉丝群
Bitmine Immersion Technologies, a Bitcoin mining company, bought another 53,500 ETH in the most recent week, pushing its holdings to roughly 4.9% of Ethereum’s total supply. And this rhythm has not been broken for 65 consecutive weeks. Week after week—no deviations. It’s more mechanical than DCA; even ETH price pullbacks haven’t shaken their hand.
Let’s make the numbers concrete: Ethereum’s total supply is about 120 million ETH. 4.9% is nearly 6 million ETH. At current prices, that’s a position in the tens of billions of dollars. Instead of selling, the mining firm keeps replenishing—suggesting it treats ETH as a long-term core asset to hoard, not something to trade for short-term swings. This “only buy, never sell” accumulation pattern is clearly visible in on-chain data.
Cross-check: Strategy’s BTC holdings are also continuously increasing. Institutional-grade “buy only, never sell” is becoming a mainstream narrative. Miners and listed companies hoarding coins at the same time means more supply keeps getting locked away—an often-typical sign of a cycle bottom. When the smart money is quietly accumulating while retail investors still hesitate, history often flips in just this way.
Risk warning: Continuous buying doesn’t mean the price will rise immediately. Institutions can get trapped too. Don’t blindly follow—position management always comes first.
👀 Adding to ETH for 65 straight weeks—do you think this is smart DCA or just stubborn holding? See you in the comments!
Click the profile to watch the livestream and join the Jiujiu chat group to get daily strategy 🚀
#以太坊 #ETH #机构持仓 #矿业公司 #Bitcoin
Group: 点击进入玖玖的粉丝群
Bitmine Immersion Technologies, a Bitcoin mining company, bought another 53,500 ETH in the most recent week, pushing its holdings to roughly 4.9% of Ethereum’s total supply. And this rhythm has not been broken for 65 consecutive weeks. Week after week—no deviations. It’s more mechanical than DCA; even ETH price pullbacks haven’t shaken their hand.
Let’s make the numbers concrete: Ethereum’s total supply is about 120 million ETH. 4.9% is nearly 6 million ETH. At current prices, that’s a position in the tens of billions of dollars. Instead of selling, the mining firm keeps replenishing—suggesting it treats ETH as a long-term core asset to hoard, not something to trade for short-term swings. This “only buy, never sell” accumulation pattern is clearly visible in on-chain data.
Cross-check: Strategy’s BTC holdings are also continuously increasing. Institutional-grade “buy only, never sell” is becoming a mainstream narrative. Miners and listed companies hoarding coins at the same time means more supply keeps getting locked away—an often-typical sign of a cycle bottom. When the smart money is quietly accumulating while retail investors still hesitate, history often flips in just this way.
Risk warning: Continuous buying doesn’t mean the price will rise immediately. Institutions can get trapped too. Don’t blindly follow—position management always comes first.
👀 Adding to ETH for 65 straight weeks—do you think this is smart DCA or just stubborn holding? See you in the comments!
Click the profile to watch the livestream and join the Jiujiu chat group to get daily strategy 🚀
#以太坊 #ETH #机构持仓 #矿业公司 #Bitcoin
Log in to explore more content