The script for catching dip #bitcoin I updated yesterday, March 10.
- The upper block of the blue box is 19.8k (fibo61.8 calculated from 16.3k);
- The lower block of the blue box is 19.2k (61.8 from the bottom of 15.5k);
If it falls, from a long-term investment perspective, don't worry because BTC is not a down trend. If it falls, it will move sideways according to some adjustment pattern.
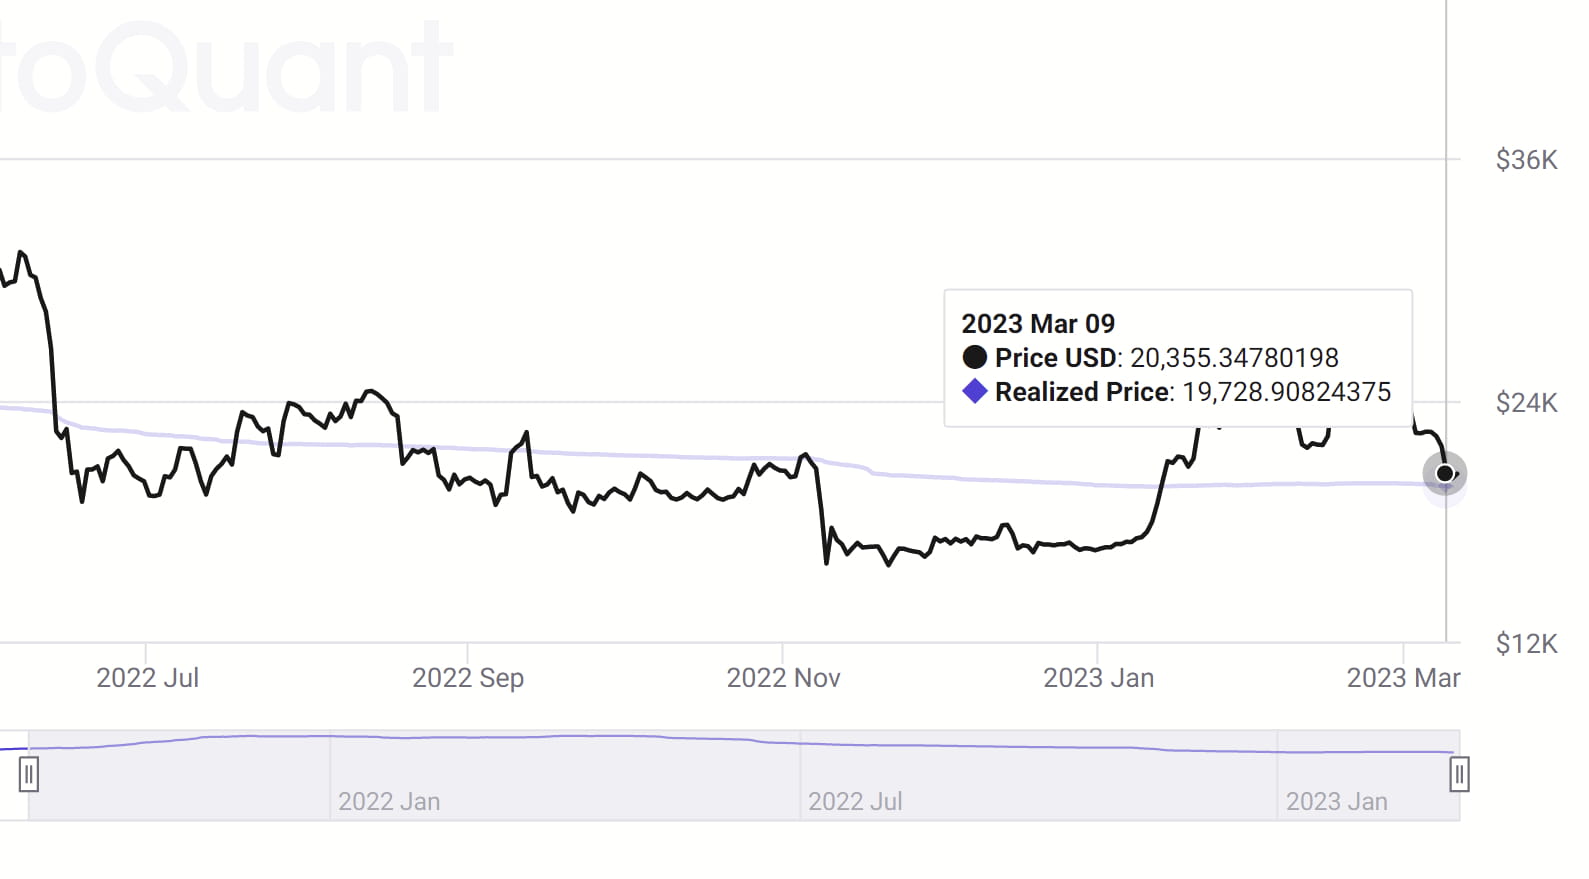
There is also an indicator that can be referenced to evaluate the annual support zone right at the 19.7k area, which is the Realized Price indicator, currently at 19.7k.
Before that, Bitcoin price was below Realized Price for a long time and Realized Price was like a resistance. From the beginning of next year, Bitcoin is currently above the Realized Price, so it will be a pretty good support level.
Note this update is on the short-term chart line to evaluate the 19.8k - 19.2k support area. In the immediate future, the price reaching this area will bounce back. If maintained well, it will likely increase sharply (beginning of wave 3 towards at least 28k).
In case more fud causes the price to fall below the green area, the market becomes sideways.