

furan
3.5k Posts

furan
 Square Verified+
Report
Block User
什么时候进圈的都忘了,不过币圈能经历的都经历了一遍,韭菜一根。发的所有帖子不构成投资建议。推特X同名。币安超级返佣邀请码:FURAN86999
Occasional Trader
2.8 Years
915 Following
60.6K+ Followers
44.5K+ Liked
Posts
All
Quotes
Videos
Live
·
--
Verified
Iran and the U.S. send a signal of easing; the market trades the idea of “cooling expectations” first
The situation between Iran and the U.S. has finally shown a bit of flexibility. The latest reports indicate that during the United Nations General Assembly in New York, the two sides held lengthy discussions. However, based on publicly available coverage, a more accurate description is that mediators have been shuttling messages between Iran and the U.S., and it is still not fully confirmed whether the “three-hour direct talks” mentioned in the images are indeed taking place. Trump later also said that the two sides were still negotiating that day and believed an agreement could ultimately be reached.
Iran’s core conditions remain clear: the U.S. should reduce military pressure and lift the port blockade, after which Iran could reopen the Strait of Hormuz within days. But the two sides have not yet reached a formal ceasefire, and neither has abandoned military options. So for now, it can only be considered that the diplomatic window has reopened—there’s still a long way to go before this is truly realized.
The market has already priced in easing expectations ahead of time. Brent crude has fallen for the fifth consecutive trading day, closing at $99.25 and slipping back below $100; WTI has dropped to $94.59. Saudi Arabia has also restarted its eastward oil pipeline network that bypasses the Strait of Hormuz, further weighing on the energy risk premium.
For the cryptocurrency market, a pullback in oil prices is beneficial for easing inflation pressure and can improve risk appetite. But the easiest mistake to make right now is to take “talks have started” as “the war is already over.” In the short term, you may be somewhat optimistic, but you cannot go all-in on positioning. What truly needs to be watched next is the ceasefire arrangement, the resumption of navigation through the strait, and whether sanctions are meaningfully eased. Diplomatic developments may trigger a rebound, but only when an agreement is actually implemented can the trend change.
Iran and the U.S. send a signal of easing; the market trades the idea of “cooling expectations” first
The situation between Iran and the U.S. has finally shown a bit of flexibility. The latest reports indicate that during the United Nations General Assembly in New York, the two sides held lengthy discussions. However, based on publicly available coverage, a more accurate description is that mediators have been shuttling messages between Iran and the U.S., and it is still not fully confirmed whether the “three-hour direct talks” mentioned in the images are indeed taking place. Trump later also said that the two sides were still negotiating that day and believed an agreement could ultimately be reached.
Iran’s core conditions remain clear: the U.S. should reduce military pressure and lift the port blockade, after which Iran could reopen the Strait of Hormuz within days. But the two sides have not yet reached a formal ceasefire, and neither has abandoned military options. So for now, it can only be considered that the diplomatic window has reopened—there’s still a long way to go before this is truly realized.
The market has already priced in easing expectations ahead of time. Brent crude has fallen for the fifth consecutive trading day, closing at $99.25 and slipping back below $100; WTI has dropped to $94.59. Saudi Arabia has also restarted its eastward oil pipeline network that bypasses the Strait of Hormuz, further weighing on the energy risk premium.
For the cryptocurrency market, a pullback in oil prices is beneficial for easing inflation pressure and can improve risk appetite. But the easiest mistake to make right now is to take “talks have started” as “the war is already over.” In the short term, you may be somewhat optimistic, but you cannot go all-in on positioning. What truly needs to be watched next is the ceasefire arrangement, the resumption of navigation through the strait, and whether sanctions are meaningfully eased. Diplomatic developments may trigger a rebound, but only when an agreement is actually implemented can the trend change.
The situation between Iran and the U.S. has finally shown a bit of flexibility. The latest reports indicate that during the United Nations General Assembly in New York, the two sides held lengthy discussions. However, based on publicly available coverage, a more accurate description is that mediators have been shuttling messages between Iran and the U.S., and it is still not fully confirmed whether the “three-hour direct talks” mentioned in the images are indeed taking place. Trump later also said that the two sides were still negotiating that day and believed an agreement could ultimately be reached.
Iran’s core conditions remain clear: the U.S. should reduce military pressure and lift the port blockade, after which Iran could reopen the Strait of Hormuz within days. But the two sides have not yet reached a formal ceasefire, and neither has abandoned military options. So for now, it can only be considered that the diplomatic window has reopened—there’s still a long way to go before this is truly realized.
The market has already priced in easing expectations ahead of time. Brent crude has fallen for the fifth consecutive trading day, closing at $99.25 and slipping back below $100; WTI has dropped to $94.59. Saudi Arabia has also restarted its eastward oil pipeline network that bypasses the Strait of Hormuz, further weighing on the energy risk premium.
For the cryptocurrency market, a pullback in oil prices is beneficial for easing inflation pressure and can improve risk appetite. But the easiest mistake to make right now is to take “talks have started” as “the war is already over.” In the short term, you may be somewhat optimistic, but you cannot go all-in on positioning. What truly needs to be watched next is the ceasefire arrangement, the resumption of navigation through the strait, and whether sanctions are meaningfully eased. Diplomatic developments may trigger a rebound, but only when an agreement is actually implemented can the trend change.

1
2
2k
·
--
BTC reclaims $87,000, this time it’s not just shorts getting squeezed
BTC briefly broke through $87,000, hitting its highest level in nearly eight months. It’s currently consolidating around $85,000. Major coins like ETH and SOL are also moving higher in sync, and the total market capitalization of the crypto market has once again climbed above $3 trillion.
There are two forces behind this rally. First, spot capital has returned. U.S. BTC spot ETFs saw total net inflows of about $593 million over Thursday and Friday, with Friday alone accounting for roughly $433 million. Second, a short squeeze: across the market, approximately $919 million in short positions were liquidated, and BTC shorts alone saw liquidations exceeding $557 million.
But I think we still can’t just look at the breakout and immediately call a bull market. Over the past week, BTC futures open interest grew by about 8%, rising to $55.7 billion. This suggests that after the old shorts were cleared, new leverage is entering quickly.
Next, the focus should be on two levels: whether $87,000 can flip from resistance to support, and whether ETFs can continue to maintain net inflows. Only if BTC holds above $87,000 does the market have the credentials to extend upward. If capital flows weaken and open interest continues to surge, be cautious—high leverage can trigger a second round of liquidations.
Personally, I wouldn’t blindly chase longs after a big bullish candle. I’m more inclined to wait for a pullback and confirmation. The trend has clearly strengthened, but for the rally to go far, it needs spot buying to carry it. If it relies only on shorts getting liquidated, it usually doesn’t stay stable. #比特币现货ETF净流入9.99亿美元
BTC reclaims $87,000, this time it’s not just shorts getting squeezed
BTC briefly broke through $87,000, hitting its highest level in nearly eight months. It’s currently consolidating around $85,000. Major coins like ETH and SOL are also moving higher in sync, and the total market capitalization of the crypto market has once again climbed above $3 trillion.
There are two forces behind this rally. First, spot capital has returned. U.S. BTC spot ETFs saw total net inflows of about $593 million over Thursday and Friday, with Friday alone accounting for roughly $433 million. Second, a short squeeze: across the market, approximately $919 million in short positions were liquidated, and BTC shorts alone saw liquidations exceeding $557 million.
But I think we still can’t just look at the breakout and immediately call a bull market. Over the past week, BTC futures open interest grew by about 8%, rising to $55.7 billion. This suggests that after the old shorts were cleared, new leverage is entering quickly.
Next, the focus should be on two levels: whether $87,000 can flip from resistance to support, and whether ETFs can continue to maintain net inflows. Only if BTC holds above $87,000 does the market have the credentials to extend upward. If capital flows weaken and open interest continues to surge, be cautious—high leverage can trigger a second round of liquidations.
Personally, I wouldn’t blindly chase longs after a big bullish candle. I’m more inclined to wait for a pullback and confirmation. The trend has clearly strengthened, but for the rally to go far, it needs spot buying to carry it. If it relies only on shorts getting liquidated, it usually doesn’t stay stable. #比特币现货ETF净流入9.99亿美元
BTC briefly broke through $87,000, hitting its highest level in nearly eight months. It’s currently consolidating around $85,000. Major coins like ETH and SOL are also moving higher in sync, and the total market capitalization of the crypto market has once again climbed above $3 trillion.
There are two forces behind this rally. First, spot capital has returned. U.S. BTC spot ETFs saw total net inflows of about $593 million over Thursday and Friday, with Friday alone accounting for roughly $433 million. Second, a short squeeze: across the market, approximately $919 million in short positions were liquidated, and BTC shorts alone saw liquidations exceeding $557 million.
But I think we still can’t just look at the breakout and immediately call a bull market. Over the past week, BTC futures open interest grew by about 8%, rising to $55.7 billion. This suggests that after the old shorts were cleared, new leverage is entering quickly.
Next, the focus should be on two levels: whether $87,000 can flip from resistance to support, and whether ETFs can continue to maintain net inflows. Only if BTC holds above $87,000 does the market have the credentials to extend upward. If capital flows weaken and open interest continues to surge, be cautious—high leverage can trigger a second round of liquidations.
Personally, I wouldn’t blindly chase longs after a big bullish candle. I’m more inclined to wait for a pullback and confirmation. The trend has clearly strengthened, but for the rally to go far, it needs spot buying to carry it. If it relies only on shorts getting liquidated, it usually doesn’t stay stable. #比特币现货ETF净流入9.99亿美元

3
1.2k
·
--
Cryptocurrency total market cap is nearing $2.9 trillion—has rotation finally arrived?
This rebound is no longer just BTC propping up the market.
Latest data shows the crypto market’s total market cap has recovered to about $2.89 trillion, with a near 3% gain over the past 24 hours. BTC is back above $82,000, with a market share of roughly 56.7%. After excluding BTC, the total market cap of other crypto assets is approximately $1.25 trillion, indicating that incremental capital really has started spreading out into altcoins.
Market performance is also more direct: ETH is back around $2,670, HYPE is up more than 4%, and ZEC is up more than 4%. NEAR is up about 24% in a day, AVAX is up about 15%, and XRP is also up around 5%. The market is gradually shifting from “BTC leading alone” to multiple sectors moving at the same time.
That said, it’s still too early to call for an “altcoin season” right now. BTC’s market share remains close to 57%, which suggests that investors’ core holdings are still concentrated in BTC. What we should truly watch next isn’t whether total market cap can temporarily touch $2.9 trillion, but whether—while BTC goes sideways—market cap outside BTC can consistently hold above $1.2 trillion and continue rising on expanding volume.
If that happens, then that would be real capital rotation. If BTC pulls back slightly and altcoins collectively dump, then this round is more likely still just an oversold bounce. For now, I’ll continue to stay bullish, but I won’t chase highs just because of a few big green candles.$BTC
{future}(BTCUSDT)
$ZEC
{future}(ZECUSDT)
$ETH
{future}(ETHUSDT)
Cryptocurrency total market cap is nearing $2.9 trillion—has rotation finally arrived?
This rebound is no longer just BTC propping up the market.
Latest data shows the crypto market’s total market cap has recovered to about $2.89 trillion, with a near 3% gain over the past 24 hours. BTC is back above $82,000, with a market share of roughly 56.7%. After excluding BTC, the total market cap of other crypto assets is approximately $1.25 trillion, indicating that incremental capital really has started spreading out into altcoins.
Market performance is also more direct: ETH is back around $2,670, HYPE is up more than 4%, and ZEC is up more than 4%. NEAR is up about 24% in a day, AVAX is up about 15%, and XRP is also up around 5%. The market is gradually shifting from “BTC leading alone” to multiple sectors moving at the same time.
That said, it’s still too early to call for an “altcoin season” right now. BTC’s market share remains close to 57%, which suggests that investors’ core holdings are still concentrated in BTC. What we should truly watch next isn’t whether total market cap can temporarily touch $2.9 trillion, but whether—while BTC goes sideways—market cap outside BTC can consistently hold above $1.2 trillion and continue rising on expanding volume.
If that happens, then that would be real capital rotation. If BTC pulls back slightly and altcoins collectively dump, then this round is more likely still just an oversold bounce. For now, I’ll continue to stay bullish, but I won’t chase highs just because of a few big green candles.$BTC
$ZEC
$ETH
This rebound is no longer just BTC propping up the market.
Latest data shows the crypto market’s total market cap has recovered to about $2.89 trillion, with a near 3% gain over the past 24 hours. BTC is back above $82,000, with a market share of roughly 56.7%. After excluding BTC, the total market cap of other crypto assets is approximately $1.25 trillion, indicating that incremental capital really has started spreading out into altcoins.
Market performance is also more direct: ETH is back around $2,670, HYPE is up more than 4%, and ZEC is up more than 4%. NEAR is up about 24% in a day, AVAX is up about 15%, and XRP is also up around 5%. The market is gradually shifting from “BTC leading alone” to multiple sectors moving at the same time.
That said, it’s still too early to call for an “altcoin season” right now. BTC’s market share remains close to 57%, which suggests that investors’ core holdings are still concentrated in BTC. What we should truly watch next isn’t whether total market cap can temporarily touch $2.9 trillion, but whether—while BTC goes sideways—market cap outside BTC can consistently hold above $1.2 trillion and continue rising on expanding volume.
If that happens, then that would be real capital rotation. If BTC pulls back slightly and altcoins collectively dump, then this round is more likely still just an oversold bounce. For now, I’ll continue to stay bullish, but I won’t chase highs just because of a few big green candles.$BTC
$ZEC
$ETH

3k
·
--
BTC holds above $80,000, but it’s not time to be fully optimistic yet
After BTC reclaimed the $80,000 level, it is currently consolidating around $80,400. During the day, it briefly touched $81,859. ETH has pulled back to around $2,580, while SOL is about $108.5. Compared with BTC’s less than 1% decline, the pullbacks in ETH and SOL are more pronounced. This suggests that although the current move has spread, the market has not yet formed a stable consensus of broad-based gains.
Market liquidity has indeed improved. On September 17, the U.S. spot BTC ETF saw net inflows of about $159 million, including BlackRock’s IBIT with inflows of roughly $184 million. However, this is not the $433 million stated in the image. Also, when BTC broke above $80,000 earlier, part of the momentum came from ETF flows turning back to net inflows and improved expectations around regulation.
I don’t think we can judge the trend has fully reversed just because BTC has “reclaimed $80,000.” There is still overhead pressure around $81,800–$82,000. On the downside, we should first see whether the market can repeatedly hold $80,000. As long as BTC does not fall back below $80,000, ETH, SOL, and other major coins still have opportunities to rotate upward. If BTC loses $80,000 again, altcoins typically retrace faster.
So my current strategy is not to chase. I’m waiting for a pullback and confirmation. Right now, it looks more like a probing phase after risk appetite has been repaired. What ultimately determines whether the market can continue higher is whether ETF inflows can be sustained, and whether BTC can turn the $80,000 breakout from a short-term move into an effective support level.#比特币突破8万美元大关
BTC holds above $80,000, but it’s not time to be fully optimistic yet
After BTC reclaimed the $80,000 level, it is currently consolidating around $80,400. During the day, it briefly touched $81,859. ETH has pulled back to around $2,580, while SOL is about $108.5. Compared with BTC’s less than 1% decline, the pullbacks in ETH and SOL are more pronounced. This suggests that although the current move has spread, the market has not yet formed a stable consensus of broad-based gains.
Market liquidity has indeed improved. On September 17, the U.S. spot BTC ETF saw net inflows of about $159 million, including BlackRock’s IBIT with inflows of roughly $184 million. However, this is not the $433 million stated in the image. Also, when BTC broke above $80,000 earlier, part of the momentum came from ETF flows turning back to net inflows and improved expectations around regulation.
I don’t think we can judge the trend has fully reversed just because BTC has “reclaimed $80,000.” There is still overhead pressure around $81,800–$82,000. On the downside, we should first see whether the market can repeatedly hold $80,000. As long as BTC does not fall back below $80,000, ETH, SOL, and other major coins still have opportunities to rotate upward. If BTC loses $80,000 again, altcoins typically retrace faster.
So my current strategy is not to chase. I’m waiting for a pullback and confirmation. Right now, it looks more like a probing phase after risk appetite has been repaired. What ultimately determines whether the market can continue higher is whether ETF inflows can be sustained, and whether BTC can turn the $80,000 breakout from a short-term move into an effective support level.#比特币突破8万美元大关
After BTC reclaimed the $80,000 level, it is currently consolidating around $80,400. During the day, it briefly touched $81,859. ETH has pulled back to around $2,580, while SOL is about $108.5. Compared with BTC’s less than 1% decline, the pullbacks in ETH and SOL are more pronounced. This suggests that although the current move has spread, the market has not yet formed a stable consensus of broad-based gains.
Market liquidity has indeed improved. On September 17, the U.S. spot BTC ETF saw net inflows of about $159 million, including BlackRock’s IBIT with inflows of roughly $184 million. However, this is not the $433 million stated in the image. Also, when BTC broke above $80,000 earlier, part of the momentum came from ETF flows turning back to net inflows and improved expectations around regulation.
I don’t think we can judge the trend has fully reversed just because BTC has “reclaimed $80,000.” There is still overhead pressure around $81,800–$82,000. On the downside, we should first see whether the market can repeatedly hold $80,000. As long as BTC does not fall back below $80,000, ETH, SOL, and other major coins still have opportunities to rotate upward. If BTC loses $80,000 again, altcoins typically retrace faster.
So my current strategy is not to chase. I’m waiting for a pullback and confirmation. Right now, it looks more like a probing phase after risk appetite has been repaired. What ultimately determines whether the market can continue higher is whether ETF inflows can be sustained, and whether BTC can turn the $80,000 breakout from a short-term move into an effective support level.#比特币突破8万美元大关

1
3
886
·
--
BTC returns to $80,000—this time it’s not just a technical rebound
This rebound in BTC is indeed interesting.
A few days ago, the market was still worried about regulatory headwinds and another Federal Reserve rate hike. BTC even fell to around $75,000; now the price has already reclaimed $81,000. In the past 24 hours, it’s up about 4.2%, with an intraday high of $81,618.
More importantly, capital is starting to come back. After two consecutive days of outflows, U.S. spot Bitcoin ETFs recorded roughly a net inflow of about $160 million again on Thursday. Meanwhile, risk appetite has also spilled over into U.S. equities: Coinbase rose about 11.7% in a day, Strategy was up about 16.4%, and MARA climbed about 13.7%. This suggests the current rebound is not driven solely by derivatives/liquidity from futures—spot BTC and related stocks are both repairing in sync.
However, calling it a full reversal right now still feels too early. The Federal Reserve has just completed its first rate hike in three years, and long-term U.S. Treasury yields remain elevated. Macro liquidity is not loose. BTC reclaiming $80,000 under these conditions shows that buy support underneath is certainly strong; but whether it can hold above the 50-week moving average and whether ETF inflows can remain net-positive for multiple consecutive days are the more important confirmation signals for what comes next.
In the short term, it looks like a technical repair; in the mid term, what matters is the continuity of capital. Breaking through for one day isn’t hard—the real challenge is holding the level. #比特币突破8万美元大关
BTC returns to $80,000—this time it’s not just a technical rebound
This rebound in BTC is indeed interesting.
A few days ago, the market was still worried about regulatory headwinds and another Federal Reserve rate hike. BTC even fell to around $75,000; now the price has already reclaimed $81,000. In the past 24 hours, it’s up about 4.2%, with an intraday high of $81,618.
More importantly, capital is starting to come back. After two consecutive days of outflows, U.S. spot Bitcoin ETFs recorded roughly a net inflow of about $160 million again on Thursday. Meanwhile, risk appetite has also spilled over into U.S. equities: Coinbase rose about 11.7% in a day, Strategy was up about 16.4%, and MARA climbed about 13.7%. This suggests the current rebound is not driven solely by derivatives/liquidity from futures—spot BTC and related stocks are both repairing in sync.
However, calling it a full reversal right now still feels too early. The Federal Reserve has just completed its first rate hike in three years, and long-term U.S. Treasury yields remain elevated. Macro liquidity is not loose. BTC reclaiming $80,000 under these conditions shows that buy support underneath is certainly strong; but whether it can hold above the 50-week moving average and whether ETF inflows can remain net-positive for multiple consecutive days are the more important confirmation signals for what comes next.
In the short term, it looks like a technical repair; in the mid term, what matters is the continuity of capital. Breaking through for one day isn’t hard—the real challenge is holding the level. #比特币突破8万美元大关
This rebound in BTC is indeed interesting.
A few days ago, the market was still worried about regulatory headwinds and another Federal Reserve rate hike. BTC even fell to around $75,000; now the price has already reclaimed $81,000. In the past 24 hours, it’s up about 4.2%, with an intraday high of $81,618.
More importantly, capital is starting to come back. After two consecutive days of outflows, U.S. spot Bitcoin ETFs recorded roughly a net inflow of about $160 million again on Thursday. Meanwhile, risk appetite has also spilled over into U.S. equities: Coinbase rose about 11.7% in a day, Strategy was up about 16.4%, and MARA climbed about 13.7%. This suggests the current rebound is not driven solely by derivatives/liquidity from futures—spot BTC and related stocks are both repairing in sync.
However, calling it a full reversal right now still feels too early. The Federal Reserve has just completed its first rate hike in three years, and long-term U.S. Treasury yields remain elevated. Macro liquidity is not loose. BTC reclaiming $80,000 under these conditions shows that buy support underneath is certainly strong; but whether it can hold above the 50-week moving average and whether ETF inflows can remain net-positive for multiple consecutive days are the more important confirmation signals for what comes next.
In the short term, it looks like a technical repair; in the mid term, what matters is the continuity of capital. Breaking through for one day isn’t hard—the real challenge is holding the level. #比特币突破8万美元大关

3
5
2.2k
·
--
The Federal Reserve’s first rate hike in three years—what’s truly worrying isn’t these 25 basis points, but that the familiar rate-cut logic the market has grown used to may already have stopped working.
This time, the interest rate was raised to 3.75%—4.00%, passing with all 12 votes. More hawkish is the dot plot: of 18 officials, 16 expect at least one more rate hike this year. This indicates it isn’t a simple “correction”—it’s telling the market that as long as inflation can’t be brought down, high interest rates will remain.
The market reaction was equally direct. The Dow fell by about 631 points, the S&P dropped 0.45%, the yield on the 10-year U.S. Treasury climbed above 5%, and the dollar strengthened. What is now truly suppressing risk assets isn’t only the policy rate—it’s that the risk-free yield is too high. When you can earn nearly 5% just by holding U.S. Treasuries, overvalued stocks and some altcoins must demand even higher growth expectations to attract capital.
Interestingly, though, BTC is still around $76,000 and hasn’t followed U.S. equities into a clear selloff. My take is that a 25-basis-point hike has long been priced in by the market; what funds are really waiting for is when the next hike will actually be implemented.
So don’t just focus on the idea that “a rate hike becoming effective is bad news already being priced in.” Next, watch whether the U.S. dollar, Treasury yields, and BTC can keep showing this kind of divergence. If the 10-year Treasury yield continues to surge and the dollar strengthens in tandem, the crypto market’s current resilience may only mean the pressure hasn’t finished transmitting yet. #美联储加息25基点美股收跌
The Federal Reserve’s first rate hike in three years—what’s truly worrying isn’t these 25 basis points, but that the familiar rate-cut logic the market has grown used to may already have stopped working.
This time, the interest rate was raised to 3.75%—4.00%, passing with all 12 votes. More hawkish is the dot plot: of 18 officials, 16 expect at least one more rate hike this year. This indicates it isn’t a simple “correction”—it’s telling the market that as long as inflation can’t be brought down, high interest rates will remain.
The market reaction was equally direct. The Dow fell by about 631 points, the S&P dropped 0.45%, the yield on the 10-year U.S. Treasury climbed above 5%, and the dollar strengthened. What is now truly suppressing risk assets isn’t only the policy rate—it’s that the risk-free yield is too high. When you can earn nearly 5% just by holding U.S. Treasuries, overvalued stocks and some altcoins must demand even higher growth expectations to attract capital.
Interestingly, though, BTC is still around $76,000 and hasn’t followed U.S. equities into a clear selloff. My take is that a 25-basis-point hike has long been priced in by the market; what funds are really waiting for is when the next hike will actually be implemented.
So don’t just focus on the idea that “a rate hike becoming effective is bad news already being priced in.” Next, watch whether the U.S. dollar, Treasury yields, and BTC can keep showing this kind of divergence. If the 10-year Treasury yield continues to surge and the dollar strengthens in tandem, the crypto market’s current resilience may only mean the pressure hasn’t finished transmitting yet. #美联储加息25基点美股收跌
This time, the interest rate was raised to 3.75%—4.00%, passing with all 12 votes. More hawkish is the dot plot: of 18 officials, 16 expect at least one more rate hike this year. This indicates it isn’t a simple “correction”—it’s telling the market that as long as inflation can’t be brought down, high interest rates will remain.
The market reaction was equally direct. The Dow fell by about 631 points, the S&P dropped 0.45%, the yield on the 10-year U.S. Treasury climbed above 5%, and the dollar strengthened. What is now truly suppressing risk assets isn’t only the policy rate—it’s that the risk-free yield is too high. When you can earn nearly 5% just by holding U.S. Treasuries, overvalued stocks and some altcoins must demand even higher growth expectations to attract capital.
Interestingly, though, BTC is still around $76,000 and hasn’t followed U.S. equities into a clear selloff. My take is that a 25-basis-point hike has long been priced in by the market; what funds are really waiting for is when the next hike will actually be implemented.
So don’t just focus on the idea that “a rate hike becoming effective is bad news already being priced in.” Next, watch whether the U.S. dollar, Treasury yields, and BTC can keep showing this kind of divergence. If the 10-year Treasury yield continues to surge and the dollar strengthens in tandem, the crypto market’s current resilience may only mean the pressure hasn’t finished transmitting yet. #美联储加息25基点美股收跌

8
4.4k
·
--
Clarity blocked: What the market is really hitting isn’t the bill, but “certainty”
The U.S. Senate isn’t conducting a final vote on the Digital Asset Market Clarity Act; instead, it’s holding a procedural vote to decide whether the measure can enter formal consideration. The outcome was 49 yeas and 50 nays—failing to reach the 60-vote threshold—so the bill is temporarily stalled, but that doesn’t mean it’s been completely killed. Republican Senator Tillis strategically voted no and moved to reconsider, theoretically leaving room for a restart. U.S. Senate records
What’s truly worth paying attention to is that this rift is no longer simply about “support or opposition to crypto.” The dispute centers on alleged crypto-related conflicts of interest involving the Trump family, whether stablecoin incentives would divert bank deposits, the authority of state attorneys general to enforce laws, and whether the CFTC has enough resources to take on additional regulatory responsibilities. In plain terms: everyone wants a regulatory framework, but banks, politicians, and crypto businesses all want the rules to be more favorable to themselves.
The market reaction has been very straightforward. BTC briefly dipped to around $75,000 during the day and is still near $75,800; Coinbase is down about 10%, and Circle is down more than 11%. Reuters reported
Interestingly, crypto stocks fell harder than BTC. The reason isn’t complicated: in the U.S., Bitcoin has already gained a relatively clear commodity-like status, but trading platforms, stablecoin issuers, and a large number of altcoins are the assets that truly depend on how the SEC and the CFTC split the regulatory boundary.
So this selloff isn’t really the market pricing in “crypto being rejected by the U.S.” Rather, it’s the reality that congressional legislation may continue to drag on, leaving the industry to rely on SEC and CFTC administrative rules. Administrative rules can move faster, but they’re also more likely to change with political leadership turnovers.
In the short term, this is clearly a negative. But since the bill still has room for reconsideration, you shouldn’t conclude that America’s regulatory path has been completely reversed based on a single procedural vote. What will genuinely move the market next is whether the two parties can renegotiate, and whether the macro environment can hold steady. What’s most dangerous right now is treating political news as a reason to go all-in on a single direction. #美参议院否决CLARITY法案
Clarity blocked: What the market is really hitting isn’t the bill, but “certainty”
The U.S. Senate isn’t conducting a final vote on the Digital Asset Market Clarity Act; instead, it’s holding a procedural vote to decide whether the measure can enter formal consideration. The outcome was 49 yeas and 50 nays—failing to reach the 60-vote threshold—so the bill is temporarily stalled, but that doesn’t mean it’s been completely killed. Republican Senator Tillis strategically voted no and moved to reconsider, theoretically leaving room for a restart. U.S. Senate records
What’s truly worth paying attention to is that this rift is no longer simply about “support or opposition to crypto.” The dispute centers on alleged crypto-related conflicts of interest involving the Trump family, whether stablecoin incentives would divert bank deposits, the authority of state attorneys general to enforce laws, and whether the CFTC has enough resources to take on additional regulatory responsibilities. In plain terms: everyone wants a regulatory framework, but banks, politicians, and crypto businesses all want the rules to be more favorable to themselves.
The market reaction has been very straightforward. BTC briefly dipped to around $75,000 during the day and is still near $75,800; Coinbase is down about 10%, and Circle is down more than 11%. Reuters reported
Interestingly, crypto stocks fell harder than BTC. The reason isn’t complicated: in the U.S., Bitcoin has already gained a relatively clear commodity-like status, but trading platforms, stablecoin issuers, and a large number of altcoins are the assets that truly depend on how the SEC and the CFTC split the regulatory boundary.
So this selloff isn’t really the market pricing in “crypto being rejected by the U.S.” Rather, it’s the reality that congressional legislation may continue to drag on, leaving the industry to rely on SEC and CFTC administrative rules. Administrative rules can move faster, but they’re also more likely to change with political leadership turnovers.
In the short term, this is clearly a negative. But since the bill still has room for reconsideration, you shouldn’t conclude that America’s regulatory path has been completely reversed based on a single procedural vote. What will genuinely move the market next is whether the two parties can renegotiate, and whether the macro environment can hold steady. What’s most dangerous right now is treating political news as a reason to go all-in on a single direction. #美参议院否决CLARITY法案
The U.S. Senate isn’t conducting a final vote on the Digital Asset Market Clarity Act; instead, it’s holding a procedural vote to decide whether the measure can enter formal consideration. The outcome was 49 yeas and 50 nays—failing to reach the 60-vote threshold—so the bill is temporarily stalled, but that doesn’t mean it’s been completely killed. Republican Senator Tillis strategically voted no and moved to reconsider, theoretically leaving room for a restart. U.S. Senate records
What’s truly worth paying attention to is that this rift is no longer simply about “support or opposition to crypto.” The dispute centers on alleged crypto-related conflicts of interest involving the Trump family, whether stablecoin incentives would divert bank deposits, the authority of state attorneys general to enforce laws, and whether the CFTC has enough resources to take on additional regulatory responsibilities. In plain terms: everyone wants a regulatory framework, but banks, politicians, and crypto businesses all want the rules to be more favorable to themselves.
The market reaction has been very straightforward. BTC briefly dipped to around $75,000 during the day and is still near $75,800; Coinbase is down about 10%, and Circle is down more than 11%. Reuters reported
Interestingly, crypto stocks fell harder than BTC. The reason isn’t complicated: in the U.S., Bitcoin has already gained a relatively clear commodity-like status, but trading platforms, stablecoin issuers, and a large number of altcoins are the assets that truly depend on how the SEC and the CFTC split the regulatory boundary.
So this selloff isn’t really the market pricing in “crypto being rejected by the U.S.” Rather, it’s the reality that congressional legislation may continue to drag on, leaving the industry to rely on SEC and CFTC administrative rules. Administrative rules can move faster, but they’re also more likely to change with political leadership turnovers.
In the short term, this is clearly a negative. But since the bill still has room for reconsideration, you shouldn’t conclude that America’s regulatory path has been completely reversed based on a single procedural vote. What will genuinely move the market next is whether the two parties can renegotiate, and whether the macro environment can hold steady. What’s most dangerous right now is treating political news as a reason to go all-in on a single direction. #美参议院否决CLARITY法案

2
4
3.7k
·
--
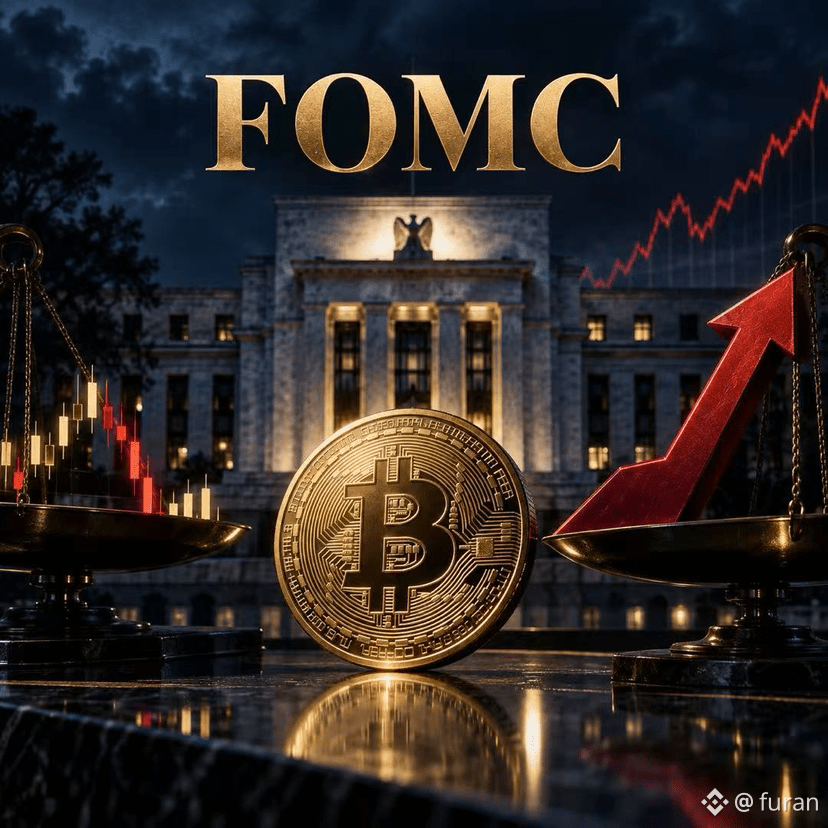
This week’s FOMC is indeed a bit special. The Federal Reserve will release the interest rate decision and economic projections at around 12:00 a.m. Beijing time on September 17. In the market, pricing for a 25-basis-point hike is already up to about 95%. Major institutions such as Goldman Sachs and JPMorgan have also shifted toward expectations of a rate hike. The interest rate range could rise to 3.75%—4.00%.
The reasons are straightforward: the U.S. August CPI rose 0.4% month-over-month and 3.4% year-over-year, while the PPI year-over-year reached as high as 5.4%. Combined with oil prices moving back up, inflation pressure clearly hasn’t gone away.
But I think that the rate hike itself may have largely been priced in by the market in advance. What will truly determine the next phase is the dot plot and the Fed’s remarks about the number of hikes in the future. If it’s just a 25-basis-point increase while releasing cautious signals, then after the bearish news is absorbed, risk assets may actually rebound. If it hints at a new round of consecutive hikes, then the market may only start trimming valuations again.
Currently, the 10-year U.S. Treasury yield is already near 5%, and the U.S. dollar index is around 99.55. BTC is about $77,570, and ETH is about $2,495.
So tonight is not a good time to place a directional bet early. The first wave of volatility is likely a false move. Listen first to what the Fed actually says, and then see whether BTC can hold above $77,000—more important than guessing whether it will rise or fall.#比特币现货ETF净流入1.6亿美元
This week’s FOMC is indeed a bit special. The Federal Reserve will release the interest rate decision and economic projections at around 12:00 a.m. Beijing time on September 17. In the market, pricing for a 25-basis-point hike is already up to about 95%. Major institutions such as Goldman Sachs and JPMorgan have also shifted toward expectations of a rate hike. The interest rate range could rise to 3.75%—4.00%.
The reasons are straightforward: the U.S. August CPI rose 0.4% month-over-month and 3.4% year-over-year, while the PPI year-over-year reached as high as 5.4%. Combined with oil prices moving back up, inflation pressure clearly hasn’t gone away.
But I think that the rate hike itself may have largely been priced in by the market in advance. What will truly determine the next phase is the dot plot and the Fed’s remarks about the number of hikes in the future. If it’s just a 25-basis-point increase while releasing cautious signals, then after the bearish news is absorbed, risk assets may actually rebound. If it hints at a new round of consecutive hikes, then the market may only start trimming valuations again.
Currently, the 10-year U.S. Treasury yield is already near 5%, and the U.S. dollar index is around 99.55. BTC is about $77,570, and ETH is about $2,495.
So tonight is not a good time to place a directional bet early. The first wave of volatility is likely a false move. Listen first to what the Fed actually says, and then see whether BTC can hold above $77,000—more important than guessing whether it will rise or fall.#比特币现货ETF净流入1.6亿美元
The reasons are straightforward: the U.S. August CPI rose 0.4% month-over-month and 3.4% year-over-year, while the PPI year-over-year reached as high as 5.4%. Combined with oil prices moving back up, inflation pressure clearly hasn’t gone away.
But I think that the rate hike itself may have largely been priced in by the market in advance. What will truly determine the next phase is the dot plot and the Fed’s remarks about the number of hikes in the future. If it’s just a 25-basis-point increase while releasing cautious signals, then after the bearish news is absorbed, risk assets may actually rebound. If it hints at a new round of consecutive hikes, then the market may only start trimming valuations again.
Currently, the 10-year U.S. Treasury yield is already near 5%, and the U.S. dollar index is around 99.55. BTC is about $77,570, and ETH is about $2,495.
So tonight is not a good time to place a directional bet early. The first wave of volatility is likely a false move. Listen first to what the Fed actually says, and then see whether BTC can hold above $77,000—more important than guessing whether it will rise or fall.#比特币现货ETF净流入1.6亿美元
5
1.1k
·
--
ETF funds haven’t been fully unwound, but BTC has been held down by macro conditions first
What’s most notable about Bitcoin over the past couple of days isn’t that ETF inflows turned negative on a single day—it’s that money flows and price have started to diverge.
From September 2 to 4, U.S. spot Bitcoin ETFs saw net inflows for three straight trading days, totaling about $1.007 billion. Of that, the daily inflow on September 3 was about $731 million. By September 8, the overall flow flipped to a net outflow of $46.6 million. The main pressure came from GBTC, which saw a $65.5 million outflow; meanwhile, IBIT, BITB, and ARKB still remained net inflows.
So this turn to negative isn’t something you can directly interpret as institutions fully retreating. It’s more like capital is becoming segmented across different products. The issue is that BTC is already down to around $78.1k, and intraday it briefly probed as low as $77.8k—suggesting that the previous days’ ETF buying of more than $1 billion did not immediately translate into price strength.
The reason isn’t hard to find. Brent crude has moved back above $100, U.S. 10-year Treasury yields have risen to around 4.84%, and market pricing for a September Fed rate hike at one point reached 60%. The next PPI and CPI data—those will be the real variables determining the direction of risk assets.
My view is that BTC isn’t lacking long-term capital buyers; rather, near-term macro selling pressure is stronger. A single-day ETF outflow of $46.6 million isn’t scary. What’s scary is if oil prices, inflation expectations, and interest-rate expectations continue rising all at once.
In the short term, focus on whether $78k can hold, then watch whether ETF outflows continue day after day. A one-day flip to negative counts as normal fluctuation. But if the price breaks down and ETFs keep bleeding continuously, that’s the signal you’d truly need to reduce positions. #比特币突破79000美元
ETF funds haven’t been fully unwound, but BTC has been held down by macro conditions first
What’s most notable about Bitcoin over the past couple of days isn’t that ETF inflows turned negative on a single day—it’s that money flows and price have started to diverge.
From September 2 to 4, U.S. spot Bitcoin ETFs saw net inflows for three straight trading days, totaling about $1.007 billion. Of that, the daily inflow on September 3 was about $731 million. By September 8, the overall flow flipped to a net outflow of $46.6 million. The main pressure came from GBTC, which saw a $65.5 million outflow; meanwhile, IBIT, BITB, and ARKB still remained net inflows.
So this turn to negative isn’t something you can directly interpret as institutions fully retreating. It’s more like capital is becoming segmented across different products. The issue is that BTC is already down to around $78.1k, and intraday it briefly probed as low as $77.8k—suggesting that the previous days’ ETF buying of more than $1 billion did not immediately translate into price strength.
The reason isn’t hard to find. Brent crude has moved back above $100, U.S. 10-year Treasury yields have risen to around 4.84%, and market pricing for a September Fed rate hike at one point reached 60%. The next PPI and CPI data—those will be the real variables determining the direction of risk assets.
My view is that BTC isn’t lacking long-term capital buyers; rather, near-term macro selling pressure is stronger. A single-day ETF outflow of $46.6 million isn’t scary. What’s scary is if oil prices, inflation expectations, and interest-rate expectations continue rising all at once.
In the short term, focus on whether $78k can hold, then watch whether ETF outflows continue day after day. A one-day flip to negative counts as normal fluctuation. But if the price breaks down and ETFs keep bleeding continuously, that’s the signal you’d truly need to reduce positions. #比特币突破79000美元
What’s most notable about Bitcoin over the past couple of days isn’t that ETF inflows turned negative on a single day—it’s that money flows and price have started to diverge.
From September 2 to 4, U.S. spot Bitcoin ETFs saw net inflows for three straight trading days, totaling about $1.007 billion. Of that, the daily inflow on September 3 was about $731 million. By September 8, the overall flow flipped to a net outflow of $46.6 million. The main pressure came from GBTC, which saw a $65.5 million outflow; meanwhile, IBIT, BITB, and ARKB still remained net inflows.
So this turn to negative isn’t something you can directly interpret as institutions fully retreating. It’s more like capital is becoming segmented across different products. The issue is that BTC is already down to around $78.1k, and intraday it briefly probed as low as $77.8k—suggesting that the previous days’ ETF buying of more than $1 billion did not immediately translate into price strength.
The reason isn’t hard to find. Brent crude has moved back above $100, U.S. 10-year Treasury yields have risen to around 4.84%, and market pricing for a September Fed rate hike at one point reached 60%. The next PPI and CPI data—those will be the real variables determining the direction of risk assets.
My view is that BTC isn’t lacking long-term capital buyers; rather, near-term macro selling pressure is stronger. A single-day ETF outflow of $46.6 million isn’t scary. What’s scary is if oil prices, inflation expectations, and interest-rate expectations continue rising all at once.
In the short term, focus on whether $78k can hold, then watch whether ETF outflows continue day after day. A one-day flip to negative counts as normal fluctuation. But if the price breaks down and ETFs keep bleeding continuously, that’s the signal you’d truly need to reduce positions. #比特币突破79000美元

1
1
3
759
·
--
The encrypted treasury is not out of flames—it's just starting to split up.
In this round, there’s a clear change in how companies with crypto treasuries are operating: everyone is allocating capital, but the gameplay is no longer the same.
Last week, Strive spent about $109 million to buy an additional 1,375 BTC at an average purchase price of $79,281. Its total holdings rose to 24,531 BTC. More notably, about 70% of this funding came from SATA perpetual preferred shares, suggesting it’s still actively expanding through the capital markets.
BitMine is taking a different approach. As of September 7, its ETH holdings had reached about 5.929 million coins. Of those, 5.067 million were put into staking, accounting for roughly 85%. Based on current yield estimates, annualized staking income is about $330 million. It’s not just betting on ETH price appreciation—it’s turning the treasury into a machine that continuously generates cash flow.
By contrast, Strategy did not continue adding BTC last week. Its holdings stayed at 845,050 BTC, while it deployed $176 million to repurchase STRC and increased the related repurchase authorization to $2 billion.
Meanwhile, during the same period, publicly listed companies worldwide net bought about $267 million worth of BTC in a single week, down 48% month over month. It’s not that companies have stopped believing in crypto assets; rather, the phase of “financing to buy coins” is cooling off. Capital is beginning to redistribute among accumulation, buybacks, cash reserves, and staking returns.
As of now, BTC is around $79,700 and ETH around $2,520. When assessing whether a crypto treasury is worth buying, you can’t just look at how many coins it holds—you also need to consider how high its financing cost is, how much dilution has occurred, and whether those coins can truly generate returns.
In the second half of the crypto treasury competition, it’s not about who has the bigger nerve—it’s about whose books are clearer.#灰度ZcashETF资产突破5亿美元 $BTC
{future}(BTCUSDT)
$ETH
{future}(ETHUSDT)
The encrypted treasury is not out of flames—it's just starting to split up.
In this round, there’s a clear change in how companies with crypto treasuries are operating: everyone is allocating capital, but the gameplay is no longer the same.
Last week, Strive spent about $109 million to buy an additional 1,375 BTC at an average purchase price of $79,281. Its total holdings rose to 24,531 BTC. More notably, about 70% of this funding came from SATA perpetual preferred shares, suggesting it’s still actively expanding through the capital markets.
BitMine is taking a different approach. As of September 7, its ETH holdings had reached about 5.929 million coins. Of those, 5.067 million were put into staking, accounting for roughly 85%. Based on current yield estimates, annualized staking income is about $330 million. It’s not just betting on ETH price appreciation—it’s turning the treasury into a machine that continuously generates cash flow.
By contrast, Strategy did not continue adding BTC last week. Its holdings stayed at 845,050 BTC, while it deployed $176 million to repurchase STRC and increased the related repurchase authorization to $2 billion.
Meanwhile, during the same period, publicly listed companies worldwide net bought about $267 million worth of BTC in a single week, down 48% month over month. It’s not that companies have stopped believing in crypto assets; rather, the phase of “financing to buy coins” is cooling off. Capital is beginning to redistribute among accumulation, buybacks, cash reserves, and staking returns.
As of now, BTC is around $79,700 and ETH around $2,520. When assessing whether a crypto treasury is worth buying, you can’t just look at how many coins it holds—you also need to consider how high its financing cost is, how much dilution has occurred, and whether those coins can truly generate returns.
In the second half of the crypto treasury competition, it’s not about who has the bigger nerve—it’s about whose books are clearer.#灰度ZcashETF资产突破5亿美元 $BTC
$ETH
In this round, there’s a clear change in how companies with crypto treasuries are operating: everyone is allocating capital, but the gameplay is no longer the same.
Last week, Strive spent about $109 million to buy an additional 1,375 BTC at an average purchase price of $79,281. Its total holdings rose to 24,531 BTC. More notably, about 70% of this funding came from SATA perpetual preferred shares, suggesting it’s still actively expanding through the capital markets.
BitMine is taking a different approach. As of September 7, its ETH holdings had reached about 5.929 million coins. Of those, 5.067 million were put into staking, accounting for roughly 85%. Based on current yield estimates, annualized staking income is about $330 million. It’s not just betting on ETH price appreciation—it’s turning the treasury into a machine that continuously generates cash flow.
By contrast, Strategy did not continue adding BTC last week. Its holdings stayed at 845,050 BTC, while it deployed $176 million to repurchase STRC and increased the related repurchase authorization to $2 billion.
Meanwhile, during the same period, publicly listed companies worldwide net bought about $267 million worth of BTC in a single week, down 48% month over month. It’s not that companies have stopped believing in crypto assets; rather, the phase of “financing to buy coins” is cooling off. Capital is beginning to redistribute among accumulation, buybacks, cash reserves, and staking returns.
As of now, BTC is around $79,700 and ETH around $2,520. When assessing whether a crypto treasury is worth buying, you can’t just look at how many coins it holds—you also need to consider how high its financing cost is, how much dilution has occurred, and whether those coins can truly generate returns.
In the second half of the crypto treasury competition, it’s not about who has the bigger nerve—it’s about whose books are clearer.#灰度ZcashETF资产突破5亿美元 $BTC
$ETH

2
768
·
--
Previously, when building a multi-asset trading platform, the benchmark was who had more money, a bigger team, and stronger infrastructure.
Now the rules have changed.
For things like crypto, stocks, commodities, FX, and prediction markets—what used to require separate solutions for matching, market data, liquidity, wallet, and account systems now generally have mature approaches. Instead of starting from the foundation to build a building, startup teams need to decide which modules are worth integrating, and how to combine them into a truly usable product.
So when building platforms like this today, the core competitive advantage is no longer “everything built in-house.” It’s integration capability: whether liquidity is deep enough, whether account status can be synchronized, whether risk parameters are clear, and who is responsible when upstream services fail.
Nika is a microcosm of this new model.
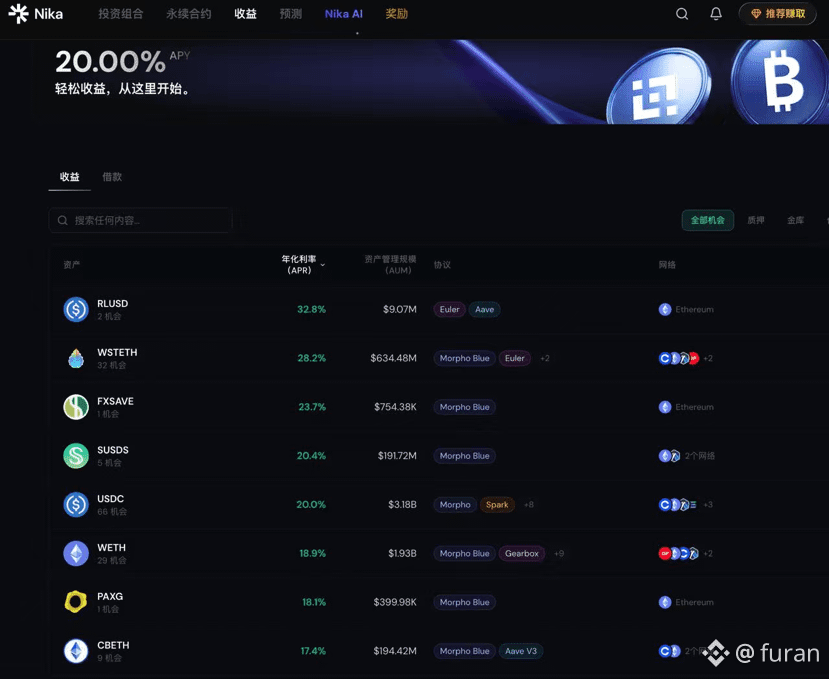
Based on its public information, the core team consists of only two people. Within less than a year, it completed a $2 million funding round, accumulated more than 50,000 users, covered more than 30 countries, and integrated with 500+ markets. On September 8, with the full launch of Nika AI v1, it further compresses market research, trade execution, and portfolio management into a single chat interface.
More importantly, Nika connects to the user’s own non-custodial accounts. The AI can read positions, analyze risk, and propose trading plans—but the funds are always controlled by the user. Position sizing, limits, and risk-control parameters are also set by the user.
“Two people building a full-stack financial product” used to sound like bragging. But with the underlying infrastructure now mature, it has actually become a viable path.
That said, the more modules you assemble, the more dependencies you inherit. If any provider in a single chain breaks down, it can affect the final user experience. What Nika truly needs to prove is not just whether the product can be put together quickly—it’s whether this assembled system can operate stably and reliably over the long term in real market conditions.
https://reurl.cc/MWM7yk
Previously, when building a multi-asset trading platform, the benchmark was who had more money, a bigger team, and stronger infrastructure.
Now the rules have changed.
For things like crypto, stocks, commodities, FX, and prediction markets—what used to require separate solutions for matching, market data, liquidity, wallet, and account systems now generally have mature approaches. Instead of starting from the foundation to build a building, startup teams need to decide which modules are worth integrating, and how to combine them into a truly usable product.
So when building platforms like this today, the core competitive advantage is no longer “everything built in-house.” It’s integration capability: whether liquidity is deep enough, whether account status can be synchronized, whether risk parameters are clear, and who is responsible when upstream services fail.
Nika is a microcosm of this new model.
Based on its public information, the core team consists of only two people. Within less than a year, it completed a $2 million funding round, accumulated more than 50,000 users, covered more than 30 countries, and integrated with 500+ markets. On September 8, with the full launch of Nika AI v1, it further compresses market research, trade execution, and portfolio management into a single chat interface.
More importantly, Nika connects to the user’s own non-custodial accounts. The AI can read positions, analyze risk, and propose trading plans—but the funds are always controlled by the user. Position sizing, limits, and risk-control parameters are also set by the user.
“Two people building a full-stack financial product” used to sound like bragging. But with the underlying infrastructure now mature, it has actually become a viable path.
That said, the more modules you assemble, the more dependencies you inherit. If any provider in a single chain breaks down, it can affect the final user experience. What Nika truly needs to prove is not just whether the product can be put together quickly—it’s whether this assembled system can operate stably and reliably over the long term in real market conditions.
https://reurl.cc/MWM7yk
Now the rules have changed.
For things like crypto, stocks, commodities, FX, and prediction markets—what used to require separate solutions for matching, market data, liquidity, wallet, and account systems now generally have mature approaches. Instead of starting from the foundation to build a building, startup teams need to decide which modules are worth integrating, and how to combine them into a truly usable product.
So when building platforms like this today, the core competitive advantage is no longer “everything built in-house.” It’s integration capability: whether liquidity is deep enough, whether account status can be synchronized, whether risk parameters are clear, and who is responsible when upstream services fail.
Nika is a microcosm of this new model.
Based on its public information, the core team consists of only two people. Within less than a year, it completed a $2 million funding round, accumulated more than 50,000 users, covered more than 30 countries, and integrated with 500+ markets. On September 8, with the full launch of Nika AI v1, it further compresses market research, trade execution, and portfolio management into a single chat interface.
More importantly, Nika connects to the user’s own non-custodial accounts. The AI can read positions, analyze risk, and propose trading plans—but the funds are always controlled by the user. Position sizing, limits, and risk-control parameters are also set by the user.
“Two people building a full-stack financial product” used to sound like bragging. But with the underlying infrastructure now mature, it has actually become a viable path.
That said, the more modules you assemble, the more dependencies you inherit. If any provider in a single chain breaks down, it can affect the final user experience. What Nika truly needs to prove is not just whether the product can be put together quickly—it’s whether this assembled system can operate stably and reliably over the long term in real market conditions.
https://reurl.cc/MWM7yk
16
3
2.1k
·
--
Partly True
Who would have thought that $ZEC , which many people had still considered an “old coin” in the previous round, would suddenly charge back to the center of the table this round.
On September 6, ZEC surged to as high as $1,255, briefly overtaking DOGE in market cap. The current price is still around $1,180. It ranks 10th on CoinMarketCap and 9th on CoinGecko, with a market cap close to $20 billion.
This rally is not just about the privacy-coin narrative making a sudden comeback. After Grayscale’s ZCSH spot ETF was listed on August 25, its holdings had increased from about 387,800 coins to 428,600 coins by September 3, and its assets under management reached about $415 million, which did indeed bring in new buying.
On another front, Cypherpunk Technologies, backed by Winklevoss Capital, launched the world’s largest ZEC mining cluster, with about 4.2 GSol/s of hash power, accounting for roughly 18% of the entire network. Institutions have moved beyond simply holding coins and are now controlling upstream hash power.
But chasing the rally now still requires calm judgment. ZEC has risen too fast in a short period, derivatives leverage has clearly piled up, and short liquidations over the past 24 hours exceeded $51 million. The short squeeze was also an important force behind the breakout above $1,200.
So my view is straightforward: ZEC is indeed regaining capital allocation, but the current price has already front-run a lot of expectations. It can still be watched for the long term, but in the short term, don’t get lured into blindly buying just because it “made it into the top 10.” In this kind of volatility, getting the timing wrong once can be very painful.
{future}(ZECUSDT)
Who would have thought that $ZEC , which many people had still considered an “old coin” in the previous round, would suddenly charge back to the center of the table this round.
On September 6, ZEC surged to as high as $1,255, briefly overtaking DOGE in market cap. The current price is still around $1,180. It ranks 10th on CoinMarketCap and 9th on CoinGecko, with a market cap close to $20 billion.
This rally is not just about the privacy-coin narrative making a sudden comeback. After Grayscale’s ZCSH spot ETF was listed on August 25, its holdings had increased from about 387,800 coins to 428,600 coins by September 3, and its assets under management reached about $415 million, which did indeed bring in new buying.
On another front, Cypherpunk Technologies, backed by Winklevoss Capital, launched the world’s largest ZEC mining cluster, with about 4.2 GSol/s of hash power, accounting for roughly 18% of the entire network. Institutions have moved beyond simply holding coins and are now controlling upstream hash power.
But chasing the rally now still requires calm judgment. ZEC has risen too fast in a short period, derivatives leverage has clearly piled up, and short liquidations over the past 24 hours exceeded $51 million. The short squeeze was also an important force behind the breakout above $1,200.
So my view is straightforward: ZEC is indeed regaining capital allocation, but the current price has already front-run a lot of expectations. It can still be watched for the long term, but in the short term, don’t get lured into blindly buying just because it “made it into the top 10.” In this kind of volatility, getting the timing wrong once can be very painful.
On September 6, ZEC surged to as high as $1,255, briefly overtaking DOGE in market cap. The current price is still around $1,180. It ranks 10th on CoinMarketCap and 9th on CoinGecko, with a market cap close to $20 billion.
This rally is not just about the privacy-coin narrative making a sudden comeback. After Grayscale’s ZCSH spot ETF was listed on August 25, its holdings had increased from about 387,800 coins to 428,600 coins by September 3, and its assets under management reached about $415 million, which did indeed bring in new buying.
On another front, Cypherpunk Technologies, backed by Winklevoss Capital, launched the world’s largest ZEC mining cluster, with about 4.2 GSol/s of hash power, accounting for roughly 18% of the entire network. Institutions have moved beyond simply holding coins and are now controlling upstream hash power.
But chasing the rally now still requires calm judgment. ZEC has risen too fast in a short period, derivatives leverage has clearly piled up, and short liquidations over the past 24 hours exceeded $51 million. The short squeeze was also an important force behind the breakout above $1,200.
So my view is straightforward: ZEC is indeed regaining capital allocation, but the current price has already front-run a lot of expectations. It can still be watched for the long term, but in the short term, don’t get lured into blindly buying just because it “made it into the top 10.” In this kind of volatility, getting the timing wrong once can be very painful.
4
2k
·
--
Bitcoin Reclaims $80,000—Is This a Bounce or a Reversal?
BTC is back above $80,000, currently trading around $81,000. But I don’t think it’s time to eagerly declare that a full-fledged bull market has returned, because the real tough bones ahead haven’t been chewed through yet.
From a flows perspective, on September 3, US spot BTC ETFs saw net inflows of approximately $301.6 million. The previous day also recorded net inflows of $101.1 million, suggesting institutional capital has warmed up again. However, inflows and outflows have still been bouncing back and forth recently, so there’s no evidence of sustained one-way buying—for now.
The macro picture has also shown some marginal positives. After Federal Reserve officials released signals that leaned dovish, market expectations for a September rate hike fell from about 63% to around 50%. At the same time, the 10-year Treasury yield slipped back to around 4.75%, giving breathing room to BTC, gold, and other assets.
Interestingly, the 90-day correlation between BTC and gold has risen to near a six-year high, while BTC’s correlation with the Nasdaq has declined. The market is once again pricing the “currency devaluation hedge” narrative—but higher correlation doesn’t mean BTC will only go up from here.
Technically, the next key resistance lies around $82,800. A successful breakout and hold would set the stage for a potential challenge toward $90,000. If the rally fails to break higher, then traders should watch support levels around $75,700 and $71,800.
My view is very straightforward: this move is no longer just a normal minor rebound, but $80,000 looks more like a battlefield between bulls and bears—not a place to blindly chase with full size. Going forward, if US employment and inflation data slightly exceed expectations, the rates trade could flip at any time. If you want to participate, you can—but don’t go all-in with your position size at the hottest moment of the emotion. #美国10年期国债收益率创2023年11月新高
Bitcoin Reclaims $80,000—Is This a Bounce or a Reversal?
BTC is back above $80,000, currently trading around $81,000. But I don’t think it’s time to eagerly declare that a full-fledged bull market has returned, because the real tough bones ahead haven’t been chewed through yet.
From a flows perspective, on September 3, US spot BTC ETFs saw net inflows of approximately $301.6 million. The previous day also recorded net inflows of $101.1 million, suggesting institutional capital has warmed up again. However, inflows and outflows have still been bouncing back and forth recently, so there’s no evidence of sustained one-way buying—for now.
The macro picture has also shown some marginal positives. After Federal Reserve officials released signals that leaned dovish, market expectations for a September rate hike fell from about 63% to around 50%. At the same time, the 10-year Treasury yield slipped back to around 4.75%, giving breathing room to BTC, gold, and other assets.
Interestingly, the 90-day correlation between BTC and gold has risen to near a six-year high, while BTC’s correlation with the Nasdaq has declined. The market is once again pricing the “currency devaluation hedge” narrative—but higher correlation doesn’t mean BTC will only go up from here.
Technically, the next key resistance lies around $82,800. A successful breakout and hold would set the stage for a potential challenge toward $90,000. If the rally fails to break higher, then traders should watch support levels around $75,700 and $71,800.
My view is very straightforward: this move is no longer just a normal minor rebound, but $80,000 looks more like a battlefield between bulls and bears—not a place to blindly chase with full size. Going forward, if US employment and inflation data slightly exceed expectations, the rates trade could flip at any time. If you want to participate, you can—but don’t go all-in with your position size at the hottest moment of the emotion. #美国10年期国债收益率创2023年11月新高
BTC is back above $80,000, currently trading around $81,000. But I don’t think it’s time to eagerly declare that a full-fledged bull market has returned, because the real tough bones ahead haven’t been chewed through yet.
From a flows perspective, on September 3, US spot BTC ETFs saw net inflows of approximately $301.6 million. The previous day also recorded net inflows of $101.1 million, suggesting institutional capital has warmed up again. However, inflows and outflows have still been bouncing back and forth recently, so there’s no evidence of sustained one-way buying—for now.
The macro picture has also shown some marginal positives. After Federal Reserve officials released signals that leaned dovish, market expectations for a September rate hike fell from about 63% to around 50%. At the same time, the 10-year Treasury yield slipped back to around 4.75%, giving breathing room to BTC, gold, and other assets.
Interestingly, the 90-day correlation between BTC and gold has risen to near a six-year high, while BTC’s correlation with the Nasdaq has declined. The market is once again pricing the “currency devaluation hedge” narrative—but higher correlation doesn’t mean BTC will only go up from here.
Technically, the next key resistance lies around $82,800. A successful breakout and hold would set the stage for a potential challenge toward $90,000. If the rally fails to break higher, then traders should watch support levels around $75,700 and $71,800.
My view is very straightforward: this move is no longer just a normal minor rebound, but $80,000 looks more like a battlefield between bulls and bears—not a place to blindly chase with full size. Going forward, if US employment and inflation data slightly exceed expectations, the rates trade could flip at any time. If you want to participate, you can—but don’t go all-in with your position size at the hottest moment of the emotion. #美国10年期国债收益率创2023年11月新高

2
1.2k
·
--
Divergence Before Non-Farm Payrolls: Maximum Rate-Hike Uncertainty for September
Two latest sets of U.S. data have put the market in a tricky spot.
In August, the ISM Manufacturing PMI fell from 55.6 to 54.6, below expectations of 55.2—indicating that the pace of manufacturing expansion is slowing. However, the Prices Paid Index remains as high as 71.1, meaning inflation pressure has not clearly cooled.
The job market is also stable on the surface but cooling underneath. In July, JOLTS job openings came in at 7.271 million, higher than the revised 7.182 million for June. But the number of hires decreased by 278,000 to 5.054 million, suggesting firms are not laying off at scale, yet they are becoming increasingly reluctant to hire.
The real problem is that rising oil prices continue to push up inflation expectations. U.S. Treasury yields and the dollar are moving higher in tandem. Market pricing for a 25-basis-point Fed rate hike in September has risen to around 66%–68%, and the 10-year U.S. Treasury yield briefly approached 4.8%.
Risk assets are already under pressure. All three major U.S. stock indexes fell together, with the Nasdaq down about 1%. BTC is also chopping around near $78,000.
The most crucial next step is the release of the August Non-Farm Payrolls at 20:30 Beijing time on September 4. If employment is too strong, it will further cement expectations of a rate hike. If employment clearly weakens, it will trigger concerns about an economic slowdown. For BTC, in the short term it’s no longer just a matter of “bad data goes up.” Instead, you need to see how the dollar, Treasury yields, and the probability of rate hikes are repriced at the same time.
Personally, I will focus on the strength of support around $78,000. Before the Non-Farm Payrolls are released, chasing or selling aggressively can easily get whipsawed. The real direction may only become clear after the data is published.#美联储加息概率升至68%
Divergence Before Non-Farm Payrolls: Maximum Rate-Hike Uncertainty for September
Two latest sets of U.S. data have put the market in a tricky spot.
In August, the ISM Manufacturing PMI fell from 55.6 to 54.6, below expectations of 55.2—indicating that the pace of manufacturing expansion is slowing. However, the Prices Paid Index remains as high as 71.1, meaning inflation pressure has not clearly cooled.
The job market is also stable on the surface but cooling underneath. In July, JOLTS job openings came in at 7.271 million, higher than the revised 7.182 million for June. But the number of hires decreased by 278,000 to 5.054 million, suggesting firms are not laying off at scale, yet they are becoming increasingly reluctant to hire.
The real problem is that rising oil prices continue to push up inflation expectations. U.S. Treasury yields and the dollar are moving higher in tandem. Market pricing for a 25-basis-point Fed rate hike in September has risen to around 66%–68%, and the 10-year U.S. Treasury yield briefly approached 4.8%.
Risk assets are already under pressure. All three major U.S. stock indexes fell together, with the Nasdaq down about 1%. BTC is also chopping around near $78,000.
The most crucial next step is the release of the August Non-Farm Payrolls at 20:30 Beijing time on September 4. If employment is too strong, it will further cement expectations of a rate hike. If employment clearly weakens, it will trigger concerns about an economic slowdown. For BTC, in the short term it’s no longer just a matter of “bad data goes up.” Instead, you need to see how the dollar, Treasury yields, and the probability of rate hikes are repriced at the same time.
Personally, I will focus on the strength of support around $78,000. Before the Non-Farm Payrolls are released, chasing or selling aggressively can easily get whipsawed. The real direction may only become clear after the data is published.#美联储加息概率升至68%
Two latest sets of U.S. data have put the market in a tricky spot.
In August, the ISM Manufacturing PMI fell from 55.6 to 54.6, below expectations of 55.2—indicating that the pace of manufacturing expansion is slowing. However, the Prices Paid Index remains as high as 71.1, meaning inflation pressure has not clearly cooled.
The job market is also stable on the surface but cooling underneath. In July, JOLTS job openings came in at 7.271 million, higher than the revised 7.182 million for June. But the number of hires decreased by 278,000 to 5.054 million, suggesting firms are not laying off at scale, yet they are becoming increasingly reluctant to hire.
The real problem is that rising oil prices continue to push up inflation expectations. U.S. Treasury yields and the dollar are moving higher in tandem. Market pricing for a 25-basis-point Fed rate hike in September has risen to around 66%–68%, and the 10-year U.S. Treasury yield briefly approached 4.8%.
Risk assets are already under pressure. All three major U.S. stock indexes fell together, with the Nasdaq down about 1%. BTC is also chopping around near $78,000.
The most crucial next step is the release of the August Non-Farm Payrolls at 20:30 Beijing time on September 4. If employment is too strong, it will further cement expectations of a rate hike. If employment clearly weakens, it will trigger concerns about an economic slowdown. For BTC, in the short term it’s no longer just a matter of “bad data goes up.” Instead, you need to see how the dollar, Treasury yields, and the probability of rate hikes are repriced at the same time.
Personally, I will focus on the strength of support around $78,000. Before the Non-Farm Payrolls are released, chasing or selling aggressively can easily get whipsawed. The real direction may only become clear after the data is published.#美联储加息概率升至68%

1
731
·
--
BTC rallies to high and then pulls back, the $80,000 battle for the time being favors the bears
BTC’s recent trend has been very straightforward: it broke above $80,000, failed to sustain the breakout, and then quickly retreated.
The latest market data shows that BTC is currently consolidating around $77,800. In the August 28 intraday session, the high reached about $81,354 and the low dropped to about $76,955, with a daily decline of roughly 3%. This suggests that $80,000 is not yet an effective support level, but a clear overhead resistance zone with significant sell pressure.
Meanwhile, flows have also changed. After the U.S. spot BTC ETFs saw inflows for 9 consecutive trading days, they recorded approximately $202 million in net outflows on August 28. Among them, ARKB had net outflows of about $115 million, BITB net outflows of about $49.7 million, and IBIT net outflows of about $33.4 million. The ETFs’ total net asset value also fell from about $100.9 billion the previous day to $97.59 billion.
Gold is also seeing a pullback. Spot gold at one point fell to around $4,567 per ounce on Friday, down more than 3% on the day. A relatively hawkish Fed stance boosted rate-hike expectations; as the U.S. dollar and short-term Treasury yields strengthened, both BTC and gold were pressured at the same time.
BTC’s 90-day correlation with gold has risen to over 50%, while its correlation with the Nasdaq 100 has dropped to about 33%. This can only indicate that the linkage between them has strengthened in the recent period—it does not directly mean that BTC has already completed “digital gold” pricing. For now, rate expectations are once again the dominant variable, and both assets can still fall together.
My view is that in the short term, we should first see whether BTC can hold the $76,900—$77,000 range. If it holds, BTC still has the chance to retest $80,000. If it continues to break down below that level, it would suggest that this breakout was more like a squeeze followed by a failed rally. Only if price can reclaim and stabilize above $80,000—$81,300 will the market be considered to have truly regained bullish strength.
This is not a time to simply call for more upside. ETF flows have already turned around, and $80,000 has also been lost again. Focus first on whether support can hold; only then should we talk about the next wave of gains.#比特币24小时跌3.4%至7.74万美元
BTC rallies to high and then pulls back, the $80,000 battle for the time being favors the bears
BTC’s recent trend has been very straightforward: it broke above $80,000, failed to sustain the breakout, and then quickly retreated.
The latest market data shows that BTC is currently consolidating around $77,800. In the August 28 intraday session, the high reached about $81,354 and the low dropped to about $76,955, with a daily decline of roughly 3%. This suggests that $80,000 is not yet an effective support level, but a clear overhead resistance zone with significant sell pressure.
Meanwhile, flows have also changed. After the U.S. spot BTC ETFs saw inflows for 9 consecutive trading days, they recorded approximately $202 million in net outflows on August 28. Among them, ARKB had net outflows of about $115 million, BITB net outflows of about $49.7 million, and IBIT net outflows of about $33.4 million. The ETFs’ total net asset value also fell from about $100.9 billion the previous day to $97.59 billion.
Gold is also seeing a pullback. Spot gold at one point fell to around $4,567 per ounce on Friday, down more than 3% on the day. A relatively hawkish Fed stance boosted rate-hike expectations; as the U.S. dollar and short-term Treasury yields strengthened, both BTC and gold were pressured at the same time.
BTC’s 90-day correlation with gold has risen to over 50%, while its correlation with the Nasdaq 100 has dropped to about 33%. This can only indicate that the linkage between them has strengthened in the recent period—it does not directly mean that BTC has already completed “digital gold” pricing. For now, rate expectations are once again the dominant variable, and both assets can still fall together.
My view is that in the short term, we should first see whether BTC can hold the $76,900—$77,000 range. If it holds, BTC still has the chance to retest $80,000. If it continues to break down below that level, it would suggest that this breakout was more like a squeeze followed by a failed rally. Only if price can reclaim and stabilize above $80,000—$81,300 will the market be considered to have truly regained bullish strength.
This is not a time to simply call for more upside. ETF flows have already turned around, and $80,000 has also been lost again. Focus first on whether support can hold; only then should we talk about the next wave of gains.#比特币24小时跌3.4%至7.74万美元
BTC’s recent trend has been very straightforward: it broke above $80,000, failed to sustain the breakout, and then quickly retreated.
The latest market data shows that BTC is currently consolidating around $77,800. In the August 28 intraday session, the high reached about $81,354 and the low dropped to about $76,955, with a daily decline of roughly 3%. This suggests that $80,000 is not yet an effective support level, but a clear overhead resistance zone with significant sell pressure.
Meanwhile, flows have also changed. After the U.S. spot BTC ETFs saw inflows for 9 consecutive trading days, they recorded approximately $202 million in net outflows on August 28. Among them, ARKB had net outflows of about $115 million, BITB net outflows of about $49.7 million, and IBIT net outflows of about $33.4 million. The ETFs’ total net asset value also fell from about $100.9 billion the previous day to $97.59 billion.
Gold is also seeing a pullback. Spot gold at one point fell to around $4,567 per ounce on Friday, down more than 3% on the day. A relatively hawkish Fed stance boosted rate-hike expectations; as the U.S. dollar and short-term Treasury yields strengthened, both BTC and gold were pressured at the same time.
BTC’s 90-day correlation with gold has risen to over 50%, while its correlation with the Nasdaq 100 has dropped to about 33%. This can only indicate that the linkage between them has strengthened in the recent period—it does not directly mean that BTC has already completed “digital gold” pricing. For now, rate expectations are once again the dominant variable, and both assets can still fall together.
My view is that in the short term, we should first see whether BTC can hold the $76,900—$77,000 range. If it holds, BTC still has the chance to retest $80,000. If it continues to break down below that level, it would suggest that this breakout was more like a squeeze followed by a failed rally. Only if price can reclaim and stabilize above $80,000—$81,300 will the market be considered to have truly regained bullish strength.
This is not a time to simply call for more upside. ETF flows have already turned around, and $80,000 has also been lost again. Focus first on whether support can hold; only then should we talk about the next wave of gains.#比特币24小时跌3.4%至7.74万美元

2
5
1.3k
·
--
BTC rises sharply then falls back; the real test is only just beginning
After BTC broke through $80,000, it quickly pulled back and is currently trading in a range around $79,000. This rally has indeed been fierce—up more than 25% in a single month—but it was fueled not only by genuine spot ETF inflows; a portion of the move was also boosted by forced short liquidations. In the short term, it’s not entirely driven by active buying pressure.
Market liquidity has clearly improved. U.S. spot BTC ETFs saw net inflows of about $1.92 billion last week, the strongest single-week performance in nearly 10 months. Over the past 7 trading days, cumulative inflows reached roughly $2.5 billion. This suggests institutional capital has re-entered the market. However, after BTC quickly surges, the profit-taking pressure from low-cost holdings is likely to rise at the same time.
The biggest variable right now is the BTC options set to expire on August 28. Deribit has around 81,700 BTC options contracts concentrated in a single settlement, with a notional value of about $6.44 billion. The call-to-put ratio is approximately 0.83, and open interest is mainly clustered around $75,000 and $80,000. Notably, the maximum pain point lies at $68,000–$70,000—clearly below the current price—so the battle leading up to and around expiration could be especially intense.
My view is straightforward: $80,000 is not just an ordinary round-number level now—it’s a zone where long and short costs are highly concentrated. In the short term, as long as $78,000 is held, there’s still a chance the market attempts to surge again toward $80,000–$83,000. If price breaks below $78,000, watch for a pullback toward the $75,000 area.
Has this round of price action ended? You can’t judge it solely by a single candlestick that spikes and then reverses. Once the interference from the options settlement fades, whether ETF inflows can continue and whether spot buyers can absorb the supply from high-level sell pressure will be the key to determining whether BTC is undergoing a trend reversal or merely a rebound after being oversold.
#加密市场 #比特币升破8万美元创三月新高 #比特币守于7.94万美元
BTC rises sharply then falls back; the real test is only just beginning
After BTC broke through $80,000, it quickly pulled back and is currently trading in a range around $79,000. This rally has indeed been fierce—up more than 25% in a single month—but it was fueled not only by genuine spot ETF inflows; a portion of the move was also boosted by forced short liquidations. In the short term, it’s not entirely driven by active buying pressure.
Market liquidity has clearly improved. U.S. spot BTC ETFs saw net inflows of about $1.92 billion last week, the strongest single-week performance in nearly 10 months. Over the past 7 trading days, cumulative inflows reached roughly $2.5 billion. This suggests institutional capital has re-entered the market. However, after BTC quickly surges, the profit-taking pressure from low-cost holdings is likely to rise at the same time.
The biggest variable right now is the BTC options set to expire on August 28. Deribit has around 81,700 BTC options contracts concentrated in a single settlement, with a notional value of about $6.44 billion. The call-to-put ratio is approximately 0.83, and open interest is mainly clustered around $75,000 and $80,000. Notably, the maximum pain point lies at $68,000–$70,000—clearly below the current price—so the battle leading up to and around expiration could be especially intense.
My view is straightforward: $80,000 is not just an ordinary round-number level now—it’s a zone where long and short costs are highly concentrated. In the short term, as long as $78,000 is held, there’s still a chance the market attempts to surge again toward $80,000–$83,000. If price breaks below $78,000, watch for a pullback toward the $75,000 area.
Has this round of price action ended? You can’t judge it solely by a single candlestick that spikes and then reverses. Once the interference from the options settlement fades, whether ETF inflows can continue and whether spot buyers can absorb the supply from high-level sell pressure will be the key to determining whether BTC is undergoing a trend reversal or merely a rebound after being oversold.
#加密市场 #比特币升破8万美元创三月新高 #比特币守于7.94万美元
After BTC broke through $80,000, it quickly pulled back and is currently trading in a range around $79,000. This rally has indeed been fierce—up more than 25% in a single month—but it was fueled not only by genuine spot ETF inflows; a portion of the move was also boosted by forced short liquidations. In the short term, it’s not entirely driven by active buying pressure.
Market liquidity has clearly improved. U.S. spot BTC ETFs saw net inflows of about $1.92 billion last week, the strongest single-week performance in nearly 10 months. Over the past 7 trading days, cumulative inflows reached roughly $2.5 billion. This suggests institutional capital has re-entered the market. However, after BTC quickly surges, the profit-taking pressure from low-cost holdings is likely to rise at the same time.
The biggest variable right now is the BTC options set to expire on August 28. Deribit has around 81,700 BTC options contracts concentrated in a single settlement, with a notional value of about $6.44 billion. The call-to-put ratio is approximately 0.83, and open interest is mainly clustered around $75,000 and $80,000. Notably, the maximum pain point lies at $68,000–$70,000—clearly below the current price—so the battle leading up to and around expiration could be especially intense.
My view is straightforward: $80,000 is not just an ordinary round-number level now—it’s a zone where long and short costs are highly concentrated. In the short term, as long as $78,000 is held, there’s still a chance the market attempts to surge again toward $80,000–$83,000. If price breaks below $78,000, watch for a pullback toward the $75,000 area.
Has this round of price action ended? You can’t judge it solely by a single candlestick that spikes and then reverses. Once the interference from the options settlement fades, whether ETF inflows can continue and whether spot buyers can absorb the supply from high-level sell pressure will be the key to determining whether BTC is undergoing a trend reversal or merely a rebound after being oversold.
#加密市场 #比特币升破8万美元创三月新高 #比特币守于7.94万美元

1
2
1.7k
·
--
Verified
After Nvidia’s upside performance, the AI market is entering an “earnings checkpoint” phase
Nvidia’s earnings report is still strong: quarterly revenue was $96.2 billion, up 106% year over year; data center revenue was $89.0 billion, up 117%. The company’s next-quarter revenue guidance reaches $108.0 billion, above market expectations. More importantly, it expects FY2028 revenue to continue growing by about 70%, indicating that demand for AI compute is not showing any obvious cooling for now.
But I think the truly noteworthy shift during this earnings season is that AI returns are starting to spread from the chip layer to the software layer.
Salesforce’s AI and data products ARR is nearing $3.9 billion; CrowdStrike’s quarterly revenue grew 26%, ARR reached $5.84 billion, and net new ARR set a record of $333 million; Synopsys quarterly revenue was $2.477 billion, and it also raised full-year revenue and profit guidance; Okta’s overall growth is only 11%, but its subscription backlog orders increased 17% year over year.
This means the market’s criteria for judging the AI cycle are changing: in the past, it was about who bought more GPUs; now it’s about who can turn AI into orders, renewals, and cash flow.
Of course, Nvidia’s delivery is still constrained by supply capacity, and valuation has already priced in very high expectations in advance. Next, Marvell’s earnings report will further validate demand for network connectivity, custom chips, and AI interconnects. If upstream and downstream grow in sync, the main AI theme can continue; if only Nvidia is the standout, differentiation within the sector will become increasingly pronounced.
My view is that the AI rally hasn’t ended, but the phase of “story-driven broad-based gains” is over. The next stage will only reward companies that can genuinely deliver on performance.
#英伟达营收超预期股价涨4%
After Nvidia’s upside performance, the AI market is entering an “earnings checkpoint” phase
Nvidia’s earnings report is still strong: quarterly revenue was $96.2 billion, up 106% year over year; data center revenue was $89.0 billion, up 117%. The company’s next-quarter revenue guidance reaches $108.0 billion, above market expectations. More importantly, it expects FY2028 revenue to continue growing by about 70%, indicating that demand for AI compute is not showing any obvious cooling for now.
But I think the truly noteworthy shift during this earnings season is that AI returns are starting to spread from the chip layer to the software layer.
Salesforce’s AI and data products ARR is nearing $3.9 billion; CrowdStrike’s quarterly revenue grew 26%, ARR reached $5.84 billion, and net new ARR set a record of $333 million; Synopsys quarterly revenue was $2.477 billion, and it also raised full-year revenue and profit guidance; Okta’s overall growth is only 11%, but its subscription backlog orders increased 17% year over year.
This means the market’s criteria for judging the AI cycle are changing: in the past, it was about who bought more GPUs; now it’s about who can turn AI into orders, renewals, and cash flow.
Of course, Nvidia’s delivery is still constrained by supply capacity, and valuation has already priced in very high expectations in advance. Next, Marvell’s earnings report will further validate demand for network connectivity, custom chips, and AI interconnects. If upstream and downstream grow in sync, the main AI theme can continue; if only Nvidia is the standout, differentiation within the sector will become increasingly pronounced.
My view is that the AI rally hasn’t ended, but the phase of “story-driven broad-based gains” is over. The next stage will only reward companies that can genuinely deliver on performance.
#英伟达营收超预期股价涨4%
Nvidia’s earnings report is still strong: quarterly revenue was $96.2 billion, up 106% year over year; data center revenue was $89.0 billion, up 117%. The company’s next-quarter revenue guidance reaches $108.0 billion, above market expectations. More importantly, it expects FY2028 revenue to continue growing by about 70%, indicating that demand for AI compute is not showing any obvious cooling for now.
But I think the truly noteworthy shift during this earnings season is that AI returns are starting to spread from the chip layer to the software layer.
Salesforce’s AI and data products ARR is nearing $3.9 billion; CrowdStrike’s quarterly revenue grew 26%, ARR reached $5.84 billion, and net new ARR set a record of $333 million; Synopsys quarterly revenue was $2.477 billion, and it also raised full-year revenue and profit guidance; Okta’s overall growth is only 11%, but its subscription backlog orders increased 17% year over year.
This means the market’s criteria for judging the AI cycle are changing: in the past, it was about who bought more GPUs; now it’s about who can turn AI into orders, renewals, and cash flow.
Of course, Nvidia’s delivery is still constrained by supply capacity, and valuation has already priced in very high expectations in advance. Next, Marvell’s earnings report will further validate demand for network connectivity, custom chips, and AI interconnects. If upstream and downstream grow in sync, the main AI theme can continue; if only Nvidia is the standout, differentiation within the sector will become increasingly pronounced.
My view is that the AI rally hasn’t ended, but the phase of “story-driven broad-based gains” is over. The next stage will only reward companies that can genuinely deliver on performance.
#英伟达营收超预期股价涨4%

3
10
2.5k
·
--
BTC breaks through $80,000— the real test has just begun
I just took a look at BTC breaking above $80,000. The intraday gain is close to 5%, and the high reached $81,104. Compared with what was expected in the image, $80,000 is no longer a question of “whether it can break through,” but rather whether it can genuinely hold after breaking.
This rally isn’t driven by sentiment alone. U.S. spot BTC ETFs have seen consecutive weeks of net inflows, totaling nearly $2 billion. Of that, BlackRock’s IBIT accounted for about $1 billion in inflows in the same week. Combined with short-covering, a weaker U.S. dollar, and the U.S. Treasury expanding its long-term Treasury repurchase program, expectations for liquidity in risk assets have clearly improved.
However, after consecutive rises, short-term profit-taking is definitely likely to increase. Going forward, I’ll focus on two key levels: whether there can be a volume-supported breakout above $82,000, and whether the $78,000–$80,000 zone below can turn from a resistance area into a support area. If $80,000 is defended, the market may have a chance to continue probing higher; if it quickly falls back below $78,000, then we need to guard against this breakout turning into a bull trap.
In addition, the 2026 Jackson Hole Global Central Bank Conference will be held from August 27 to 29. Remarks by the Fed Chair could again affect the U.S. dollar, interest rates, and overall risk appetite.
So right now, we can’t just look at the headline “BTC breaks $80,000.” What truly determines how far the market can go is whether ETF inflows can keep up, whether spot trading volume can follow through, and whether the $80,000 threshold can withstand a pullback. #BTC触及80000美元
BTC breaks through $80,000— the real test has just begun
I just took a look at BTC breaking above $80,000. The intraday gain is close to 5%, and the high reached $81,104. Compared with what was expected in the image, $80,000 is no longer a question of “whether it can break through,” but rather whether it can genuinely hold after breaking.
This rally isn’t driven by sentiment alone. U.S. spot BTC ETFs have seen consecutive weeks of net inflows, totaling nearly $2 billion. Of that, BlackRock’s IBIT accounted for about $1 billion in inflows in the same week. Combined with short-covering, a weaker U.S. dollar, and the U.S. Treasury expanding its long-term Treasury repurchase program, expectations for liquidity in risk assets have clearly improved.
However, after consecutive rises, short-term profit-taking is definitely likely to increase. Going forward, I’ll focus on two key levels: whether there can be a volume-supported breakout above $82,000, and whether the $78,000–$80,000 zone below can turn from a resistance area into a support area. If $80,000 is defended, the market may have a chance to continue probing higher; if it quickly falls back below $78,000, then we need to guard against this breakout turning into a bull trap.
In addition, the 2026 Jackson Hole Global Central Bank Conference will be held from August 27 to 29. Remarks by the Fed Chair could again affect the U.S. dollar, interest rates, and overall risk appetite.
So right now, we can’t just look at the headline “BTC breaks $80,000.” What truly determines how far the market can go is whether ETF inflows can keep up, whether spot trading volume can follow through, and whether the $80,000 threshold can withstand a pullback. #BTC触及80000美元
I just took a look at BTC breaking above $80,000. The intraday gain is close to 5%, and the high reached $81,104. Compared with what was expected in the image, $80,000 is no longer a question of “whether it can break through,” but rather whether it can genuinely hold after breaking.
This rally isn’t driven by sentiment alone. U.S. spot BTC ETFs have seen consecutive weeks of net inflows, totaling nearly $2 billion. Of that, BlackRock’s IBIT accounted for about $1 billion in inflows in the same week. Combined with short-covering, a weaker U.S. dollar, and the U.S. Treasury expanding its long-term Treasury repurchase program, expectations for liquidity in risk assets have clearly improved.
However, after consecutive rises, short-term profit-taking is definitely likely to increase. Going forward, I’ll focus on two key levels: whether there can be a volume-supported breakout above $82,000, and whether the $78,000–$80,000 zone below can turn from a resistance area into a support area. If $80,000 is defended, the market may have a chance to continue probing higher; if it quickly falls back below $78,000, then we need to guard against this breakout turning into a bull trap.
In addition, the 2026 Jackson Hole Global Central Bank Conference will be held from August 27 to 29. Remarks by the Fed Chair could again affect the U.S. dollar, interest rates, and overall risk appetite.
So right now, we can’t just look at the headline “BTC breaks $80,000.” What truly determines how far the market can go is whether ETF inflows can keep up, whether spot trading volume can follow through, and whether the $80,000 threshold can withstand a pullback. #BTC触及80000美元

1
1
800
·
--
After BTC breaks out, the real test is only just beginning
This latest leg of BTC’s rally has indeed been quite fierce. The current price is around $77,300, and it even surged to $79,194 during the day. In just a few days, it has broken through the prior consolidation range that had persisted for weeks.
But this move shouldn’t be simply understood as “a new bull market restart.” The main driver in the first phase is still short liquidations. With the market having built up a large number of short positions under low-volatility conditions, once BTC broke through a key level, in the following 24 hours roughly $2.7–$3.0 billion in short positions were liquidated. Forced buybacks, in turn, kept pushing the price higher.
What’s really worth watching is what comes after the short squeeze: spot capital stepping in. On August 20, U.S. spot BTC ETF net inflows were about $606 million, while ETH spot ETF net inflows were about $221 million—together nearly $826 million, as mentioned in the image. In the first four trading days of this week, BTC ETFs saw cumulative net inflows of about $1.6 billion.
Meanwhile, the U.S. Treasury expanded its purchases of long-term government bonds, the U.S. dollar weakened, and expectations for improved crypto regulation have also been supporting fresh buying of BTC, gold, and other inflation-hedging assets.
So going forward, don’t just focus on whether BTC can reach $80,000. The key is whether ETFs can continue to maintain net inflows. The short squeeze lifts the price, but spot capital determines how long it can hold.
If ETF inflows continue, this breakout could shift from a sentiment-driven move to a trend-driven one. If capital quickly fades, after a sharp rise of nearly 20%, a pullback is also perfectly normal.
Chasing higher prices now may not feel comfortable, but shorting blindly based on last cycle’s bearish mindset could carry even greater risk. #比特币创2023年3月来最佳周表现 $BTC
{future}(BTCUSDT)
After BTC breaks out, the real test is only just beginning
This latest leg of BTC’s rally has indeed been quite fierce. The current price is around $77,300, and it even surged to $79,194 during the day. In just a few days, it has broken through the prior consolidation range that had persisted for weeks.
But this move shouldn’t be simply understood as “a new bull market restart.” The main driver in the first phase is still short liquidations. With the market having built up a large number of short positions under low-volatility conditions, once BTC broke through a key level, in the following 24 hours roughly $2.7–$3.0 billion in short positions were liquidated. Forced buybacks, in turn, kept pushing the price higher.
What’s really worth watching is what comes after the short squeeze: spot capital stepping in. On August 20, U.S. spot BTC ETF net inflows were about $606 million, while ETH spot ETF net inflows were about $221 million—together nearly $826 million, as mentioned in the image. In the first four trading days of this week, BTC ETFs saw cumulative net inflows of about $1.6 billion.
Meanwhile, the U.S. Treasury expanded its purchases of long-term government bonds, the U.S. dollar weakened, and expectations for improved crypto regulation have also been supporting fresh buying of BTC, gold, and other inflation-hedging assets.
So going forward, don’t just focus on whether BTC can reach $80,000. The key is whether ETFs can continue to maintain net inflows. The short squeeze lifts the price, but spot capital determines how long it can hold.
If ETF inflows continue, this breakout could shift from a sentiment-driven move to a trend-driven one. If capital quickly fades, after a sharp rise of nearly 20%, a pullback is also perfectly normal.
Chasing higher prices now may not feel comfortable, but shorting blindly based on last cycle’s bearish mindset could carry even greater risk. #比特币创2023年3月来最佳周表现 $BTC
This latest leg of BTC’s rally has indeed been quite fierce. The current price is around $77,300, and it even surged to $79,194 during the day. In just a few days, it has broken through the prior consolidation range that had persisted for weeks.
But this move shouldn’t be simply understood as “a new bull market restart.” The main driver in the first phase is still short liquidations. With the market having built up a large number of short positions under low-volatility conditions, once BTC broke through a key level, in the following 24 hours roughly $2.7–$3.0 billion in short positions were liquidated. Forced buybacks, in turn, kept pushing the price higher.
What’s really worth watching is what comes after the short squeeze: spot capital stepping in. On August 20, U.S. spot BTC ETF net inflows were about $606 million, while ETH spot ETF net inflows were about $221 million—together nearly $826 million, as mentioned in the image. In the first four trading days of this week, BTC ETFs saw cumulative net inflows of about $1.6 billion.
Meanwhile, the U.S. Treasury expanded its purchases of long-term government bonds, the U.S. dollar weakened, and expectations for improved crypto regulation have also been supporting fresh buying of BTC, gold, and other inflation-hedging assets.
So going forward, don’t just focus on whether BTC can reach $80,000. The key is whether ETFs can continue to maintain net inflows. The short squeeze lifts the price, but spot capital determines how long it can hold.
If ETF inflows continue, this breakout could shift from a sentiment-driven move to a trend-driven one. If capital quickly fades, after a sharp rise of nearly 20%, a pullback is also perfectly normal.
Chasing higher prices now may not feel comfortable, but shorting blindly based on last cycle’s bearish mindset could carry even greater risk. #比特币创2023年3月来最佳周表现 $BTC

2
1.5k
·
--
At first glance, this round of rally looks like a price breakout, but beneath the surface there are actually three forces driving it at the same time:
First, the U.S. Treasury plans to expand its long-term Treasury repurchase program. The market interprets it as an improvement at the margin of liquidity; the U.S. Dollar Index weakens, and risk assets collectively benefit.
Second, the U.S. spot BTC ETF saw net inflows of about $517 million on August 19. BlackRock’s IBIT contributed roughly $285 million—spot capital really has started coming back.
Third, a large number of short positions were repeatedly liquidated. Over the past 24 hours, total liquidations across the market exceeded $3.2 billion, forming a classic short-squeeze pattern.
But I think we still can’t blindly call it a bull market.
The rise has been too fast in a short period of time, and the passive buy pressure caused by leveraged liquidations cannot continue indefinitely. Next, the key is to see whether $72,000 can turn from a resistance level into support. If a pullback holds and, at the same time, the ETF continues to see net inflows, then the move has a chance to transition from a short-squeeze rebound into a real uptrend. If it falls back below $70,000 again, this rally is likely just a quick pulse created jointly by sentiment and leverage.
My view is quite straightforward: the direction has strengthened, but the risk of chasing at this point is still not low. A truly healthy move isn’t to keep pulling the price up in one continuous push—it’s to trade and change hands around $72,000, hold its ground, and then open up room to move higher. #BTC突破$72000
At first glance, this round of rally looks like a price breakout, but beneath the surface there are actually three forces driving it at the same time:
First, the U.S. Treasury plans to expand its long-term Treasury repurchase program. The market interprets it as an improvement at the margin of liquidity; the U.S. Dollar Index weakens, and risk assets collectively benefit.
Second, the U.S. spot BTC ETF saw net inflows of about $517 million on August 19. BlackRock’s IBIT contributed roughly $285 million—spot capital really has started coming back.
Third, a large number of short positions were repeatedly liquidated. Over the past 24 hours, total liquidations across the market exceeded $3.2 billion, forming a classic short-squeeze pattern.
But I think we still can’t blindly call it a bull market.
The rise has been too fast in a short period of time, and the passive buy pressure caused by leveraged liquidations cannot continue indefinitely. Next, the key is to see whether $72,000 can turn from a resistance level into support. If a pullback holds and, at the same time, the ETF continues to see net inflows, then the move has a chance to transition from a short-squeeze rebound into a real uptrend. If it falls back below $70,000 again, this rally is likely just a quick pulse created jointly by sentiment and leverage.
My view is quite straightforward: the direction has strengthened, but the risk of chasing at this point is still not low. A truly healthy move isn’t to keep pulling the price up in one continuous push—it’s to trade and change hands around $72,000, hold its ground, and then open up room to move higher. #BTC突破$72000
First, the U.S. Treasury plans to expand its long-term Treasury repurchase program. The market interprets it as an improvement at the margin of liquidity; the U.S. Dollar Index weakens, and risk assets collectively benefit.
Second, the U.S. spot BTC ETF saw net inflows of about $517 million on August 19. BlackRock’s IBIT contributed roughly $285 million—spot capital really has started coming back.
Third, a large number of short positions were repeatedly liquidated. Over the past 24 hours, total liquidations across the market exceeded $3.2 billion, forming a classic short-squeeze pattern.
But I think we still can’t blindly call it a bull market.
The rise has been too fast in a short period of time, and the passive buy pressure caused by leveraged liquidations cannot continue indefinitely. Next, the key is to see whether $72,000 can turn from a resistance level into support. If a pullback holds and, at the same time, the ETF continues to see net inflows, then the move has a chance to transition from a short-squeeze rebound into a real uptrend. If it falls back below $70,000 again, this rally is likely just a quick pulse created jointly by sentiment and leverage.
My view is quite straightforward: the direction has strengthened, but the risk of chasing at this point is still not low. A truly healthy move isn’t to keep pulling the price up in one continuous push—it’s to trade and change hands around $72,000, hold its ground, and then open up room to move higher. #BTC突破$72000

BTC-0.13%
IBITETF-0.58%
2
1.3k
Log in to explore more content
Join global crypto users on Binance Square
⚡️ Get latest and useful information about crypto.
💬 Trusted by the world’s largest crypto exchange.
👍 Discover real insights from verified creators.
Email / Phone number
Trending Topics
CircleMints500MUSDCOnSolana
5,906 views
317 Discussing
💰 MASSIVE: Circle Mints $500M $USDC on Solana!
Circle just minted 500 Million $USDC on Solana in 2 transactions ($250M + $250M) on Sept 25, in just 5.5 hours! 🚀
Solana now holds $7.48B+ $USDC dominance - over 50% of its $14.7B stablecoin supply.
Why Solana?
⚡️ Speed: 65k TPS
💸 Low Fees: $0.00025
🔥 DeFi Hub: Jupiter, Raydium pumping
This is one of the largest single-day mints & signals HUGE institutional demand for Solana ecosystem.
Bullish for $SOL? 👇
#Circle #USDC #Solana #Stablecoin #DeFi#circlemints500musdconsolana
True News
·8 Likes
·4.2k views
PolymarketBankFailureBetsDrawFDICConcern
18,898 views
542 Discussing
BlackRockBuildsTokenizedPortfoliosForOndo
14,538 views
368 Discussing