
TimingByParis
5k Posts

TimingByParis
Report
Block User
Narrativas sobre mercados, psicología y convicción. El precio se mueve. Las emociones revelan. Escribo lo que los gráficos no muestran.
Open Trade
Occasional Trader
4 Years
287 Following
22.8K+ Followers
43.8K+ Liked
Posts
Portfolio
All
Quotes
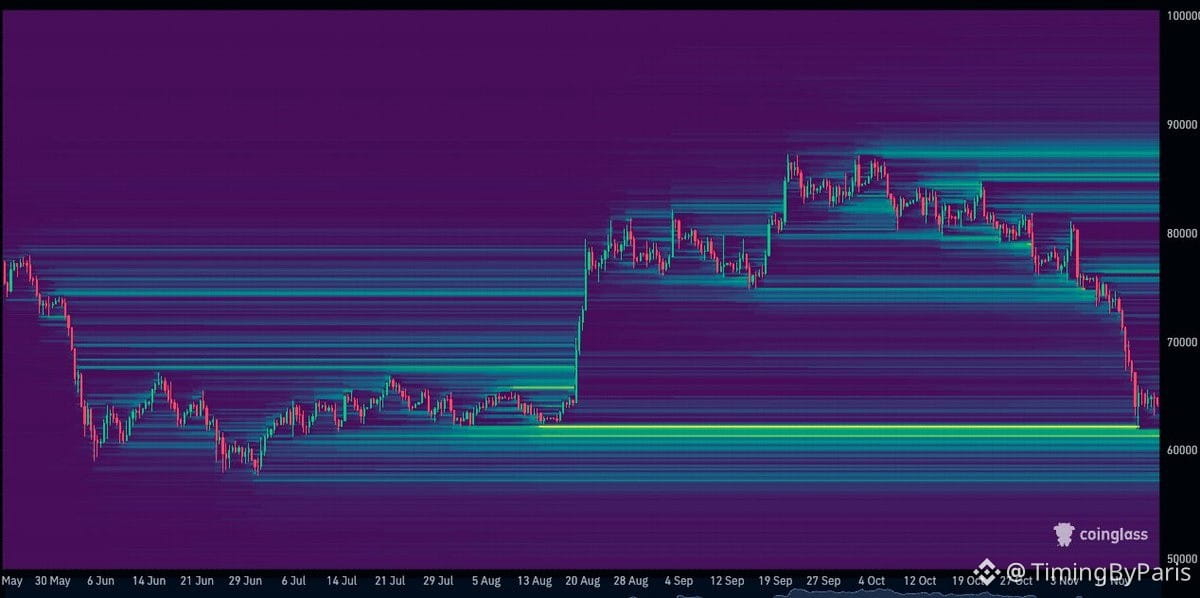
Bitcoin’s liquidation heatmap shows that the largest cluster of nearby liquidations remains below the price, concentrated around $61,000 and extending toward $59,500.
Beyond that, much of the liquidity is stacked above the price, where short liquidation levels have built up following the recent sell-off.
Although the $60k region remains an obvious downside liquidity target, the relief bounce could also trigger a squeeze toward the liquidity sitting above.
$BTC
{future}(BTCUSDT)
Bitcoin’s liquidation heatmap shows that the largest cluster of nearby liquidations remains below the price, concentrated around $61,000 and extending toward $59,500.
Beyond that, much of the liquidity is stacked above the price, where short liquidation levels have built up following the recent sell-off.
Although the $60k region remains an obvious downside liquidity target, the relief bounce could also trigger a squeeze toward the liquidity sitting above.
$BTC
Beyond that, much of the liquidity is stacked above the price, where short liquidation levels have built up following the recent sell-off.
Although the $60k region remains an obvious downside liquidity target, the relief bounce could also trigger a squeeze toward the liquidity sitting above.
$BTC
1
332
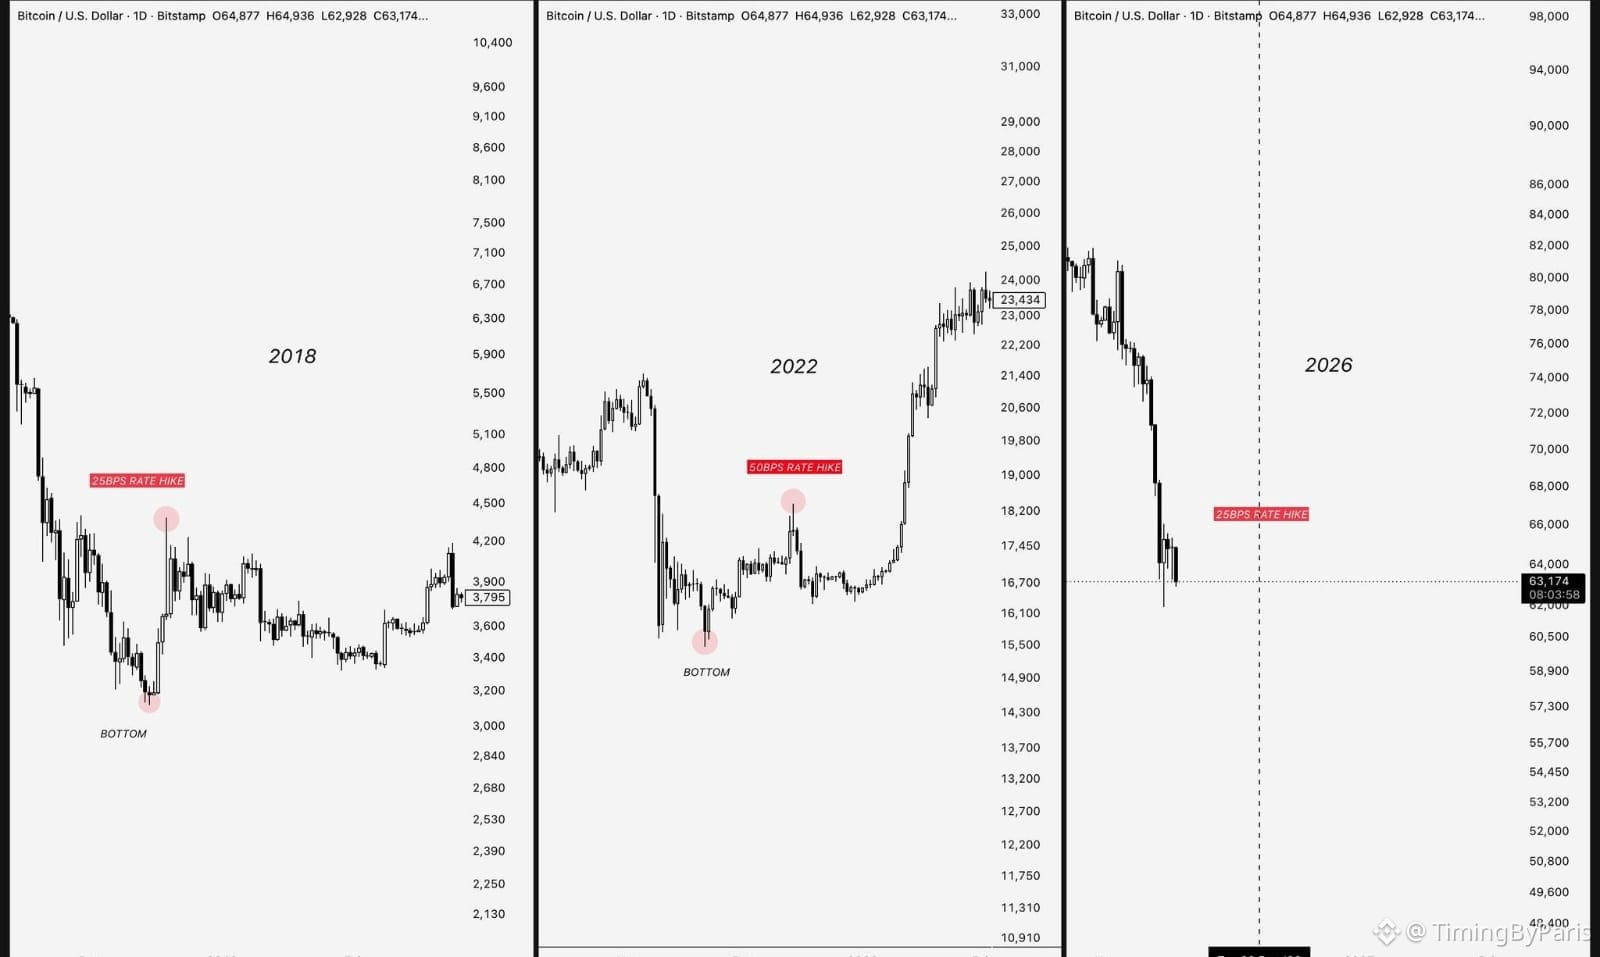
From a temporal perspective, this is potentially the point where we could see $BTC form a local or final bottom.
In both previous cycles, we saw weakness toward the end of the year, followed by a cycle bottom just before the FOMC meeting in December.
In 2018, the low formed on December 15, four days before a 25-basis-point hike.
In 2022, it formed on November 21, ahead of the 50-basis-point hike on December 14.
Now we’re seeing another aggressive year-end correction, with the next rate decision on December 9 and another hike expected. That gives us a pretty interesting comparison.
If a similar temporal sequence unfolds, we’d gradually begin to see some kind of short-term relief rally, followed by another period of weakness toward the meeting as markets price in a rate hike.
That would allow Bitcoin to form a Q4 bottom before the decision, as we’ve seen in the previous two cycles, and then gradually begin to build higher lows toward the start of 2027.
I’d expect fear to be priced in before the meeting, a bottom to form, and then a recovery in the chart structure to begin.
Perhaps the sequence will unfold in a similar way.
$BTC
{future}(BTCUSDT)
From a temporal perspective, this is potentially the point where we could see $BTC form a local or final bottom.
In both previous cycles, we saw weakness toward the end of the year, followed by a cycle bottom just before the FOMC meeting in December.
In 2018, the low formed on December 15, four days before a 25-basis-point hike.
In 2022, it formed on November 21, ahead of the 50-basis-point hike on December 14.
Now we’re seeing another aggressive year-end correction, with the next rate decision on December 9 and another hike expected. That gives us a pretty interesting comparison.
If a similar temporal sequence unfolds, we’d gradually begin to see some kind of short-term relief rally, followed by another period of weakness toward the meeting as markets price in a rate hike.
That would allow Bitcoin to form a Q4 bottom before the decision, as we’ve seen in the previous two cycles, and then gradually begin to build higher lows toward the start of 2027.
I’d expect fear to be priced in before the meeting, a bottom to form, and then a recovery in the chart structure to begin.
Perhaps the sequence will unfold in a similar way.
$BTC
In both previous cycles, we saw weakness toward the end of the year, followed by a cycle bottom just before the FOMC meeting in December.
In 2018, the low formed on December 15, four days before a 25-basis-point hike.
In 2022, it formed on November 21, ahead of the 50-basis-point hike on December 14.
Now we’re seeing another aggressive year-end correction, with the next rate decision on December 9 and another hike expected. That gives us a pretty interesting comparison.
If a similar temporal sequence unfolds, we’d gradually begin to see some kind of short-term relief rally, followed by another period of weakness toward the meeting as markets price in a rate hike.
That would allow Bitcoin to form a Q4 bottom before the decision, as we’ve seen in the previous two cycles, and then gradually begin to build higher lows toward the start of 2027.
I’d expect fear to be priced in before the meeting, a bottom to form, and then a recovery in the chart structure to begin.
Perhaps the sequence will unfold in a similar way.
$BTC
3
2k
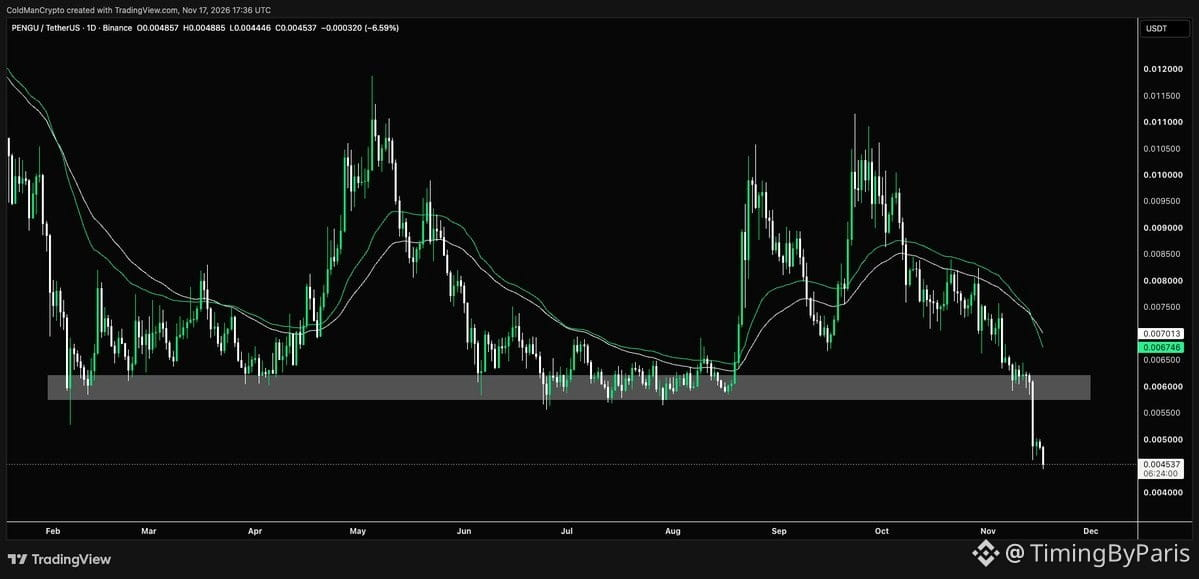
$PENGU looks terrible. There's no way to sugarcoat it.
After holding a key support zone around $0.006 for much of 2026, it has finally broken down.
Another memecoin fighting to survive in a market
{future}(PENGUUSDT)
$PENGU looks terrible. There's no way to sugarcoat it.
After holding a key support zone around $0.006 for much of 2026, it has finally broken down.
Another memecoin fighting to survive in a market
After holding a key support zone around $0.006 for much of 2026, it has finally broken down.
Another memecoin fighting to survive in a market
1
319
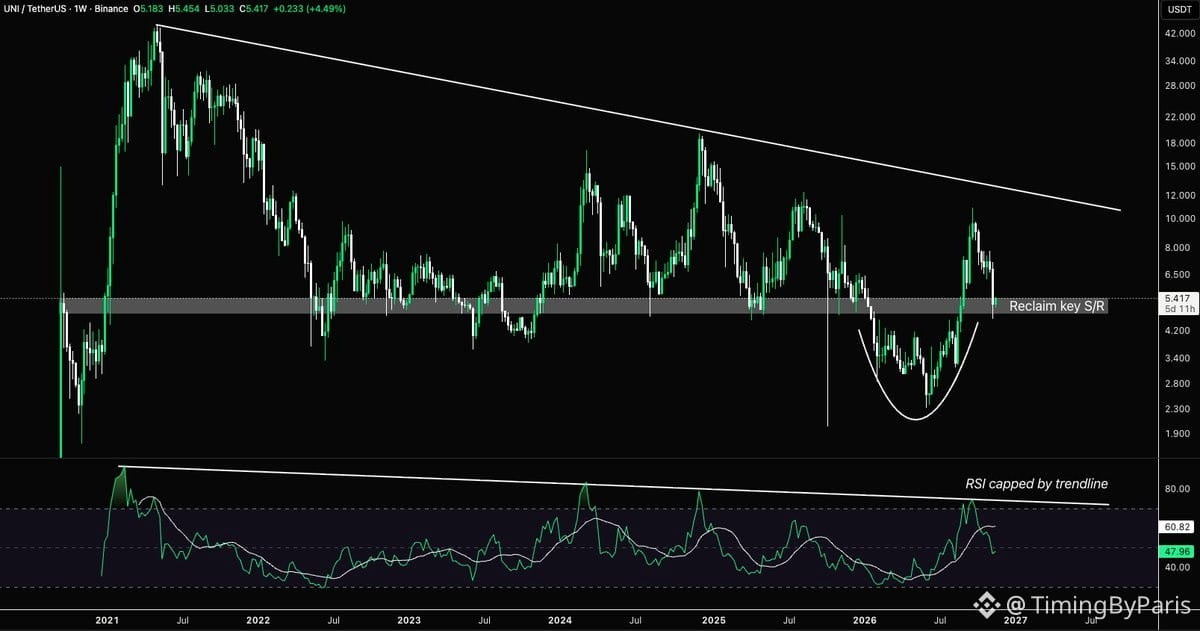
Bulls in $UNI face a crucial test at $5.
Driven by growing on-chain activity linked to Robinhood, $UNI recovered approximately 380% from May to September, reclaiming a major multiyear support/resistance level.
However, after a sharp rejection from recent highs, the price has returned to retest this key $5 region.
For the bulls, holding this level is crucial if the recovery is to continue.
Failure to defend $5 would weaken the bullish structure and increase the likelihood of a prolonged correction toward levels below $4.
The weekly RSI also remains capped by a multiyear descending trendline. For a sustained bullish breakout, the bulls will want to see this trendline broken and momentum strengthen.
$UNI
{future}(UNIUSDT)
Bulls in $UNI face a crucial test at $5.
Driven by growing on-chain activity linked to Robinhood, $UNI recovered approximately 380% from May to September, reclaiming a major multiyear support/resistance level.
However, after a sharp rejection from recent highs, the price has returned to retest this key $5 region.
For the bulls, holding this level is crucial if the recovery is to continue.
Failure to defend $5 would weaken the bullish structure and increase the likelihood of a prolonged correction toward levels below $4.
The weekly RSI also remains capped by a multiyear descending trendline. For a sustained bullish breakout, the bulls will want to see this trendline broken and momentum strengthen.
$UNI
Driven by growing on-chain activity linked to Robinhood, $UNI recovered approximately 380% from May to September, reclaiming a major multiyear support/resistance level.
However, after a sharp rejection from recent highs, the price has returned to retest this key $5 region.
For the bulls, holding this level is crucial if the recovery is to continue.
Failure to defend $5 would weaken the bullish structure and increase the likelihood of a prolonged correction toward levels below $4.
The weekly RSI also remains capped by a multiyear descending trendline. For a sustained bullish breakout, the bulls will want to see this trendline broken and momentum strengthen.
$UNI
2
357
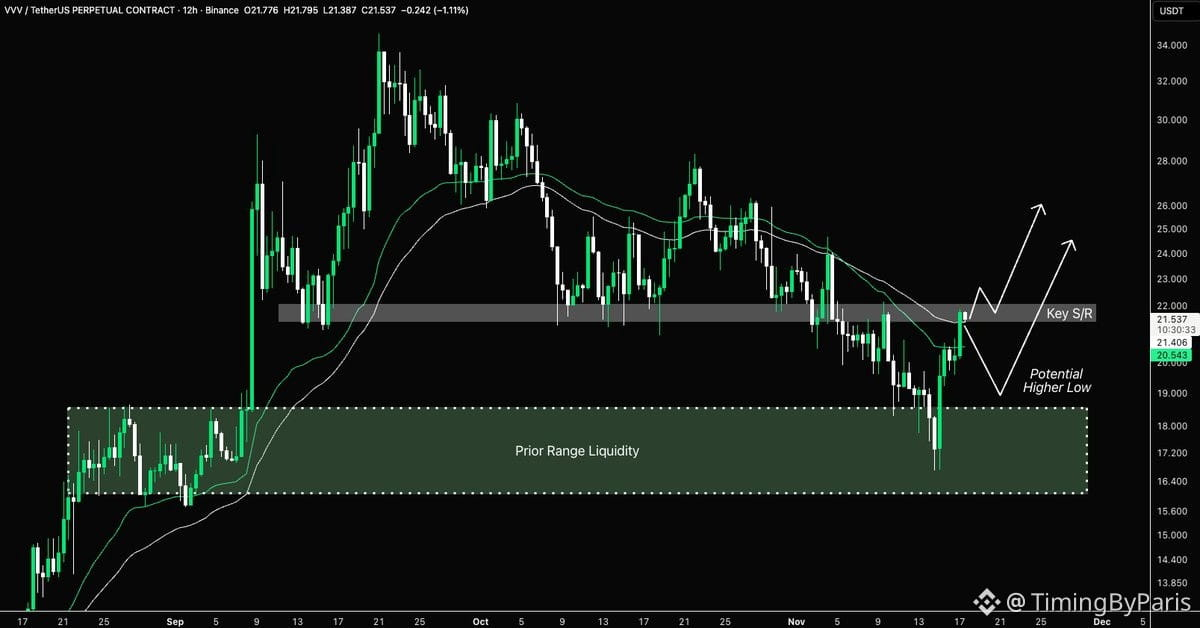
$VVV rises 30% as bulls look to reclaim key resistance 📈
After a correction toward the liquidity of its previous trading range, $VVV has risen approximately 30% and is now testing the key resistance level at $22.
For a bullish continuation, there are two scenarios to watch:
A clean break above $22, followed by a successful retest as support.
A rejection at $22, followed by a higher low on the 12H/daily timeframe before another attempt to break higher.
As long as the major swing low around $16 remains intact, the broader recovery structure remains constructive.
$VVV rises 30% as bulls look to reclaim key resistance 📈
After a correction toward the liquidity of its previous trading range, $VVV has risen approximately 30% and is now testing the key resistance level at $22.
For a bullish continuation, there are two scenarios to watch:
A clean break above $22, followed by a successful retest as support.
A rejection at $22, followed by a higher low on the 12H/daily timeframe before another attempt to break higher.
As long as the major swing low around $16 remains intact, the broader recovery structure remains constructive.
After a correction toward the liquidity of its previous trading range, $VVV has risen approximately 30% and is now testing the key resistance level at $22.
For a bullish continuation, there are two scenarios to watch:
A clean break above $22, followed by a successful retest as support.
A rejection at $22, followed by a higher low on the 12H/daily timeframe before another attempt to break higher.
As long as the major swing low around $16 remains intact, the broader recovery structure remains constructive.
1
228
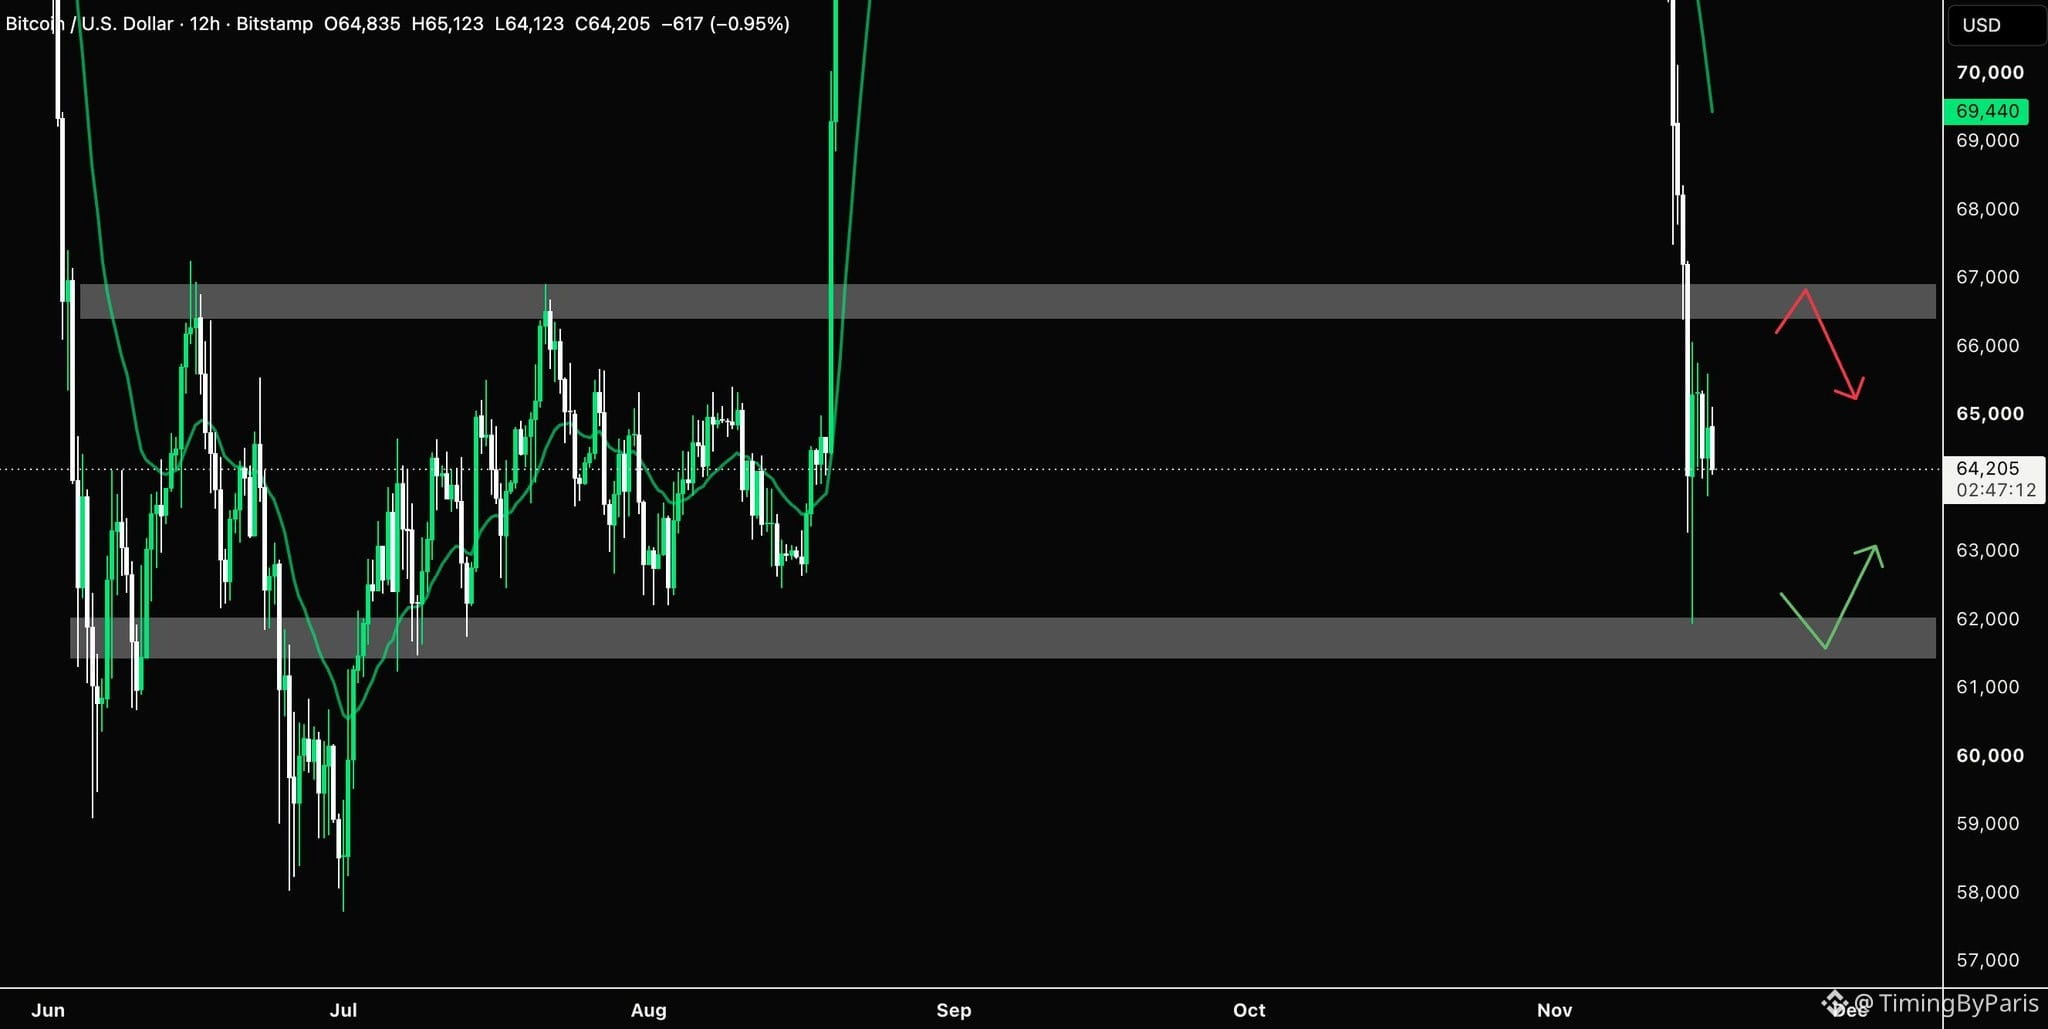
BTC has now fallen back into its previous June-to-August trading range, between approximately $62k and $67k.
Although BTC has yet to establish a clear new range following the recent sell-off, the previous structure gives us some useful levels to work with. And with those in mind, the best opportunities usually come at the extremes, rather than from chasing price in the middle.
Until BTC establishes a clear directional breakout, there’s no need to overcomplicate things. If it looks like a range, play it as a range.
$BTC
{future}(BTCUSDT)
BTC has now fallen back into its previous June-to-August trading range, between approximately $62k and $67k.
Although BTC has yet to establish a clear new range following the recent sell-off, the previous structure gives us some useful levels to work with. And with those in mind, the best opportunities usually come at the extremes, rather than from chasing price in the middle.
Until BTC establishes a clear directional breakout, there’s no need to overcomplicate things. If it looks like a range, play it as a range.
$BTC
Although BTC has yet to establish a clear new range following the recent sell-off, the previous structure gives us some useful levels to work with. And with those in mind, the best opportunities usually come at the extremes, rather than from chasing price in the middle.
Until BTC establishes a clear directional breakout, there’s no need to overcomplicate things. If it looks like a range, play it as a range.
$BTC
1
383
In trading, the key to being more profitable is to trade less. Tell me what you think
In trading, the key to being more profitable is to trade less. Tell me what you think
2
2
128
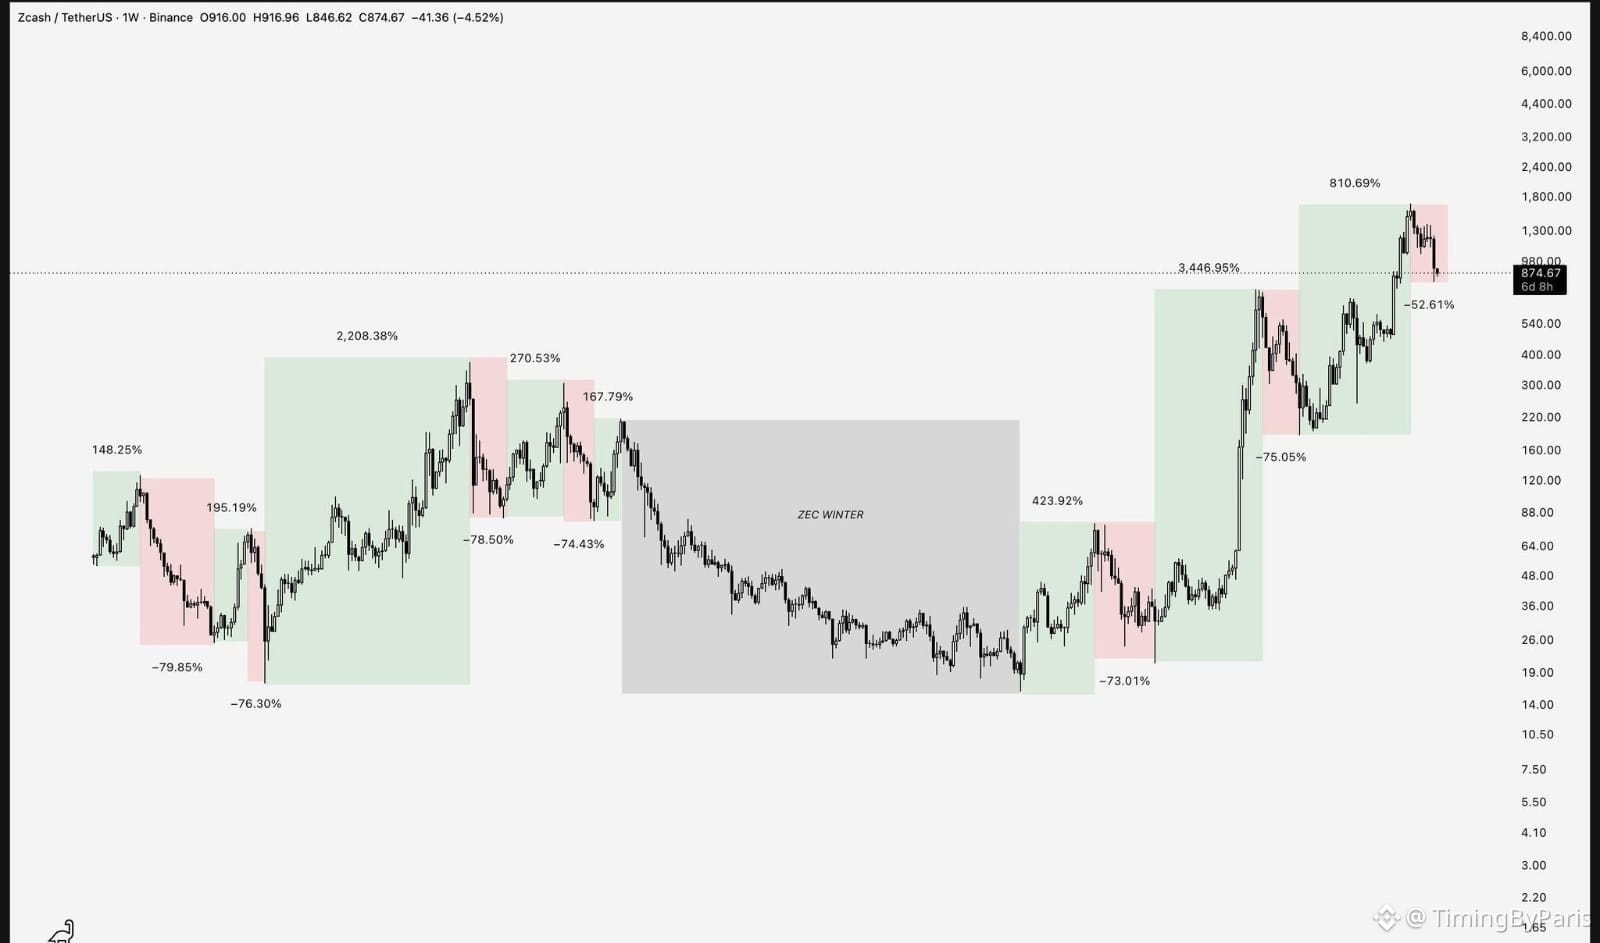
If you simply study the cycles of $ZEC over the last seven years, you’ll understand why a deeper correction was always part of the expectations for this phase of its cycle.
Aside from ZEC’s prolonged winter from 2022–2024, every time the chart has experienced a weekly macro expansion, it has been followed by a consistent sequence of corrections.
After each rally of more than 100%, we then saw corrections of approximately 70–80%.
Different rally sizes, different market conditions, but a similar amount of reversal once those expansions ended.
That’s why what seemed like a crazy expectation during the rally euphoria wasn’t particularly unusual for Zcash. The chart has gone through the same process several times.
So far, we’ve seen a correction of around 53% following an expansion of approximately 811%. It’s a substantial move down, but still considerably smaller than the corrections that followed those previous rallies.
However, I do believe Zcash is maturing as an asset. As liquidity develops, I’d expect the size of these macro corrections to gradually compress. That means allowing for a shallower correction rather than automatically expecting another 70–80% decline.
Whether that compression begins here or a little further down the road is something we still need to see.
To put the current reversal in context, a correction of around 60% would take us toward the $650 region. If we formed a low there, it would still be the shallowest macro correction among the completed cycles on this chart.
That’s why I’ve consistently maintained since $1,400 that further downside lies ahead, without this turning into an unusually deep correction for Zcash.
Even at those lower levels, we’d already be seeing a reduction in the drawdown compared with its previous euphoric expansions.
$ZEC
{future}(ZECUSDT)
If you simply study the cycles of $ZEC over the last seven years, you’ll understand why a deeper correction was always part of the expectations for this phase of its cycle.
Aside from ZEC’s prolonged winter from 2022–2024, every time the chart has experienced a weekly macro expansion, it has been followed by a consistent sequence of corrections.
After each rally of more than 100%, we then saw corrections of approximately 70–80%.
Different rally sizes, different market conditions, but a similar amount of reversal once those expansions ended.
That’s why what seemed like a crazy expectation during the rally euphoria wasn’t particularly unusual for Zcash. The chart has gone through the same process several times.
So far, we’ve seen a correction of around 53% following an expansion of approximately 811%. It’s a substantial move down, but still considerably smaller than the corrections that followed those previous rallies.
However, I do believe Zcash is maturing as an asset. As liquidity develops, I’d expect the size of these macro corrections to gradually compress. That means allowing for a shallower correction rather than automatically expecting another 70–80% decline.
Whether that compression begins here or a little further down the road is something we still need to see.
To put the current reversal in context, a correction of around 60% would take us toward the $650 region. If we formed a low there, it would still be the shallowest macro correction among the completed cycles on this chart.
That’s why I’ve consistently maintained since $1,400 that further downside lies ahead, without this turning into an unusually deep correction for Zcash.
Even at those lower levels, we’d already be seeing a reduction in the drawdown compared with its previous euphoric expansions.
$ZEC
Aside from ZEC’s prolonged winter from 2022–2024, every time the chart has experienced a weekly macro expansion, it has been followed by a consistent sequence of corrections.
After each rally of more than 100%, we then saw corrections of approximately 70–80%.
Different rally sizes, different market conditions, but a similar amount of reversal once those expansions ended.
That’s why what seemed like a crazy expectation during the rally euphoria wasn’t particularly unusual for Zcash. The chart has gone through the same process several times.
So far, we’ve seen a correction of around 53% following an expansion of approximately 811%. It’s a substantial move down, but still considerably smaller than the corrections that followed those previous rallies.
However, I do believe Zcash is maturing as an asset. As liquidity develops, I’d expect the size of these macro corrections to gradually compress. That means allowing for a shallower correction rather than automatically expecting another 70–80% decline.
Whether that compression begins here or a little further down the road is something we still need to see.
To put the current reversal in context, a correction of around 60% would take us toward the $650 region. If we formed a low there, it would still be the shallowest macro correction among the completed cycles on this chart.
That’s why I’ve consistently maintained since $1,400 that further downside lies ahead, without this turning into an unusually deep correction for Zcash.
Even at those lower levels, we’d already be seeing a reduction in the drawdown compared with its previous euphoric expansions.
$ZEC
1
631
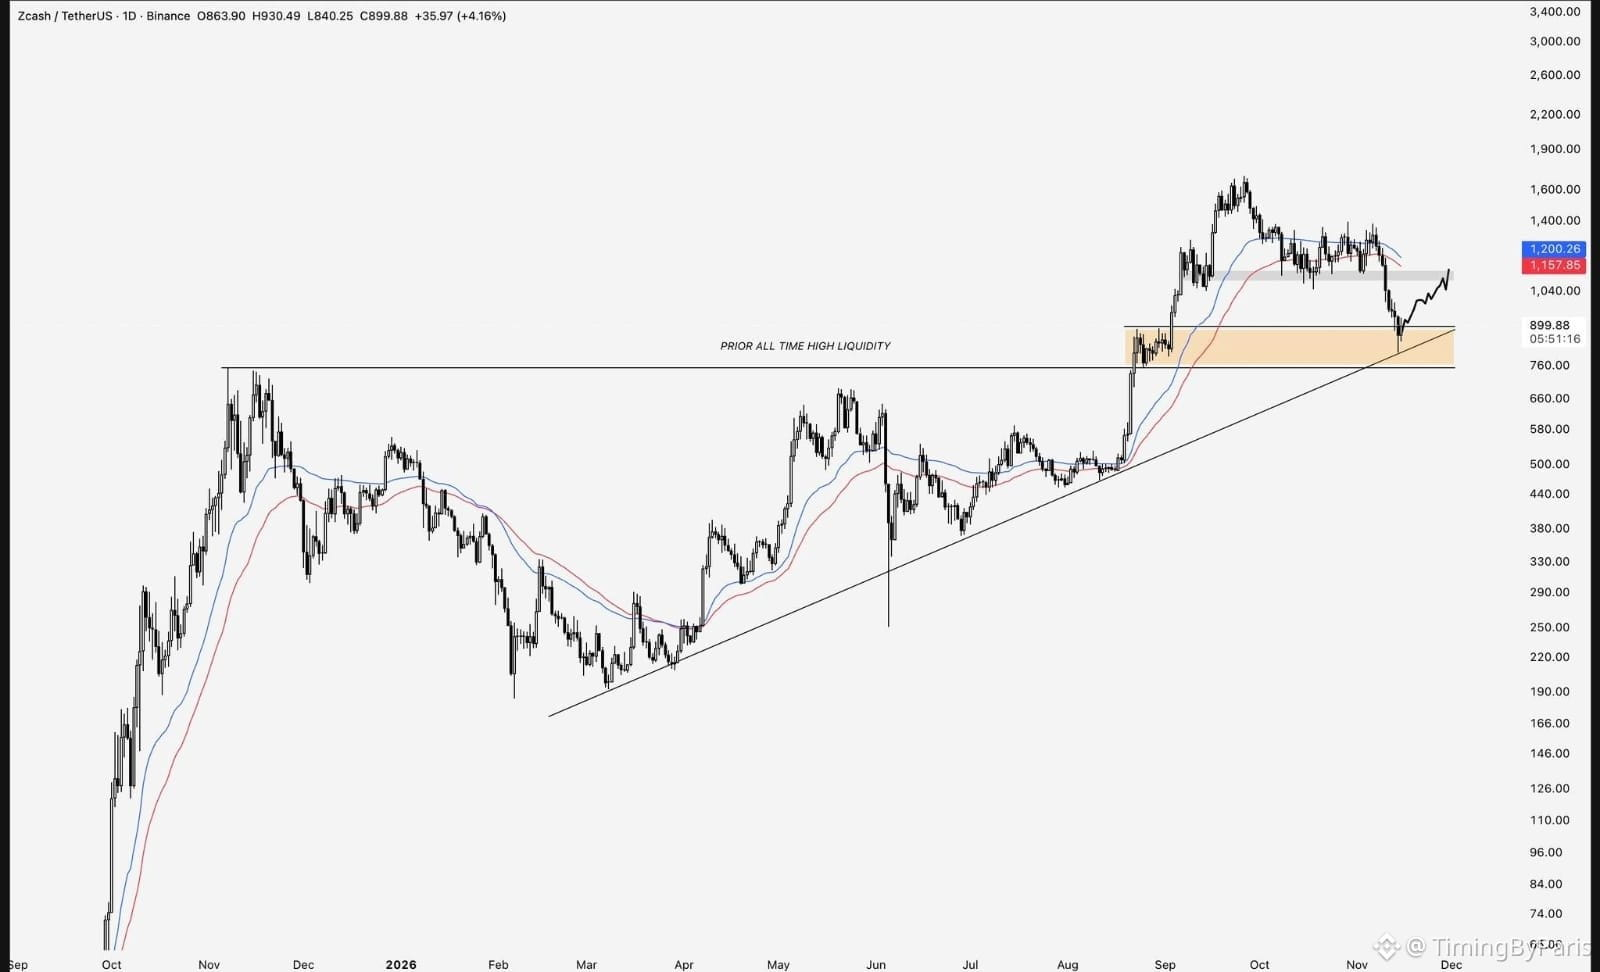
$ZEC.. just in time for the roadmap. 🎯
Take liquidity from the previous all-time high region, hunt the macro trendline, and gather enough combined liquidity from both for a bounce.
As long as BTC stays stable and doesn’t screw things up over the next few days, we should start seeing the next relief rally for $ZEC, probably toward the $1,040-$1,150 zone.
If BTC collapses, losing the ZEC trendline that’s been running since February would probably give us the final washout toward the lows.
$ZEC
{future}(ZECUSDT)
$ZEC .. just in time for the roadmap. 🎯
Take liquidity from the previous all-time high region, hunt the macro trendline, and gather enough combined liquidity from both for a bounce.
As long as BTC stays stable and doesn’t screw things up over the next few days, we should start seeing the next relief rally for $ZEC , probably toward the $1,040-$1,150 zone.
If BTC collapses, losing the ZEC trendline that’s been running since February would probably give us the final washout toward the lows.
$ZEC
Take liquidity from the previous all-time high region, hunt the macro trendline, and gather enough combined liquidity from both for a bounce.
As long as BTC stays stable and doesn’t screw things up over the next few days, we should start seeing the next relief rally for $ZEC , probably toward the $1,040-$1,150 zone.
If BTC collapses, losing the ZEC trendline that’s been running since February would probably give us the final washout toward the lows.
$ZEC
2
799
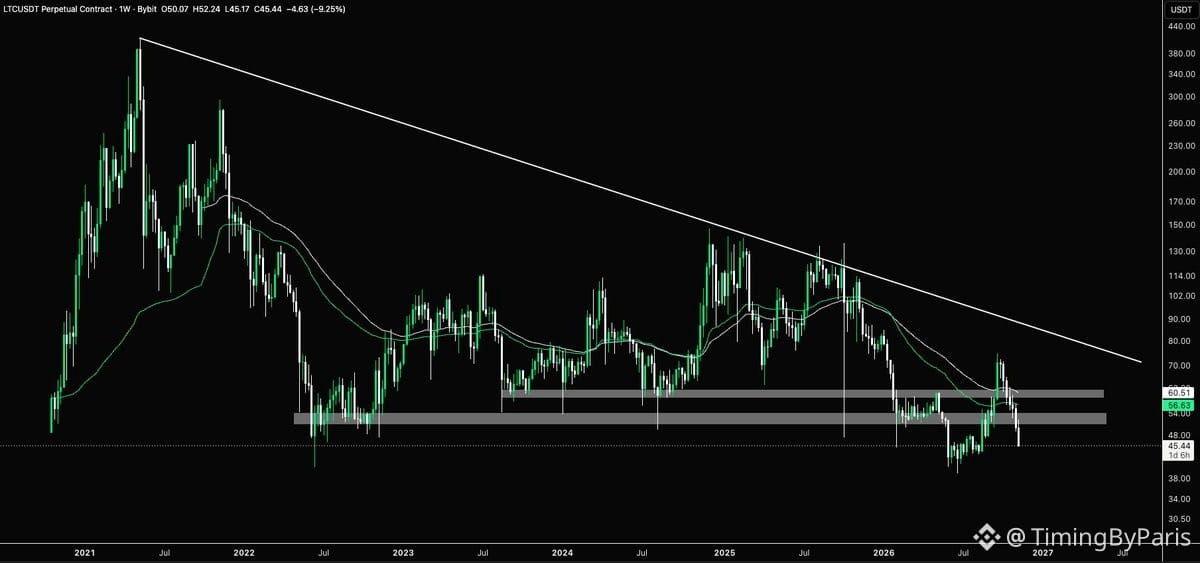
Has Litecoin's market passed it?
Litecoin was designed to be a faster, lighter alternative to Bitcoin.
But since 2021, $LTC has spent years trading within a broad descending triangle, with every major rally producing a lower high.
Over the summer, Litecoin managed to reclaim a key multi-year support/resistance level around $50, giving bulls renewed hope as the price surged toward $130.
Since then, $LTC has given back those gains, with that same level now threatening to act as resistance once again.
Moving averages remain above the price and are curling downward, reinforcing the bearish structure.
But fundamentally, there's a bigger question at play.
With $BTC valued at approximately $1.35 trillion and LTC at just $3 billion, is Litecoin's narrative as a “faster, lighter BTC” struggling to resonate with the market?
Has Litecoin's market passed it?
Litecoin was designed to be a faster, lighter alternative to Bitcoin.
But since 2021, $LTC has spent years trading within a broad descending triangle, with every major rally producing a lower high.
Over the summer, Litecoin managed to reclaim a key multi-year support/resistance level around $50, giving bulls renewed hope as the price surged toward $130.
Since then, $LTC has given back those gains, with that same level now threatening to act as resistance once again.
Moving averages remain above the price and are curling downward, reinforcing the bearish structure.
But fundamentally, there's a bigger question at play.
With $BTC valued at approximately $1.35 trillion and LTC at just $3 billion, is Litecoin's narrative as a “faster, lighter BTC” struggling to resonate with the market?
Litecoin was designed to be a faster, lighter alternative to Bitcoin.
But since 2021, $LTC has spent years trading within a broad descending triangle, with every major rally producing a lower high.
Over the summer, Litecoin managed to reclaim a key multi-year support/resistance level around $50, giving bulls renewed hope as the price surged toward $130.
Since then, $LTC has given back those gains, with that same level now threatening to act as resistance once again.
Moving averages remain above the price and are curling downward, reinforcing the bearish structure.
But fundamentally, there's a bigger question at play.
With $BTC valued at approximately $1.35 trillion and LTC at just $3 billion, is Litecoin's narrative as a “faster, lighter BTC” struggling to resonate with the market?
1
320
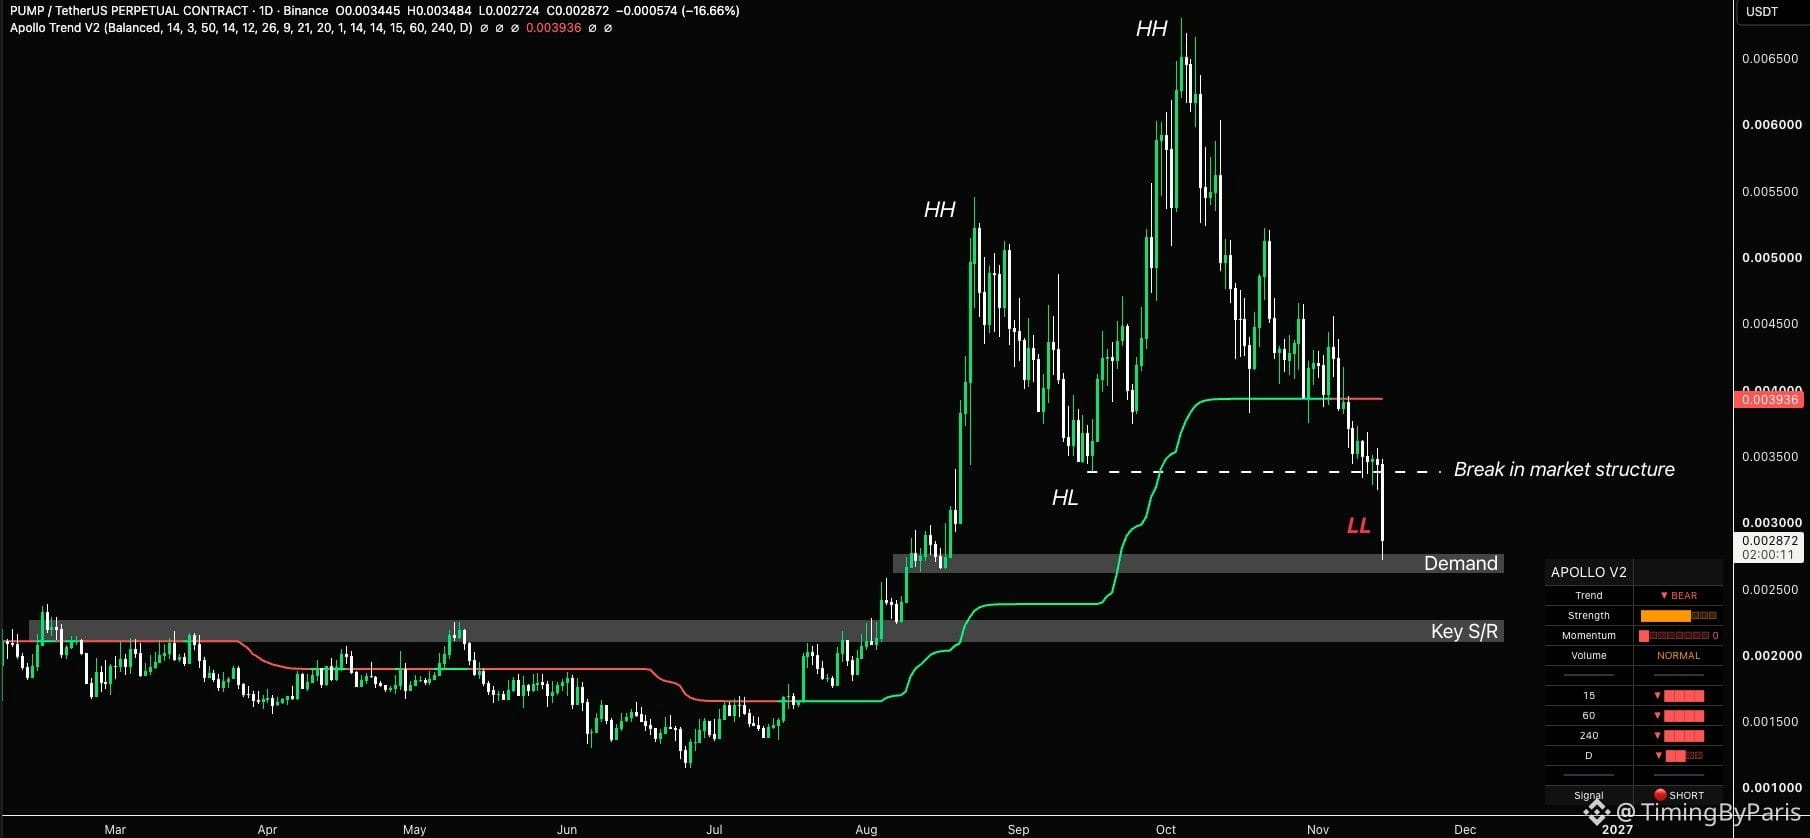
PUMP has broken its bullish market structure 🚨
After establishing a series of higher highs and higher lows, $PUMP has now lost its previous higher low around $0.0034.
This marks a significant shift in market structure, with the price recording a lower low and trading below the Apollo trend indicator.
Bulls now face a critical test at the $0.0027 demand zone.
Failing to defend this region would put the next major support around $0.0021–$0.0023 firmly in focus.
Memecoins are undoubtedly one of the least attractive sectors for risk exposure, given their speculative nature and tendency to experience amplified declines during risk-off conditions.
$PUMP
{future}(PUMPUSDT)
PUMP has broken its bullish market structure 🚨
After establishing a series of higher highs and higher lows, $PUMP has now lost its previous higher low around $0.0034.
This marks a significant shift in market structure, with the price recording a lower low and trading below the Apollo trend indicator.
Bulls now face a critical test at the $0.0027 demand zone.
Failing to defend this region would put the next major support around $0.0021–$0.0023 firmly in focus.
Memecoins are undoubtedly one of the least attractive sectors for risk exposure, given their speculative nature and tendency to experience amplified declines during risk-off conditions.
$PUMP
After establishing a series of higher highs and higher lows, $PUMP has now lost its previous higher low around $0.0034.
This marks a significant shift in market structure, with the price recording a lower low and trading below the Apollo trend indicator.
Bulls now face a critical test at the $0.0027 demand zone.
Failing to defend this region would put the next major support around $0.0021–$0.0023 firmly in focus.
Memecoins are undoubtedly one of the least attractive sectors for risk exposure, given their speculative nature and tendency to experience amplified declines during risk-off conditions.
$PUMP
1
392
$ZEC
{future}(ZECUSDT)
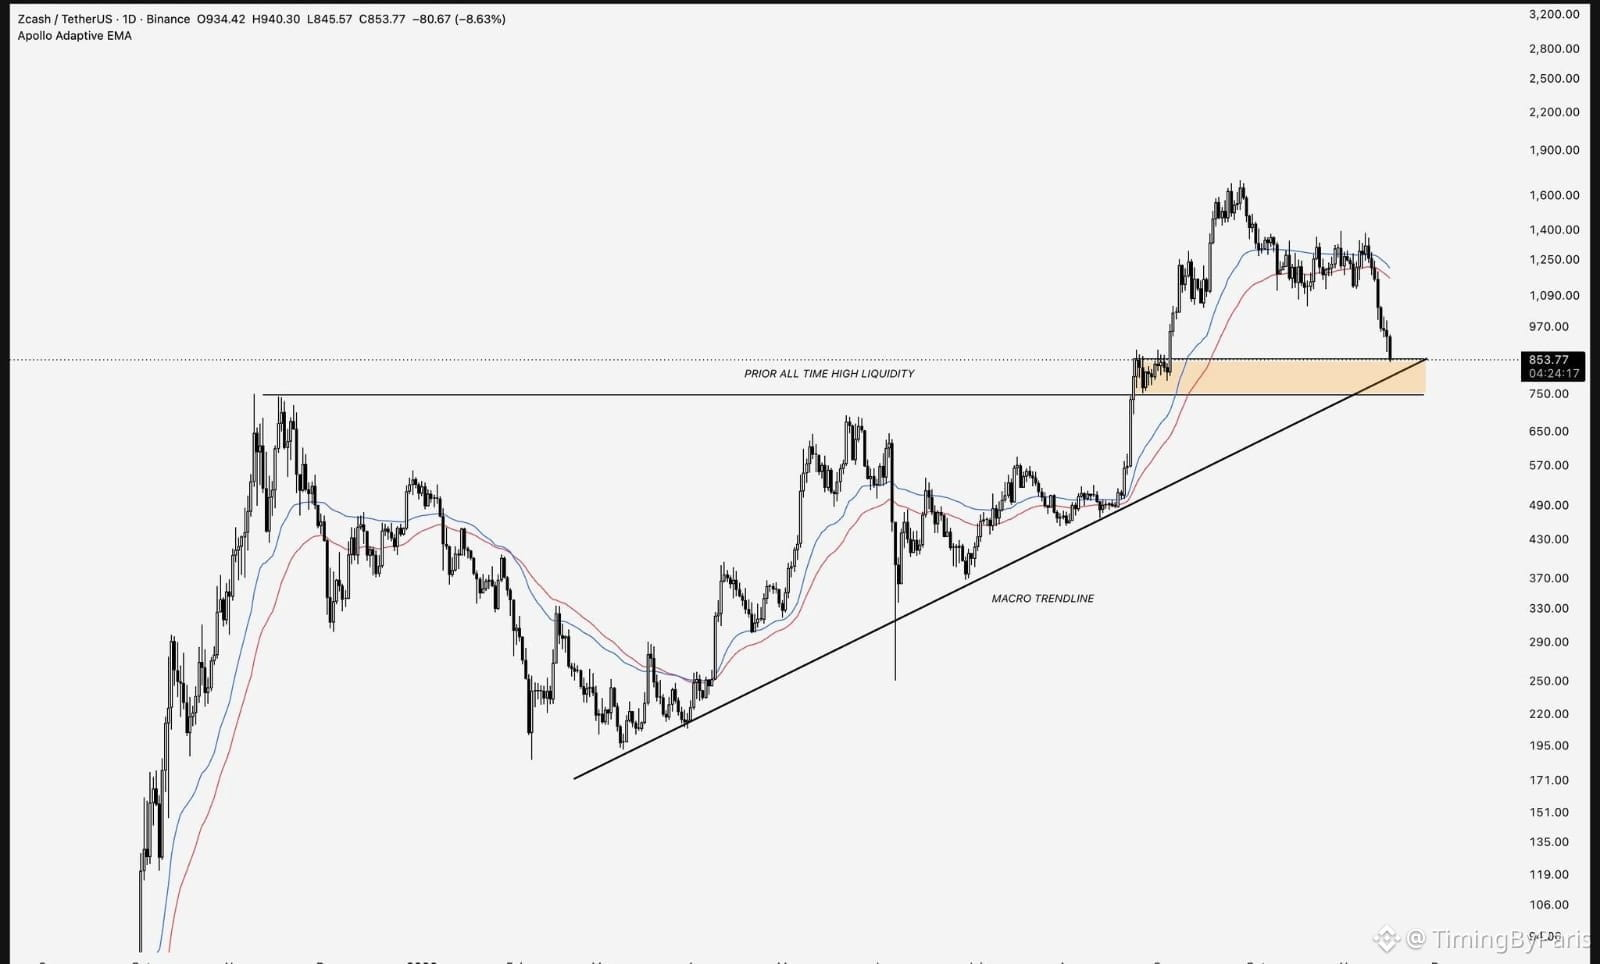
it is now moving toward the final stages of the macro roadmap I outlined a month ago.
We’ve seen the move toward our highlighted range accelerate without a relief bounce, given BTC and market price action over the past week.
It is also slowly approaching the macro trendline that has supported every major pullback since the February lows at $180, which is a significant development to watch.
I still expect us to find some kind of bounce from the liquidity within this range before hunting for liquidity below the previous all-time high in an attempt to stabilize. Then we can see what the rest of the year brings for the chart.
I think there is naturally a lot of pessimism about Zcash right now, but a hunt below the liquidity at the previous all-time high would represent a correction of approximately 60%. Although that seemed unlikely when I first proposed it, it is still in line with what we’ve seen after previous euphoric highs. So, in my opinion, there isn’t much to worry about or be surprised by.
Personally, I DCA’d into some spot positions today as a hedge against my shorts from $1,420, and I’ll continue reassessing where to add to my holdings as we see price action unfold over the rest of the year.
$ZEC
it is now moving toward the final stages of the macro roadmap I outlined a month ago.
We’ve seen the move toward our highlighted range accelerate without a relief bounce, given BTC and market price action over the past week.
It is also slowly approaching the macro trendline that has supported every major pullback since the February lows at $180, which is a significant development to watch.
I still expect us to find some kind of bounce from the liquidity within this range before hunting for liquidity below the previous all-time high in an attempt to stabilize. Then we can see what the rest of the year brings for the chart.
I think there is naturally a lot of pessimism about Zcash right now, but a hunt below the liquidity at the previous all-time high would represent a correction of approximately 60%. Although that seemed unlikely when I first proposed it, it is still in line with what we’ve seen after previous euphoric highs. So, in my opinion, there isn’t much to worry about or be surprised by.
Personally, I DCA’d into some spot positions today as a hedge against my shorts from $1,420, and I’ll continue reassessing where to add to my holdings as we see price action unfold over the rest of the year.
it is now moving toward the final stages of the macro roadmap I outlined a month ago.
We’ve seen the move toward our highlighted range accelerate without a relief bounce, given BTC and market price action over the past week.
It is also slowly approaching the macro trendline that has supported every major pullback since the February lows at $180, which is a significant development to watch.
I still expect us to find some kind of bounce from the liquidity within this range before hunting for liquidity below the previous all-time high in an attempt to stabilize. Then we can see what the rest of the year brings for the chart.
I think there is naturally a lot of pessimism about Zcash right now, but a hunt below the liquidity at the previous all-time high would represent a correction of approximately 60%. Although that seemed unlikely when I first proposed it, it is still in line with what we’ve seen after previous euphoric highs. So, in my opinion, there isn’t much to worry about or be surprised by.
Personally, I DCA’d into some spot positions today as a hedge against my shorts from $1,420, and I’ll continue reassessing where to add to my holdings as we see price action unfold over the rest of the year.
3
1.1k
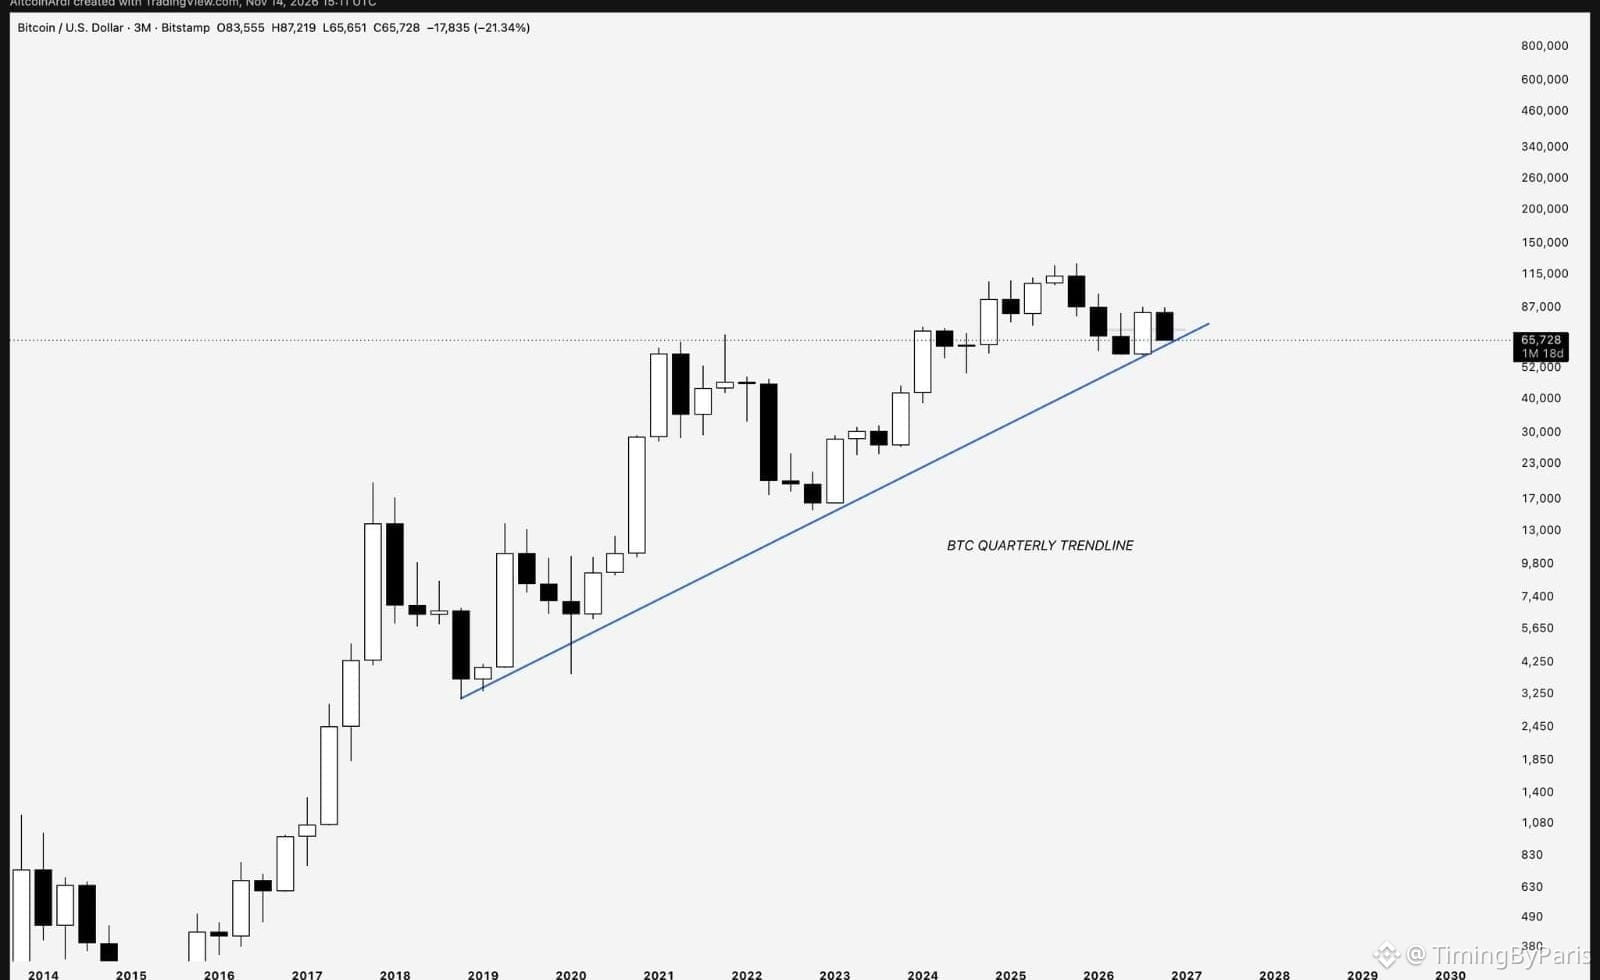
Nobody seems to be talking about this, but it’s probably one of the most important technical charts for $BTC right now.
The eight-year trend line going all the way back to when Bitcoin was at $3,000.
It runs through the 2018 and 2022 bear market lows, and now we’re testing it again on the monthly and quarterly charts.
Needless to say, if we lose this trend line, it needs to recover very quickly. Otherwise, we can expect a much more aggressive drop below $57K.
“The higher the time frame, the bigger the breakout.”
$BTC
{future}(BTCUSDT)
Nobody seems to be talking about this, but it’s probably one of the most important technical charts for $BTC right now.
The eight-year trend line going all the way back to when Bitcoin was at $3,000.
It runs through the 2018 and 2022 bear market lows, and now we’re testing it again on the monthly and quarterly charts.
Needless to say, if we lose this trend line, it needs to recover very quickly. Otherwise, we can expect a much more aggressive drop below $57K.
“The higher the time frame, the bigger the breakout.”
$BTC
The eight-year trend line going all the way back to when Bitcoin was at $3,000.
It runs through the 2018 and 2022 bear market lows, and now we’re testing it again on the monthly and quarterly charts.
Needless to say, if we lose this trend line, it needs to recover very quickly. Otherwise, we can expect a much more aggressive drop below $57K.
“The higher the time frame, the bigger the breakout.”
$BTC
1
4
1.4k
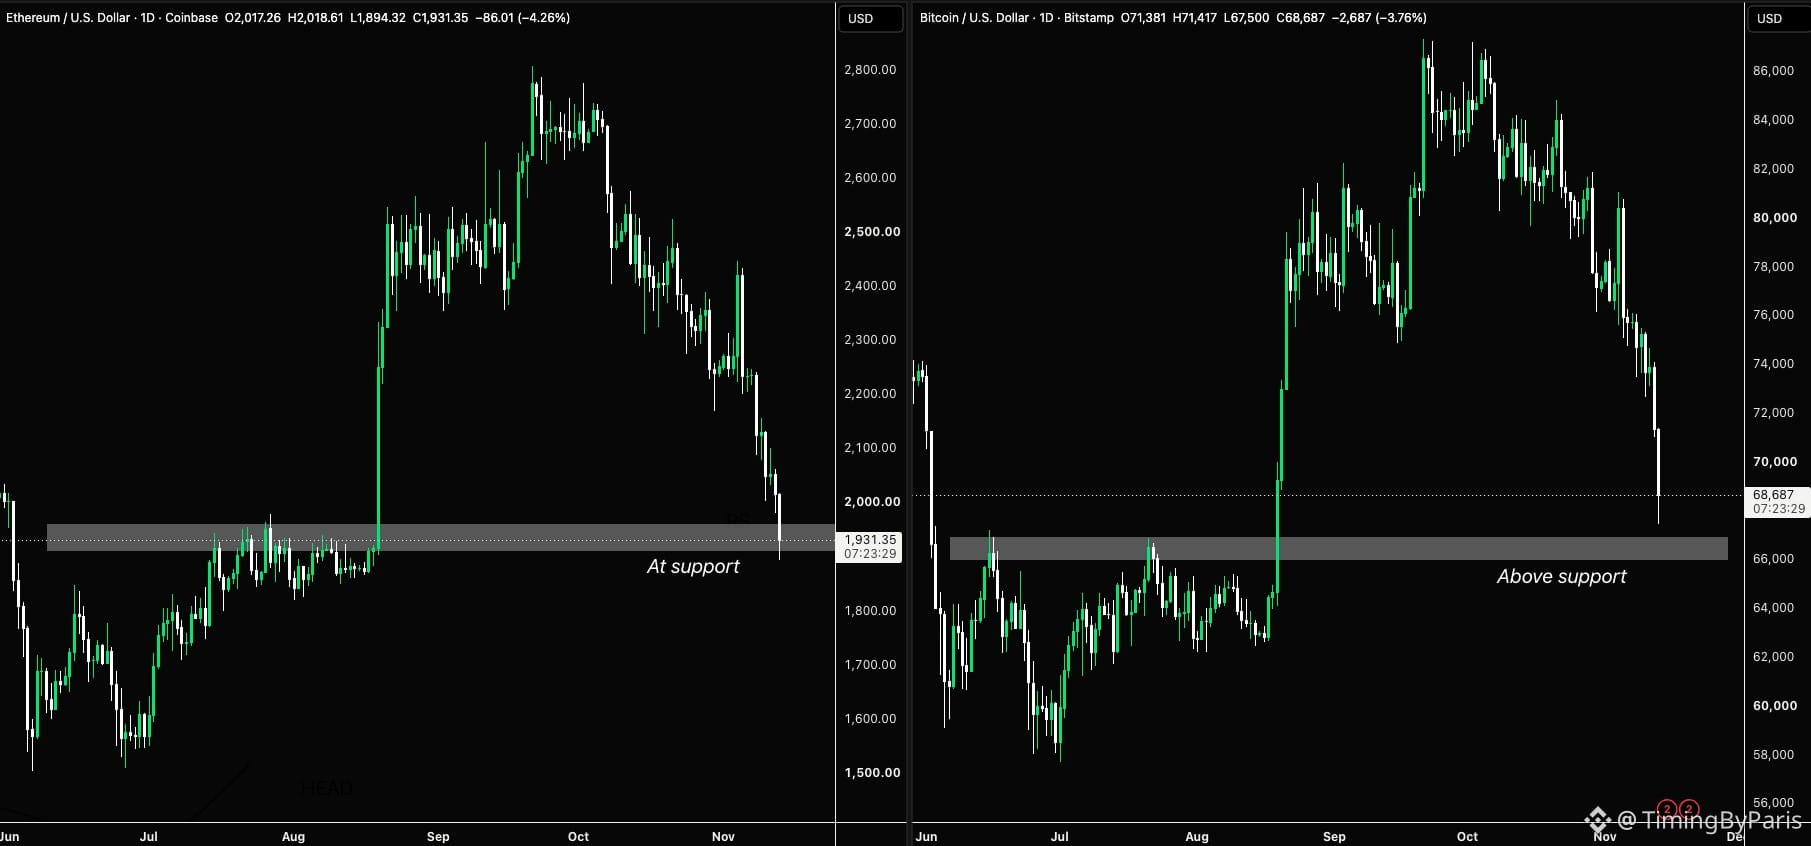
$ETH is now testing its main daily support around $1,900, while $BTC is holding above its equivalent support zone at $66,000.
Both assets have experienced aggressive selling, but ETH is already testing a level BTC has yet to reach.
Ethereum is underperforming right now, but is it giving us an early warning of Bitcoin’s next move?
$ETH is now testing its main daily support around $1,900, while $BTC is holding above its equivalent support zone at $66,000.
Both assets have experienced aggressive selling, but ETH is already testing a level BTC has yet to reach.
Ethereum is underperforming right now, but is it giving us an early warning of Bitcoin’s next move?
Both assets have experienced aggressive selling, but ETH is already testing a level BTC has yet to reach.
Ethereum is underperforming right now, but is it giving us an early warning of Bitcoin’s next move?
1
317
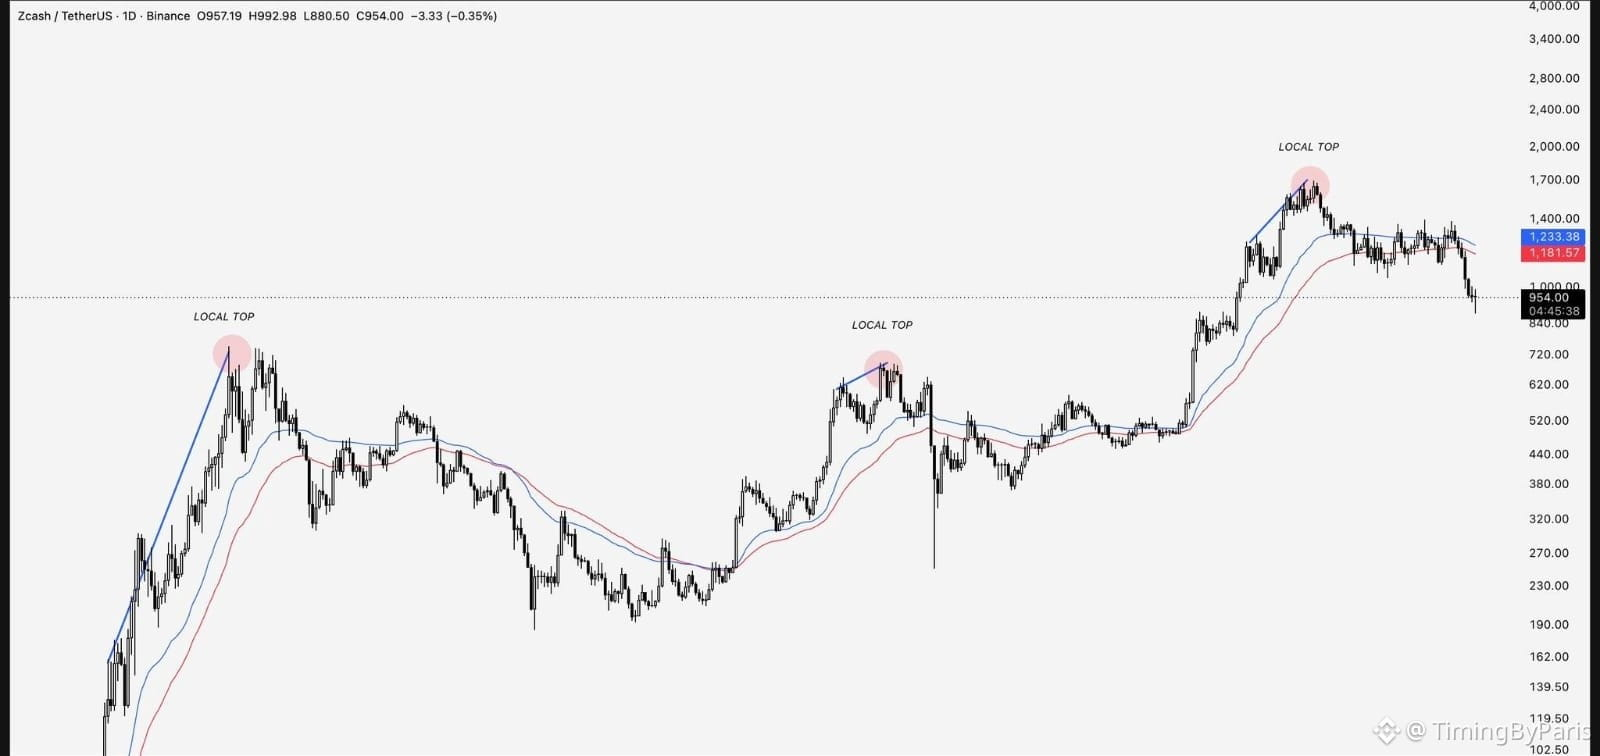
The bearish RSI divergence on the daily chart of $ZEC rarely fails to deliver results.
Three out of three in marking its macro highs over the last 12 months.
Every time Zcash has formed an expansive higher high while the RSI formed a lower high, a local top and the beginning of a macro correction have subsequently followed.
We have also seen the opposite, with bullish RSI divergence marking the start of macro markup phases.
I’ll be watching closely to see whether a macro bullish divergence develops during this correction, which could give us an early signal of the next expansion phase.
$ZEC
{future}(ZECUSDT)
The bearish RSI divergence on the daily chart of $ZEC rarely fails to deliver results.
Three out of three in marking its macro highs over the last 12 months.
Every time Zcash has formed an expansive higher high while the RSI formed a lower high, a local top and the beginning of a macro correction have subsequently followed.
We have also seen the opposite, with bullish RSI divergence marking the start of macro markup phases.
I’ll be watching closely to see whether a macro bullish divergence develops during this correction, which could give us an early signal of the next expansion phase.
$ZEC
Three out of three in marking its macro highs over the last 12 months.
Every time Zcash has formed an expansive higher high while the RSI formed a lower high, a local top and the beginning of a macro correction have subsequently followed.
We have also seen the opposite, with bullish RSI divergence marking the start of macro markup phases.
I’ll be watching closely to see whether a macro bullish divergence develops during this correction, which could give us an early signal of the next expansion phase.
$ZEC
407
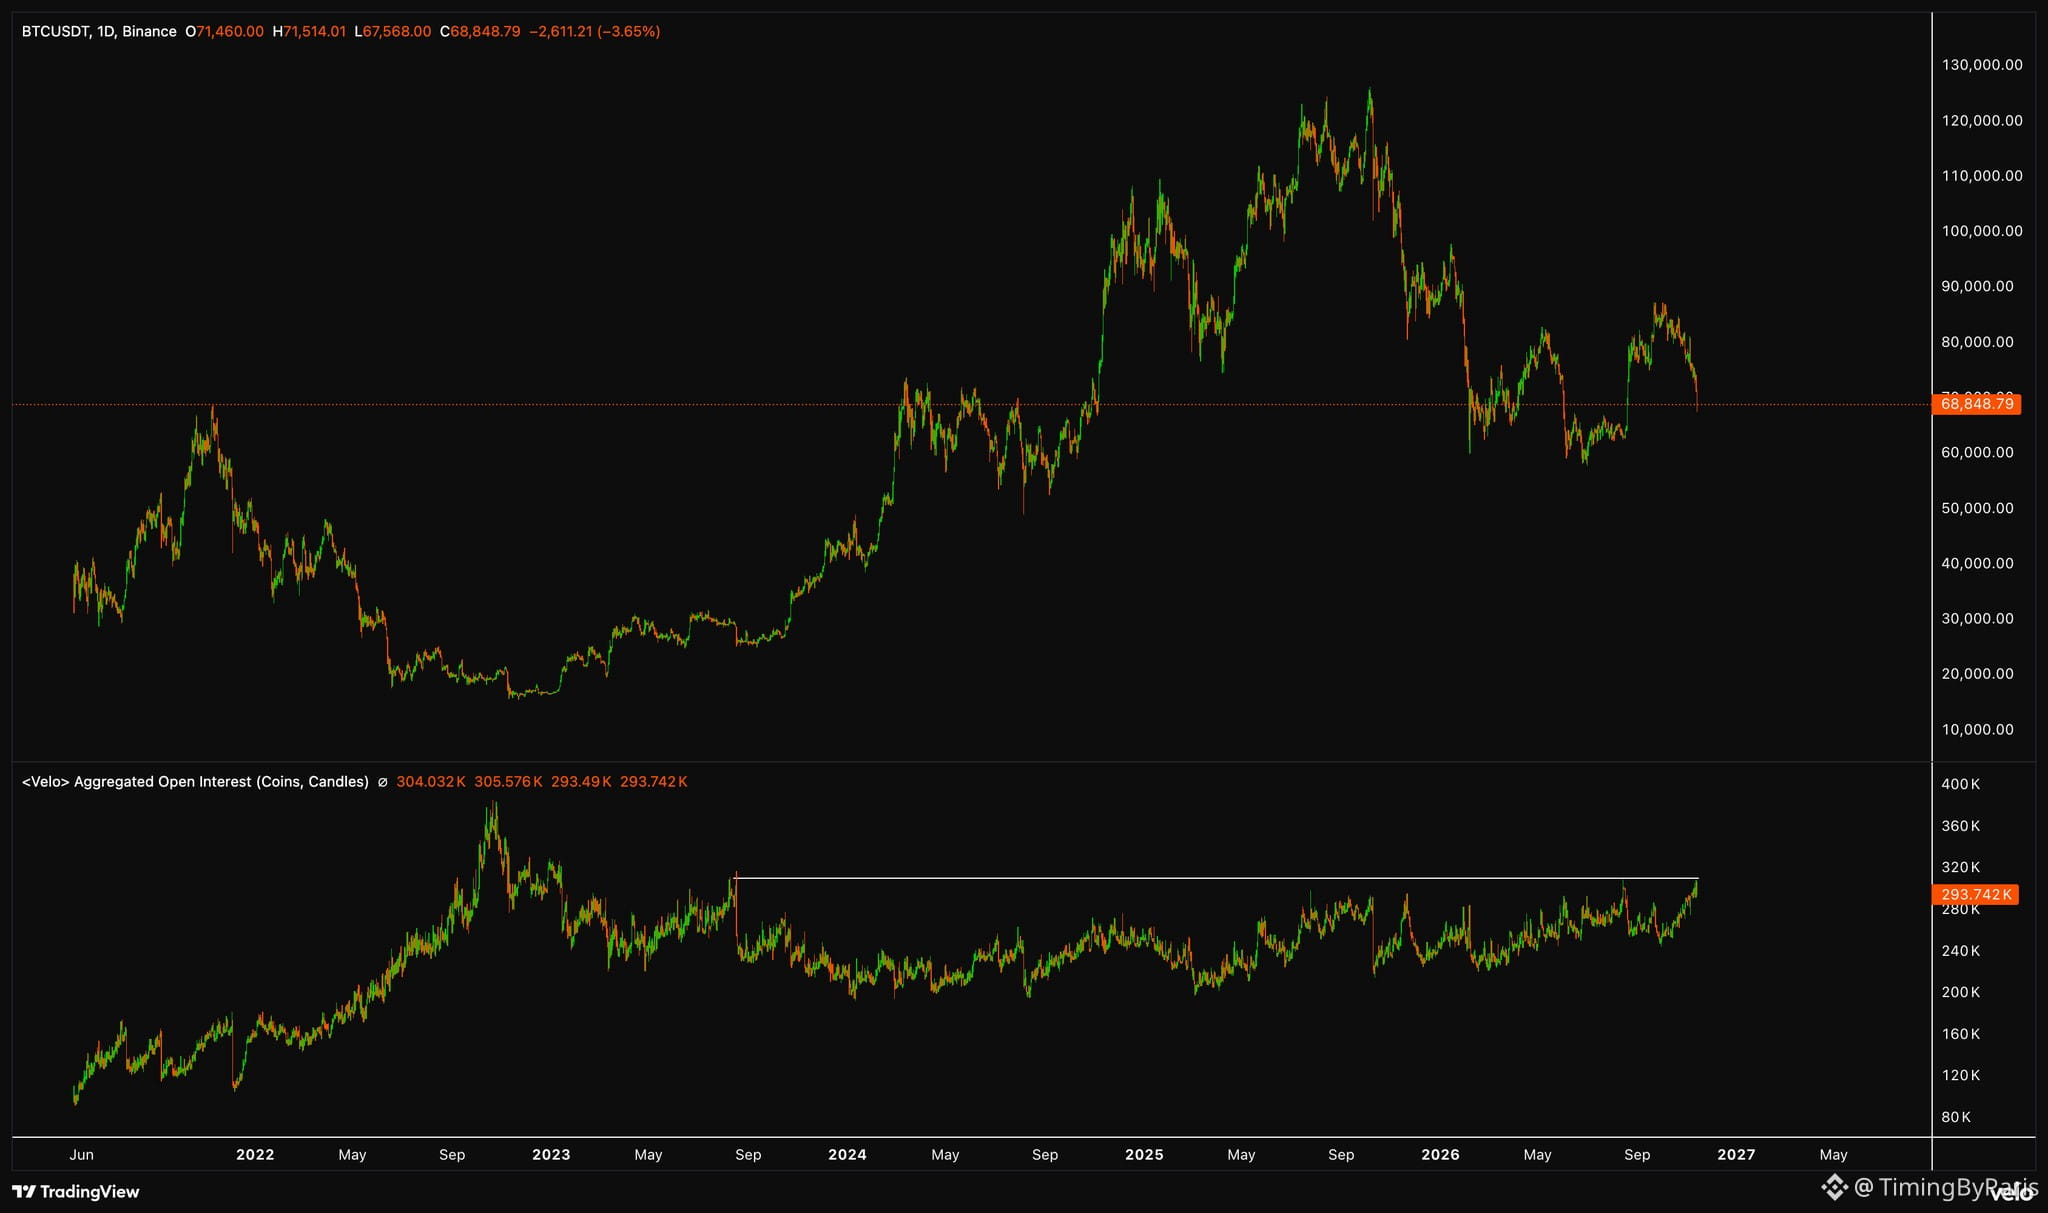
Fucking incredible how positioning is piling up in this $BTC sell-off.
Open interest has increased by almost 30% since the local high at $87K, and is now at its highest levels since 2023.
All while the price has continued to fall with barely any relief.
Literally, shorts piled on top of shorts.
You'd think a squeeze back above $72K to clear out some of those positions would be next on the agenda.
$BTC
{future}(BTCUSDT)
Fucking incredible how positioning is piling up in this $BTC sell-off.
Open interest has increased by almost 30% since the local high at $87K, and is now at its highest levels since 2023.
All while the price has continued to fall with barely any relief.
Literally, shorts piled on top of shorts.
You'd think a squeeze back above $72K to clear out some of those positions would be next on the agenda.
$BTC
Open interest has increased by almost 30% since the local high at $87K, and is now at its highest levels since 2023.
All while the price has continued to fall with barely any relief.
Literally, shorts piled on top of shorts.
You'd think a squeeze back above $72K to clear out some of those positions would be next on the agenda.
$BTC
1
142
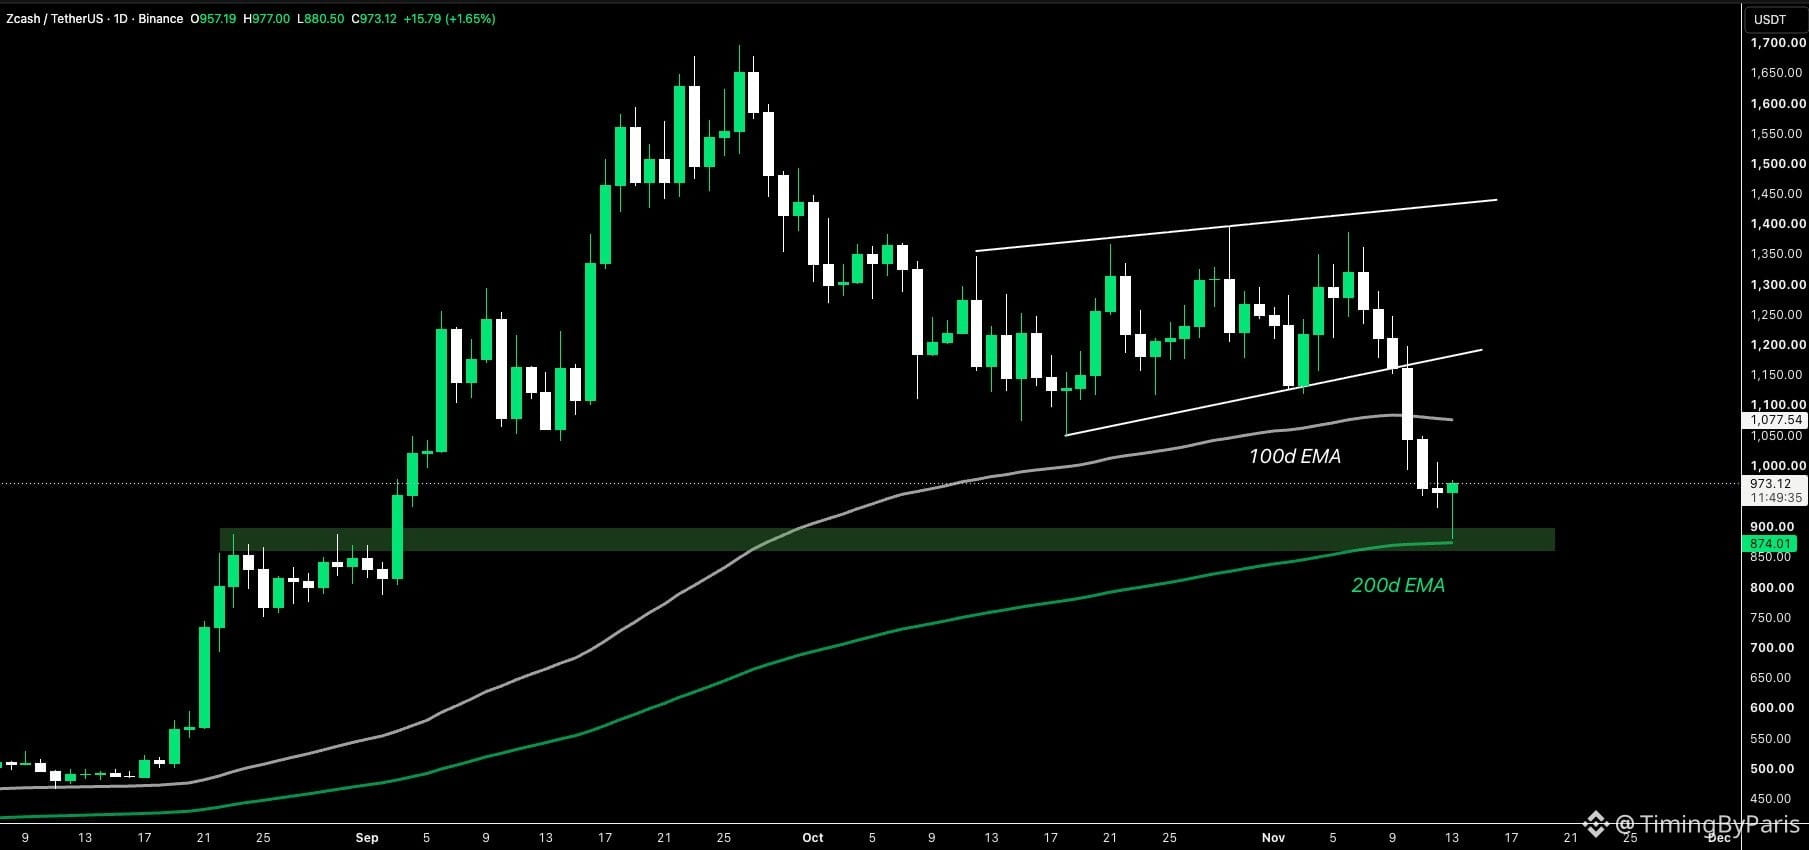
If $ZEC is going to form a local bottom, the 200-day EMA seems like a good place to start.
After a compound collapse from its rising wedge structure, $ZEC has found support in the August trading range and at the 200-day EMA.
The price is now trying to print a bullish hammer candle, a potential bottom signal suggesting that buyers are stepping in to defend support.
Notably, this sell-off marks the first time $ZEC has lost its 100-day EMA since July.
If a local bottom is confirmed, a relief bounce toward the 100-day EMA at $1,075 seems possible.
{future}(ZECUSDT)
If $ZEC is going to form a local bottom, the 200-day EMA seems like a good place to start.
After a compound collapse from its rising wedge structure, $ZEC has found support in the August trading range and at the 200-day EMA.
The price is now trying to print a bullish hammer candle, a potential bottom signal suggesting that buyers are stepping in to defend support.
Notably, this sell-off marks the first time $ZEC has lost its 100-day EMA since July.
If a local bottom is confirmed, a relief bounce toward the 100-day EMA at $1,075 seems possible.
After a compound collapse from its rising wedge structure, $ZEC has found support in the August trading range and at the 200-day EMA.
The price is now trying to print a bullish hammer candle, a potential bottom signal suggesting that buyers are stepping in to defend support.
Notably, this sell-off marks the first time $ZEC has lost its 100-day EMA since July.
If a local bottom is confirmed, a relief bounce toward the 100-day EMA at $1,075 seems possible.
285
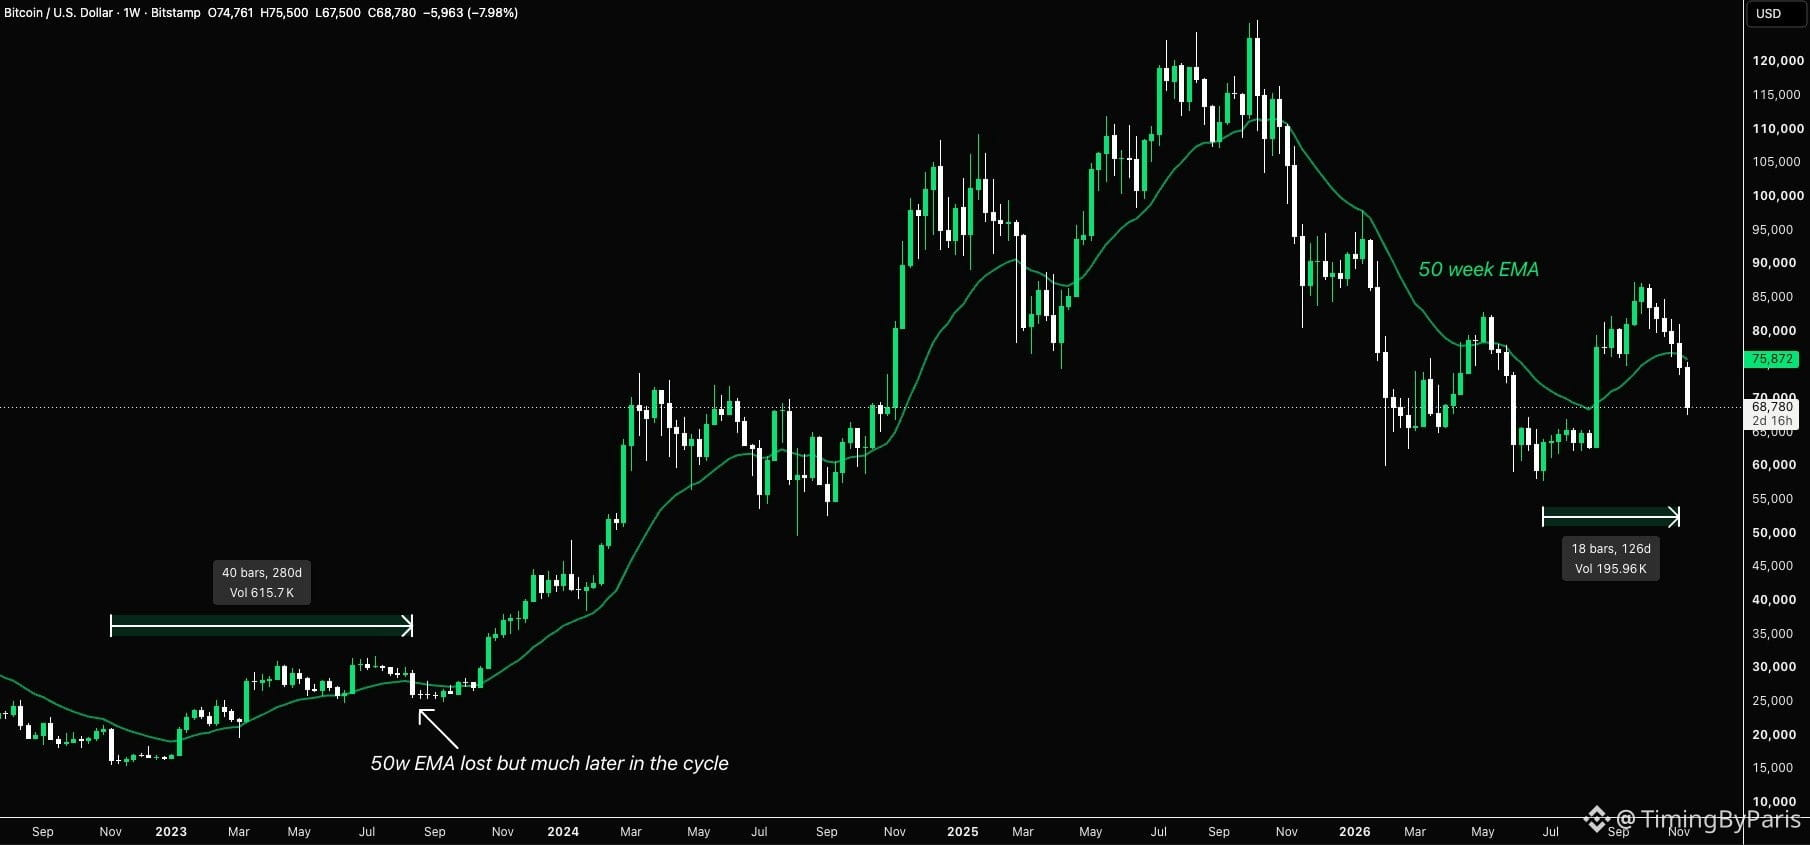
Bitcoin is losing its bullish momentum earlier than in previous cycles 🚨
$BTC is now trading almost 10% below its 50-week EMA, raising questions about the strength of the current market cycle.
History offers some interesting comparisons.
In 2019, BTC lost the 50W EMA, but that was after a 300% rally.
In March 2020, BTC briefly lost the same moving average during the COVID crash, only to reclaim it and begin a major bullish expansion.
Even using the previous cycle as an example, BTC spent 40 weeks above the 50W EMA after the bear market low before briefly losing it.
This time, the comparable period has lasted only 18 weeks, with BTC now 10% below the indicator.
That’s less than half the time.
Of course, losing the 50W EMA doesn’t automatically signal new lows. But if this is the start of a new bullish expansion, the early deterioration in momentum is hard to ignore.
The next sustained recovery of, or rejection at, the 50W EMA around $76k could tell us a lot about where this cycle is headed.
$BTC
{future}(BTCUSDT)
Bitcoin is losing its bullish momentum earlier than in previous cycles 🚨
$BTC is now trading almost 10% below its 50-week EMA, raising questions about the strength of the current market cycle.
History offers some interesting comparisons.
In 2019, BTC lost the 50W EMA, but that was after a 300% rally.
In March 2020, BTC briefly lost the same moving average during the COVID crash, only to reclaim it and begin a major bullish expansion.
Even using the previous cycle as an example, BTC spent 40 weeks above the 50W EMA after the bear market low before briefly losing it.
This time, the comparable period has lasted only 18 weeks, with BTC now 10% below the indicator.
That’s less than half the time.
Of course, losing the 50W EMA doesn’t automatically signal new lows. But if this is the start of a new bullish expansion, the early deterioration in momentum is hard to ignore.
The next sustained recovery of, or rejection at, the 50W EMA around $76k could tell us a lot about where this cycle is headed.
$BTC
$BTC is now trading almost 10% below its 50-week EMA, raising questions about the strength of the current market cycle.
History offers some interesting comparisons.
In 2019, BTC lost the 50W EMA, but that was after a 300% rally.
In March 2020, BTC briefly lost the same moving average during the COVID crash, only to reclaim it and begin a major bullish expansion.
Even using the previous cycle as an example, BTC spent 40 weeks above the 50W EMA after the bear market low before briefly losing it.
This time, the comparable period has lasted only 18 weeks, with BTC now 10% below the indicator.
That’s less than half the time.
Of course, losing the 50W EMA doesn’t automatically signal new lows. But if this is the start of a new bullish expansion, the early deterioration in momentum is hard to ignore.
The next sustained recovery of, or rejection at, the 50W EMA around $76k could tell us a lot about where this cycle is headed.
$BTC
199
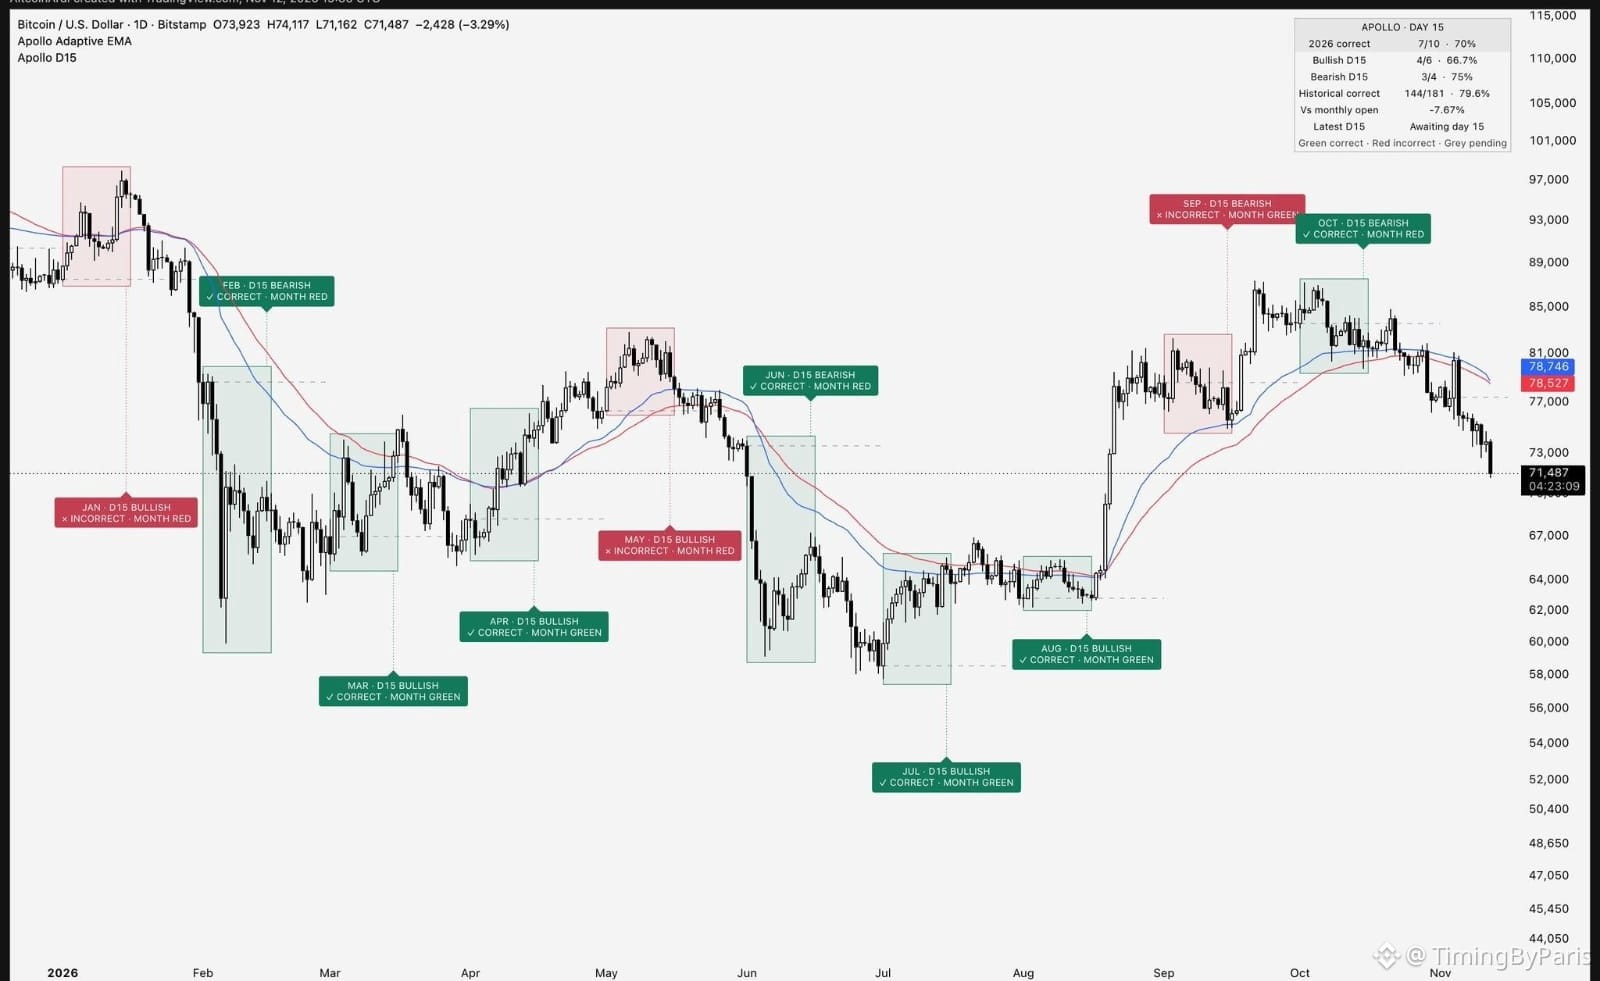
With the 15th of the month approaching, it’s worth reviewing one of the most reliable monthly patterns I follow in $BTC.
Bitcoin’s close on the 15th relative to the monthly open has often been a reliable indicator of how the month will end.
Above the monthly open on the 15th, and the month has typically ended in the green.
Below it, and the month has typically ended in the red.
Of the 10 months completed this year, seven have followed that direction. A 70% hit rate.
Across my entire historical sample, that’s 144 out of 181 months, or 79.6%. So this isn’t just something that worked a few times this year.
In fact, it’s one of the most statistically reliable indicators I’ve come across.
Bitcoin is currently below the monthly open, which is around $77K.
If Bitcoin closes below this pivot on the 15th, which currently seems likely, the expectation is that November will end in the red.
$BTC
{future}(BTCUSDT)
With the 15th of the month approaching, it’s worth reviewing one of the most reliable monthly patterns I follow in $BTC .
Bitcoin’s close on the 15th relative to the monthly open has often been a reliable indicator of how the month will end.
Above the monthly open on the 15th, and the month has typically ended in the green.
Below it, and the month has typically ended in the red.
Of the 10 months completed this year, seven have followed that direction. A 70% hit rate.
Across my entire historical sample, that’s 144 out of 181 months, or 79.6%. So this isn’t just something that worked a few times this year.
In fact, it’s one of the most statistically reliable indicators I’ve come across.
Bitcoin is currently below the monthly open, which is around $77K.
If Bitcoin closes below this pivot on the 15th, which currently seems likely, the expectation is that November will end in the red.
$BTC
Bitcoin’s close on the 15th relative to the monthly open has often been a reliable indicator of how the month will end.
Above the monthly open on the 15th, and the month has typically ended in the green.
Below it, and the month has typically ended in the red.
Of the 10 months completed this year, seven have followed that direction. A 70% hit rate.
Across my entire historical sample, that’s 144 out of 181 months, or 79.6%. So this isn’t just something that worked a few times this year.
In fact, it’s one of the most statistically reliable indicators I’ve come across.
Bitcoin is currently below the monthly open, which is around $77K.
If Bitcoin closes below this pivot on the 15th, which currently seems likely, the expectation is that November will end in the red.
$BTC
1
362
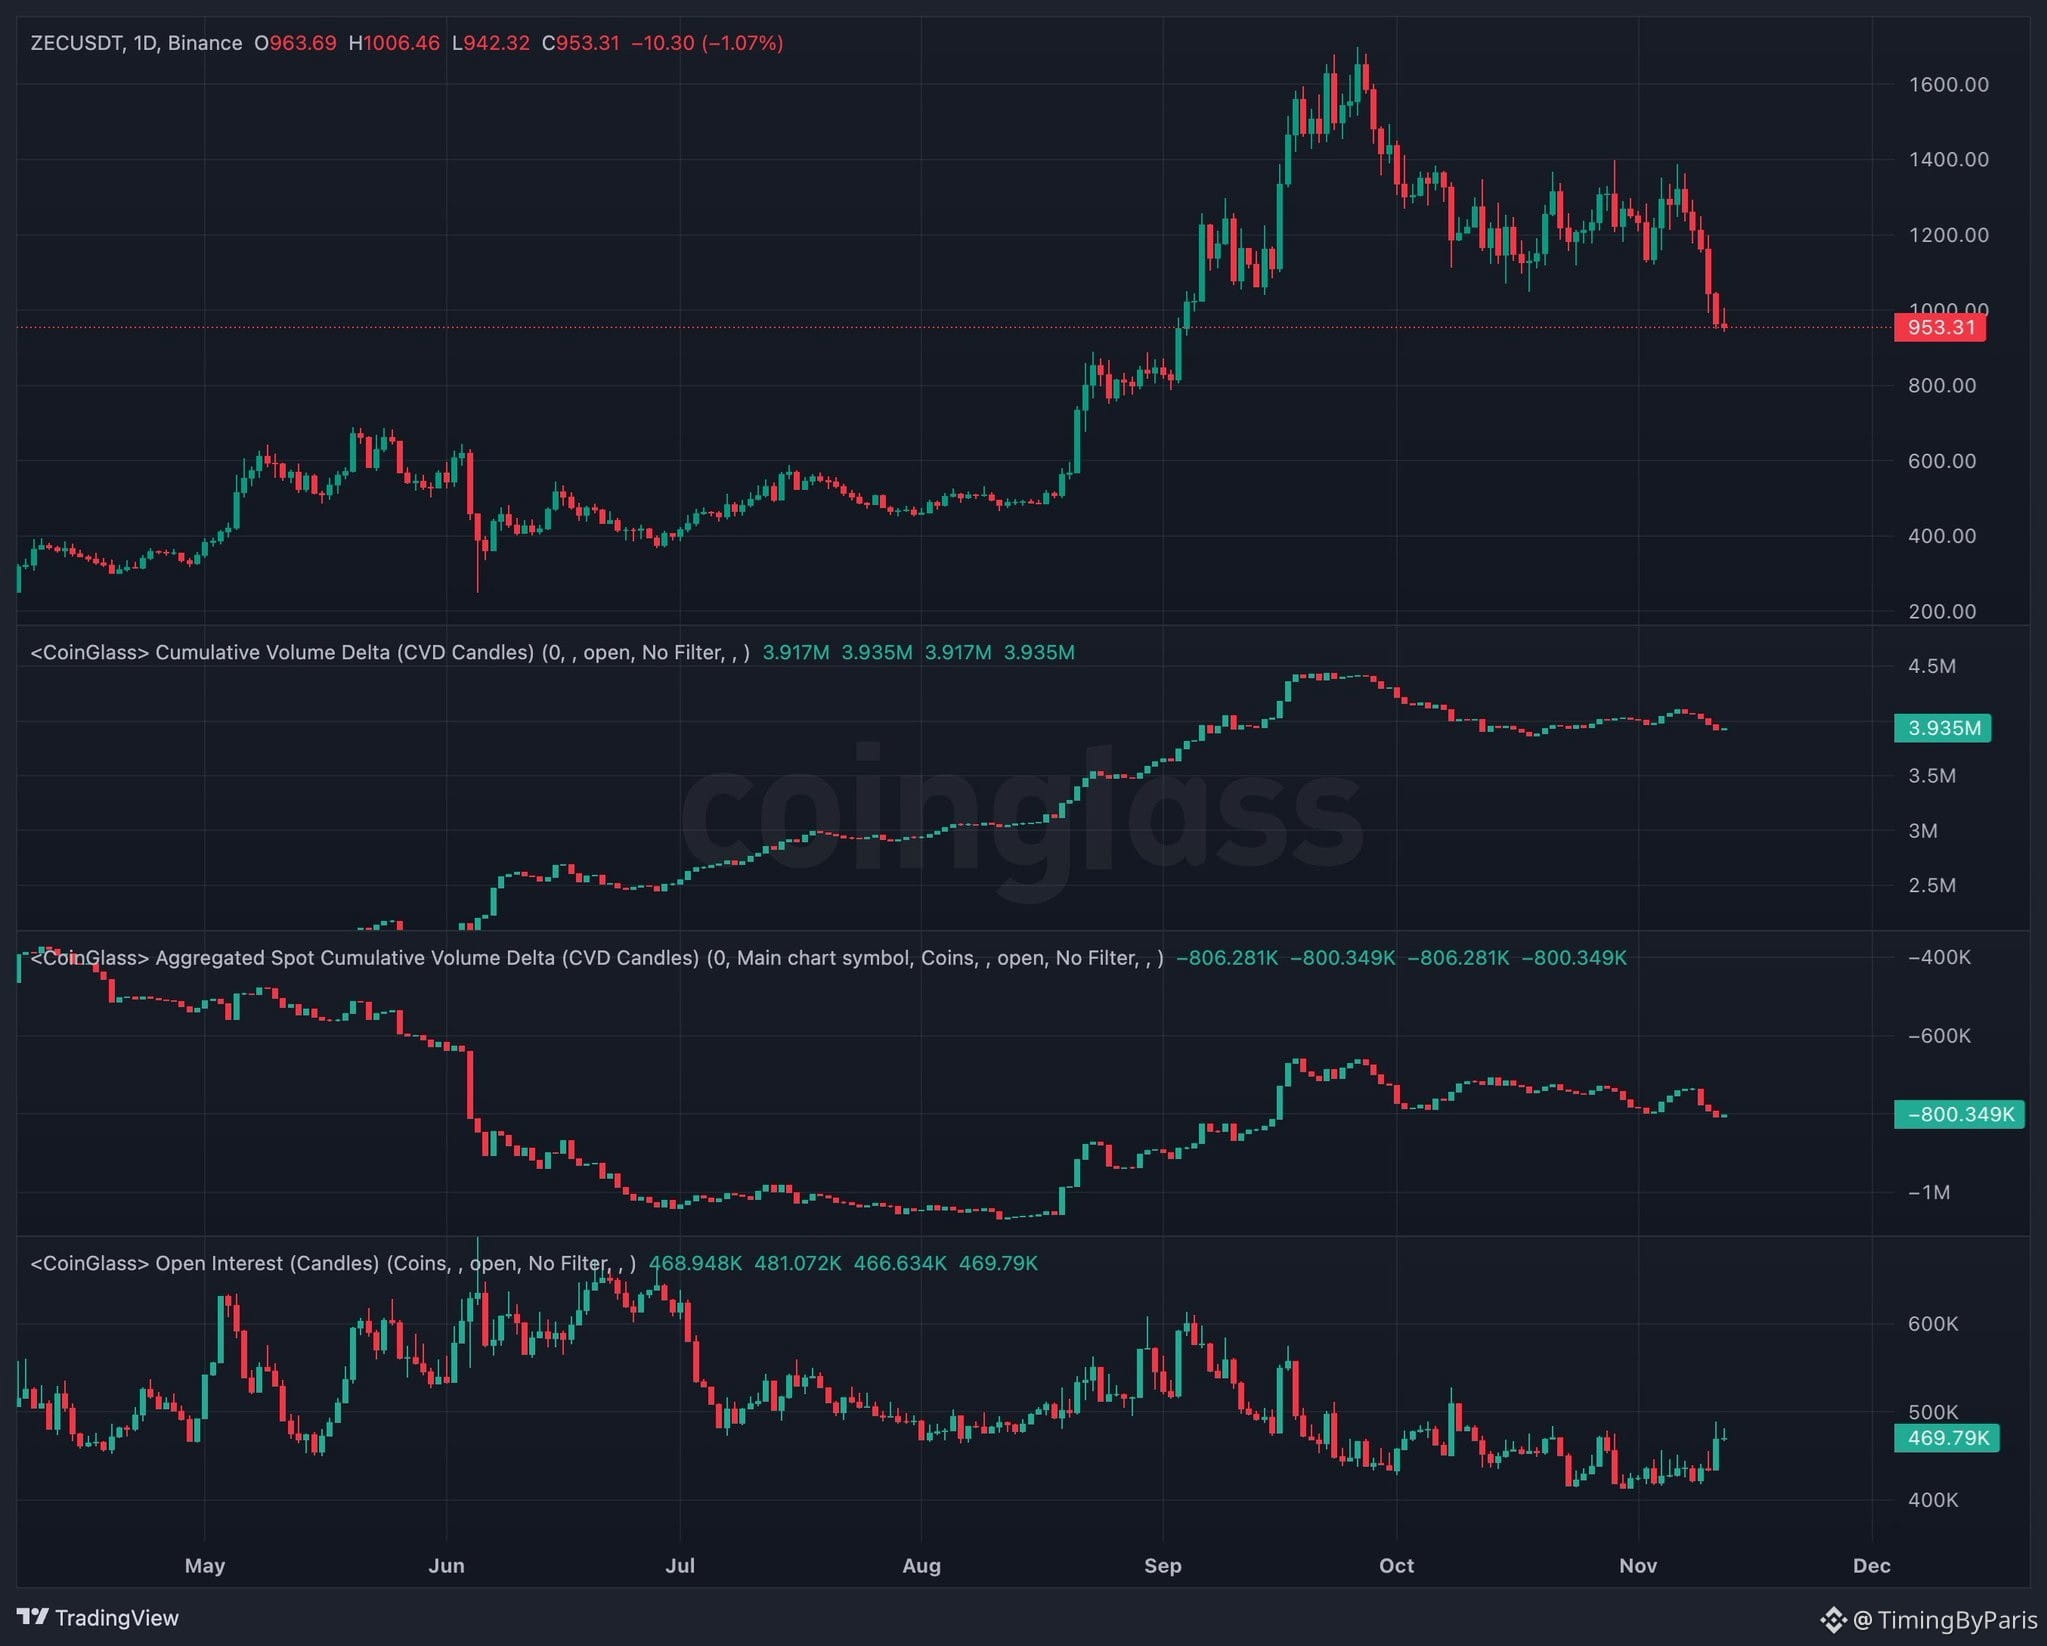
Now that $ZEC is below $1,000, suddenly everyone is bearish.
The time to get aggressively bearish was when the macro low at $1,420 broke.
But sure, after a 45% drop, you’ve finally decided to pile into shorts.
Just don’t act surprised when those late shorts get trapped.
$ZEC
{future}(ZECUSDT)
Now that $ZEC is below $1,000, suddenly everyone is bearish.
The time to get aggressively bearish was when the macro low at $1,420 broke.
But sure, after a 45% drop, you’ve finally decided to pile into shorts.
Just don’t act surprised when those late shorts get trapped.
$ZEC
The time to get aggressively bearish was when the macro low at $1,420 broke.
But sure, after a 45% drop, you’ve finally decided to pile into shorts.
Just don’t act surprised when those late shorts get trapped.
$ZEC
1
738
Log in to explore more content
Join global crypto users on Binance Square
⚡️ Get latest and useful information about crypto.
💬 Trusted by the world’s largest crypto exchange.
👍 Discover real insights from verified creators.
Email / Phone number
Trending Topics
BTCRemainsUnderPressureAfterHawkishFOMCMinutes
12,372 views
210 Discussing
FOMC Minutes | Fed Minutes Show Almost All Officials Expect More Rate Hikes, With Some Open to a Larger December Move
Binance News
·32 Likes
·48.3k views
AnthropicToDebutAfter$83IPOPricing
5,169 views
24 Discussing
NvidiaBoardReportedlySplitOverHuang’sReturn
2 views
14 Discussing