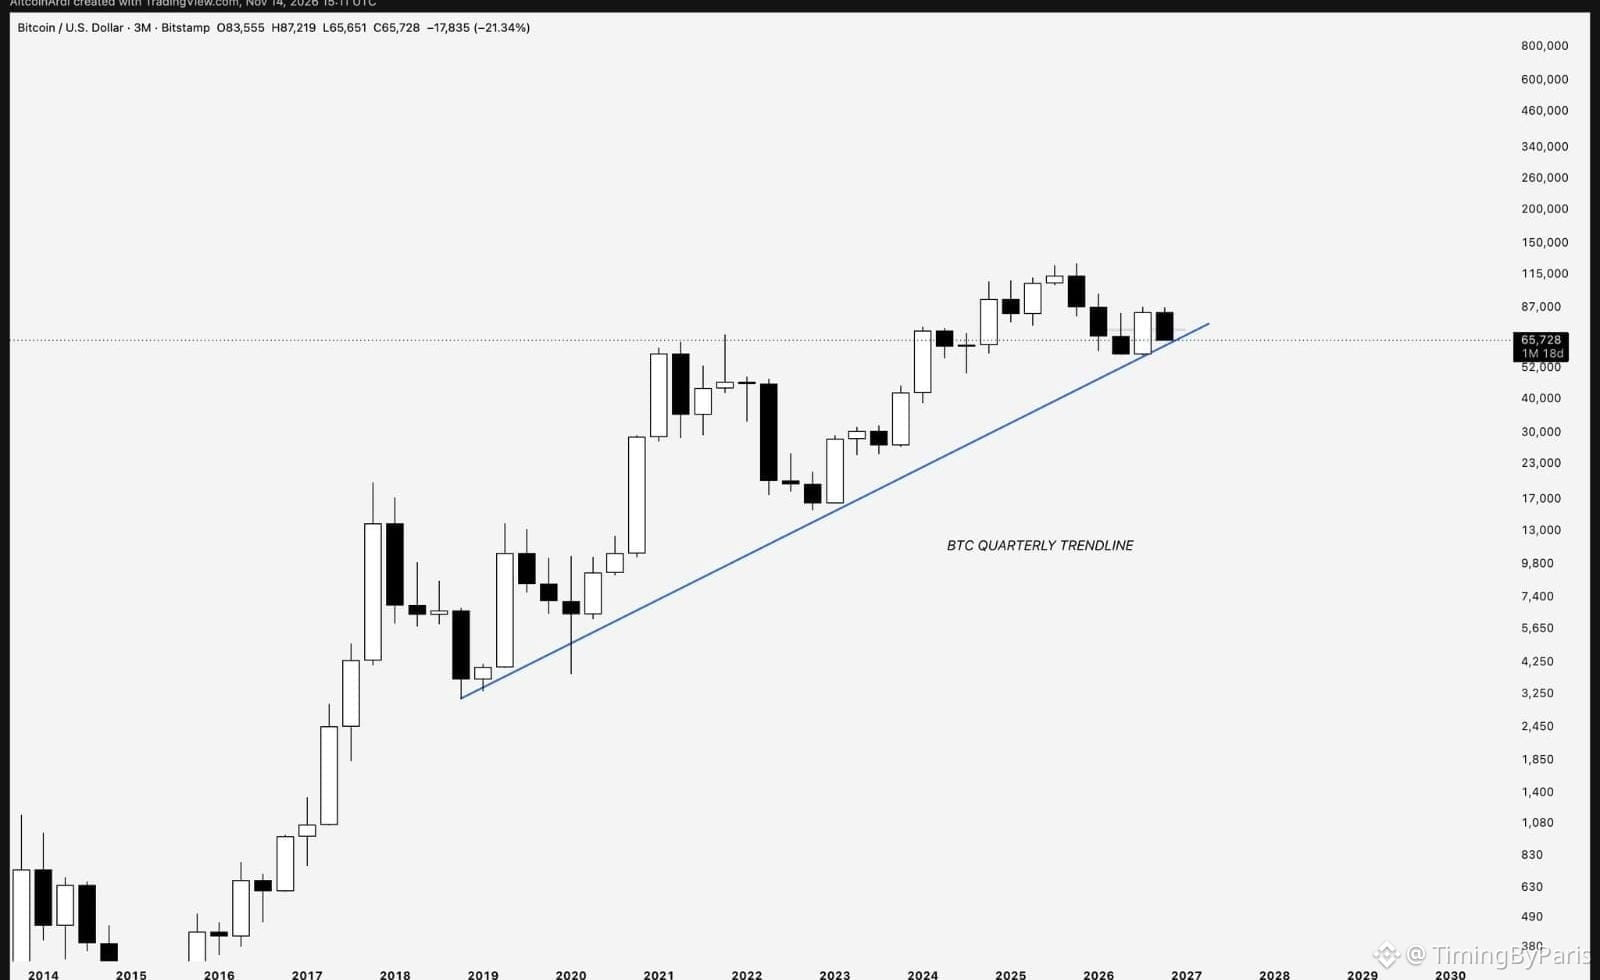
Nobody seems to be talking about this, but it’s probably one of the most important technical charts for $BTC right now.
The eight-year trend line going all the way back to when Bitcoin was at $3,000.
It runs through the 2018 and 2022 bear market lows, and now we’re testing it again on the monthly and quarterly charts.
Needless to say, if we lose this trend line, it needs to recover very quickly. Otherwise, we can expect a much more aggressive drop below $57K.
“The higher the time frame, the bigger the breakout.”
$BTC
The eight-year trend line going all the way back to when Bitcoin was at $3,000.
It runs through the 2018 and 2022 bear market lows, and now we’re testing it again on the monthly and quarterly charts.
Needless to say, if we lose this trend line, it needs to recover very quickly. Otherwise, we can expect a much more aggressive drop below $57K.
“The higher the time frame, the bigger the breakout.”
$BTC