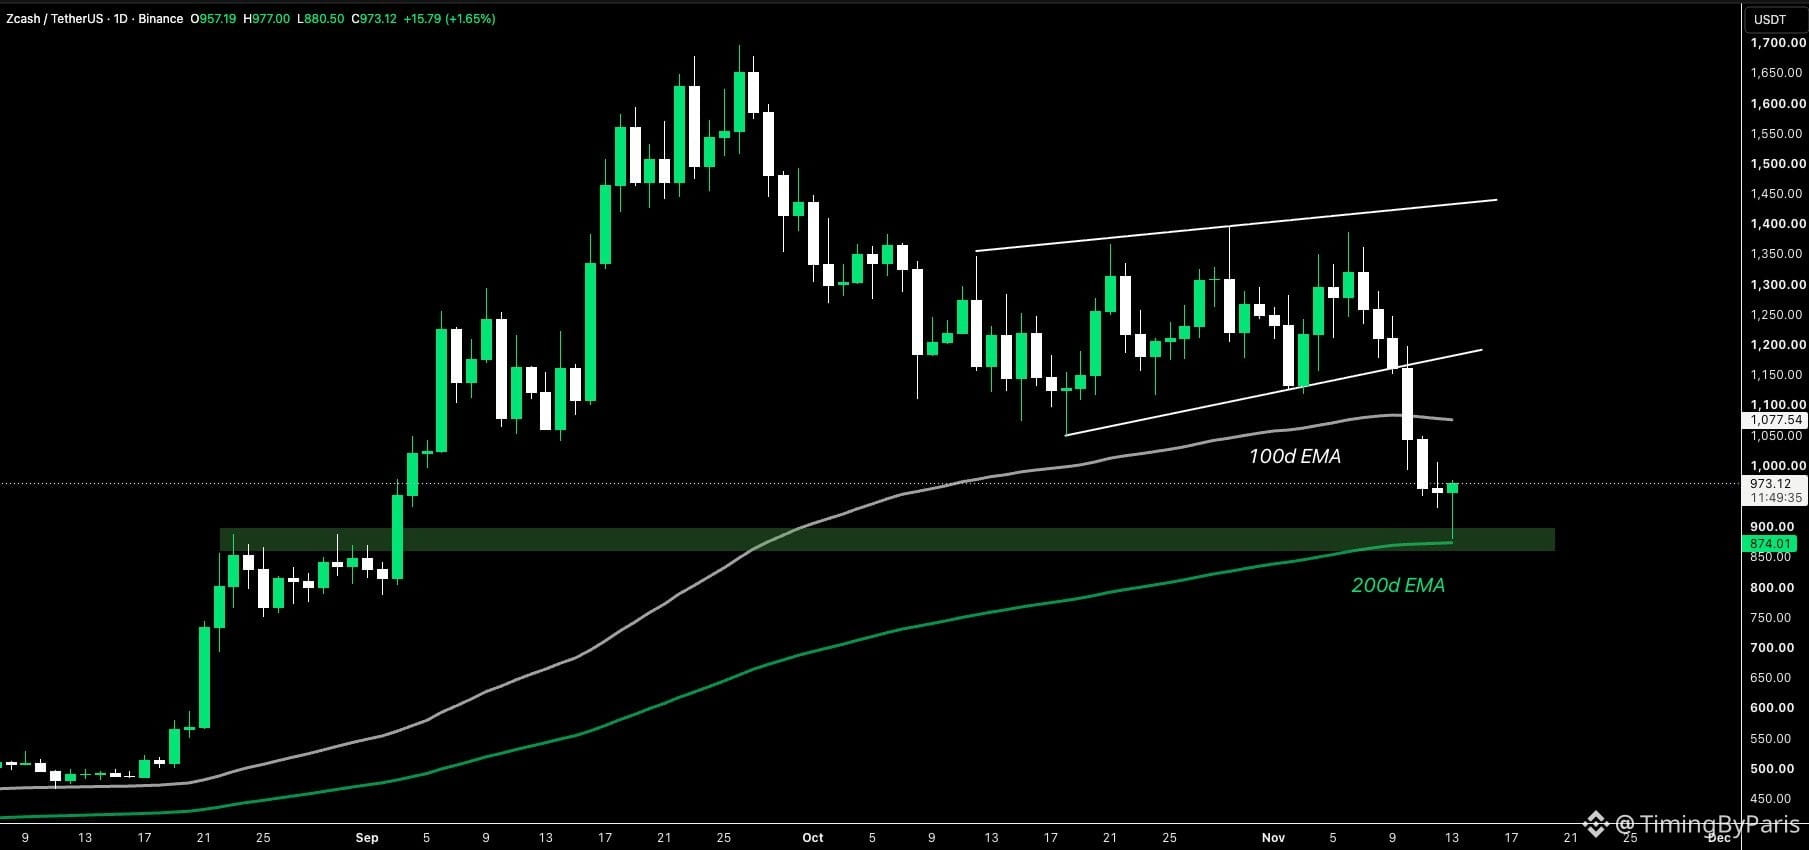
If $ZEC is going to form a local bottom, the 200-day EMA seems like a good place to start.
After a compound collapse from its rising wedge structure, $ZEC has found support in the August trading range and at the 200-day EMA.
The price is now trying to print a bullish hammer candle, a potential bottom signal suggesting that buyers are stepping in to defend support.
Notably, this sell-off marks the first time $ZEC has lost its 100-day EMA since July.
If a local bottom is confirmed, a relief bounce toward the 100-day EMA at $1,075 seems possible.
After a compound collapse from its rising wedge structure, $ZEC has found support in the August trading range and at the 200-day EMA.
The price is now trying to print a bullish hammer candle, a potential bottom signal suggesting that buyers are stepping in to defend support.
Notably, this sell-off marks the first time $ZEC has lost its 100-day EMA since July.
If a local bottom is confirmed, a relief bounce toward the 100-day EMA at $1,075 seems possible.