

Please refer to the #bitcoin price analysis today October 3 to closely follow the movement of this asset!
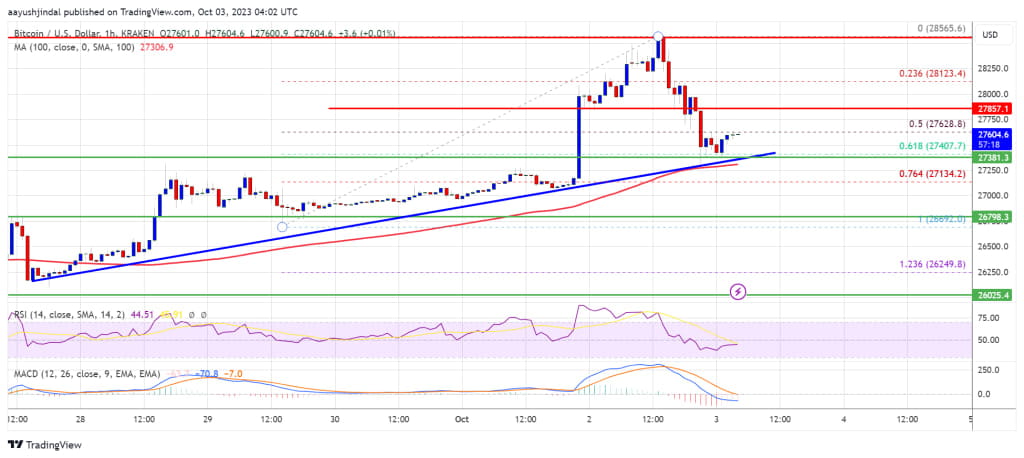
Bitcoin price had previously extended its gains towards resistance at $28,500. The corrected #BTC is currently holding the critical support at $27,350.
Bitcoin rose further above the $28,000 and $28,200 resistance levels.
The price is trading above $27,400 and the 100 SMA.
There is a key bullish trend line forming with support near $27,400.
The pair could start another increase unless there is a move below the $26,650 support.
Bitcoin price remains supported
Bitcoin price started to rise above the $27,700 resistance area. #BTC has moved steadily higher above the $27,500 and $28,000 resistance levels.
The price tested the $28,500 resistance level. A new multi-week high was formed near $28,565 before it witnessed a downside correction. Finally, the price saw a downside correction below the $28,200 and $28,000 levels. It even moved below the 50% Fib retracement level of the upward move from $26,690 to $28,565.
Bitcoin is still trading above $27,400 and the 100 SMA. Additionally, there is a key bullish trend line forming with support near $27,400.
Immediate resistance on the upside is near the $27,850 level. The next key resistance could be near the $28,000 level. A close above the $28,000 resistance could start another rally.
In the said case, the price could rise to the resistance level of $28,500. Any further gains could require a move to $29,200.
Case of BTC price drop
If #Bitcoin fails to continue above the $28,000 resistance level, there could be more downside. Immediate support on the downside is near the $27,400 level and the trendline.
The next major support is near $27,250 or SMA 100. A downside break and close below $27,250 could push the price towards $26,800. The next support lies at $26,650. Any further losses could require a test of the $26,000 level.
Technical indicators:
Hourly MACD – The MACD is currently losing speed in the bullish zone.
Hourly RSI (Relative Strength Index) – The RSI for BTC/USD is currently below the 50 level.
Key support levels – $27,250, followed by $26,650.
Key resistance levels – $28,000, $28,500 and $29,200.
Theo NewsBTC$BTC