

#usspotethetfspost23straightdaysofnetoutflows
usspotethetfspost23straightdaysofnetoutflows
Hot
Latest

·
--
Bullish
#usspotethetfspost23straightdaysofnetoutflows 🚨 ETH ETF HOLDERS KEEP SELLING FOR 23 DAYS — BUT ETHEREUM IS HOLDING UP
Something interesting is happening in the Ethereum market.
According to Glassnode, US spot Ethereum ETFs have recorded 23 consecutive trading days of net outflows, marking the longest outflow streak since their launch.
More than $1 billion reportedly left these funds during October.
But here's where things get interesting:
🔍 Two Different Market Trends
• ETF investors continue reducing their ETH exposure.
• Ethereum staking has reached approximately 43.8 million ETH, representing around 35.9% of total supply.
• ETH's price has remained relatively resilient despite sustained ETF selling pressure.
📊 Market Analysis & Structural Assessment
We're seeing two different types of investor behavior.
Traditional investors using ETF products appear to be reducing exposure amid macroeconomic uncertainty.
Meanwhile, on-chain participants continue locking ETH into staking to earn rewards.
This creates an interesting supply dynamic. However, staking does not automatically offset ETF outflows because both represent different market activities.
The key question is whether on-chain demand can remain strong enough to absorb continued selling pressure.
💭 My Take
I am watching two important signals:
A meaningful ETF inflow day that could indicate institutional demand is returning.
Whether Bitcoin ETFs also begin experiencing sustained outflows.
For Ethereum, the $2,200 area is an important technical level to monitor. A sustained hold could support the current structure, while a decisive breakdown may increase downside pressure.
The big question: Will the ETF outflow streak end before ETH retests $2,200, or will the support level break first?
$ETH | $BTC | $BNB
#Ethereum #ETH #EthereumETF #Glassnode #Bitcoin #CryptoMarket #CryptoAnalysis

248


·
--
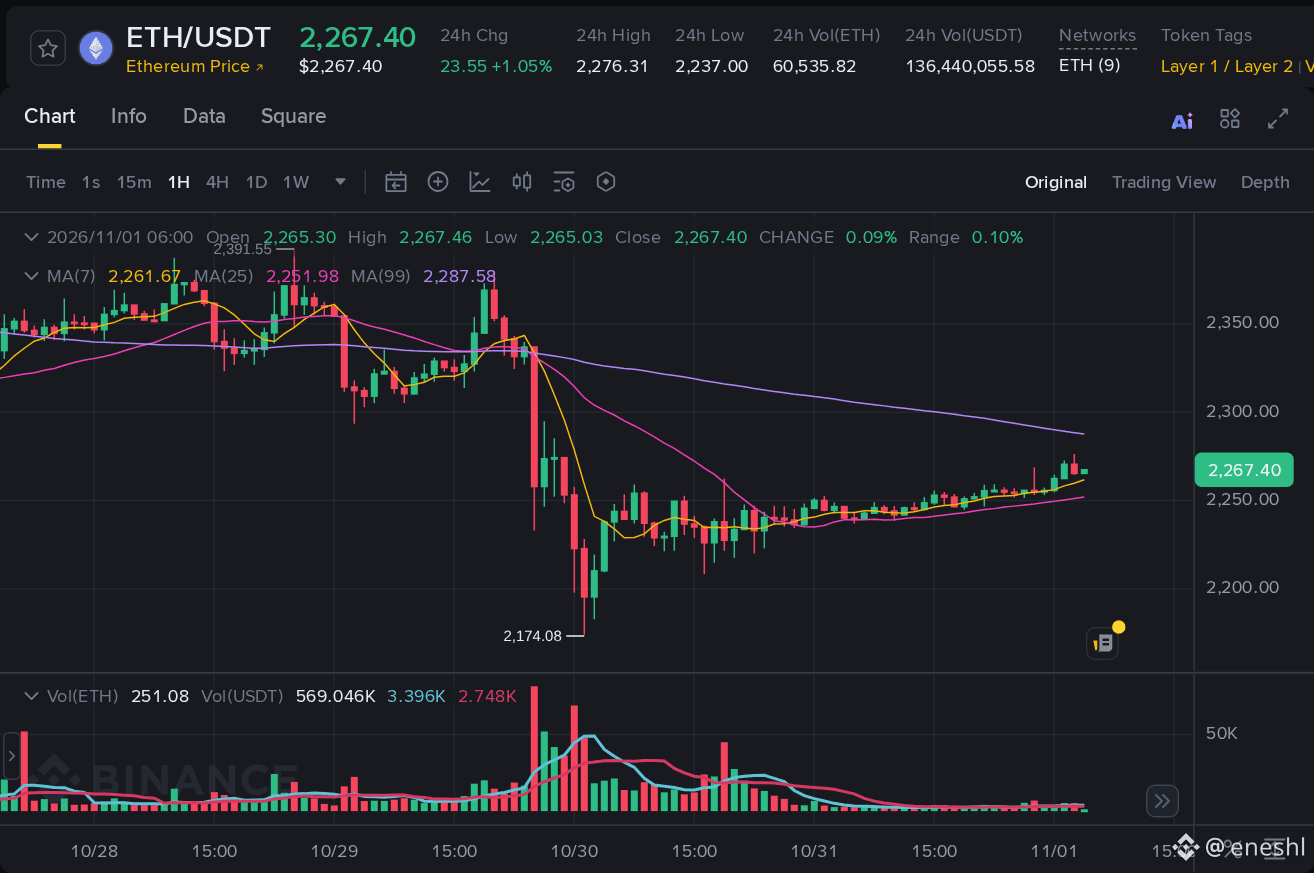
eth etf holders have been selling for a month straight and price barely cared
#USSpotETHETFsPost23StraightDaysOfNetOutflows
us spot $ETH etfs just logged 23 trading days of net outflows in a row, the longest run since launch per glassnode. same window, onchain staking kept hitting records
my take, two crowds are reading the same coin differently. the wrapper crowd trims when macro gets shaky, the onchain crowd locks up and earns yield. supply into staking quietly offsets some of that etf selling, so no flush yet. what changes it is one real inflow day breaking the streak, or $BTC etfs rolling over too. im watching 2,200, it got wicked through once this week and bought straight back
streak snaps before 2,200 gets tested, or floor goes first ?
1
341

·
--
#USSpotETHETFsPost23StraightDaysOfNetOutflows
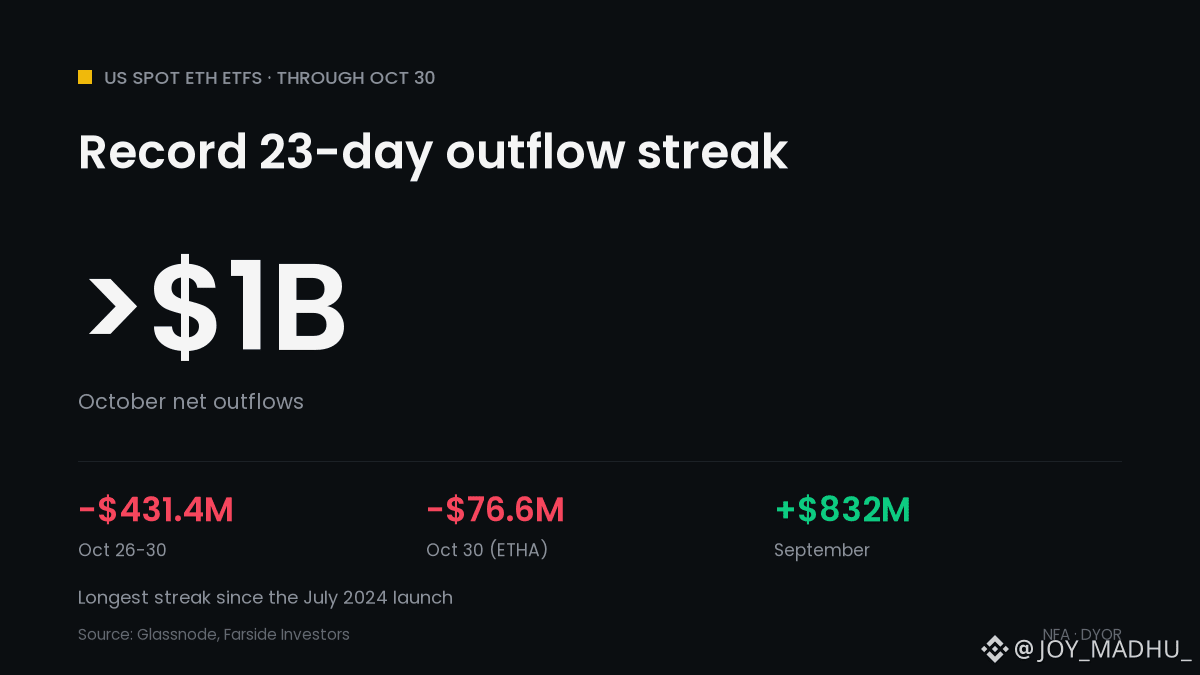
📉 Ether ETFs Hit a Record 23-Day Outflow Streak
📅 US spot ETH ETFs posted net outflows for 23 straight trading days through Oct 30, the longest since the July 2024 launch (Glassnode)
💸 October net outflows topped $1B, the biggest monthly drain of 2026
📊 Oct 26-30 alone: $431.4M out (Farside); Oct 30 was the worst day at about $155.8M
🏦 BlackRock's ETHA led with $76.6M out on Oct 30
🔄 A sharp turn from September, when the funds took in about $832M
📈 Net inflows since launch still total about $12.29B
What it means for crypto: ETF buyers are stepping back while on-chain staking keeps hitting records. Glassnode says a return of ETF inflows would be the signal that institutional demand is back.
Which side is right on ETH right now, the ETF sellers or the stakers? 👇
$ETH
#CryptoNews #Ethereum #ETF #USSpotETHETFsPost23StraightDaysOfNetOutflows
11

·
--
Article
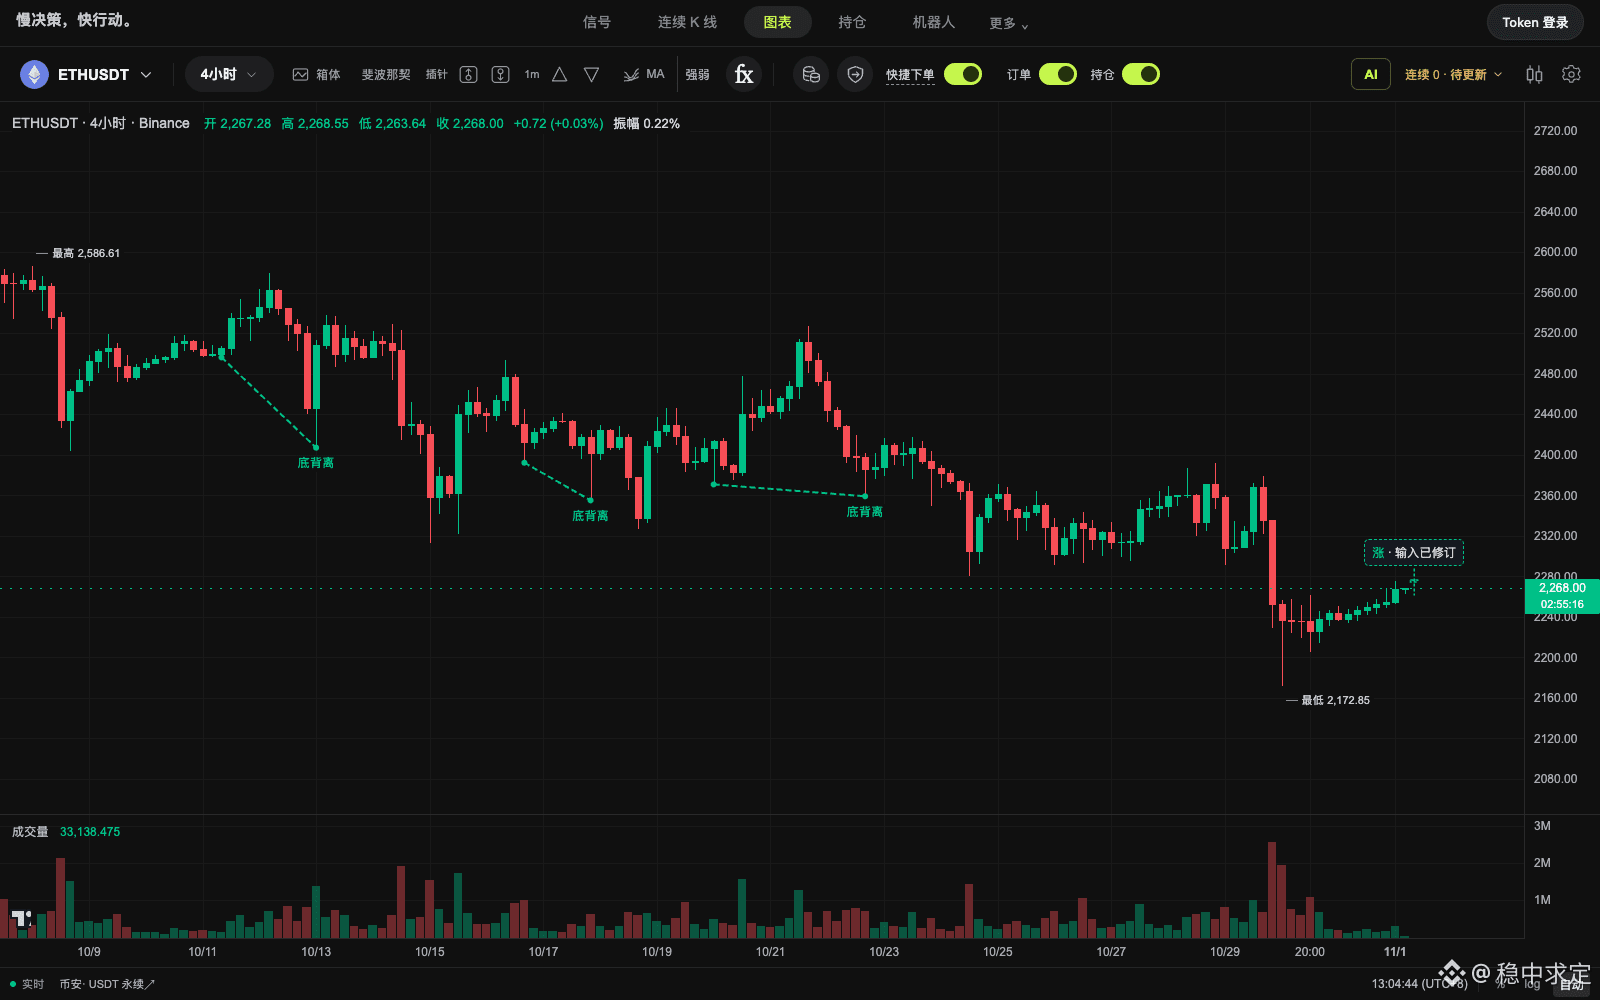
ETH trending topic claims “23 consecutive days of outflows,” but public data shows 5: check the methodology before judging institutional demandThe bottom line: “23 consecutive trading days of net outflows” from U.S. spot ETH ETFs is a hot topic on Binance Square today, but the claim needs to be qualified by the data methodology. Glassnode’s data counts through October 30 as the longest outflow streak since the products launched; Farside’s public table, however, shows net inflows of about $4.4 million on October 23, followed by five consecutive trading days of net outflows from October 26 to 30. The two datasets shouldn’t be conflated into one definitive figure. What really matters is that demand for ETH through traditional financial channels is indeed weak, but different datasets are being used to describe this period of pressure.
ETH trending topic claims “23 consecutive days of outflows,” but public data shows 5: check the methodology before judging institutional demand
The bottom line: “23 consecutive trading days of net outflows” from U.S. spot ETH ETFs is a hot topic on Binance Square today, but the claim needs to be qualified by the data methodology. Glassnode’s data counts through October 30 as the longest outflow streak since the products launched; Farside’s public table, however, shows net inflows of about $4.4 million on October 23, followed by five consecutive trading days of net outflows from October 26 to 30. The two datasets shouldn’t be conflated into one definitive figure. What really matters is that demand for ETH through traditional financial channels is indeed weak, but different datasets are being used to describe this period of pressure.
31

·
--
Bearish
#usspotethetfspost23straightdaysofnetoutflows
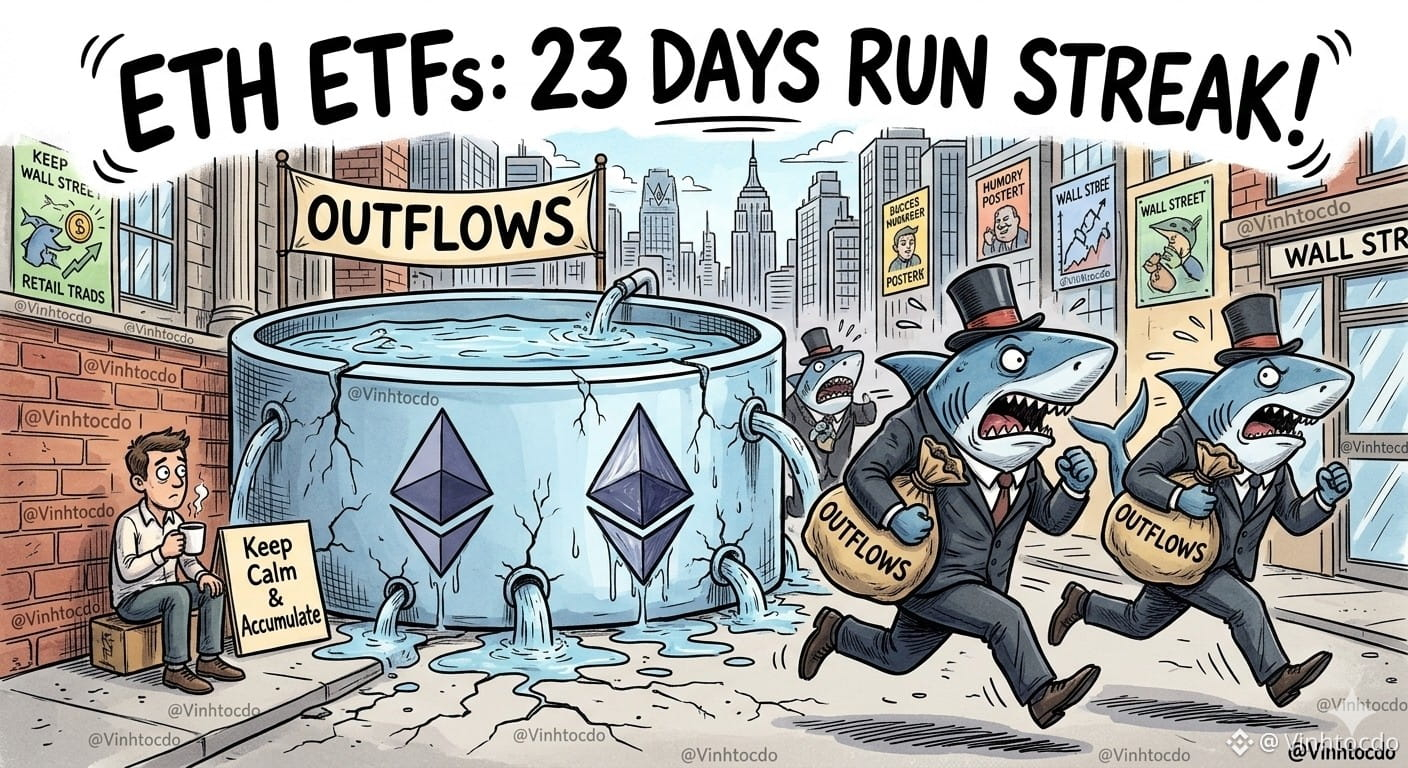
U.S. spot ETH ETFs have just set an unprecedented record: 23 consecutive days of net outflows!
After eagerly accumulating assets in August and September, traditional “whales” have suddenly turned around and lost interest, leaving inflows noticeably weaker. Watching Ether wallets keep losing steam feels just like an ex turning their back and ignoring you, folks!
What should traders do?
At this point, both longs and shorts could easily get wrecked, so it’s better to sit tight and watch what the big funds do next. Don’t panic-sell with the crowd just because there are net outflows. This is a good time to gradually build positions in quality assets at discounted prices, and patiently wait for traditional money to return!
⚠️ This is not financial advice.
Sign up for a new account to support me: [https://www.binance.com/register?ref=VINHTOCDO](https://www.binance.com/register?ref=VINHTOCDO) (Code: VINHTOCDO)
Click below to trade and support me: $ETH
{spot}(ETHUSDT)
$BNB
{spot}(BNBUSDT)
$SOL
{spot}(SOLUSDT)
#EthereumETF #CryptoOutflows #EthereumNews #TradingStrategy #VINHTOCDO
#usspotethetfspost23straightdaysofnetoutflows
U.S. spot ETH ETFs have just set an unprecedented record: 23 consecutive days of net outflows!
After eagerly accumulating assets in August and September, traditional “whales” have suddenly turned around and lost interest, leaving inflows noticeably weaker. Watching Ether wallets keep losing steam feels just like an ex turning their back and ignoring you, folks!
What should traders do?
At this point, both longs and shorts could easily get wrecked, so it’s better to sit tight and watch what the big funds do next. Don’t panic-sell with the crowd just because there are net outflows. This is a good time to gradually build positions in quality assets at discounted prices, and patiently wait for traditional money to return!
⚠️ This is not financial advice.
Sign up for a new account to support me: https://www.binance.com/register?ref=VINHTOCDO (Code: VINHTOCDO)
Click below to trade and support me: $ETH
$BNB
$SOL
#EthereumETF #CryptoOutflows #EthereumNews #TradingStrategy #VINHTOCDO
2
266

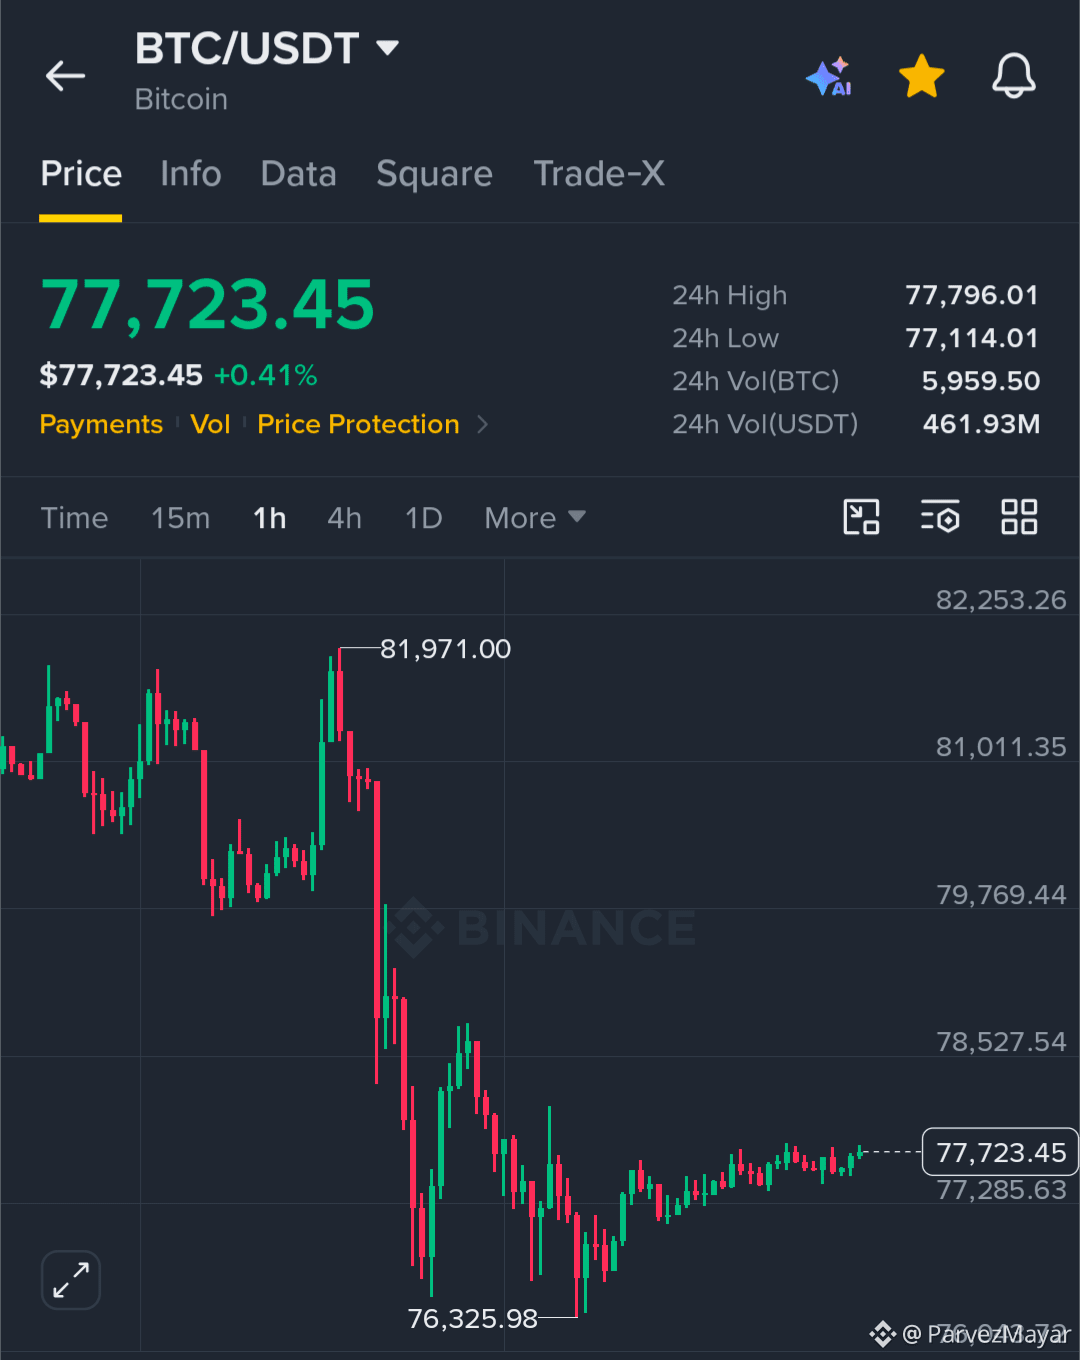
# IS $76K THE BITCOIN BOTTOM? $BTC COULD BE PREPARING FOR A $90K COMEBACK! I’m still watching the *I’m still watching the $76,000 zone as a potential bottom for $BTC.
After touching approximately $76,325, Bitcoin has bounced back and is trading near $77,800. Buyers are trying to stabilize the market, but the real test is whether they can turn this recovery into a sustained bullish reversal.
And honestly... I’m watching Monday closely. 👀 Could the new week bring fresh buying pressure?
📊 THE LEVELS THAT MATTER
🟢 Support Zone: $76,000–$76,325
🔹 Near Resistance: Around $78,000
🔹 First Major Hurdle: $80,000
🚀 Breakout Confirmation: Above $82,000
🎯 Bullish Target: $90,000+
A sustained move above $80K could improve market sentiment. If buyers then reclaim $82K with strong volume, the path toward $90K becomes an interesting bullish scenario.
⚠️ WHAT COULD INVALIDATE THE BULLISH VIEW?
If $BTC loses the $76K support zone on a convincing daily close, the recovery thesis becomes weaker. The next downside areas to watch are around $74,800–$73,000.
There is also another factor traders should not ignore: US spot Ethereum ETFs have recorded 23 consecutive trading days of net outflows, highlighting continued weakness in institutional demand for ETH exposure. That broader market pressure could affect crypto sentiment too.
🧠 MY STRATEGY
I’m leaning cautiously bullish, but I don't want to chase a sudden green candle.
My focus:
Accumulate gradually rather than entering all at once.Watch how BTC reacts around $78K–$80K.Look for strong volume before treating $82K as a confirmed breakout.Keep risk management in place if $76K fails.
Imagine the market keeps waiting for $70K, while Bitcoin surprises everyone with a recovery toward $90K! 🔥
What’s your opinion, buddies? Is $76K the real bottom, or are we going to see another dip before the next major rally? 👇
#USSpotETHETFsPost23StraightDaysOfNetOutflows
#BinanceSAFUFundTransferCompleted7499BTC
{spot}(BTCUSDT)
# IS $76K THE BITCOIN BOTTOM? $BTC COULD BE PREPARING FOR A $90K COMEBACK! I’m still watching the *
I’m still watching the $76,000 zone as a potential bottom for $BTC.
After touching approximately $76,325, Bitcoin has bounced back and is trading near $77,800. Buyers are trying to stabilize the market, but the real test is whether they can turn this recovery into a sustained bullish reversal.
And honestly... I’m watching Monday closely. 👀 Could the new week bring fresh buying pressure?
📊 THE LEVELS THAT MATTER
🟢 Support Zone: $76,000–$76,325
🔹 Near Resistance: Around $78,000
🔹 First Major Hurdle: $80,000
🚀 Breakout Confirmation: Above $82,000
🎯 Bullish Target: $90,000+
A sustained move above $80K could improve market sentiment. If buyers then reclaim $82K with strong volume, the path toward $90K becomes an interesting bullish scenario.
⚠️ WHAT COULD INVALIDATE THE BULLISH VIEW?
If $BTC loses the $76K support zone on a convincing daily close, the recovery thesis becomes weaker. The next downside areas to watch are around $74,800–$73,000.
There is also another factor traders should not ignore: US spot Ethereum ETFs have recorded 23 consecutive trading days of net outflows, highlighting continued weakness in institutional demand for ETH exposure. That broader market pressure could affect crypto sentiment too.
🧠 MY STRATEGY
I’m leaning cautiously bullish, but I don't want to chase a sudden green candle.
My focus:
Accumulate gradually rather than entering all at once.Watch how BTC reacts around $78K–$80K.Look for strong volume before treating $82K as a confirmed breakout.Keep risk management in place if $76K fails.
Imagine the market keeps waiting for $70K, while Bitcoin surprises everyone with a recovery toward $90K! 🔥
What’s your opinion, buddies? Is $76K the real bottom, or are we going to see another dip before the next major rally? 👇
#USSpotETHETFsPost23StraightDaysOfNetOutflows
#BinanceSAFUFundTransferCompleted7499BTC
16


·
--
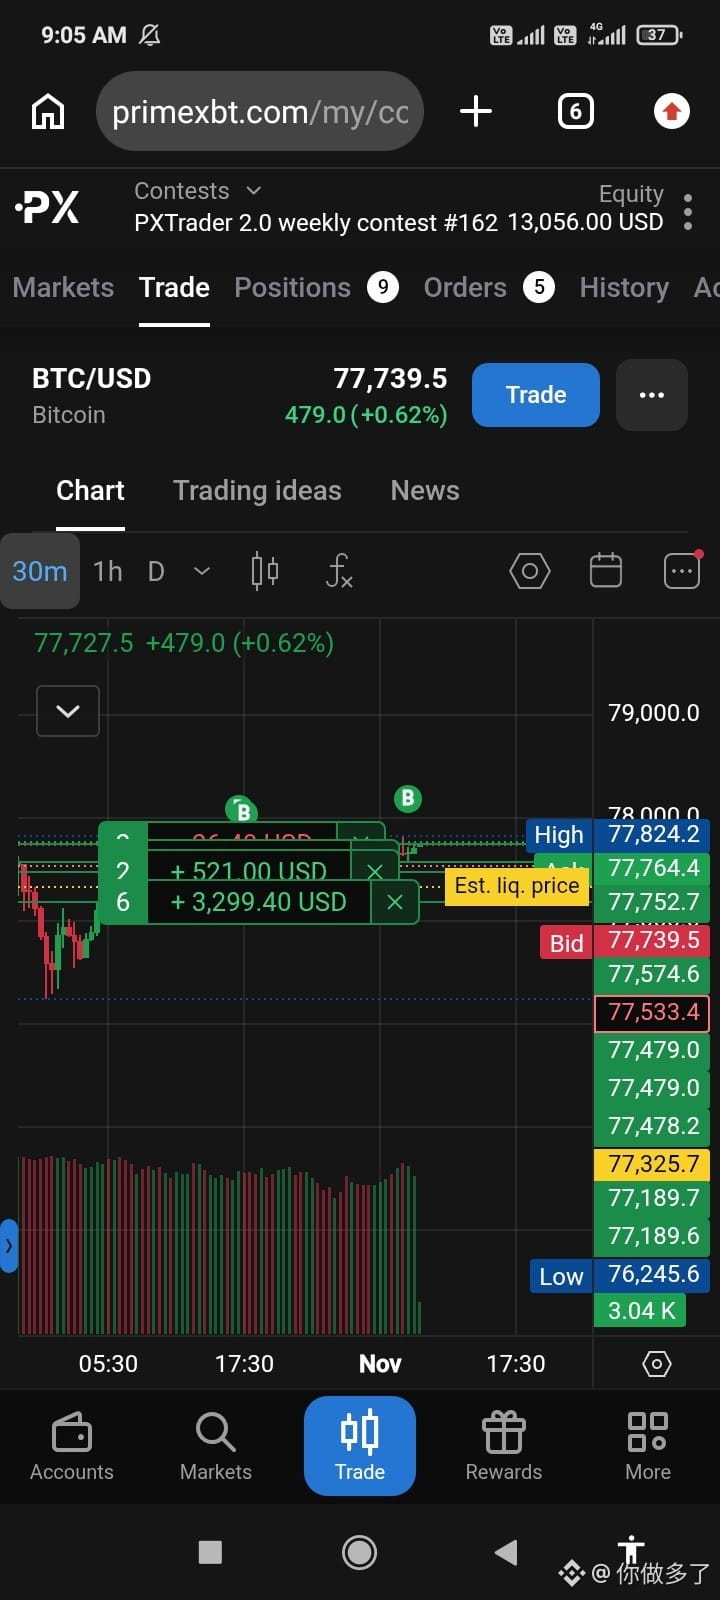
30D trade $BTC 26.4K USDT
I still believe $76K was the BOTTOM for $BTC ...
Bitcoin bounced from $76,325 and is now holding around $77,700, slowly building a base after that massive dump.
And i have a feeling... Monday could bring the next wave of bullish momentum 💪🏻
My target is still $90K+ if buyers manage to reclaim $80K and then break above $82K.
Of course... losing $76K again would change the picture, but for now i am leaning bullish and accumulating in small amounts.
Imagine everyone expecting another dump to $70K and $BTC suddenly starts flying towards $90K...
Who agrees with me buddies❓ Is $76K really the bottom?
{future}(BTCUSDT)
#USSpotETHETFsPost23StraightDaysOfNetOutflows
#BinanceSAFUFundTransferCompleted7499BTC
I still believe $76K was the BOTTOM for $BTC ...
Bitcoin bounced from $76,325 and is now holding around $77,700, slowly building a base after that massive dump.
And i have a feeling... Monday could bring the next wave of bullish momentum 💪🏻
My target is still $90K+ if buyers manage to reclaim $80K and then break above $82K.
Of course... losing $76K again would change the picture, but for now i am leaning bullish and accumulating in small amounts.
Imagine everyone expecting another dump to $70K and $BTC suddenly starts flying towards $90K...
Who agrees with me buddies❓ Is $76K really the bottom?
#USSpotETHETFsPost23StraightDaysOfNetOutflows
#BinanceSAFUFundTransferCompleted7499BTC
hothefa 1999:
تحليل جميل انا كمبتدئ تعلمت منك ان مستوى 76الف مهم. انا هدفي 80الف أولاً. هل تتفق اننا نحتاج ان نكسر 82الف للتأكيد؟ بالتوفيق 💪$BTC
3
10
2.8k

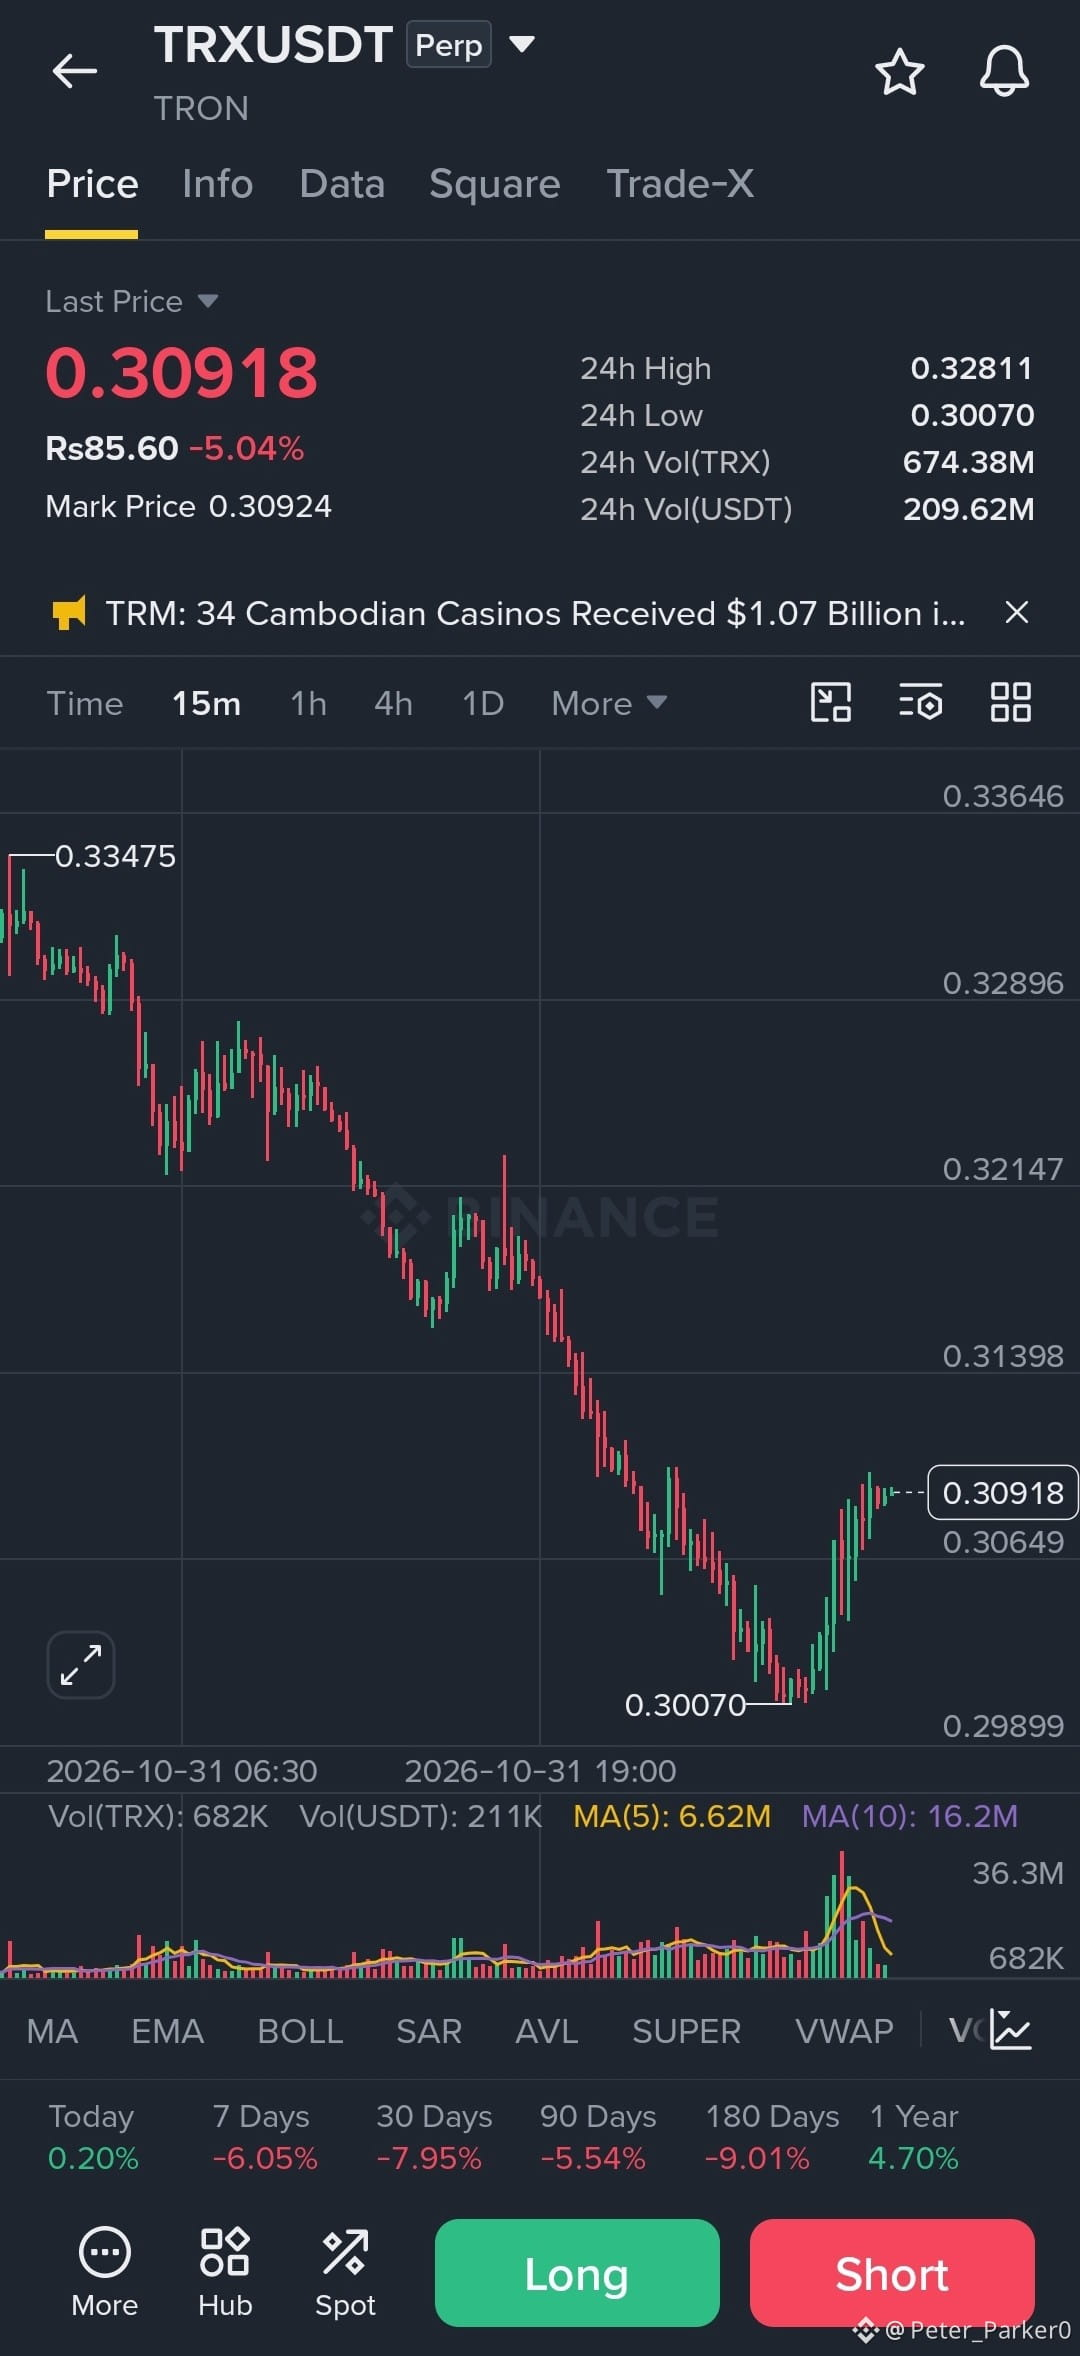
🚀 $TRX WOKE UP AND CHOSE VIOLENCE! 😂📈
Looks like TRX is tired of sleeping at the bottom and wants to take the elevator straight to the moon! 🌕🤣
I'm watching this potential bottom reversal closely. Bulls, don't get too excited yet, but this setup is definitely worth keeping on the radar. 👀
🟢 LONG SETUP – $TRX
Entry: 0.3080 – 0.3095
TP1: 0.3120
TP2: 0.3250
TP3: 0.3360
Final Target: 0.3430
SL: 0.3040
😂 The Game Plan:
If TP1 hits, take some profit and move SL to breakeven. Let the remaining position try to do the heavy lifting.
25x leverage? That's not a roller coaster anymore, that's a rocket with no seatbelts! 💀🚀
Trade smart, protect your capital, and don't let the market turn your Lamborghini dreams into bicycle dreams. 🤝😂
Let's see if $TRX delivers or teaches us another expensive lesson!
{future}(TRXUSDT)
#USSpotETHETFsPost23StraightDaysOfNetOutflows #USSpotETHETFsPost23StraightDaysOfNetOutflows #YiHe:ProofOfReserves:10TokensAt100%Backing #BinanceSAFUFundTransferCompleted7499BTC
🚀 $TRX WOKE UP AND CHOSE VIOLENCE! 😂📈
Looks like TRX is tired of sleeping at the bottom and wants to take the elevator straight to the moon! 🌕🤣
I'm watching this potential bottom reversal closely. Bulls, don't get too excited yet, but this setup is definitely worth keeping on the radar. 👀
🟢 LONG SETUP – $TRX
Entry: 0.3080 – 0.3095
TP1: 0.3120
TP2: 0.3250
TP3: 0.3360
Final Target: 0.3430
SL: 0.3040
😂 The Game Plan:
If TP1 hits, take some profit and move SL to breakeven. Let the remaining position try to do the heavy lifting.
25x leverage? That's not a roller coaster anymore, that's a rocket with no seatbelts! 💀🚀
Trade smart, protect your capital, and don't let the market turn your Lamborghini dreams into bicycle dreams. 🤝😂
Let's see if $TRX delivers or teaches us another expensive lesson!
#USSpotETHETFsPost23StraightDaysOfNetOutflows #USSpotETHETFsPost23StraightDaysOfNetOutflows #YiHe:ProofOfReserves:10TokensAt100%Backing #BinanceSAFUFundTransferCompleted7499BTC
1
1
458

·
--
Bullish
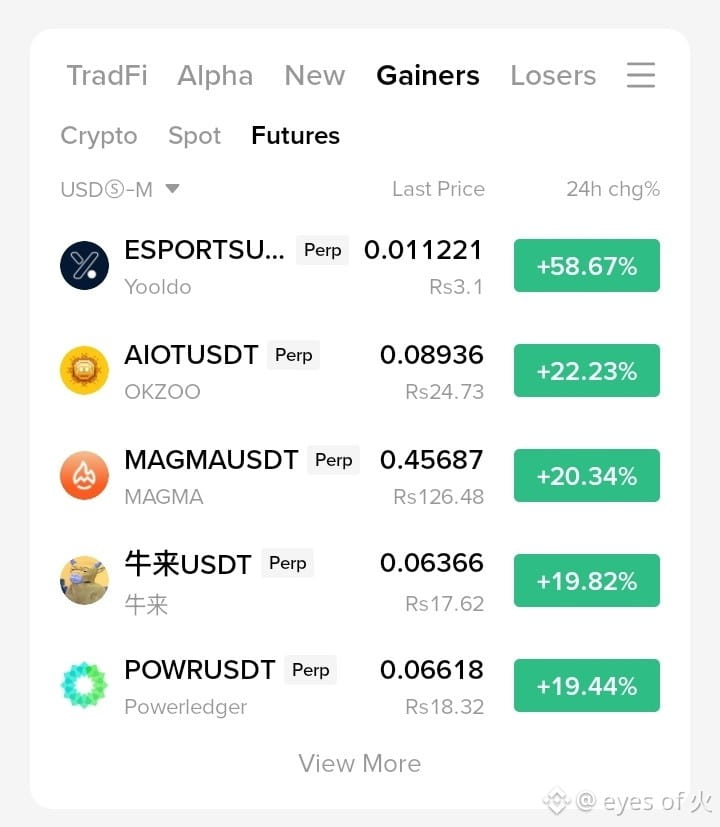
🚀 Market Alert! Look at these massive crypto gainers today! 🔥
The market is pumping hard led by $ESPORTS (Yooldo), skyrocketing a massive +58.67% to trade at $0.011221 (Rs 3.1)! Following closely are $AIOT (OKZOO) up +22.23% at $0.08936 (Rs 24.73), and $MAGMA surging +20.34% sitting at $0.45687 (Rs 126.48).
Are you trading any of these green monsters today? Drop your thoughts below! 👇
DYOR, trade smart!
#BinanceToResumePhaseOneOfWithdrawals #BinanceSAFUFundTransferCompleted7499BTC #CZDismissesClaimsBinanceHackWasPredicted #USSpotETHETFsPost23StraightDaysOfNetOutflows #B14gReportsUnauthorizedTransferOfAbout97MCORE
{future}(ESPORTSUSDT)
{future}(AIOTUSDT)
{future}(MAGMAUSDT)
🚀 Market Alert! Look at these massive crypto gainers today! 🔥
The market is pumping hard led by $ESPORTS (Yooldo), skyrocketing a massive +58.67% to trade at $0.011221 (Rs 3.1)! Following closely are $AIOT (OKZOO) up +22.23% at $0.08936 (Rs 24.73), and $MAGMA surging +20.34% sitting at $0.45687 (Rs 126.48).
Are you trading any of these green monsters today? Drop your thoughts below! 👇
DYOR, trade smart!
#BinanceToResumePhaseOneOfWithdrawals #BinanceSAFUFundTransferCompleted7499BTC #CZDismissesClaimsBinanceHackWasPredicted #USSpotETHETFsPost23StraightDaysOfNetOutflows #B14gReportsUnauthorizedTransferOfAbout97MCORE
Crypto Anik BD:
Trading $ESPORTS today! +58% is insane 🚀 Market recovering after Binance hack update. $AIOT also on my watchlist. Bullish! 🔥
2
1
467

·
--
$MAGMA TRADE SETUP — Momentum Push 🌋
📈 Bias: LONG
💰 Current Price: $0.43968
🔥 24H Change: +16.86%
Entry Zone: $0.43000–$0.43900
🎯 TP1: $0.44900
🎯 TP2: $0.46000
🎯 TP3: $0.47200
🛑 Stop Loss: $0.41800
MAGMA is gaining ground, and continued buying could support another move higher. Watch how price reacts around the entry zone and nearby resistance; a strong hold with fresh buying is the confirmation to look for, while a breakdown weakens the setup.
Trade smart and manage your risk. 📊
$MAGMA
{future}(MAGMAUSDT)
#USSpotETHETFsPost23StraightDaysOfNetOutflows #CZSaysCompensationIsinPlaceUsersAreProtected #IntelHasItsWorstDaySince1974 #YiHe:ProofOfReserves:10TokensAt100%Backing #BinanceSAFUFundTransferCompleted7499BTC
$MAGMA TRADE SETUP — Momentum Push 🌋
📈 Bias: LONG
💰 Current Price: $0.43968
🔥 24H Change: +16.86%
Entry Zone: $0.43000–$0.43900
🎯 TP1: $0.44900
🎯 TP2: $0.46000
🎯 TP3: $0.47200
🛑 Stop Loss: $0.41800
MAGMA is gaining ground, and continued buying could support another move higher. Watch how price reacts around the entry zone and nearby resistance; a strong hold with fresh buying is the confirmation to look for, while a breakdown weakens the setup.
Trade smart and manage your risk. 📊
$MAGMA
#USSpotETHETFsPost23StraightDaysOfNetOutflows #CZSaysCompensationIsinPlaceUsersAreProtected #IntelHasItsWorstDaySince1974 #YiHe:ProofOfReserves:10TokensAt100%Backing #BinanceSAFUFundTransferCompleted7499BTC
110

·
--
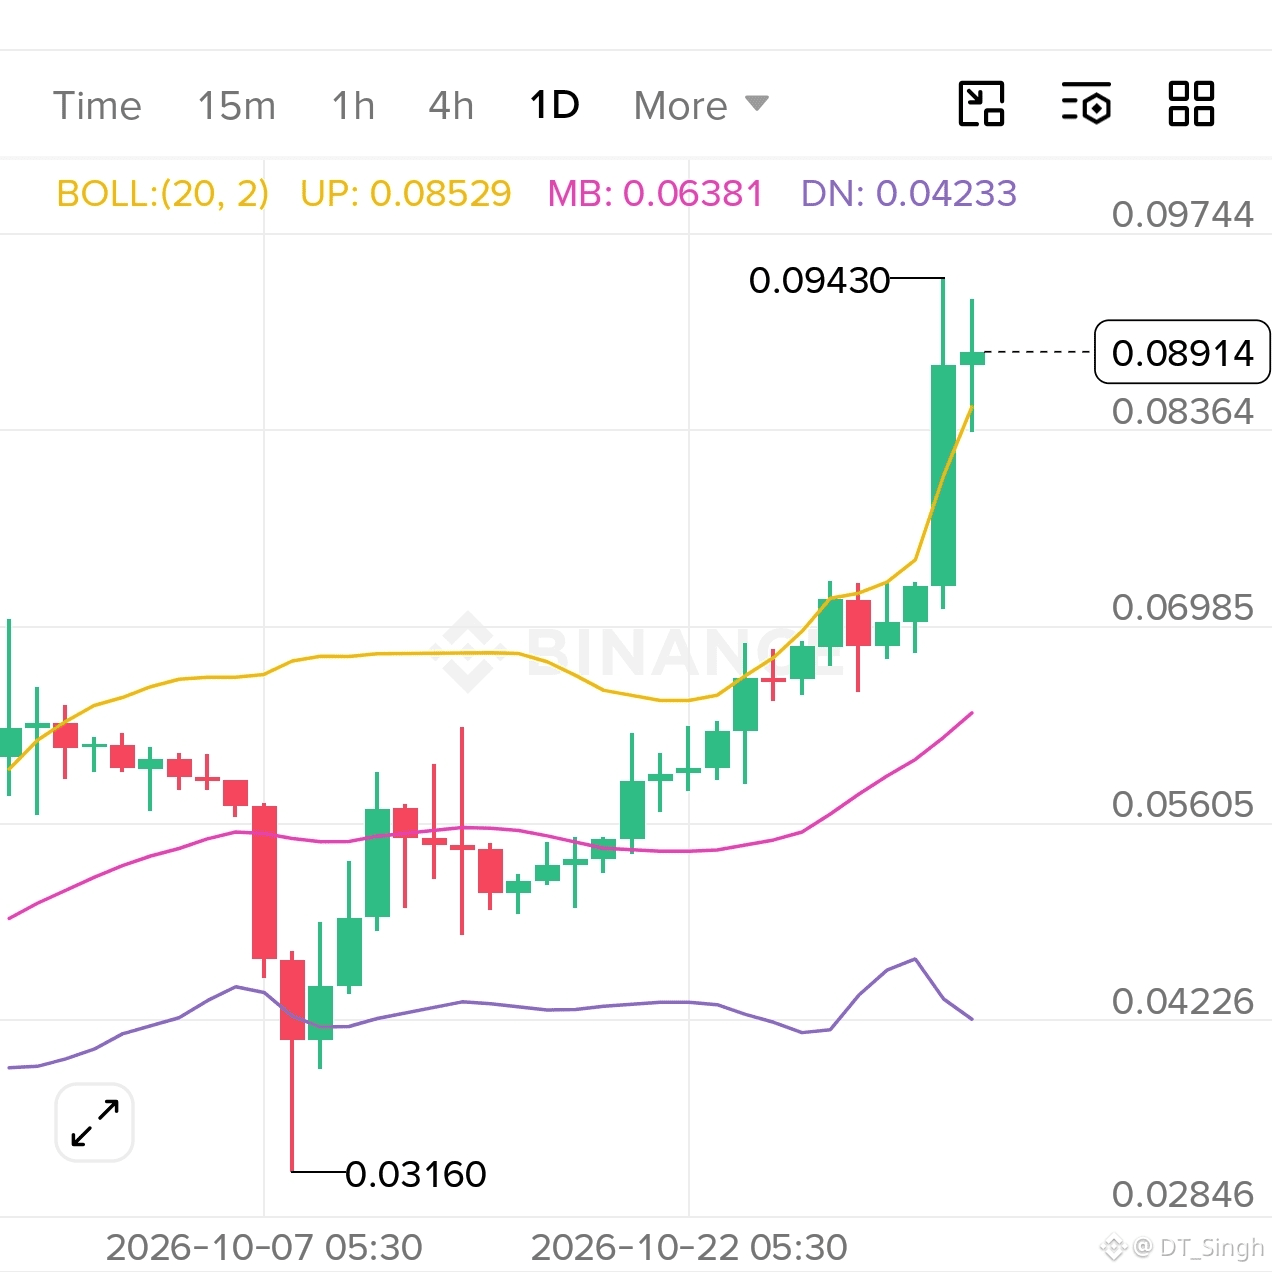
$AIOT is up 21.61% today, trading at 0.08915 after a dramatic round trip 📈
Chart levels I'm watching:
🔴 Resistance: 0.0943 (24h high, tested with a long upper wick)
🟢 Support: 0.0699 – 0.0638 (BOLL midline zone)
🟡 Key level: 0.0560 (prior consolidation)
The daily chart tells a wild story: price crashed from around 0.07 down to 0.0316, then reversed into a strong V-shaped recovery back above 0.09. That kind of move usually means heavy liquidations followed by aggressive buying.
Context: +33.86% over 7 days and +86.43% over 90 days, but -16.41% over 180 days and -80.90% over 1 year. So this is a sharp short-term recovery inside a much larger downtrend.
Volume picked up a lot on the recovery (100M+ USDT), which supports the move, but after such a fast run, some consolidation or pullback wouldn't be unusual.
A clean close above 0.0943 would confirm strength. Losing 0.0699 could mean the bounce is fading.
Do you see this as a real reversal or just a relief bounce after the crash? 👇
#CZDismissesClaimsBinanceHackWasPredicted #USSpotETHETFsPost23StraightDaysOfNetOutflows #BinanceSAFUFundTransferCompleted7499BTC
Chart-based observation only, not financial advice. NFA, manage your own risk
1
106

·
--
Bullish
🔥 I'm watching #BEAMX closely! Short liquidations near $0.00547 could signal a bullish opportunity if buyers maintain pressure. A squeeze higher might be coming! 👀
🟢 Trade Setup: LONG
* Entry Zone: $0.00542 – $0.00550
* TP1: $0.00560
* TP2: $0.00575
* TP3: $0.00590
* Stop Loss: $0.00532
💡 Pro Tip: Watch for strong buying volume and a clean breakout. Avoid chasing green candles and keep risk under control. 🚀
#BinanceToResumePhaseOneOfWithdrawals #BinanceSAFUFundTransferCompleted7499BTC #CZDismissesClaimsBinanceHackWasPredicted #YiHe:ProofOfReserves:10TokensAt100%Backing #USSpotETHETFsPost23StraightDaysOfNetOutflows $BEAMX
{spot}(BEAMXUSDT)
🔥 I'm watching #BEAMX closely! Short liquidations near $0.00547 could signal a bullish opportunity if buyers maintain pressure. A squeeze higher might be coming! 👀
🟢 Trade Setup: LONG
* Entry Zone: $0.00542 – $0.00550
* TP1: $0.00560
* TP2: $0.00575
* TP3: $0.00590
* Stop Loss: $0.00532
💡 Pro Tip: Watch for strong buying volume and a clean breakout. Avoid chasing green candles and keep risk under control. 🚀
#BinanceToResumePhaseOneOfWithdrawals #BinanceSAFUFundTransferCompleted7499BTC #CZDismissesClaimsBinanceHackWasPredicted #YiHe:ProofOfReserves:10TokensAt100%Backing #USSpotETHETFsPost23StraightDaysOfNetOutflows $BEAMX
238
·
--
Bullish
🔥 I'm watching $LA closely! Short liquidations around $0.05931 are catching my attention. A potential bounce could create an interesting LONG opportunity if buyers step in. 👀
🟢 Trade Setup: LONG
* Entry Zone: $0.0585 – $0.0595
* TP1: $0.0610
* TP2: $0.0630
* TP3: $0.0650
* Stop Loss: $0.0570
💡 Pro Tip: Watch volume and buyer confirmation before entering. Don't chase the move; protect your capital and trade smart! 🚀
#BinanceToResumePhaseOneOfWithdrawals #BinanceSAFUFundTransferCompleted7499BTC #CZDismissesClaimsBinanceHackWasPredicted #YiHe:ProofOfReserves:10TokensAt100%Backing #USSpotETHETFsPost23StraightDaysOfNetOutflows $LA
{spot}(LAUSDT)
🔥 I'm watching $LA closely! Short liquidations around $0.05931 are catching my attention. A potential bounce could create an interesting LONG opportunity if buyers step in. 👀
🟢 Trade Setup: LONG
* Entry Zone: $0.0585 – $0.0595
* TP1: $0.0610
* TP2: $0.0630
* TP3: $0.0650
* Stop Loss: $0.0570
💡 Pro Tip: Watch volume and buyer confirmation before entering. Don't chase the move; protect your capital and trade smart! 🚀
#BinanceToResumePhaseOneOfWithdrawals #BinanceSAFUFundTransferCompleted7499BTC #CZDismissesClaimsBinanceHackWasPredicted #YiHe:ProofOfReserves:10TokensAt100%Backing #USSpotETHETFsPost23StraightDaysOfNetOutflows $LA
129

·
--
Bullish
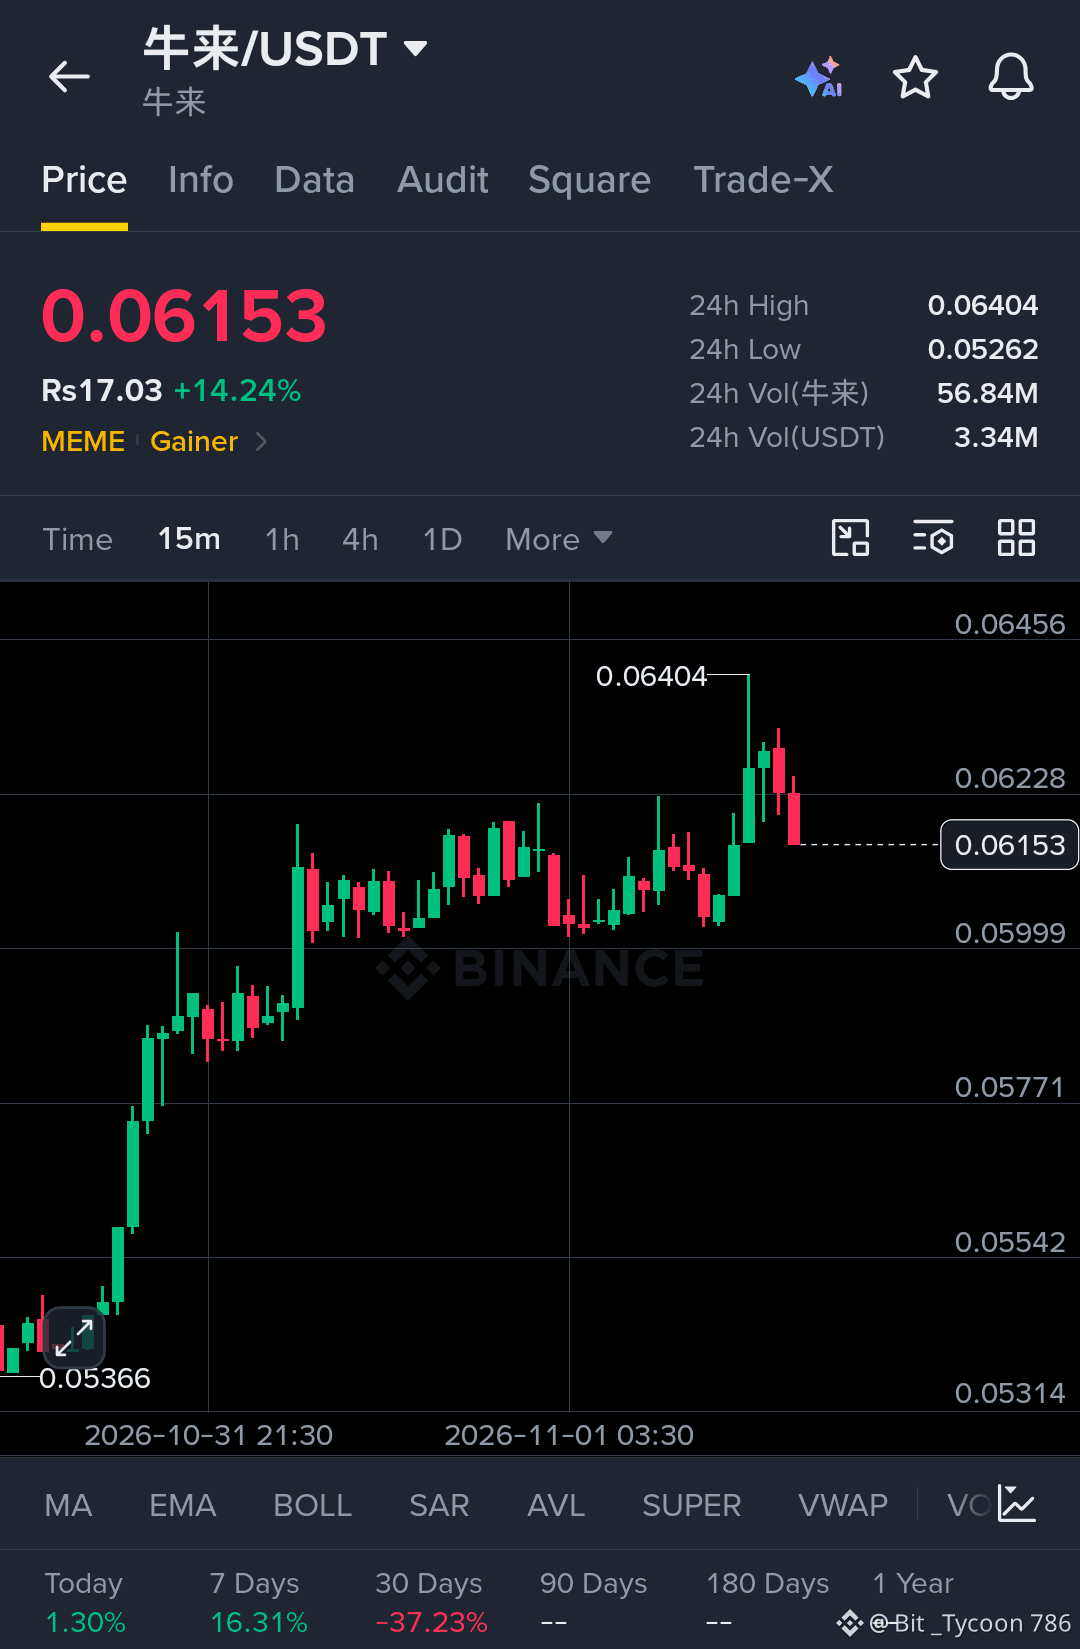
$牛来 /USDT is trading at 0.06153, up 14.24% over the last 24 hours. The move follows a strong advance from the 0.05366 area, with price gradually establishing a higher trading range around 0.06000–0.06200.
On the 15-minute chart, buying activity accelerated as the token moved through successive resistance levels. Price eventually reached 0.06404 before encountering selling pressure. The latest candles show a pullback toward 0.06153, indicating some short-term profit-taking after the advance.
Trading volume has reached 56.84 million tokens, equivalent to approximately 3.34 million USDT over 24 hours. This increased activity coincides with the upward move, although the recent rejection suggests buyers still need to demonstrate strength around the current level.
The immediate resistance is around 0.06228, followed by 0.06404. On the downside, 0.06000 is an important nearby support area, with 0.05999 marking the next chart reference.
The broader short-term structure remains constructive, but maintaining the recently established range is important. A recovery above 0.06228 would strengthen the recovery attempt, while a sustained move below 0.06000 could indicate that the market needs a deeper consolidation.
{spot}(牛来USDT)
#BinanceSAFUFundTransferCompleted7499BTC #YiHe:ProofOfReserves:10TokensAt100%Backing #CZSaysCompensationIsinPlaceUsersAreProtected #B14gReportsUnauthorizedTransferOfAbout97MCORE #USSpotETHETFsPost23StraightDaysOfNetOutflows
$牛来 /USDT is trading at 0.06153, up 14.24% over the last 24 hours. The move follows a strong advance from the 0.05366 area, with price gradually establishing a higher trading range around 0.06000–0.06200.
On the 15-minute chart, buying activity accelerated as the token moved through successive resistance levels. Price eventually reached 0.06404 before encountering selling pressure. The latest candles show a pullback toward 0.06153, indicating some short-term profit-taking after the advance.
Trading volume has reached 56.84 million tokens, equivalent to approximately 3.34 million USDT over 24 hours. This increased activity coincides with the upward move, although the recent rejection suggests buyers still need to demonstrate strength around the current level.
The immediate resistance is around 0.06228, followed by 0.06404. On the downside, 0.06000 is an important nearby support area, with 0.05999 marking the next chart reference.
The broader short-term structure remains constructive, but maintaining the recently established range is important. A recovery above 0.06228 would strengthen the recovery attempt, while a sustained move below 0.06000 could indicate that the market needs a deeper consolidation.
#BinanceSAFUFundTransferCompleted7499BTC #YiHe:ProofOfReserves:10TokensAt100%Backing #CZSaysCompensationIsinPlaceUsersAreProtected #B14gReportsUnauthorizedTransferOfAbout97MCORE #USSpotETHETFsPost23StraightDaysOfNetOutflows
119

·
--
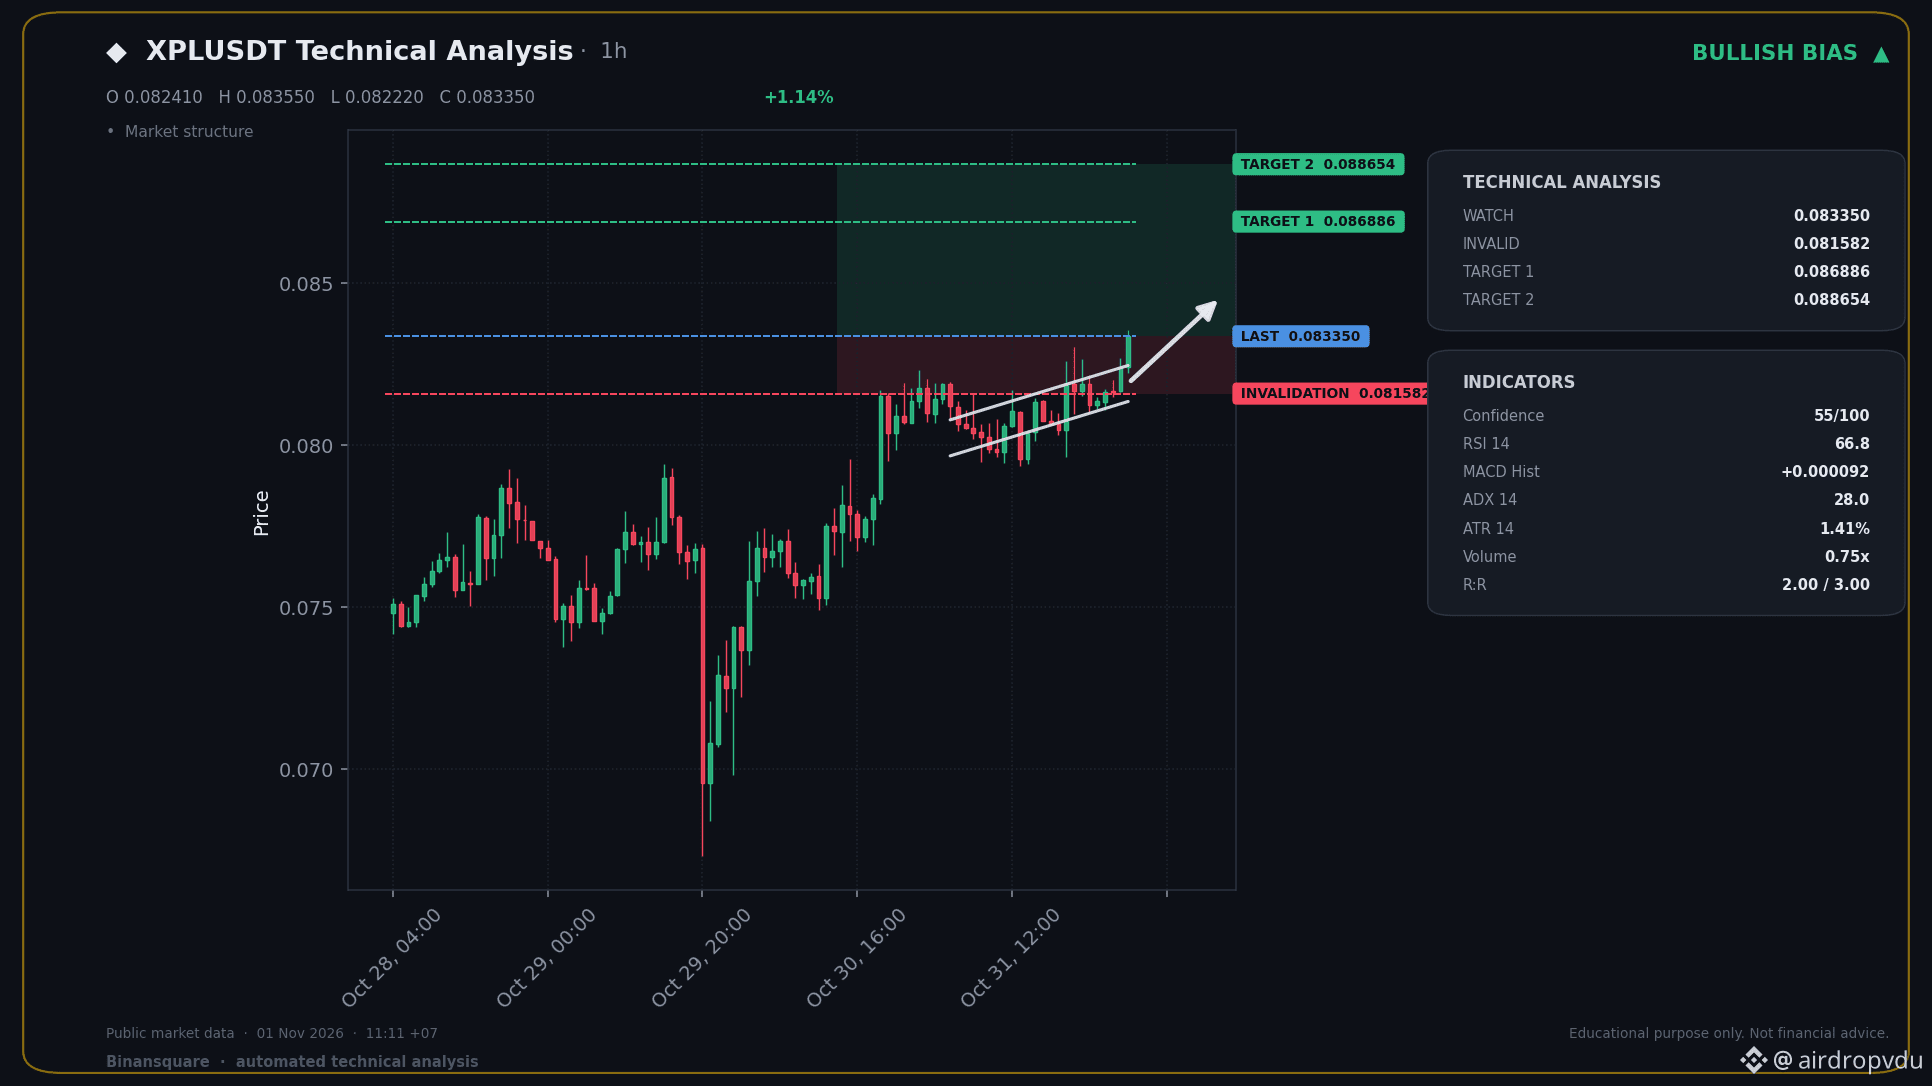
📈 BIG LONG NOW - XPLUSDT
📍 KEY LEVELS
Entry: 0.083350
🛑 SL: 0.081582
🎯 TP1: 0.086886
🎯 TP2: 0.088654
The trend is clearly up with EMAs showing strength and momentum confirmed by the MACD. RSI is sitting nicely in the healthy zone, suggesting this uptrend has more room to run.
This signal was generated automatically from technical indicators. It does not guarantee profit and is not investment advice. Always manage your own risk and DYOR.
$XPL
#USSpotETHETFsPost23StraightDaysOfNetOutflows #IntelHasItsWorstDaySince1974
88

·
--
$PUMP PUMP (Pump.fun / Big Pump)
Current Status: High-risk, speculative trading environment. Intraday price action continues to strictly track short-term Solana DEX liquidity pool flows and launchpad volume.
Key Focus: Highly volatile. Strict risk management and mandatory stop-loss execution remain vital to protect capital against sudden drawdown sweeps during weekend lulls.#YiHe:ProofOfReserves:10TokensAt100%Backing #BinanceSAFUFundTransferCompleted7499BTC #BackedNotBroken:RichardTengSaysUsersBearNoLoss #B14gReportsUnauthorizedTransferOfAbout97MCORE #USSpotETHETFsPost23StraightDaysOfNetOutflows
{spot}(PUMPUSDT)
$PUMP PUMP (Pump.fun / Big Pump)
Current Status: High-risk, speculative trading environment. Intraday price action continues to strictly track short-term Solana DEX liquidity pool flows and launchpad volume.
Key Focus: Highly volatile. Strict risk management and mandatory stop-loss execution remain vital to protect capital against sudden drawdown sweeps during weekend lulls.#YiHe:ProofOfReserves:10TokensAt100%Backing #BinanceSAFUFundTransferCompleted7499BTC #BackedNotBroken:RichardTengSaysUsersBearNoLoss #B14gReportsUnauthorizedTransferOfAbout97MCORE #USSpotETHETFsPost23StraightDaysOfNetOutflows
59
·
--
$SOL Solana (SOL)
Current Status: Trading near $105.00 – $108.00 (~NPR 15,900). SOL is building a firm accumulation floor above its key $100 psychological level, with DEX volumes and network throughput maintaining baseline strength post-Alpenglow mainnet upgrade.
Key Focus: Primary support sits in the $102 – $105 demand channel. A high-volume daily push past $110 – $114 is required to re-establish bullish expansion targeting $120 – $125.#BinanceSAFUFundTransferCompleted7499BTC #YiHe:ProofOfReserves:10TokensAt100%Backing #BackedNotBroken:RichardTengSaysUsersBearNoLoss #B14gReportsUnauthorizedTransferOfAbout97MCORE #USSpotETHETFsPost23StraightDaysOfNetOutflows
{spot}(SOLUSDT)
$SOL Solana (SOL)
Current Status: Trading near $105.00 – $108.00 (~NPR 15,900). SOL is building a firm accumulation floor above its key $100 psychological level, with DEX volumes and network throughput maintaining baseline strength post-Alpenglow mainnet upgrade.
Key Focus: Primary support sits in the $102 – $105 demand channel. A high-volume daily push past $110 – $114 is required to re-establish bullish expansion targeting $120 – $125.#BinanceSAFUFundTransferCompleted7499BTC #YiHe:ProofOfReserves:10TokensAt100%Backing #BackedNotBroken:RichardTengSaysUsersBearNoLoss #B14gReportsUnauthorizedTransferOfAbout97MCORE #USSpotETHETFsPost23StraightDaysOfNetOutflows
81

·
--
Bullish
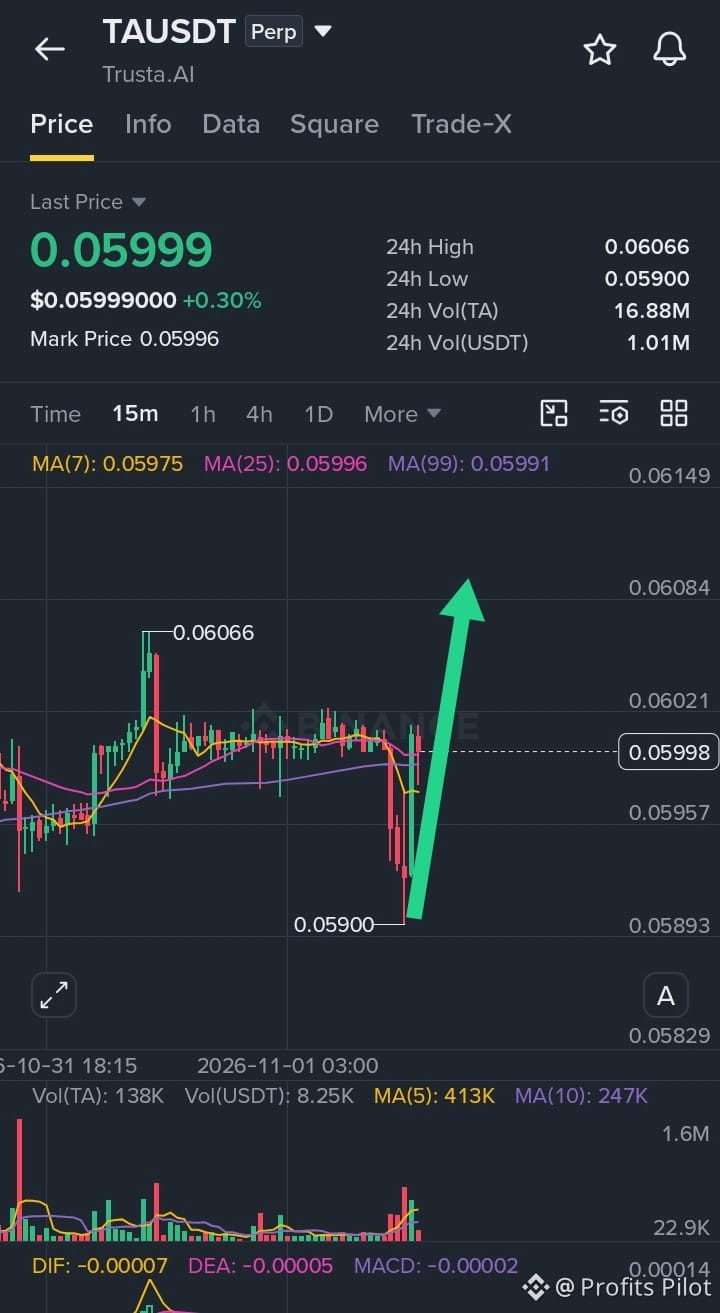
$TA LONG SETUP IS LIVE! BUYERS ARE FINALLY FIGHTING BACK!
After a sustained decline, $TA is showing signs of a potential recovery. Buyers have broken the previous candle's high, triggering the long setup.
The entry is live. Here's the complete trade plan.
🟢 LONG Now
Entry: 0.059 0.060
TP1: 0.06107
TP2: 0.06191
TP3: 0.06317
Stop Loss: 0.05897
Invalidation: Below 0.05897.
The recovery trigger is clear. Now the focus is on reaching each target one by one.
Buy and Trade $TA. Follow Profits Pilot for more fresh trading setups and market opportunities. 🔥
Click Below Bro ❤️ 🤝 $TA
{future}(TAUSDT)
{spot}(XRPUSDT)
{spot}(XAUTUSDT)
#BinanceSAFUFundTransferCompleted7499BTC #YiHe:ProofOfReserves:10TokensAt100%Backing #BackedNotBroken:RichardTengSaysUsersBearNoLoss #B14gReportsUnauthorizedTransferOfAbout97MCORE #USSpotETHETFsPost23StraightDaysOfNetOutflows
$TA LONG SETUP IS LIVE! BUYERS ARE FINALLY FIGHTING BACK!
After a sustained decline, $TA is showing signs of a potential recovery. Buyers have broken the previous candle's high, triggering the long setup.
The entry is live. Here's the complete trade plan.
🟢 LONG Now
Entry: 0.059 0.060
TP1: 0.06107
TP2: 0.06191
TP3: 0.06317
Stop Loss: 0.05897
Invalidation: Below 0.05897.
The recovery trigger is clear. Now the focus is on reaching each target one by one.
Buy and Trade $TA . Follow Profits Pilot for more fresh trading setups and market opportunities. 🔥
Click Below Bro ❤️ 🤝 $TA
#BinanceSAFUFundTransferCompleted7499BTC #YiHe:ProofOfReserves:10TokensAt100%Backing #BackedNotBroken:RichardTengSaysUsersBearNoLoss #B14gReportsUnauthorizedTransferOfAbout97MCORE #USSpotETHETFsPost23StraightDaysOfNetOutflows
147

·
--
LABUSDT#LABUSDT
Reference price: $0.04436
24h change: -0.40%
1H RSI: 50 – Neutral.
4H RSI: 51 – Neutral.
Daily RSI: 47 – Weak.
Weekly RSI: 41 – Bearish momentum.
Immediate support: $0.0437
Strong support: $0.041–0.042
Immediate resistance: $0.046
Next resistance: $0.048–0.050
#BinanceSAFUFundTransferCompleted7499BTC #YiHe:ProofOfReserves:10TokensAt100%Backing #BackedNotBroken:RichardTengSaysUsersBearNoLoss #USSpotETHETFsPost23StraightDaysOfNetOutflows
202
Log in to explore more content
Join global crypto users on Binance Square
⚡️ Get latest and useful information about crypto.
💬 Trusted by the world’s largest crypto exchange.
👍 Discover real insights from verified creators.
Email / Phone number
Trending Topics
1
#BinanceToResumePhaseOneOfWithdrawals
5,178 views
266 Discussing
2
#BinanceHadAlreadyCovered$6BofHackLoss
1,393 views
43 Discussing
3
#FBIConfirmsNorthKoreaIsResponsibleForBinanceCryptoHack
8,099 views
55 Discussing
4
#BinanceSAFUFundTransferCompleted7499BTC
73,829 views
1,277 Discussing
5
#CZDismissesClaimsBinanceHackWasPredicted
1,429 views
73 Discussing
6
#BinanceRecovery90% of stolen assets
203,016 views
219 Discussing
7
#YiHe:ProofOfReserves:10TokensAt100%Backing
181,226 views
1,089 Discussing
8
#BackedNotBroken:RichardTengSaysUsersBearNoLoss
62,975 views
670 Discussing
9
#B14gReportsUnauthorizedTransferOfAbout97MCORE
4,118 views
121 Discussing
10
#USSpotETHETFsPost23StraightDaysOfNetOutflows
4,905 views
114 Discussing