

#tutorial
tutorial
266,884 views
717 Discussing
Hot
Latest

Step-by-step instructions on how to connect Binance Earn in three steps
If you’ve never used the passive income section, here’s the action plan:
Open the main screen of Binance and go to Earn, then Simple Earn.
Find the required coin in the list (I recommend starting with USDT) and select the terms type: Flexible.
Enter the desired amount, review the estimated APR, and click Confirm.
The interest will start accruing from the next day. You can cancel the subscription at any time without fees.
#Tutorial #BinanceEarn #CryptoGuide
Step-by-step instructions on how to connect Binance Earn in three steps
If you’ve never used the passive income section, here’s the action plan:
Open the main screen of Binance and go to Earn, then Simple Earn.
Find the required coin in the list (I recommend starting with USDT) and select the terms type: Flexible.
Enter the desired amount, review the estimated APR, and click Confirm.
The interest will start accruing from the next day. You can cancel the subscription at any time without fees.
#Tutorial #BinanceEarn #CryptoGuide
If you’ve never used the passive income section, here’s the action plan:
Open the main screen of Binance and go to Earn, then Simple Earn.
Find the required coin in the list (I recommend starting with USDT) and select the terms type: Flexible.
Enter the desired amount, review the estimated APR, and click Confirm.
The interest will start accruing from the next day. You can cancel the subscription at any time without fees.
#Tutorial #BinanceEarn #CryptoGuide
72


·
--
Article
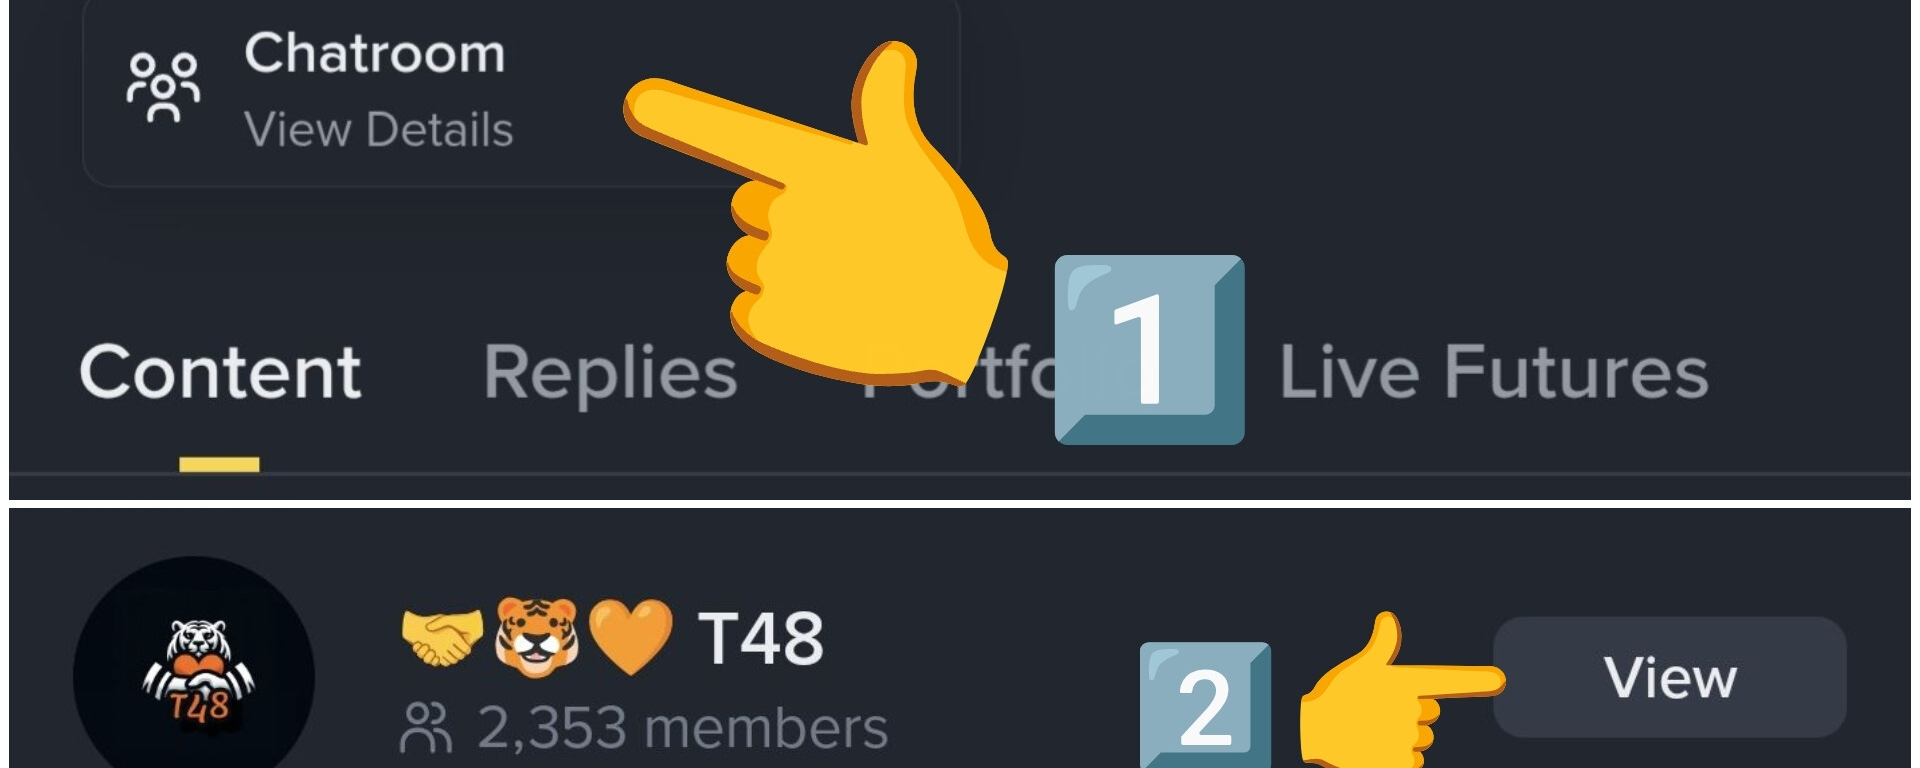
How to join the group of your Favorite creator?1️⃣ : When you see a post from your favorite creator, click on the photo of their profile..
• For this example, I’m going to use the profile of @CRYPTOMECHANIC , who is one of the best creators about Trading..
2️⃣ : Once you see their profile, below the bio there is a button for ( Chat Room ), click on it..
3️⃣ then click the yellow button to join ...
• As you can see, it’s quite simple; it could even be summarized in 2 steps..
1️⃣ Go to your profile and click on the chat room
How to join the group of your Favorite creator?
1️⃣ : When you see a post from your favorite creator, click on the photo of their profile..
• For this example, I’m going to use the profile of @CRYPTO MECHANIC , who is one of the best creators about Trading..
2️⃣ : Once you see their profile, below the bio there is a button for ( Chat Room ), click on it..
3️⃣ then click the yellow button to join ...
• As you can see, it’s quite simple; it could even be summarized in 2 steps..
1️⃣ Go to your profile and click on the chat room
• For this example, I’m going to use the profile of @CRYPTO MECHANIC , who is one of the best creators about Trading..
2️⃣ : Once you see their profile, below the bio there is a button for ( Chat Room ), click on it..
3️⃣ then click the yellow button to join ...
• As you can see, it’s quite simple; it could even be summarized in 2 steps..
1️⃣ Go to your profile and click on the chat room
Valeria_arg:
buen dato!
5
7
718

·
--
Bullish
Lesson 1: How to create a token.
Lesson 2: How people discover the token.
Lesson 3: How people start trading the token.
Lesson 4: How traders lose sleep watching the token. 😂
Welcome to the TUT tutorial.
$TUT T #Tutorial #Crypto #BNBChain
#BitcoinETFsBiggestDailyInflowSinceJanuary #USAugustJobGrowthNearlyTriplesForecast $DASH
Lesson 1: How to create a token.
Lesson 2: How people discover the token.
Lesson 3: How people start trading the token.
Lesson 4: How traders lose sleep watching the token. 😂
Welcome to the TUT tutorial.
$TUT T #Tutorial #Crypto #BNBChain
#BitcoinETFsBiggestDailyInflowSinceJanuary #USAugustJobGrowthNearlyTriplesForecast $DASH
Lesson 2: How people discover the token.
Lesson 3: How people start trading the token.
Lesson 4: How traders lose sleep watching the token. 😂
Welcome to the TUT tutorial.
$TUT T #Tutorial #Crypto #BNBChain
#BitcoinETFsBiggestDailyInflowSinceJanuary #USAugustJobGrowthNearlyTriplesForecast $DASH
1
91

·
--
Bullish
Verified
#aTutorial ($TUT ) is an AI-powered educational platform and utility token built on BNB Chain ($BNB ). Originating from a viral developer tutorial on token creation, it evolved from a memecoin narrative into an active Web3 learning ecosystem.
$TUT is used to incentivize creators, reward users for learning milestones, unlock premium features, and participate in protocol governance. The ecosystem expands via educational partnerships (e.g., DeFi learning initiatives) and custom learning domains like .learn.
Why TUT is on the Radar
AI Utility Roadmap: Transitioning beyond its early memecoin roots, Tutorial’s live AI-powered learning app continues to scale on BNB Chain. The upcoming Q3 Enhanced AI Tutor upgrade targets multi-format study tools (videos, audio, docs) to drive organic user retention.
Derivatives & Liquidity: Recent perp listings and leverage integrations have turned TUT into a high-beta favorite, driving intense short-term order book volatility.
Ecosystem Expansion: Planned Q4 updates—including creator profiles, multi-language support, and shared study libraries—position TUT at the cross-section of Web3 education and DeAI.
What's your take on Tutorial? Let us know in the comment. 👇
#Tutorial #DeAI #AIPowered
#Write2Earn
#aTutorial ($TUT ) is an AI-powered educational platform and utility token built on BNB Chain ($BNB ). Originating from a viral developer tutorial on token creation, it evolved from a memecoin narrative into an active Web3 learning ecosystem.
$TUT is used to incentivize creators, reward users for learning milestones, unlock premium features, and participate in protocol governance. The ecosystem expands via educational partnerships (e.g., DeFi learning initiatives) and custom learning domains like .learn.
Why TUT is on the Radar
AI Utility Roadmap: Transitioning beyond its early memecoin roots, Tutorial’s live AI-powered learning app continues to scale on BNB Chain. The upcoming Q3 Enhanced AI Tutor upgrade targets multi-format study tools (videos, audio, docs) to drive organic user retention.
Derivatives & Liquidity: Recent perp listings and leverage integrations have turned TUT into a high-beta favorite, driving intense short-term order book volatility.
Ecosystem Expansion: Planned Q4 updates—including creator profiles, multi-language support, and shared study libraries—position TUT at the cross-section of Web3 education and DeAI.
What's your take on Tutorial? Let us know in the comment. 👇
#Tutorial #DeAI #AIPowered
#Write2Earn
$TUT is used to incentivize creators, reward users for learning milestones, unlock premium features, and participate in protocol governance. The ecosystem expands via educational partnerships (e.g., DeFi learning initiatives) and custom learning domains like .learn.
Why TUT is on the Radar
AI Utility Roadmap: Transitioning beyond its early memecoin roots, Tutorial’s live AI-powered learning app continues to scale on BNB Chain. The upcoming Q3 Enhanced AI Tutor upgrade targets multi-format study tools (videos, audio, docs) to drive organic user retention.
Derivatives & Liquidity: Recent perp listings and leverage integrations have turned TUT into a high-beta favorite, driving intense short-term order book volatility.
Ecosystem Expansion: Planned Q4 updates—including creator profiles, multi-language support, and shared study libraries—position TUT at the cross-section of Web3 education and DeAI.
What's your take on Tutorial? Let us know in the comment. 👇
#Tutorial #DeAI #AIPowered
#Write2Earn
183
·
--
Article
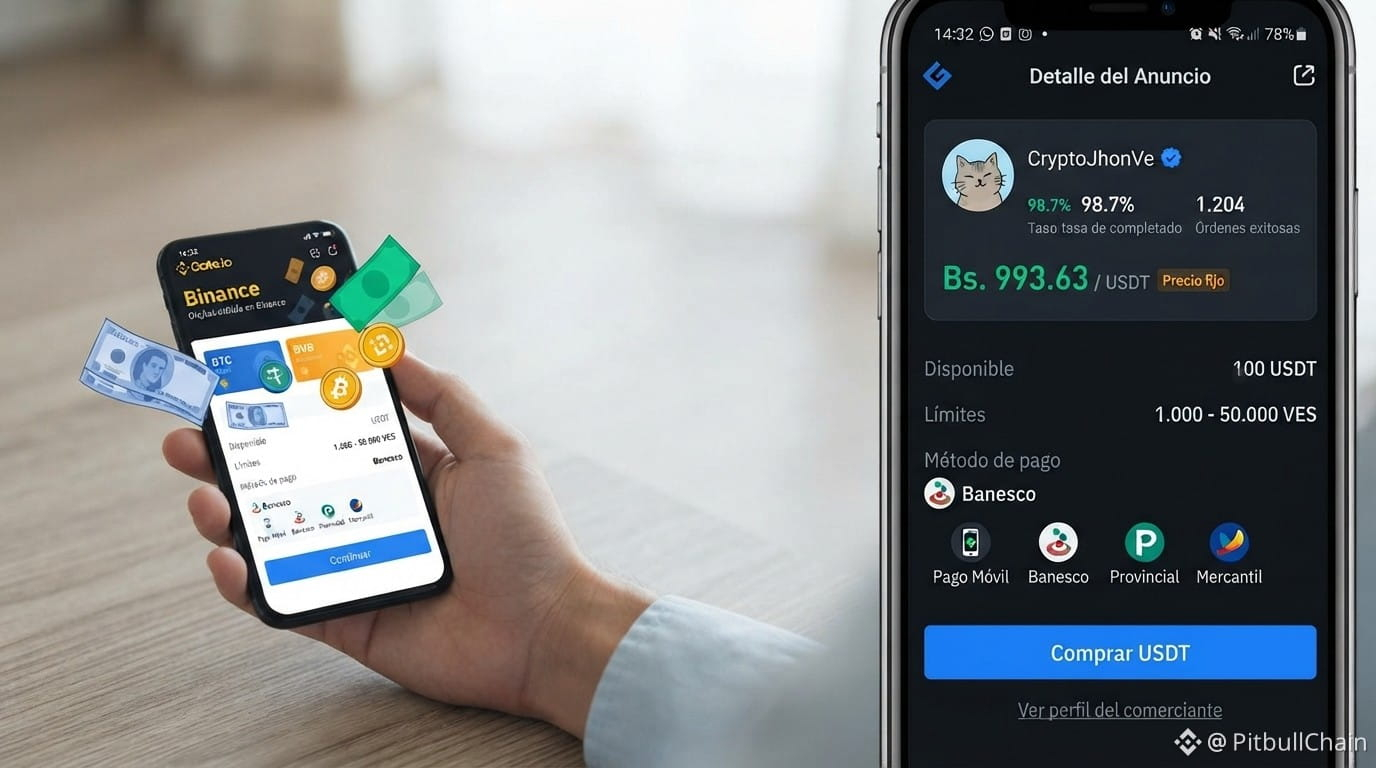
Learn to read the P2P spread today: 4.03% in 3 steps🚨 Beware! The P2P spread has jumped to 4.03% (38.50 Bs). That means buying and selling USDT have a huge difference. In my tutorial today, I’ll show you how to read this number and not fall into traps.
First: compare the lowest buy and the highest sell. Today, buying USDT is at 993.63 and selling is at 955.13. That gap is your opportunity cost.
Second: review the 295 active offers. How many have fair amounts and reliable banks? Don’t go with the first one you see.
Third: use Binance’s calculator to set your real price. If the spread is high, wait or negotiate with verified providers.
Learn to read the P2P spread today: 4.03% in 3 steps
🚨 Beware! The P2P spread has jumped to 4.03% (38.50 Bs). That means buying and selling USDT have a huge difference. In my tutorial today, I’ll show you how to read this number and not fall into traps.
First: compare the lowest buy and the highest sell. Today, buying USDT is at 993.63 and selling is at 955.13. That gap is your opportunity cost.
Second: review the 295 active offers. How many have fair amounts and reliable banks? Don’t go with the first one you see.
Third: use Binance’s calculator to set your real price. If the spread is high, wait or negotiate with verified providers.
First: compare the lowest buy and the highest sell. Today, buying USDT is at 993.63 and selling is at 955.13. That gap is your opportunity cost.
Second: review the 295 active offers. How many have fair amounts and reliable banks? Don’t go with the first one you see.
Third: use Binance’s calculator to set your real price. If the spread is high, wait or negotiate with verified providers.
45
·
--
Article
Tutorial Dips Slightly—Is This a Calm Before the Storm?In a market filled with explosive pumps and painful dumps, one token is quietly doing its own thing. $TUT , the native token of Tutorial, is down a modest 1.5% over the last 24 hours, currently trading at $0.0469 . While a 1.5% drop might not seem exciting, the story behind the price action is worth paying attention to. 👀
Let's break down what's happening with Tutorial and what it could mean for traders. 👇
What's Happening with TUT? 🤔
Tight Consolidation: After a massive rally from its lows, TUT has been trading in a relatively tight range between $0.0427 and $0.0491 . This consolidation often precedes a significant move in either direction.Buyer Dominance: Despite the slight price drop, the 24-hour trading activity shows 54% buyers vs. 46% sellers . This indicates that the dip is being bought, which is a bullish sign.Oversold Rebound: Before this consolidation, TUT had been on a brutal downtrend, dropping over 80% from its all-time high of $0.242 . The current price action could be a bottoming pattern.
The Fundamentals: What Is Tutorial? 🔍
Tutorial appears to be an educational or learn-to-earn platform in the crypto space. While specific details are limited, the project likely focuses on making crypto education accessible and rewarding for users. Educational platforms have gained traction as more people look to understand blockchain technology.
Key Strengths:
Growing Sector: The learn-to-earn model has shown promise, with projects like Rabbit Hole and Layer3 gaining popularity .Utility: A functional educational platform provides real utility, which could support long-term value .Community Potential: With a circulating supply of 831.6 million tokens, TUT has the potential to build a large community .
The Charts: What the Technicals Say 📊
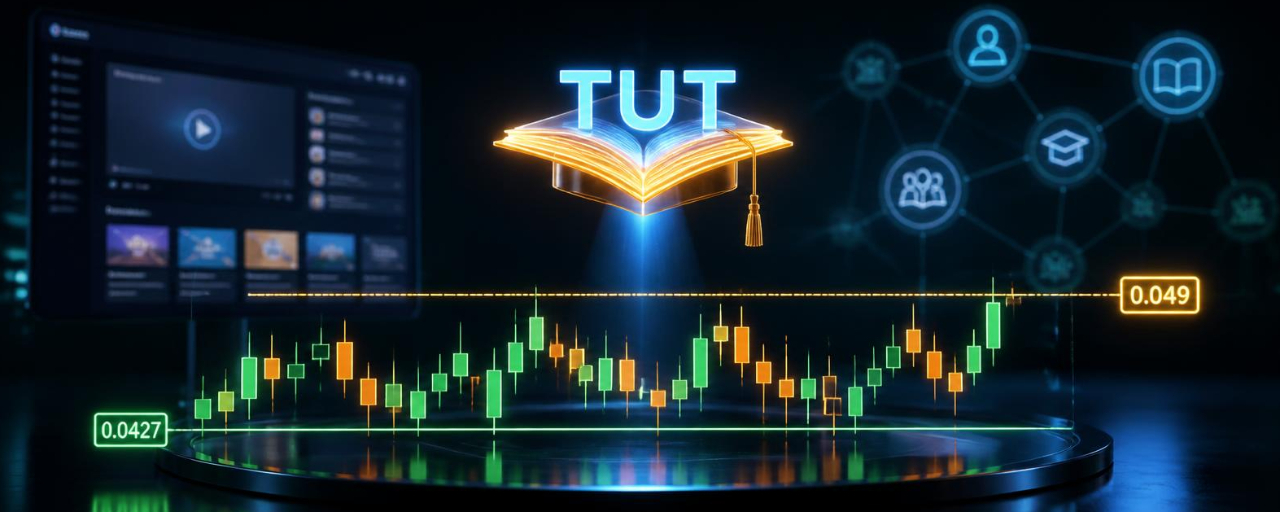
Support Zone: The $0.0427 low is the immediate support to watch. If this holds, we could see a bounce toward $0.055 .Resistance Level: The $0.049 zone is the next major hurdle. A break above this could open the door to $0.060 or even $0.080 .Volume: The recent consolidation has been on relatively low volume, which often precedes a breakout .
Potential Catalysts to Watch 🔥
Product Updates: Any new features or partnerships could provide positive price catalysts .Broader Market Recovery: If the overall crypto market resumes its uptrend, TUT could benefit .Community Growth: A growing user base could increase demand for the token .
Final Takeaway 💎
Tutorial is in a consolidation phase after a significant drop, and the slight pullback could be a buying opportunity. The key levels to watch are $0.0427 (support) and $0.049 (resistance). If TUT can break above resistance with strong volume, we could see a continuation toward $0.060. However, a breakdown below support could lead to a retest of lower levels.
Are you watching TUT, or do you prefer more established projects? Drop your $TUT strategy below! 👇
#Tutorial #Write2Earn #tutanalysis
Tutorial Dips Slightly—Is This a Calm Before the Storm?
In a market filled with explosive pumps and painful dumps, one token is quietly doing its own thing. $TUT , the native token of Tutorial, is down a modest 1.5% over the last 24 hours, currently trading at $0.0469 . While a 1.5% drop might not seem exciting, the story behind the price action is worth paying attention to. 👀
Let's break down what's happening with Tutorial and what it could mean for traders. 👇
What's Happening with TUT? 🤔
Tight Consolidation: After a massive rally from its lows, TUT has been trading in a relatively tight range between $0.0427 and $0.0491 . This consolidation often precedes a significant move in either direction.Buyer Dominance: Despite the slight price drop, the 24-hour trading activity shows 54% buyers vs. 46% sellers . This indicates that the dip is being bought, which is a bullish sign.Oversold Rebound: Before this consolidation, TUT had been on a brutal downtrend, dropping over 80% from its all-time high of $0.242 . The current price action could be a bottoming pattern.
The Fundamentals: What Is Tutorial? 🔍
Tutorial appears to be an educational or learn-to-earn platform in the crypto space. While specific details are limited, the project likely focuses on making crypto education accessible and rewarding for users. Educational platforms have gained traction as more people look to understand blockchain technology.
Key Strengths:
Growing Sector: The learn-to-earn model has shown promise, with projects like Rabbit Hole and Layer3 gaining popularity .Utility: A functional educational platform provides real utility, which could support long-term value .Community Potential: With a circulating supply of 831.6 million tokens, TUT has the potential to build a large community .
The Charts: What the Technicals Say 📊
Support Zone: The $0.0427 low is the immediate support to watch. If this holds, we could see a bounce toward $0.055 .Resistance Level: The $0.049 zone is the next major hurdle. A break above this could open the door to $0.060 or even $0.080 .Volume: The recent consolidation has been on relatively low volume, which often precedes a breakout .
Potential Catalysts to Watch 🔥
Product Updates: Any new features or partnerships could provide positive price catalysts .Broader Market Recovery: If the overall crypto market resumes its uptrend, TUT could benefit .Community Growth: A growing user base could increase demand for the token .
Final Takeaway 💎
Tutorial is in a consolidation phase after a significant drop, and the slight pullback could be a buying opportunity. The key levels to watch are $0.0427 (support) and $0.049 (resistance). If TUT can break above resistance with strong volume, we could see a continuation toward $0.060. However, a breakdown below support could lead to a retest of lower levels.
Are you watching TUT, or do you prefer more established projects? Drop your $TUT strategy below! 👇
#Tutorial #Write2Earn #tutanalysis
Let's break down what's happening with Tutorial and what it could mean for traders. 👇
What's Happening with TUT? 🤔
Tight Consolidation: After a massive rally from its lows, TUT has been trading in a relatively tight range between $0.0427 and $0.0491 . This consolidation often precedes a significant move in either direction.Buyer Dominance: Despite the slight price drop, the 24-hour trading activity shows 54% buyers vs. 46% sellers . This indicates that the dip is being bought, which is a bullish sign.Oversold Rebound: Before this consolidation, TUT had been on a brutal downtrend, dropping over 80% from its all-time high of $0.242 . The current price action could be a bottoming pattern.
The Fundamentals: What Is Tutorial? 🔍
Tutorial appears to be an educational or learn-to-earn platform in the crypto space. While specific details are limited, the project likely focuses on making crypto education accessible and rewarding for users. Educational platforms have gained traction as more people look to understand blockchain technology.
Key Strengths:
Growing Sector: The learn-to-earn model has shown promise, with projects like Rabbit Hole and Layer3 gaining popularity .Utility: A functional educational platform provides real utility, which could support long-term value .Community Potential: With a circulating supply of 831.6 million tokens, TUT has the potential to build a large community .
The Charts: What the Technicals Say 📊
Support Zone: The $0.0427 low is the immediate support to watch. If this holds, we could see a bounce toward $0.055 .Resistance Level: The $0.049 zone is the next major hurdle. A break above this could open the door to $0.060 or even $0.080 .Volume: The recent consolidation has been on relatively low volume, which often precedes a breakout .
Potential Catalysts to Watch 🔥
Product Updates: Any new features or partnerships could provide positive price catalysts .Broader Market Recovery: If the overall crypto market resumes its uptrend, TUT could benefit .Community Growth: A growing user base could increase demand for the token .
Final Takeaway 💎
Tutorial is in a consolidation phase after a significant drop, and the slight pullback could be a buying opportunity. The key levels to watch are $0.0427 (support) and $0.049 (resistance). If TUT can break above resistance with strong volume, we could see a continuation toward $0.060. However, a breakdown below support could lead to a retest of lower levels.
Are you watching TUT, or do you prefer more established projects? Drop your $TUT strategy below! 👇
#Tutorial #Write2Earn #tutanalysis
178

·
--
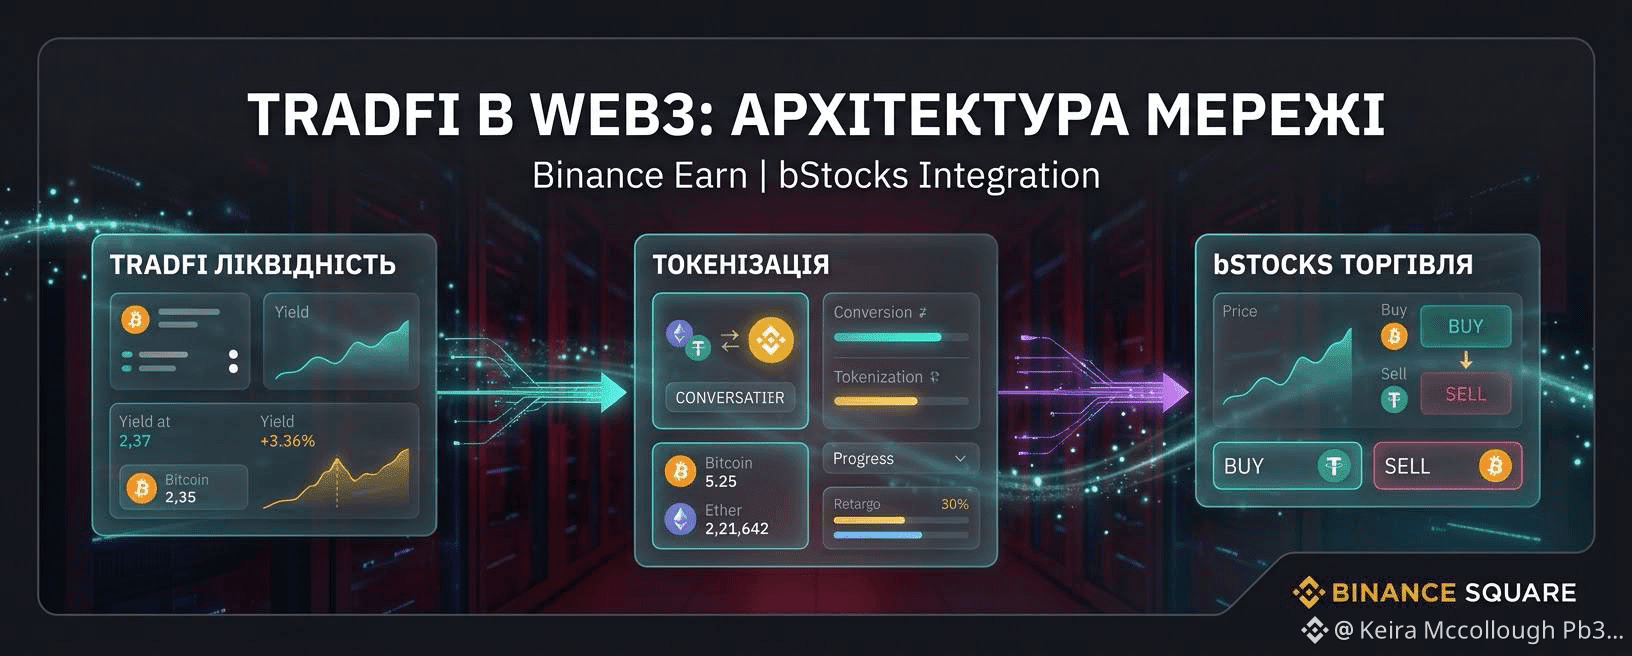
How to buy your first tokenized US stock on Binance (under 3 minutes)
1. Open Binance App, search "Bstocks"
2. Pick a stock — tokens carry a B suffix (TSLAB, AAPLB, NVDAB)
3. Enter any amount, fractional from $1
4. Confirm. Assets land in your spot wallet
Want the real stock instead? Hold Bstocks → tap "Convert" → 1:1 to real US stock after KYC, zero conversion fee.
Rules worth knowing:
• Trades 24/7, all year
• Prices anchor to real stocks during market hours, may drift after hours
• Dividends paid as reinvestment
Register with code BNAPP: https://www.binance.com/register?ref=BNAPP
Fee promotions change over time — check the app for what's currently active.
#Bstocks #Tutorial #Binance
How to buy your first tokenized US stock on Binance (under 3 minutes)
1. Open Binance App, search "Bstocks"
2. Pick a stock — tokens carry a B suffix (TSLAB, AAPLB, NVDAB)
3. Enter any amount, fractional from $1
4. Confirm. Assets land in your spot wallet
Want the real stock instead? Hold Bstocks → tap "Convert" → 1:1 to real US stock after KYC, zero conversion fee.
Rules worth knowing:
• Trades 24/7, all year
• Prices anchor to real stocks during market hours, may drift after hours
• Dividends paid as reinvestment
Register with code BNAPP: https://www.binance.com/register?ref=BNAPP
Fee promotions change over time — check the app for what's currently active.
#Bstocks #Tutorial #Binance
1. Open Binance App, search "Bstocks"
2. Pick a stock — tokens carry a B suffix (TSLAB, AAPLB, NVDAB)
3. Enter any amount, fractional from $1
4. Confirm. Assets land in your spot wallet
Want the real stock instead? Hold Bstocks → tap "Convert" → 1:1 to real US stock after KYC, zero conversion fee.
Rules worth knowing:
• Trades 24/7, all year
• Prices anchor to real stocks during market hours, may drift after hours
• Dividends paid as reinvestment
Register with code BNAPP: https://www.binance.com/register?ref=BNAPP
Fee promotions change over time — check the app for what's currently active.
#Bstocks #Tutorial #Binance
182
·
--
🚀 Why did TUT suddenly start going up?
The Token Tutorial (TUT) unexpectedly caught the market’s attention and began showing a noticeable upward move.
Tutorial is an AI-powered educational Web3 platform that helps users understand blockchain, cryptocurrencies, and the BNB Chain ecosystem.
📈 Why TUT may be growing: • increased interest in AI + Crypto; • the project sits at the intersection of education and Web3; • rising activity around BNB Chain can support demand; • after a long consolidation, the token can receive sharp momentum moves on higher volumes.
But it’s important: price growth by itself does not yet mean the start of a long-term trend. Before entering, you should look at volumes, resistance levels, and the activity of large holders.
👀 TUT is clearly worth adding to your watchlist.$TUT
{spot}(TUTUSDT)
#Tutorial #BNBChain #Binance
🚀 Why did TUT suddenly start going up?
The Token Tutorial (TUT) unexpectedly caught the market’s attention and began showing a noticeable upward move.
Tutorial is an AI-powered educational Web3 platform that helps users understand blockchain, cryptocurrencies, and the BNB Chain ecosystem.
📈 Why TUT may be growing: • increased interest in AI + Crypto; • the project sits at the intersection of education and Web3; • rising activity around BNB Chain can support demand; • after a long consolidation, the token can receive sharp momentum moves on higher volumes.
But it’s important: price growth by itself does not yet mean the start of a long-term trend. Before entering, you should look at volumes, resistance levels, and the activity of large holders.
👀 TUT is clearly worth adding to your watchlist.$TUT
#Tutorial #BNBChain #Binance
The Token Tutorial (TUT) unexpectedly caught the market’s attention and began showing a noticeable upward move.
Tutorial is an AI-powered educational Web3 platform that helps users understand blockchain, cryptocurrencies, and the BNB Chain ecosystem.
📈 Why TUT may be growing: • increased interest in AI + Crypto; • the project sits at the intersection of education and Web3; • rising activity around BNB Chain can support demand; • after a long consolidation, the token can receive sharp momentum moves on higher volumes.
But it’s important: price growth by itself does not yet mean the start of a long-term trend. Before entering, you should look at volumes, resistance levels, and the activity of large holders.
👀 TUT is clearly worth adding to your watchlist.$TUT
#Tutorial #BNBChain #Binance
1
217
·
--
How to buy your first tokenized US stock on Binance (under 3 minutes)
1. Open Binance App, search "Bstocks"
2. Pick a stock — tokens carry a B suffix (TSLAB, AAPLB, NVDAB)
3. Enter any amount, fractional from $1
4. Confirm. Assets land in your spot wallet
Want the real stock instead? Hold Bstocks → tap "Convert" → 1:1 to real US stock after KYC, zero conversion fee.
Rules worth knowing:
• Trades 24/7, all year
• Prices anchor to real stocks during market hours, may drift after hours
• Dividends paid as reinvestment
Fee discount up to 50% off right now: https://www.binance.com/zh-TC/support/announcement/detail/e187a603a2084c4cafe8acd651dca160
Register with code BNVIP: https://www.binance.com/register?ref=BNVIP
#Bstocks #Tutorial #Binance
How to buy your first tokenized US stock on Binance (under 3 minutes)
1. Open Binance App, search "Bstocks"
2. Pick a stock — tokens carry a B suffix (TSLAB, AAPLB, NVDAB)
3. Enter any amount, fractional from $1
4. Confirm. Assets land in your spot wallet
Want the real stock instead? Hold Bstocks → tap "Convert" → 1:1 to real US stock after KYC, zero conversion fee.
Rules worth knowing:
• Trades 24/7, all year
• Prices anchor to real stocks during market hours, may drift after hours
• Dividends paid as reinvestment
Fee discount up to 50% off right now: https://www.binance.com/zh-TC/support/announcement/detail/e187a603a2084c4cafe8acd651dca160
Register with code BNVIP: https://www.binance.com/register?ref=BNVIP
#Bstocks #Tutorial #Binance
1. Open Binance App, search "Bstocks"
2. Pick a stock — tokens carry a B suffix (TSLAB, AAPLB, NVDAB)
3. Enter any amount, fractional from $1
4. Confirm. Assets land in your spot wallet
Want the real stock instead? Hold Bstocks → tap "Convert" → 1:1 to real US stock after KYC, zero conversion fee.
Rules worth knowing:
• Trades 24/7, all year
• Prices anchor to real stocks during market hours, may drift after hours
• Dividends paid as reinvestment
Fee discount up to 50% off right now: https://www.binance.com/zh-TC/support/announcement/detail/e187a603a2084c4cafe8acd651dca160
Register with code BNVIP: https://www.binance.com/register?ref=BNVIP
#Bstocks #Tutorial #Binance
263

·
--
$TUT @tutorialtoken #Tutorial
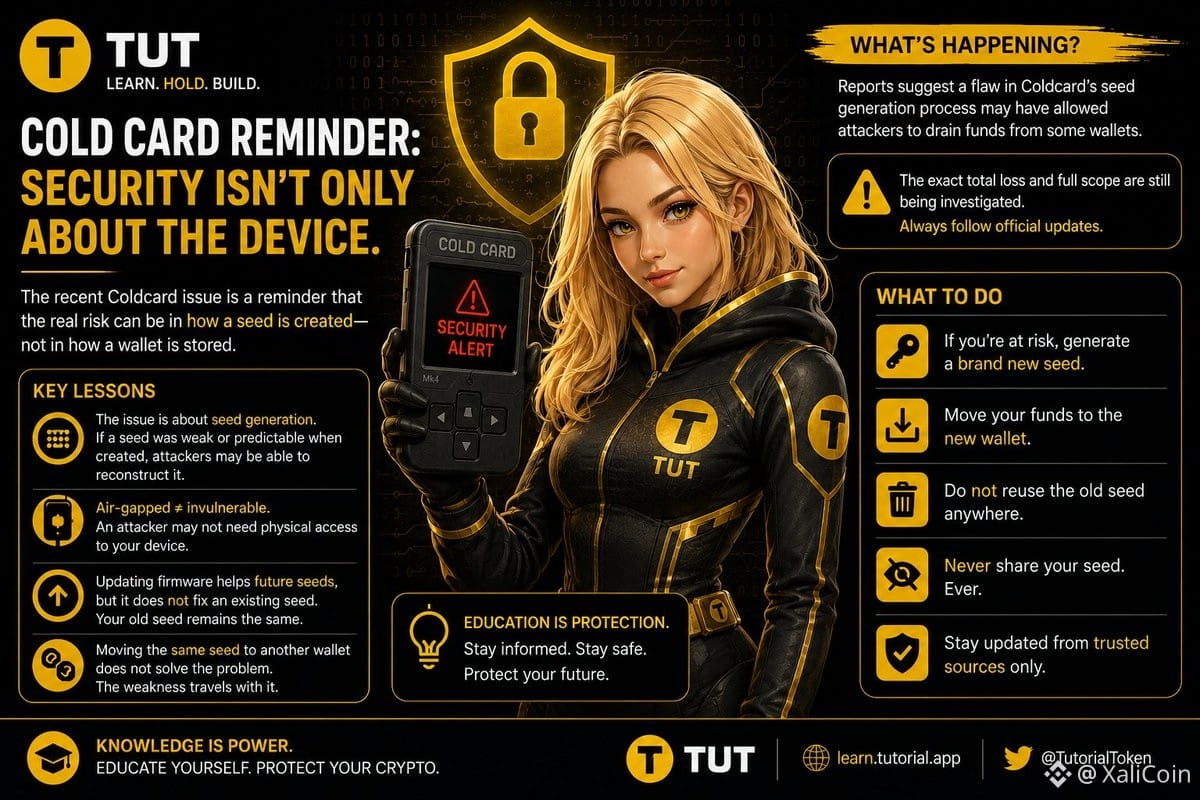
The idea originally emerged from a video/tutorial on how to launch a token on BNB Chain, created by developers in 2023 (still on testnet).
The “OG” token from the testnet was then brought to life again on mainnet and became the project now known as Tutorial ($TUT).
Major momentum took off in March 2025, when $TUT listed on major exchanges (including Binance) and went viral as an “educational meme coin.”
In some sources, the official start date is recorded around 7–8 February 2025 (the launch/mainnet date widely used as a benchmark for the project’s age).
Founder & CEO: Yerasyl Amanbek (@YerasylAmanbek).
His profile: a blockchain engineer, educator, and “Tech Martian” on BNB Chain; previously involved in blockchain infrastructure projects (e.g., Entangle L1) and blockchain education programs with Binance Academy.
{future}(TUTUSDT)
$TUT @tutorialtoken #Tutorial
The idea originally emerged from a video/tutorial on how to launch a token on BNB Chain, created by developers in 2023 (still on testnet).
The “OG” token from the testnet was then brought to life again on mainnet and became the project now known as Tutorial ($TUT ).
Major momentum took off in March 2025, when $TUT listed on major exchanges (including Binance) and went viral as an “educational meme coin.”
In some sources, the official start date is recorded around 7–8 February 2025 (the launch/mainnet date widely used as a benchmark for the project’s age).
Founder & CEO: Yerasyl Amanbek (@YerasylAmanbek).
His profile: a blockchain engineer, educator, and “Tech Martian” on BNB Chain; previously involved in blockchain infrastructure projects (e.g., Entangle L1) and blockchain education programs with Binance Academy.
The idea originally emerged from a video/tutorial on how to launch a token on BNB Chain, created by developers in 2023 (still on testnet).
The “OG” token from the testnet was then brought to life again on mainnet and became the project now known as Tutorial ($TUT ).
Major momentum took off in March 2025, when $TUT listed on major exchanges (including Binance) and went viral as an “educational meme coin.”
In some sources, the official start date is recorded around 7–8 February 2025 (the launch/mainnet date widely used as a benchmark for the project’s age).
Founder & CEO: Yerasyl Amanbek (@YerasylAmanbek).
His profile: a blockchain engineer, educator, and “Tech Martian” on BNB Chain; previously involved in blockchain infrastructure projects (e.g., Entangle L1) and blockchain education programs with Binance Academy.
1
304

Short on time to analyze candlesticks? 📊 How I chose a Master Trader on Binance and my results. Let's go!You can make money on Binance by posting content through Binance Square, the official social network of the platform that rewards content creators.
1. Choose your monetization program
Binance Square Write to Earn: Earn direct commissions. You get up to 5% cashback on trading fees when your readers trade after checking out your post.
Tips on Binance Square: Enable the option for your followers to send you crypto directly if they find your analysis useful.
Short on time to analyze candlesticks? 📊 How I chose a Master Trader on Binance and my results. Let's go!
You can make money on Binance by posting content through Binance Square, the official social network of the platform that rewards content creators.
1. Choose your monetization program
Binance Square Write to Earn: Earn direct commissions. You get up to 5% cashback on trading fees when your readers trade after checking out your post.
Tips on Binance Square: Enable the option for your followers to send you crypto directly if they find your analysis useful.
1. Choose your monetization program
Binance Square Write to Earn: Earn direct commissions. You get up to 5% cashback on trading fees when your readers trade after checking out your post.
Tips on Binance Square: Enable the option for your followers to send you crypto directly if they find your analysis useful.
116

·
--
This is information to help beginners. It’s a simple method to determine whether a crypto is a good investment in Spot using only one indicator.
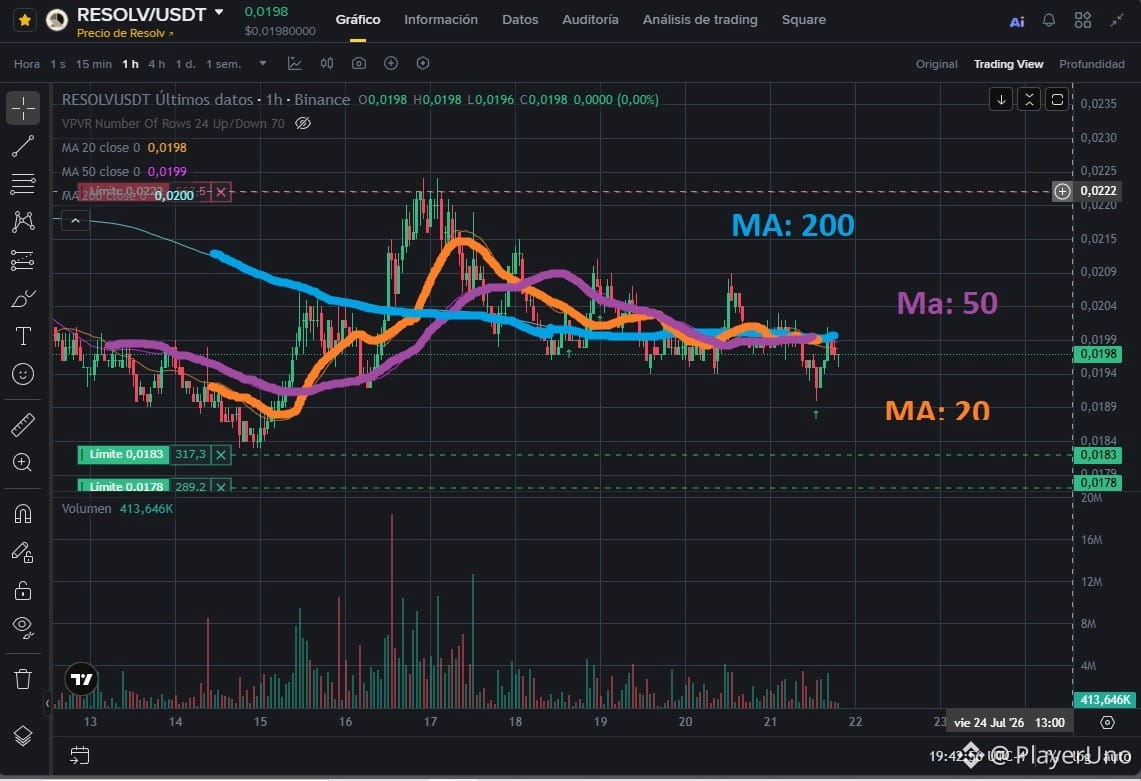
Open the Indicators settings and change the MA (Moving Average) values: one to 200, another to 50, and another to 20.
The flatter the 200 MA is, and the closer together the 50 and 20 MAs are, and the candles or bars are slightly above this cluster of MAs—then the crypto is in an accumulation phase. It’s then only a matter of time for it to break upward, unless there’s some unfavorable event.
Check the chart on the 1D, 4H, and 1H timeframes. In at least 2 of them, there should be a similar compression state to be safer.
By applying this method you reduce risk and increase your chances of making profits. Of course, you should consider other indicators too, but this alone can help you spot a good investment at a glance.
Good luck, Trader
Chart:$RESOLV 1H
#Tutorial #nuevosenbinance
This is information to help beginners. It’s a simple method to determine whether a crypto is a good investment in Spot using only one indicator.
Open the Indicators settings and change the MA (Moving Average) values: one to 200, another to 50, and another to 20.
The flatter the 200 MA is, and the closer together the 50 and 20 MAs are, and the candles or bars are slightly above this cluster of MAs—then the crypto is in an accumulation phase. It’s then only a matter of time for it to break upward, unless there’s some unfavorable event.
Check the chart on the 1D, 4H, and 1H timeframes. In at least 2 of them, there should be a similar compression state to be safer.
By applying this method you reduce risk and increase your chances of making profits. Of course, you should consider other indicators too, but this alone can help you spot a good investment at a glance.
Good luck, Trader
Chart:$RESOLV 1H
#Tutorial #nuevosenbinance
Open the Indicators settings and change the MA (Moving Average) values: one to 200, another to 50, and another to 20.
The flatter the 200 MA is, and the closer together the 50 and 20 MAs are, and the candles or bars are slightly above this cluster of MAs—then the crypto is in an accumulation phase. It’s then only a matter of time for it to break upward, unless there’s some unfavorable event.
Check the chart on the 1D, 4H, and 1H timeframes. In at least 2 of them, there should be a similar compression state to be safer.
By applying this method you reduce risk and increase your chances of making profits. Of course, you should consider other indicators too, but this alone can help you spot a good investment at a glance.
Good luck, Trader
Chart:$RESOLV 1H
#Tutorial #nuevosenbinance
232

·
--
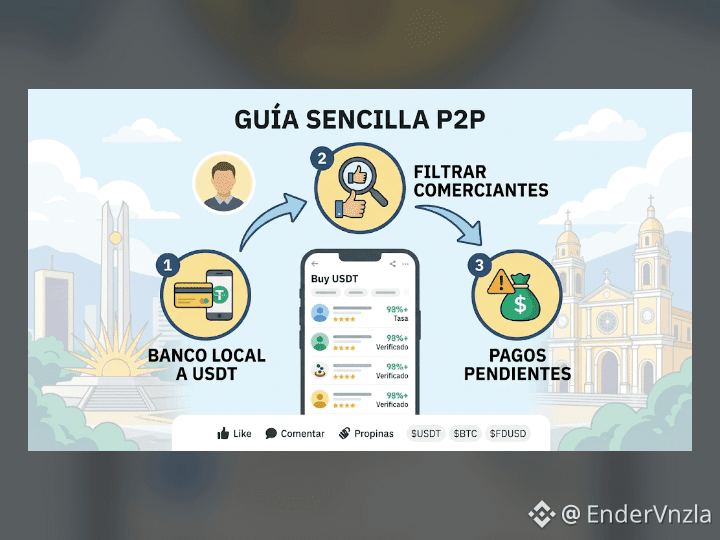
QUICK GUIDE: Master P2P in 3 simple steps 💡
Buying and selling crypto with your local bank doesn’t have to be complicated or risky. To keep your operations 100% secure, just focus on three key aspects:
1️⃣ Local Bank to USDT: Choose the payment option in your local currency and make the transfer directly from your personal bank account.
2️⃣ Filter Trusted Traders: Always look for sellers with a verification badge and a completion rate higher than 95%.
3️⃣ Handling Pending Payments: If the payment is delayed or something unexpected happens, don’t release the funds until you’ve verified the deposit in your account or you open an appeal in time.
📌 Learn how to protect your funds and trade with complete peace of mind.
$USDT #BTC $FDUSD $USDC #p2p #aprenden #tutorial
QUICK GUIDE: Master P2P in 3 simple steps 💡
Buying and selling crypto with your local bank doesn’t have to be complicated or risky. To keep your operations 100% secure, just focus on three key aspects:
1️⃣ Local Bank to USDT: Choose the payment option in your local currency and make the transfer directly from your personal bank account.
2️⃣ Filter Trusted Traders: Always look for sellers with a verification badge and a completion rate higher than 95%.
3️⃣ Handling Pending Payments: If the payment is delayed or something unexpected happens, don’t release the funds until you’ve verified the deposit in your account or you open an appeal in time.
📌 Learn how to protect your funds and trade with complete peace of mind.
$USDT #BTC $FDUSD $USDC #p2p #aprenden #tutorial
Buying and selling crypto with your local bank doesn’t have to be complicated or risky. To keep your operations 100% secure, just focus on three key aspects:
1️⃣ Local Bank to USDT: Choose the payment option in your local currency and make the transfer directly from your personal bank account.
2️⃣ Filter Trusted Traders: Always look for sellers with a verification badge and a completion rate higher than 95%.
3️⃣ Handling Pending Payments: If the payment is delayed or something unexpected happens, don’t release the funds until you’ve verified the deposit in your account or you open an appeal in time.
📌 Learn how to protect your funds and trade with complete peace of mind.
$USDT #BTC $FDUSD $USDC #p2p #aprenden #tutorial
1
265
·
--
All about vision & mission (core project) @tutorialtoken
The core vision is to make learning blockchain/crypto easy, viral, and genuinely useful—using the approach “meme + education + AI”.
The main mission can be summarized as:
Building an ecosystem that connects Tutorials (education), AI (smart agent/tutor), and the Community.
Providing practical learning content & tools (wallet setup, trading on DEX, smart contracts, etc.) specifically for the BNB Chain ecosystem.
Using token $TUT as incentives (rewards), feature access, and governance elements in the platform.
#Tutorial
#SaylorHintsStrategyBitcoinBuy
#BIP110SoftForkAttemptBegins
#SouthKoreaProposesLooseningCryptoShareholderRules
{spot}(TUTUSDT)
All about vision & mission (core project) @tutorialtoken
The core vision is to make learning blockchain/crypto easy, viral, and genuinely useful—using the approach “meme + education + AI”.
The main mission can be summarized as:
Building an ecosystem that connects Tutorials (education), AI (smart agent/tutor), and the Community.
Providing practical learning content & tools (wallet setup, trading on DEX, smart contracts, etc.) specifically for the BNB Chain ecosystem.
Using token $TUT as incentives (rewards), feature access, and governance elements in the platform.
#Tutorial
#SaylorHintsStrategyBitcoinBuy
#BIP110SoftForkAttemptBegins
#SouthKoreaProposesLooseningCryptoShareholderRules
The core vision is to make learning blockchain/crypto easy, viral, and genuinely useful—using the approach “meme + education + AI”.
The main mission can be summarized as:
Building an ecosystem that connects Tutorials (education), AI (smart agent/tutor), and the Community.
Providing practical learning content & tools (wallet setup, trading on DEX, smart contracts, etc.) specifically for the BNB Chain ecosystem.
Using token $TUT as incentives (rewards), feature access, and governance elements in the platform.
#Tutorial
#SaylorHintsStrategyBitcoinBuy
#BIP110SoftForkAttemptBegins
#SouthKoreaProposesLooseningCryptoShareholderRules

1
338

·
--
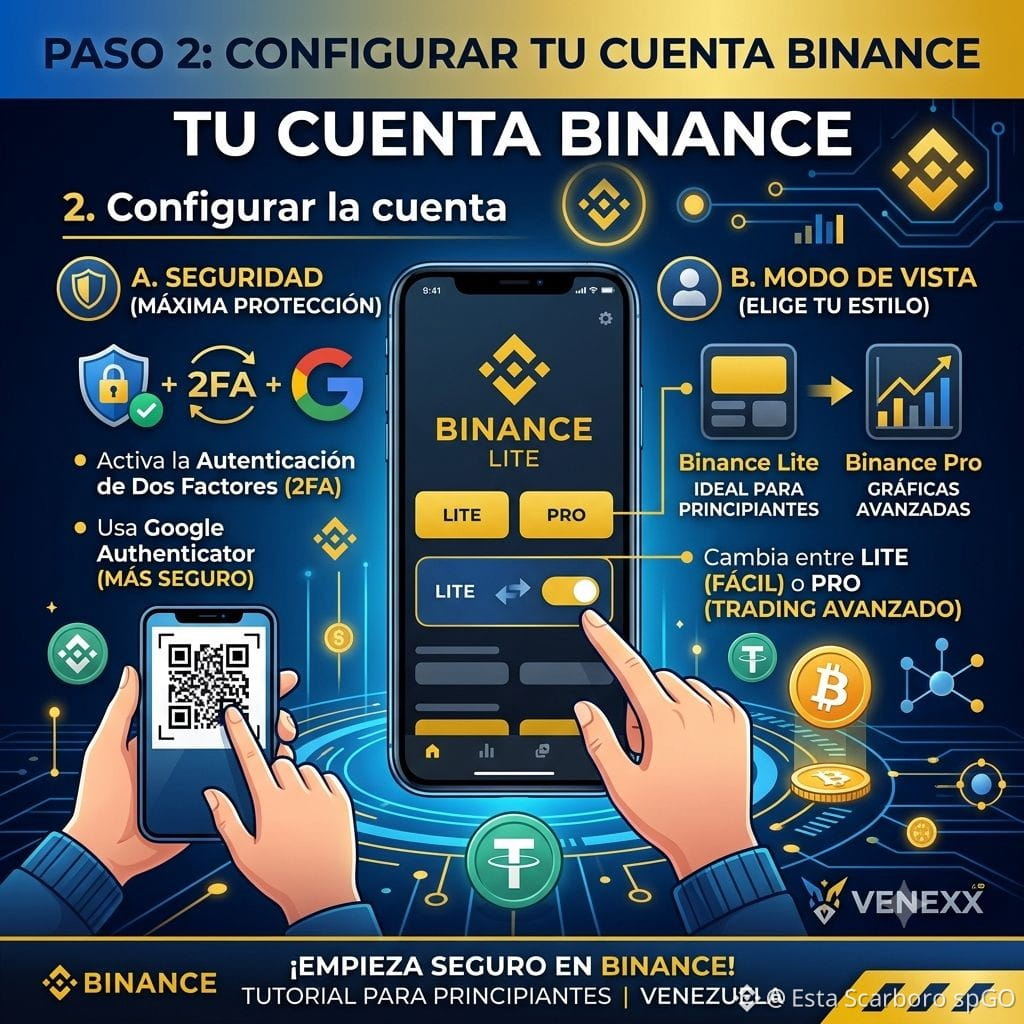
*Set up your account*
Within Binance, tweak these two key aspects in your profile:
Security: Activate two-factor authentication (2FA). I recommend using the Google Authenticator app instead of just SMS for enhanced security.
Mode: Binance has two views: "Binance Lite" (perfect for newbies, with big buttons and basic functions) and "Binance Pro" (for when you're ready to dive into advanced candlestick charts and trading). You can toggle between both in your profile settings.
#BinanceToOpenXLMSpotTrading
#Tutorial
*Set up your account*
Within Binance, tweak these two key aspects in your profile:
Security: Activate two-factor authentication (2FA). I recommend using the Google Authenticator app instead of just SMS for enhanced security.
Mode: Binance has two views: "Binance Lite" (perfect for newbies, with big buttons and basic functions) and "Binance Pro" (for when you're ready to dive into advanced candlestick charts and trading). You can toggle between both in your profile settings.
#BinanceToOpenXLMSpotTrading
#Tutorial
Within Binance, tweak these two key aspects in your profile:
Security: Activate two-factor authentication (2FA). I recommend using the Google Authenticator app instead of just SMS for enhanced security.
Mode: Binance has two views: "Binance Lite" (perfect for newbies, with big buttons and basic functions) and "Binance Pro" (for when you're ready to dive into advanced candlestick charts and trading). You can toggle between both in your profile settings.
#BinanceToOpenXLMSpotTrading
#Tutorial
183

·
--
Bearish
Yesterday Top Gainers, Today Top Losers! 📉 Toxic Trap or Healthy Correction? ⚠️
Notice how tokens pumping +30% to +50% one day suddenly land at the top of the Top Losers list the very next day?
If you bought at the peak due to FOMO, you are not alone! Here is why this happens and how to avoid getting trapped:
🔍 1. Liquidity Hunt (Pump & Dump)
Whales and market makers artificially pump low-cap tokens to generate excitement. Once retail buyers jump in (FOMO), early holders dump their bags into the buying volume.
📉 2. Overbought Rejections
When 4H and 1D RSI cross 80+, a sharp pullback is mathematically inevitable. Buying at these technical extremes carries maximum risk.
🛡️ How to Protect Your Capital:
Never buy Top Gainers at the peak: Wait for a 30% - 50% retracement to a key support zone before entering.
Always set a Stop-Loss: High-volatility gainers can drop 20%+ in a single 15-minute candle.
Focus on Retests: Wait for breakout confirmations instead of chasing green candles.
Are you holding any bags from yesterday's pump, or did you take profits in time? Let me know below! 👇💬
$TST $TUT $BMT #tutorial #test
{spot}(TUTUSDT)
{spot}(TSTUSDT)
{spot}(BMTUSDT)
#MarketInsight
Yesterday Top Gainers, Today Top Losers! 📉 Toxic Trap or Healthy Correction? ⚠️
Notice how tokens pumping +30% to +50% one day suddenly land at the top of the Top Losers list the very next day?
If you bought at the peak due to FOMO, you are not alone! Here is why this happens and how to avoid getting trapped:
🔍 1. Liquidity Hunt (Pump & Dump)
Whales and market makers artificially pump low-cap tokens to generate excitement. Once retail buyers jump in (FOMO), early holders dump their bags into the buying volume.
📉 2. Overbought Rejections
When 4H and 1D RSI cross 80+, a sharp pullback is mathematically inevitable. Buying at these technical extremes carries maximum risk.
🛡️ How to Protect Your Capital:
Never buy Top Gainers at the peak: Wait for a 30% - 50% retracement to a key support zone before entering.
Always set a Stop-Loss: High-volatility gainers can drop 20%+ in a single 15-minute candle.
Focus on Retests: Wait for breakout confirmations instead of chasing green candles.
Are you holding any bags from yesterday's pump, or did you take profits in time? Let me know below! 👇💬
$TST $TUT $BMT #tutorial #test
#MarketInsight
Notice how tokens pumping +30% to +50% one day suddenly land at the top of the Top Losers list the very next day?
If you bought at the peak due to FOMO, you are not alone! Here is why this happens and how to avoid getting trapped:
🔍 1. Liquidity Hunt (Pump & Dump)
Whales and market makers artificially pump low-cap tokens to generate excitement. Once retail buyers jump in (FOMO), early holders dump their bags into the buying volume.
📉 2. Overbought Rejections
When 4H and 1D RSI cross 80+, a sharp pullback is mathematically inevitable. Buying at these technical extremes carries maximum risk.
🛡️ How to Protect Your Capital:
Never buy Top Gainers at the peak: Wait for a 30% - 50% retracement to a key support zone before entering.
Always set a Stop-Loss: High-volatility gainers can drop 20%+ in a single 15-minute candle.
Focus on Retests: Wait for breakout confirmations instead of chasing green candles.
Are you holding any bags from yesterday's pump, or did you take profits in time? Let me know below! 👇💬
$TST $TUT $BMT #tutorial #test
#MarketInsight
237
·
--
Article
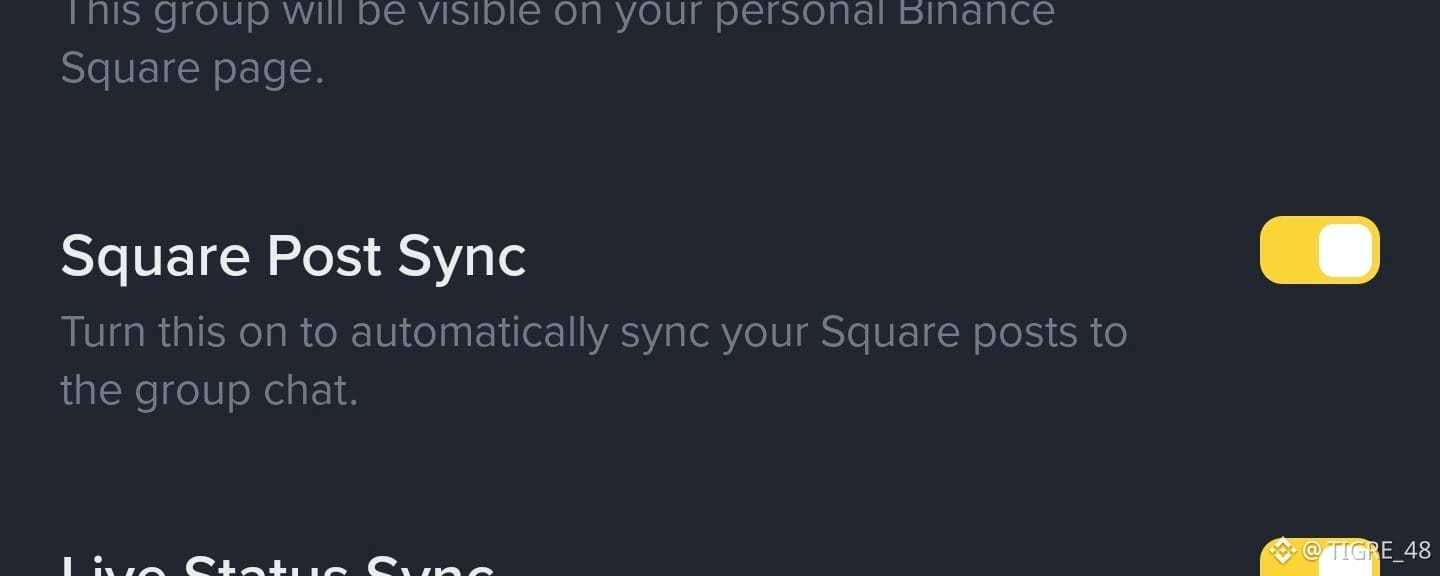
🤔 Did you activate it? 🔃 ( Square post synchronization
)🔸 What is the advantage of having this enabled?
🔸 In summary: all the posts you make will be shared in your group automatically, so your audience will have one more way not to miss your posts..
🔸 Attached is an image of this synchronization in operation:
🔸 If they want to join the group : [T48🤝🐯🧡](https://app.binance.com/uni-qr/a19k1bhu)
🔸 Do you have any questions? Leave me a question in the comments...
#Tutorial // #guia // #Tips .
🤔 Did you activate it? 🔃 ( Square post synchronization )
🔸 What is the advantage of having this enabled?
🔸 In summary: all the posts you make will be shared in your group automatically, so your audience will have one more way not to miss your posts..
🔸 Attached is an image of this synchronization in operation:
🔸 If they want to join the group : T48🤝🐯🧡
🔸 Do you have any questions? Leave me a question in the comments...
#Tutorial // #guia // #Tips .
🔸 In summary: all the posts you make will be shared in your group automatically, so your audience will have one more way not to miss your posts..
🔸 Attached is an image of this synchronization in operation:
🔸 If they want to join the group : T48🤝🐯🧡
🔸 Do you have any questions? Leave me a question in the comments...
#Tutorial // #guia // #Tips .
46
50
591

·
--
Bearish
$TUT ‼️The Chart Is Giving a Signal🚦
TUT’s recent move shows an important battle between buyers and sellers.
📉 If selling pressure keeps increasing, the price can continue searching for lower support.
📈 But if volume returns and buyers reclaim the broken level, this pullback could turn into a recovery setup.
$TUT
{future}(TUTUSDT)
The key isn’t the candle alone watch volume + support + momentum together. 👀
One strong volume spike could change the short-term picture quickly.
#TUT #Tutorial #Crypto #BNBChain
$TUT ‼️The Chart Is Giving a Signal🚦
TUT’s recent move shows an important battle between buyers and sellers.
📉 If selling pressure keeps increasing, the price can continue searching for lower support.
📈 But if volume returns and buyers reclaim the broken level, this pullback could turn into a recovery setup.
$TUT
The key isn’t the candle alone watch volume + support + momentum together. 👀
One strong volume spike could change the short-term picture quickly.
#TUT #Tutorial #Crypto #BNBChain
TUT’s recent move shows an important battle between buyers and sellers.
📉 If selling pressure keeps increasing, the price can continue searching for lower support.
📈 But if volume returns and buyers reclaim the broken level, this pullback could turn into a recovery setup.
$TUT
The key isn’t the candle alone watch volume + support + momentum together. 👀
One strong volume spike could change the short-term picture quickly.
#TUT #Tutorial #Crypto #BNBChain
1
389
·
--
Bearish
🚀 $TUT IS WAKING UP AGAIN 🤑
After the recent volatility, TUT is showing signs of renewed strength. 📈🔥
The interesting part?
🤖 Tutorial continues developing its AI-powered blockchain education ecosystem, while market activity around TUT remains strong.
$TUT
{future}(TUTUSDT)
Could this be the start of another bigger move? 👀
⚠️ Watch the volume + price action closely. Nothing is guaranteed in crypto.
#TUT #Tutorial #BinanceSquareFamily
🚀 $TUT IS WAKING UP AGAIN 🤑
After the recent volatility, TUT is showing signs of renewed strength. 📈🔥
The interesting part?
🤖 Tutorial continues developing its AI-powered blockchain education ecosystem, while market activity around TUT remains strong.
$TUT
Could this be the start of another bigger move? 👀
⚠️ Watch the volume + price action closely. Nothing is guaranteed in crypto.
#TUT #Tutorial #BinanceSquareFamily
After the recent volatility, TUT is showing signs of renewed strength. 📈🔥
The interesting part?
🤖 Tutorial continues developing its AI-powered blockchain education ecosystem, while market activity around TUT remains strong.
$TUT
Could this be the start of another bigger move? 👀
⚠️ Watch the volume + price action closely. Nothing is guaranteed in crypto.
#TUT #Tutorial #BinanceSquareFamily
1
716
🚀 TUTORIAL ($TUT ): RECOVERY OR A NEW CORRECTION?
📅 25/09/2026
The TUT, a token from the Tutorial ecosystem on the BNB Chain, shows strong volatility, with speculative activity and interest in its AI-based educational platform.
💰 MARKET
• Price: approximately US$ 0.0256
• Weekly change: +23.7%
• Market cap: US$ 21.5 million
• Volume in 24h: about US$ 13 million
📊 TECHNICAL ANALYSIS
The token faces selling pressure after recent fluctuations. The US$ 0.0211 region appears as support, while US$ 0.0288 is a key resistance.
🟢 Supports: US$ 0.0211 and US$ 0.0155.
🔴 Resistances: US$ 0.0288, US$ 0.0355, and US$ 0.0433.
🔥 CATALYSTS
• Expansion of the Tutorial Agent, an AI educational tool.
• New learning features planned for 2026.
• Token utility in rewards, features, and governance.
⚠️ RISKS
High concentration of tokens, high volatility, and variable liquidity can trigger sharp moves. The top 100 holders concentrate approximately 98.99% of the supply, according to CMC AI analysis.
📌 SUMMARY
TUT combines the AI narrative with blockchain education and the BNB Chain ecosystem. Maintaining support levels and the platform’s evolution will be key points to watch for the next moves.
⚠️ Informational content. Not financial advice. Do your own research (DYOR).
#tut #tutorial #altcoins #etf
🚀 TUTORIAL ($TUT ): RECOVERY OR A NEW CORRECTION?
📅 25/09/2026
The TUT, a token from the Tutorial ecosystem on the BNB Chain, shows strong volatility, with speculative activity and interest in its AI-based educational platform.
💰 MARKET
• Price: approximately US$ 0.0256
• Weekly change: +23.7%
• Market cap: US$ 21.5 million
• Volume in 24h: about US$ 13 million
📊 TECHNICAL ANALYSIS
The token faces selling pressure after recent fluctuations. The US$ 0.0211 region appears as support, while US$ 0.0288 is a key resistance.
🟢 Supports: US$ 0.0211 and US$ 0.0155.
🔴 Resistances: US$ 0.0288, US$ 0.0355, and US$ 0.0433.
🔥 CATALYSTS
• Expansion of the Tutorial Agent, an AI educational tool.
• New learning features planned for 2026.
• Token utility in rewards, features, and governance.
⚠️ RISKS
High concentration of tokens, high volatility, and variable liquidity can trigger sharp moves. The top 100 holders concentrate approximately 98.99% of the supply, according to CMC AI analysis.
📌 SUMMARY
TUT combines the AI narrative with blockchain education and the BNB Chain ecosystem. Maintaining support levels and the platform’s evolution will be key points to watch for the next moves.
⚠️ Informational content. Not financial advice. Do your own research (DYOR).
#tut #tutorial #altcoins #etf
📅 25/09/2026
The TUT, a token from the Tutorial ecosystem on the BNB Chain, shows strong volatility, with speculative activity and interest in its AI-based educational platform.
💰 MARKET
• Price: approximately US$ 0.0256
• Weekly change: +23.7%
• Market cap: US$ 21.5 million
• Volume in 24h: about US$ 13 million
📊 TECHNICAL ANALYSIS
The token faces selling pressure after recent fluctuations. The US$ 0.0211 region appears as support, while US$ 0.0288 is a key resistance.
🟢 Supports: US$ 0.0211 and US$ 0.0155.
🔴 Resistances: US$ 0.0288, US$ 0.0355, and US$ 0.0433.
🔥 CATALYSTS
• Expansion of the Tutorial Agent, an AI educational tool.
• New learning features planned for 2026.
• Token utility in rewards, features, and governance.
⚠️ RISKS
High concentration of tokens, high volatility, and variable liquidity can trigger sharp moves. The top 100 holders concentrate approximately 98.99% of the supply, according to CMC AI analysis.
📌 SUMMARY
TUT combines the AI narrative with blockchain education and the BNB Chain ecosystem. Maintaining support levels and the platform’s evolution will be key points to watch for the next moves.
⚠️ Informational content. Not financial advice. Do your own research (DYOR).
#tut #tutorial #altcoins #etf
1
460
Log in to explore more content
Join global crypto users on Binance Square
⚡️ Get latest and useful information about crypto.
💬 Trusted by the world’s largest crypto exchange.
👍 Discover real insights from verified creators.
Email / Phone number
Trending Topics
1
#CircleMints500MUSDCOnSolana
51,561 views
1,293 Discussing
2
#PolymarketBankFailureBetsDrawFDICConcern
65,139 views
1,346 Discussing
3
#BlackRockBuildsTokenizedPortfoliosForOndo
51,482 views
939 Discussing
4
#BitwiseFilesToListNEARETFOnNYSEArca
50,163 views
823 Discussing
5
#SECCommissionerPeirceToLeaveOct2
45,532 views
663 Discussing
6
#SECSaysBuybacksUpgradesDontMakeTokenSecurity
40,286 views
516 Discussing
7
#StrategyProposesDailyDividendsForPreferreds
7,557 views
184 Discussing
8
#CircleTetherFreezeBitgetHackerWallet
6,373 views
102 Discussing
9
#CoinMarketCapCompletesCoinglassAcquisition
9,570 views
139 Discussing
10
#QNTRises39%
102,228 views
1,584 Discussing