
#trade
trade
4.3M views
16,856 Discussing
Hot
Latest

·
--
$G is up 15% and showing rejection at the highs. Here's why 👇
A 40% surge in 2 days put it up 15% on the day, so I took a closer look at the structure.
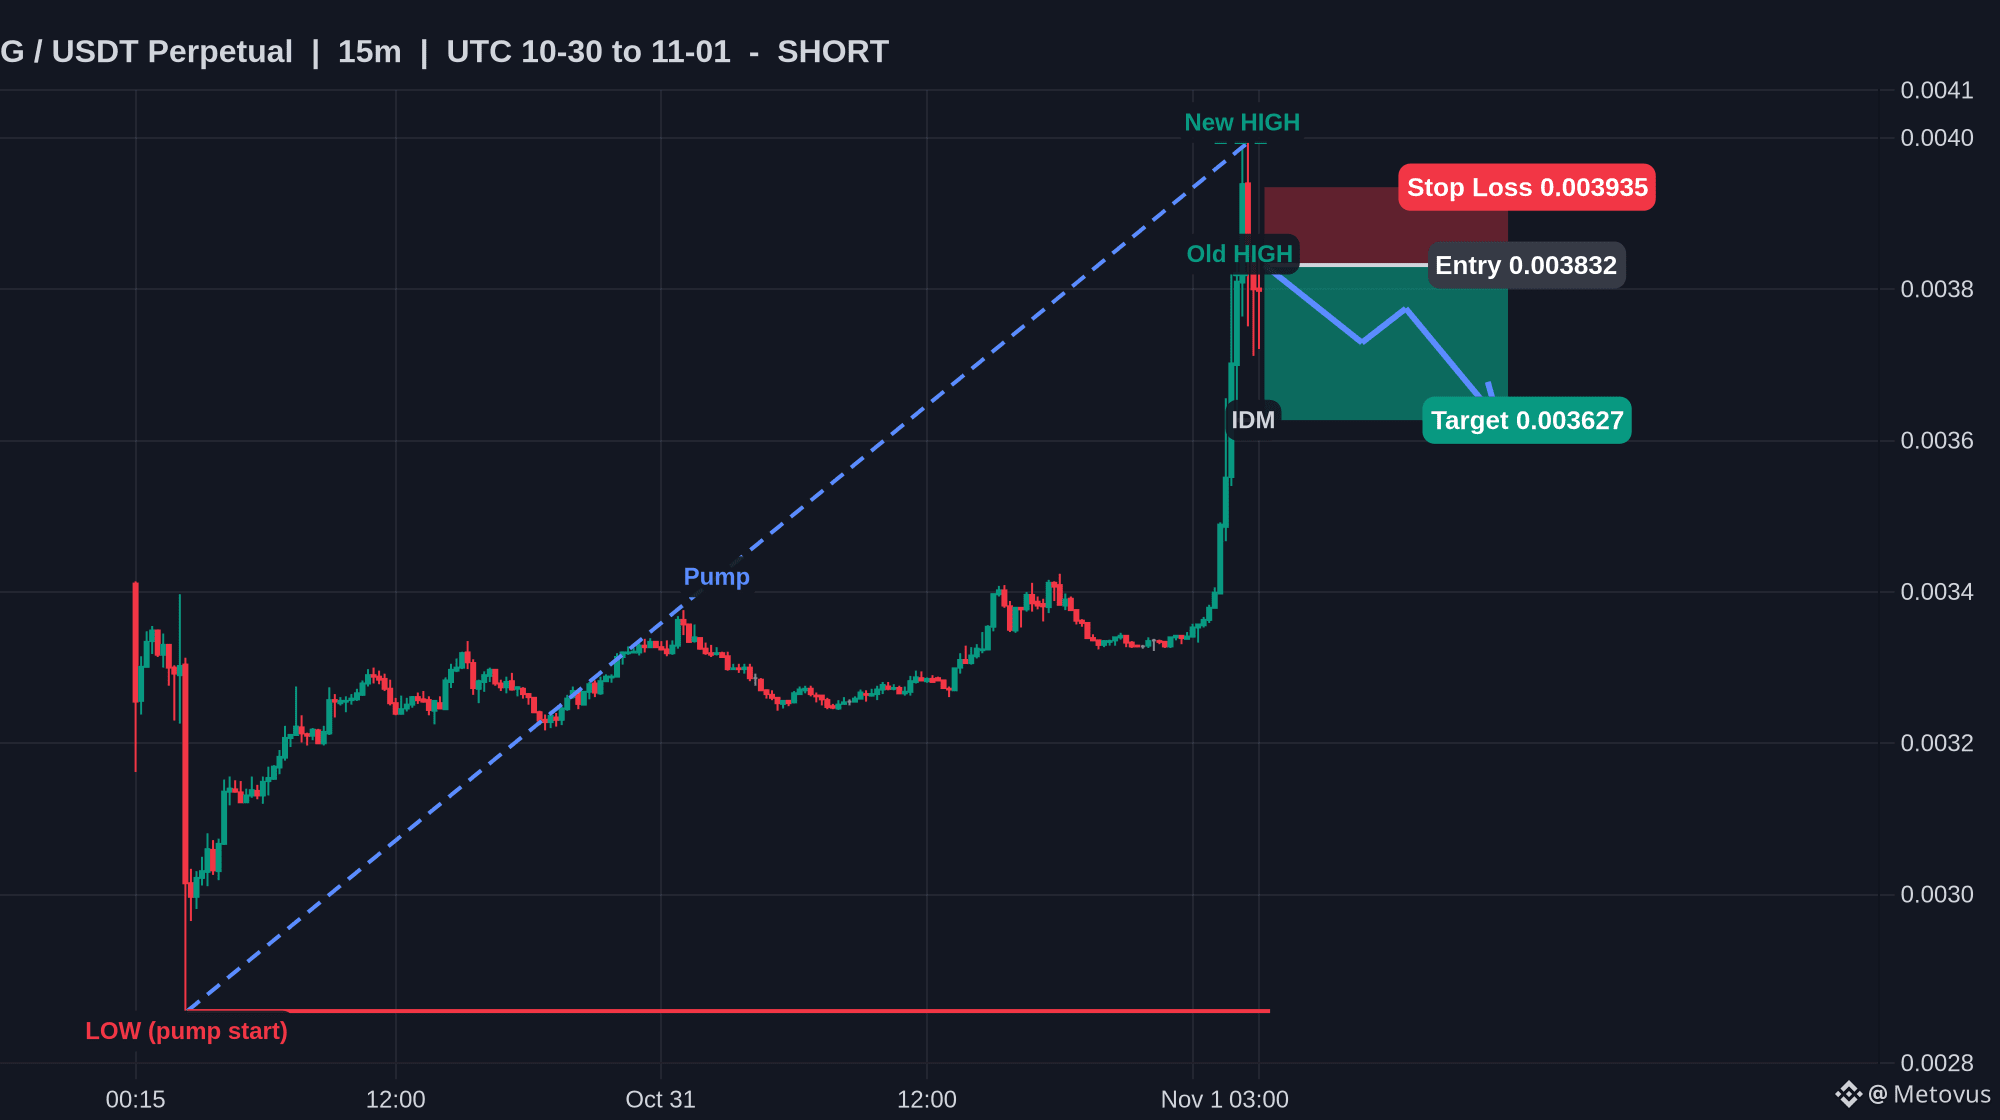
It pushed above 0.00382 for a moment, got sold hard from 0.003994 and G is now right at that old high again. Looks like a breakout that didn't hold, and anyone who bought up there is probably getting nervous.
Next stop for me is 0.003627. Nobody's $G touched it since the pullback (20% of the leg), so it's the obvious magnet. A move above 0.003994 proves me wrong.
📌 My G trade: short from 0.003832, stop at 0.003935, target 0.003627 (+5.3%, 1:2)
📊 24h Vol: $20.0M | 24h Chg: +15.2% | Funding: -0.1676%
Am I wrong? Tell me why below 👇
Follow for daily chart breakdowns 🔔
My opinion only. Not financial advice, do your own research.
#G #Crypto #Trade
$G is up 15% and showing rejection at the highs. Here's why 👇
A 40% surge in 2 days put it up 15% on the day, so I took a closer look at the structure.
It pushed above 0.00382 for a moment, got sold hard from 0.003994 and G is now right at that old high again. Looks like a breakout that didn't hold, and anyone who bought up there is probably getting nervous.
Next stop for me is 0.003627. Nobody's $G touched it since the pullback (20% of the leg), so it's the obvious magnet. A move above 0.003994 proves me wrong.
📌 My G trade: short from 0.003832, stop at 0.003935, target 0.003627 (+5.3%, 1:2)
📊 24h Vol: $20.0M | 24h Chg: +15.2% | Funding: -0.1676%
Am I wrong? Tell me why below 👇
Follow for daily chart breakdowns 🔔
My opinion only. Not financial advice, do your own research.
#G #Crypto #Trade
A 40% surge in 2 days put it up 15% on the day, so I took a closer look at the structure.
It pushed above 0.00382 for a moment, got sold hard from 0.003994 and G is now right at that old high again. Looks like a breakout that didn't hold, and anyone who bought up there is probably getting nervous.
Next stop for me is 0.003627. Nobody's $G touched it since the pullback (20% of the leg), so it's the obvious magnet. A move above 0.003994 proves me wrong.
📌 My G trade: short from 0.003832, stop at 0.003935, target 0.003627 (+5.3%, 1:2)
📊 24h Vol: $20.0M | 24h Chg: +15.2% | Funding: -0.1676%
Am I wrong? Tell me why below 👇
Follow for daily chart breakdowns 🔔
My opinion only. Not financial advice, do your own research.
#G #Crypto #Trade
32

·
--
Bearish
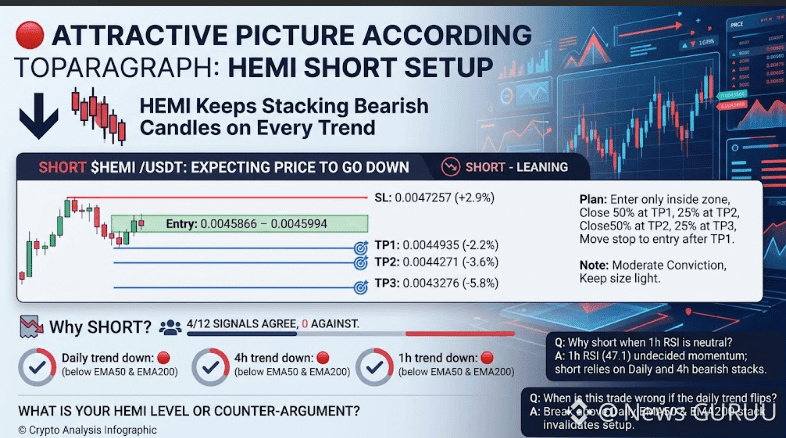
🔴 $HEMI/USDT — SHORT BIAS 📉
Bearish trends across Daily, 4H & 1H.
🎯 Entry: 0.0045866–0.0045994
✅ TP1: 0.0044935 (-2.2%)
✅ TP2: 0.0044271 (-3.6%)
✅ TP3: 0.0043276 (-5.8%)
🛑 SL: 0.0047257 (+2.9%)
📉 Why SHORT? Price below EMA50 & EMA200 on all 3 timeframes.
⚠️ Moderate conviction — keep position size small. RSI is neutral (47.1), so confirmation is limited.
💬 What’s your $HEMI target or counter-analysis?."CLICK ON THE BELOW YELLOW COIN TAG TO GO TO DESIRED TRADING PAGE TO GET BENEFIT TRADE"$HEMI
#HEMİ #trade
{spot}(HEMIUSDT)
🔴 $HEMI /USDT — SHORT BIAS 📉
Bearish trends across Daily, 4H & 1H.
🎯 Entry: 0.0045866–0.0045994
✅ TP1: 0.0044935 (-2.2%)
✅ TP2: 0.0044271 (-3.6%)
✅ TP3: 0.0043276 (-5.8%)
🛑 SL: 0.0047257 (+2.9%)
📉 Why SHORT? Price below EMA50 & EMA200 on all 3 timeframes.
⚠️ Moderate conviction — keep position size small. RSI is neutral (47.1), so confirmation is limited.
💬 What’s your $HEMI target or counter-analysis?."CLICK ON THE BELOW YELLOW COIN TAG TO GO TO DESIRED TRADING PAGE TO GET BENEFIT TRADE"$HEMI
#HEMİ #trade
Bearish trends across Daily, 4H & 1H.
🎯 Entry: 0.0045866–0.0045994
✅ TP1: 0.0044935 (-2.2%)
✅ TP2: 0.0044271 (-3.6%)
✅ TP3: 0.0043276 (-5.8%)
🛑 SL: 0.0047257 (+2.9%)
📉 Why SHORT? Price below EMA50 & EMA200 on all 3 timeframes.
⚠️ Moderate conviction — keep position size small. RSI is neutral (47.1), so confirmation is limited.
💬 What’s your $HEMI target or counter-analysis?."CLICK ON THE BELOW YELLOW COIN TAG TO GO TO DESIRED TRADING PAGE TO GET BENEFIT TRADE"$HEMI
#HEMİ #trade
1
1
71


·
--
Bullish
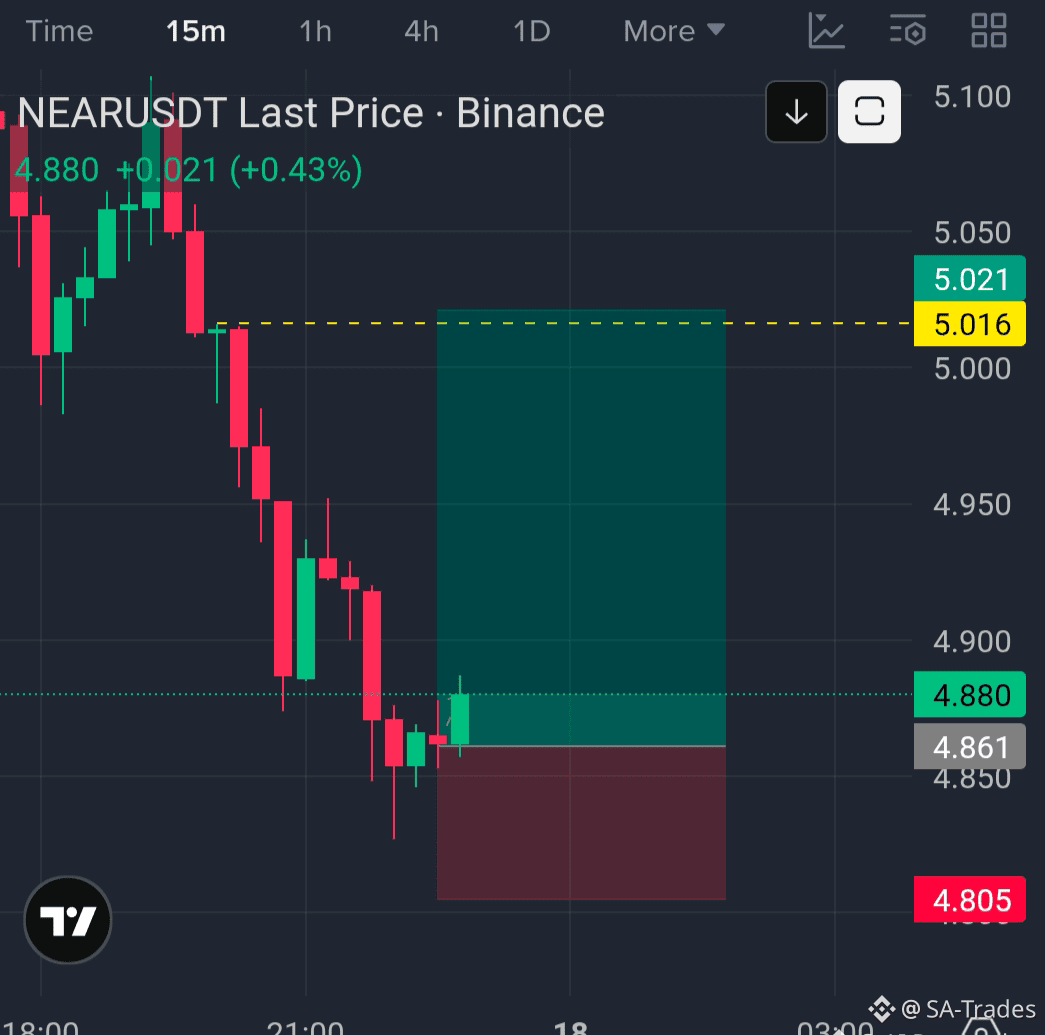
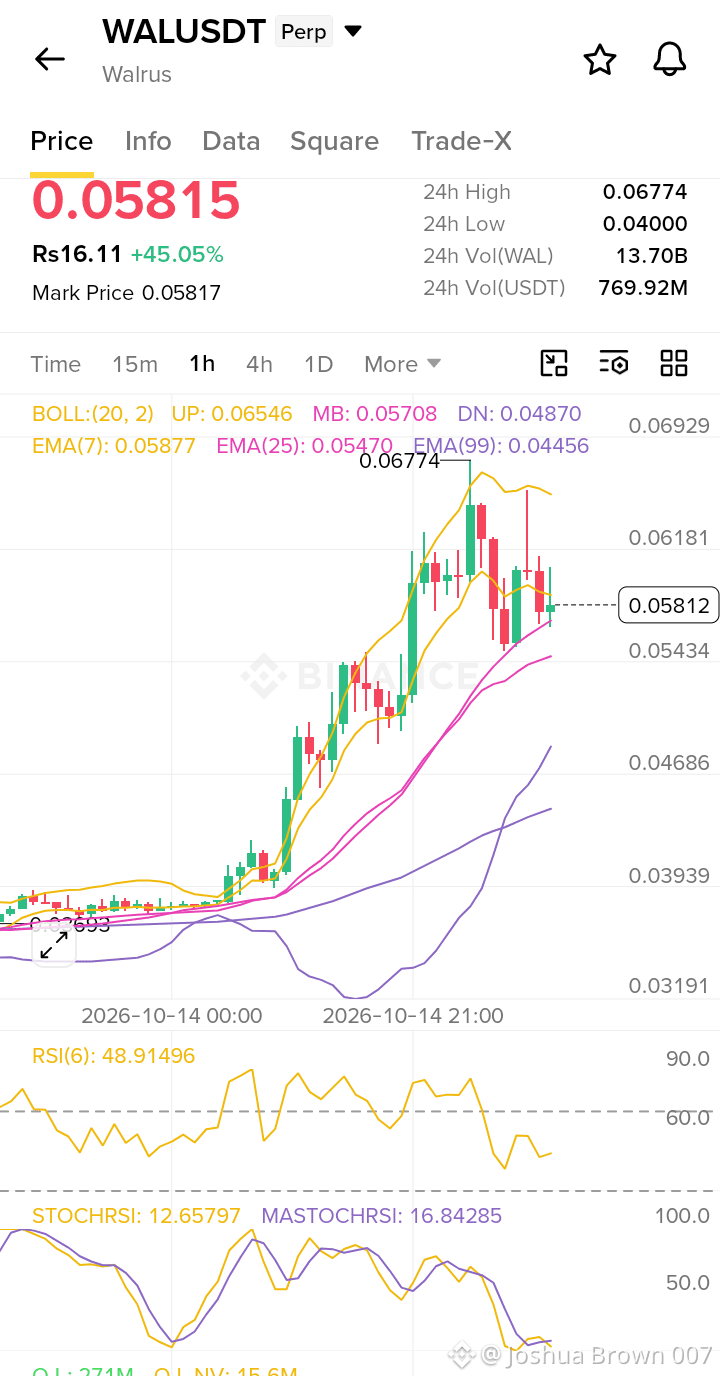
#trade $WAL LONG Trade Set up
{future}(WALUSDT)
Swing Long Avoid High leverage and Maximum 2 % of your portfolio.
Entry 0.05750
SL 0.05380
TP 0.06450
TP 0.06710
Invalidation Conditions:
A sustained 1H candle close directly below 0.05400 invalidates the bull flag structure and shifts the operational bias to neutral bearish.
$ZEREBRO
{future}(ZEREBROUSDT)
$BSP
{future}(BSPUSDT)
#trade $WAL LONG Trade Set up
Swing Long Avoid High leverage and Maximum 2 % of your portfolio.
Entry 0.05750
SL 0.05380
TP 0.06450
TP 0.06710
Invalidation Conditions:
A sustained 1H candle close directly below 0.05400 invalidates the bull flag structure and shifts the operational bias to neutral bearish.
$ZEREBRO
$BSP
Swing Long Avoid High leverage and Maximum 2 % of your portfolio.
Entry 0.05750
SL 0.05380
TP 0.06450
TP 0.06710
Invalidation Conditions:
A sustained 1H candle close directly below 0.05400 invalidates the bull flag structure and shifts the operational bias to neutral bearish.
$ZEREBRO
$BSP
1
2
466
#trade $APR Trade Analysis
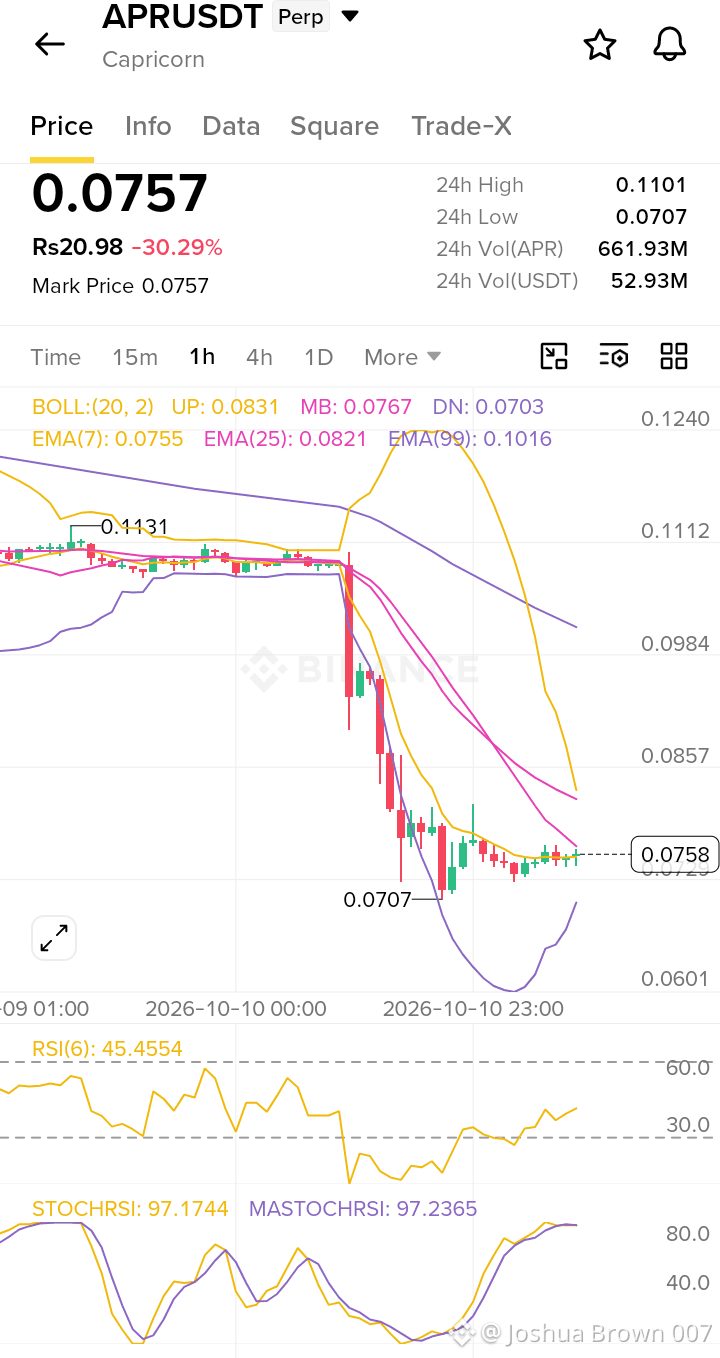
Wait for a pullback to 0.0730–0.0740 to enter a scalp long with a tight stop at 0.0700, targeting 0.0767–0.0821. Do not chase the current price at 0.0757, as the StochRSI is overbought and a pullback is likely. If price breaks below 0.0707, exit immediately and consider a short toward 0.0650.
{future}(APRUSDT)
#trade $APR Trade Analysis
Wait for a pullback to 0.0730–0.0740 to enter a scalp long with a tight stop at 0.0700, targeting 0.0767–0.0821. Do not chase the current price at 0.0757, as the StochRSI is overbought and a pullback is likely. If price breaks below 0.0707, exit immediately and consider a short toward 0.0650.
Wait for a pullback to 0.0730–0.0740 to enter a scalp long with a tight stop at 0.0700, targeting 0.0767–0.0821. Do not chase the current price at 0.0757, as the StochRSI is overbought and a pullback is likely. If price breaks below 0.0707, exit immediately and consider a short toward 0.0650.
541

TRADE IS SAVING THE MARKET? 🚀
Global trade growth slowed to 1.9% 📉 from 4.6% last year (WTO Report)
Everyone is worried 😱
Why market is slow?
12% ships stuck at ports 🚢
Panama & Suez canal issues ⚠️
US tariffs + Middle East war 🔥
But what's strong? 💪
AI chips & electronics trade is BOOMING 🚀
This is saving the market!
Market Today:
Stocks green ✅ Gold $4159 👑 Oil up 🛢️
Trade is slow but not stopped! Are you bullish or bearish? 👇
#trade #GlobalTrade #BİNANCESQUARE
TRADE IS SAVING THE MARKET? 🚀
Global trade growth slowed to 1.9% 📉 from 4.6% last year (WTO Report)
Everyone is worried 😱
Why market is slow?
12% ships stuck at ports 🚢
Panama & Suez canal issues ⚠️
US tariffs + Middle East war 🔥
But what's strong? 💪
AI chips & electronics trade is BOOMING 🚀
This is saving the market!
Market Today:
Stocks green ✅ Gold $4159 👑 Oil up 🛢️
Trade is slow but not stopped! Are you bullish or bearish? 👇
#trade #GlobalTrade #BİNANCESQUARE
Global trade growth slowed to 1.9% 📉 from 4.6% last year (WTO Report)
Everyone is worried 😱
Why market is slow?
12% ships stuck at ports 🚢
Panama & Suez canal issues ⚠️
US tariffs + Middle East war 🔥
But what's strong? 💪
AI chips & electronics trade is BOOMING 🚀
This is saving the market!
Market Today:
Stocks green ✅ Gold $4159 👑 Oil up 🛢️
Trade is slow but not stopped! Are you bullish or bearish? 👇
#trade #GlobalTrade #BİNANCESQUARE
1
1
102

·
--
$SCR
Entry Zone: $0.0275 – $0.0285 (Retest of 15M MA99 & previous resistance breakout)
Targets:
TP1: $0.0320 (15M MA7 retest)
TP2: $0.0345 (Mid-range consolidation level)
TP3: $0.0375 (24h High retest zone)
Stop Loss (SL): $0.0258 (Below impulse base $0.02515)
Risk/Reward: ~1:2.4
{future}(SCRUSDT)
#SECProposesCryptoCustodyFramework #trade #signal #ETH #BTC
$SCR
Entry Zone: $0.0275 – $0.0285 (Retest of 15M MA99 & previous resistance breakout)
Targets:
TP1: $0.0320 (15M MA7 retest)
TP2: $0.0345 (Mid-range consolidation level)
TP3: $0.0375 (24h High retest zone)
Stop Loss (SL): $0.0258 (Below impulse base $0.02515)
Risk/Reward: ~1:2.4
#SECProposesCryptoCustodyFramework #trade #signal #ETH #BTC
Entry Zone: $0.0275 – $0.0285 (Retest of 15M MA99 & previous resistance breakout)
Targets:
TP1: $0.0320 (15M MA7 retest)
TP2: $0.0345 (Mid-range consolidation level)
TP3: $0.0375 (24h High retest zone)
Stop Loss (SL): $0.0258 (Below impulse base $0.02515)
Risk/Reward: ~1:2.4
#SECProposesCryptoCustodyFramework #trade #signal #ETH #BTC
1
276

$Q SHORT
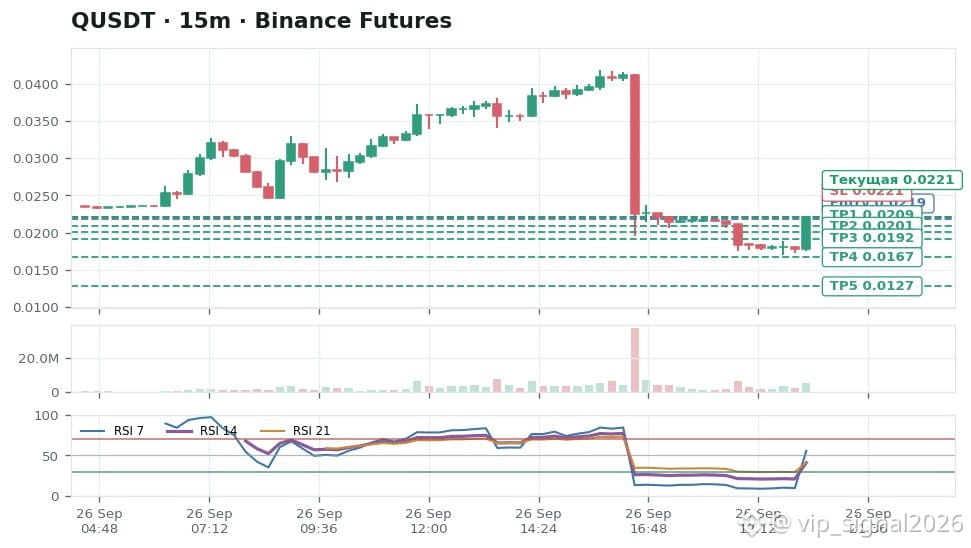
The movement remains oriented downward, but further refinement depends on maintaining selling pressure. A sudden move against the position remains the main risk factor, so the protective level has priority.
🏁Entry: 0.02185$
✅Take Profit 1: 0.02092094$
✅Take Profit 2: 0.02009327$
✅Take Profit 3: 0.0191903$
✅Take Profit 4: 0.01667875$
✅Take Profit 5: 0.01274789$
⛔️Stop: 0.02207592$
🧲 OI: 0.022077 • 📊 ROI: -26.0%
⚠️ This is not financial advice. Trade at your own risk. DYOR.
#Q #Crypto #Trade 📈
$Q
$Q SHORT
The movement remains oriented downward, but further refinement depends on maintaining selling pressure. A sudden move against the position remains the main risk factor, so the protective level has priority.
🏁Entry: 0.02185$
✅Take Profit 1: 0.02092094$
✅Take Profit 2: 0.02009327$
✅Take Profit 3: 0.0191903$
✅Take Profit 4: 0.01667875$
✅Take Profit 5: 0.01274789$
⛔️Stop: 0.02207592$
🧲 OI: 0.022077 • 📊 ROI: -26.0%
⚠️ This is not financial advice. Trade at your own risk. DYOR.
#Q #Crypto #Trade 📈
$Q
The movement remains oriented downward, but further refinement depends on maintaining selling pressure. A sudden move against the position remains the main risk factor, so the protective level has priority.
🏁Entry: 0.02185$
✅Take Profit 1: 0.02092094$
✅Take Profit 2: 0.02009327$
✅Take Profit 3: 0.0191903$
✅Take Profit 4: 0.01667875$
✅Take Profit 5: 0.01274789$
⛔️Stop: 0.02207592$
🧲 OI: 0.022077 • 📊 ROI: -26.0%
⚠️ This is not financial advice. Trade at your own risk. DYOR.
#Q #Crypto #Trade 📈
$Q
67
$CKB LONG
Bulls are forming a local foothold for the development of an upward impulse.
Buyers are trying to consolidate an advantage at the current levels, creating the prerequisites for a move toward higher targets.
The risk of a deep correction still remains a limiting factor, however the initiative remains on the side of long positions.
🏁Entry: 0.0011282
✅Take 1: 0.00114023 (+1.07%)
✅Take 2: 0.00116317 (+3.10%)
✅Take 3: 0.00119756 (+6.15%)
⛔️Stop: 0.0010829 (-4.02%)
⚠️ This is not financial advice. Trade at your own risk. DYOR.
#CKB #Signal #Trade 📈
$CKB
$CKB LONG
Bulls are forming a local foothold for the development of an upward impulse.
Buyers are trying to consolidate an advantage at the current levels, creating the prerequisites for a move toward higher targets.
The risk of a deep correction still remains a limiting factor, however the initiative remains on the side of long positions.
🏁Entry: 0.0011282
✅Take 1: 0.00114023 (+1.07%)
✅Take 2: 0.00116317 (+3.10%)
✅Take 3: 0.00119756 (+6.15%)
⛔️Stop: 0.0010829 (-4.02%)
⚠️ This is not financial advice. Trade at your own risk. DYOR.
#CKB #Signal #Trade 📈
$CKB
Bulls are forming a local foothold for the development of an upward impulse.
Buyers are trying to consolidate an advantage at the current levels, creating the prerequisites for a move toward higher targets.
The risk of a deep correction still remains a limiting factor, however the initiative remains on the side of long positions.
🏁Entry: 0.0011282
✅Take 1: 0.00114023 (+1.07%)
✅Take 2: 0.00116317 (+3.10%)
✅Take 3: 0.00119756 (+6.15%)
⛔️Stop: 0.0010829 (-4.02%)
⚠️ This is not financial advice. Trade at your own risk. DYOR.
#CKB #Signal #Trade 📈
$CKB
44
$Q SHORT
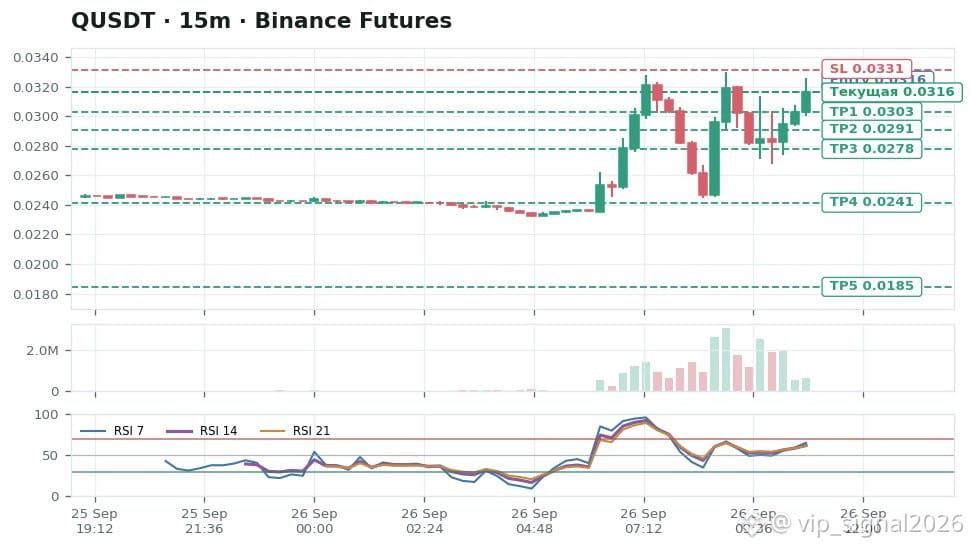
Pressure from sellers remains in focus, so a downward move looks like the base scenario. A sharp move against the position remains the main risk factor, so the protective level has priority.
🔹Entry zone: 0.031628$
💰Target 1: 0.03028318$
💰Target 2: 0.02908512$
💰Target 3: 0.02777806$
💰Target 4: 0.02414259$
💰Target 5: 0.01845264$
⛔️Stop: 0.03314614$
📈 RSI14: m1 69.5 • m5 59.0 • m15 62.3 • m30 64.6
📊 VOL: m1 $120.1K • m5 $95.3K • m15 $606.4K • m30 $1.2M
🧲 OI: now $10M • 5m +0.5% • 15m +3.4% • 30m +6.3%
⚠️ This is not financial advice. Trade at your own risk. DYOR.
#Q #Crypto #Trade 📈
$Q
$Q SHORT
Pressure from sellers remains in focus, so a downward move looks like the base scenario. A sharp move against the position remains the main risk factor, so the protective level has priority.
🔹Entry zone: 0.031628$
💰Target 1: 0.03028318$
💰Target 2: 0.02908512$
💰Target 3: 0.02777806$
💰Target 4: 0.02414259$
💰Target 5: 0.01845264$
⛔️Stop: 0.03314614$
📈 RSI14: m1 69.5 • m5 59.0 • m15 62.3 • m30 64.6
📊 VOL: m1 $120.1K • m5 $95.3K • m15 $606.4K • m30 $1.2M
🧲 OI: now $10M • 5m +0.5% • 15m +3.4% • 30m +6.3%
⚠️ This is not financial advice. Trade at your own risk. DYOR.
#Q #Crypto #Trade 📈
$Q
Pressure from sellers remains in focus, so a downward move looks like the base scenario. A sharp move against the position remains the main risk factor, so the protective level has priority.
🔹Entry zone: 0.031628$
💰Target 1: 0.03028318$
💰Target 2: 0.02908512$
💰Target 3: 0.02777806$
💰Target 4: 0.02414259$
💰Target 5: 0.01845264$
⛔️Stop: 0.03314614$
📈 RSI14: m1 69.5 • m5 59.0 • m15 62.3 • m30 64.6
📊 VOL: m1 $120.1K • m5 $95.3K • m15 $606.4K • m30 $1.2M
🧲 OI: now $10M • 5m +0.5% • 15m +3.4% • 30m +6.3%
⚠️ This is not financial advice. Trade at your own risk. DYOR.
#Q #Crypto #Trade 📈
$Q
1
70

🌍 US and China: what markets will be watching this week
Trade relations between the US and China are again drawing the attention of financial markets.
On September 20, representatives of both countries held talks in New York. Topics included trade, critical minerals, and issues related to the development and security of artificial intelligence.
📅 A separate date to watch is November 10, when the current period of the tariff truce ends.
For markets, several factors remain important:
• the terms of further trade arrangements;
• the availability of critical minerals and rare-earth materials;
• restrictions in advanced technology sectors;
• possible changes to tariff policy.
These decisions may affect global supply chains, production costs, and sentiment in financial markets.
📌 My takeaway: this week, it’s worth watching not only the headlines, but above all the specific terms of the agreements and the subsequent official steps by both sides.
#Macro #trade #markets #usa #china
🌍 US and China: what markets will be watching this week
Trade relations between the US and China are again drawing the attention of financial markets.
On September 20, representatives of both countries held talks in New York. Topics included trade, critical minerals, and issues related to the development and security of artificial intelligence.
📅 A separate date to watch is November 10, when the current period of the tariff truce ends.
For markets, several factors remain important:
• the terms of further trade arrangements;
• the availability of critical minerals and rare-earth materials;
• restrictions in advanced technology sectors;
• possible changes to tariff policy.
These decisions may affect global supply chains, production costs, and sentiment in financial markets.
📌 My takeaway: this week, it’s worth watching not only the headlines, but above all the specific terms of the agreements and the subsequent official steps by both sides.
#Macro #trade #markets #usa #china
Trade relations between the US and China are again drawing the attention of financial markets.
On September 20, representatives of both countries held talks in New York. Topics included trade, critical minerals, and issues related to the development and security of artificial intelligence.
📅 A separate date to watch is November 10, when the current period of the tariff truce ends.
For markets, several factors remain important:
• the terms of further trade arrangements;
• the availability of critical minerals and rare-earth materials;
• restrictions in advanced technology sectors;
• possible changes to tariff policy.
These decisions may affect global supply chains, production costs, and sentiment in financial markets.
📌 My takeaway: this week, it’s worth watching not only the headlines, but above all the specific terms of the agreements and the subsequent official steps by both sides.
#Macro #trade #markets #usa #china

3
401


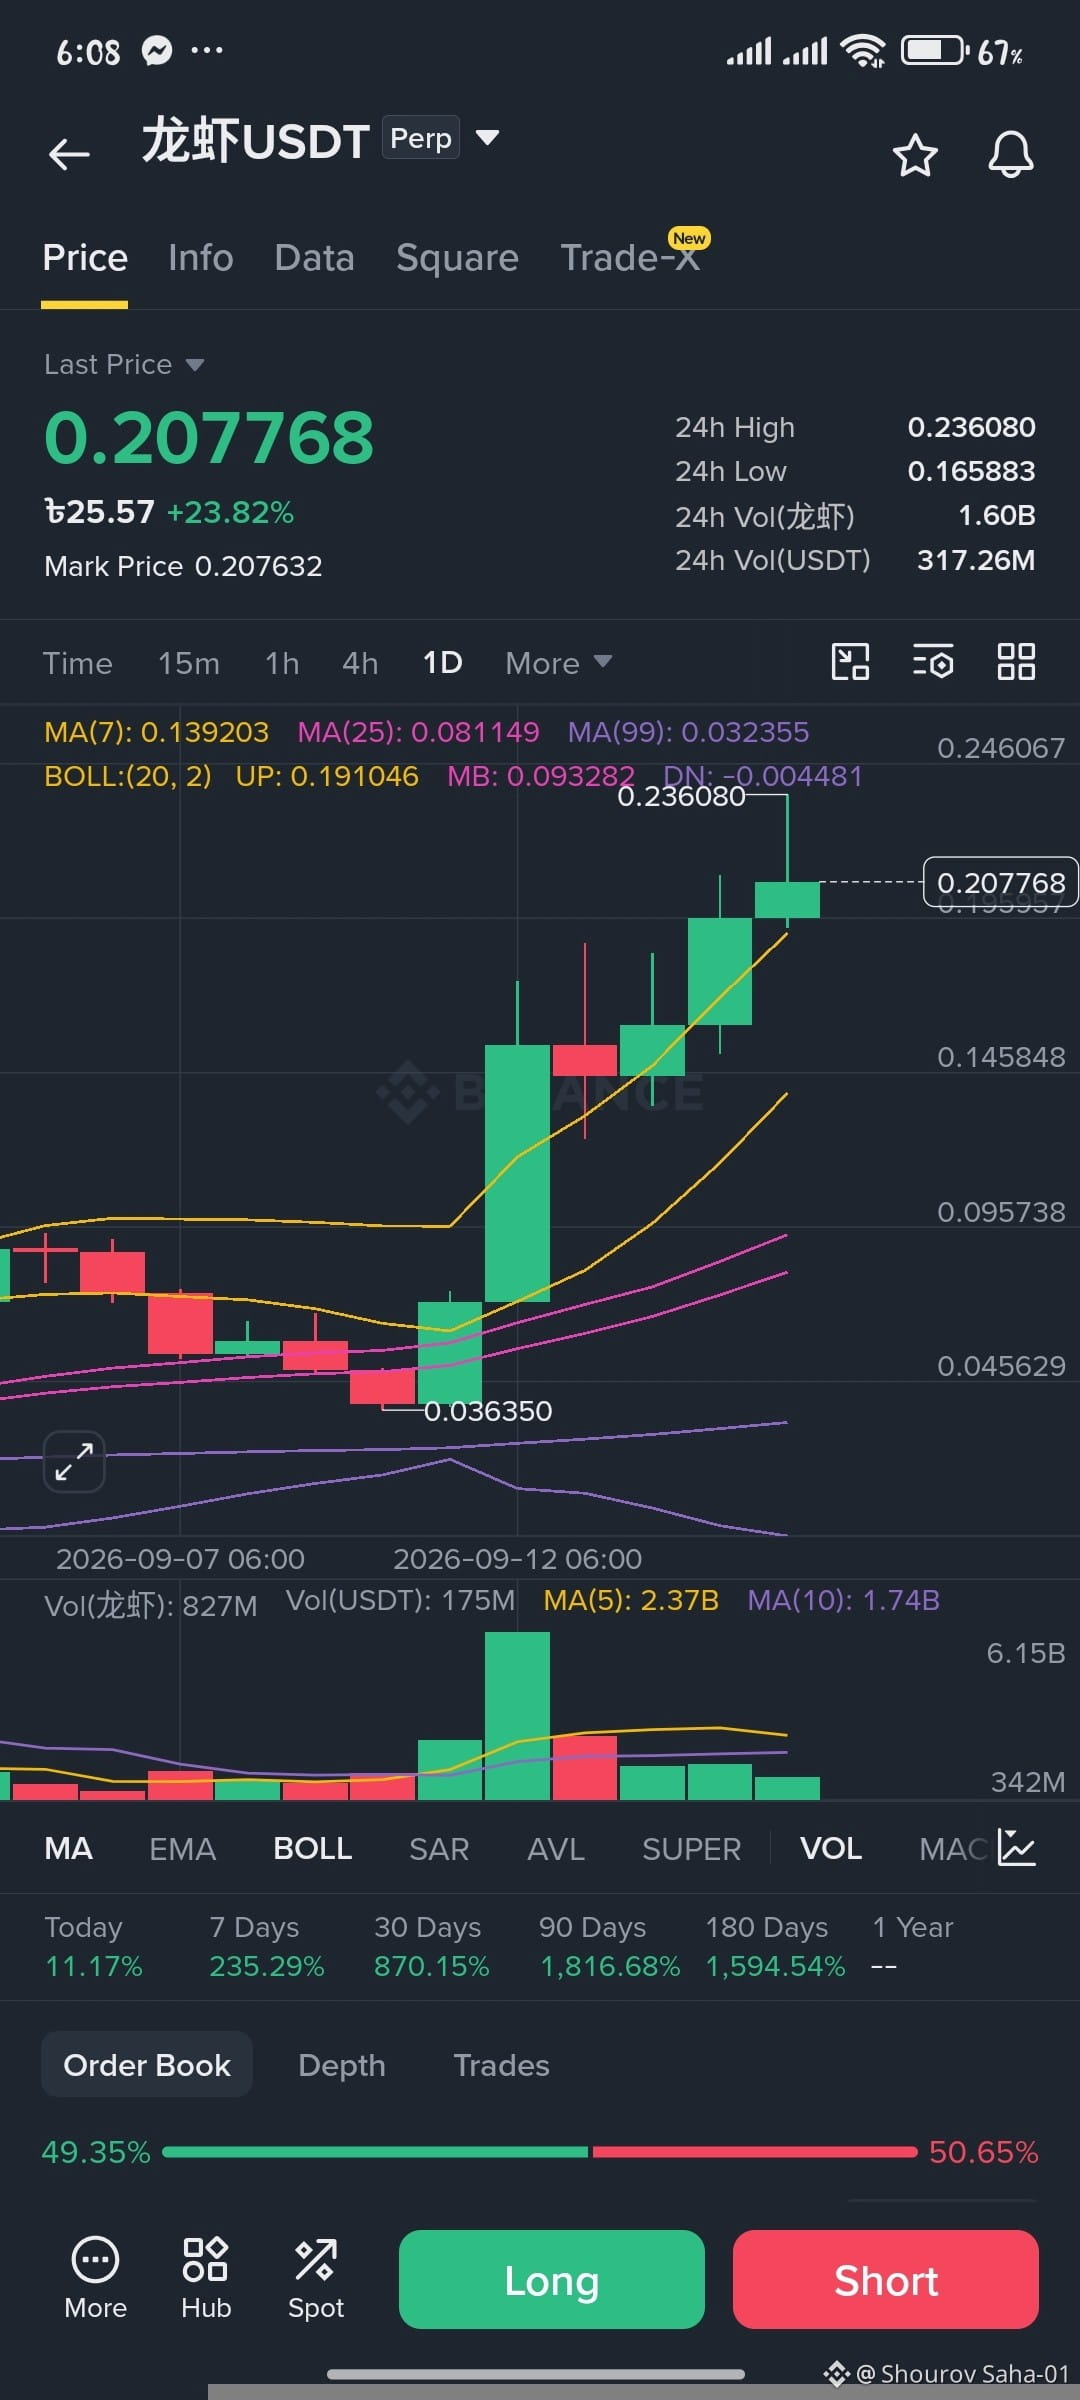
🦞 $龙虾 — TRADE SETUP 🔥
📍 Long Entry: $0.180–$0.191
🎯 TP1: $0.230
🎯 TP2: $0.260
🛑 SL: $0.165
🚀 Breakout Entry: $0.236+ with strong volume
🎯 Target: $0.280–$0.300
⚠️ Don’t chase the pump. Wait for the retest + confirmation. Manage leverage & risk. DYOR/NFA.
{future}(龙虾USDT)
#Binance #trading #trade #FedRateWatch #AI
🦞 $龙虾 — TRADE SETUP 🔥
📍 Long Entry: $0.180–$0.191
🎯 TP1: $0.230
🎯 TP2: $0.260
🛑 SL: $0.165
🚀 Breakout Entry: $0.236+ with strong volume
🎯 Target: $0.280–$0.300
⚠️ Don’t chase the pump. Wait for the retest + confirmation. Manage leverage & risk. DYOR/NFA.
#Binance #trading #trade #FedRateWatch #AI
📍 Long Entry: $0.180–$0.191
🎯 TP1: $0.230
🎯 TP2: $0.260
🛑 SL: $0.165
🚀 Breakout Entry: $0.236+ with strong volume
🎯 Target: $0.280–$0.300
⚠️ Don’t chase the pump. Wait for the retest + confirmation. Manage leverage & risk. DYOR/NFA.
#Binance #trading #trade #FedRateWatch #AI
1
275

·
--
Hey millionaire let's trade 👋
BTW/USDT — Bullish Range-Breakout Watch
$BTW
{future}(BTWUSDT)
Bias: Long
Confidence: 76% (signal estimate)
Entry Zone: 0.6656629 – 0.6864171
Invalidation Level: 0.5382569
Upside Reference Levels:
• TP1: 0.7793773
• TP2: 0.8482688
• TP3: 0.9516061
Why this setup?
BTW/USDT is consolidating inside a broader daily range while shorter-term momentum shows constructive conditions. The 1-hour ATR reading of 0.038274 suggests volatility compression, which can precede a larger directional move—although it does not determine the direction by itself. On the 15-minute chart, RSI near 59.44 reflects neutral-to-positive momentum without an overbought reading.
The stated entry area provides a defined structure: potential upside reference levels sit above the range, while a decisive loss of the invalidation level would weaken the bullish thesis.#BTWSignal #trade
Hey millionaire let's trade 👋
BTW/USDT — Bullish Range-Breakout Watch
$BTW
Bias: Long
Confidence: 76% (signal estimate)
Entry Zone: 0.6656629 – 0.6864171
Invalidation Level: 0.5382569
Upside Reference Levels:
• TP1: 0.7793773
• TP2: 0.8482688
• TP3: 0.9516061
Why this setup?
BTW/USDT is consolidating inside a broader daily range while shorter-term momentum shows constructive conditions. The 1-hour ATR reading of 0.038274 suggests volatility compression, which can precede a larger directional move—although it does not determine the direction by itself. On the 15-minute chart, RSI near 59.44 reflects neutral-to-positive momentum without an overbought reading.
The stated entry area provides a defined structure: potential upside reference levels sit above the range, while a decisive loss of the invalidation level would weaken the bullish thesis.#BTWSignal #trade
BTW/USDT — Bullish Range-Breakout Watch
$BTW
Bias: Long
Confidence: 76% (signal estimate)
Entry Zone: 0.6656629 – 0.6864171
Invalidation Level: 0.5382569
Upside Reference Levels:
• TP1: 0.7793773
• TP2: 0.8482688
• TP3: 0.9516061
Why this setup?
BTW/USDT is consolidating inside a broader daily range while shorter-term momentum shows constructive conditions. The 1-hour ATR reading of 0.038274 suggests volatility compression, which can precede a larger directional move—although it does not determine the direction by itself. On the 15-minute chart, RSI near 59.44 reflects neutral-to-positive momentum without an overbought reading.
The stated entry area provides a defined structure: potential upside reference levels sit above the range, while a decisive loss of the invalidation level would weaken the bullish thesis.#BTWSignal #trade
150

On September 15, 2026, social network X announced the launch in the United States of its Cashtag partner program, a feature that allows users to start buying and selling operations of bitcoin ($BTC ), cryptocurrencies, and stock trades from the platform. The tool connects the platform’s financial interactions with brokerage firms and external exchanges.
In this initial stage, U.S. users have a workflow outlined by the company to execute transactions. When searching for or interacting with a financial tag on the social network (such as $BTC), people can access real-time price charts and related posts.
From there, a new option called “Trade” is enabled, which redirects the user to the chosen exchange’s mobile app or web platform. Finally, the person must sign in or create a new account to complete the transaction directly with the external entity.
Companies included in the launch program include Interactive Brokers, Moomoo, Gemini, Kraken, and Coinbase.
#x #coinbase #trade $ETH $SOL
{spot}(SOLUSDT)
{spot}(ETHUSDT)
{spot}(BTCUSDT)
On September 15, 2026, social network X announced the launch in the United States of its Cashtag partner program, a feature that allows users to start buying and selling operations of bitcoin ($BTC ), cryptocurrencies, and stock trades from the platform. The tool connects the platform’s financial interactions with brokerage firms and external exchanges.
In this initial stage, U.S. users have a workflow outlined by the company to execute transactions. When searching for or interacting with a financial tag on the social network (such as $BTC ), people can access real-time price charts and related posts.
From there, a new option called “Trade” is enabled, which redirects the user to the chosen exchange’s mobile app or web platform. Finally, the person must sign in or create a new account to complete the transaction directly with the external entity.
Companies included in the launch program include Interactive Brokers, Moomoo, Gemini, Kraken, and Coinbase.
#x #coinbase #trade $ETH $SOL
In this initial stage, U.S. users have a workflow outlined by the company to execute transactions. When searching for or interacting with a financial tag on the social network (such as $BTC ), people can access real-time price charts and related posts.
From there, a new option called “Trade” is enabled, which redirects the user to the chosen exchange’s mobile app or web platform. Finally, the person must sign in or create a new account to complete the transaction directly with the external entity.
Companies included in the launch program include Interactive Brokers, Moomoo, Gemini, Kraken, and Coinbase.
#x #coinbase #trade $ETH $SOL
160

·
--
Bullish
Reflection on a Week of Luck
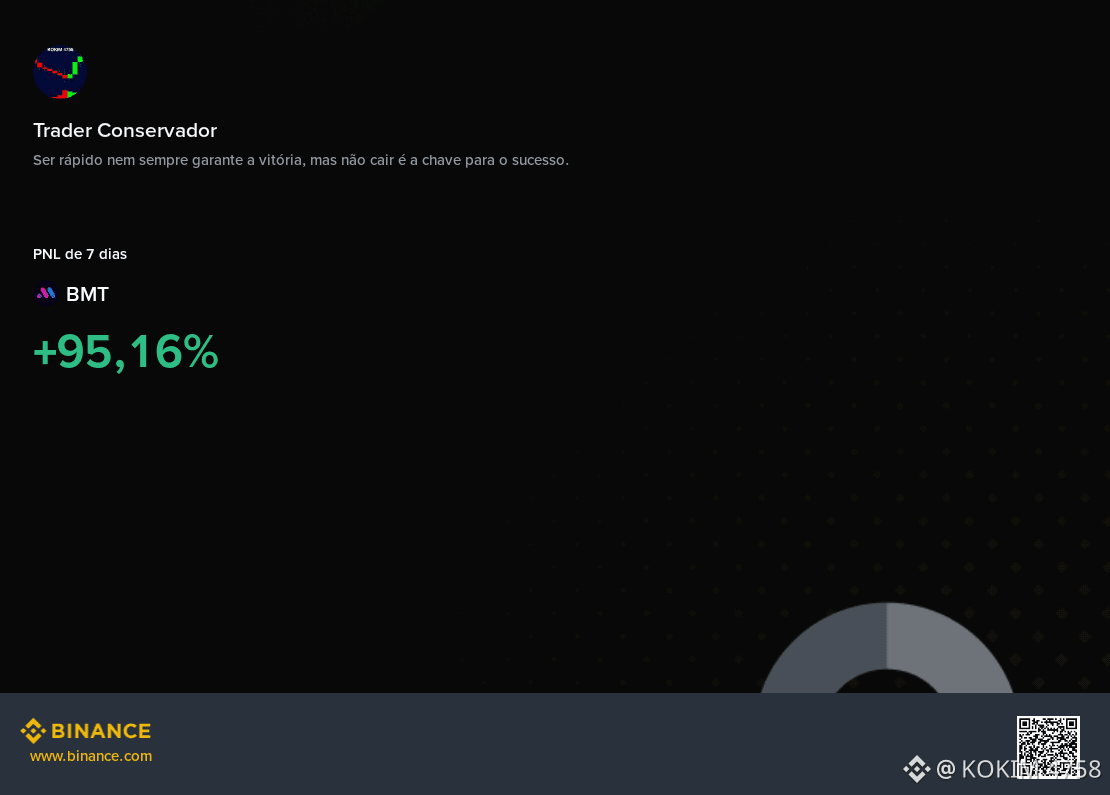
I saw this chart appear today and, honestly, my first reaction was surprise. Yes, the numbers are real, but I know, deep down, that this isn’t my day-to-day reality.
For me, the ‘Conservative Trader’ isn’t just a username; it’s my life philosophy in the markets. I’m not looking for quick wealth. I’m looking for survival. As the phrase in the image says: ‘not falling is the key.’ And this week, I simply didn’t fall.
The market gave me a gift. Maybe a few small positions, carefully analyzed so as not to risk too much of my real capital, rose at the right moment on BMT. Was it luck? Mostly, yes. If I said I planned this exact return, I’d be lying to myself and to whoever is reading this.
This 95.16% result in 7 days is an anomaly in my journey. It’s a blessed week, a reminder of what’s possible, but it’s not my pattern. My pattern is patience, strict risk management, and accepting small, consistent profits over time.
I didn’t change my strategy, I didn’t become a genius overnight. I’m still the same cautious trader who values every cent. This gain goes straight into my reserve, not into vanity. It gives me more breathing room for the weeks that will inevitably be difficult or involve losses.
Binance shows the number, but it doesn’t show the nights of studying, the anguish of each ‘trade’, or the awareness that tomorrow everything can change. I receive this result with gratitude, but with my feet firmly on the ground. It’s a good week. That’s all. And my journey continues, one step at a time.
$BMT
#pnl
#trade
Reflection on a Week of Luck
I saw this chart appear today and, honestly, my first reaction was surprise. Yes, the numbers are real, but I know, deep down, that this isn’t my day-to-day reality.
For me, the ‘Conservative Trader’ isn’t just a username; it’s my life philosophy in the markets. I’m not looking for quick wealth. I’m looking for survival. As the phrase in the image says: ‘not falling is the key.’ And this week, I simply didn’t fall.
The market gave me a gift. Maybe a few small positions, carefully analyzed so as not to risk too much of my real capital, rose at the right moment on BMT. Was it luck? Mostly, yes. If I said I planned this exact return, I’d be lying to myself and to whoever is reading this.
This 95.16% result in 7 days is an anomaly in my journey. It’s a blessed week, a reminder of what’s possible, but it’s not my pattern. My pattern is patience, strict risk management, and accepting small, consistent profits over time.
I didn’t change my strategy, I didn’t become a genius overnight. I’m still the same cautious trader who values every cent. This gain goes straight into my reserve, not into vanity. It gives me more breathing room for the weeks that will inevitably be difficult or involve losses.
Binance shows the number, but it doesn’t show the nights of studying, the anguish of each ‘trade’, or the awareness that tomorrow everything can change. I receive this result with gratitude, but with my feet firmly on the ground. It’s a good week. That’s all. And my journey continues, one step at a time.
$BMT
#pnl
#trade
I saw this chart appear today and, honestly, my first reaction was surprise. Yes, the numbers are real, but I know, deep down, that this isn’t my day-to-day reality.
For me, the ‘Conservative Trader’ isn’t just a username; it’s my life philosophy in the markets. I’m not looking for quick wealth. I’m looking for survival. As the phrase in the image says: ‘not falling is the key.’ And this week, I simply didn’t fall.
The market gave me a gift. Maybe a few small positions, carefully analyzed so as not to risk too much of my real capital, rose at the right moment on BMT. Was it luck? Mostly, yes. If I said I planned this exact return, I’d be lying to myself and to whoever is reading this.
This 95.16% result in 7 days is an anomaly in my journey. It’s a blessed week, a reminder of what’s possible, but it’s not my pattern. My pattern is patience, strict risk management, and accepting small, consistent profits over time.
I didn’t change my strategy, I didn’t become a genius overnight. I’m still the same cautious trader who values every cent. This gain goes straight into my reserve, not into vanity. It gives me more breathing room for the weeks that will inevitably be difficult or involve losses.
Binance shows the number, but it doesn’t show the nights of studying, the anguish of each ‘trade’, or the awareness that tomorrow everything can change. I receive this result with gratitude, but with my feet firmly on the ground. It’s a good week. That’s all. And my journey continues, one step at a time.
$BMT
#pnl
#trade
1
190

·
--
$DOGE Here is a structured framework for a bullish trade setup on $DOGE (Dogecoin) based on recent technical patterns (such as a potential continuation pattern near support/resistance boundaries).
$DOGE Bullish Trade Setup
Asset: DOGE / USDT
Direction: Long / Bullish
Setup Type: Momentum Breakout / Trendline Defense
Key Technical Levels
Entry Trigger: A confirmed 4-hour candle close above the immediate consolidation resistance (roughly $0.0915 – $0.0920) accompanied by above-average volume. Alternatively, accumulation near the local rising trendline support (~$0.0840 – $0.0850).
Stop-Loss (Risk Management): Place just below the local invalidation level / rising trendline support (approx. $0.0795) to protect against a breakdown.
Take-Profit Targets:
Target 1: $0.0953
Target 2: $0.1008 (Psychological level)
Target 3: $0.1068 (Extended momentum target)
Trade Rationale & Market Context
Momentum Indicators: On lower-to-mid timeframes (like the 4-hour chart), the RSI holding moderately above midline levels reflects underlying buyer interest without being immediately overbought.
Pattern Recognition: Price action showing tight consolidation right under local resistance hints at building pressure. A clean volume-backed breakout invalidates the range-bound chop.
Risk Note: Meme assets like DOGE carry high volatility and can be heavily swayed by broader market shifts (especially Bitcoin's movement) and social sentiment. Always manage position sizes accordingly. #crypto #trade #bullish
{future}(DOGEUSDT)
$DOGE Here is a structured framework for a bullish trade setup on $DOGE (Dogecoin) based on recent technical patterns (such as a potential continuation pattern near support/resistance boundaries).
$DOGE Bullish Trade Setup
Asset: DOGE / USDT
Direction: Long / Bullish
Setup Type: Momentum Breakout / Trendline Defense
Key Technical Levels
Entry Trigger: A confirmed 4-hour candle close above the immediate consolidation resistance (roughly $0.0915 – $0.0920) accompanied by above-average volume. Alternatively, accumulation near the local rising trendline support (~$0.0840 – $0.0850).
Stop-Loss (Risk Management): Place just below the local invalidation level / rising trendline support (approx. $0.0795) to protect against a breakdown.
Take-Profit Targets:
Target 1: $0.0953
Target 2: $0.1008 (Psychological level)
Target 3: $0.1068 (Extended momentum target)
Trade Rationale & Market Context
Momentum Indicators: On lower-to-mid timeframes (like the 4-hour chart), the RSI holding moderately above midline levels reflects underlying buyer interest without being immediately overbought.
Pattern Recognition: Price action showing tight consolidation right under local resistance hints at building pressure. A clean volume-backed breakout invalidates the range-bound chop.
Risk Note: Meme assets like DOGE carry high volatility and can be heavily swayed by broader market shifts (especially Bitcoin's movement) and social sentiment. Always manage position sizes accordingly. #crypto #trade #bullish
$DOGE Bullish Trade Setup
Asset: DOGE / USDT
Direction: Long / Bullish
Setup Type: Momentum Breakout / Trendline Defense
Key Technical Levels
Entry Trigger: A confirmed 4-hour candle close above the immediate consolidation resistance (roughly $0.0915 – $0.0920) accompanied by above-average volume. Alternatively, accumulation near the local rising trendline support (~$0.0840 – $0.0850).
Stop-Loss (Risk Management): Place just below the local invalidation level / rising trendline support (approx. $0.0795) to protect against a breakdown.
Take-Profit Targets:
Target 1: $0.0953
Target 2: $0.1008 (Psychological level)
Target 3: $0.1068 (Extended momentum target)
Trade Rationale & Market Context
Momentum Indicators: On lower-to-mid timeframes (like the 4-hour chart), the RSI holding moderately above midline levels reflects underlying buyer interest without being immediately overbought.
Pattern Recognition: Price action showing tight consolidation right under local resistance hints at building pressure. A clean volume-backed breakout invalidates the range-bound chop.
Risk Note: Meme assets like DOGE carry high volatility and can be heavily swayed by broader market shifts (especially Bitcoin's movement) and social sentiment. Always manage position sizes accordingly. #crypto #trade #bullish
58

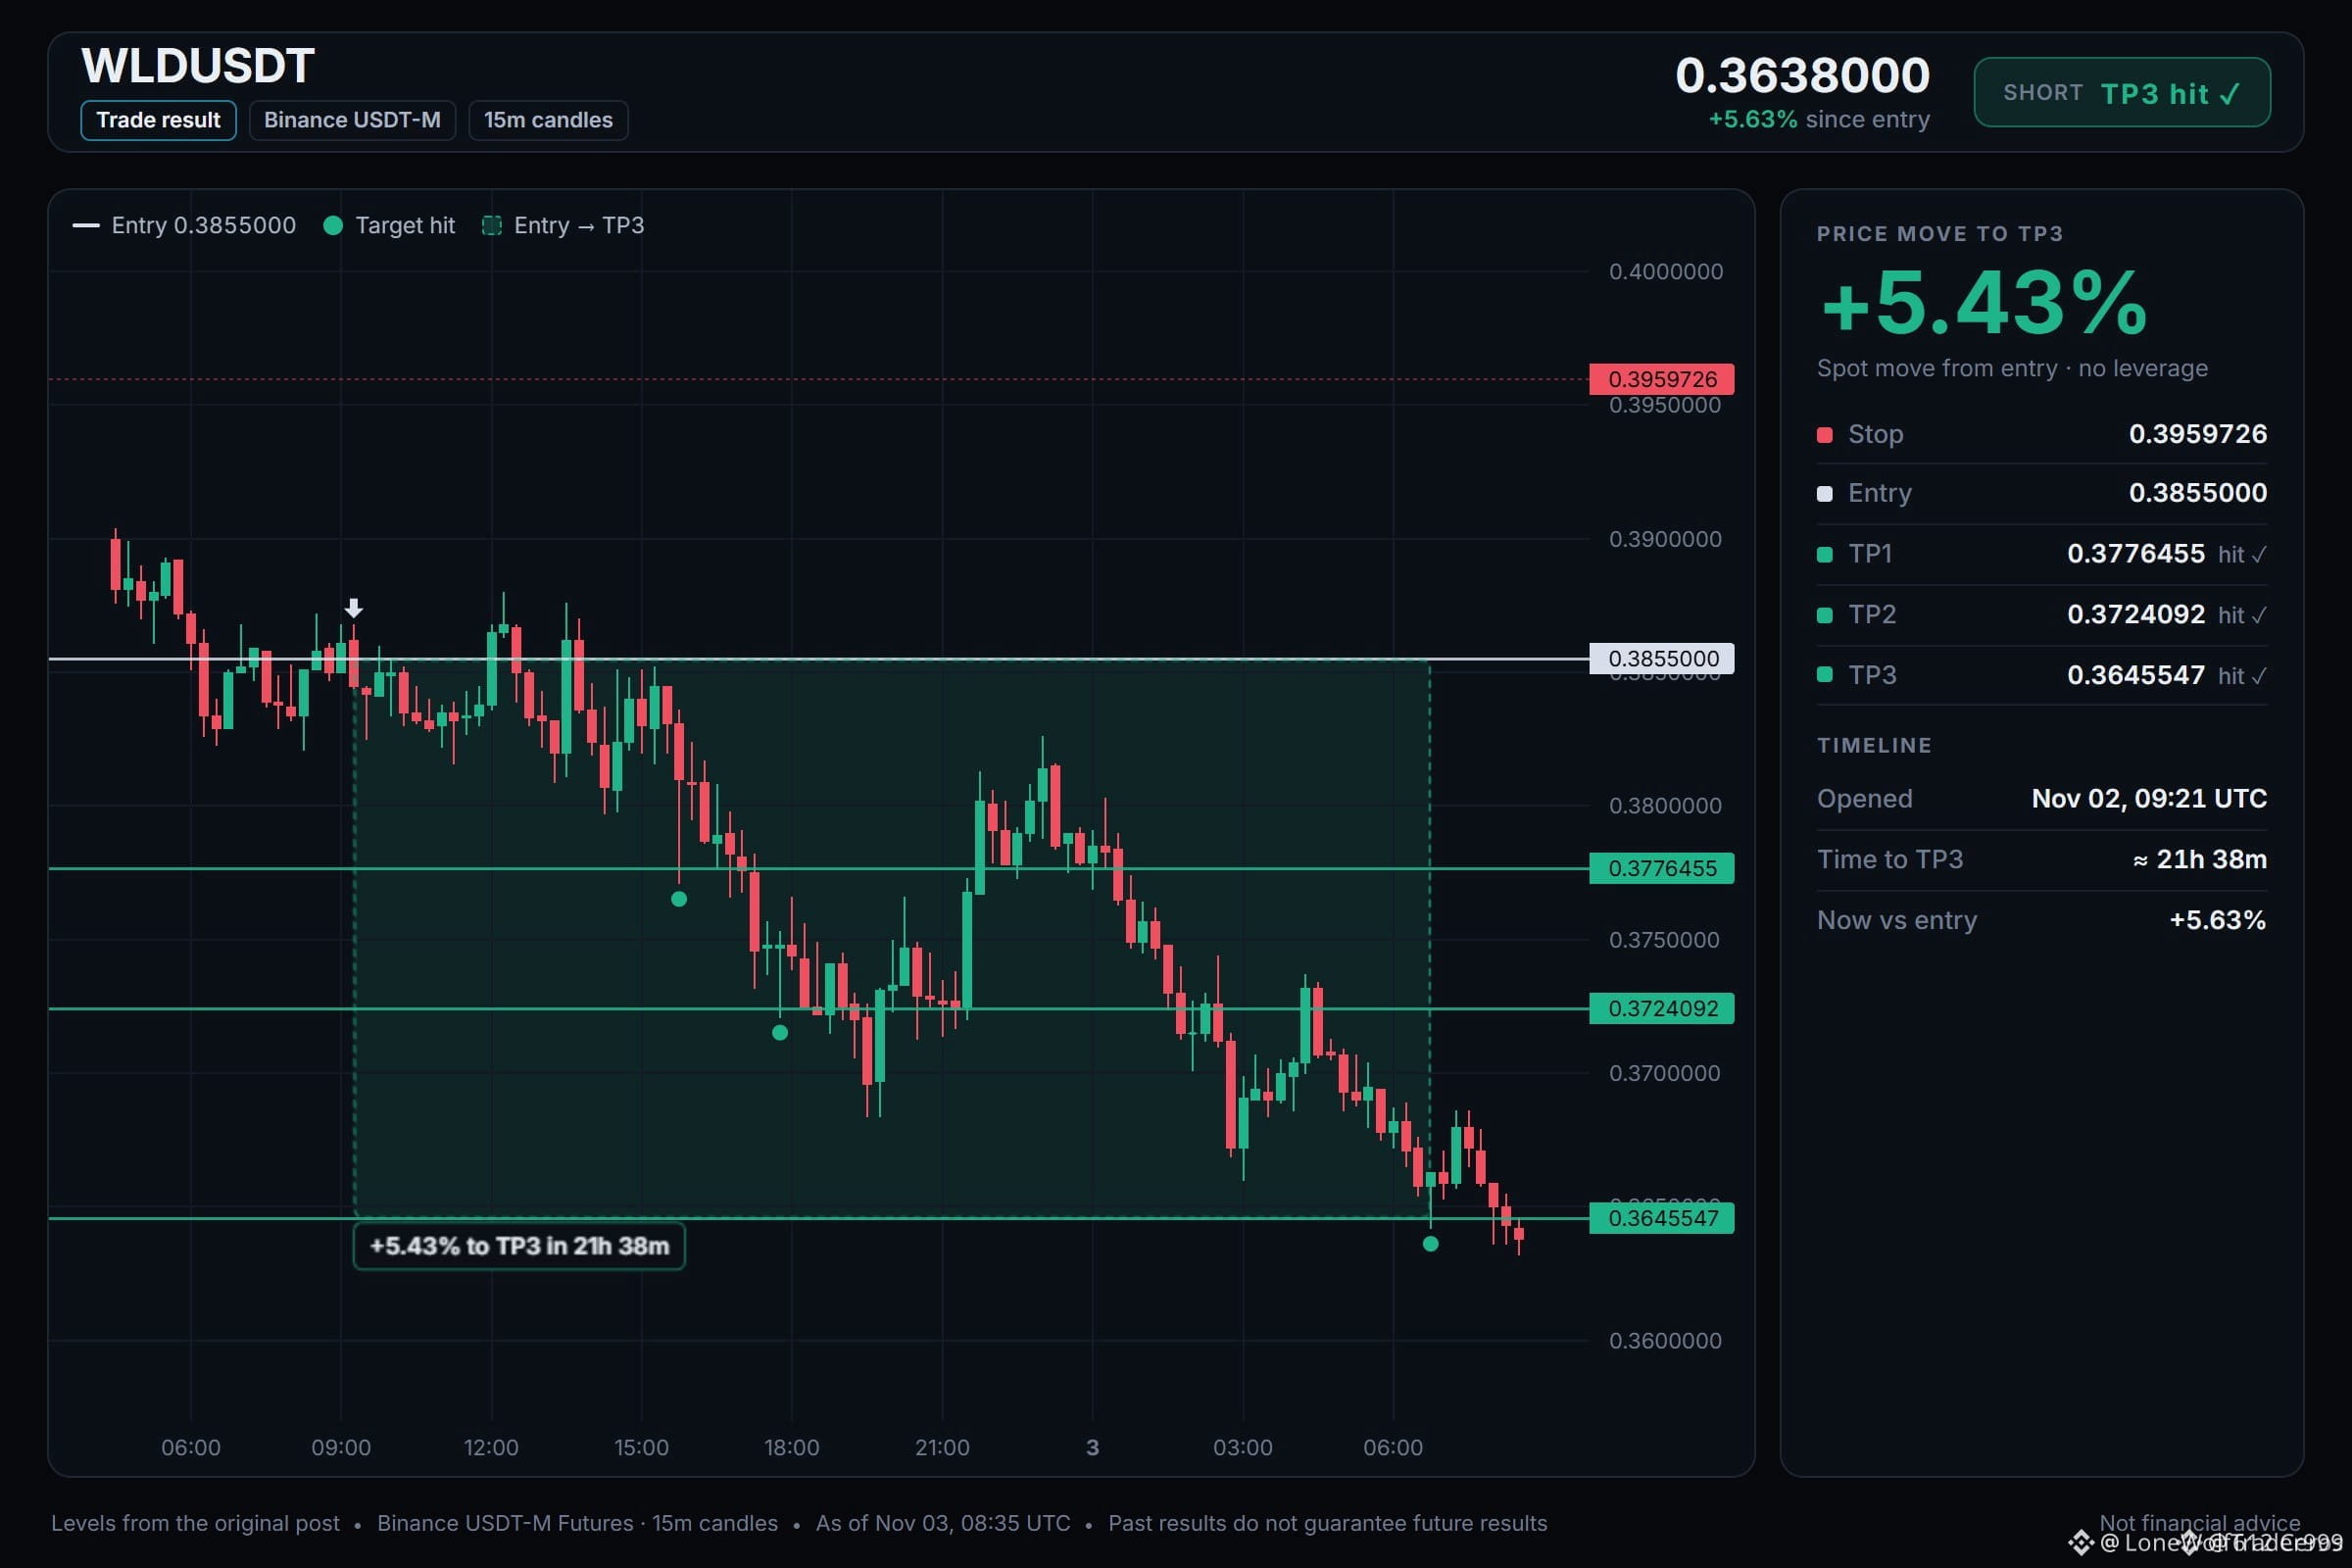
🚨 $BTC SHORT HITS TP3 AFTER 5% POP – LIQUIDITY SWEEP! 📉
📊 The 5.43% surge in just 21h 38m signals a swift liquidity grab, with smart‑money sharks flipping the order book fast. ⚡ Volume spiked on the 4H chart as sellers sliced through the last resistance, locking in TP3 cleanly.
💡 Execution was crisp, but the market’s appetite for short pressure remains high. 👀 Are you ready to chase the next short wave or sit on the sidelines? 💬
⚠️ Not financial advice. Always manage your risk. 🛡️
🏷️ #BTC #ShortSetup #Crypto #Trade
🐻 🔥
🚨 $BTC SHORT HITS TP3 AFTER 5% POP – LIQUIDITY SWEEP! 📉
📊 The 5.43% surge in just 21h 38m signals a swift liquidity grab, with smart‑money sharks flipping the order book fast. ⚡ Volume spiked on the 4H chart as sellers sliced through the last resistance, locking in TP3 cleanly.
💡 Execution was crisp, but the market’s appetite for short pressure remains high. 👀 Are you ready to chase the next short wave or sit on the sidelines? 💬
⚠️ Not financial advice. Always manage your risk. 🛡️
🏷️ #BTC #ShortSetup #Crypto #Trade
🐻 🔥
📊 The 5.43% surge in just 21h 38m signals a swift liquidity grab, with smart‑money sharks flipping the order book fast. ⚡ Volume spiked on the 4H chart as sellers sliced through the last resistance, locking in TP3 cleanly.
💡 Execution was crisp, but the market’s appetite for short pressure remains high. 👀 Are you ready to chase the next short wave or sit on the sidelines? 💬
⚠️ Not financial advice. Always manage your risk. 🛡️
🏷️ #BTC #ShortSetup #Crypto #Trade
🐻 🔥
4
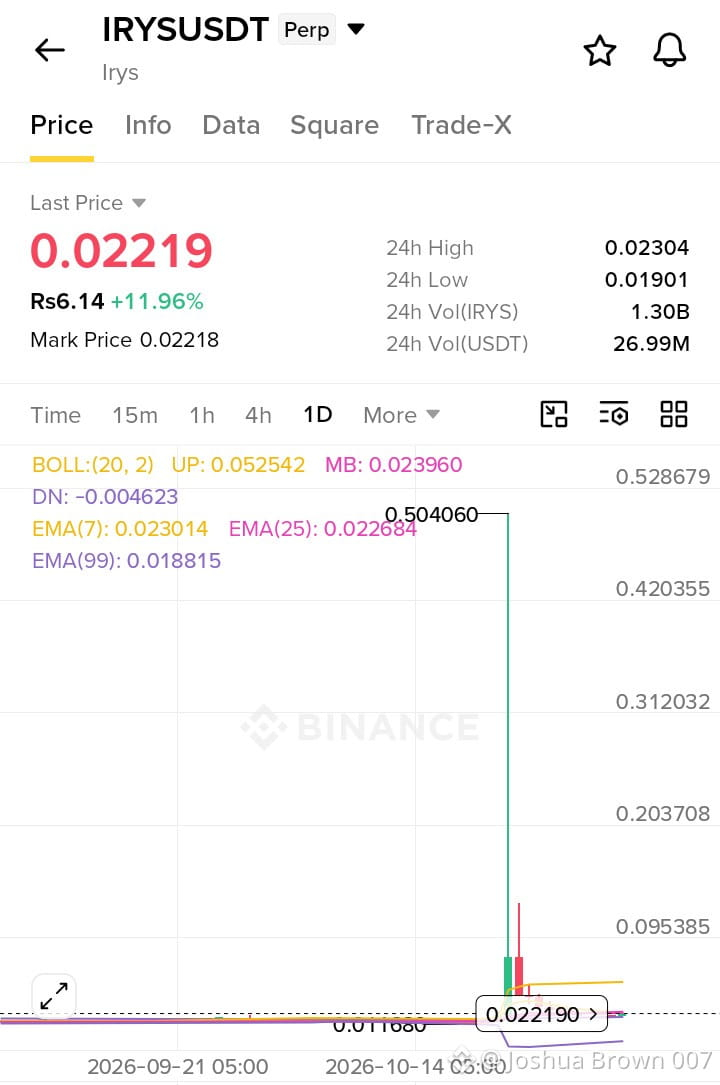
$IRYS Another Pump and Dump Could Be Waiting Around the Corner. Are Traders Prepared?
I have been looking at the extreme price movement in $IRYS, and one thing deserves serious attention.
The chart shows a sudden spike to $0.504060, followed by a sharp collapse toward $0.022190.
This is the kind of price action that makes me question the actual liquidity behind a token.
A sudden wick does not automatically prove market manipulation, but it exposes a serious risk: thin order books, aggressive leverage and insufficient organic liquidity.
Here is what I would monitor before taking another trade:
🔹 Liquidity Heatmap: Identify major liquidation clusters and potential stop hunt zones.
🔹 Open Interest:
Watch for rapid OI increases without meaningful price movement. Excessive leverage can create conditions for violent moves.
🔹 Spot vs Futures Volume: Check whether real spot demand supports the price or whether derivatives are driving the movement.
🔹 FDV and Circulating Supply: Understand the valuation and potential selling pressure.
My Trading Strategy for $IRYS
I would not chase a sudden green candle.
1. Avoid high-leverage futures positions.
2. Let the price establish a clear support and resistance range.
3. Wait for a liquidity sweep followed by a confirmed reclaim or breakdown.
4. Check spot volume and OI before entering.
5. Use a predefined stop loss and risk only 0.5–1% of trading capital.
6. Take partial profits at predefined resistance levels.
My biggest concern isn't missing the next pump. It's entering at the wrong time and becoming exit liquidity for someone else's trade.
Remember:
Protecting capital is also a trading strategy.
#trade #TraderAlert #coin #ALPHA
{future}(IRYSUSDT)
$SOXSB
{spot}(SOXSBUSDT)
$ON
{future}(ONUSDT)
$IRYS Another Pump and Dump Could Be Waiting Around the Corner. Are Traders Prepared?
I have been looking at the extreme price movement in $IRYS , and one thing deserves serious attention.
The chart shows a sudden spike to $0.504060, followed by a sharp collapse toward $0.022190.
This is the kind of price action that makes me question the actual liquidity behind a token.
A sudden wick does not automatically prove market manipulation, but it exposes a serious risk: thin order books, aggressive leverage and insufficient organic liquidity.
Here is what I would monitor before taking another trade:
🔹 Liquidity Heatmap: Identify major liquidation clusters and potential stop hunt zones.
🔹 Open Interest:
Watch for rapid OI increases without meaningful price movement. Excessive leverage can create conditions for violent moves.
🔹 Spot vs Futures Volume: Check whether real spot demand supports the price or whether derivatives are driving the movement.
🔹 FDV and Circulating Supply: Understand the valuation and potential selling pressure.
My Trading Strategy for $IRYS
I would not chase a sudden green candle.
1. Avoid high-leverage futures positions.
2. Let the price establish a clear support and resistance range.
3. Wait for a liquidity sweep followed by a confirmed reclaim or breakdown.
4. Check spot volume and OI before entering.
5. Use a predefined stop loss and risk only 0.5–1% of trading capital.
6. Take partial profits at predefined resistance levels.
My biggest concern isn't missing the next pump. It's entering at the wrong time and becoming exit liquidity for someone else's trade.
Remember:
Protecting capital is also a trading strategy.
#trade #TraderAlert #coin #ALPHA
$SOXSB
$ON
I have been looking at the extreme price movement in $IRYS , and one thing deserves serious attention.
The chart shows a sudden spike to $0.504060, followed by a sharp collapse toward $0.022190.
This is the kind of price action that makes me question the actual liquidity behind a token.
A sudden wick does not automatically prove market manipulation, but it exposes a serious risk: thin order books, aggressive leverage and insufficient organic liquidity.
Here is what I would monitor before taking another trade:
🔹 Liquidity Heatmap: Identify major liquidation clusters and potential stop hunt zones.
🔹 Open Interest:
Watch for rapid OI increases without meaningful price movement. Excessive leverage can create conditions for violent moves.
🔹 Spot vs Futures Volume: Check whether real spot demand supports the price or whether derivatives are driving the movement.
🔹 FDV and Circulating Supply: Understand the valuation and potential selling pressure.
My Trading Strategy for $IRYS
I would not chase a sudden green candle.
1. Avoid high-leverage futures positions.
2. Let the price establish a clear support and resistance range.
3. Wait for a liquidity sweep followed by a confirmed reclaim or breakdown.
4. Check spot volume and OI before entering.
5. Use a predefined stop loss and risk only 0.5–1% of trading capital.
6. Take partial profits at predefined resistance levels.
My biggest concern isn't missing the next pump. It's entering at the wrong time and becoming exit liquidity for someone else's trade.
Remember:
Protecting capital is also a trading strategy.
#trade #TraderAlert #coin #ALPHA
$SOXSB
$ON
427

here is my trade which want to share all of you ..
#trade
here is my trade which want to share all of you ..
#trade
#trade
71
Log in to explore more content
Join global crypto users on Binance Square
⚡️ Get latest and useful information about crypto.
💬 Trusted by the world’s largest crypto exchange.
👍 Discover real insights from verified creators.
Email / Phone number
Trending Topics
1
#BinanceReopensWithdrawalsForMoreAssets
24,812 views
678 Discussing
2
#AppleReportsMixedResults
16,776 views
501 Discussing
3
#BinanceHourlyDepositsExceedWithdrawals
4,268 views
167 Discussing
4
#PalantirSlides3PercentOn$2BRevenue
325 views
10 Discussing
5
#USMidtermElections
718,316 views
3,898 Discussing
6
#USOctoberNFP-AreRateCutsStillPossible
112,490 views
937 Discussing
7
#Verify1to1BinanceReserves
101,237 views
695 Discussing
8
#SBIFirstHalfCryptoRevenueFalls30.1%
684 views
22 Discussing
9
#NEARVoteApprovesCutInMaxAnnualIssuanceTo1.6%
4,496 views
34 Discussing
10
#BinanceRestores28FiatWithdrawals
255,121 views
1,359 Discussing