
#liquidationheatmap
liquidationheatmap
587,456 views
541 Discussing
Hot
Latest

·
--
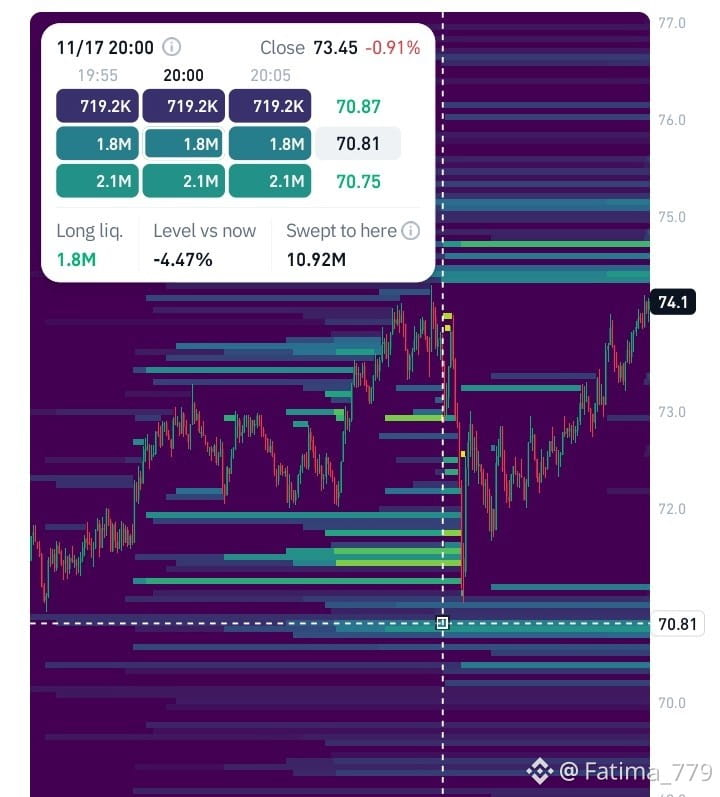
🔥$SOL Liquidity Heatmap: A Major Level to Watch!
Price is trading near 74.10, while the liquidation heatmap highlights an important liquidity zone around 70.81.
Here's what caught my attention:
📊 70.81: A significant liquidity area, with approximately $1.8M in long liquidations shown.
🐋 $10.92M swept: The chart highlights substantial liquidity swept around this level.
⚡ 74.00–74.50: The immediate area to watch as price approaches nearby resistance.
My Market View:
Price has recovered strongly after the sharp downside move. However, I want to see whether buyers can maintain momentum and push above nearby resistance.
A rejection could bring another pullback, while a confirmed breakout may open the door for further upside.
No blind entries. Watch volume, liquidity and confirmation before taking a trade.
What's next?
🐂 Bullish continuation
🐻 Another liquidity sweep
⏳ Sideways consolidation
#CryptoTrading #LiquidationHeatmap #liquidity #MarketAnalysis
{future}(SOLUSDT)
🔥$SOL Liquidity Heatmap: A Major Level to Watch!
Price is trading near 74.10, while the liquidation heatmap highlights an important liquidity zone around 70.81.
Here's what caught my attention:
📊 70.81: A significant liquidity area, with approximately $1.8M in long liquidations shown.
🐋 $10.92M swept: The chart highlights substantial liquidity swept around this level.
⚡ 74.00–74.50: The immediate area to watch as price approaches nearby resistance.
My Market View:
Price has recovered strongly after the sharp downside move. However, I want to see whether buyers can maintain momentum and push above nearby resistance.
A rejection could bring another pullback, while a confirmed breakout may open the door for further upside.
No blind entries. Watch volume, liquidity and confirmation before taking a trade.
What's next?
🐂 Bullish continuation
🐻 Another liquidity sweep
⏳ Sideways consolidation
#CryptoTrading #LiquidationHeatmap #liquidity #MarketAnalysis
Price is trading near 74.10, while the liquidation heatmap highlights an important liquidity zone around 70.81.
Here's what caught my attention:
📊 70.81: A significant liquidity area, with approximately $1.8M in long liquidations shown.
🐋 $10.92M swept: The chart highlights substantial liquidity swept around this level.
⚡ 74.00–74.50: The immediate area to watch as price approaches nearby resistance.
My Market View:
Price has recovered strongly after the sharp downside move. However, I want to see whether buyers can maintain momentum and push above nearby resistance.
A rejection could bring another pullback, while a confirmed breakout may open the door for further upside.
No blind entries. Watch volume, liquidity and confirmation before taking a trade.
What's next?
🐂 Bullish continuation
🐻 Another liquidity sweep
⏳ Sideways consolidation
#CryptoTrading #LiquidationHeatmap #liquidity #MarketAnalysis
2
223
·
--
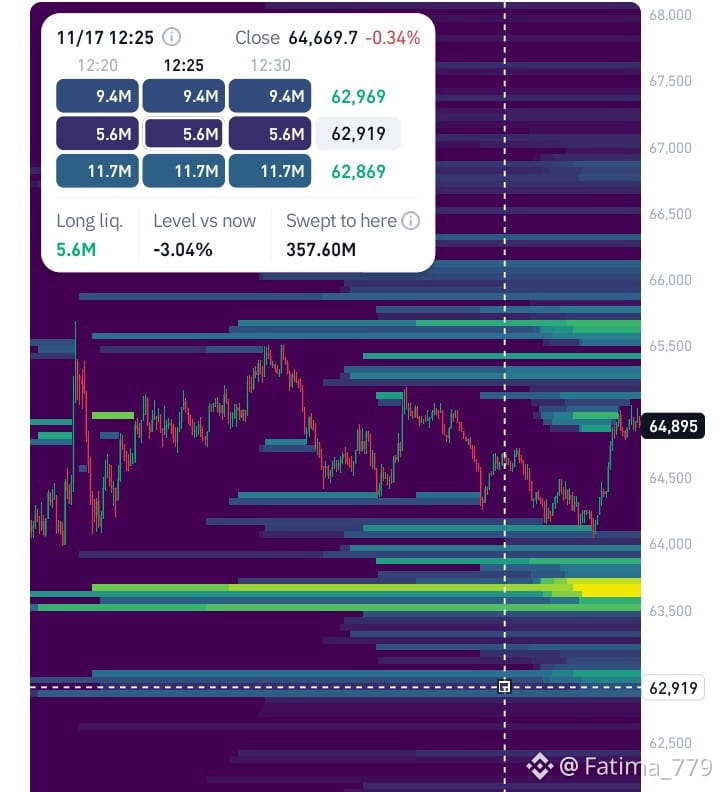
🚨 $BTC LIQUIDATION HEATMAP: Where Is Price Heading Next?
Bitcoin is currently trading around $64,895, and the liquidation heatmap is showing some interesting liquidity zones.
🔍 Key Levels to Watch:
🟢 $65,500–$65,800: Major liquidity cluster above the current price.
🟡 $63,500–$63,700: Strong liquidity concentration below the market.
🔻 $62,919: A notable liquidation level, with approximately $5.6M in long liquidations shown.
📊 My Observation:
BTC has recovered from the $64,000 area, but the liquidity above $65,500 could attract another move upward. On the other hand, a rejection near resistance could bring price back toward the lower liquidity zones.
Remember, liquidity clusters are potential price magnets, not guaranteed targets.
What's your expectation?
📈 BTC moves toward $65,500 first?
📉 Or does price sweep the $63,500 liquidity first?
#BTC #Bitcoin #LiquidationHeatmap #cryptotrading
{future}(BTCUSDT)
🚨 $BTC LIQUIDATION HEATMAP: Where Is Price Heading Next?
Bitcoin is currently trading around $64,895, and the liquidation heatmap is showing some interesting liquidity zones.
🔍 Key Levels to Watch:
🟢 $65,500–$65,800: Major liquidity cluster above the current price.
🟡 $63,500–$63,700: Strong liquidity concentration below the market.
🔻 $62,919: A notable liquidation level, with approximately $5.6M in long liquidations shown.
📊 My Observation:
BTC has recovered from the $64,000 area, but the liquidity above $65,500 could attract another move upward. On the other hand, a rejection near resistance could bring price back toward the lower liquidity zones.
Remember, liquidity clusters are potential price magnets, not guaranteed targets.
What's your expectation?
📈 BTC moves toward $65,500 first?
📉 Or does price sweep the $63,500 liquidity first?
#BTC #Bitcoin #LiquidationHeatmap #cryptotrading
Bitcoin is currently trading around $64,895, and the liquidation heatmap is showing some interesting liquidity zones.
🔍 Key Levels to Watch:
🟢 $65,500–$65,800: Major liquidity cluster above the current price.
🟡 $63,500–$63,700: Strong liquidity concentration below the market.
🔻 $62,919: A notable liquidation level, with approximately $5.6M in long liquidations shown.
📊 My Observation:
BTC has recovered from the $64,000 area, but the liquidity above $65,500 could attract another move upward. On the other hand, a rejection near resistance could bring price back toward the lower liquidity zones.
Remember, liquidity clusters are potential price magnets, not guaranteed targets.
What's your expectation?
📈 BTC moves toward $65,500 first?
📉 Or does price sweep the $63,500 liquidity first?
#BTC #Bitcoin #LiquidationHeatmap #cryptotrading
1
103

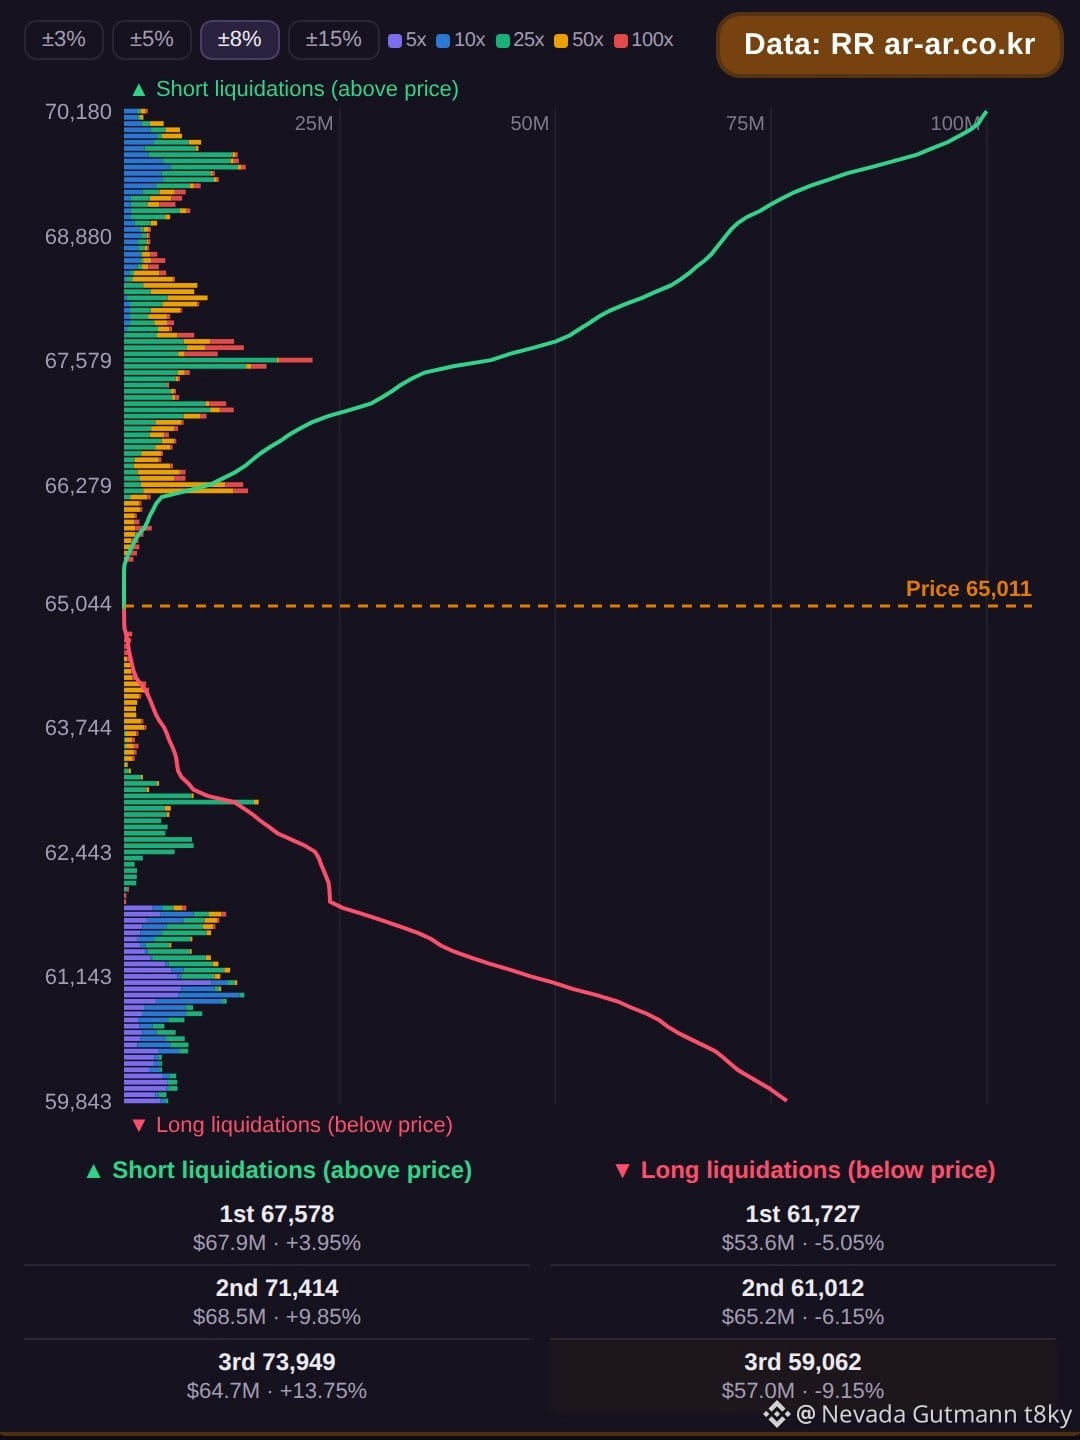
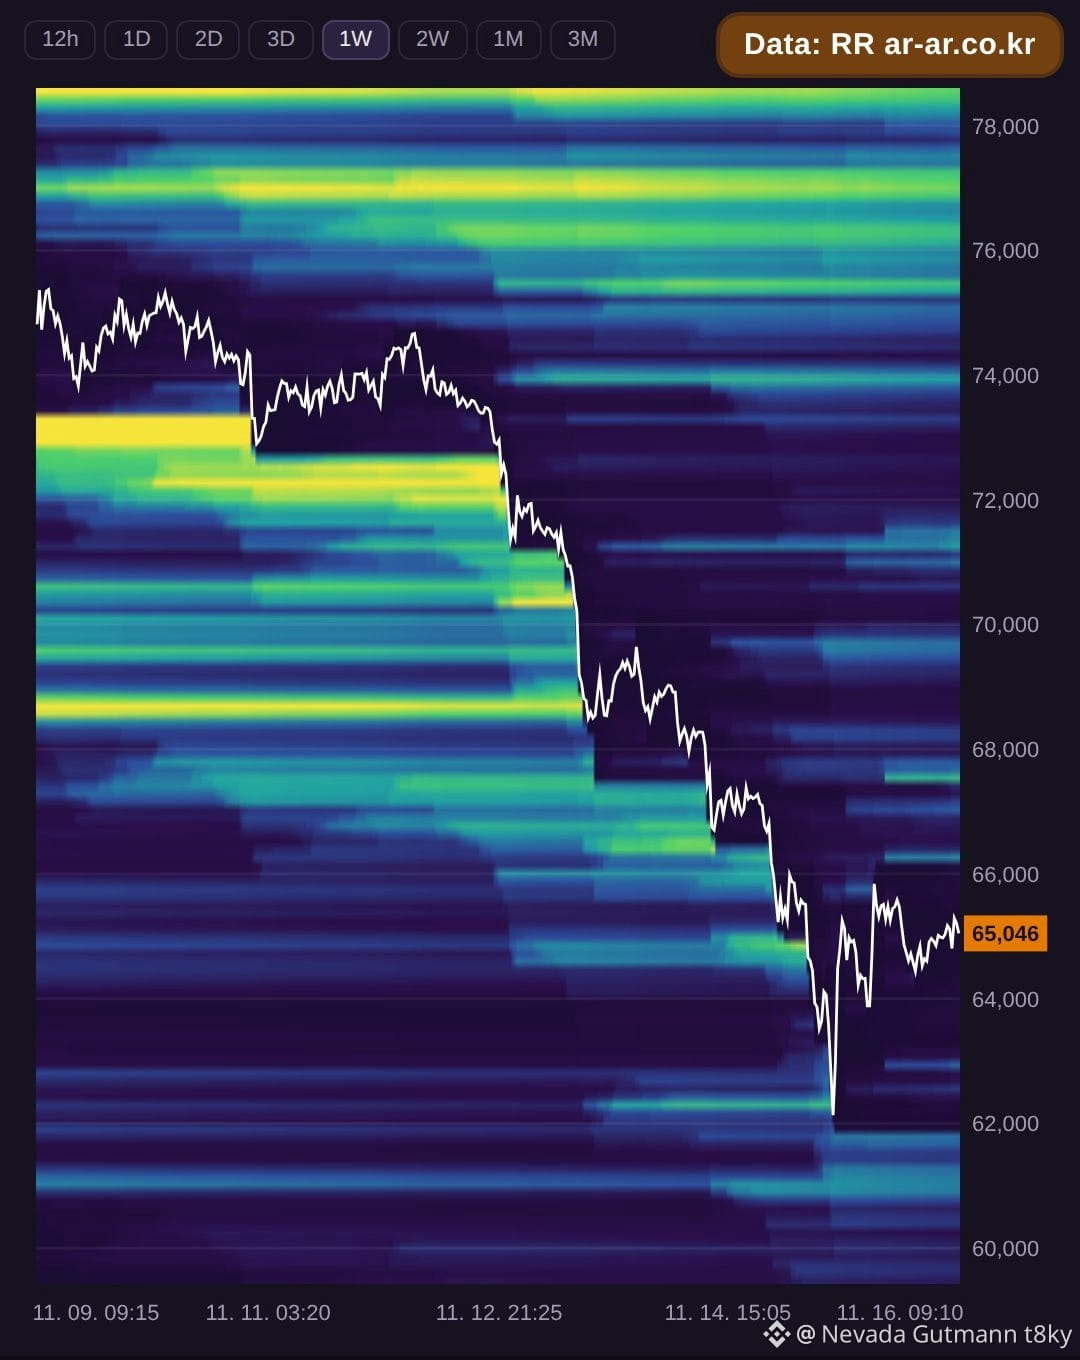
Bitcoin trades at $64,968 as of 00:30 UTC on November 16. The liquidation map shows a notable asymmetry in cluster positioning around current price.
Short liquidations sit above in three main zones. The nearest cluster is at $67,599, about $70.3M in size. Further up, $71,367 holds roughly $74.7M, while $73,966 contains approximately $64.6M. Combined, these three levels stack about $209.7M in estimated short liquidations.
Long liquidations below price are smaller overall. The first cluster appears at $61,752 with about $49.7M, followed by $60,973 holding roughly $63.3M. A third zone at $59,023 contains approximately $54.1M. These three total around $167.1M.
Shorts carry more volume and extend further from spot than longs. The nearest short cluster at $67,599 is +4.05% away, while the closest long cluster at $61,752 sits -4.95% below. Traders may watch whether price gravitates toward the heavier side or tests the closer downside levels first.
Data source: RR (ar-ar.co.kr). Estimated from BTCUSDT futures data. Not financial advice.
#BTC #Bitcoin #LiquidationMap #LiquidationHeatmap
Bitcoin trades at $64,968 as of 00:30 UTC on November 16. The liquidation map shows a notable asymmetry in cluster positioning around current price.
Short liquidations sit above in three main zones. The nearest cluster is at $67,599, about $70.3M in size. Further up, $71,367 holds roughly $74.7M, while $73,966 contains approximately $64.6M. Combined, these three levels stack about $209.7M in estimated short liquidations.
Long liquidations below price are smaller overall. The first cluster appears at $61,752 with about $49.7M, followed by $60,973 holding roughly $63.3M. A third zone at $59,023 contains approximately $54.1M. These three total around $167.1M.
Shorts carry more volume and extend further from spot than longs. The nearest short cluster at $67,599 is +4.05% away, while the closest long cluster at $61,752 sits -4.95% below. Traders may watch whether price gravitates toward the heavier side or tests the closer downside levels first.
Data source: RR (ar-ar.co.kr). Estimated from BTCUSDT futures data. Not financial advice.
#BTC #Bitcoin #LiquidationMap #LiquidationHeatmap
Short liquidations sit above in three main zones. The nearest cluster is at $67,599, about $70.3M in size. Further up, $71,367 holds roughly $74.7M, while $73,966 contains approximately $64.6M. Combined, these three levels stack about $209.7M in estimated short liquidations.
Long liquidations below price are smaller overall. The first cluster appears at $61,752 with about $49.7M, followed by $60,973 holding roughly $63.3M. A third zone at $59,023 contains approximately $54.1M. These three total around $167.1M.
Shorts carry more volume and extend further from spot than longs. The nearest short cluster at $67,599 is +4.05% away, while the closest long cluster at $61,752 sits -4.95% below. Traders may watch whether price gravitates toward the heavier side or tests the closer downside levels first.
Data source: RR (ar-ar.co.kr). Estimated from BTCUSDT futures data. Not financial advice.
#BTC #Bitcoin #LiquidationMap #LiquidationHeatmap
100
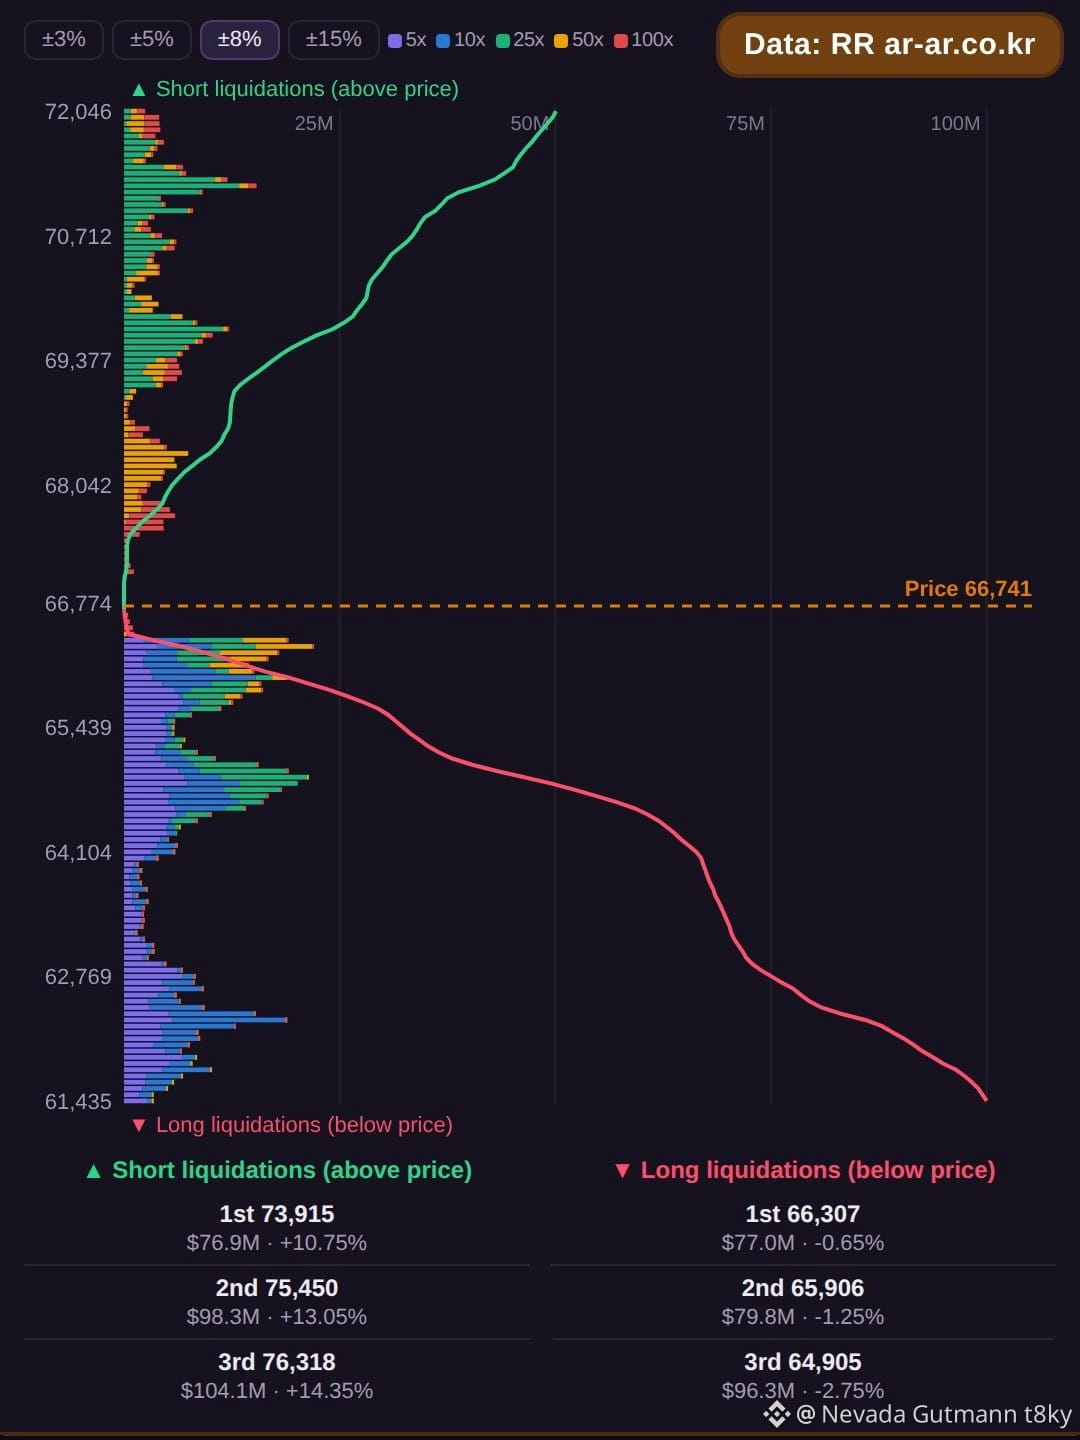
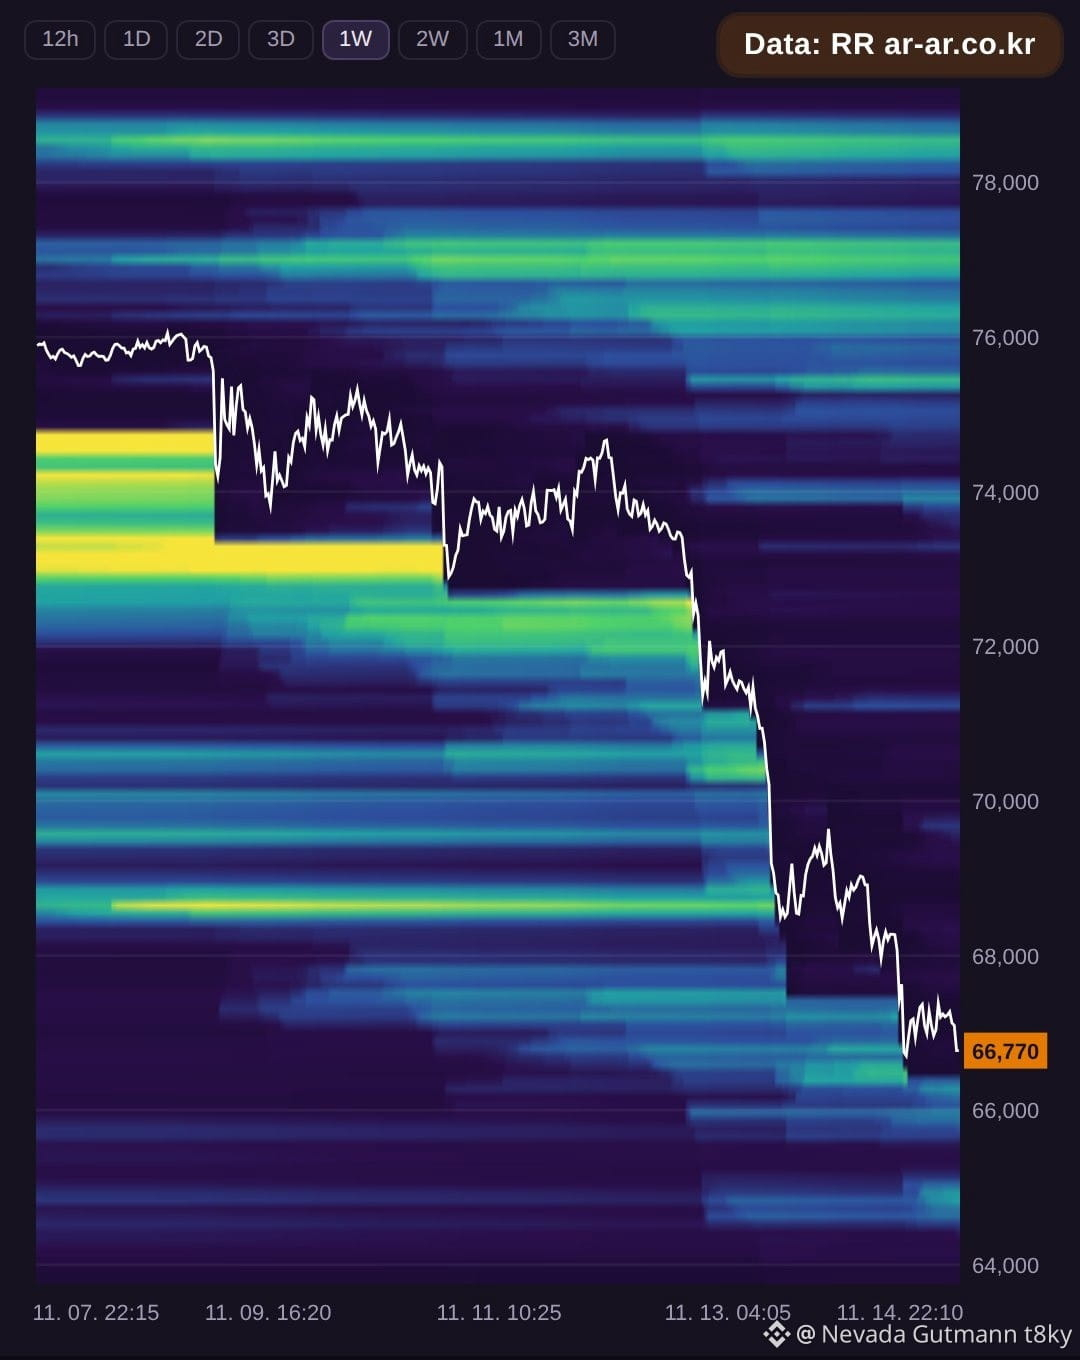
Bitcoin is trading at $66,651 as of 13:30 UTC on November 14. Short liquidations are stacked above the current price with the nearest cluster at $73,949, about $77.5M in size. Further up, $75,416 holds around $94.6M, and $76,282 shows approximately $105.1M. These three levels combined total $277.2M in estimated short liquidations.
On the downside, long liquidations begin very close to price. The $66,285 level sits just -0.55% away with about $84.0M. Below that, $65,885 contains roughly $83.1M, and $64,885 holds around $97.3M. The total for these three long clusters is $264.4M.
Long liquidations are much closer to the current price, while shorts are stacked higher up with slightly more volume overall. Traders may watch whether price moves toward the nearby long clusters or pushes higher into the short liquidation zone.
Data source: RR (ar-ar.co.kr). Estimated from BTCUSDT futures data. Not financial advice.
#BTC #Bitcoin #LiquidationMap #LiquidationHeatmap
Bitcoin is trading at $66,651 as of 13:30 UTC on November 14. Short liquidations are stacked above the current price with the nearest cluster at $73,949, about $77.5M in size. Further up, $75,416 holds around $94.6M, and $76,282 shows approximately $105.1M. These three levels combined total $277.2M in estimated short liquidations.
On the downside, long liquidations begin very close to price. The $66,285 level sits just -0.55% away with about $84.0M. Below that, $65,885 contains roughly $83.1M, and $64,885 holds around $97.3M. The total for these three long clusters is $264.4M.
Long liquidations are much closer to the current price, while shorts are stacked higher up with slightly more volume overall. Traders may watch whether price moves toward the nearby long clusters or pushes higher into the short liquidation zone.
Data source: RR (ar-ar.co.kr). Estimated from BTCUSDT futures data. Not financial advice.
#BTC #Bitcoin #LiquidationMap #LiquidationHeatmap
On the downside, long liquidations begin very close to price. The $66,285 level sits just -0.55% away with about $84.0M. Below that, $65,885 contains roughly $83.1M, and $64,885 holds around $97.3M. The total for these three long clusters is $264.4M.
Long liquidations are much closer to the current price, while shorts are stacked higher up with slightly more volume overall. Traders may watch whether price moves toward the nearby long clusters or pushes higher into the short liquidation zone.
Data source: RR (ar-ar.co.kr). Estimated from BTCUSDT futures data. Not financial advice.
#BTC #Bitcoin #LiquidationMap #LiquidationHeatmap
65
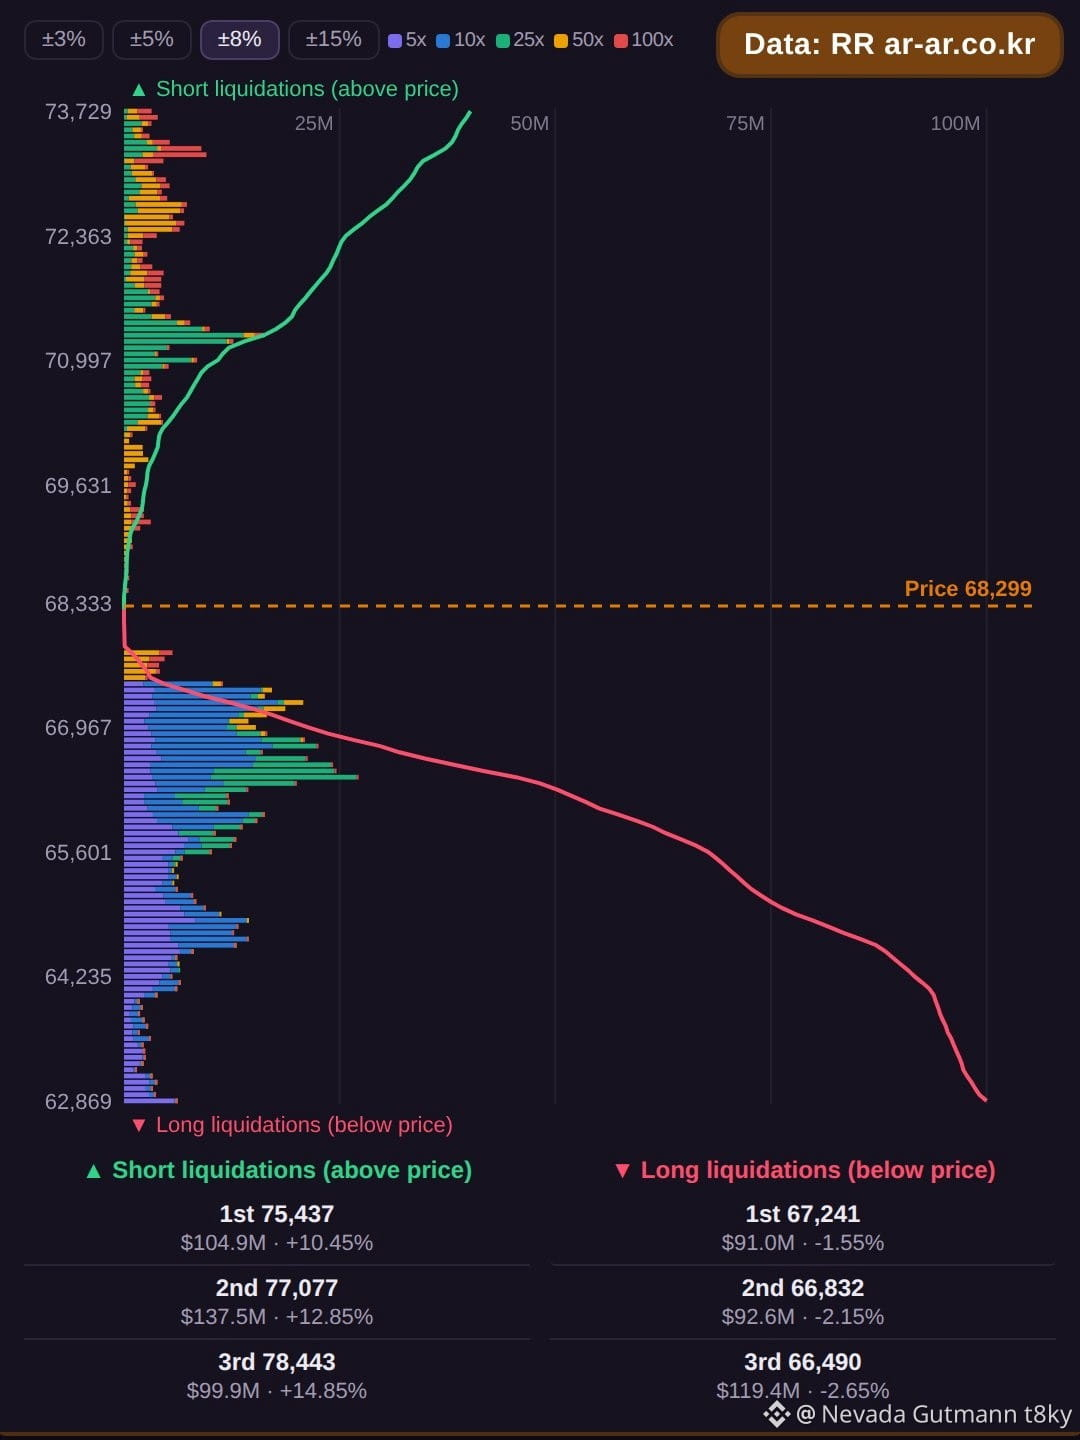
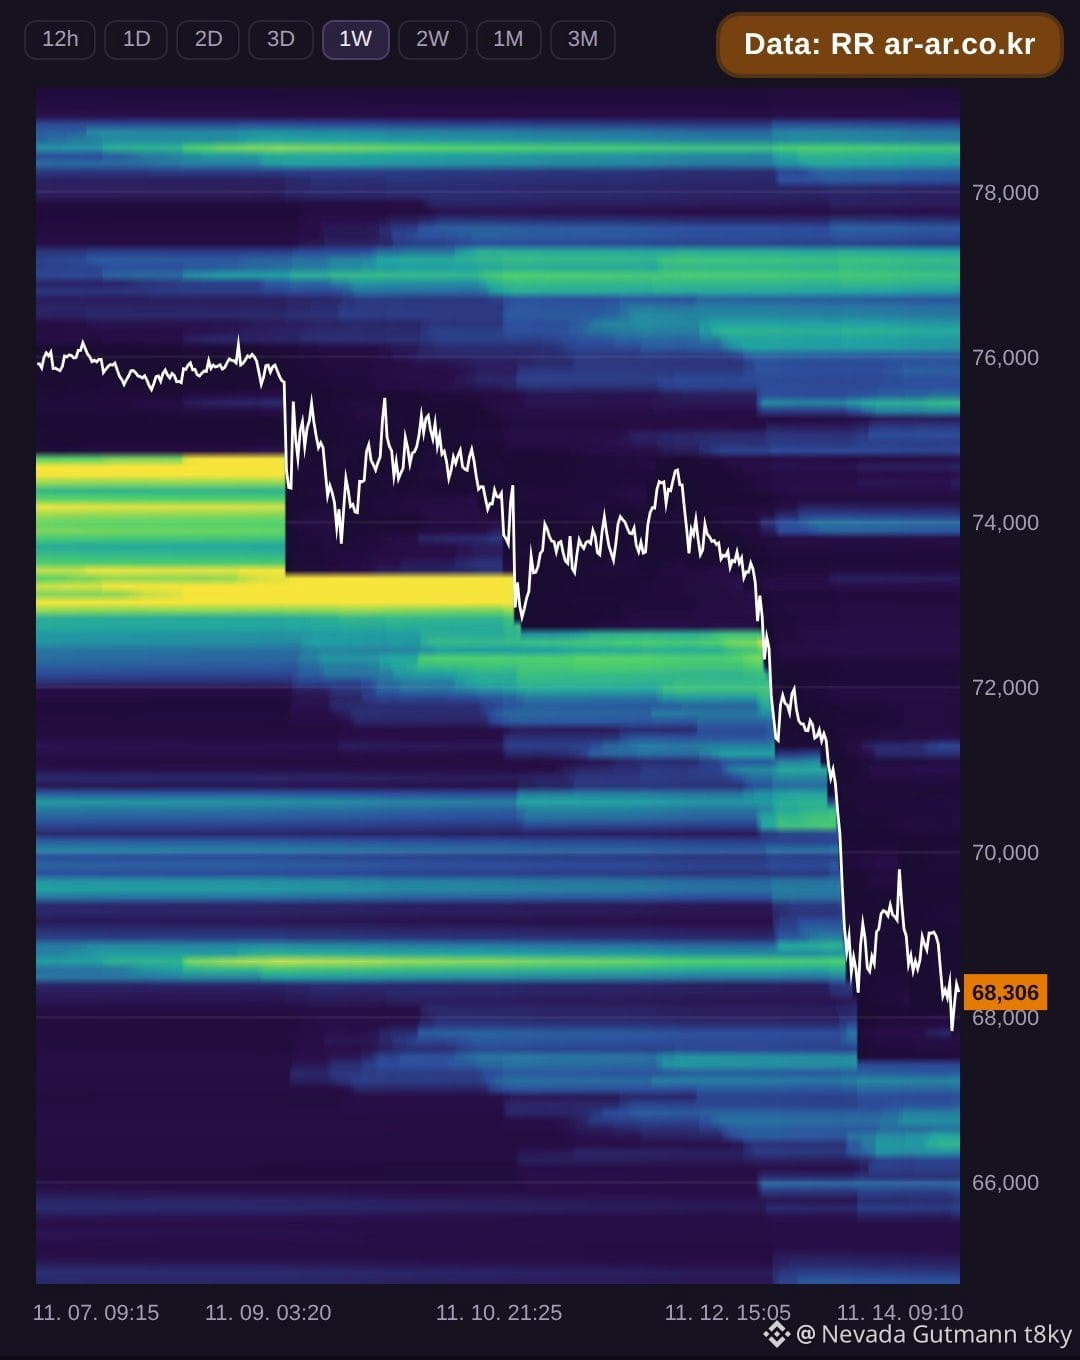
Bitcoin is trading at $68,303 as of 00:30 UTC on Nov 14. Short liquidations are stacked above the current price with significant volume at $75,441 showing about $105.2M, followed by $77,080 holding roughly $137.6M, and $78,446 with about $100.6M. These three levels combine for $343.4M in estimated short liquidations. On the downside, long liquidations sit at $67,176 with about $88.7M, then $66,493 carrying roughly $119.5M, and deeper at $62,327 with about $73.9M. The total for these long clusters comes to $282.1M. The nearest long cluster is only -1.65% away while the nearest short cluster sits +10.45% above price, though the short side holds considerably more volume overall. Traders may watch whether price pushes toward either concentration zone as volatility could increase near these liquidation levels.
Data source: RR (ar-ar.co.kr). Estimated from BTCUSDT futures data. Not financial advice.
#BTC #Bitcoin #LiquidationMap #LiquidationHeatmap
Bitcoin is trading at $68,303 as of 00:30 UTC on Nov 14. Short liquidations are stacked above the current price with significant volume at $75,441 showing about $105.2M, followed by $77,080 holding roughly $137.6M, and $78,446 with about $100.6M. These three levels combine for $343.4M in estimated short liquidations. On the downside, long liquidations sit at $67,176 with about $88.7M, then $66,493 carrying roughly $119.5M, and deeper at $62,327 with about $73.9M. The total for these long clusters comes to $282.1M. The nearest long cluster is only -1.65% away while the nearest short cluster sits +10.45% above price, though the short side holds considerably more volume overall. Traders may watch whether price pushes toward either concentration zone as volatility could increase near these liquidation levels.
Data source: RR (ar-ar.co.kr). Estimated from BTCUSDT futures data. Not financial advice.
#BTC #Bitcoin #LiquidationMap #LiquidationHeatmap
Data source: RR (ar-ar.co.kr). Estimated from BTCUSDT futures data. Not financial advice.
#BTC #Bitcoin #LiquidationMap #LiquidationHeatmap
110

·
--
Bullish
$BTC
{future}(BTCUSDT)
: which hits first, $85K or $65K? 🤔
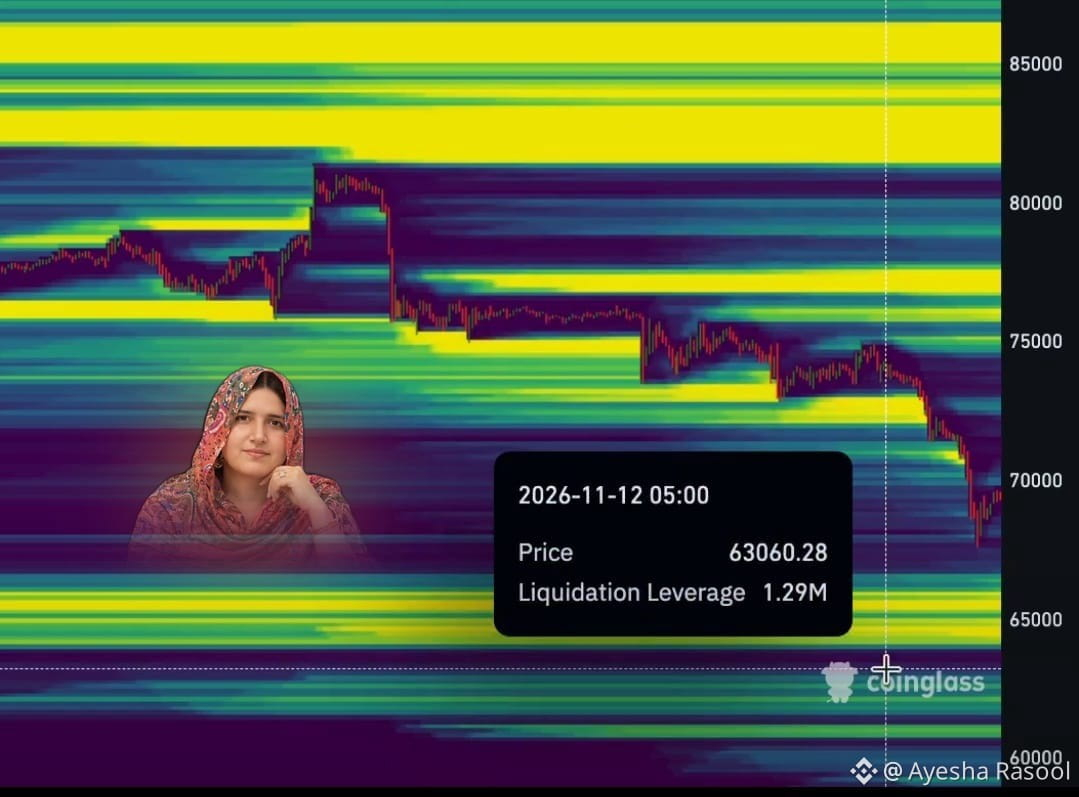
There's a big liquidity cluster below at $65K and an even bigger one above at $80K–$85K.
Price is at $69K, much closer to $65K.
My bet: $65K gets swept first, then the run toward $85K.
What's your pick?
#BTC #Bitcoin #LiquidationHeatmap #CryptoAnalysis
$BTC
: which hits first, $85K or $65K? 🤔
There's a big liquidity cluster below at $65K and an even bigger one above at $80K–$85K.
Price is at $69K, much closer to $65K.
My bet: $65K gets swept first, then the run toward $85K.
What's your pick?
#BTC #Bitcoin #LiquidationHeatmap #CryptoAnalysis
: which hits first, $85K or $65K? 🤔
There's a big liquidity cluster below at $65K and an even bigger one above at $80K–$85K.
Price is at $69K, much closer to $65K.
My bet: $65K gets swept first, then the run toward $85K.
What's your pick?
#BTC #Bitcoin #LiquidationHeatmap #CryptoAnalysis
4
186
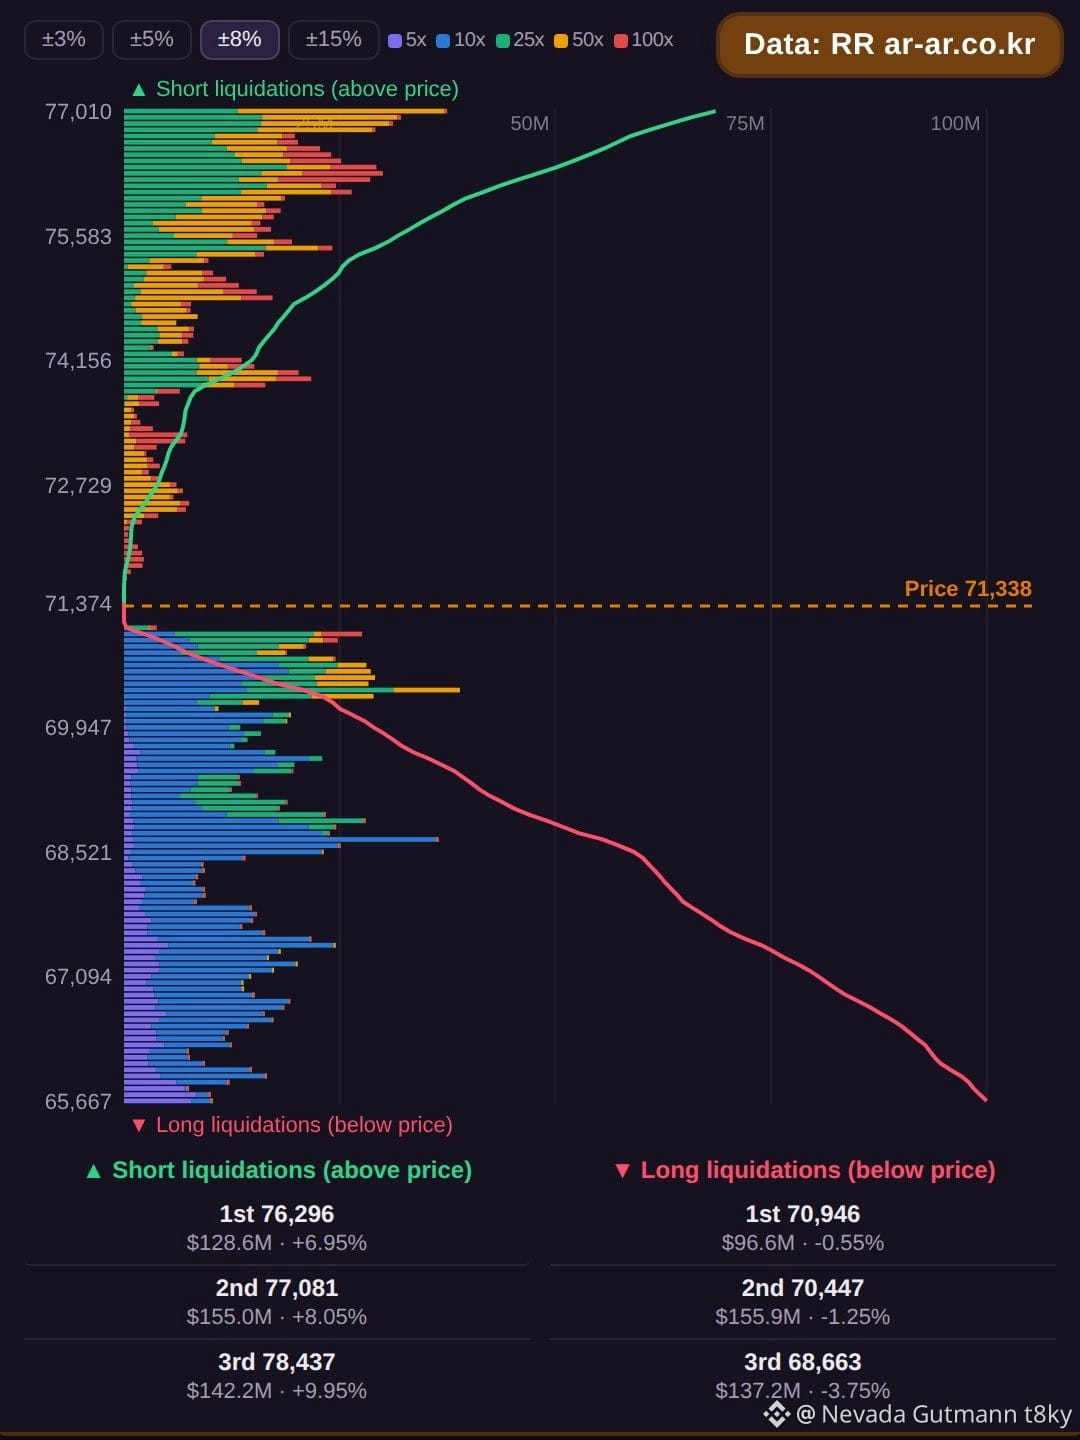
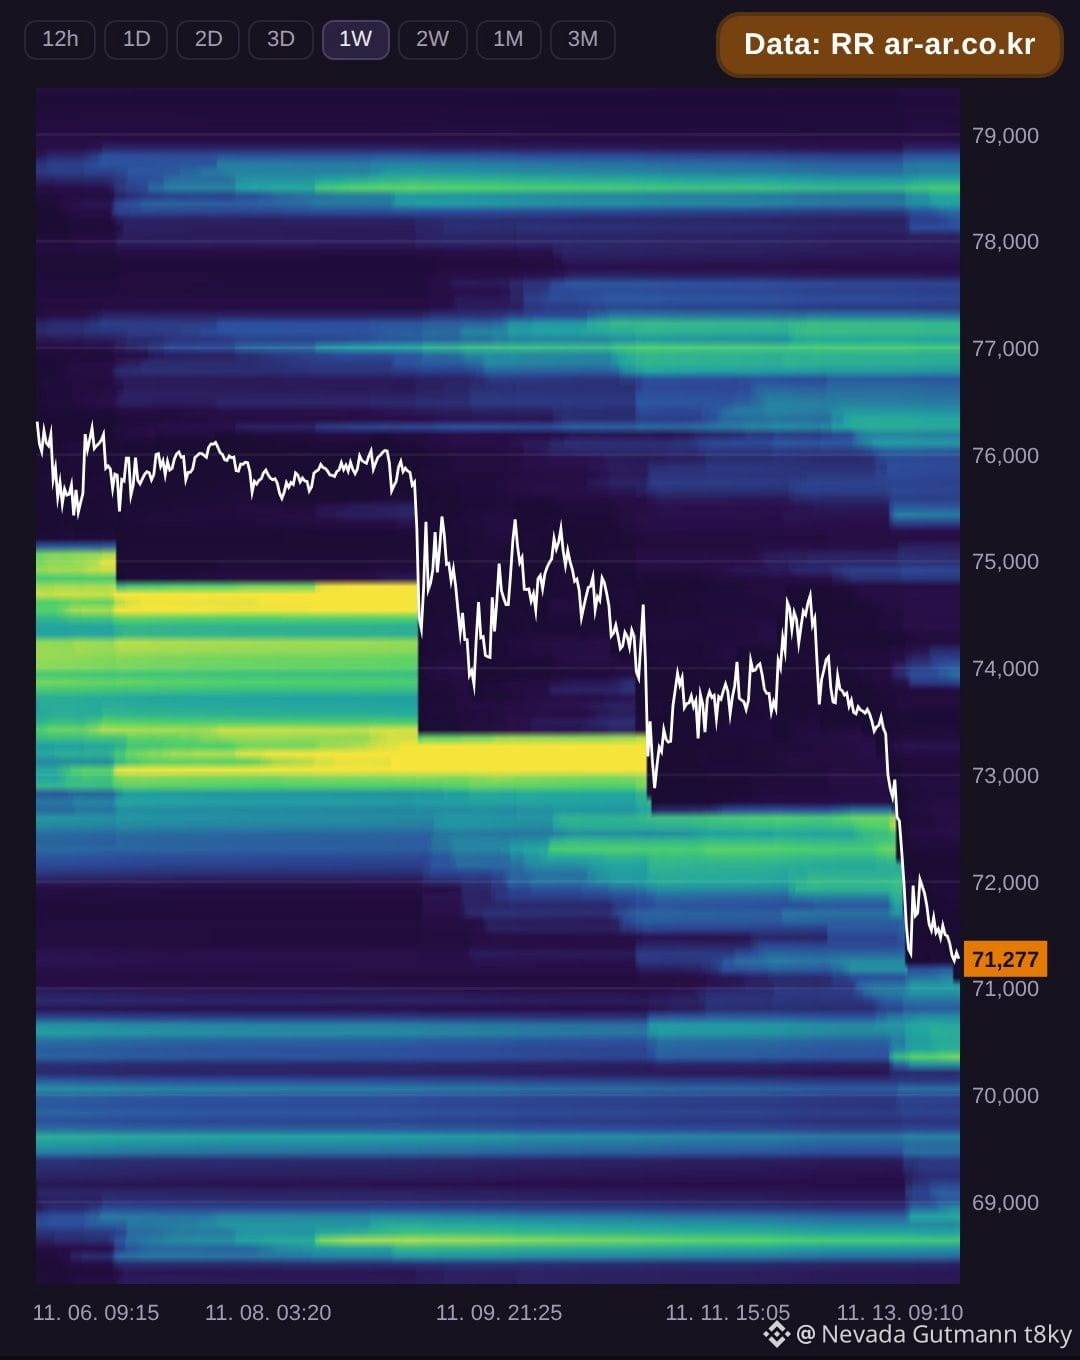
Checking the liquidation maps at 00:30 UTC. Bitcoin is currently trading at $71,188.
Above current price, short liquidations are stacked. The first cluster is at $76,278, estimated at about $130.1M. Higher up, we see $153.6M at $77,061 and another $144.0M at $78,484. The total for these three short clusters is $427.7M.
Below current price, long liquidations are present. The nearest cluster is at $70,939, about $98.8M. Further down, there is $155.1M at $70,440 and $136.7M at $68,661. These three long clusters total $390.7M.
Long liquidations are closer to the current price at $70,939. However, the total estimated short liquidation volume above is larger. Traders may watch these zones for potential price reactions.
Data source: RR (ar-ar.co.kr). Estimated from BTCUSDT futures data. Not financial advice.
#BTC #Bitcoin #LiquidationMap #LiquidationHeatmap
Checking the liquidation maps at 00:30 UTC. Bitcoin is currently trading at $71,188.
Above current price, short liquidations are stacked. The first cluster is at $76,278, estimated at about $130.1M. Higher up, we see $153.6M at $77,061 and another $144.0M at $78,484. The total for these three short clusters is $427.7M.
Below current price, long liquidations are present. The nearest cluster is at $70,939, about $98.8M. Further down, there is $155.1M at $70,440 and $136.7M at $68,661. These three long clusters total $390.7M.
Long liquidations are closer to the current price at $70,939. However, the total estimated short liquidation volume above is larger. Traders may watch these zones for potential price reactions.
Data source: RR (ar-ar.co.kr). Estimated from BTCUSDT futures data. Not financial advice.
#BTC #Bitcoin #LiquidationMap #LiquidationHeatmap
Above current price, short liquidations are stacked. The first cluster is at $76,278, estimated at about $130.1M. Higher up, we see $153.6M at $77,061 and another $144.0M at $78,484. The total for these three short clusters is $427.7M.
Below current price, long liquidations are present. The nearest cluster is at $70,939, about $98.8M. Further down, there is $155.1M at $70,440 and $136.7M at $68,661. These three long clusters total $390.7M.
Long liquidations are closer to the current price at $70,939. However, the total estimated short liquidation volume above is larger. Traders may watch these zones for potential price reactions.
Data source: RR (ar-ar.co.kr). Estimated from BTCUSDT futures data. Not financial advice.
#BTC #Bitcoin #LiquidationMap #LiquidationHeatmap
129
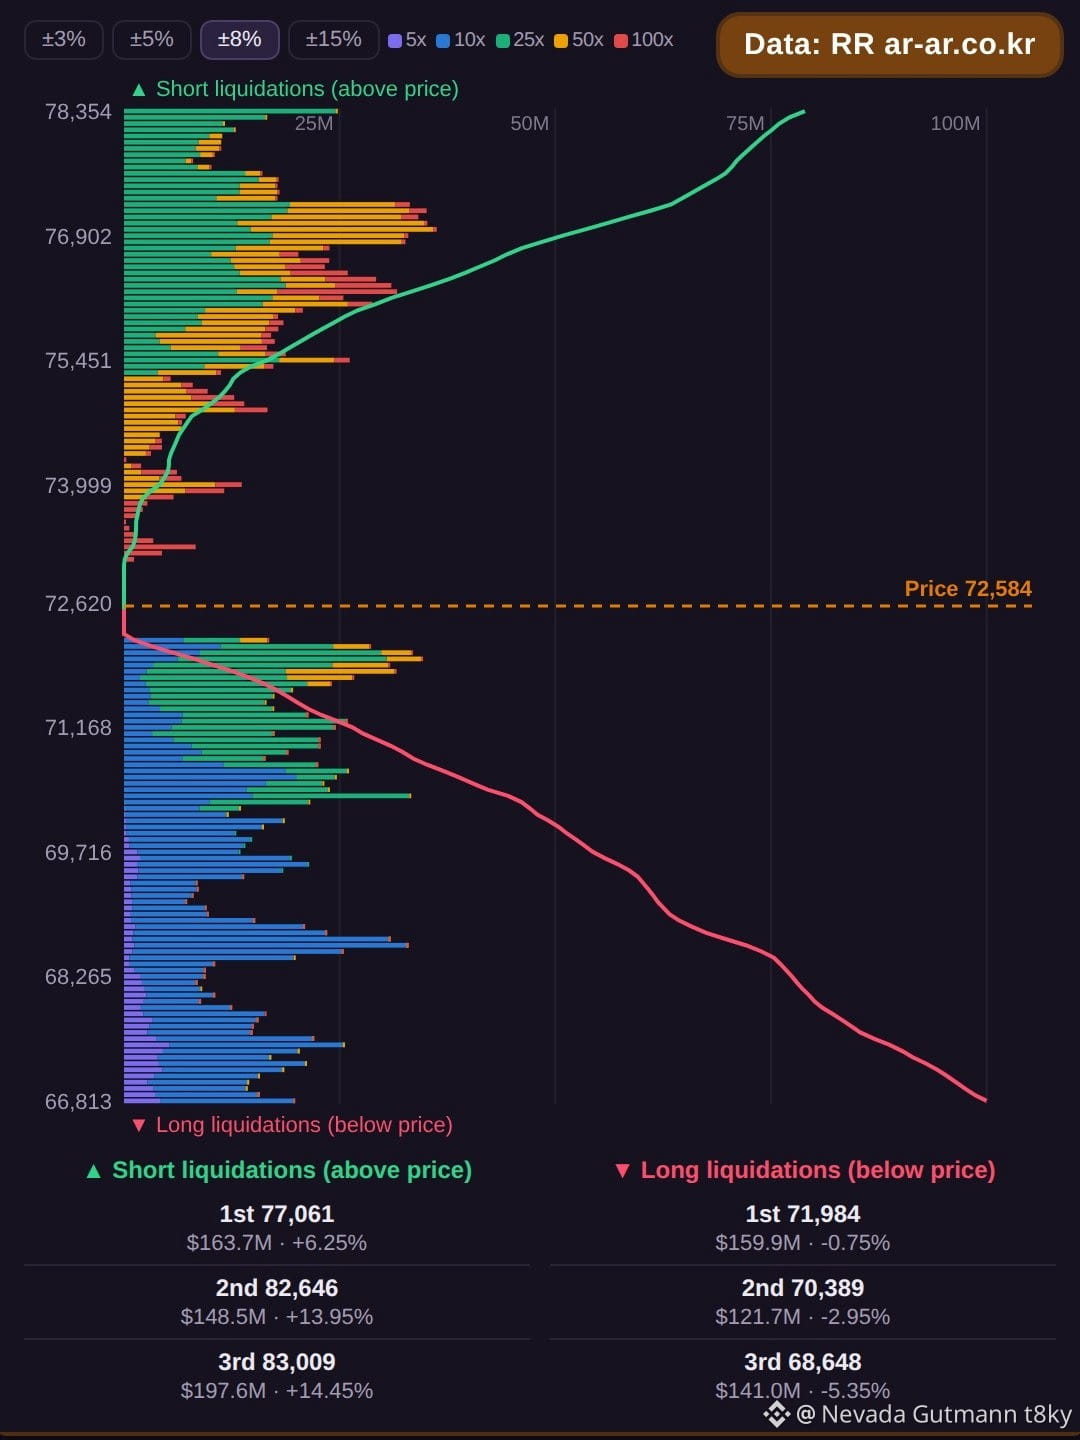
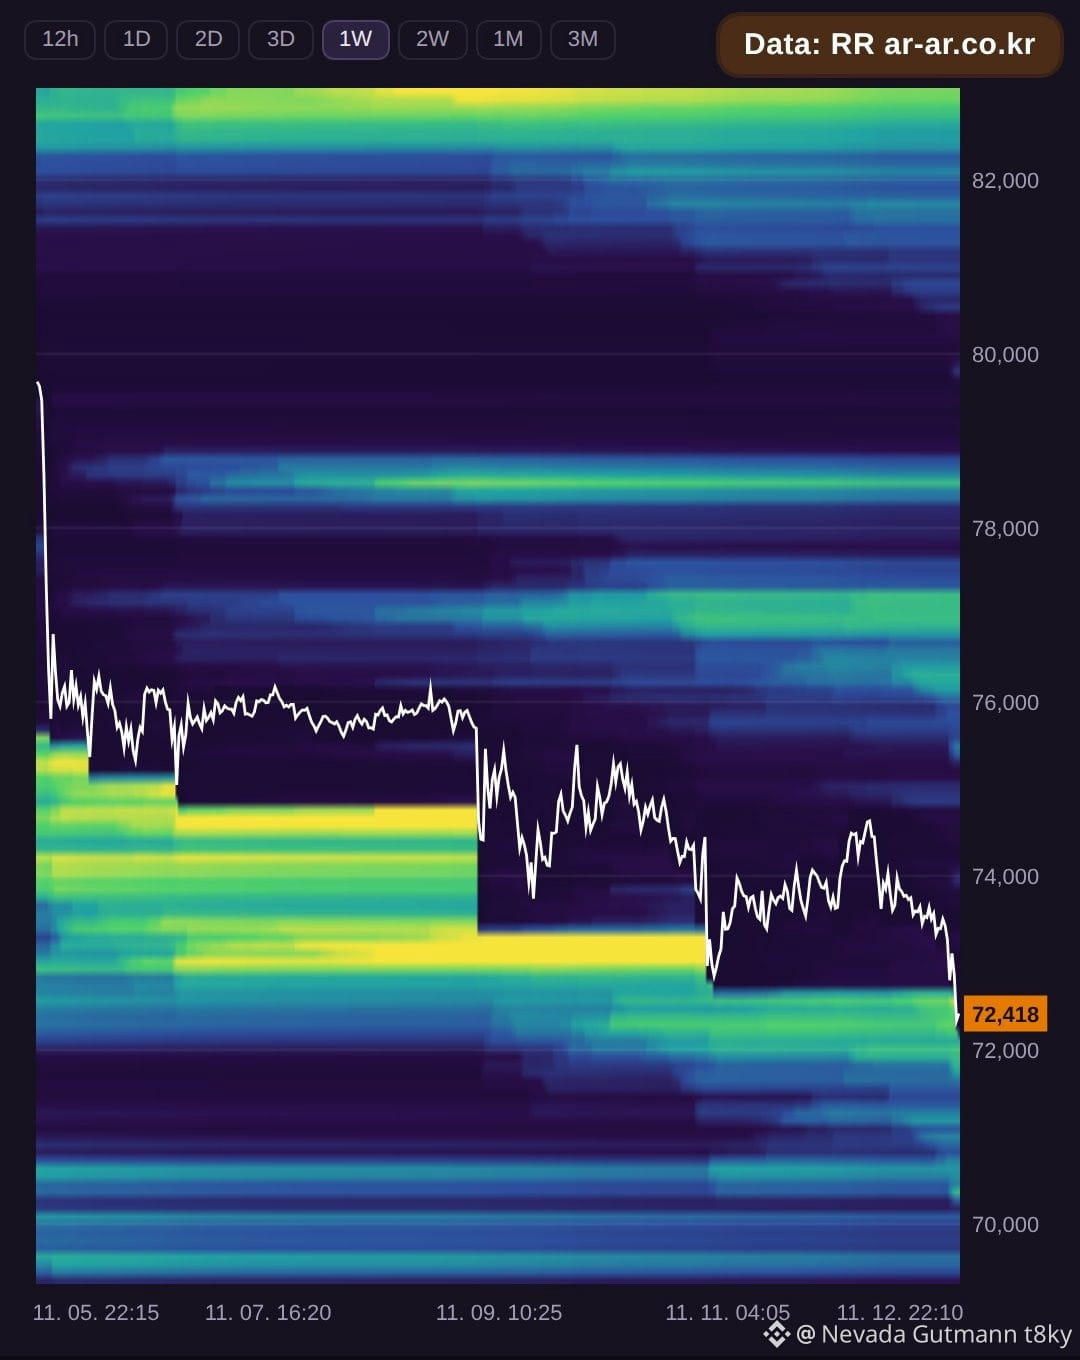
Liquidation map update for BTC. Price is currently $72,598.
Above current price, short liquidations are stacked. Significant levels are $77,063 (+6.15% from price), accounting for about $164.1M. Higher up, we see $82,653 (+13.85% from price) with about $149.7M, and $83,016 (+14.35% from price) with about $197.8M. The total estimated short liquidation volume for these three clusters is $511.6M.
Below price, long liquidations are present. The nearest level is $71,981 (-0.85% from price), about $161.2M. Also notable are $70,384 (-3.05% from price) with about $121.0M, and $68,641 (-5.45% from price) representing about $140.7M. These three long clusters total $422.9M.
Long liquidations are closer to the current price. However, the total short liquidation volume above is larger. Traders may watch how price interacts with these levels.
Data source: RR (ar-ar.co.kr). Estimated from BTCUSDT futures data. Not financial advice.
#BTC #Bitcoin #LiquidationMap #LiquidationHeatmap
Liquidation map update for BTC. Price is currently $72,598.
Above current price, short liquidations are stacked. Significant levels are $77,063 (+6.15% from price), accounting for about $164.1M. Higher up, we see $82,653 (+13.85% from price) with about $149.7M, and $83,016 (+14.35% from price) with about $197.8M. The total estimated short liquidation volume for these three clusters is $511.6M.
Below price, long liquidations are present. The nearest level is $71,981 (-0.85% from price), about $161.2M. Also notable are $70,384 (-3.05% from price) with about $121.0M, and $68,641 (-5.45% from price) representing about $140.7M. These three long clusters total $422.9M.
Long liquidations are closer to the current price. However, the total short liquidation volume above is larger. Traders may watch how price interacts with these levels.
Data source: RR (ar-ar.co.kr). Estimated from BTCUSDT futures data. Not financial advice.
#BTC #Bitcoin #LiquidationMap #LiquidationHeatmap
Above current price, short liquidations are stacked. Significant levels are $77,063 (+6.15% from price), accounting for about $164.1M. Higher up, we see $82,653 (+13.85% from price) with about $149.7M, and $83,016 (+14.35% from price) with about $197.8M. The total estimated short liquidation volume for these three clusters is $511.6M.
Below price, long liquidations are present. The nearest level is $71,981 (-0.85% from price), about $161.2M. Also notable are $70,384 (-3.05% from price) with about $121.0M, and $68,641 (-5.45% from price) representing about $140.7M. These three long clusters total $422.9M.
Long liquidations are closer to the current price. However, the total short liquidation volume above is larger. Traders may watch how price interacts with these levels.
Data source: RR (ar-ar.co.kr). Estimated from BTCUSDT futures data. Not financial advice.
#BTC #Bitcoin #LiquidationMap #LiquidationHeatmap
227
·
--
Bullish
$BTC
{future}(BTCUSDT)
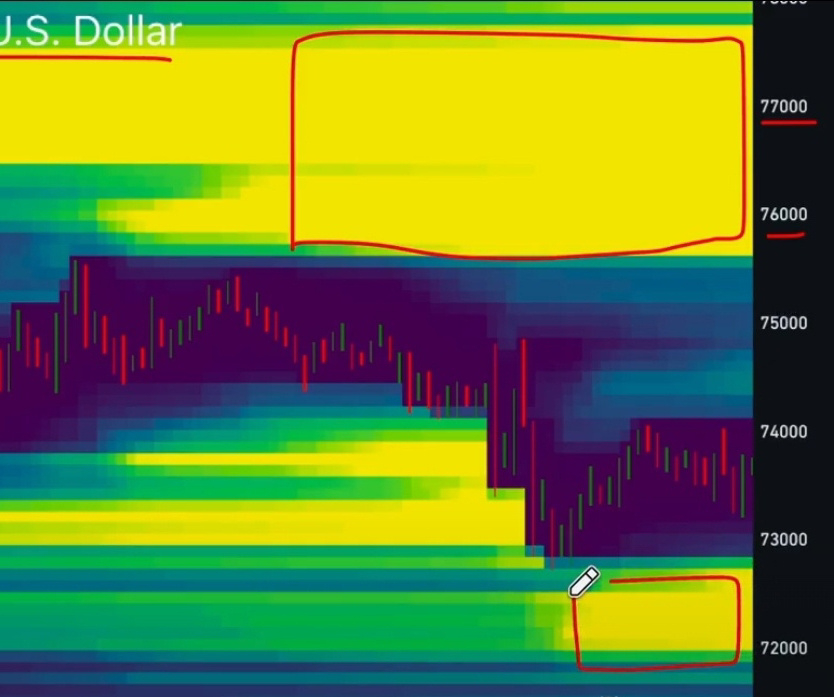
liquidation heatmap 🔥
Big liquidity cluster sitting above at $76,000 – $77,000.
Smaller pocket below at $72,000 – $72,600.
Price is at $73,700. The bigger magnet is above.
#BTC #Bitcoin #LiquidationHeatmap #CryptoAnalysis
$BTC
liquidation heatmap 🔥
Big liquidity cluster sitting above at $76,000 – $77,000.
Smaller pocket below at $72,000 – $72,600.
Price is at $73,700. The bigger magnet is above.
#BTC #Bitcoin #LiquidationHeatmap #CryptoAnalysis
liquidation heatmap 🔥
Big liquidity cluster sitting above at $76,000 – $77,000.
Smaller pocket below at $72,000 – $72,600.
Price is at $73,700. The bigger magnet is above.
#BTC #Bitcoin #LiquidationHeatmap #CryptoAnalysis
Crypto Scientist Expert44:
i follows you please follows me back
27
1
30
33.4k

·
--
🚨 $BTC Liquidity & Heatmap Breakdown: Short Squeeze Loading? 🚨
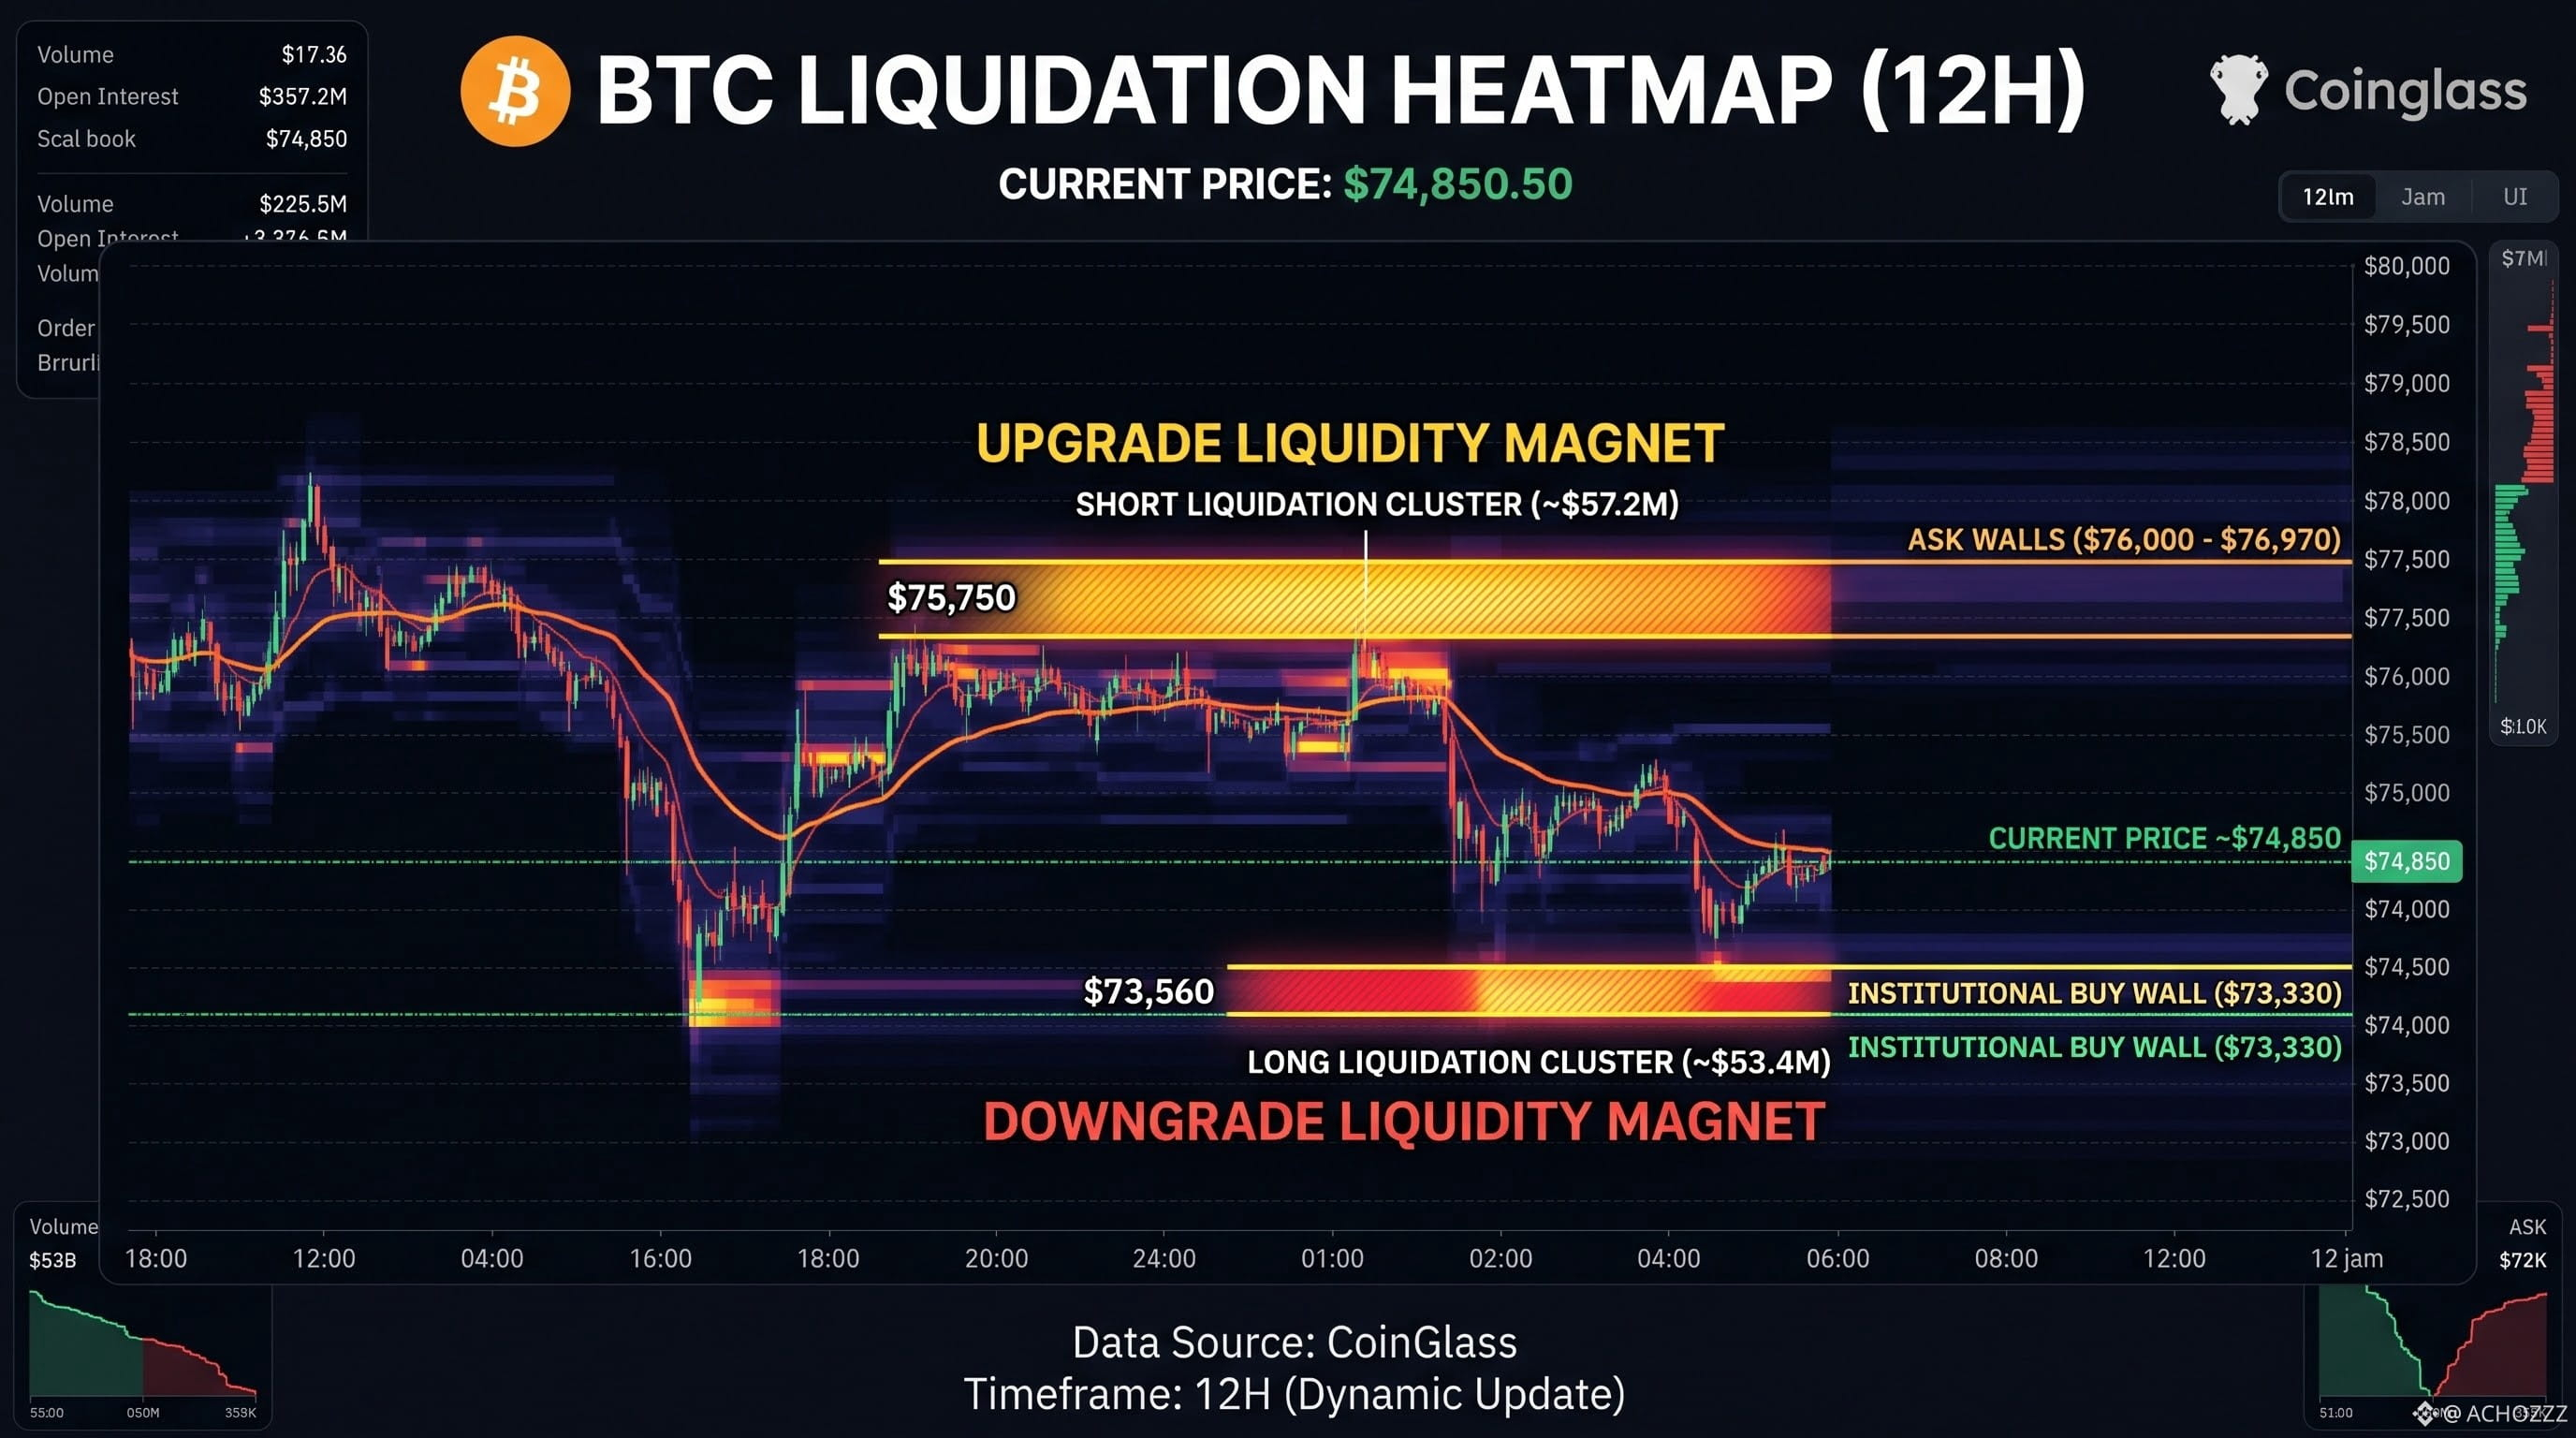
Bitcoin ($BTC) is compressing tightly in the $74,600 – $75,000 equilibrium zone. While retail sentiment remains fearful (F&G: 30), institutional orderflow and CoinGlass derivatives data reveal a classic divergence:
📊 Derivatives vs. Spot Orderflow:
• Futures Short Build-up: Rising Open Interest ($52.2B) paired with sub-1.0 Taker Buy/Sell ratios (0.97) confirms aggressive late shorting below $75K.
• Spot Absorption: While futures bleed, Spot CVD shows +$94.2M net taker buying—smart money is quietly absorbing sell pressure.
• Reset Funding: OI-weighted funding sits cool at ~0.0085% (below 0.01% baseline). Over-leveraged longs have already been flushed.
🧲 Key CoinGlass Liquidity Magnets (12H Timeframe):
• Upside Squeeze Trigger (UPGRADE LIQUIDITY MAGNET): $75,750 (~$57.2M Short Liquidation cluster). Reclaiming $76K clears heavy ask walls ($18.9M) and opens a fast move toward $77K–$80K.
• Downside Liquidity Sweep (DOWNGRADE LIQUIDITY MAGNET): $73,560 (~$53.4M Long Liquidation pool) backed by a massive $73,330 institutional buy wall ($25M).
🎯 Execution Plan:
Watch for a fakeout sweep into $73.5K–$73.9K to trap late shorts, or a high-volume spot reclaim above $75,750 to ride the short squeeze. Patience over over-leverage.
Where do you think $BTC hunts liquidity first—$75.7K or $73.5K? 👇
#BTC #CryptoTrading #BinanceFutures #Orderflow #LiquidationHeatmap
🚨 $BTC Liquidity & Heatmap Breakdown: Short Squeeze Loading? 🚨
Bitcoin ($BTC) is compressing tightly in the $74,600 – $75,000 equilibrium zone. While retail sentiment remains fearful (F&G: 30), institutional orderflow and CoinGlass derivatives data reveal a classic divergence:
📊 Derivatives vs. Spot Orderflow:
• Futures Short Build-up: Rising Open Interest ($52.2B) paired with sub-1.0 Taker Buy/Sell ratios (0.97) confirms aggressive late shorting below $75K.
• Spot Absorption: While futures bleed, Spot CVD shows +$94.2M net taker buying—smart money is quietly absorbing sell pressure.
• Reset Funding: OI-weighted funding sits cool at ~0.0085% (below 0.01% baseline). Over-leveraged longs have already been flushed.
🧲 Key CoinGlass Liquidity Magnets (12H Timeframe):
• Upside Squeeze Trigger (UPGRADE LIQUIDITY MAGNET): $75,750 (~$57.2M Short Liquidation cluster). Reclaiming $76K clears heavy ask walls ($18.9M) and opens a fast move toward $77K–$80K.
• Downside Liquidity Sweep (DOWNGRADE LIQUIDITY MAGNET): $73,560 (~$53.4M Long Liquidation pool) backed by a massive $73,330 institutional buy wall ($25M).
🎯 Execution Plan:
Watch for a fakeout sweep into $73.5K–$73.9K to trap late shorts, or a high-volume spot reclaim above $75,750 to ride the short squeeze. Patience over over-leverage.
Where do you think $BTC hunts liquidity first—$75.7K or $73.5K? 👇
#BTC #CryptoTrading #BinanceFutures #Orderflow #LiquidationHeatmap
Bitcoin ($BTC) is compressing tightly in the $74,600 – $75,000 equilibrium zone. While retail sentiment remains fearful (F&G: 30), institutional orderflow and CoinGlass derivatives data reveal a classic divergence:
📊 Derivatives vs. Spot Orderflow:
• Futures Short Build-up: Rising Open Interest ($52.2B) paired with sub-1.0 Taker Buy/Sell ratios (0.97) confirms aggressive late shorting below $75K.
• Spot Absorption: While futures bleed, Spot CVD shows +$94.2M net taker buying—smart money is quietly absorbing sell pressure.
• Reset Funding: OI-weighted funding sits cool at ~0.0085% (below 0.01% baseline). Over-leveraged longs have already been flushed.
🧲 Key CoinGlass Liquidity Magnets (12H Timeframe):
• Upside Squeeze Trigger (UPGRADE LIQUIDITY MAGNET): $75,750 (~$57.2M Short Liquidation cluster). Reclaiming $76K clears heavy ask walls ($18.9M) and opens a fast move toward $77K–$80K.
• Downside Liquidity Sweep (DOWNGRADE LIQUIDITY MAGNET): $73,560 (~$53.4M Long Liquidation pool) backed by a massive $73,330 institutional buy wall ($25M).
🎯 Execution Plan:
Watch for a fakeout sweep into $73.5K–$73.9K to trap late shorts, or a high-volume spot reclaim above $75,750 to ride the short squeeze. Patience over over-leverage.
Where do you think $BTC hunts liquidity first—$75.7K or $73.5K? 👇
#BTC #CryptoTrading #BinanceFutures #Orderflow #LiquidationHeatmap
88
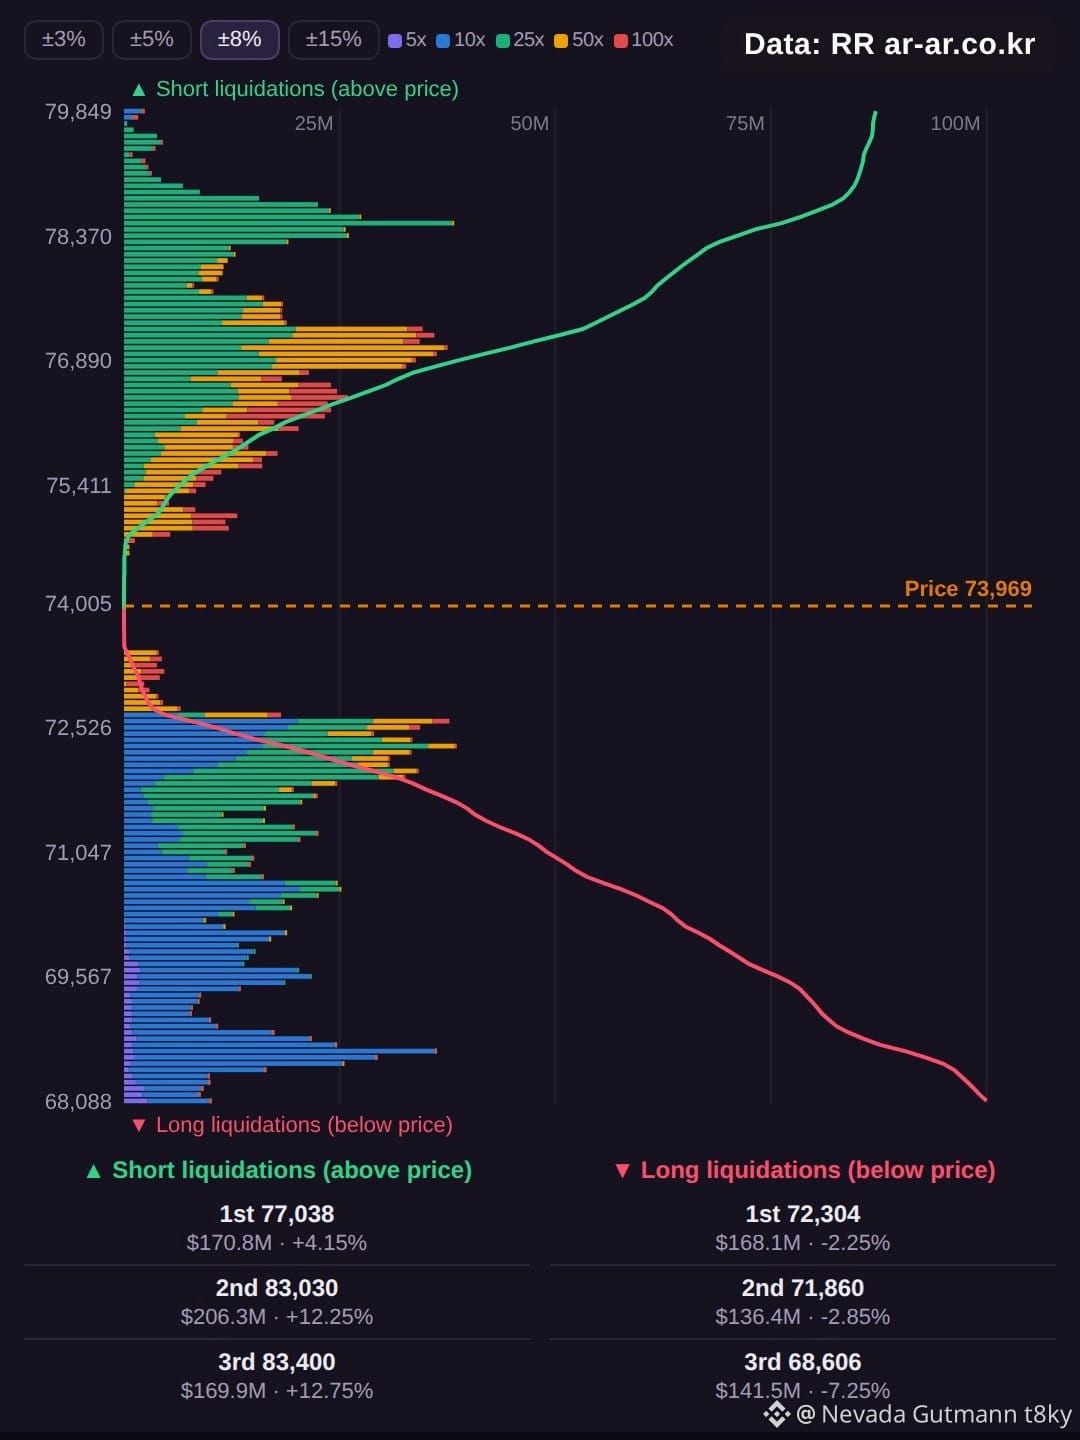
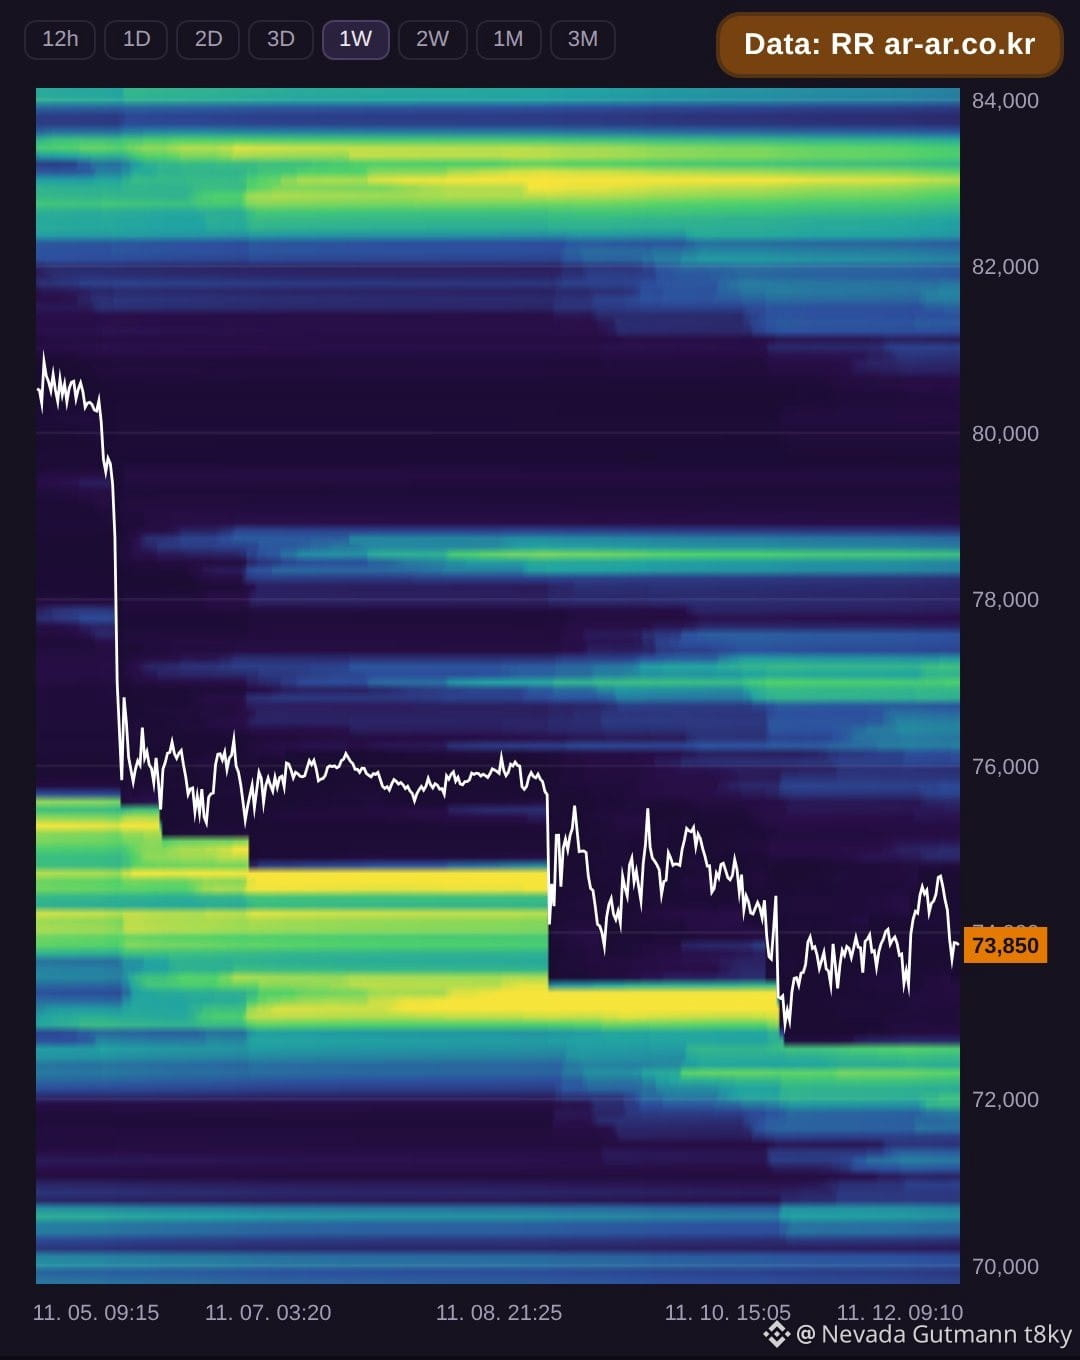
Here's a look at the Bitcoin liquidation map with BTC at $74,086. Above current price, short liquidations are stacked. The nearest cluster is at $77,086 (+4.05%) with about $173.2M. Further up, $83,013 (+12.05%) holds around $207.4M, and $83,383 (+12.55%) has about $172.2M. The total for these three short clusters is $552.8M.
Below price, long liquidations are present. The closest level is $72,641 (-1.95%) with about $115.5M. Deeper down, $72,271 (-2.45%) shows about $167.8M, and $68,640 (-7.35%) has approximately $146.6M. The total for these three long clusters is $429.9M.
Longs are notably closer to the current price. However, the aggregated short liquidation volume is larger overall. Traders may watch these levels for potential liquidity draws.
Data source: RR (ar-ar.co.kr). Estimated from BTCUSDT futures data. Not financial advice.
#BTC #Bitcoin #LiquidationMap #LiquidationHeatmap
Here's a look at the Bitcoin liquidation map with BTC at $74,086. Above current price, short liquidations are stacked. The nearest cluster is at $77,086 (+4.05%) with about $173.2M. Further up, $83,013 (+12.05%) holds around $207.4M, and $83,383 (+12.55%) has about $172.2M. The total for these three short clusters is $552.8M.
Below price, long liquidations are present. The closest level is $72,641 (-1.95%) with about $115.5M. Deeper down, $72,271 (-2.45%) shows about $167.8M, and $68,640 (-7.35%) has approximately $146.6M. The total for these three long clusters is $429.9M.
Longs are notably closer to the current price. However, the aggregated short liquidation volume is larger overall. Traders may watch these levels for potential liquidity draws.
Data source: RR (ar-ar.co.kr). Estimated from BTCUSDT futures data. Not financial advice.
#BTC #Bitcoin #LiquidationMap #LiquidationHeatmap
Below price, long liquidations are present. The closest level is $72,641 (-1.95%) with about $115.5M. Deeper down, $72,271 (-2.45%) shows about $167.8M, and $68,640 (-7.35%) has approximately $146.6M. The total for these three long clusters is $429.9M.
Longs are notably closer to the current price. However, the aggregated short liquidation volume is larger overall. Traders may watch these levels for potential liquidity draws.
Data source: RR (ar-ar.co.kr). Estimated from BTCUSDT futures data. Not financial advice.
#BTC #Bitcoin #LiquidationMap #LiquidationHeatmap
1
245

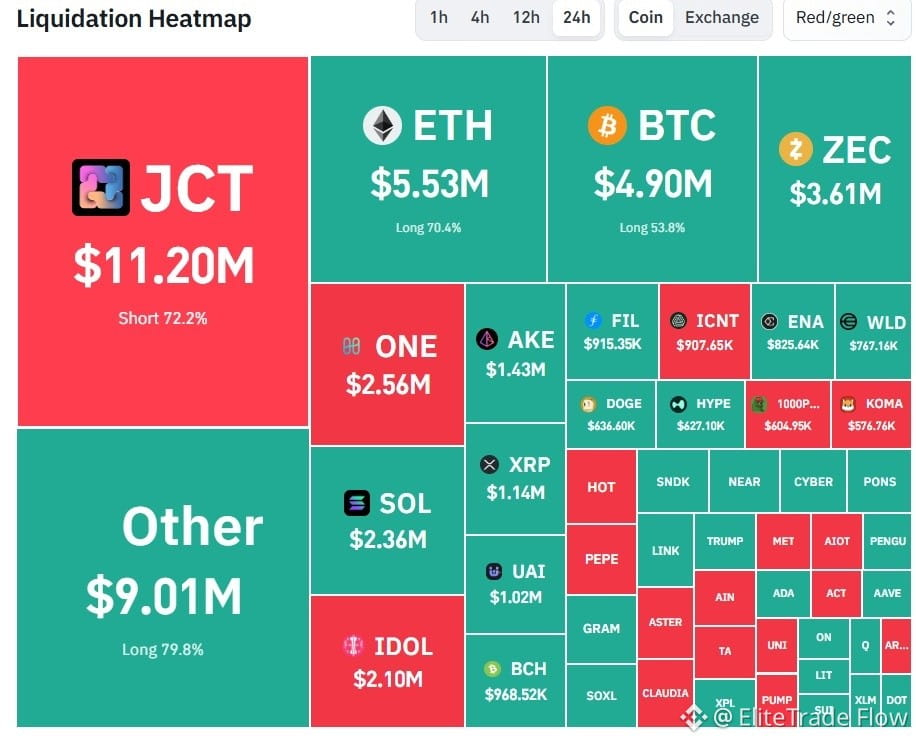
🔥 LIQUIDATION HEATMAP ALERT — A Big Move Is Coming!🔥
People who only watch charts see half the picture.
The real game is in Liquidation! 👇
24H Liquidation Data:
1. $JCT — $11.20M 🔴
72.2% Shorts Liquidated!
JCT completely wiped out the Short sellers!
2. ETH — $5.53M 🟢
70.4% Longs Liquidated!
ETH trapped the Long buyers.
3. BTC — $4.90M 🟢
53.8% Longs Liquidated!
4. $ZEC — $3.61M
5. $ONE — $2.56M
6. SOL — $2.36M*
What Does This Mean?
The market is cleaning both sides right now.
First Shorts got liquidated, then Longs got liquidated.
This is the phase where:
❌ Trading without SL = Account Wash
❌ High Leverage = Direct Liquidation
✅ Smart Trader = Wait & Watch
Big money always goes to patient traders, not to impatient ones.
Tomorrow's plan will be made from the Heatmap itself.
Follow now, so you know the next move before it happens!
#LiquidationHeatmap #JCT #ETH #AKE
🔥 LIQUIDATION HEATMAP ALERT — A Big Move Is Coming!🔥
People who only watch charts see half the picture.
The real game is in Liquidation! 👇
24H Liquidation Data:
1. $JCT — $11.20M 🔴
72.2% Shorts Liquidated!
JCT completely wiped out the Short sellers!
2. ETH — $5.53M 🟢
70.4% Longs Liquidated!
ETH trapped the Long buyers.
3. BTC — $4.90M 🟢
53.8% Longs Liquidated!
4. $ZEC — $3.61M
5. $ONE — $2.56M
6. SOL — $2.36M*
What Does This Mean?
The market is cleaning both sides right now.
First Shorts got liquidated, then Longs got liquidated.
This is the phase where:
❌ Trading without SL = Account Wash
❌ High Leverage = Direct Liquidation
✅ Smart Trader = Wait & Watch
Big money always goes to patient traders, not to impatient ones.
Tomorrow's plan will be made from the Heatmap itself.
Follow now, so you know the next move before it happens!
#LiquidationHeatmap #JCT #ETH #AKE
People who only watch charts see half the picture.
The real game is in Liquidation! 👇
24H Liquidation Data:
1. $JCT — $11.20M 🔴
72.2% Shorts Liquidated!
JCT completely wiped out the Short sellers!
2. ETH — $5.53M 🟢
70.4% Longs Liquidated!
ETH trapped the Long buyers.
3. BTC — $4.90M 🟢
53.8% Longs Liquidated!
4. $ZEC — $3.61M
5. $ONE — $2.56M
6. SOL — $2.36M*
What Does This Mean?
The market is cleaning both sides right now.
First Shorts got liquidated, then Longs got liquidated.
This is the phase where:
❌ Trading without SL = Account Wash
❌ High Leverage = Direct Liquidation
✅ Smart Trader = Wait & Watch
Big money always goes to patient traders, not to impatient ones.
Tomorrow's plan will be made from the Heatmap itself.
Follow now, so you know the next move before it happens!
#LiquidationHeatmap #JCT #ETH #AKE
2
132

🚨 $BTC /USDT Liquidation Heatmap: Where Is the Next Liquidity Hunt?
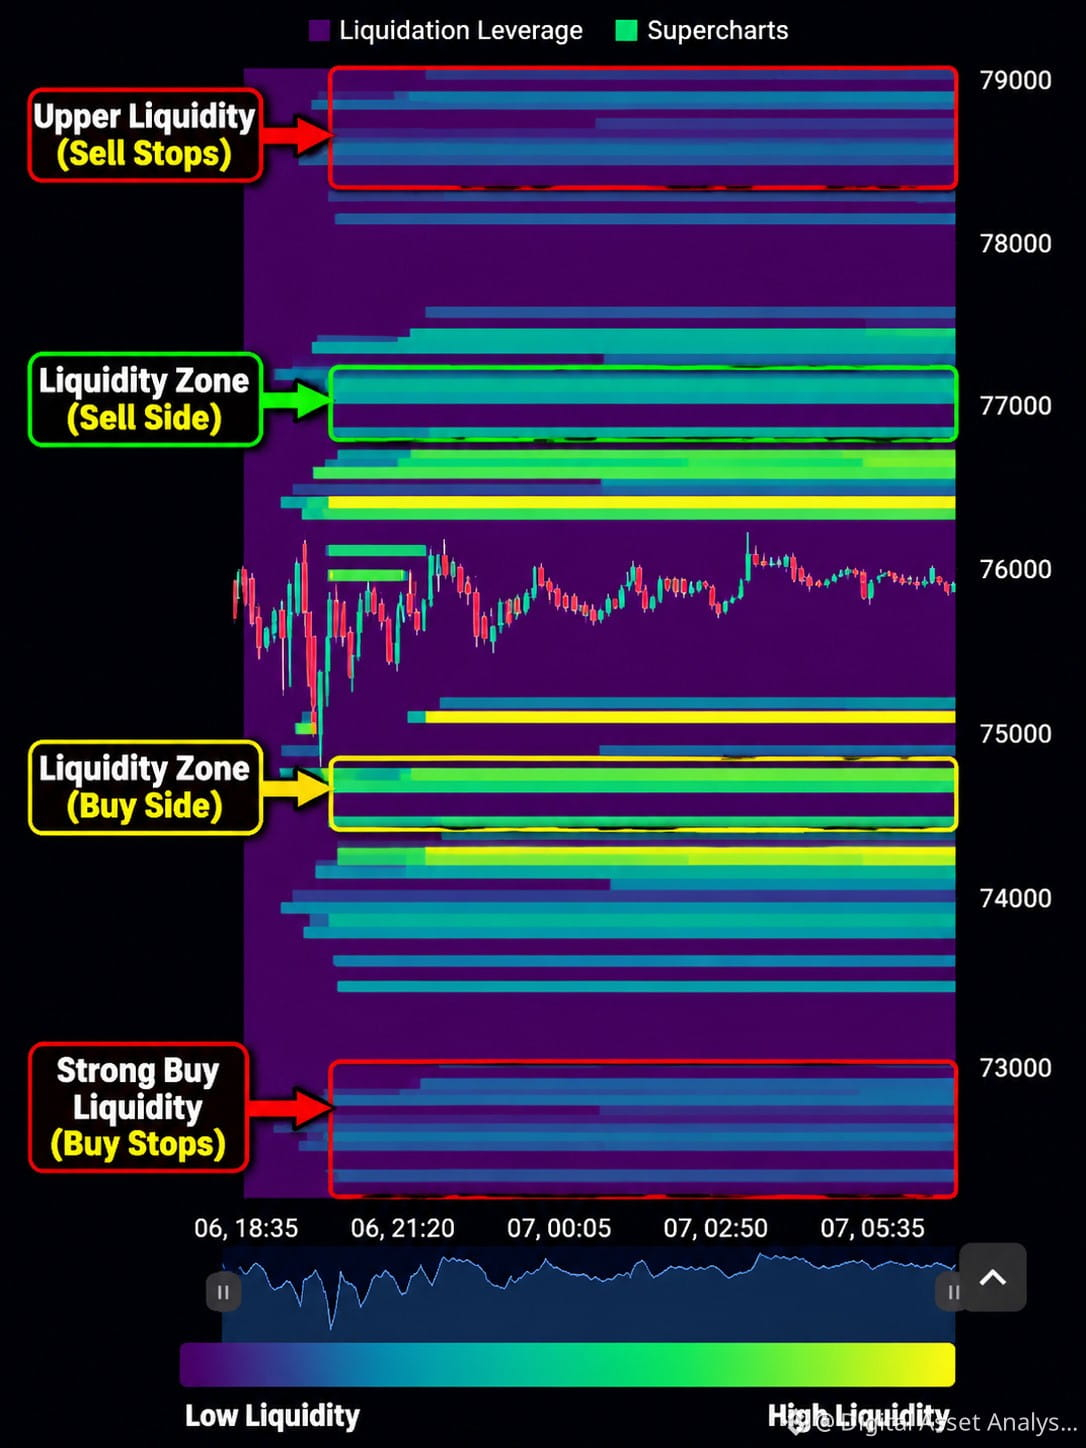
Bitcoin is moving sideways around $75,800, but the liquidation heatmap is showing some interesting liquidity clusters above and below the current price.
🔴 Upper Liquidity Zones
$76,300–$76,500
$77,000–$77,300
🟢 Lower Liquidity Zones
$74,700–$75,000
$72,800–$73,000
🔍 My Market View:
$BTC could move toward the upper liquidity first if buyers gain momentum. However, losing the $75,000 support area could open the door to a move toward lower liquidity.
For now, I'm watching both sides instead of jumping into a trade too early.
What do you think? Which liquidity zone will $BTC sweep next?
#BTC #bitcoin #CryptoAnalysis #LiquidationHeatmap
{future}(BTCUSDT)
🚨 $BTC /USDT Liquidation Heatmap: Where Is the Next Liquidity Hunt?
Bitcoin is moving sideways around $75,800, but the liquidation heatmap is showing some interesting liquidity clusters above and below the current price.
🔴 Upper Liquidity Zones
$76,300–$76,500
$77,000–$77,300
🟢 Lower Liquidity Zones
$74,700–$75,000
$72,800–$73,000
🔍 My Market View:
$BTC could move toward the upper liquidity first if buyers gain momentum. However, losing the $75,000 support area could open the door to a move toward lower liquidity.
For now, I'm watching both sides instead of jumping into a trade too early.
What do you think? Which liquidity zone will $BTC sweep next?
#BTC #bitcoin #CryptoAnalysis #LiquidationHeatmap
Bitcoin is moving sideways around $75,800, but the liquidation heatmap is showing some interesting liquidity clusters above and below the current price.
🔴 Upper Liquidity Zones
$76,300–$76,500
$77,000–$77,300
🟢 Lower Liquidity Zones
$74,700–$75,000
$72,800–$73,000
🔍 My Market View:
$BTC could move toward the upper liquidity first if buyers gain momentum. However, losing the $75,000 support area could open the door to a move toward lower liquidity.
For now, I'm watching both sides instead of jumping into a trade too early.
What do you think? Which liquidity zone will $BTC sweep next?
#BTC #bitcoin #CryptoAnalysis #LiquidationHeatmap
5
2
3.8k

Article
Bitcoin Liquidity Trap: Liquidation Clusters on Both Sides — Is BTC Preparing for a Major Move?Bitcoin Liquidity Trap: Liquidation Clusters on Both Sides — Is BTC Preparing for a Major Move?
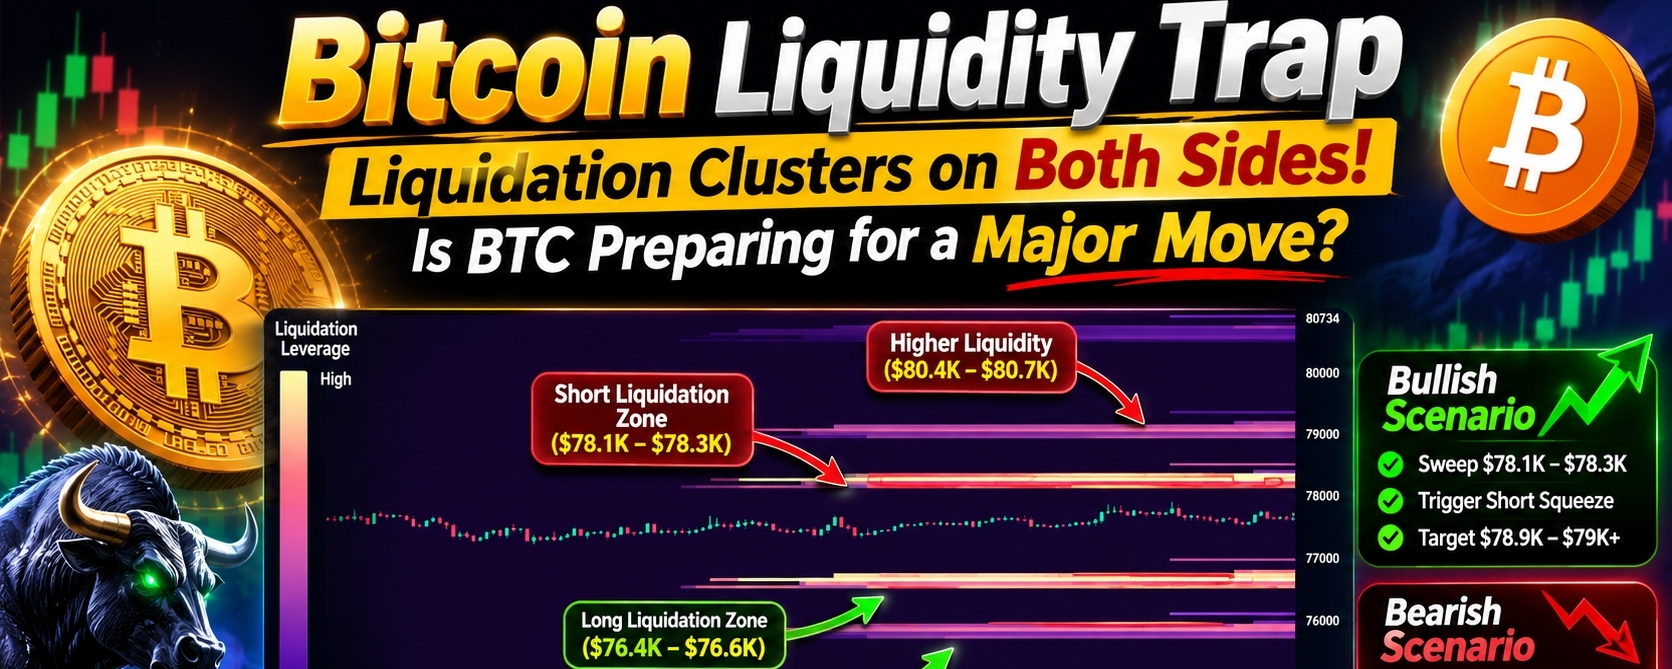
Bitcoin ($BTC) is approaching a critical liquidity battle. The latest liquidation heatmap reveals significant liquidity clusters above and below the current price, creating a potential setup for a sharp move in either direction.
The interesting part? Neither bulls nor bears appear completely safe.
This is exactly the type of market structure traders should pay attention to before opening leveraged positions.
1. What the liquidation heatmap is telling us
The chart from CoinGlass displays estimated liquidation concentrations at different BTC price levels.
Purple zones: Lower concentrations of estimated liquidation liquidity.
Pink and yellow zones: Higher concentrations of estimated liquidation liquidity.
Upper clusters: Potential short-liquidation zones.
Lower clusters: Potential long-liquidation zones.
When Bitcoin moves into these areas, leveraged positions can be forcibly closed, potentially accelerating the price movement.
Importantly, these are estimated liquidation levels, not guaranteed orders or confirmed future liquidations.
2. Key BTC liquidity zones from your screenshot
Approximate levels visually interpreted from the uploaded chart — not live price quotes.
BTC price zone
Market interpretation
$78,100–$78,300
Major upper liquidity cluster
$78,900–$79,000
Additional short-liquidation liquidity
$80,400–$80,700
Higher upside liquidity
$76,400–$76,600
Major lower liquidity cluster
$75,700–$75,900
Additional downside liquidity
$74,200–$74,400
Deeper downside liquidity
The important observation: BTC is trading between substantial liquidity pools on both sides.
The strongest visible nearby zones are around $78.1K–$78.3K above and $76.4K–$76.6K below.
3. Two possible scenarios
Scenario A — Bullish liquidity sweep
If BTC maintains its local support and buyers step in:
Price could move towards $78,100–$78,300.
A breakout could trigger short liquidations.
Increased buying pressure could push BTC towards $78,900–$79,000.
A sustained move above that region could open the path towards higher liquidity.
Scenario B — Bearish liquidity sweep
If BTC loses its nearby support:
Selling pressure could push BTC towards $76,400–$76,600.
Long liquidations could accelerate the decline.
If that region fails to hold, $75,700–$75,900 becomes the next important area.
Further weakness could expose the $74,200–$74,400 region.
Neither scenario is confirmed. Price action and volume must determine which side gets taken first.
4. Why traders should pay attention now
Liquidation cascades can create unusually fast price movements.
A recent report published on October 30, 2026, highlighted approximately $1.49 billion in crypto liquidations over 24 hours, with Bitcoin long positions taking a substantial share of the losses. This demonstrates how quickly excessive leverage can become a problem when the market moves against crowded positions.
BeInCrypto
This is why watching leverage, open interest, trading volume and liquidation clusters together is more useful than relying on the heatmap alone.
5. What should traders watch next?
Here are five important signals:
BTC price action: Does Bitcoin hold its current trading range?
Trading volume: Is a breakout supported by strong volume?
Open interest: Is leverage increasing or decreasing?
Funding rates: Are traders becoming excessively bullish or bearish?
Liquidation activity: Which side is actually getting liquidated?
A liquidity cluster can attract price, but it does not guarantee a reversal or breakout. Sometimes liquidity disappears before price reaches it.
6. My final market perspective
Bitcoin is showing an interesting liquidity structure.
There is substantial potential liquidation liquidity above and below the current price. This creates an environment where both bullish and bearish traders need to manage risk carefully.
My approach would be to avoid chasing the first move.
I would wait for a liquidity sweep, observe the reaction, and look for confirmation through volume and a candle close.
The key question is not simply whether BTC goes up or down. The real question is which side of the leveraged market gets trapped first.
Remember:
Liquidity sweep + bullish reclaim = potential long opportunity.
Liquidity sweep + bearish rejection = potential short opportunity.
No confirmation = no reason to rush into a trade.
Final takeaway
Both sides have liquidity. The next major move could punish overleveraged bulls or bears. Patience, confirmation and risk management matter more than prediction.
#bitcoin #BTC #BitcoinAnalysis #LiquidationHeatmap #LiquidationHeatmap
$BTC
Bitcoin Liquidity Trap: Liquidation Clusters on Both Sides — Is BTC Preparing for a Major Move?
Bitcoin Liquidity Trap: Liquidation Clusters on Both Sides — Is BTC Preparing for a Major Move?
Bitcoin ($BTC ) is approaching a critical liquidity battle. The latest liquidation heatmap reveals significant liquidity clusters above and below the current price, creating a potential setup for a sharp move in either direction.
The interesting part? Neither bulls nor bears appear completely safe.
This is exactly the type of market structure traders should pay attention to before opening leveraged positions.
1. What the liquidation heatmap is telling us
The chart from CoinGlass displays estimated liquidation concentrations at different BTC price levels.
Purple zones: Lower concentrations of estimated liquidation liquidity.
Pink and yellow zones: Higher concentrations of estimated liquidation liquidity.
Upper clusters: Potential short-liquidation zones.
Lower clusters: Potential long-liquidation zones.
When Bitcoin moves into these areas, leveraged positions can be forcibly closed, potentially accelerating the price movement.
Importantly, these are estimated liquidation levels, not guaranteed orders or confirmed future liquidations.
2. Key BTC liquidity zones from your screenshot
Approximate levels visually interpreted from the uploaded chart — not live price quotes.
BTC price zone
Market interpretation
$78,100–$78,300
Major upper liquidity cluster
$78,900–$79,000
Additional short-liquidation liquidity
$80,400–$80,700
Higher upside liquidity
$76,400–$76,600
Major lower liquidity cluster
$75,700–$75,900
Additional downside liquidity
$74,200–$74,400
Deeper downside liquidity
The important observation: BTC is trading between substantial liquidity pools on both sides.
The strongest visible nearby zones are around $78.1K–$78.3K above and $76.4K–$76.6K below.
3. Two possible scenarios
Scenario A — Bullish liquidity sweep
If BTC maintains its local support and buyers step in:
Price could move towards $78,100–$78,300.
A breakout could trigger short liquidations.
Increased buying pressure could push BTC towards $78,900–$79,000.
A sustained move above that region could open the path towards higher liquidity.
Scenario B — Bearish liquidity sweep
If BTC loses its nearby support:
Selling pressure could push BTC towards $76,400–$76,600.
Long liquidations could accelerate the decline.
If that region fails to hold, $75,700–$75,900 becomes the next important area.
Further weakness could expose the $74,200–$74,400 region.
Neither scenario is confirmed. Price action and volume must determine which side gets taken first.
4. Why traders should pay attention now
Liquidation cascades can create unusually fast price movements.
A recent report published on October 30, 2026, highlighted approximately $1.49 billion in crypto liquidations over 24 hours, with Bitcoin long positions taking a substantial share of the losses. This demonstrates how quickly excessive leverage can become a problem when the market moves against crowded positions.
BeInCrypto
This is why watching leverage, open interest, trading volume and liquidation clusters together is more useful than relying on the heatmap alone.
5. What should traders watch next?
Here are five important signals:
BTC price action: Does Bitcoin hold its current trading range?
Trading volume: Is a breakout supported by strong volume?
Open interest: Is leverage increasing or decreasing?
Funding rates: Are traders becoming excessively bullish or bearish?
Liquidation activity: Which side is actually getting liquidated?
A liquidity cluster can attract price, but it does not guarantee a reversal or breakout. Sometimes liquidity disappears before price reaches it.
6. My final market perspective
Bitcoin is showing an interesting liquidity structure.
There is substantial potential liquidation liquidity above and below the current price. This creates an environment where both bullish and bearish traders need to manage risk carefully.
My approach would be to avoid chasing the first move.
I would wait for a liquidity sweep, observe the reaction, and look for confirmation through volume and a candle close.
The key question is not simply whether BTC goes up or down. The real question is which side of the leveraged market gets trapped first.
Remember:
Liquidity sweep + bullish reclaim = potential long opportunity.
Liquidity sweep + bearish rejection = potential short opportunity.
No confirmation = no reason to rush into a trade.
Final takeaway
Both sides have liquidity. The next major move could punish overleveraged bulls or bears. Patience, confirmation and risk management matter more than prediction.
#bitcoin #BTC #BitcoinAnalysis #LiquidationHeatmap #LiquidationHeatmap
$BTC
Bitcoin ($BTC ) is approaching a critical liquidity battle. The latest liquidation heatmap reveals significant liquidity clusters above and below the current price, creating a potential setup for a sharp move in either direction.
The interesting part? Neither bulls nor bears appear completely safe.
This is exactly the type of market structure traders should pay attention to before opening leveraged positions.
1. What the liquidation heatmap is telling us
The chart from CoinGlass displays estimated liquidation concentrations at different BTC price levels.
Purple zones: Lower concentrations of estimated liquidation liquidity.
Pink and yellow zones: Higher concentrations of estimated liquidation liquidity.
Upper clusters: Potential short-liquidation zones.
Lower clusters: Potential long-liquidation zones.
When Bitcoin moves into these areas, leveraged positions can be forcibly closed, potentially accelerating the price movement.
Importantly, these are estimated liquidation levels, not guaranteed orders or confirmed future liquidations.
2. Key BTC liquidity zones from your screenshot
Approximate levels visually interpreted from the uploaded chart — not live price quotes.
BTC price zone
Market interpretation
$78,100–$78,300
Major upper liquidity cluster
$78,900–$79,000
Additional short-liquidation liquidity
$80,400–$80,700
Higher upside liquidity
$76,400–$76,600
Major lower liquidity cluster
$75,700–$75,900
Additional downside liquidity
$74,200–$74,400
Deeper downside liquidity
The important observation: BTC is trading between substantial liquidity pools on both sides.
The strongest visible nearby zones are around $78.1K–$78.3K above and $76.4K–$76.6K below.
3. Two possible scenarios
Scenario A — Bullish liquidity sweep
If BTC maintains its local support and buyers step in:
Price could move towards $78,100–$78,300.
A breakout could trigger short liquidations.
Increased buying pressure could push BTC towards $78,900–$79,000.
A sustained move above that region could open the path towards higher liquidity.
Scenario B — Bearish liquidity sweep
If BTC loses its nearby support:
Selling pressure could push BTC towards $76,400–$76,600.
Long liquidations could accelerate the decline.
If that region fails to hold, $75,700–$75,900 becomes the next important area.
Further weakness could expose the $74,200–$74,400 region.
Neither scenario is confirmed. Price action and volume must determine which side gets taken first.
4. Why traders should pay attention now
Liquidation cascades can create unusually fast price movements.
A recent report published on October 30, 2026, highlighted approximately $1.49 billion in crypto liquidations over 24 hours, with Bitcoin long positions taking a substantial share of the losses. This demonstrates how quickly excessive leverage can become a problem when the market moves against crowded positions.
BeInCrypto
This is why watching leverage, open interest, trading volume and liquidation clusters together is more useful than relying on the heatmap alone.
5. What should traders watch next?
Here are five important signals:
BTC price action: Does Bitcoin hold its current trading range?
Trading volume: Is a breakout supported by strong volume?
Open interest: Is leverage increasing or decreasing?
Funding rates: Are traders becoming excessively bullish or bearish?
Liquidation activity: Which side is actually getting liquidated?
A liquidity cluster can attract price, but it does not guarantee a reversal or breakout. Sometimes liquidity disappears before price reaches it.
6. My final market perspective
Bitcoin is showing an interesting liquidity structure.
There is substantial potential liquidation liquidity above and below the current price. This creates an environment where both bullish and bearish traders need to manage risk carefully.
My approach would be to avoid chasing the first move.
I would wait for a liquidity sweep, observe the reaction, and look for confirmation through volume and a candle close.
The key question is not simply whether BTC goes up or down. The real question is which side of the leveraged market gets trapped first.
Remember:
Liquidity sweep + bullish reclaim = potential long opportunity.
Liquidity sweep + bearish rejection = potential short opportunity.
No confirmation = no reason to rush into a trade.
Final takeaway
Both sides have liquidity. The next major move could punish overleveraged bulls or bears. Patience, confirmation and risk management matter more than prediction.
#bitcoin #BTC #BitcoinAnalysis #LiquidationHeatmap #LiquidationHeatmap
$BTC
420

·
--
Bullish
$LSK
{future}(LSKUSDT)
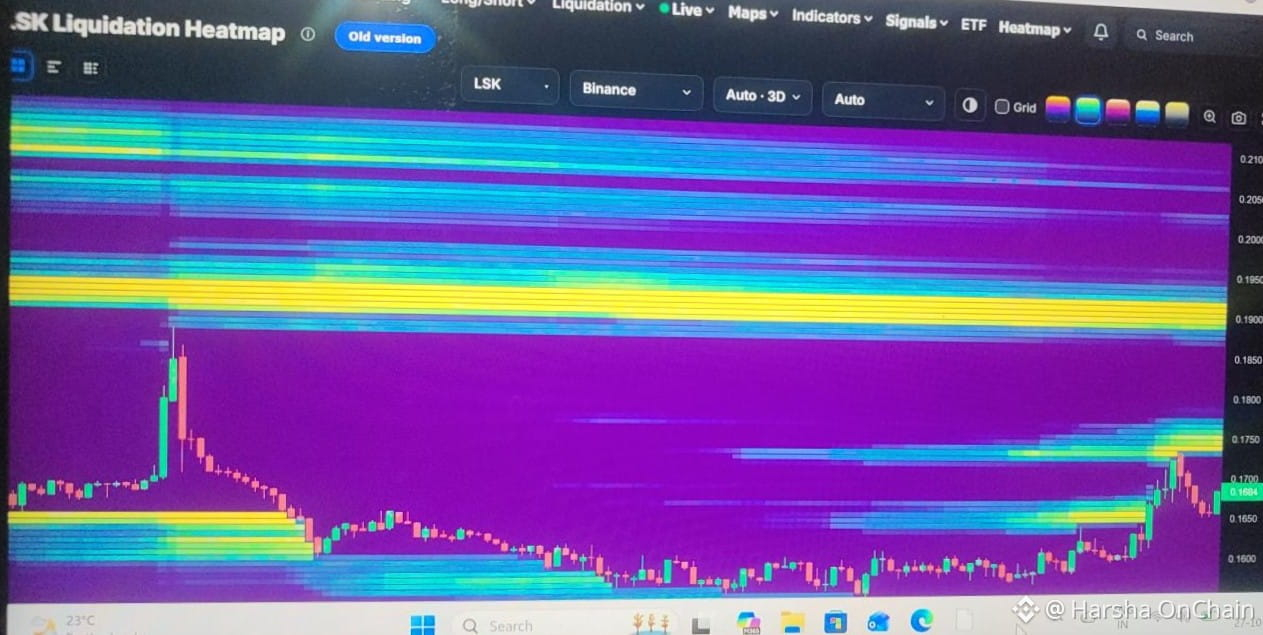
🔥 LSK — LIQUIDITY IS BUILDING ABOVE! 👀
Price has bounced from the $0.155–$0.160 area and is now testing higher levels.
📍 Current price: ~$0.168
🟢 Bullish scenario: If price holds $0.165–$0.168 and breaks higher with confirmation, the next liquidity area to watch is $0.173–$0.176.
🔴 Bearish scenario: If price gets rejected and loses $0.165, a pullback toward $0.160–$0.155 becomes possible.
🎯 My plan: Wait for the breakout and retest, or a clear rejection. The bright heatmap zones show potential liquidity magnets — not guaranteed targets.
Will LSK reach the upper liquidity first, or sweep the lows? 👇
#LSK #Lisk #CryptoTrading #LiquidationHeatmap #BinanceSquare
$LSK
🔥 LSK — LIQUIDITY IS BUILDING ABOVE! 👀
Price has bounced from the $0.155–$0.160 area and is now testing higher levels.
📍 Current price: ~$0.168
🟢 Bullish scenario: If price holds $0.165–$0.168 and breaks higher with confirmation, the next liquidity area to watch is $0.173–$0.176.
🔴 Bearish scenario: If price gets rejected and loses $0.165, a pullback toward $0.160–$0.155 becomes possible.
🎯 My plan: Wait for the breakout and retest, or a clear rejection. The bright heatmap zones show potential liquidity magnets — not guaranteed targets.
Will LSK reach the upper liquidity first, or sweep the lows? 👇
#LSK #Lisk #CryptoTrading #LiquidationHeatmap #BinanceSquare
🔥 LSK — LIQUIDITY IS BUILDING ABOVE! 👀
Price has bounced from the $0.155–$0.160 area and is now testing higher levels.
📍 Current price: ~$0.168
🟢 Bullish scenario: If price holds $0.165–$0.168 and breaks higher with confirmation, the next liquidity area to watch is $0.173–$0.176.
🔴 Bearish scenario: If price gets rejected and loses $0.165, a pullback toward $0.160–$0.155 becomes possible.
🎯 My plan: Wait for the breakout and retest, or a clear rejection. The bright heatmap zones show potential liquidity magnets — not guaranteed targets.
Will LSK reach the upper liquidity first, or sweep the lows? 👇
#LSK #Lisk #CryptoTrading #LiquidationHeatmap #BinanceSquare
729
·
--
Bearish
$BULLA
{future}(BULLAUSDT)
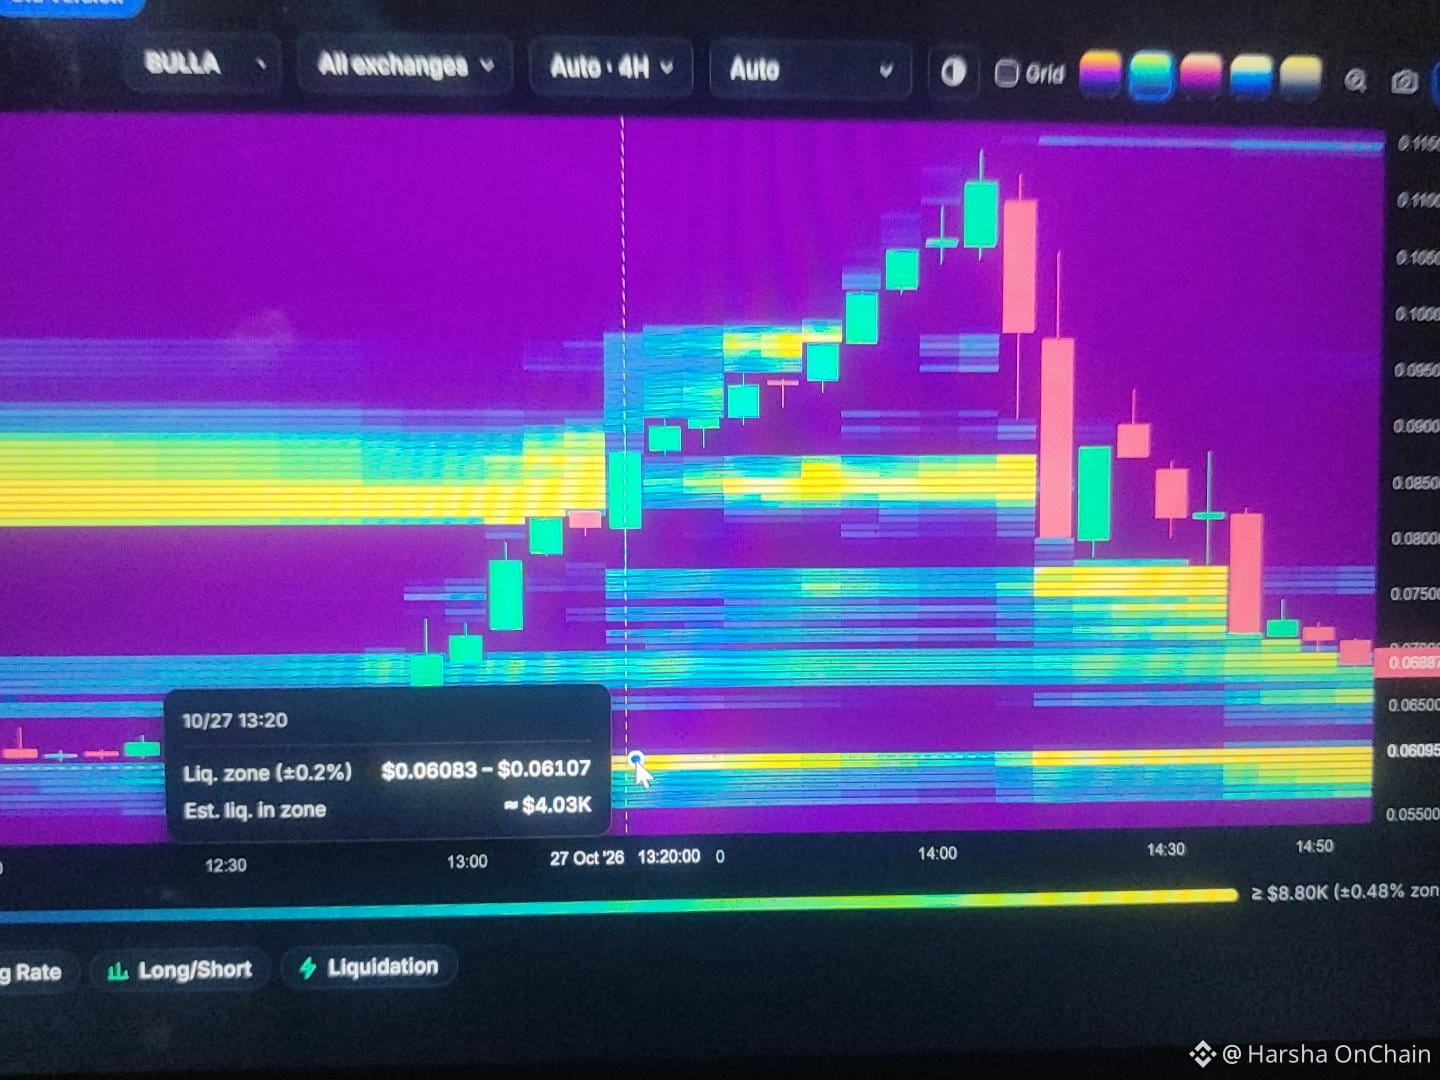
🔥 LIQUIDATION HEATMAP: WHERE COULD PRICE GO NEXT?
The pump is over for now, and sellers have stepped in. 👀
📉 Scenario 1 — 60%: Price sweeps $0.066–$0.067, with $0.060–$0.061 as the next area to watch.
📈 Scenario 2 — 40%: Buyers defend support and reclaim resistance, opening a possible bounce toward $0.075–$0.077.
🧠 My strategy: No blind entries. I’ll wait for a liquidity sweep, price reaction, and confirmation before choosing a side.
⚠️ Heatmap liquidity is not a guaranteed target. These probabilities are estimates, not proven odds.
Which comes first — another flush or a relief bounce? 👇
#CryptoTrading #LiquidationHeatmap #PriceAction #BinanceSquare
$BULLA
🔥 LIQUIDATION HEATMAP: WHERE COULD PRICE GO NEXT?
The pump is over for now, and sellers have stepped in. 👀
📉 Scenario 1 — 60%: Price sweeps $0.066–$0.067, with $0.060–$0.061 as the next area to watch.
📈 Scenario 2 — 40%: Buyers defend support and reclaim resistance, opening a possible bounce toward $0.075–$0.077.
🧠 My strategy: No blind entries. I’ll wait for a liquidity sweep, price reaction, and confirmation before choosing a side.
⚠️ Heatmap liquidity is not a guaranteed target. These probabilities are estimates, not proven odds.
Which comes first — another flush or a relief bounce? 👇
#CryptoTrading #LiquidationHeatmap #PriceAction #BinanceSquare
🔥 LIQUIDATION HEATMAP: WHERE COULD PRICE GO NEXT?
The pump is over for now, and sellers have stepped in. 👀
📉 Scenario 1 — 60%: Price sweeps $0.066–$0.067, with $0.060–$0.061 as the next area to watch.
📈 Scenario 2 — 40%: Buyers defend support and reclaim resistance, opening a possible bounce toward $0.075–$0.077.
🧠 My strategy: No blind entries. I’ll wait for a liquidity sweep, price reaction, and confirmation before choosing a side.
⚠️ Heatmap liquidity is not a guaranteed target. These probabilities are estimates, not proven odds.
Which comes first — another flush or a relief bounce? 👇
#CryptoTrading #LiquidationHeatmap #PriceAction #BinanceSquare
478

🔴 $JCT: Positive buying delta, failed highs — here are the numbers behind my bearish watch.
Price: 0.007350
📍 Estimated liquidation zones
Approximate readings from the current 24h heatmap:
Above price: 0.00790–0.00810
Below price: 0.00700–0.00710 → 0.00685–0.00690 → 0.00655–0.00670
Deeper concentrations: 0.00570–0.00585 / 0.00500–0.00515
These are potential liquidation zones, not guaranteed destinations.
💰 Executed buying vs selling
During the hourly spike to 0.008250:
• Turnover: $68.00M
• Aggressive buys: $35.42M
• Aggressive sells: $32.58M
• Delta: +$2.84M
• Candle close: 0.006435
During the following rebound:
• Turnover: $58.36M
• Aggressive buys: $30.38M
• Aggressive sells: $27.98M
• Delta: +$2.40M
• High: 0.007987
• Close: 0.007551
Buyers were aggressive in both hours, but failed to reclaim 0.008250. That suggests overhead supply. The strong rebound also shows sellers haven’t secured control.
This is futures trade delta — not net capital inflow or exchange deposits.
📊 Open interest
4.831B → 4.716B → 4.734B JCT
OI fell 2.38% during the reversal, then recovered just 0.39% during the rebound. Latest hourly notional OI: $35.71M.
The rebound was accompanied by limited growth in outstanding contracts. That does not identify which side opened or closed positions.
Funding: +0.0826%, longs pay shorts.
🎯 My bearish confirmation level: 0.00700
An hourly close below 0.00700, followed by a failed reclaim, would strengthen the case for 0.00685 → 0.00655 → 0.00620…and to 0,003.
Until then, a squeeze toward 0.00790–0.00810 remains possible. A sustained break above 0.008250 invalidates this bearish thesis.
#JCT #TechnicalAnalysis #LiquidationHeatmap #short #crypto
🔴 $JCT: Positive buying delta, failed highs — here are the numbers behind my bearish watch.
Price: 0.007350
📍 Estimated liquidation zones
Approximate readings from the current 24h heatmap:
Above price: 0.00790–0.00810
Below price: 0.00700–0.00710 → 0.00685–0.00690 → 0.00655–0.00670
Deeper concentrations: 0.00570–0.00585 / 0.00500–0.00515
These are potential liquidation zones, not guaranteed destinations.
💰 Executed buying vs selling
During the hourly spike to 0.008250:
• Turnover: $68.00M
• Aggressive buys: $35.42M
• Aggressive sells: $32.58M
• Delta: +$2.84M
• Candle close: 0.006435
During the following rebound:
• Turnover: $58.36M
• Aggressive buys: $30.38M
• Aggressive sells: $27.98M
• Delta: +$2.40M
• High: 0.007987
• Close: 0.007551
Buyers were aggressive in both hours, but failed to reclaim 0.008250. That suggests overhead supply. The strong rebound also shows sellers haven’t secured control.
This is futures trade delta — not net capital inflow or exchange deposits.
📊 Open interest
4.831B → 4.716B → 4.734B JCT
OI fell 2.38% during the reversal, then recovered just 0.39% during the rebound. Latest hourly notional OI: $35.71M.
The rebound was accompanied by limited growth in outstanding contracts. That does not identify which side opened or closed positions.
Funding: +0.0826%, longs pay shorts.
🎯 My bearish confirmation level: 0.00700
An hourly close below 0.00700, followed by a failed reclaim, would strengthen the case for 0.00685 → 0.00655 → 0.00620…and to 0,003.
Until then, a squeeze toward 0.00790–0.00810 remains possible. A sustained break above 0.008250 invalidates this bearish thesis.
#JCT #TechnicalAnalysis #LiquidationHeatmap #short #crypto
Price: 0.007350
📍 Estimated liquidation zones
Approximate readings from the current 24h heatmap:
Above price: 0.00790–0.00810
Below price: 0.00700–0.00710 → 0.00685–0.00690 → 0.00655–0.00670
Deeper concentrations: 0.00570–0.00585 / 0.00500–0.00515
These are potential liquidation zones, not guaranteed destinations.
💰 Executed buying vs selling
During the hourly spike to 0.008250:
• Turnover: $68.00M
• Aggressive buys: $35.42M
• Aggressive sells: $32.58M
• Delta: +$2.84M
• Candle close: 0.006435
During the following rebound:
• Turnover: $58.36M
• Aggressive buys: $30.38M
• Aggressive sells: $27.98M
• Delta: +$2.40M
• High: 0.007987
• Close: 0.007551
Buyers were aggressive in both hours, but failed to reclaim 0.008250. That suggests overhead supply. The strong rebound also shows sellers haven’t secured control.
This is futures trade delta — not net capital inflow or exchange deposits.
📊 Open interest
4.831B → 4.716B → 4.734B JCT
OI fell 2.38% during the reversal, then recovered just 0.39% during the rebound. Latest hourly notional OI: $35.71M.
The rebound was accompanied by limited growth in outstanding contracts. That does not identify which side opened or closed positions.
Funding: +0.0826%, longs pay shorts.
🎯 My bearish confirmation level: 0.00700
An hourly close below 0.00700, followed by a failed reclaim, would strengthen the case for 0.00685 → 0.00655 → 0.00620…and to 0,003.
Until then, a squeeze toward 0.00790–0.00810 remains possible. A sustained break above 0.008250 invalidates this bearish thesis.
#JCT #TechnicalAnalysis #LiquidationHeatmap #short #crypto
1
531
Article
⚠️ #BTC Sitting Between Dual Liquidity Pools: Why Entering Now is High Risk 🔴⚠️ #BTC Sitting Between Dual Liquidity Pools: Why Entering Now is High Risk 🔴
Understanding market structure requires looking beyond basic chart patterns and diving straight into where market liquidity is stacked.
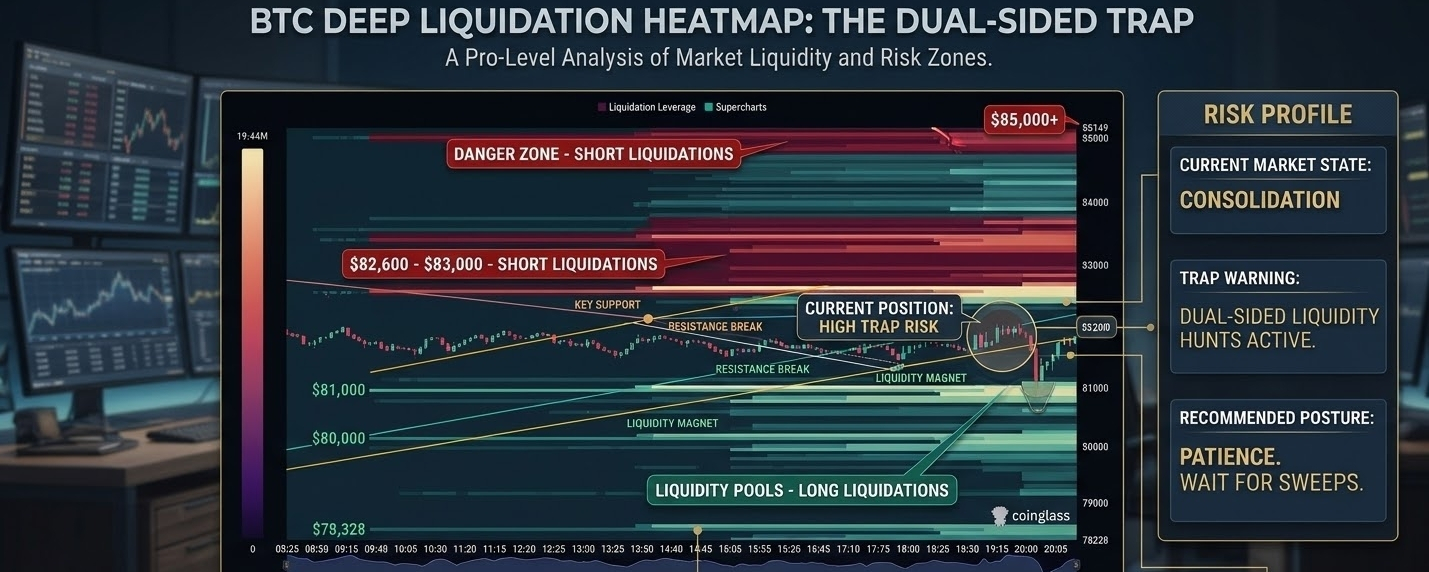
Looking at the latest CoinGlass Liquidation Heatmap for Bitcoin ($BTC) around the $82,000 price area, a clear professional insight emerges: Bitcoin is currently trapped in a high-density, dual-sided liquidity magnet.
📊 Deep-Dive Heatmap Analysis
1. Upper Liquidity (Short Liquidations)
Key Levels: $82,600 – $83,000 and $85,000+
Structure: Bright yellow/orange bands indicate dense, leveraged Short positions stacked closely above the current price.
Impact: A fast break upward toward $83,000 can trigger cascading forced buys (short squeezes), fueling a quick liquidity sweep before institutional sellers potentially step back in.
2. Lower Liquidity (Long Liquidations)
Key Levels: $81,000, $80,000, and $78,300
Structure: Deep pools of Long stop-losses and liquidation levels are sitting right under the recent low around $81,000.
Impact: Market makers and algorithmic traders frequently hunt these clustered long liquidations. A downside sweep below $81,000 could trigger a sharp "flush out" down toward the major psychological level at $80,000.
💡 Why a "No-Trade Zone" Exists Right Now
When liquidation density is concentrated heavily on both sides within a tight price range:
Choppy Whipsaw Volatility: Price tends to act like a ping-pong ball, hunting liquidity first in one direction to flush out early positions, then rapidly reversing to sweep the opposite side.
Poor Risk-to-Reward (R:R): Entering at current levels puts your stop-loss right in the middle of active liquidity clusters—making stop-outs almost inevitable during volatility spikes.
Liquidity Sweeps Over Trend: In these environments, price movement is driven by forced liquidations rather than genuine directional momentum.
🎯 Pro Trader Playbook & Next Steps
🛑 Patience Over Action: Avoid taking leveraged market orders in the middle of these two heavy liquidity pools.
👀 Wait for the Sweep & Confirmation:
Let price sweep either $83,000+ (Shorts) or $81,000/$80,000 (Longs) first.
Look for clear absorption (rejection wicks, volume divergence, or market structure shifts) after the sweep occurs before considering an entry.
🛡️ Capital Preservation First: Cash is a valid position during dual-sided liquidity traps. Protect your capital and let the market reveal its true direction post-liquidation.
📌 Summary: Both sides have heavy liquidity waiting to be cleared. Wait for the sweeps to settle before taking action! 🔴
What’s your plan—are you waiting for $81k to sweep first, or are you looking for an $83k break? Let me know below! 👇
#bitcoin #cryptotrading #LiquidationHeatmap #TechnicalAnalysis #BinanceSquare
$BTC
⚠️ #BTC Sitting Between Dual Liquidity Pools: Why Entering Now is High Risk 🔴
⚠️ #BTC Sitting Between Dual Liquidity Pools: Why Entering Now is High Risk 🔴
Understanding market structure requires looking beyond basic chart patterns and diving straight into where market liquidity is stacked.
Looking at the latest CoinGlass Liquidation Heatmap for Bitcoin ($BTC ) around the $82,000 price area, a clear professional insight emerges: Bitcoin is currently trapped in a high-density, dual-sided liquidity magnet.
📊 Deep-Dive Heatmap Analysis
1. Upper Liquidity (Short Liquidations)
Key Levels: $82,600 – $83,000 and $85,000+
Structure: Bright yellow/orange bands indicate dense, leveraged Short positions stacked closely above the current price.
Impact: A fast break upward toward $83,000 can trigger cascading forced buys (short squeezes), fueling a quick liquidity sweep before institutional sellers potentially step back in.
2. Lower Liquidity (Long Liquidations)
Key Levels: $81,000, $80,000, and $78,300
Structure: Deep pools of Long stop-losses and liquidation levels are sitting right under the recent low around $81,000.
Impact: Market makers and algorithmic traders frequently hunt these clustered long liquidations. A downside sweep below $81,000 could trigger a sharp "flush out" down toward the major psychological level at $80,000.
💡 Why a "No-Trade Zone" Exists Right Now
When liquidation density is concentrated heavily on both sides within a tight price range:
Choppy Whipsaw Volatility: Price tends to act like a ping-pong ball, hunting liquidity first in one direction to flush out early positions, then rapidly reversing to sweep the opposite side.
Poor Risk-to-Reward (R:R): Entering at current levels puts your stop-loss right in the middle of active liquidity clusters—making stop-outs almost inevitable during volatility spikes.
Liquidity Sweeps Over Trend: In these environments, price movement is driven by forced liquidations rather than genuine directional momentum.
🎯 Pro Trader Playbook & Next Steps
🛑 Patience Over Action: Avoid taking leveraged market orders in the middle of these two heavy liquidity pools.
👀 Wait for the Sweep & Confirmation:
Let price sweep either $83,000+ (Shorts) or $81,000/$80,000 (Longs) first.
Look for clear absorption (rejection wicks, volume divergence, or market structure shifts) after the sweep occurs before considering an entry.
🛡️ Capital Preservation First: Cash is a valid position during dual-sided liquidity traps. Protect your capital and let the market reveal its true direction post-liquidation.
📌 Summary: Both sides have heavy liquidity waiting to be cleared. Wait for the sweeps to settle before taking action! 🔴
What’s your plan—are you waiting for $81k to sweep first, or are you looking for an $83k break? Let me know below! 👇
#bitcoin #cryptotrading #LiquidationHeatmap #TechnicalAnalysis #BinanceSquare
$BTC
Understanding market structure requires looking beyond basic chart patterns and diving straight into where market liquidity is stacked.
Looking at the latest CoinGlass Liquidation Heatmap for Bitcoin ($BTC ) around the $82,000 price area, a clear professional insight emerges: Bitcoin is currently trapped in a high-density, dual-sided liquidity magnet.
📊 Deep-Dive Heatmap Analysis
1. Upper Liquidity (Short Liquidations)
Key Levels: $82,600 – $83,000 and $85,000+
Structure: Bright yellow/orange bands indicate dense, leveraged Short positions stacked closely above the current price.
Impact: A fast break upward toward $83,000 can trigger cascading forced buys (short squeezes), fueling a quick liquidity sweep before institutional sellers potentially step back in.
2. Lower Liquidity (Long Liquidations)
Key Levels: $81,000, $80,000, and $78,300
Structure: Deep pools of Long stop-losses and liquidation levels are sitting right under the recent low around $81,000.
Impact: Market makers and algorithmic traders frequently hunt these clustered long liquidations. A downside sweep below $81,000 could trigger a sharp "flush out" down toward the major psychological level at $80,000.
💡 Why a "No-Trade Zone" Exists Right Now
When liquidation density is concentrated heavily on both sides within a tight price range:
Choppy Whipsaw Volatility: Price tends to act like a ping-pong ball, hunting liquidity first in one direction to flush out early positions, then rapidly reversing to sweep the opposite side.
Poor Risk-to-Reward (R:R): Entering at current levels puts your stop-loss right in the middle of active liquidity clusters—making stop-outs almost inevitable during volatility spikes.
Liquidity Sweeps Over Trend: In these environments, price movement is driven by forced liquidations rather than genuine directional momentum.
🎯 Pro Trader Playbook & Next Steps
🛑 Patience Over Action: Avoid taking leveraged market orders in the middle of these two heavy liquidity pools.
👀 Wait for the Sweep & Confirmation:
Let price sweep either $83,000+ (Shorts) or $81,000/$80,000 (Longs) first.
Look for clear absorption (rejection wicks, volume divergence, or market structure shifts) after the sweep occurs before considering an entry.
🛡️ Capital Preservation First: Cash is a valid position during dual-sided liquidity traps. Protect your capital and let the market reveal its true direction post-liquidation.
📌 Summary: Both sides have heavy liquidity waiting to be cleared. Wait for the sweeps to settle before taking action! 🔴
What’s your plan—are you waiting for $81k to sweep first, or are you looking for an $83k break? Let me know below! 👇
#bitcoin #cryptotrading #LiquidationHeatmap #TechnicalAnalysis #BinanceSquare
$BTC
181

·
--
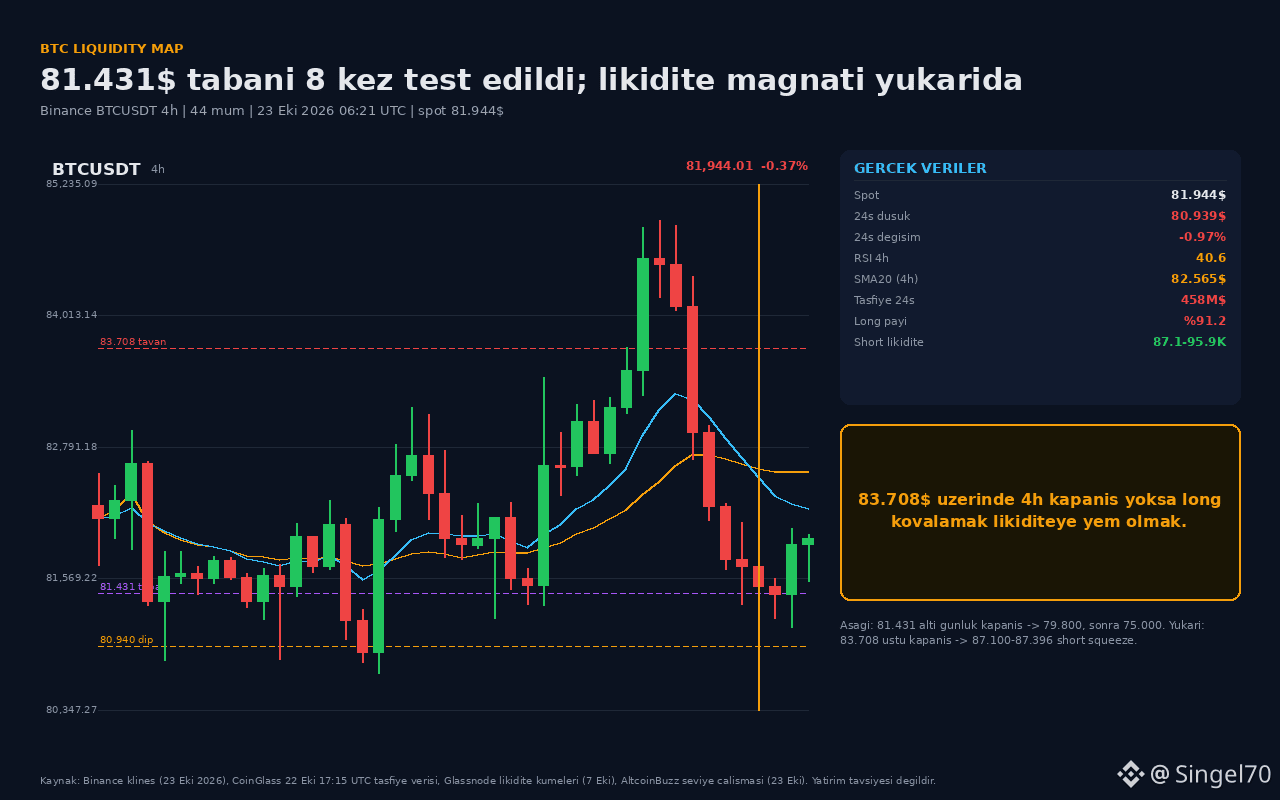
#LiquidationHeatmap BTC at the $81,431 floor: everyone is looking down, but the liquidity map points up.
📌 The real numbers (Oct 23, 2026, 06:21 UTC)
• Binance BTCUSDT: $81,944 | 24h low $80,939 | 24h -0.97%
• CoinGlass (Oct 22, 17:15 UTC): $458M liquidated in 24h, $417.9M of it from longs (91.2%), 103,000+ traders
• Oct 22: Nasdaq -2.60%, S&P 500 -1.21%; BTC fell with high beta
• 4h RSI 40.6; SMA20 at $82,565 above price; price above the lower Bollinger Band at $80,581
📉 Technical read
The $81,431 level has been tested 8 separate times since February 2025. Yesterday's daily close at $81,416 was just below the floor and the lowest in 30 days; today it was reclaimed at $81,944. So this is not a breakdown, but a defense of the floor. Critical levels: a close above $83,708 opens the way to $87,396; a close below $79,800 leaves room to $75,000.
🐋 Liquidity map (Glassnode, Oct 7)
The main short liquidation cluster is at $87,100–$95,900 (densest around 92K). The long cluster is at $81,700–$83,300, just above the current price. $458M in longs has been liquidated, but the price is still below the SMA20: no confirmation of a recovery.
🎯 Plan
• Upside: daily close above $83,708 → $87,100–$87,396, stop below $81,431
• Downside: daily close below $79,800 → $75,000
• Bottom line: No trade until there's a trigger. The upside squeeze scenario is more compelling because the short cluster overhead is large and the long side has just been cleared; but I won't chase longs without a close above 83.7K.
📌 Which side are you waiting for: an 87K squeeze or 79.8K?
#Bitcoin #BTC #CryptoMarket #RiskManagement
$BTC
Not financial advice.
#LiquidationHeatmap BTC at the $81,431 floor: everyone is looking down, but the liquidity map points up.
📌 The real numbers (Oct 23, 2026, 06:21 UTC)
• Binance BTCUSDT: $81,944 | 24h low $80,939 | 24h -0.97%
• CoinGlass (Oct 22, 17:15 UTC): $458M liquidated in 24h, $417.9M of it from longs (91.2%), 103,000+ traders
• Oct 22: Nasdaq -2.60%, S&P 500 -1.21%; BTC fell with high beta
• 4h RSI 40.6; SMA20 at $82,565 above price; price above the lower Bollinger Band at $80,581
📉 Technical read
The $81,431 level has been tested 8 separate times since February 2025. Yesterday's daily close at $81,416 was just below the floor and the lowest in 30 days; today it was reclaimed at $81,944. So this is not a breakdown, but a defense of the floor. Critical levels: a close above $83,708 opens the way to $87,396; a close below $79,800 leaves room to $75,000.
🐋 Liquidity map (Glassnode, Oct 7)
The main short liquidation cluster is at $87,100–$95,900 (densest around 92K). The long cluster is at $81,700–$83,300, just above the current price. $458M in longs has been liquidated, but the price is still below the SMA20: no confirmation of a recovery.
🎯 Plan
• Upside: daily close above $83,708 → $87,100–$87,396, stop below $81,431
• Downside: daily close below $79,800 → $75,000
• Bottom line: No trade until there's a trigger. The upside squeeze scenario is more compelling because the short cluster overhead is large and the long side has just been cleared; but I won't chase longs without a close above 83.7K.
📌 Which side are you waiting for: an 87K squeeze or 79.8K?
#Bitcoin #BTC #CryptoMarket #RiskManagement
$BTC
Not financial advice.
📌 The real numbers (Oct 23, 2026, 06:21 UTC)
• Binance BTCUSDT: $81,944 | 24h low $80,939 | 24h -0.97%
• CoinGlass (Oct 22, 17:15 UTC): $458M liquidated in 24h, $417.9M of it from longs (91.2%), 103,000+ traders
• Oct 22: Nasdaq -2.60%, S&P 500 -1.21%; BTC fell with high beta
• 4h RSI 40.6; SMA20 at $82,565 above price; price above the lower Bollinger Band at $80,581
📉 Technical read
The $81,431 level has been tested 8 separate times since February 2025. Yesterday's daily close at $81,416 was just below the floor and the lowest in 30 days; today it was reclaimed at $81,944. So this is not a breakdown, but a defense of the floor. Critical levels: a close above $83,708 opens the way to $87,396; a close below $79,800 leaves room to $75,000.
🐋 Liquidity map (Glassnode, Oct 7)
The main short liquidation cluster is at $87,100–$95,900 (densest around 92K). The long cluster is at $81,700–$83,300, just above the current price. $458M in longs has been liquidated, but the price is still below the SMA20: no confirmation of a recovery.
🎯 Plan
• Upside: daily close above $83,708 → $87,100–$87,396, stop below $81,431
• Downside: daily close below $79,800 → $75,000
• Bottom line: No trade until there's a trigger. The upside squeeze scenario is more compelling because the short cluster overhead is large and the long side has just been cleared; but I won't chase longs without a close above 83.7K.
📌 Which side are you waiting for: an 87K squeeze or 79.8K?
#Bitcoin #BTC #CryptoMarket #RiskManagement
$BTC
Not financial advice.
1
47
🚨 $BTW : COULD A SHORT SQUEEZE PUSH PRICE TOWARD $3–$4? 📈🔥
{future}(BTWUSDT)
$BTW is approaching a critical liquidity zone, and the next 24 hours could bring major volatility.
📊 HERE’S THE SETUP
🔹 Current reference price: ~$2.70
🔹 First upside target: $3.00
🔹 Extended target: $4.00
🔹 Key catalyst: Potential short liquidations above the current price
If price continues higher, short sellers may be forced to close their positions, potentially adding fuel to the rally. 🚀
⚠️ BUT THERE’S A CATCH: Liquidation clusters are not guaranteed price targets. Price could reverse before reaching them, and a sudden sell-off remains possible.
👀 WHAT I’M WATCHING
✅ Liquidation heatmap
✅ Breakout confirmation and trading volume
✅ Whether price holds key support
✅ Signs of a short squeeze
My view: $3–$4 is a bullish scenario, not a guaranteed move within 24 hours. Avoid excessive leverage and always define your risk.
💬 Can $BTW reach $4, or will sellers take control first?
#BTW #cryptotrading #ShortSqueez #LiquidationHeatmap #BinanceSquare
🚨 $BTW : COULD A SHORT SQUEEZE PUSH PRICE TOWARD $3–$4? 📈🔥
$BTW is approaching a critical liquidity zone, and the next 24 hours could bring major volatility.
📊 HERE’S THE SETUP
🔹 Current reference price: ~$2.70
🔹 First upside target: $3.00
🔹 Extended target: $4.00
🔹 Key catalyst: Potential short liquidations above the current price
If price continues higher, short sellers may be forced to close their positions, potentially adding fuel to the rally. 🚀
⚠️ BUT THERE’S A CATCH: Liquidation clusters are not guaranteed price targets. Price could reverse before reaching them, and a sudden sell-off remains possible.
👀 WHAT I’M WATCHING
✅ Liquidation heatmap
✅ Breakout confirmation and trading volume
✅ Whether price holds key support
✅ Signs of a short squeeze
My view: $3–$4 is a bullish scenario, not a guaranteed move within 24 hours. Avoid excessive leverage and always define your risk.
💬 Can $BTW reach $4, or will sellers take control first?
#BTW #cryptotrading #ShortSqueez #LiquidationHeatmap #BinanceSquare
$BTW is approaching a critical liquidity zone, and the next 24 hours could bring major volatility.
📊 HERE’S THE SETUP
🔹 Current reference price: ~$2.70
🔹 First upside target: $3.00
🔹 Extended target: $4.00
🔹 Key catalyst: Potential short liquidations above the current price
If price continues higher, short sellers may be forced to close their positions, potentially adding fuel to the rally. 🚀
⚠️ BUT THERE’S A CATCH: Liquidation clusters are not guaranteed price targets. Price could reverse before reaching them, and a sudden sell-off remains possible.
👀 WHAT I’M WATCHING
✅ Liquidation heatmap
✅ Breakout confirmation and trading volume
✅ Whether price holds key support
✅ Signs of a short squeeze
My view: $3–$4 is a bullish scenario, not a guaranteed move within 24 hours. Avoid excessive leverage and always define your risk.
💬 Can $BTW reach $4, or will sellers take control first?
#BTW #cryptotrading #ShortSqueez #LiquidationHeatmap #BinanceSquare
1
544
Log in to explore more content
Join global crypto users on Binance Square
⚡️ Get latest and useful information about crypto.
💬 Trusted by the world’s largest crypto exchange.
👍 Discover real insights from verified creators.
Email / Phone number
Trending Topics
1
#NvidiaBeatsEstimatesWith$130BQ4Outlook
3,092 views
67 Discussing
2
#AnthropicIPOPriceCouldExceed$80
7,175 views
75 Discussing
3
#CanNvidia’sDataCenterGrowthContinue?
16,334 views
296 Discussing
4
#DBSAndCirclePartnerToExpandAsianInstitutionsUSDCAccess
830 views
22 Discussing
5
#LedgerHardwareImplantReportsExtendToDubai
189 views
38 Discussing
6
#NvidiaBoardNotConsideringHuang’sReturnasCEO
175,526 views
1,292 Discussing
7
#KOSPIFalls2.59%ToLowestCloseSinceFebruary
48,292 views
546 Discussing
8
#AnthropicClearedToListOnNasdaqAsANT
42,151 views
427 Discussing
9
#WhatInvestmentSignalsDo13FFilingsReveal?
93,963 views
827 Discussing
10
#TetherCapitalMakesStrategicInvestmentInStables
24,389 views
234 Discussing