

#icp
icp
16.2M views
24,946 Discussing
Hot
Latest

·
--
Bearish
WARNING ⚠️ $ICP Could Be Heading for Another Sharp Drop!
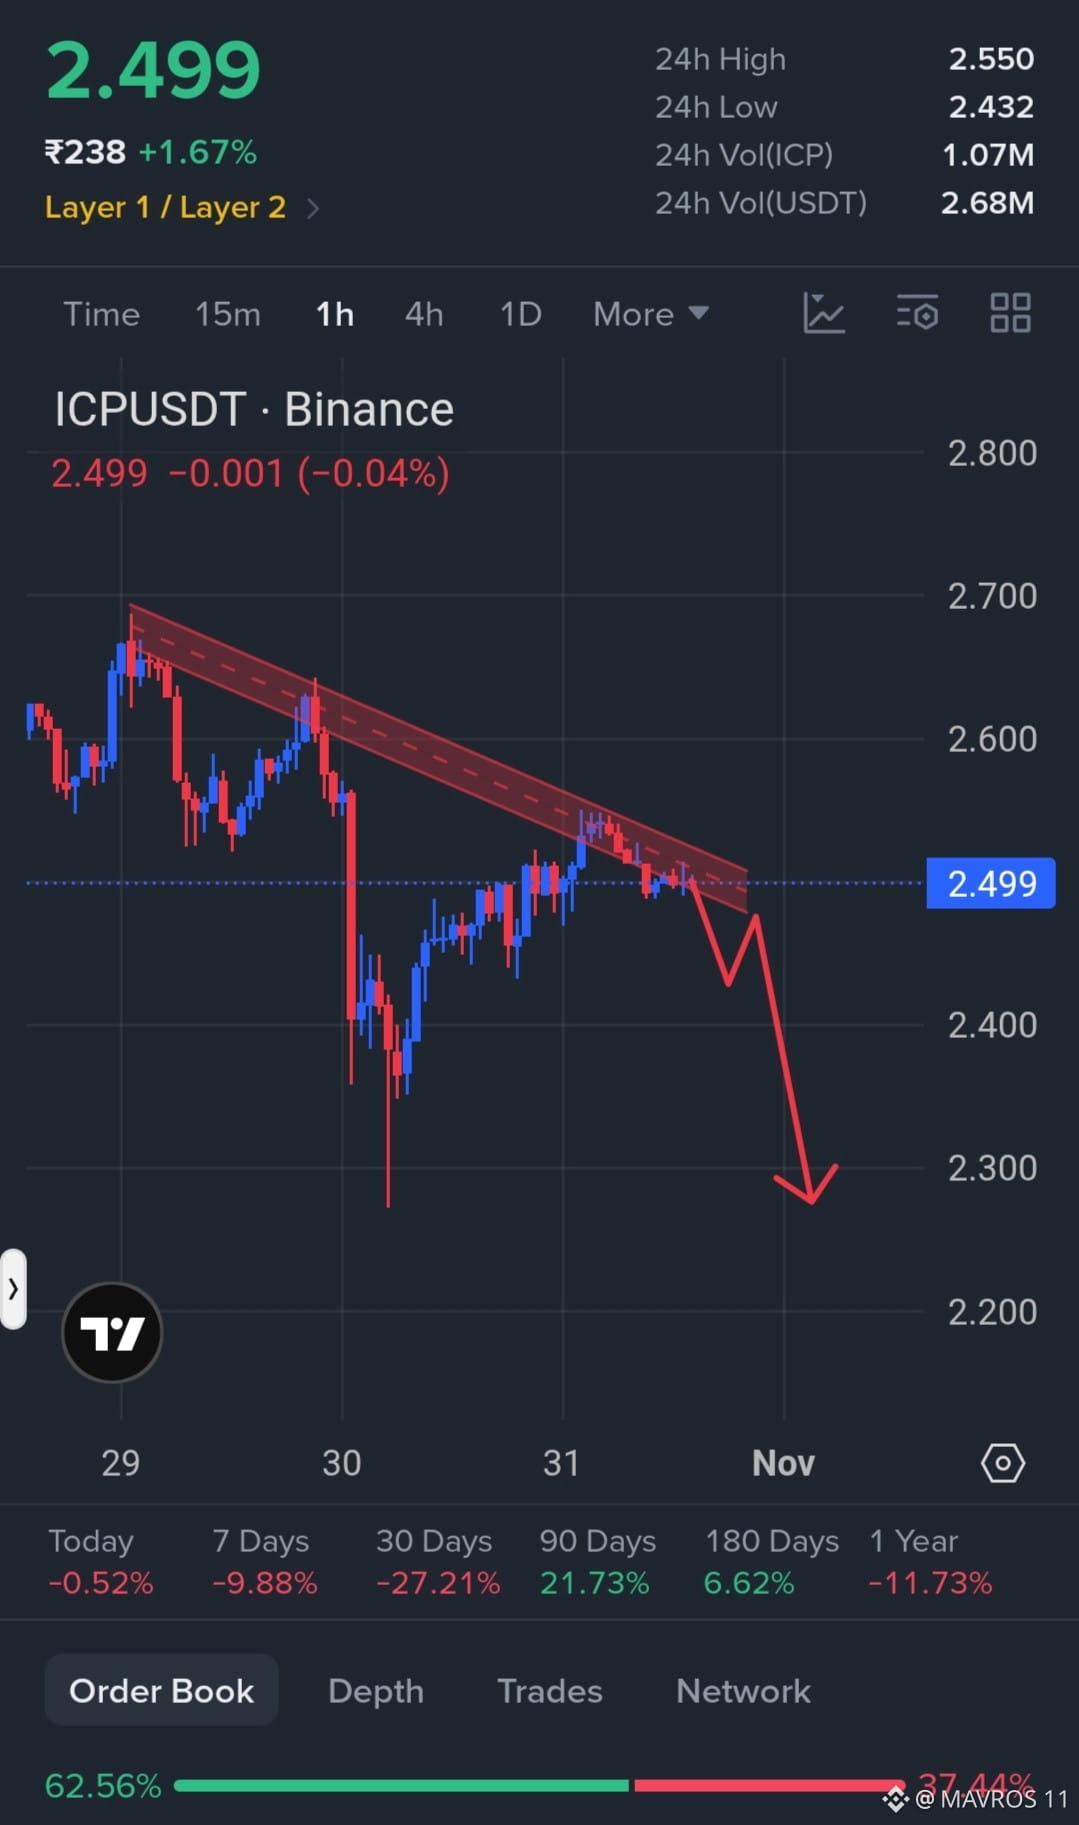
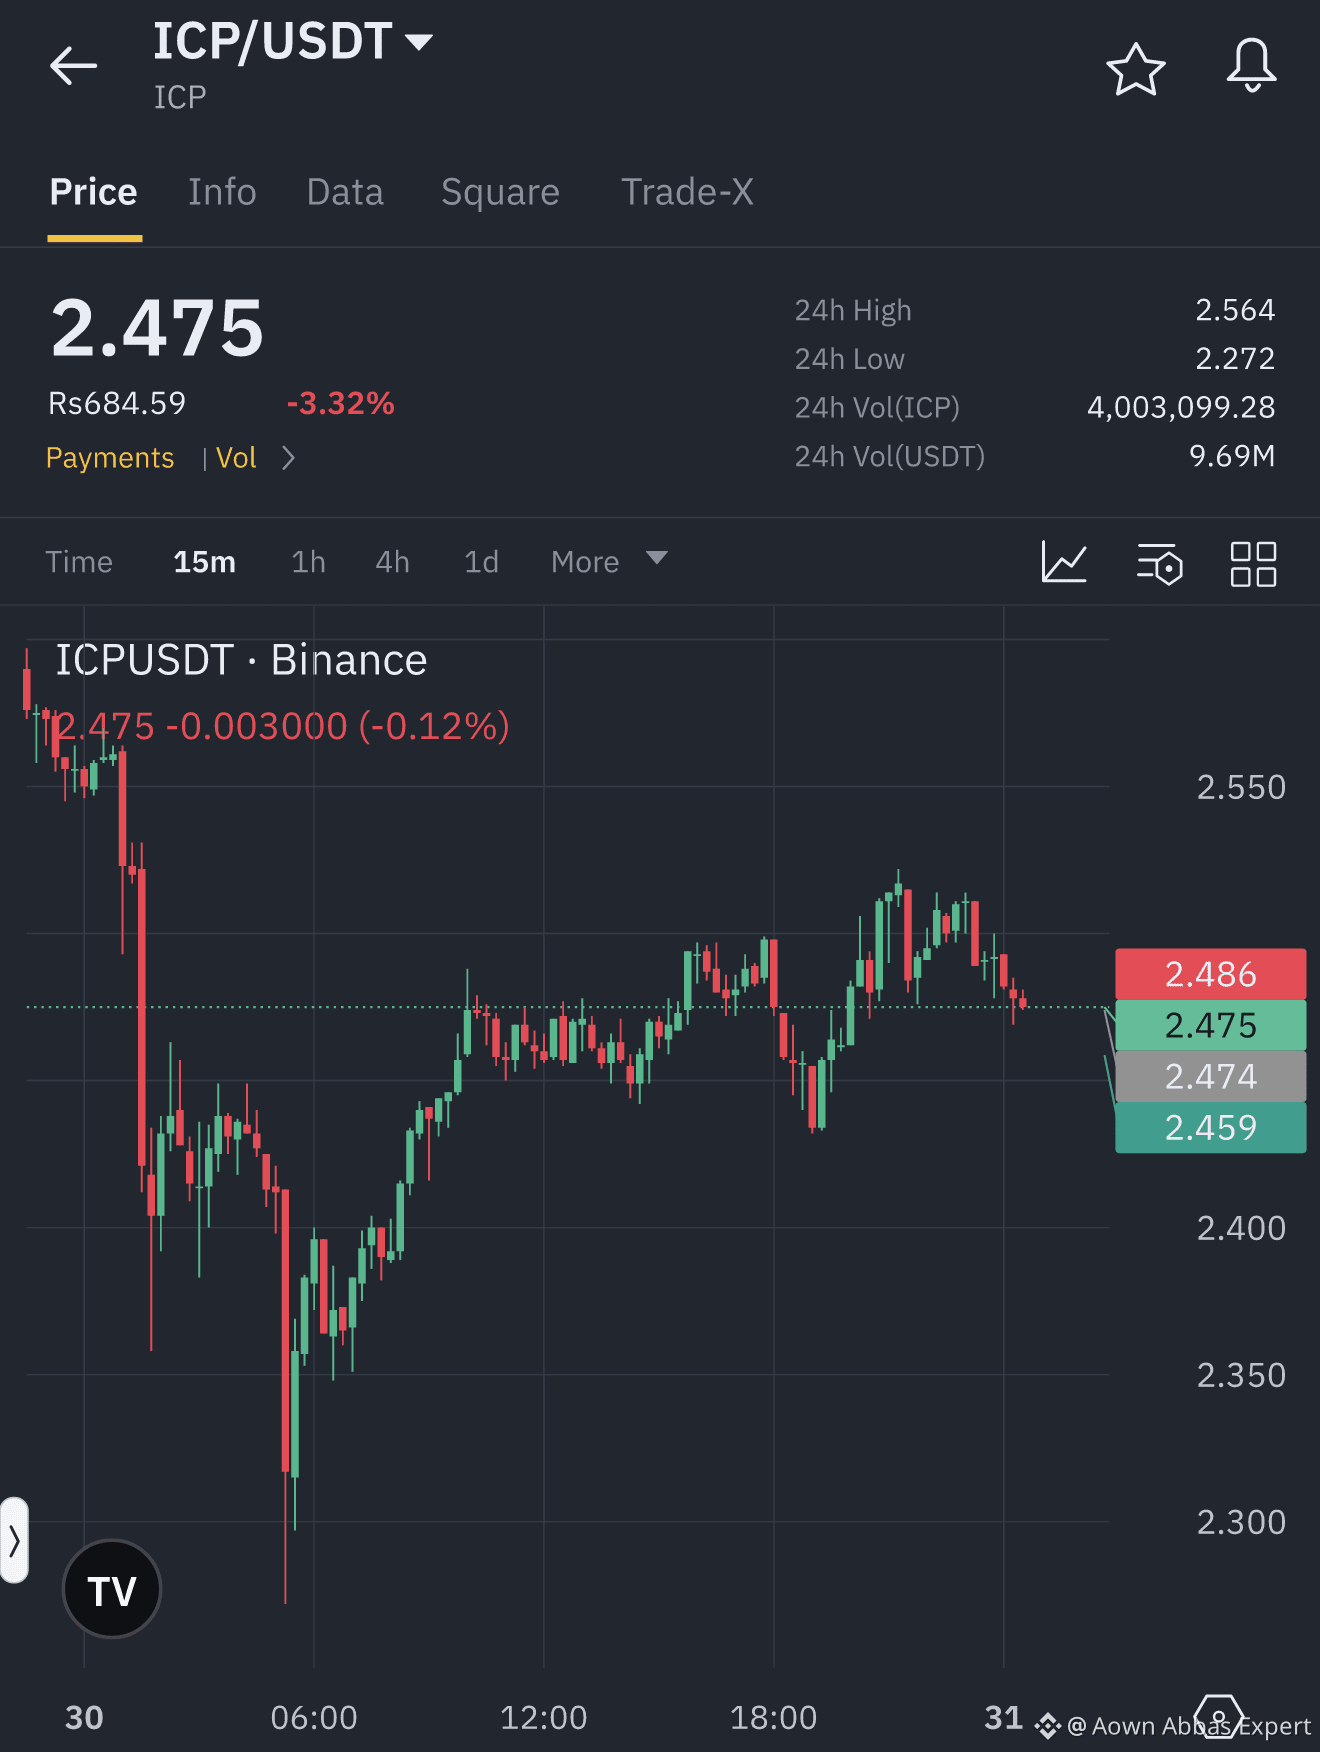
$ICP is struggling below a descending trendline on the 1H chart. Every recovery attempt is facing selling pressure, and the structure doesn't look strong right now.
What I'm watching: Price is trading near $2.50, under the descending resistance. Lower highs suggest sellers are still in control. A rejection near $2.50–$2.52 could trigger another move down. $2.40 is the first important support to watch. A breakdown could expose the $2.30 zone.
My view: Bulls need to reclaim the descending trendline. Otherwise, another leg down remains possible. Be careful with fresh longs here. ⚠️
Keep an eye on 👉$ICP
{future}(ICPUSDT)
#icp
WARNING ⚠️ $ICP Could Be Heading for Another Sharp Drop!
$ICP is struggling below a descending trendline on the 1H chart. Every recovery attempt is facing selling pressure, and the structure doesn't look strong right now.
What I'm watching: Price is trading near $2.50, under the descending resistance. Lower highs suggest sellers are still in control. A rejection near $2.50–$2.52 could trigger another move down. $2.40 is the first important support to watch. A breakdown could expose the $2.30 zone.
My view: Bulls need to reclaim the descending trendline. Otherwise, another leg down remains possible. Be careful with fresh longs here. ⚠️
Keep an eye on 👉$ICP
#icp
205

·
--
Bearish
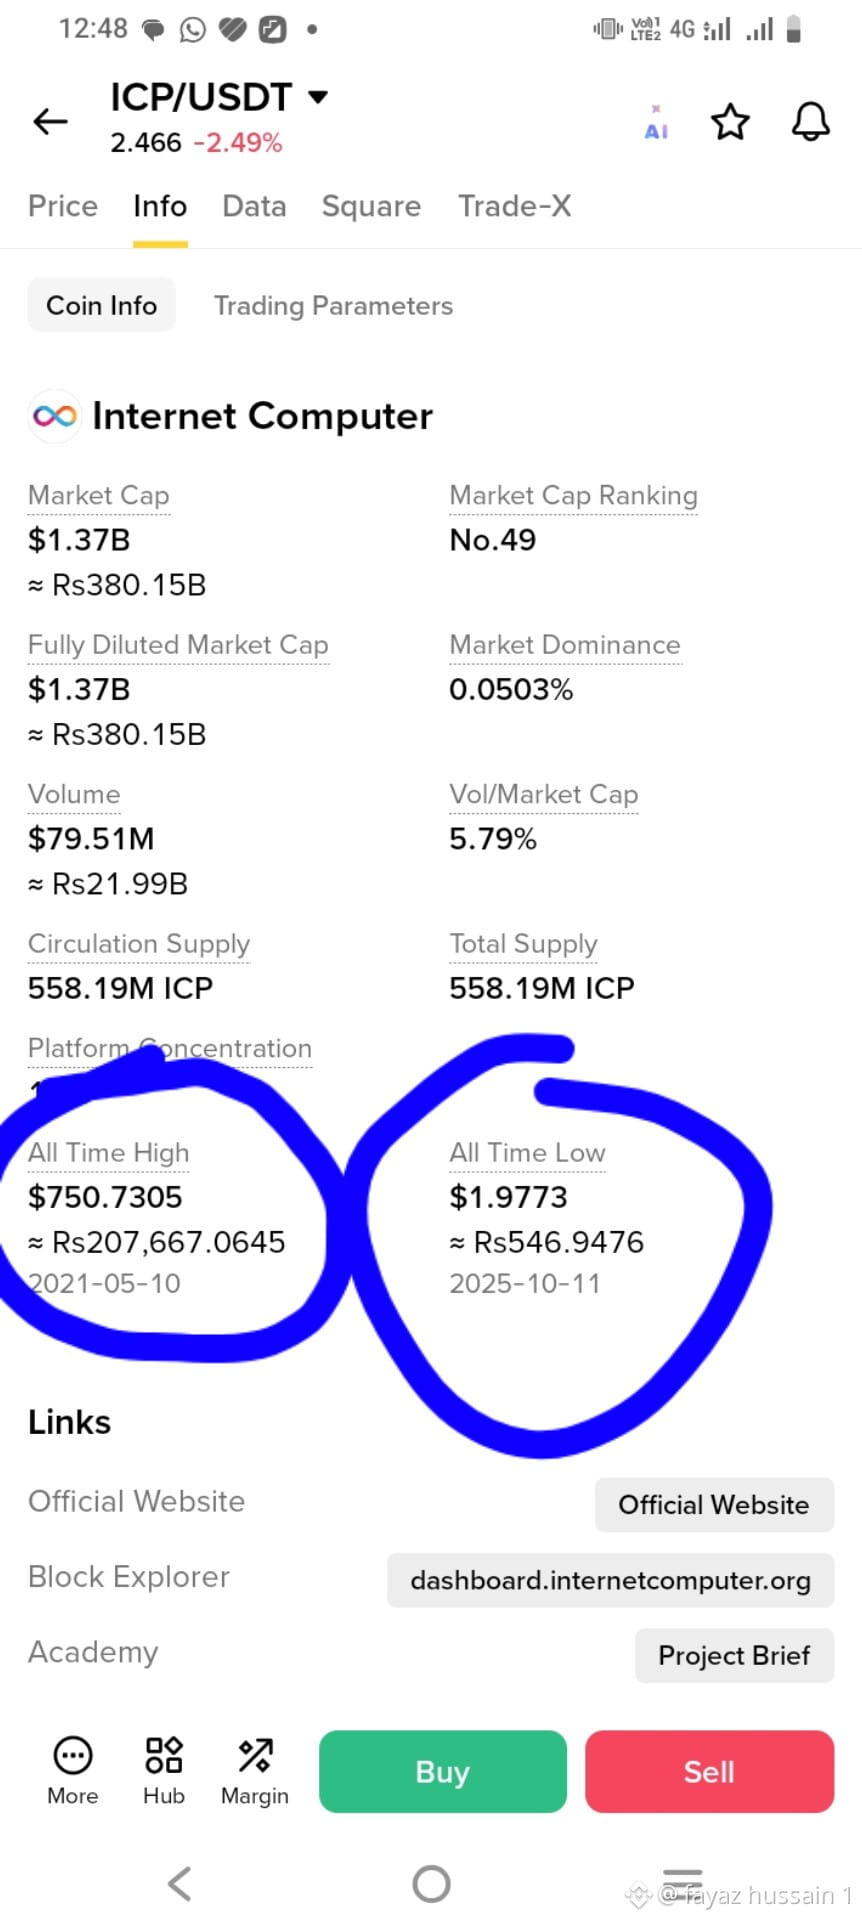
$ICP Could the next bull run completely change the story of ICP? 🚀
Crypto markets can move dramatically when investor confidence returns.
ICP has already experienced a huge correction, but what happens if demand starts increasing again?
Would you prefer to buy before the bull run begins or wait until the rally is confirmed?
Which strategy makes more sense to you? 🤔
#icp
{spot}(ICPUSDT)
$ICP Could the next bull run completely change the story of ICP? 🚀
Crypto markets can move dramatically when investor confidence returns.
ICP has already experienced a huge correction, but what happens if demand starts increasing again?
Would you prefer to buy before the bull run begins or wait until the rally is confirmed?
Which strategy makes more sense to you? 🤔
#icp
375


$ICP: Loud Candles Do Not Prove Certainty
Many traders assume a strong price move with high volume guarantees a new trend. This view often leads to overconfidence during short term shifts. The reality is that volume spikes can represent temporary selling pressure or algorithmic rebalancing rather than sustained buyer intent.
In the case of ICP, the price is currently trading below support. The hourly direction is down, and the volume is not above baseline. This specific combination challenges the idea that immediate action is required. A drop below a key level without significant volume suggests the market is not fully committed to the downside. Instead of a breakaway move, this pattern often reflects a consolidation phase where sellers are testing the floor. The mechanism at work here is uncertainty. When volume remains quiet while price makes new lows, it indicates that large institutional players may not be aggressively shorting. They might be waiting for confirmation before committing more capital. This pauses the decline and allows for potential stabilization.
This interpretation stops applying if the volume suddenly spikes above the average. A quiet break often fails quickly when true interest is low. However, if the price holds this lower area for an extended period, it transforms from a loss of support into a new zone of interest. Traders should reassess by watching for a retest of the previous support level. If the price returns and holds that line, the initial drop was likely a noise. If it continues lower with increasing volume, the assumption of a failed break becomes more realistic. Distinguishing between a pause and a trend requires patience and specific evidence rather than simple price direction.
Probabilistic market research, not a recommendation or guaranteed return.
Which trading assumption would you like to question next?
#ICP #CryptoLearning
$ICP : Loud Candles Do Not Prove Certainty
Many traders assume a strong price move with high volume guarantees a new trend. This view often leads to overconfidence during short term shifts. The reality is that volume spikes can represent temporary selling pressure or algorithmic rebalancing rather than sustained buyer intent.
In the case of ICP, the price is currently trading below support. The hourly direction is down, and the volume is not above baseline. This specific combination challenges the idea that immediate action is required. A drop below a key level without significant volume suggests the market is not fully committed to the downside. Instead of a breakaway move, this pattern often reflects a consolidation phase where sellers are testing the floor. The mechanism at work here is uncertainty. When volume remains quiet while price makes new lows, it indicates that large institutional players may not be aggressively shorting. They might be waiting for confirmation before committing more capital. This pauses the decline and allows for potential stabilization.
This interpretation stops applying if the volume suddenly spikes above the average. A quiet break often fails quickly when true interest is low. However, if the price holds this lower area for an extended period, it transforms from a loss of support into a new zone of interest. Traders should reassess by watching for a retest of the previous support level. If the price returns and holds that line, the initial drop was likely a noise. If it continues lower with increasing volume, the assumption of a failed break becomes more realistic. Distinguishing between a pause and a trend requires patience and specific evidence rather than simple price direction.
Probabilistic market research, not a recommendation or guaranteed return.
Which trading assumption would you like to question next?
#ICP #CryptoLearning
Alishacherry:
Tip me 5 bucks, i will dm you and tell you something about dolly
1
75
$ICP: ICP Volume Signals Compared With Peers
### Primary Asset Question
ICP shows an hourly direction up and volume above baseline. The price sits above resistance, suggesting a short‑term bias but the strength of that bias depends on how the move holds over the next periods.
### What the Peer Observations Add
Ethereum shares the same upward hourly direction and also trades with volume above its baseline. This parallel suggests a common market pressure but does not prove that the two moves are linked. By contrast, Lisk displays an hourly direction down while still recording volume above baseline. The opposite direction highlights that high volume can accompany both buying and selling pressure, reminding us that volume alone does not dictate price path.
### What This Comparison Cannot Establish
The shared direction between ICP and Ethereum cannot be taken as evidence of correlation, capital rotation, or a sector effect. Likewise, the divergent direction of Lisk does not cancel the observation that volume is elevated across all three assets. The key question remains whether the direction or the persistence of the move matters more. A practical next step is to monitor how the hourly direction interacts with the next support or resistance level and watch for any change in volume intensity. This approach keeps the analysis grounded in observable data rather than speculation.
Probabilistic market research, not a recommendation or guaranteed return.
The comparison to keep in mind: $ETH has hourly direction up and volume above its baseline; $LSK has hourly direction down and volume above its baseline. This alone does not establish correlation.
Which matters more in this comparison: direction or how the move holds?
#ICP #ETH #LSK #CryptoWatchlist #CryptoLearning
Binance spot proof for $ICP: closed price 2.524 USDT.
Source: binance. Closed candle: 2026-10-31T16:30:00+00:00.
$ICP : ICP Volume Signals Compared With Peers
### Primary Asset Question
ICP shows an hourly direction up and volume above baseline. The price sits above resistance, suggesting a short‑term bias but the strength of that bias depends on how the move holds over the next periods.
### What the Peer Observations Add
Ethereum shares the same upward hourly direction and also trades with volume above its baseline. This parallel suggests a common market pressure but does not prove that the two moves are linked. By contrast, Lisk displays an hourly direction down while still recording volume above baseline. The opposite direction highlights that high volume can accompany both buying and selling pressure, reminding us that volume alone does not dictate price path.
### What This Comparison Cannot Establish
The shared direction between ICP and Ethereum cannot be taken as evidence of correlation, capital rotation, or a sector effect. Likewise, the divergent direction of Lisk does not cancel the observation that volume is elevated across all three assets. The key question remains whether the direction or the persistence of the move matters more. A practical next step is to monitor how the hourly direction interacts with the next support or resistance level and watch for any change in volume intensity. This approach keeps the analysis grounded in observable data rather than speculation.
Probabilistic market research, not a recommendation or guaranteed return.
The comparison to keep in mind: $ETH has hourly direction up and volume above its baseline; $LSK has hourly direction down and volume above its baseline. This alone does not establish correlation.
Which matters more in this comparison: direction or how the move holds?
#ICP #ETH #LSK #CryptoWatchlist #CryptoLearning
Binance spot proof for $ICP : closed price 2.524 USDT.
Source: binance. Closed candle: 2026-10-31T16:30:00+00:00.
27
·
--
Bearish
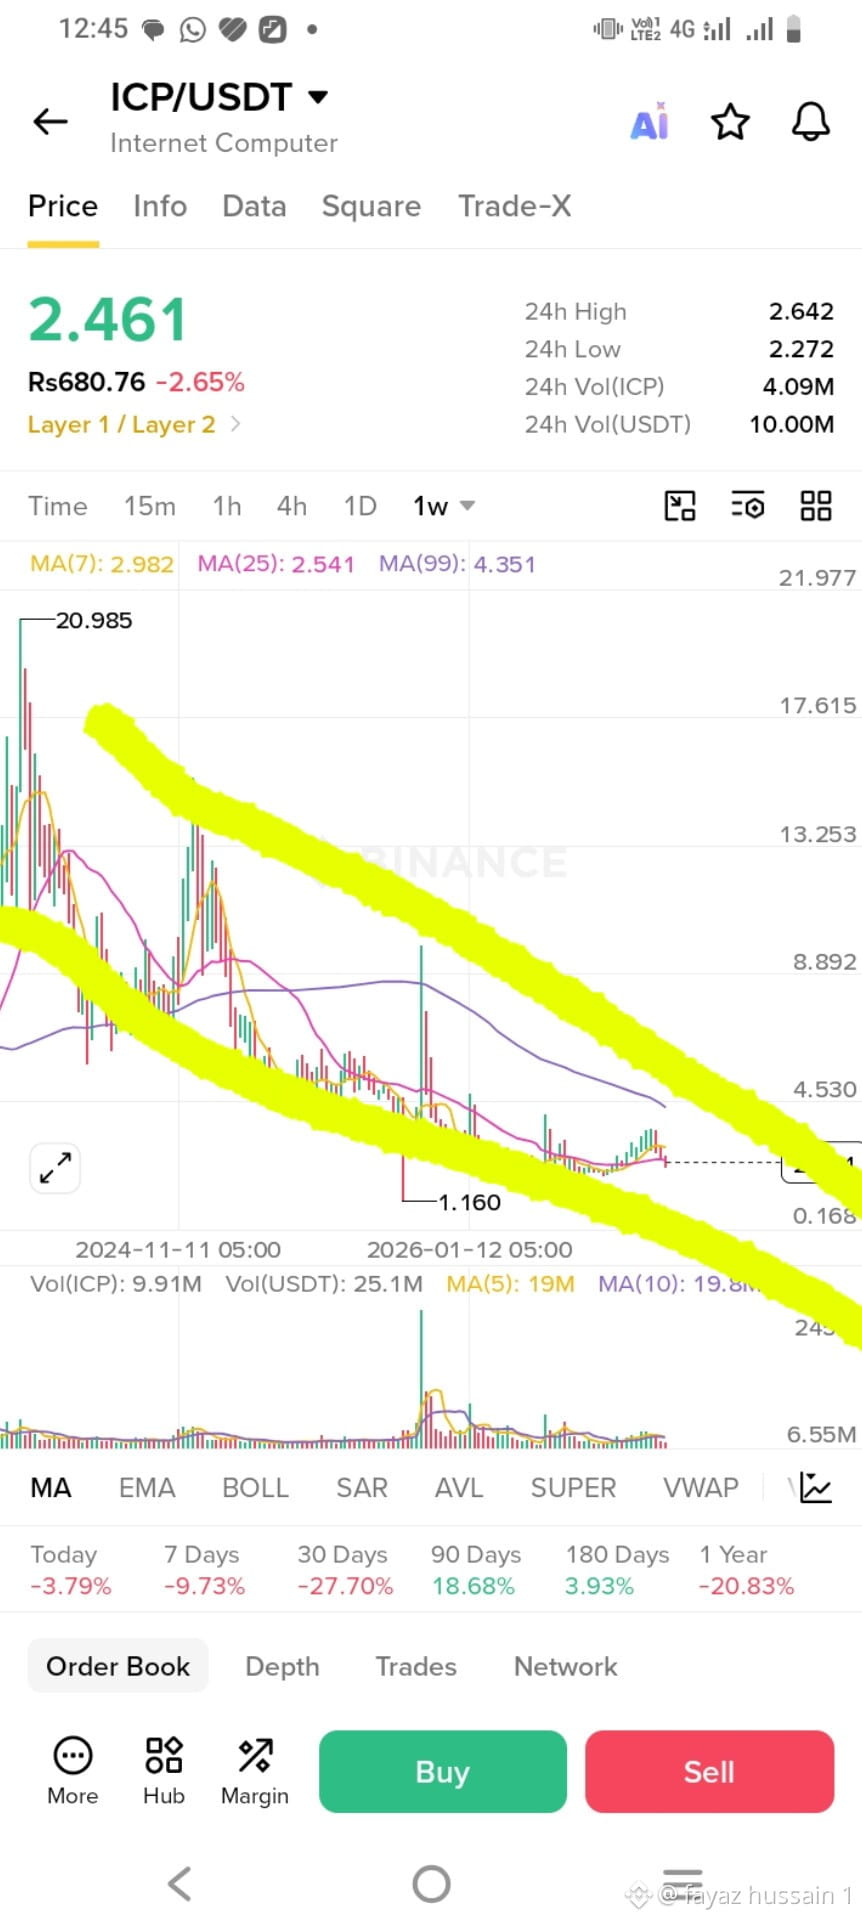
$ICP ICP: A forgotten opportunity or a risky investment? 😲
When a cryptocurrency falls this much, investors start questioning its future.
But sometimes the biggest market recoveries come from unexpected places.
Could ICP regain its strength during the next bull run?
Would you buy now for a possible long-term recovery, or stay away? 📈
#icp
{spot}(ICPUSDT)
$ICP ICP: A forgotten opportunity or a risky investment? 😲
When a cryptocurrency falls this much, investors start questioning its future.
But sometimes the biggest market recoveries come from unexpected places.
Could ICP regain its strength during the next bull run?
Would you buy now for a possible long-term recovery, or stay away? 📈
#icp
When a cryptocurrency falls this much, investors start questioning its future.
But sometimes the biggest market recoveries come from unexpected places.
Could ICP regain its strength during the next bull run?
Would you buy now for a possible long-term recovery, or stay away? 📈
#icp
486

·
--
🚨 $ICP SMASHES 300 BILLION TRANSACTIONS AS BLOCKCHAIN SHIFTS TO GLOBAL CLOUD POWER! 💥
Smart money isn't just watching pure DeFi playbooks anymore; $ICP just flipped the script by processing over 300 billion total transactions. 📊 That is equivalent to every human on Earth executing 36 network calls on-chain, proving this engine can handle heavy enterprise workloads without choking. ⚡
While most networks fight over basic token swaps, $ICP is aggressively positioning itself as decentralized cloud infrastructure to run real AI models and massive data storage. 💡 The architecture is proving that throughput scales far beyond financial speculation into high-volume real-world utility. 🔍
💬 Will decentralized networks completely displace traditional web cloud giants over the next market cycle? 👇
⚠️ Not financial advice. Always manage your risk. 🛡️
🏷️ #ICP #Web3 #CloudInfrastructure #Crypto
🔥 💎
25
·
--
Bearish
$ICP Quick profit or long-term patience? What's better for ICP? 🤔
Some investors might prefer selling after a 10–20% recovery.
Others may believe holding until the next bull run could offer a much bigger opportunity.
Of course, neither outcome is guaranteed.
If you bought ICP today, what would be your strategy?
Take profits early or hold for the bigger picture? 📈
#icp
{spot}(ICPUSDT)
$ICP Quick profit or long-term patience? What's better for ICP? 🤔
Some investors might prefer selling after a 10–20% recovery.
Others may believe holding until the next bull run could offer a much bigger opportunity.
Of course, neither outcome is guaranteed.
If you bought ICP today, what would be your strategy?
Take profits early or hold for the bigger picture? 📈
#icp
195

·
--
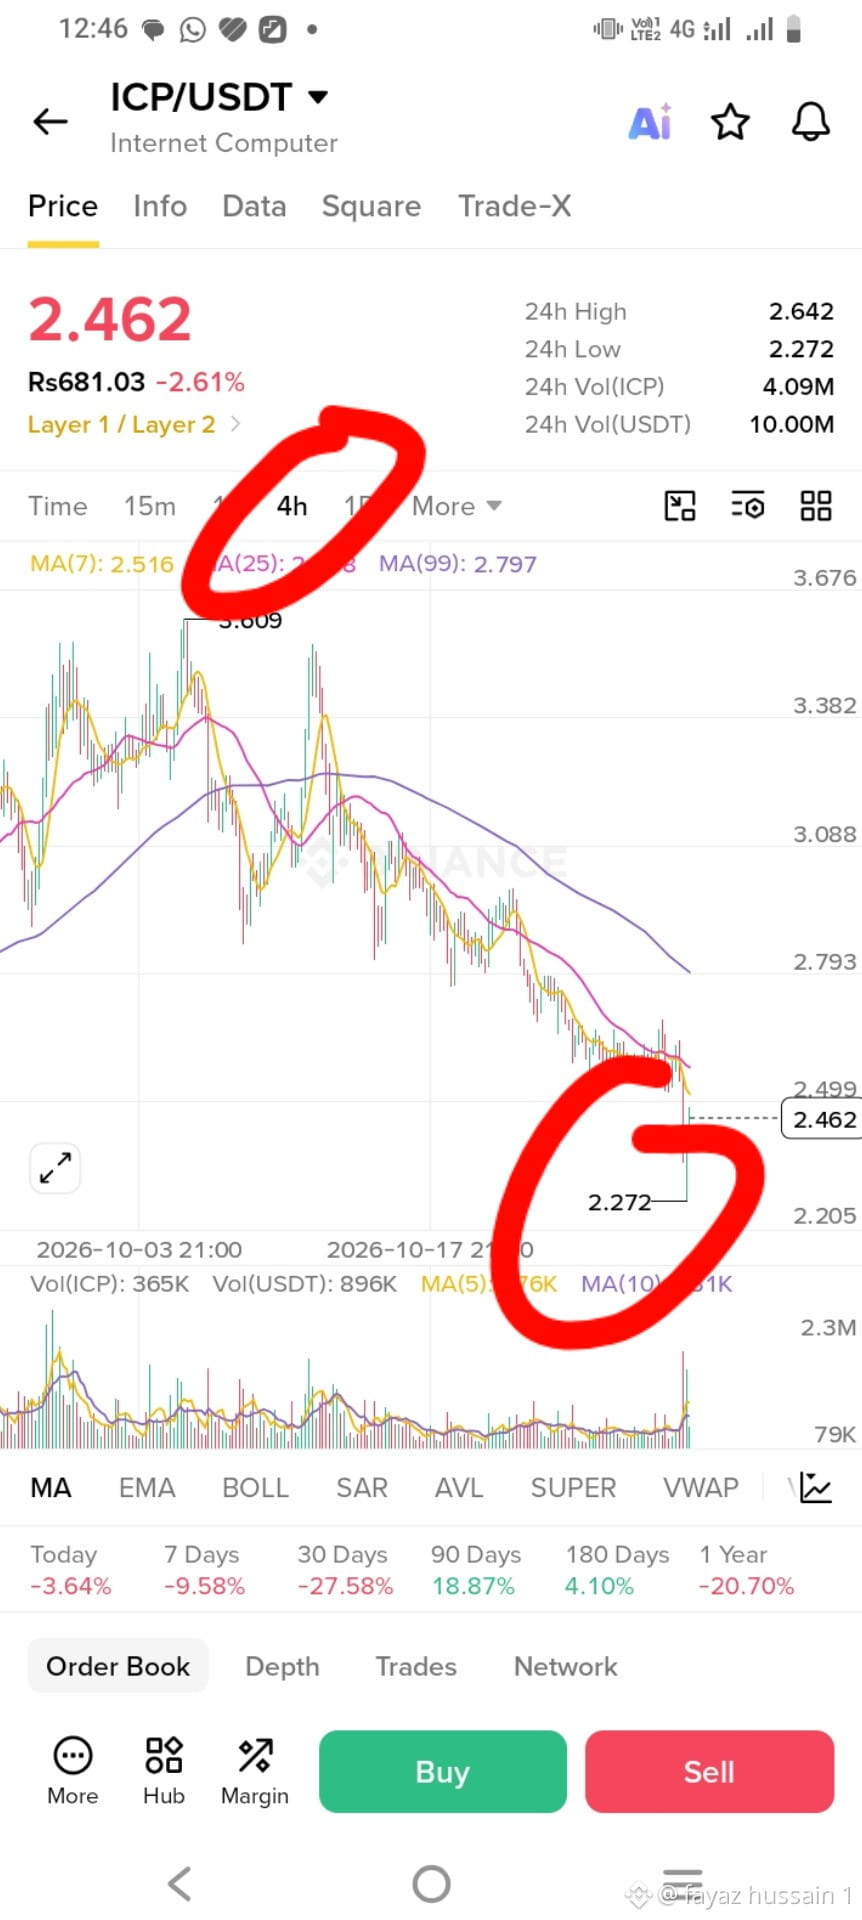
🚨 $ICP HEAVY DISTRIBUTION PATTERN SIGNALS AN IMMEDIATE FLIP TO BEARS! 📉
Entry: 2.396 - 2.444 🔻
Target: 2.37 / 2.27 / 2.19 🎯
Stop Loss: 2.62 ⚠️
Sellers are aggressively defending resistance near 2.44, suffocating every minor bounce as overhead supply builds up. 📊 Market momentum is shifting rapidly, pointing toward a clear breakdown as bid depth thins out.
Order flow signals smart money positioning for a swift liquidity sweep down toward lower demand levels. 💡 With invalidation clean above 2.62, this setup offers high structural conviction for short expansion. 🤔 Are you letting the bears work this move or riding the trend down to support? 👇
⚠️ Not financial advice. Always manage your risk. 🛡️
🏷️ #ICP #ShortSetup #Crypto #Bearish #Trading
📉 🐻
14

·
--
Bullish
Partly True
$ICP has become the blockchain for the AI revolution.
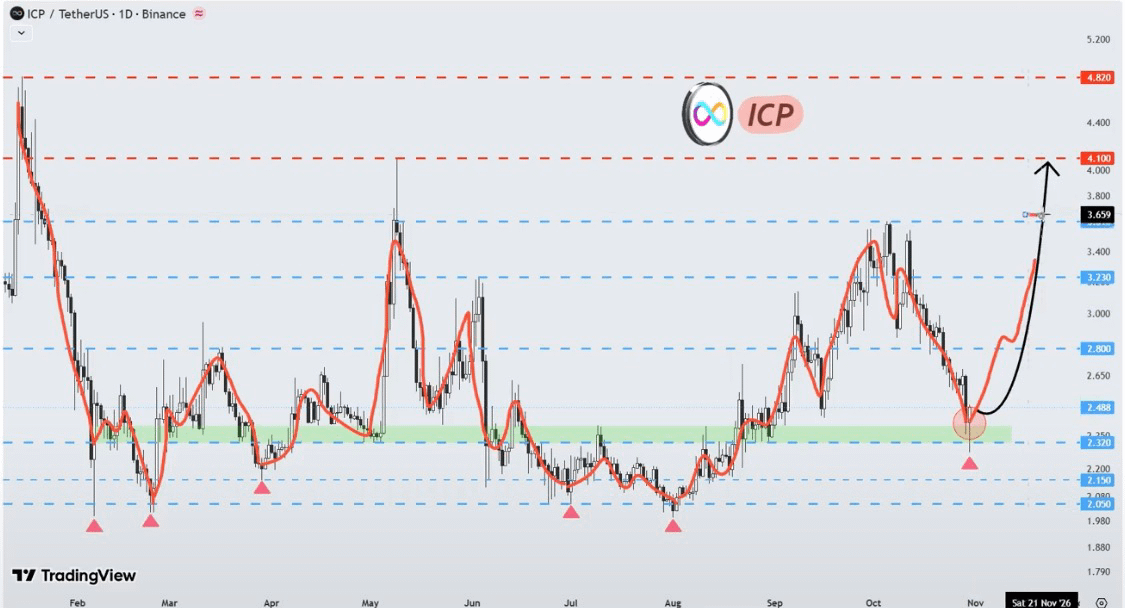
Right now, Internet Computer is holding above the broken support/resistance zone on the daily chart.
#ICP is now properly connected with both Claude and ChatGPT. People can build applications and set up cloud infrastructure directly through these two biggest AI platforms.
This is not a rumour. It is already live.
If it bounces from here, the next target levels are:
• $2.80
• $3.23
• $3.61
• $4.10
{spot}(ICPUSDT)
$ICP has become the blockchain for the AI revolution.
Right now, Internet Computer is holding above the broken support/resistance zone on the daily chart.
#ICP is now properly connected with both Claude and ChatGPT. People can build applications and set up cloud infrastructure directly through these two biggest AI platforms.
This is not a rumour. It is already live.
If it bounces from here, the next target levels are:
• $2.80
• $3.23
• $3.61
• $4.10
6
2.9k
·
--
🐂 $ICP DEFENDS CRITICAL SUPPORT AS BUYERS STEP IN FOR A POTENTIAL RECOVERY! 💥
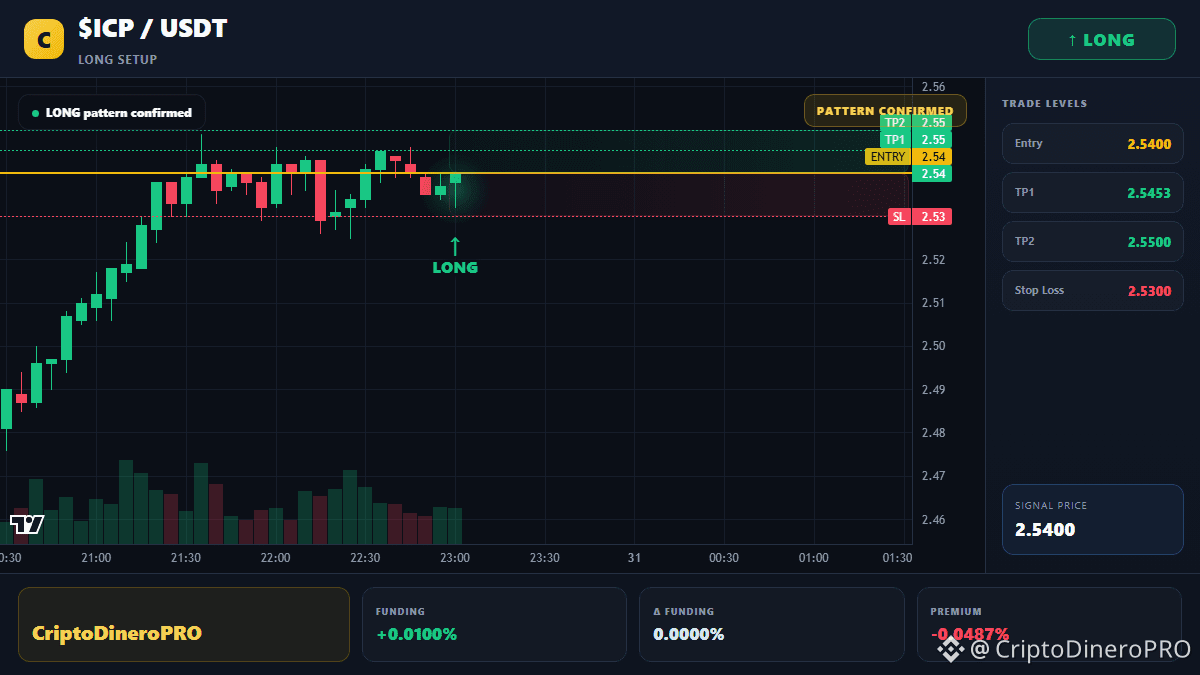
Entry: 2.440 - 2.460 ⚡
Target: 2.500 - 2.600 🚀
Stop Loss: 2.395 ⚠️
📌 Sellers tried pushing lower, but strong bids stepped up cleanly right at the 2.40 demand floor. 📊 The market structure is resetting into a higher-low consolidation, showing early signs of order flow turning back toward the upside.
⚡ Reclaiming the 2.50 handle will be the trigger to unlock velocity up toward the 2.54 and 2.60 resistance pockets. 💡 As long as the invalidation level holds tight, risk-reward favors the patient long position. 💬 Are you loading your bids on this floor or waiting for 2.50 to clear first? 👇
⚠️ Not financial advice. Always manage your risk. 🛡️
🏷️ #ICP #LongSetup #Altcoins #Crypto #Breakout
🔥 💎
34

·
--
⚡ $ICP GEARS UP FOR EXPLOSIVE EXPANSION AFTER HOLDING CRITICAL DEMAND ZONE! 🚀
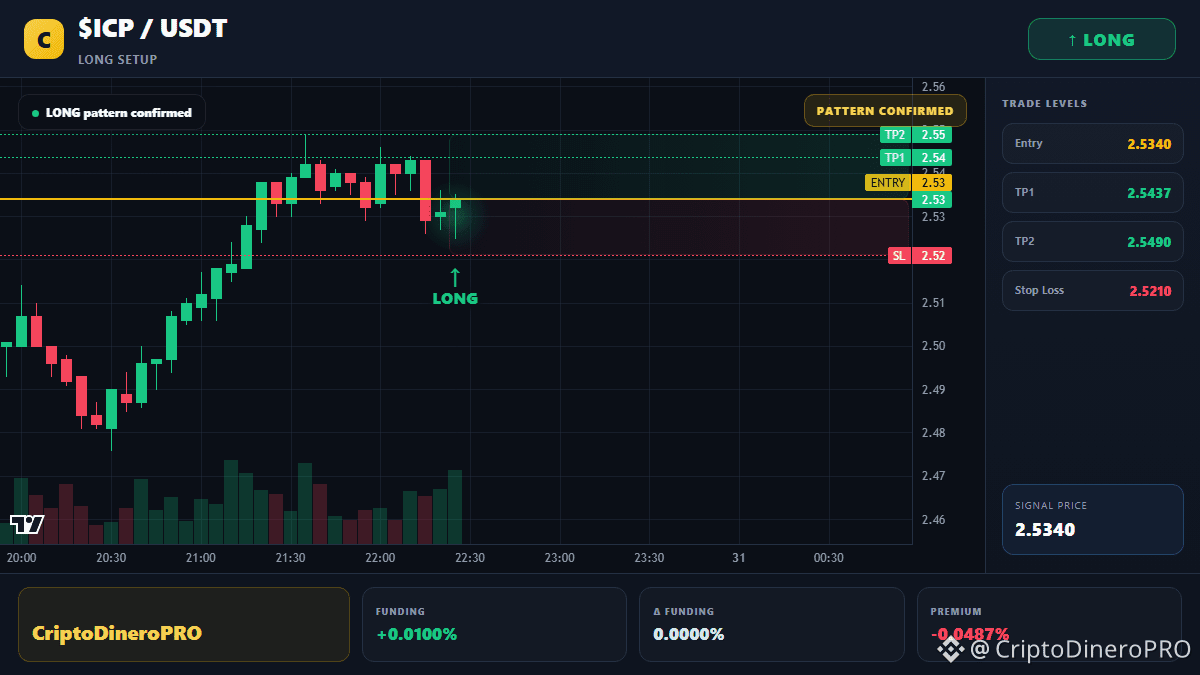
Entry: 2.445 – 2.461 ⚡
Target: 2.827 🚀
Stop Loss: 2.307 ⚠️
$ICP is currently defending the pivotal 2.346 floor with serious conviction, absorbing seller pressure while setting up the 4H structure for a clean momentum flip. 📊 Order flow indicates buyers are steadily accumulating right above support before the next upside expansion.
A sustained push out of this current consolidation opens a clean runway directly toward the 2.827 objective. 💡 Risk is tightly defined, giving us a sharp asymmetric opportunity to capture the next volatility spike.
💬 Are you bidding this accumulation pocket, or waiting for high-timeframe confirmation? 👇
⚠️ Not financial advice. Always manage your risk. 🛡️
🏷️ #ICP #LongSetup #Crypto #Breakout
🔥 💎
14
·
--
Bearish
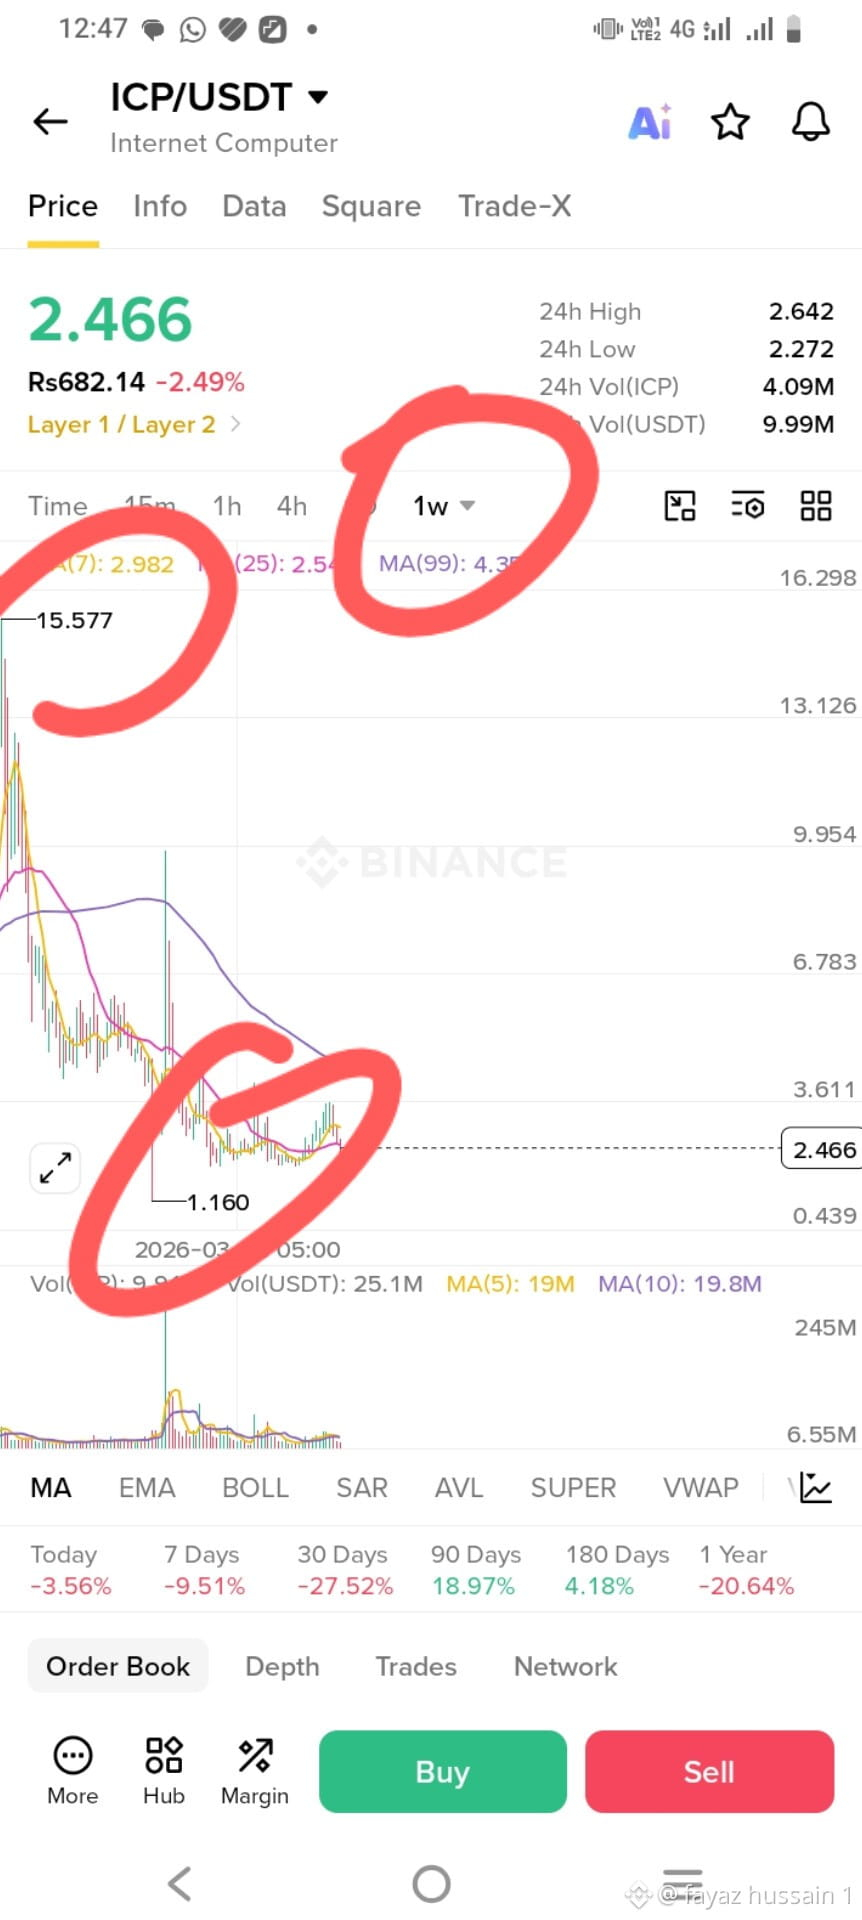
$ICP What if ICP is currently being ignored by the market? 👀
When prices fall significantly, attention often shifts to other cryptocurrencies.
But could renewed demand bring ICP back into the spotlight during the next bull run?
Would you accumulate slowly at lower levels, or wait until positive momentum returns?
What's your prediction for ICP? 🚀
#icp
{spot}(ICPUSDT)
$ICP What if ICP is currently being ignored by the market? 👀
When prices fall significantly, attention often shifts to other cryptocurrencies.
But could renewed demand bring ICP back into the spotlight during the next bull run?
Would you accumulate slowly at lower levels, or wait until positive momentum returns?
What's your prediction for ICP? 🚀
#icp
When prices fall significantly, attention often shifts to other cryptocurrencies.
But could renewed demand bring ICP back into the spotlight during the next bull run?
Would you accumulate slowly at lower levels, or wait until positive momentum returns?
What's your prediction for ICP? 🚀
#icp
39
·
--
Bearish
$ICP
{spot}(ICPUSDT)
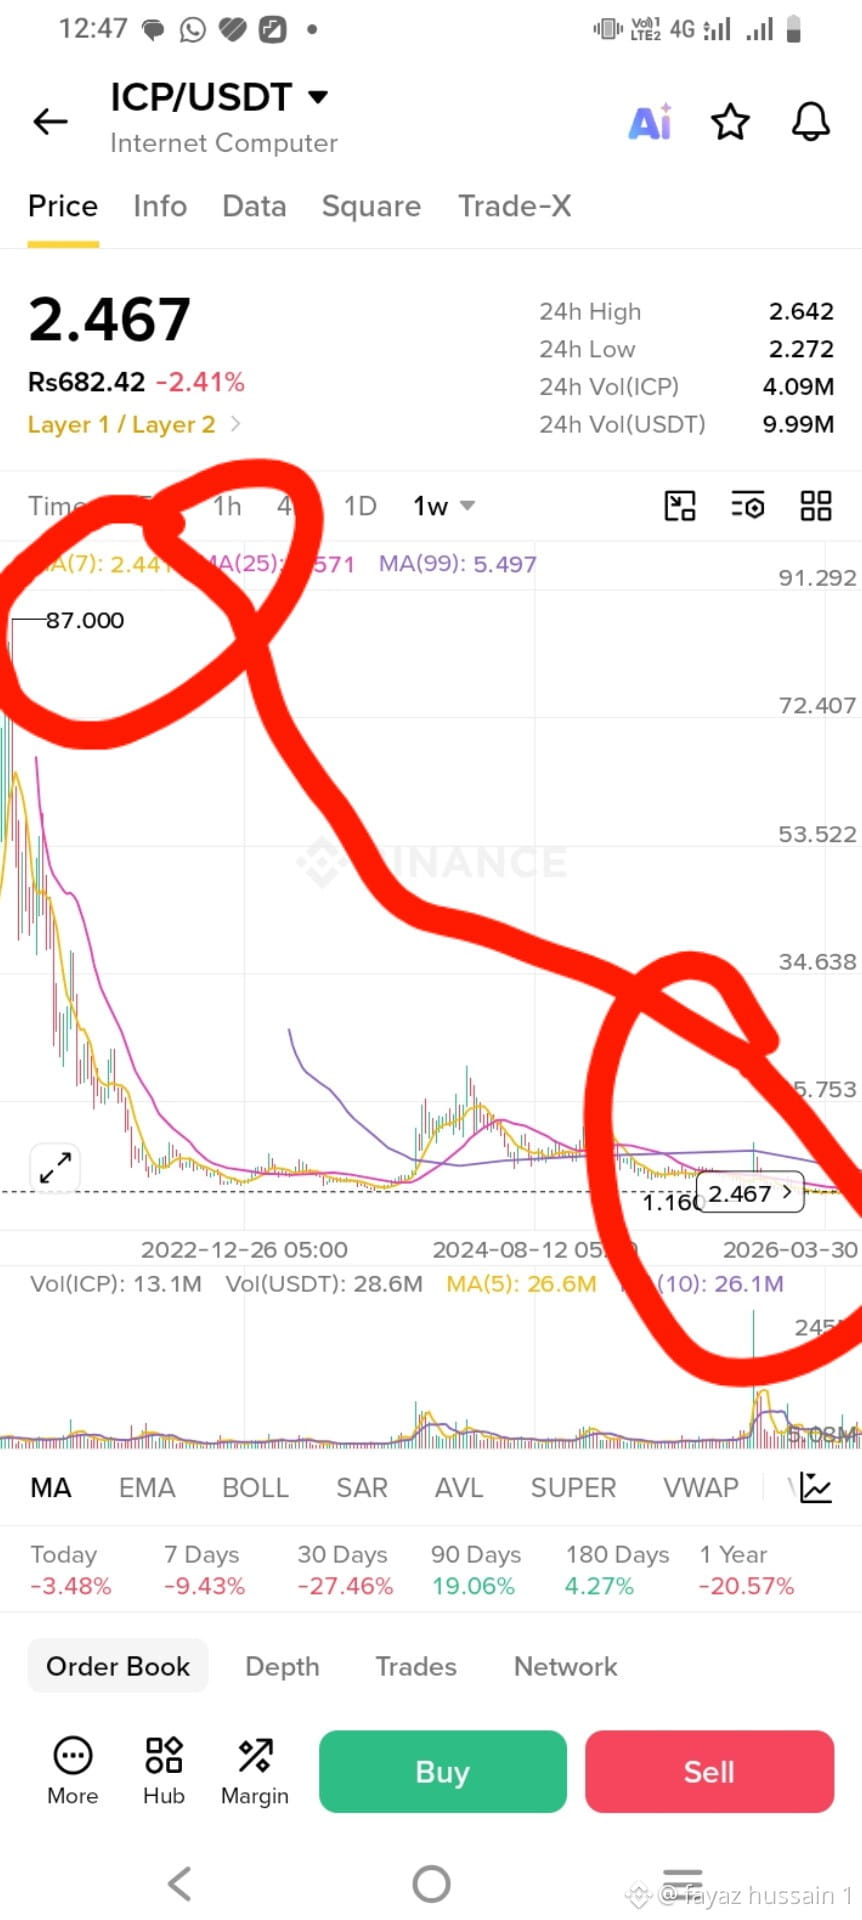
One question for ICP investors: What is your long-term target? 🎯
Are you looking for a short-term 10% or 20% recovery, or are you expecting a much bigger move during the next bull run?
Everyone has a different strategy, but having an exit plan is just as important as buying.
What price would make you consider selling your ICP? 👇
#icp
$ICP
One question for ICP investors: What is your long-term target? 🎯
Are you looking for a short-term 10% or 20% recovery, or are you expecting a much bigger move during the next bull run?
Everyone has a different strategy, but having an exit plan is just as important as buying.
What price would make you consider selling your ICP? 👇
#icp
65

·
--
Bearish
$ICP
{spot}(ICPUSDT)
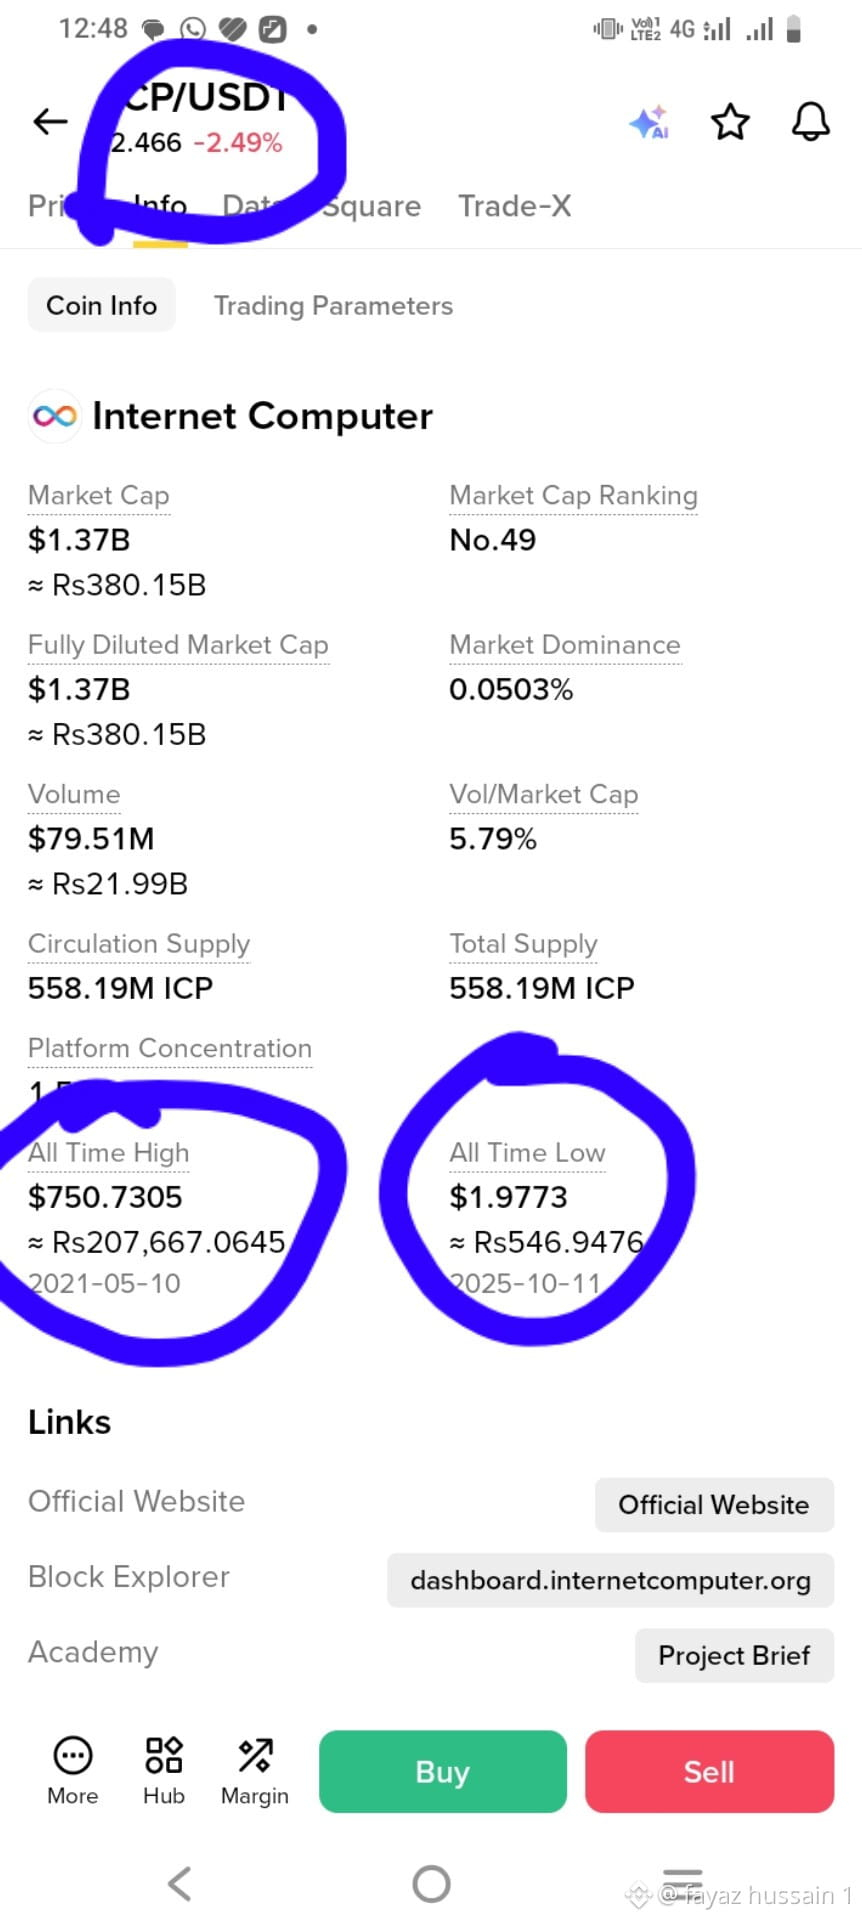
Would you rather buy ICP at a low price or wait for positive market news? 🤔
Buying early can offer a better entry, but it also comes with uncertainty.
Waiting for positive developments may reduce some risks, although the price could move higher first.
There is no perfect strategy in crypto.
How would you approach ICP right now? 📈
#icp
$ICP
Would you rather buy ICP at a low price or wait for positive market news? 🤔
Buying early can offer a better entry, but it also comes with uncertainty.
Waiting for positive developments may reduce some risks, although the price could move higher first.
There is no perfect strategy in crypto.
How would you approach ICP right now? 📈
#icp
112

Partly True
The Internet Computer (#icp ) network just turned 5 years old. To mark the occasion, the team is previewing something called “cloud engines” — a new way for people (and AI) to create their own highly secure, independent cloud environments. https://inkwellpublish.xyz/article/61
The Internet Computer (#icp ) network just turned 5 years old. To mark the occasion, the team is previewing something called “cloud engines” — a new way for people (and AI) to create their own highly secure, independent cloud environments. https://inkwellpublish.xyz/article/61

614
·
--
Bearish
$ICP
{spot}(ICPUSDT)
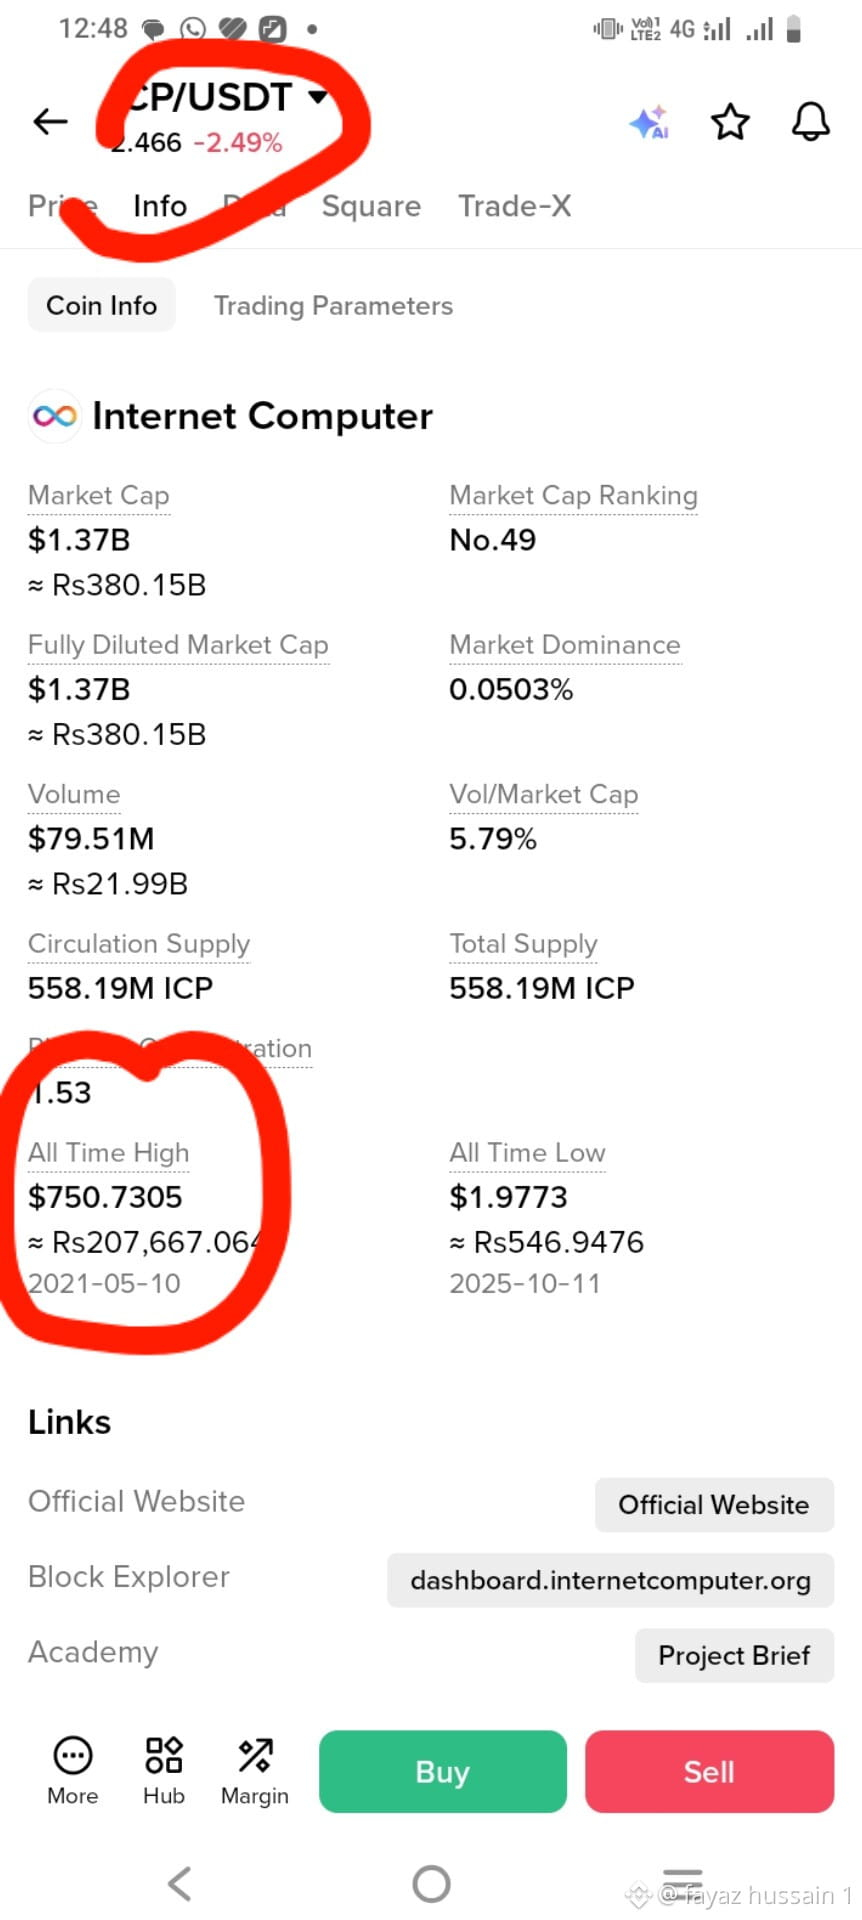
ICP investors, are you thinking about accumulating or waiting? 👀
Buying during a market downturn can be challenging because nobody knows how much further prices might fall.
But waiting for complete confirmation can also mean entering at a higher price.
Would you prefer dollar-cost averaging or making one big purchase?
What's your ICP strategy? 🤔
#icp
$ICP
ICP investors, are you thinking about accumulating or waiting? 👀
Buying during a market downturn can be challenging because nobody knows how much further prices might fall.
But waiting for complete confirmation can also mean entering at a higher price.
Would you prefer dollar-cost averaging or making one big purchase?
What's your ICP strategy? 🤔
#icp
92
·
--
Bearish
$ICP Could ICP become one of the interesting recovery plays of the next bull market? 🚀
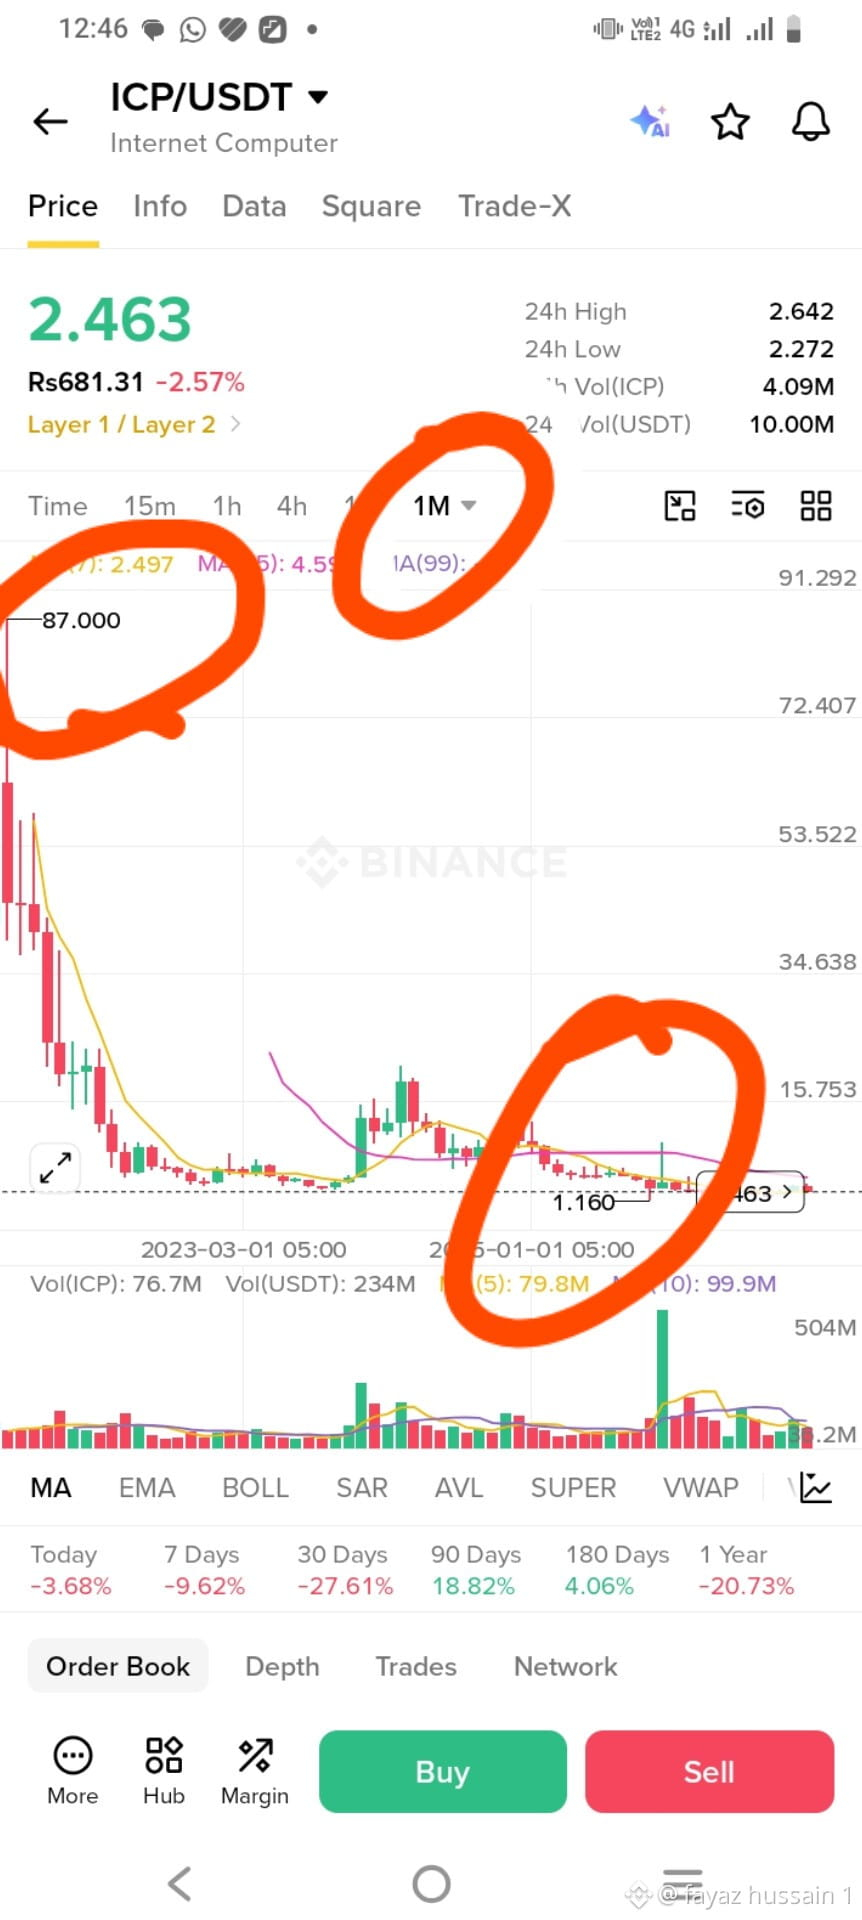
Many investors are searching for cryptocurrencies with significant upside potential.
ICP has experienced a major correction, but can it regain investor confidence?
Would you consider holding ICP through the next bull cycle?
Or do you think there are better opportunities elsewhere? 👇
#icp
{spot}(ICPUSDT)
$ICP Could ICP become one of the interesting recovery plays of the next bull market? 🚀
Many investors are searching for cryptocurrencies with significant upside potential.
ICP has experienced a major correction, but can it regain investor confidence?
Would you consider holding ICP through the next bull cycle?
Or do you think there are better opportunities elsewhere? 👇
#icp
Many investors are searching for cryptocurrencies with significant upside potential.
ICP has experienced a major correction, but can it regain investor confidence?
Would you consider holding ICP through the next bull cycle?
Or do you think there are better opportunities elsewhere? 👇
#icp
86
Log in to explore more content
Join global crypto users on Binance Square
⚡️ Get latest and useful information about crypto.
💬 Trusted by the world’s largest crypto exchange.
👍 Discover real insights from verified creators.
Email / Phone number
Trending Topics
1
#BinanceSAFUFundTransferCompleted7499BTC
1,064 views
98 Discussing
2
#BinanceRecovery90% of stolen assets
27,675 views
88 Discussing
3
#YiHe:ProofOfReserves:10TokensAt100%Backing
68,319 views
316 Discussing
4
#BackedNotBroken:RichardTengSaysUsersBearNoLoss
4,111 views
173 Discussing
5
#CZSaysCompensationIsinPlaceUsersAreProtected
74,180 views
1,007 Discussing
6
#IntelHasItsWorstDaySince1974
20,039 views
451 Discussing
7
#TRMCambodianCasinosReceived$1.07BInCrypto
4,884 views
57 Discussing
8
#USDCCirculationFallsAbout800MInSevenDays
41,874 views
594 Discussing
9
#SuspectedNorthKoreaAttacksAccountForNearly89%OfCryptoHackLosses
11,003 views
81 Discussing
10
#OpenAICutsFundraisingTargetBy$10B
2,588 views
65 Discussing