

#goldchallenges$4380
goldchallenges$4380
89,428 views
186 Discussing
Hot
Latest

·
--
🤑 $XAU
Gold is meant to be left empty right here. 4380 is pressing down hard, and the previous high plus the trendline is a double critical strike. Want the longs to turn it around? Even if Jesus came, he’d still shake his head 😂 For the short side, rest assured—enjoy the meat. Just don’t overdo the drinks 🤏
Risk management is the key 🗝️
Click here to trade 👇
{future}(XAUUSDT)
🤑 $XAU
Gold is meant to be left empty right here. 4380 is pressing down hard, and the previous high plus the trendline is a double critical strike. Want the longs to turn it around? Even if Jesus came, he’d still shake his head 😂 For the short side, rest assured—enjoy the meat. Just don’t overdo the drinks 🤏
Risk management is the key 🗝️
Click here to trade 👇
Gold is meant to be left empty right here. 4380 is pressing down hard, and the previous high plus the trendline is a double critical strike. Want the longs to turn it around? Even if Jesus came, he’d still shake his head 😂 For the short side, rest assured—enjoy the meat. Just don’t overdo the drinks 🤏
Risk management is the key 🗝️
Click here to trade 👇
121


Article
GoldChallenges$4380🗣️ Gold ($XAU ) is currently testing a critical multi-year resistance and decision zone at $4,380 per troy ounce following a powerful weekly market rally. Traders on major financial feeds like Binance Square are heavily debating whether this key psychological barrier will spark a massive bullish breakout or a short-term pullback.
✨👉🏼Technical Analysis & Market Triggers
The current structure reveals a battle of momentum at a massive decision point:
💕The Bullish Breakout Case: A strong, clean close above the $4,380 – $4,400 range clears the way for a full bullish continuation, exposing subsequent targets at $4,450 and $4,500.
💕The Bearish Pullback Case: Because momentum is deeply overextended, failing to hold above $4,380 could trigger a steep correction. Market analysts highlight $4,320 – $4,300 as the primary support floor. Losing that level could slide prices further toward $4,270.
💕Market Sentiment: Derivatives data shows massive long volume (+122.8M) crushing trapped short sellers, maintaining an overall bullish bias even as the asset hits this immediate brick wall.
✨👉🏼Underlying Global Catalysts
💥The massive surge toward $4,380 is being sustained by a combination of global macro factors:
🍂Central Bank Accumulation: Emerging market central banks continue aggressively diversifying their reserves into bullion.
🍂Safe-Haven Inflows: Sustained geopolitical uncertainties and international trade conflicts are keeping retail and institutional buyers defensive.
🍂Currency & Interest Rates: Persistent inflation pressures alongside shifting U.S. dollar trends keep physical gold highly attractive.
$XAUT
{spot}(XAUTUSDT)
$XAU
{future}(XAUUSDT)
#GoldChallenges$4380
#BitcoinETFsPost$853MWeeklyInflow
GoldChallenges$4380
🗣️ Gold ($XAU ) is currently testing a critical multi-year resistance and decision zone at $4,380 per troy ounce following a powerful weekly market rally. Traders on major financial feeds like Binance Square are heavily debating whether this key psychological barrier will spark a massive bullish breakout or a short-term pullback.
✨👉🏼Technical Analysis & Market Triggers
The current structure reveals a battle of momentum at a massive decision point:
💕The Bullish Breakout Case: A strong, clean close above the $4,380 – $4,400 range clears the way for a full bullish continuation, exposing subsequent targets at $4,450 and $4,500.
💕The Bearish Pullback Case: Because momentum is deeply overextended, failing to hold above $4,380 could trigger a steep correction. Market analysts highlight $4,320 – $4,300 as the primary support floor. Losing that level could slide prices further toward $4,270.
💕Market Sentiment: Derivatives data shows massive long volume (+122.8M) crushing trapped short sellers, maintaining an overall bullish bias even as the asset hits this immediate brick wall.
✨👉🏼Underlying Global Catalysts
💥The massive surge toward $4,380 is being sustained by a combination of global macro factors:
🍂Central Bank Accumulation: Emerging market central banks continue aggressively diversifying their reserves into bullion.
🍂Safe-Haven Inflows: Sustained geopolitical uncertainties and international trade conflicts are keeping retail and institutional buyers defensive.
🍂Currency & Interest Rates: Persistent inflation pressures alongside shifting U.S. dollar trends keep physical gold highly attractive.
$XAUT
$XAU
#GoldChallenges$4380
#BitcoinETFsPost$853MWeeklyInflow
✨👉🏼Technical Analysis & Market Triggers
The current structure reveals a battle of momentum at a massive decision point:
💕The Bullish Breakout Case: A strong, clean close above the $4,380 – $4,400 range clears the way for a full bullish continuation, exposing subsequent targets at $4,450 and $4,500.
💕The Bearish Pullback Case: Because momentum is deeply overextended, failing to hold above $4,380 could trigger a steep correction. Market analysts highlight $4,320 – $4,300 as the primary support floor. Losing that level could slide prices further toward $4,270.
💕Market Sentiment: Derivatives data shows massive long volume (+122.8M) crushing trapped short sellers, maintaining an overall bullish bias even as the asset hits this immediate brick wall.
✨👉🏼Underlying Global Catalysts
💥The massive surge toward $4,380 is being sustained by a combination of global macro factors:
🍂Central Bank Accumulation: Emerging market central banks continue aggressively diversifying their reserves into bullion.
🍂Safe-Haven Inflows: Sustained geopolitical uncertainties and international trade conflicts are keeping retail and institutional buyers defensive.
🍂Currency & Interest Rates: Persistent inflation pressures alongside shifting U.S. dollar trends keep physical gold highly attractive.
$XAUT
$XAU
#GoldChallenges$4380
#BitcoinETFsPost$853MWeeklyInflow
1
4
335

·
--
$XAU
{future}(XAUUSDT)
Gold Challenges $4,380: Breakout or Pullback?
I’ve been watching gold closely around $4,380, because this is the kind of level where momentum alone isn’t enough. After the powerful rally of the past week, price has reached a major resistance zone, and the next move could tell us whether buyers still have control.
From a technical perspective, the structure remains bullish, but momentum is starting to look stretched. For me, the key question is whether gold can secure a clean breakout above $4,380–$4,400 rather than simply spike through it. A strong close above this zone could bring $4,450 and potentially $4,500 into focus.
On the downside, I’m watching $4,320–$4,300 as the first meaningful support. If buyers defend that area, the bullish structure remains intact. But losing it could trigger a deeper retracement toward $4,270.
My approach here is simple: I wouldn’t chase the breakout blindly. $4,380 is the decision point. Hold above it, and gold can extend higher. Reject it, and patience may offer a much better entry.
#GoldChallenges$4380
#PreciousMetalsRally
#XAU
#xagusdt
#GOLD
$TUT
$HOME
{future}(HOMEUSDT)
{future}(TUTUSDT)
🗳️ Gold at $4,380 — What Happens Next?
$XAU
Gold Challenges $4,380: Breakout or Pullback?
I’ve been watching gold closely around $4,380, because this is the kind of level where momentum alone isn’t enough. After the powerful rally of the past week, price has reached a major resistance zone, and the next move could tell us whether buyers still have control.
From a technical perspective, the structure remains bullish, but momentum is starting to look stretched. For me, the key question is whether gold can secure a clean breakout above $4,380–$4,400 rather than simply spike through it. A strong close above this zone could bring $4,450 and potentially $4,500 into focus.
On the downside, I’m watching $4,320–$4,300 as the first meaningful support. If buyers defend that area, the bullish structure remains intact. But losing it could trigger a deeper retracement toward $4,270.
My approach here is simple: I wouldn’t chase the breakout blindly. $4,380 is the decision point. Hold above it, and gold can extend higher. Reject it, and patience may offer a much better entry.
#GoldChallenges$4380
#PreciousMetalsRally
#XAU
#xagusdt
#GOLD
$TUT
$HOME
🗳️ Gold at $4,380 — What Happens Next?
Gold Challenges $4,380: Breakout or Pullback?
I’ve been watching gold closely around $4,380, because this is the kind of level where momentum alone isn’t enough. After the powerful rally of the past week, price has reached a major resistance zone, and the next move could tell us whether buyers still have control.
From a technical perspective, the structure remains bullish, but momentum is starting to look stretched. For me, the key question is whether gold can secure a clean breakout above $4,380–$4,400 rather than simply spike through it. A strong close above this zone could bring $4,450 and potentially $4,500 into focus.
On the downside, I’m watching $4,320–$4,300 as the first meaningful support. If buyers defend that area, the bullish structure remains intact. But losing it could trigger a deeper retracement toward $4,270.
My approach here is simple: I wouldn’t chase the breakout blindly. $4,380 is the decision point. Hold above it, and gold can extend higher. Reject it, and patience may offer a much better entry.
#GoldChallenges$4380
#PreciousMetalsRally
#XAU
#xagusdt
#GOLD
$TUT
$HOME
🗳️ Gold at $4,380 — What Happens Next?
🚀 Clean breakout — $4,400+
86%
🔄 Rejection first
0%
🐂 Breakout → retest → rally
14%
🐻 Bigger correction
0%
7 votes • Voting closed
1
244

·
--
Bearish
#GoldChallenges$4380
🟡 Gold Challenges $4,380
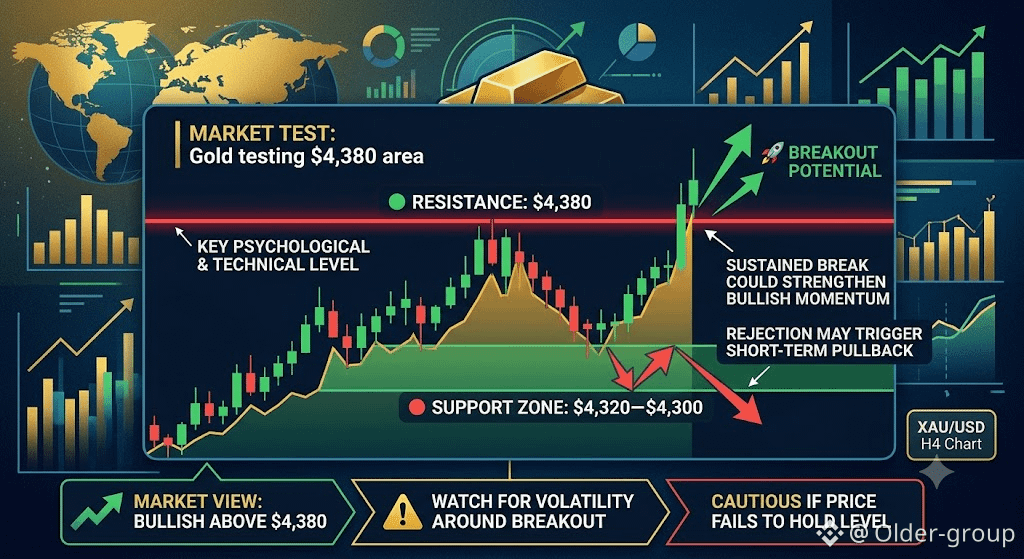
Gold is testing the $4,380 area, a key psychological and technical level. A sustained break above $4,380 could strengthen bullish momentum, while rejection may trigger a short-term pullback.
Key levels:
🟢 Resistance: $4,380 🚀 Breakout: Above $4,380 🔴 Support: $4,320–$4,300 ⚠️ Watch for volatility around the breakout.
Market view: Bullish above $4,380; cautious if price fails to hold the level.
#Gold #XAUUSD #GoldPrice #Trading $BTC $ETH $SOL
{spot}(SOLUSDT)
{spot}(ETHUSDT)
{spot}(BTCUSDT)
#GoldChallenges$4380
🟡 Gold Challenges $4,380
Gold is testing the $4,380 area, a key psychological and technical level. A sustained break above $4,380 could strengthen bullish momentum, while rejection may trigger a short-term pullback.
Key levels:
🟢 Resistance: $4,380 🚀 Breakout: Above $4,380 🔴 Support: $4,320–$4,300 ⚠️ Watch for volatility around the breakout.
Market view: Bullish above $4,380; cautious if price fails to hold the level.
#Gold #XAUUSD #GoldPrice #Trading $BTC $ETH $SOL
🟡 Gold Challenges $4,380
Gold is testing the $4,380 area, a key psychological and technical level. A sustained break above $4,380 could strengthen bullish momentum, while rejection may trigger a short-term pullback.
Key levels:
🟢 Resistance: $4,380 🚀 Breakout: Above $4,380 🔴 Support: $4,320–$4,300 ⚠️ Watch for volatility around the breakout.
Market view: Bullish above $4,380; cautious if price fails to hold the level.
#Gold #XAUUSD #GoldPrice #Trading $BTC $ETH $SOL
229

·
--
Bullish
#GoldChallenges$4380
$XAU 1H Setup — Targeting $5,000
Gold ~ $4,400 . $4,380 flipped resistance → support (today's low $4,389 held). $5,000 = retest of Jan 26 highs ($5,043), not a new target.
{future}(XAUUSDT)
💥🚀Plan A — Pullback:
💥Entry $4,350–$4,390
💥Stop $4,285
💥TP1 $4,500 / TP2 $4,700 / TP3 $5,000
💥🚀Plan B — Breakout:
💥1H close > $4,450 → enter ·
💥Stop $4,375 ·
💥Same TPs Invalidation (both): daily close < $4,300 → retrace to $4,150–$4,200
CPI Wed (Aug 12) — forecast 3.5% y/y, core 2.5%. ≤ forecast → straight to $4,500+. Hot print (≥3.8%) → sweep to $4,300–$4,350 = better Plan A entry.
Risk 1–2% per trade; SL to breakeven after TP1; no trading through CPI without a trigger. Confirm on 1H chart.
⚠️ Informational only, not financial advice.
$BZ $BTC #TrumpDemandsCompensationFromIran #BarrickMiningFalls8% #TrumpMediaPostsOver$238MQ2Loss #KeelClosesUSBitcoinMining
#GoldChallenges$4380
$XAU 1H Setup — Targeting $5,000
Gold ~ $4,400 . $4,380 flipped resistance → support (today's low $4,389 held). $5,000 = retest of Jan 26 highs ($5,043), not a new target.
💥🚀Plan A — Pullback:
💥Entry $4,350–$4,390
💥Stop $4,285
💥TP1 $4,500 / TP2 $4,700 / TP3 $5,000
💥🚀Plan B — Breakout:
💥1H close > $4,450 → enter ·
💥Stop $4,375 ·
💥Same TPs Invalidation (both): daily close < $4,300 → retrace to $4,150–$4,200
CPI Wed (Aug 12) — forecast 3.5% y/y, core 2.5%. ≤ forecast → straight to $4,500+. Hot print (≥3.8%) → sweep to $4,300–$4,350 = better Plan A entry.
Risk 1–2% per trade; SL to breakeven after TP1; no trading through CPI without a trigger. Confirm on 1H chart.
⚠️ Informational only, not financial advice.
$BZ $BTC #TrumpDemandsCompensationFromIran #BarrickMiningFalls8% #TrumpMediaPostsOver$238MQ2Loss #KeelClosesUSBitcoinMining
$XAU 1H Setup — Targeting $5,000
Gold ~ $4,400 . $4,380 flipped resistance → support (today's low $4,389 held). $5,000 = retest of Jan 26 highs ($5,043), not a new target.
💥🚀Plan A — Pullback:
💥Entry $4,350–$4,390
💥Stop $4,285
💥TP1 $4,500 / TP2 $4,700 / TP3 $5,000
💥🚀Plan B — Breakout:
💥1H close > $4,450 → enter ·
💥Stop $4,375 ·
💥Same TPs Invalidation (both): daily close < $4,300 → retrace to $4,150–$4,200
CPI Wed (Aug 12) — forecast 3.5% y/y, core 2.5%. ≤ forecast → straight to $4,500+. Hot print (≥3.8%) → sweep to $4,300–$4,350 = better Plan A entry.
Risk 1–2% per trade; SL to breakeven after TP1; no trading through CPI without a trigger. Confirm on 1H chart.
⚠️ Informational only, not financial advice.
$BZ $BTC #TrumpDemandsCompensationFromIran #BarrickMiningFalls8% #TrumpMediaPostsOver$238MQ2Loss #KeelClosesUSBitcoinMining

122
·
--
Bullish
#GoldChallenges$4380
Gold ($XAU ) Breaks $4,380 — This Isn't a Fear Trade
Gold is at $4,426 (+0.8%) , finally clearing $4,380 after two days of churn; today's low of $4,389 held right above it → $4,380 flips from resistance to support . Still -21% from the $5,602 ATH set in early 2026.
{future}(XAUUSDT)
💥The fuel: soft US jobs data killed rate-hike fears; before that it was China demand (6-week highs); next catalyst = US CPI Wednesday (Aug 12) , forecast 3.5% y/y (flat), core 2.5% (cooling from 2.6%).
💥The crypto angle: Tether is now the largest private gold holder on earth — 146 tons (~$18.8B) ; tokenized gold market ~$4.5B (XAUT $2.48B / PAXG $1.89B); London (70% of global gold flow) is drafting FCA rules for gold tokens; gold RWA perp volume +14.6% in July (Pyth).
💥$GLD.ETF : $402.54 (+1%), above EMA-10/50, +6.8% on the month, +30.5% on the year.
{etf_us}(GLD.ETF)
Bottom line: Gold isn't just the "scared money" trade anymore — it's becoming digital collateral : Fed pivot + China accumulation + on-chain rails. $4,380 is the technical level; tokenization is the real story.
⚠️ Informational only, not financial advice.
$CL #BarrickMiningFalls8% #TrumpMediaPostsOver$238MQ2Loss #KeelClosesUSBitcoinMining #TSMCJulyRevenueJumps45%
#GoldChallenges$4380
Gold ($XAU ) Breaks $4,380 — This Isn't a Fear Trade
Gold is at $4,426 (+0.8%) , finally clearing $4,380 after two days of churn; today's low of $4,389 held right above it → $4,380 flips from resistance to support . Still -21% from the $5,602 ATH set in early 2026.
💥The fuel: soft US jobs data killed rate-hike fears; before that it was China demand (6-week highs); next catalyst = US CPI Wednesday (Aug 12) , forecast 3.5% y/y (flat), core 2.5% (cooling from 2.6%).
💥The crypto angle: Tether is now the largest private gold holder on earth — 146 tons (~$18.8B) ; tokenized gold market ~$4.5B (XAUT $2.48B / PAXG $1.89B); London (70% of global gold flow) is drafting FCA rules for gold tokens; gold RWA perp volume +14.6% in July (Pyth).
💥$GLD.ETF : $402.54 (+1%), above EMA-10/50, +6.8% on the month, +30.5% on the year.
Bottom line: Gold isn't just the "scared money" trade anymore — it's becoming digital collateral : Fed pivot + China accumulation + on-chain rails. $4,380 is the technical level; tokenization is the real story.
⚠️ Informational only, not financial advice.
$CL #BarrickMiningFalls8% #TrumpMediaPostsOver$238MQ2Loss #KeelClosesUSBitcoinMining #TSMCJulyRevenueJumps45%
Gold ($XAU ) Breaks $4,380 — This Isn't a Fear Trade
Gold is at $4,426 (+0.8%) , finally clearing $4,380 after two days of churn; today's low of $4,389 held right above it → $4,380 flips from resistance to support . Still -21% from the $5,602 ATH set in early 2026.
💥The fuel: soft US jobs data killed rate-hike fears; before that it was China demand (6-week highs); next catalyst = US CPI Wednesday (Aug 12) , forecast 3.5% y/y (flat), core 2.5% (cooling from 2.6%).
💥The crypto angle: Tether is now the largest private gold holder on earth — 146 tons (~$18.8B) ; tokenized gold market ~$4.5B (XAUT $2.48B / PAXG $1.89B); London (70% of global gold flow) is drafting FCA rules for gold tokens; gold RWA perp volume +14.6% in July (Pyth).
💥$GLD.ETF : $402.54 (+1%), above EMA-10/50, +6.8% on the month, +30.5% on the year.
Bottom line: Gold isn't just the "scared money" trade anymore — it's becoming digital collateral : Fed pivot + China accumulation + on-chain rails. $4,380 is the technical level; tokenization is the real story.
⚠️ Informational only, not financial advice.
$CL #BarrickMiningFalls8% #TrumpMediaPostsOver$238MQ2Loss #KeelClosesUSBitcoinMining #TSMCJulyRevenueJumps45%

170

·
--
Bullish
#GoldChallenges$4380
Gold challenging the $4,380 level shows strong bullish momentum. A breakout above this resistance could attract fresh buying, while rejection may trigger short-term profit booking. Traders should watch volume and price action before taking positions.
#GoldChallenges$4380
Gold challenging the $4,380 level shows strong bullish momentum. A breakout above this resistance could attract fresh buying, while rejection may trigger short-term profit booking. Traders should watch volume and price action before taking positions.
Gold challenging the $4,380 level shows strong bullish momentum. A breakout above this resistance could attract fresh buying, while rejection may trigger short-term profit booking. Traders should watch volume and price action before taking positions.
3
159

·
--
Bearish
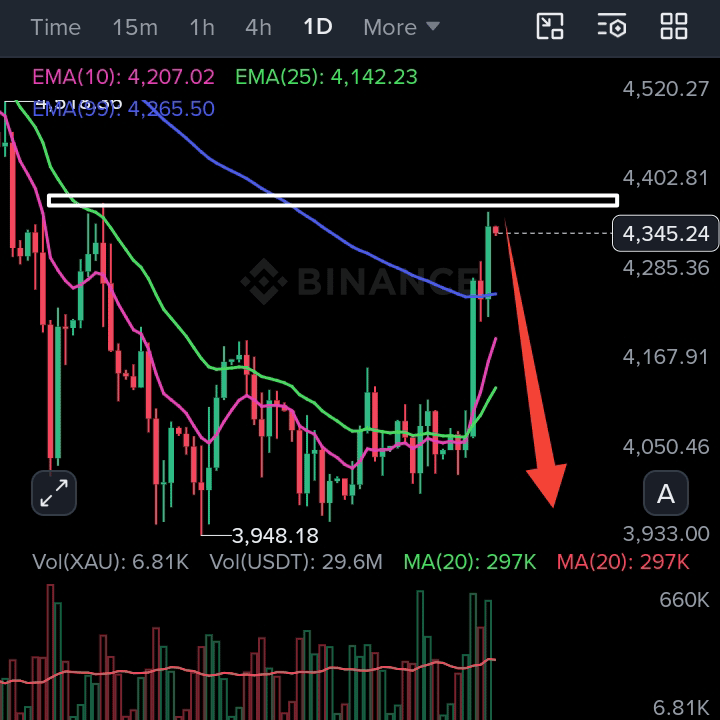
It's time to short $XAU with 10X leverage..
Entry : current price
StopLoss :$4380
Target 🎯$4320__$4300__$4280
{future}(XAUUSDT)
It's time to short $XAU with 10X leverage..
Entry : current price
StopLoss :$4380
Target 🎯$4320__$4300__$4280
Entry : current price
StopLoss :$4380
Target 🎯$4320__$4300__$4280
3
194

·
--
Bullish
#GoldChallenges$4380
Gold just smashed through $4,380! 🚀 Next stop: $4,400.
Missed the train at $4,000? You’ll cry a river when it clears this final hurdle and moons! 😭 US jobs data pumped the fuel, making bears sweat heavily.
What’s a trader to do? FOMO in now or watch from the sidelines? Pack your bags before it's too late!
👉 Sign up on Binance with code VINHTOCDO to catch the next wave!
⚠️ Not financial advice (NFA).
#GOLD #GoldBullRun #Binance #VINHTOCDO
$XAU
{future}(XAUUSDT)
$XAUT
{future}(XAUTUSDT)
$PAXG
{future}(PAXGUSDT)
#GoldChallenges$4380
Gold just smashed through $4,380! 🚀 Next stop: $4,400.
Missed the train at $4,000? You’ll cry a river when it clears this final hurdle and moons! 😭 US jobs data pumped the fuel, making bears sweat heavily.
What’s a trader to do? FOMO in now or watch from the sidelines? Pack your bags before it's too late!
👉 Sign up on Binance with code VINHTOCDO to catch the next wave!
⚠️ Not financial advice (NFA).
#GOLD #GoldBullRun #Binance #VINHTOCDO
$XAU
$XAUT
$PAXG
Gold just smashed through $4,380! 🚀 Next stop: $4,400.
Missed the train at $4,000? You’ll cry a river when it clears this final hurdle and moons! 😭 US jobs data pumped the fuel, making bears sweat heavily.
What’s a trader to do? FOMO in now or watch from the sidelines? Pack your bags before it's too late!
👉 Sign up on Binance with code VINHTOCDO to catch the next wave!
⚠️ Not financial advice (NFA).
#GOLD #GoldBullRun #Binance #VINHTOCDO
$XAU
$XAUT
$PAXG

5
642

·
--
Bullish
ALL Eyes on Gold here 👀
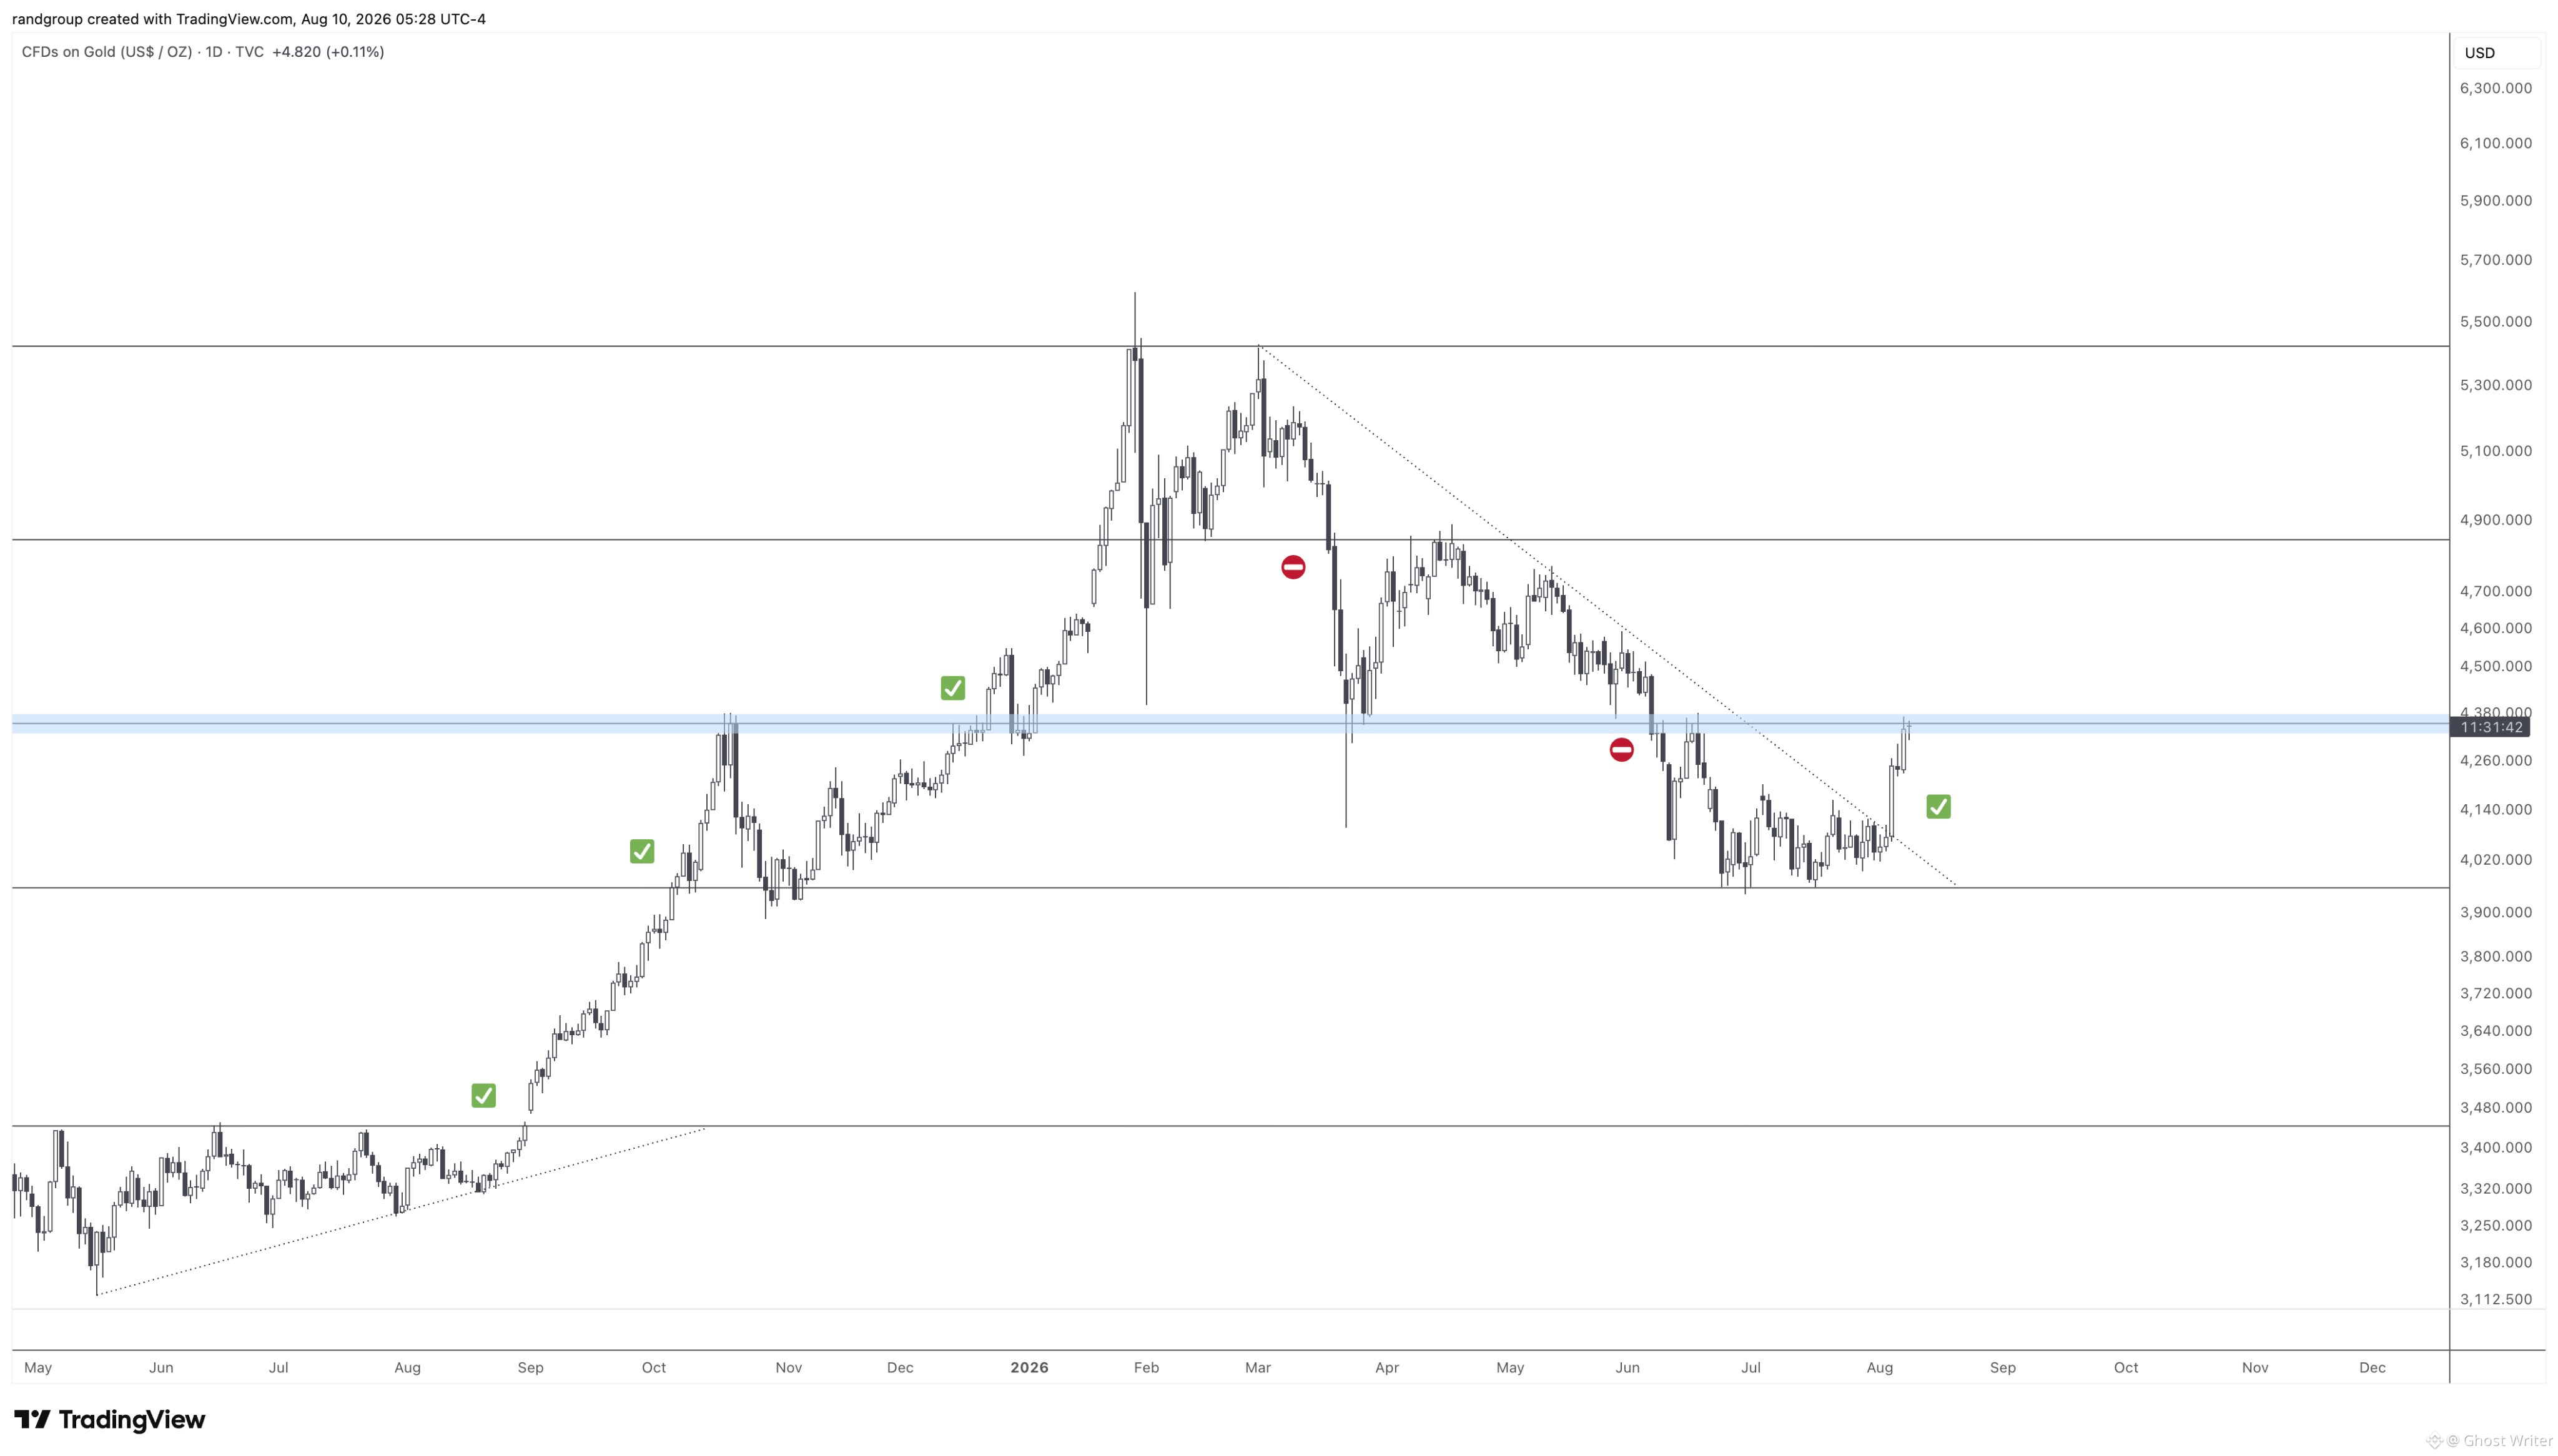
After the main downtrend BULLISH REVERSAL it's pushing to recover a key range on the $4,380 level.
The $XAU breakout here would trigger the full bullish continuation.
#GoldChallenges$4380
ALL Eyes on Gold here 👀
After the main downtrend BULLISH REVERSAL it's pushing to recover a key range on the $4,380 level.
The $XAU breakout here would trigger the full bullish continuation.
#GoldChallenges$4380
After the main downtrend BULLISH REVERSAL it's pushing to recover a key range on the $4,380 level.
The $XAU breakout here would trigger the full bullish continuation.
#GoldChallenges$4380
4
16
10.8k

·
--
{future}(XAUUSDT)
WHALE COULD BREAK THROUGH THE MAX LEVEL, LOOKING LIKE THIS LAST TIME—JUST HIT A 10% MOVE RIGHT AWAY.
The Long side is pressing the button; the door bursts through at 4380 and 4420, glowing brightly. Go all in—what are you waiting for!!!
$XAU/USDT - LONG
Entry: 4340 - 4350
SL: 4300
TP1: 4380
TP2: 4420
TP3: 4480
Numbers don’t lie:
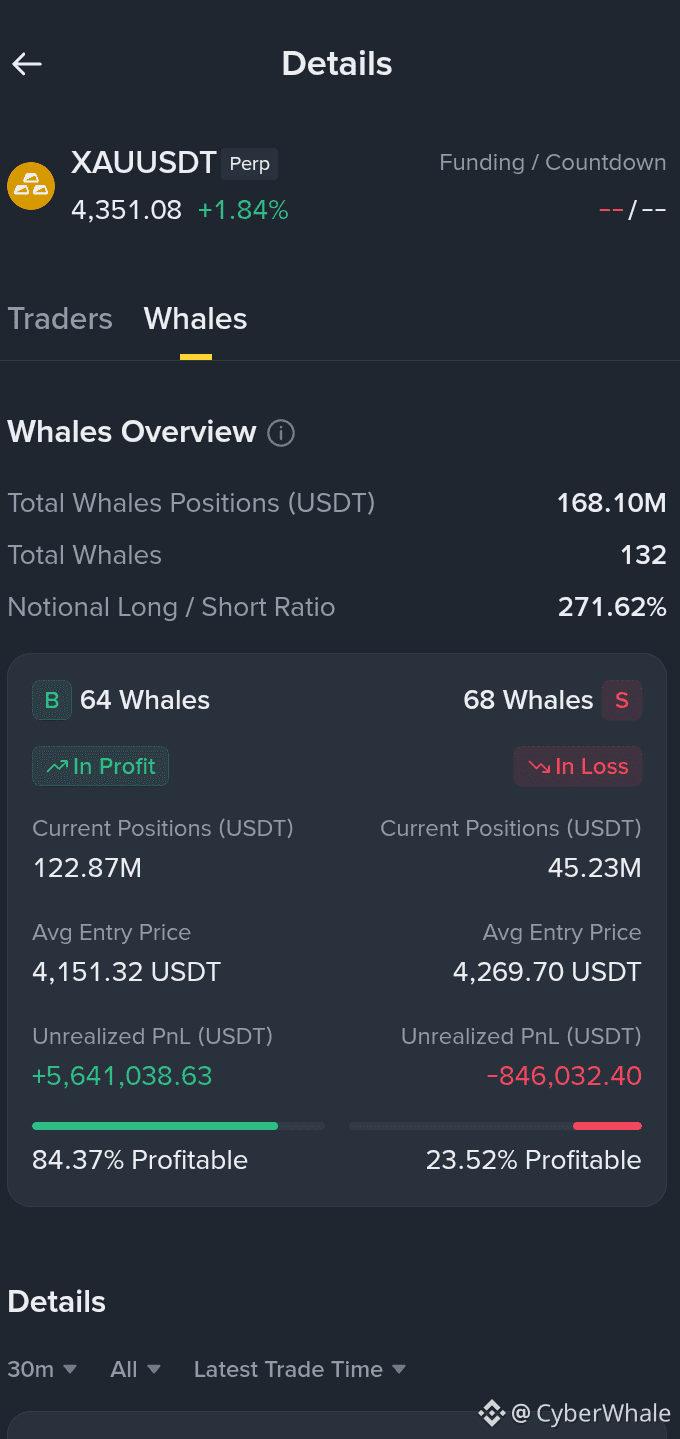
The Long side holds 122.8M$ with an average entry at 4151, winning 84%, pocketing +5.64M$. Meanwhile, the Short side is stuck and heavy at 4269, with a win rate of 23% and holding losses of -846K$. With the Long/Short ratio at 271%, the bulls have flattened the bears.
Bro, do you think $XAU should push 4380 straight up to 4420, or get rejected back at 4340? Grab it fast and hold—don’t miss out, everyone!!!
WHALE COULD BREAK THROUGH THE MAX LEVEL, LOOKING LIKE THIS LAST TIME—JUST HIT A 10% MOVE RIGHT AWAY.
The Long side is pressing the button; the door bursts through at 4380 and 4420, glowing brightly. Go all in—what are you waiting for!!!
$XAU /USDT - LONG
Entry: 4340 - 4350
SL: 4300
TP1: 4380
TP2: 4420
TP3: 4480
Numbers don’t lie:
The Long side holds 122.8M$ with an average entry at 4151, winning 84%, pocketing +5.64M$. Meanwhile, the Short side is stuck and heavy at 4269, with a win rate of 23% and holding losses of -846K$. With the Long/Short ratio at 271%, the bulls have flattened the bears.
Bro, do you think $XAU should push 4380 straight up to 4420, or get rejected back at 4340? Grab it fast and hold—don’t miss out, everyone!!!
The Long side is pressing the button; the door bursts through at 4380 and 4420, glowing brightly. Go all in—what are you waiting for!!!
$XAU /USDT - LONG
Entry: 4340 - 4350
SL: 4300
TP1: 4380
TP2: 4420
TP3: 4480
Numbers don’t lie:
The Long side holds 122.8M$ with an average entry at 4151, winning 84%, pocketing +5.64M$. Meanwhile, the Short side is stuck and heavy at 4269, with a win rate of 23% and holding losses of -846K$. With the Long/Short ratio at 271%, the bulls have flattened the bears.
Bro, do you think $XAU should push 4380 straight up to 4420, or get rejected back at 4340? Grab it fast and hold—don’t miss out, everyone!!!
61

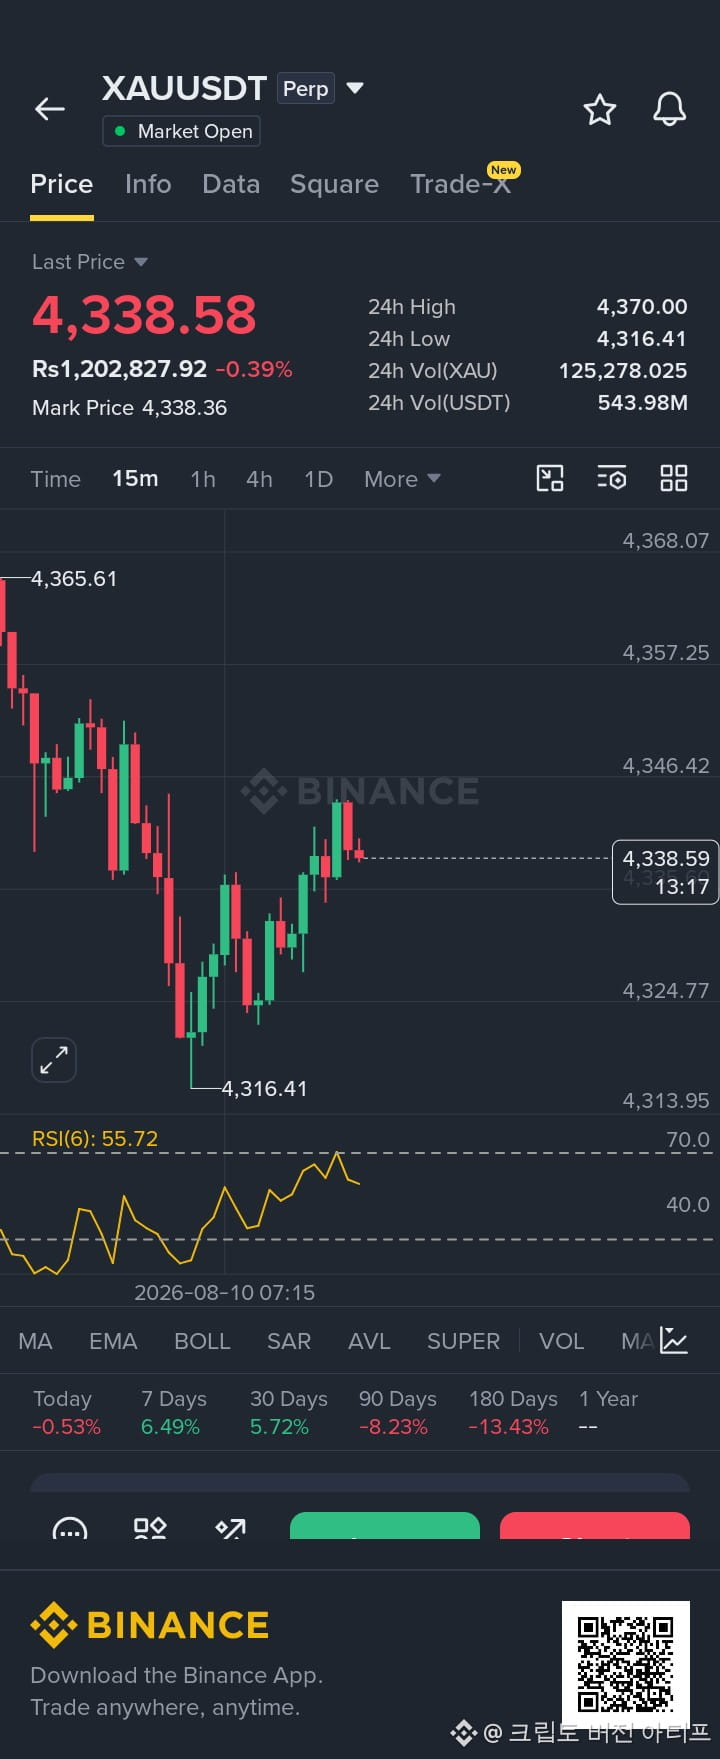
🚀 $XAU BIG LONG — BIG VOLUME! 🔥📈
Guys, opening a big long on $XAU now. Strong move potentially coming soon! 🤑
🟢 LONG $XAU
🎯 Take Profit: 4380
🛑 Stop Loss: 4320
Big profit is coming soon — stay sharp and manage your risk! 💰🔥
#XAU #Gold #Long #Trading #Futures
🚀 $XAU BIG LONG — BIG VOLUME! 🔥📈
Guys, opening a big long on $XAU now. Strong move potentially coming soon! 🤑
🟢 LONG $XAU
🎯 Take Profit: 4380
🛑 Stop Loss: 4320
Big profit is coming soon — stay sharp and manage your risk! 💰🔥
#XAU #Gold #Long #Trading #Futures
Guys, opening a big long on $XAU now. Strong move potentially coming soon! 🤑
🟢 LONG $XAU
🎯 Take Profit: 4380
🛑 Stop Loss: 4320
Big profit is coming soon — stay sharp and manage your risk! 💰🔥
#XAU #Gold #Long #Trading #Futures
62
·
--
{future}(XAUUSDT)
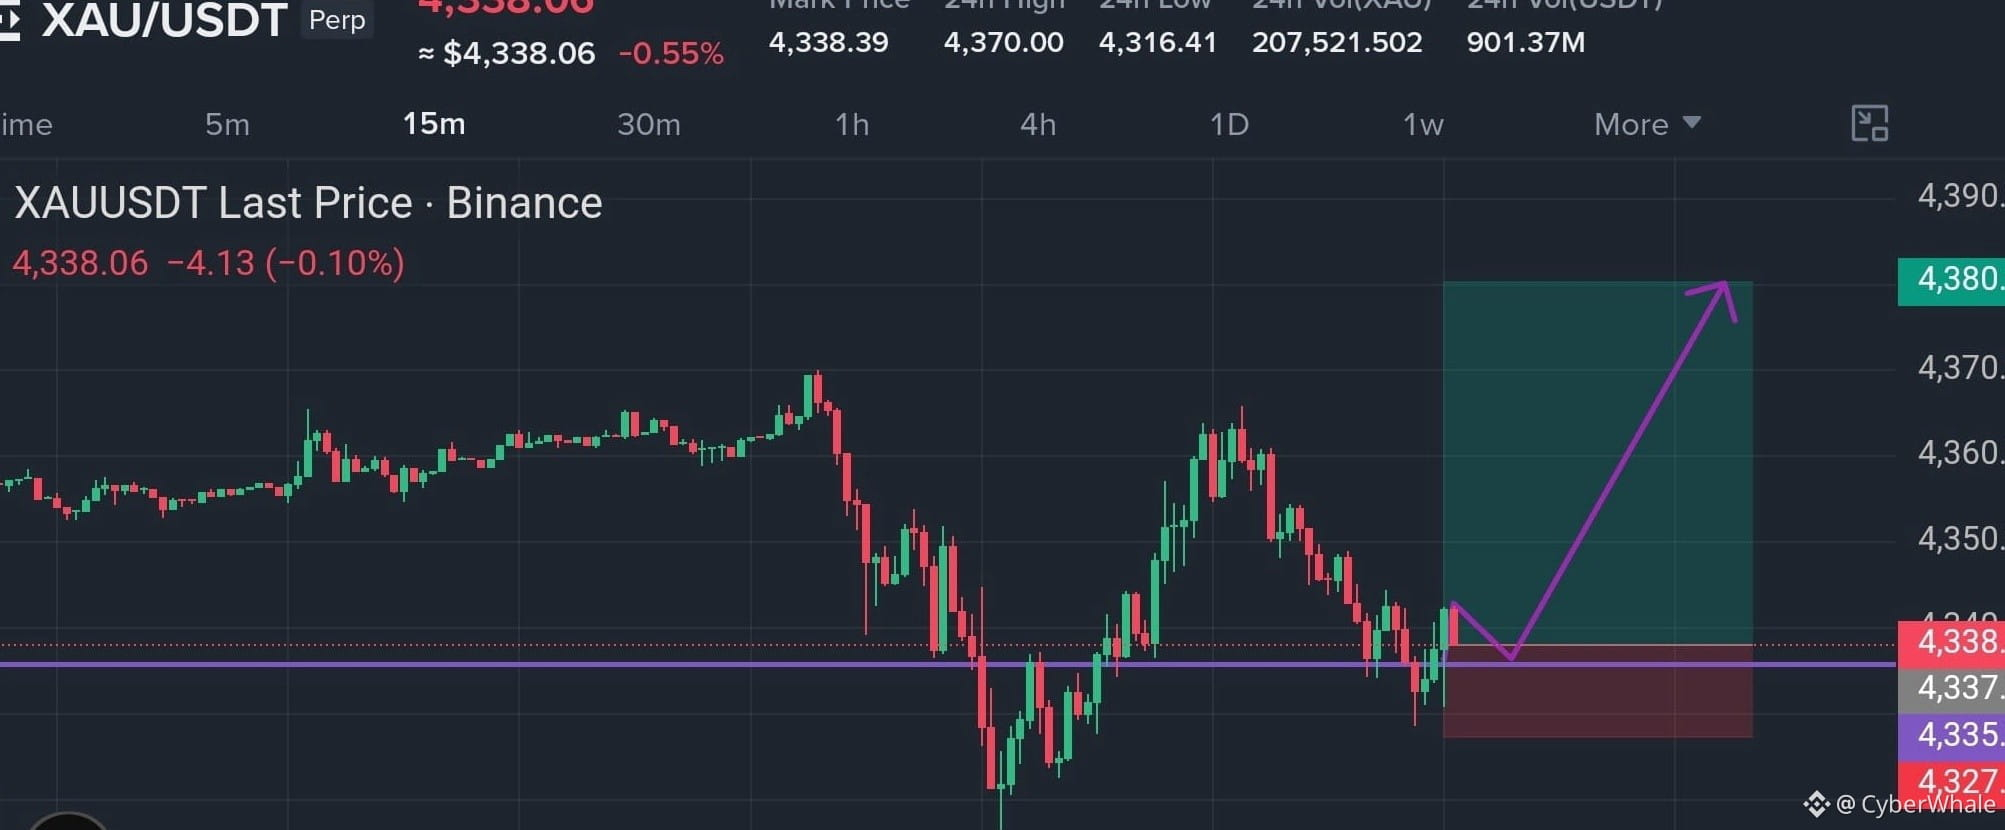
CỰC HOT OPPORTUNITY TO TRADE $XAU AE ƠI!!!
We’re holding strong support in the 4335-4338 zone—it's really great. Turn on this momentum and it’ll fly nonstop. Don’t miss out—set a limit in advance for quick fills, otherwise you’ll run out of time!
Entry 1: 4335-4338
Entry 2: 4328-4333
Target 1: 4355
Target 2: 4370
Target 3: 4380
Turn on the limit on the chart right now—still in time. Hold it strong, pull it off this momentum, everyone!!!
CỰC HOT OPPORTUNITY TO TRADE $XAU AE ƠI!!!
We’re holding strong support in the 4335-4338 zone—it's really great. Turn on this momentum and it’ll fly nonstop. Don’t miss out—set a limit in advance for quick fills, otherwise you’ll run out of time!
Entry 1: 4335-4338
Entry 2: 4328-4333
Target 1: 4355
Target 2: 4370
Target 3: 4380
Turn on the limit on the chart right now—still in time. Hold it strong, pull it off this momentum, everyone!!!
We’re holding strong support in the 4335-4338 zone—it's really great. Turn on this momentum and it’ll fly nonstop. Don’t miss out—set a limit in advance for quick fills, otherwise you’ll run out of time!
Entry 1: 4335-4338
Entry 2: 4328-4333
Target 1: 4355
Target 2: 4370
Target 3: 4380
Turn on the limit on the chart right now—still in time. Hold it strong, pull it off this momentum, everyone!!!
1
1k

·
--
Bullish
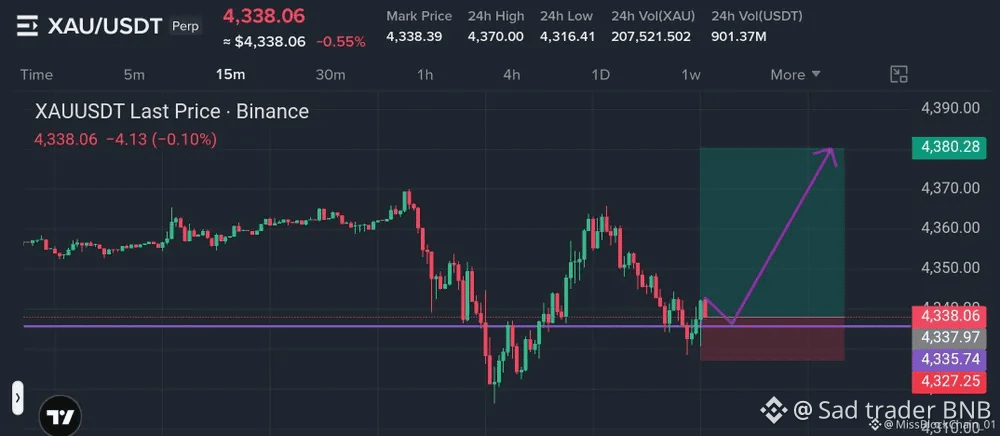
🚨 WARNING: THE ULTIMATE GOLD TRAP IS ABOUT TO SNAP! 📉⚡️
Look at the charts closely. After a heavy downtrend, we are witnessing a massive BULLISH REVERSAL trying to reclaim the crucial $4,380 range!
If $XAU officially smashes through this resistance level, get ready for a violent, unfiltered bullish continuation that will catch every late bear completely off guard. 🚀🔥
Current Setup: XAUUSDT Perp
Key Focus Zone: Recovering & holding the $4,380 pivot.
The Big Question: Are you positioned for the breakout, or sitting this one out?
Drop your thoughts below! Is $4380 holding, or are we heading for another fakeout? Let’s talk strategy! 👇💬
{future}(XAUTUSDT)
$XAUT #GoldChallenges$4380 #XAU #sadtraderbnb #bullishreversal #BinanceSquare
🚨 WARNING: THE ULTIMATE GOLD TRAP IS ABOUT TO SNAP! 📉⚡️
Look at the charts closely. After a heavy downtrend, we are witnessing a massive BULLISH REVERSAL trying to reclaim the crucial $4,380 range!
If $XAU officially smashes through this resistance level, get ready for a violent, unfiltered bullish continuation that will catch every late bear completely off guard. 🚀🔥
Current Setup: XAUUSDT Perp
Key Focus Zone: Recovering & holding the $4,380 pivot.
The Big Question: Are you positioned for the breakout, or sitting this one out?
Drop your thoughts below! Is $4380 holding, or are we heading for another fakeout? Let’s talk strategy! 👇💬
$XAUT #GoldChallenges$4380 #XAU #sadtraderbnb #bullishreversal #BinanceSquare
Look at the charts closely. After a heavy downtrend, we are witnessing a massive BULLISH REVERSAL trying to reclaim the crucial $4,380 range!
If $XAU officially smashes through this resistance level, get ready for a violent, unfiltered bullish continuation that will catch every late bear completely off guard. 🚀🔥
Current Setup: XAUUSDT Perp
Key Focus Zone: Recovering & holding the $4,380 pivot.
The Big Question: Are you positioned for the breakout, or sitting this one out?
Drop your thoughts below! Is $4380 holding, or are we heading for another fakeout? Let’s talk strategy! 👇💬
$XAUT #GoldChallenges$4380 #XAU #sadtraderbnb #bullishreversal #BinanceSquare
2
2
326

#GoldChallenges$4380 $Gold is witnessing a pivotal turning point at the critical resistance level of $4,380 per ounce, as investors and technical analysts watch to see whether the precious metal can successfully break through this level and continue its upward path, or whether it will experience a rebound and a temporary downward correction.This rising momentum is driven by a mix of ongoing geopolitical tensions, anticipation of U.S. inflation data and monetary policies, and central banks’ continued efforts to bolster their gold reserves below is a comprehensive analysis of the dimensions of the challenge facing gold at this level and the expected scenarios.
A fierce resistance challenge: Why $4,380
The $4,380 level occupies a key technical and psychological angle in the gold market for several reasons:
Liquidity congestion zone: This price marks a major downtrend line that formed at previous peaks, where strong selling pressures were seen.
Testing the durability of momentum: This level is being tested after a strong bullish rally, making technical indicators appear "overbought" and highlighting the market’s need for new buying liquidity capable of confirming the breakout.
Bulls vs. bears: Trading platform data shows sharp disagreement; buyers (long positions) are holding on to their gains, while sellers (short positions) are waiting for a chance at this peak to open fresh short positions betting on the move being wrong
#GoldChallenges$4380 $Gold is witnessing a pivotal turning point at the critical resistance level of $4,380 per ounce, as investors and technical analysts watch to see whether the precious metal can successfully break through this level and continue its upward path, or whether it will experience a rebound and a temporary downward correction.This rising momentum is driven by a mix of ongoing geopolitical tensions, anticipation of U.S. inflation data and monetary policies, and central banks’ continued efforts to bolster their gold reserves below is a comprehensive analysis of the dimensions of the challenge facing gold at this level and the expected scenarios.
A fierce resistance challenge: Why $4,380
The $4,380 level occupies a key technical and psychological angle in the gold market for several reasons:
Liquidity congestion zone: This price marks a major downtrend line that formed at previous peaks, where strong selling pressures were seen.
Testing the durability of momentum: This level is being tested after a strong bullish rally, making technical indicators appear "overbought" and highlighting the market’s need for new buying liquidity capable of confirming the breakout.
Bulls vs. bears: Trading platform data shows sharp disagreement; buyers (long positions) are holding on to their gains, while sellers (short positions) are waiting for a chance at this peak to open fresh short positions betting on the move being wrong
A fierce resistance challenge: Why $4,380
The $4,380 level occupies a key technical and psychological angle in the gold market for several reasons:
Liquidity congestion zone: This price marks a major downtrend line that formed at previous peaks, where strong selling pressures were seen.
Testing the durability of momentum: This level is being tested after a strong bullish rally, making technical indicators appear "overbought" and highlighting the market’s need for new buying liquidity capable of confirming the breakout.
Bulls vs. bears: Trading platform data shows sharp disagreement; buyers (long positions) are holding on to their gains, while sellers (short positions) are waiting for a chance at this peak to open fresh short positions betting on the move being wrong
1
111


·
--
Bullish
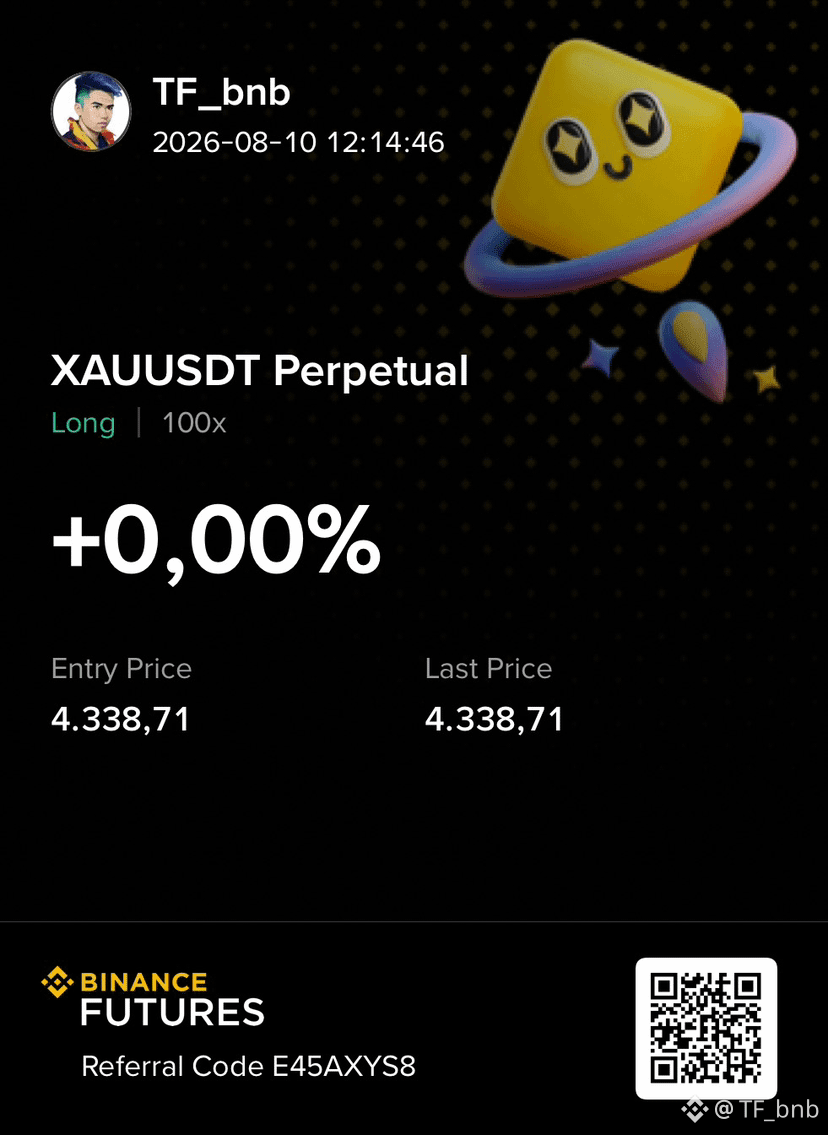
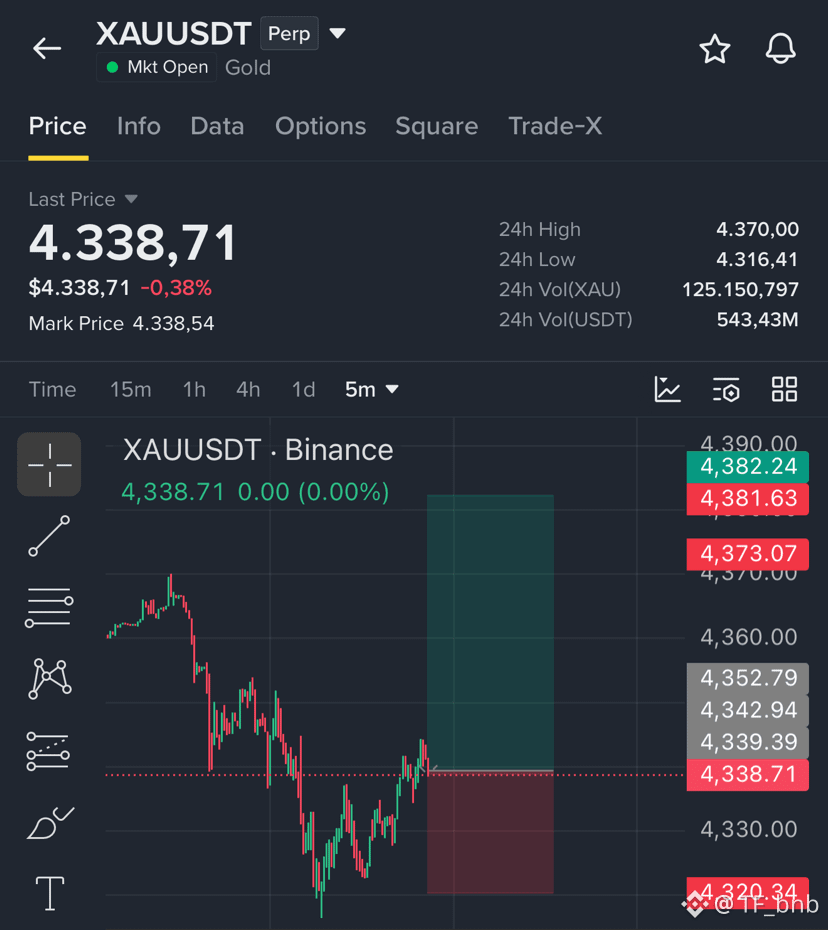
$XAU open big long big volume now , thank soon
Stoploss : 4320
Take profit : 4380
Big profit is coming soon 🤑
{future}(XAUUSDT)
$XAU open big long big volume now , thank soon
Stoploss : 4320
Take profit : 4380
Big profit is coming soon 🤑
Stoploss : 4320
Take profit : 4380
Big profit is coming soon 🤑
1
9
3.4k
·
--
Bullish
Verified
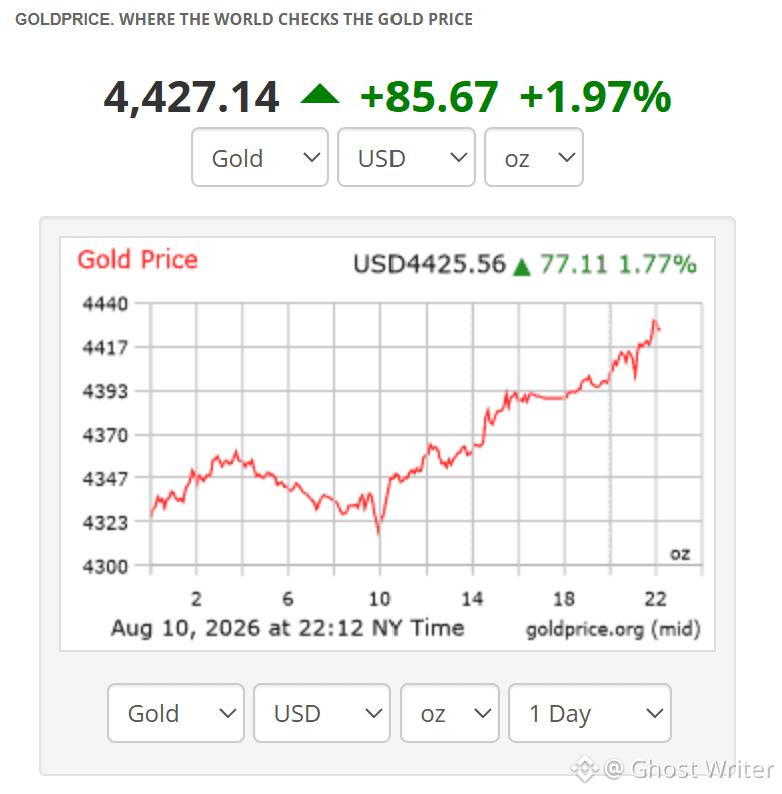
Gold is soaring, but not just because of US-Iran tensions.
$XAU just surpassed $4,400, reaching its highest level in about two months. And I see three factors simultaneously driving the price:
1️⃣ The Fed is becoming less hawkish
Weaker-than-expected US jobs reports have reduced market bets on the Fed raising interest rates. Now all eyes are on the July CPI to see if this trend continues.
2️⃣ China continues to accumulate gold
The PBOC just increased its reserves by nearly 20 tons in July, its strongest monthly purchase since October 2023 and the 21st consecutive month of gold reserve increases.
3️⃣ Risk-off returns
US-Iran negotiations on Hormuz have yet to reach a final agreement. Iran has added further conditions, while the US has not fully met them → the risk of oil supply disruptions is being reassessed.
My perspective:
Gold is currently in a rather unique setup: Fed uncertainty, central-bank demand, and geopolitical risk are all converging.
The question is no longer whether Gold can reach $4,500?
Instead, the question is: Will the upcoming CPI be high enough to break this upward trend? 👀
#GoldChallenges$4380 #XAU
Gold is soaring, but not just because of US-Iran tensions.
$XAU just surpassed $4,400, reaching its highest level in about two months. And I see three factors simultaneously driving the price:
1️⃣ The Fed is becoming less hawkish
Weaker-than-expected US jobs reports have reduced market bets on the Fed raising interest rates. Now all eyes are on the July CPI to see if this trend continues.
2️⃣ China continues to accumulate gold
The PBOC just increased its reserves by nearly 20 tons in July, its strongest monthly purchase since October 2023 and the 21st consecutive month of gold reserve increases.
3️⃣ Risk-off returns
US-Iran negotiations on Hormuz have yet to reach a final agreement. Iran has added further conditions, while the US has not fully met them → the risk of oil supply disruptions is being reassessed.
My perspective:
Gold is currently in a rather unique setup: Fed uncertainty, central-bank demand, and geopolitical risk are all converging.
The question is no longer whether Gold can reach $4,500?
Instead, the question is: Will the upcoming CPI be high enough to break this upward trend? 👀
#GoldChallenges$4380 #XAU
$XAU just surpassed $4,400, reaching its highest level in about two months. And I see three factors simultaneously driving the price:
1️⃣ The Fed is becoming less hawkish
Weaker-than-expected US jobs reports have reduced market bets on the Fed raising interest rates. Now all eyes are on the July CPI to see if this trend continues.
2️⃣ China continues to accumulate gold
The PBOC just increased its reserves by nearly 20 tons in July, its strongest monthly purchase since October 2023 and the 21st consecutive month of gold reserve increases.
3️⃣ Risk-off returns
US-Iran negotiations on Hormuz have yet to reach a final agreement. Iran has added further conditions, while the US has not fully met them → the risk of oil supply disruptions is being reassessed.
My perspective:
Gold is currently in a rather unique setup: Fed uncertainty, central-bank demand, and geopolitical risk are all converging.
The question is no longer whether Gold can reach $4,500?
Instead, the question is: Will the upcoming CPI be high enough to break this upward trend? 👀
#GoldChallenges$4380 #XAU
9
3.7k

·
--
$XAUT $XAU
The release of the non-farm payroll data will directly impact gold's price movement this week and next.
Before the data release, pay close attention to the 4305-4320 resistance zone.
If the non-farm payroll data is priced in beforehand, it's highly likely the price will break through this range and test the upper limits of 4328 and 4380.
I'm more inclined to believe that the price will pull back from this range to the 4220-4200 range before the data release, with a deeper pullback potentially approaching 4165.
This is because a downward move would cause many to exit prematurely, leading to a rapid reversal.
$XAUT $XAU
The release of the non-farm payroll data will directly impact gold's price movement this week and next.
Before the data release, pay close attention to the 4305-4320 resistance zone.
If the non-farm payroll data is priced in beforehand, it's highly likely the price will break through this range and test the upper limits of 4328 and 4380.
I'm more inclined to believe that the price will pull back from this range to the 4220-4200 range before the data release, with a deeper pullback potentially approaching 4165.
This is because a downward move would cause many to exit prematurely, leading to a rapid reversal.
The release of the non-farm payroll data will directly impact gold's price movement this week and next.
Before the data release, pay close attention to the 4305-4320 resistance zone.
If the non-farm payroll data is priced in beforehand, it's highly likely the price will break through this range and test the upper limits of 4328 and 4380.
I'm more inclined to believe that the price will pull back from this range to the 4220-4200 range before the data release, with a deeper pullback potentially approaching 4165.
This is because a downward move would cause many to exit prematurely, leading to a rapid reversal.
50
·
--
🤑 $XAU
4380 In this spot, add a downtrend line on top of the previous high-pressure top—stacking double buffs to the max 😂 The bears are laughing with their eyes closed; the bulls want to go against the odds? Even Jesus is shaking his head 🤔 Still not bearish? Sleep sounds great—go on!
Risk management is the key 🗝️
Click here to trade 👇
{future}(XAUUSDT)
🤑 $XAU
4380 In this spot, add a downtrend line on top of the previous high-pressure top—stacking double buffs to the max 😂 The bears are laughing with their eyes closed; the bulls want to go against the odds? Even Jesus is shaking his head 🤔 Still not bearish? Sleep sounds great—go on!
Risk management is the key 🗝️
Click here to trade 👇
4380 In this spot, add a downtrend line on top of the previous high-pressure top—stacking double buffs to the max 😂 The bears are laughing with their eyes closed; the bulls want to go against the odds? Even Jesus is shaking his head 🤔 Still not bearish? Sleep sounds great—go on!
Risk management is the key 🗝️
Click here to trade 👇
142

·
--
Article
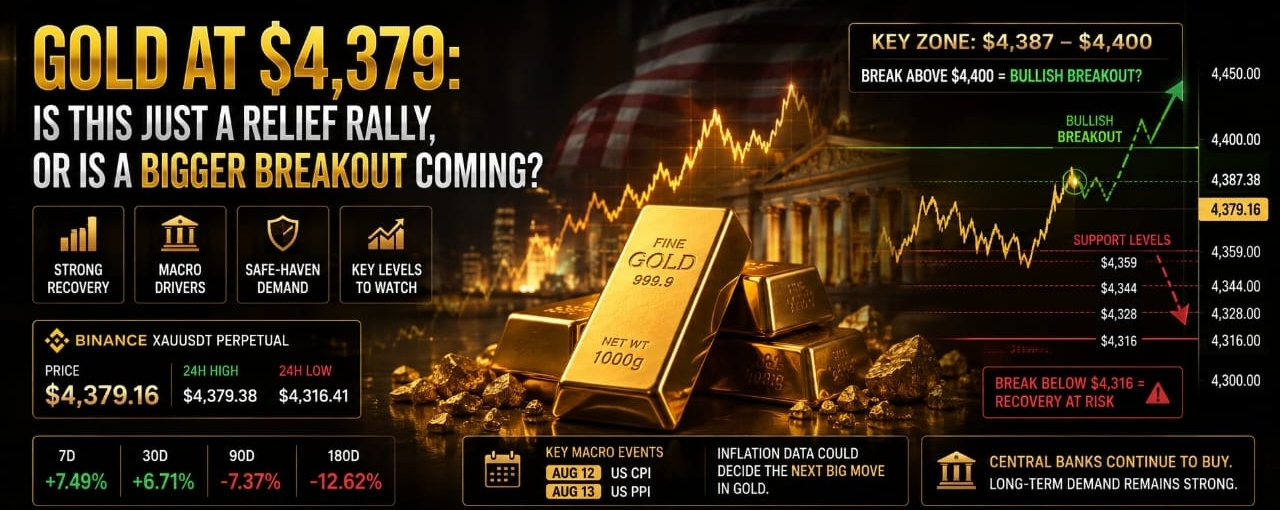
Gold at $4,379: Is This Just a Relief Rally, or Is a Bigger Breakout Coming?Last night, I kept looking at the gold chart because one thing felt more interesting than the actual price.
It was the move.
Gold dropped to $4,316.41 and then climbed all the way back toward $4,387.38. That is roughly a $71 move in a very short period. When I see a move like that, I do not immediately ask whether gold is bullish or bearish. I first ask a simpler question:
Who is actually in control right now?
On the Binance XAUUSDT Perpetual chart, gold is trading around $4,379.16, with a 24-hour high of $4,387.38 and a low of $4,316.41.
The interesting part is that price is sitting very close to the daily high.
That tells me buyers did not just recover the earlier sell-off. They pushed price back toward the top of the range and are currently refusing to give much of that move back.
But there is another side to this story.
Looking across the broader gold market, spot gold has also been trading around the $4,350-$4,370 area, while gold futures have been holding somewhat higher. Tokenized gold markets such as XAUT and PAXG are also showing the same broad direction, although prices can differ slightly between exchanges because of liquidity and timing.
So I would not treat every gold price on Binance, CoinGecko, CoinMarketCap or OKX as exactly the same thing.
For short-term trading, the Binance chart in front of me is the important one.
For the bigger picture, the macro data matters much more.
And that is where things become interesting.
The recent U.S. jobs data gave gold another reason to move higher.
The weaker employment numbers reduced expectations that the Federal Reserve would need to remain extremely tight for much longer. That put some pressure on the dollar and helped gold attract buyers again.
But I think there is a catch here.
The market is now waiting for the next inflation numbers.
U.S. CPI on August 12 and PPI on August 13 could decide whether this gold move continues or starts losing momentum.
If inflation comes in softer than expected, traders could start pricing in a greater chance of easier Fed policy. That would normally be supportive for gold.
But if inflation comes in hotter than expected, the story changes quickly.
Higher inflation can keep U.S. yields elevated and reduce expectations for aggressive rate cuts. In that situation, gold could face selling pressure even after such a strong recovery.
This is why I am not comfortable simply looking at the green candles and calling for another straight move higher.
There is another factor worth watching too.
Central-bank demand for gold remains an important part of the long-term story. China continued adding gold to its reserves in July, showing that official-sector demand has not disappeared.
That does not guarantee higher prices.
But when you combine central-bank buying with geopolitical uncertainty, changing interest-rate expectations and continued demand for a traditional safe-haven asset, gold still has a strong fundamental base underneath it.
Now let's forget the headlines for a moment and look only at the chart.
For me, $4,387-$4,400 is the key zone.
Gold is already testing the upper part of the recent range. A clean break above $4,387 would be the first sign that buyers are ready to attack $4,400.
But the important part would not simply be breaking $4,400.
Gold would need to hold above it.
That is the difference between a real breakout and a quick liquidity grab.
If price breaks above $4,400 and immediately falls back below it, I would be careful about calling that a bullish breakout.
On the other hand, if gold breaks through, consolidates above the level and buyers continue defending it, the technical picture becomes much stronger.
Below the current price, I am watching $4,359 first.
That level matters because it sits around the recent price structure.
If gold falls below $4,359, the short-term momentum starts looking less convincing.
Then I would watch $4,344, followed by $4,328.
And underneath all of that sits the major intraday low at $4,316.41.
A move back toward $4,316 would completely change the short-term picture because it would mean that the entire recovery was unable to hold.
There is also one number on this chart that I find particularly interesting.
Gold is showing approximately +7.49% over seven days and +6.71% over 30 days.
Yet the 90-day performance is still around -7.37%, while the 180-day performance is around -12.62%.
That tells me something important.
The recent strength is real, but the longer-term recovery is not fully complete.
In other words, gold has made a strong comeback, but the market still has something to prove.
That is why I would not describe the current move as a confirmed breakout yet.
I see it more as a market standing directly in front of a breakout level.
The next few sessions could be much more important than the last few.
If CPI comes in soft and gold breaks $4,400 with strong follow-through, the current recovery could turn into another major upside leg.
If CPI surprises higher and yields rise, the same $4,400 level could become a very clean rejection zone.
And this is where trading gold gets interesting.
The chart is bullish in the short term.
The macro picture is supportive, but not completely one-sided.
The price is strong, but it is also sitting directly under resistance.
So there is a clear setup, but there is no guarantee.
For now, my main levels are simple:
Above $4,400: bullish breakout territory.
Around $4,359: first short-term support.
$4,344-$4,328: deeper support zone.
Below $4,316: the current recovery structure starts looking seriously damaged.
Gold does not need to move hundreds of dollars to tell us which side is winning.
Sometimes the answer comes from watching how price behaves around one very specific level.
Right now, that level looks like $4,400.
Everyone can see it.
The real question is whether buyers have enough strength to actually take it.
So what do you think comes first: a clean break above $4,400, or a move back below $4,350 before CPI?
$XAUT #GOLD #GoldChallenges$4380
{future}(XAUTUSDT)
Gold at $4,379: Is This Just a Relief Rally, or Is a Bigger Breakout Coming?
Last night, I kept looking at the gold chart because one thing felt more interesting than the actual price.
It was the move.
Gold dropped to $4,316.41 and then climbed all the way back toward $4,387.38. That is roughly a $71 move in a very short period. When I see a move like that, I do not immediately ask whether gold is bullish or bearish. I first ask a simpler question:
Who is actually in control right now?
On the Binance XAUUSDT Perpetual chart, gold is trading around $4,379.16, with a 24-hour high of $4,387.38 and a low of $4,316.41.
The interesting part is that price is sitting very close to the daily high.
That tells me buyers did not just recover the earlier sell-off. They pushed price back toward the top of the range and are currently refusing to give much of that move back.
But there is another side to this story.
Looking across the broader gold market, spot gold has also been trading around the $4,350-$4,370 area, while gold futures have been holding somewhat higher. Tokenized gold markets such as XAUT and PAXG are also showing the same broad direction, although prices can differ slightly between exchanges because of liquidity and timing.
So I would not treat every gold price on Binance, CoinGecko, CoinMarketCap or OKX as exactly the same thing.
For short-term trading, the Binance chart in front of me is the important one.
For the bigger picture, the macro data matters much more.
And that is where things become interesting.
The recent U.S. jobs data gave gold another reason to move higher.
The weaker employment numbers reduced expectations that the Federal Reserve would need to remain extremely tight for much longer. That put some pressure on the dollar and helped gold attract buyers again.
But I think there is a catch here.
The market is now waiting for the next inflation numbers.
U.S. CPI on August 12 and PPI on August 13 could decide whether this gold move continues or starts losing momentum.
If inflation comes in softer than expected, traders could start pricing in a greater chance of easier Fed policy. That would normally be supportive for gold.
But if inflation comes in hotter than expected, the story changes quickly.
Higher inflation can keep U.S. yields elevated and reduce expectations for aggressive rate cuts. In that situation, gold could face selling pressure even after such a strong recovery.
This is why I am not comfortable simply looking at the green candles and calling for another straight move higher.
There is another factor worth watching too.
Central-bank demand for gold remains an important part of the long-term story. China continued adding gold to its reserves in July, showing that official-sector demand has not disappeared.
That does not guarantee higher prices.
But when you combine central-bank buying with geopolitical uncertainty, changing interest-rate expectations and continued demand for a traditional safe-haven asset, gold still has a strong fundamental base underneath it.
Now let's forget the headlines for a moment and look only at the chart.
For me, $4,387-$4,400 is the key zone.
Gold is already testing the upper part of the recent range. A clean break above $4,387 would be the first sign that buyers are ready to attack $4,400.
But the important part would not simply be breaking $4,400.
Gold would need to hold above it.
That is the difference between a real breakout and a quick liquidity grab.
If price breaks above $4,400 and immediately falls back below it, I would be careful about calling that a bullish breakout.
On the other hand, if gold breaks through, consolidates above the level and buyers continue defending it, the technical picture becomes much stronger.
Below the current price, I am watching $4,359 first.
That level matters because it sits around the recent price structure.
If gold falls below $4,359, the short-term momentum starts looking less convincing.
Then I would watch $4,344, followed by $4,328.
And underneath all of that sits the major intraday low at $4,316.41.
A move back toward $4,316 would completely change the short-term picture because it would mean that the entire recovery was unable to hold.
There is also one number on this chart that I find particularly interesting.
Gold is showing approximately +7.49% over seven days and +6.71% over 30 days.
Yet the 90-day performance is still around -7.37%, while the 180-day performance is around -12.62%.
That tells me something important.
The recent strength is real, but the longer-term recovery is not fully complete.
In other words, gold has made a strong comeback, but the market still has something to prove.
That is why I would not describe the current move as a confirmed breakout yet.
I see it more as a market standing directly in front of a breakout level.
The next few sessions could be much more important than the last few.
If CPI comes in soft and gold breaks $4,400 with strong follow-through, the current recovery could turn into another major upside leg.
If CPI surprises higher and yields rise, the same $4,400 level could become a very clean rejection zone.
And this is where trading gold gets interesting.
The chart is bullish in the short term.
The macro picture is supportive, but not completely one-sided.
The price is strong, but it is also sitting directly under resistance.
So there is a clear setup, but there is no guarantee.
For now, my main levels are simple:
Above $4,400: bullish breakout territory.
Around $4,359: first short-term support.
$4,344-$4,328: deeper support zone.
Below $4,316: the current recovery structure starts looking seriously damaged.
Gold does not need to move hundreds of dollars to tell us which side is winning.
Sometimes the answer comes from watching how price behaves around one very specific level.
Right now, that level looks like $4,400.
Everyone can see it.
The real question is whether buyers have enough strength to actually take it.
So what do you think comes first: a clean break above $4,400, or a move back below $4,350 before CPI?
$XAUT #GOLD #GoldChallenges$4380
It was the move.
Gold dropped to $4,316.41 and then climbed all the way back toward $4,387.38. That is roughly a $71 move in a very short period. When I see a move like that, I do not immediately ask whether gold is bullish or bearish. I first ask a simpler question:
Who is actually in control right now?
On the Binance XAUUSDT Perpetual chart, gold is trading around $4,379.16, with a 24-hour high of $4,387.38 and a low of $4,316.41.
The interesting part is that price is sitting very close to the daily high.
That tells me buyers did not just recover the earlier sell-off. They pushed price back toward the top of the range and are currently refusing to give much of that move back.
But there is another side to this story.
Looking across the broader gold market, spot gold has also been trading around the $4,350-$4,370 area, while gold futures have been holding somewhat higher. Tokenized gold markets such as XAUT and PAXG are also showing the same broad direction, although prices can differ slightly between exchanges because of liquidity and timing.
So I would not treat every gold price on Binance, CoinGecko, CoinMarketCap or OKX as exactly the same thing.
For short-term trading, the Binance chart in front of me is the important one.
For the bigger picture, the macro data matters much more.
And that is where things become interesting.
The recent U.S. jobs data gave gold another reason to move higher.
The weaker employment numbers reduced expectations that the Federal Reserve would need to remain extremely tight for much longer. That put some pressure on the dollar and helped gold attract buyers again.
But I think there is a catch here.
The market is now waiting for the next inflation numbers.
U.S. CPI on August 12 and PPI on August 13 could decide whether this gold move continues or starts losing momentum.
If inflation comes in softer than expected, traders could start pricing in a greater chance of easier Fed policy. That would normally be supportive for gold.
But if inflation comes in hotter than expected, the story changes quickly.
Higher inflation can keep U.S. yields elevated and reduce expectations for aggressive rate cuts. In that situation, gold could face selling pressure even after such a strong recovery.
This is why I am not comfortable simply looking at the green candles and calling for another straight move higher.
There is another factor worth watching too.
Central-bank demand for gold remains an important part of the long-term story. China continued adding gold to its reserves in July, showing that official-sector demand has not disappeared.
That does not guarantee higher prices.
But when you combine central-bank buying with geopolitical uncertainty, changing interest-rate expectations and continued demand for a traditional safe-haven asset, gold still has a strong fundamental base underneath it.
Now let's forget the headlines for a moment and look only at the chart.
For me, $4,387-$4,400 is the key zone.
Gold is already testing the upper part of the recent range. A clean break above $4,387 would be the first sign that buyers are ready to attack $4,400.
But the important part would not simply be breaking $4,400.
Gold would need to hold above it.
That is the difference between a real breakout and a quick liquidity grab.
If price breaks above $4,400 and immediately falls back below it, I would be careful about calling that a bullish breakout.
On the other hand, if gold breaks through, consolidates above the level and buyers continue defending it, the technical picture becomes much stronger.
Below the current price, I am watching $4,359 first.
That level matters because it sits around the recent price structure.
If gold falls below $4,359, the short-term momentum starts looking less convincing.
Then I would watch $4,344, followed by $4,328.
And underneath all of that sits the major intraday low at $4,316.41.
A move back toward $4,316 would completely change the short-term picture because it would mean that the entire recovery was unable to hold.
There is also one number on this chart that I find particularly interesting.
Gold is showing approximately +7.49% over seven days and +6.71% over 30 days.
Yet the 90-day performance is still around -7.37%, while the 180-day performance is around -12.62%.
That tells me something important.
The recent strength is real, but the longer-term recovery is not fully complete.
In other words, gold has made a strong comeback, but the market still has something to prove.
That is why I would not describe the current move as a confirmed breakout yet.
I see it more as a market standing directly in front of a breakout level.
The next few sessions could be much more important than the last few.
If CPI comes in soft and gold breaks $4,400 with strong follow-through, the current recovery could turn into another major upside leg.
If CPI surprises higher and yields rise, the same $4,400 level could become a very clean rejection zone.
And this is where trading gold gets interesting.
The chart is bullish in the short term.
The macro picture is supportive, but not completely one-sided.
The price is strong, but it is also sitting directly under resistance.
So there is a clear setup, but there is no guarantee.
For now, my main levels are simple:
Above $4,400: bullish breakout territory.
Around $4,359: first short-term support.
$4,344-$4,328: deeper support zone.
Below $4,316: the current recovery structure starts looking seriously damaged.
Gold does not need to move hundreds of dollars to tell us which side is winning.
Sometimes the answer comes from watching how price behaves around one very specific level.
Right now, that level looks like $4,400.
Everyone can see it.
The real question is whether buyers have enough strength to actually take it.
So what do you think comes first: a clean break above $4,400, or a move back below $4,350 before CPI?
$XAUT #GOLD #GoldChallenges$4380
4
496
Log in to explore more content
Join global crypto users on Binance Square
⚡️ Get latest and useful information about crypto.
💬 Trusted by the world’s largest crypto exchange.
👍 Discover real insights from verified creators.
Email / Phone number
Trending Topics
1
#ChinaIndustrialProfitGrowthSlowsFourthMonth
100 views
29 Discussing
2
#BitwiseFilesFinalNEARSpotETFProspectus
94,512 views
1,494 Discussing
3
#BitgetHackerMoves$83MStolenXRP
34,659 views
167 Discussing
4
#SOLSpotETFWeeklyInflow$188M
22,799 views
133 Discussing
5
#DogecoinETFsPostBiggestWeekSinceLaunch
58,308 views
1,016 Discussing
6
#StrategyStriveAdd2305BitcoinThisWeek
150,786 views
2,221 Discussing
7
#TrumpRejectsIranHormuzReopening
129,749 views
1,674 Discussing
8
#CircleTetherFreezeBitgetHackerWallet
110,353 views
1,535 Discussing
9
#SECSaysTokenBuybacksNotAutoSecurities
75,085 views
915 Discussing
10
#ChinaUSAgreeOn$30BTariffCut
5,686 views
48 Discussing