

#gme
gme
6.5M views
2,203 Discussing
GameStop (GME) is currently leading the memecoin sector, capturing the attention of investors and enthusiasts alike. Let's discuss GME and its future as a Solana-based memecoin.
Hot
Latest


·
--
Surge In GME Meme Coin Value On Multiple Blockchain PlatformsAccording to BlockBeats, on May 13, the value of GME meme coins on several blockchain platforms skyrocketed due to the surge in GameStop's US stock. Specifically, the GME coin on the Solana blockchain saw a 24-hour increase of 1518%, with a temporary price of 0.008322 USD. Similarly, the GME coin on the Ethereum blockchain experienced a 24-hour increase of 93,492%, with a temporary price of 0.058565 USD. Lastly, the GME coin on the Base blockchain saw a 24-hour increase of 322%, with a temporary price of 0.02981 USD.
This sudden increase in the value of GME meme coins across multiple blockchain platforms is directly linked to the surge in GameStop's US stock. The correlation between the stock market and the value of meme coins is a clear indication of the influence traditional financial markets can have on the digital currency landscape. However, it's important to note that the prices mentioned are temporary and can fluctuate due to the volatile nature of digital currencies.
Surge In GME Meme Coin Value On Multiple Blockchain Platforms
According to BlockBeats, on May 13, the value of GME meme coins on several blockchain platforms skyrocketed due to the surge in GameStop's US stock. Specifically, the GME coin on the Solana blockchain saw a 24-hour increase of 1518%, with a temporary price of 0.008322 USD. Similarly, the GME coin on the Ethereum blockchain experienced a 24-hour increase of 93,492%, with a temporary price of 0.058565 USD. Lastly, the GME coin on the Base blockchain saw a 24-hour increase of 322%, with a temporary price of 0.02981 USD.
This sudden increase in the value of GME meme coins across multiple blockchain platforms is directly linked to the surge in GameStop's US stock. The correlation between the stock market and the value of meme coins is a clear indication of the influence traditional financial markets can have on the digital currency landscape. However, it's important to note that the prices mentioned are temporary and can fluctuate due to the volatile nature of digital currencies.
This sudden increase in the value of GME meme coins across multiple blockchain platforms is directly linked to the surge in GameStop's US stock. The correlation between the stock market and the value of meme coins is a clear indication of the influence traditional financial markets can have on the digital currency landscape. However, it's important to note that the prices mentioned are temporary and can fluctuate due to the volatile nature of digital currencies.
3
1
15
20.2k

·
--
$GME falls to $23.41, down 6.135% in 24 hours; the funding rate has dropped to zero, with open interest of 55,000 contracts. Zero funding means neither side—longs or shorts—pays the other, so the market stalls here. A drop of around 6% usually triggers inflows of risk-hedging capital, but the funding rate doesn’t move at all, suggesting even hedging orders aren’t coming in; liquidity may be standing by at the sidelines.
This signal is based on a divergence between price and funding rate: prices are falling, but the cost of capital isn’t rising. The selling pressure may not be coming from contract shorts initiating new positions; it could instead be spot holders reducing exposure. Retail shares like this (e.g., $GME ) are extremely sensitive to sentiment. In a zero-funding environment, the decline looks more like a snapshot of the market’s overall risk appetite shrinking rather than company-specific bad news. Conversely, if suddenly meme-stock speculation news pushes the funding rate back positive, longs would start accumulating cost pressure.
The strongest counter-evidence is a sudden reversal in retail sentiment. If a new round of GameStop calls spreads on social media, or if a broader rebound in risk appetite in the U.S. stock market lifts the meme-stock segment, $GME could bounce quickly and the funding rate could turn positive. My invalidation conditions are: price moves back above $24 and holds for at least 12 hours, or the funding rate breaks above 0.0001.
Trading tag: #TradFi #链上美股 #GME
Where do you think this framework is most likely to be wrong?
$GME falls to $23.41, down 6.135% in 24 hours; the funding rate has dropped to zero, with open interest of 55,000 contracts. Zero funding means neither side—longs or shorts—pays the other, so the market stalls here. A drop of around 6% usually triggers inflows of risk-hedging capital, but the funding rate doesn’t move at all, suggesting even hedging orders aren’t coming in; liquidity may be standing by at the sidelines.
This signal is based on a divergence between price and funding rate: prices are falling, but the cost of capital isn’t rising. The selling pressure may not be coming from contract shorts initiating new positions; it could instead be spot holders reducing exposure. Retail shares like this (e.g., $GME ) are extremely sensitive to sentiment. In a zero-funding environment, the decline looks more like a snapshot of the market’s overall risk appetite shrinking rather than company-specific bad news. Conversely, if suddenly meme-stock speculation news pushes the funding rate back positive, longs would start accumulating cost pressure.
The strongest counter-evidence is a sudden reversal in retail sentiment. If a new round of GameStop calls spreads on social media, or if a broader rebound in risk appetite in the U.S. stock market lifts the meme-stock segment, $GME could bounce quickly and the funding rate could turn positive. My invalidation conditions are: price moves back above $24 and holds for at least 12 hours, or the funding rate breaks above 0.0001.
Trading tag: #TradFi #链上美股 #GME
Where do you think this framework is most likely to be wrong?
This signal is based on a divergence between price and funding rate: prices are falling, but the cost of capital isn’t rising. The selling pressure may not be coming from contract shorts initiating new positions; it could instead be spot holders reducing exposure. Retail shares like this (e.g., $GME ) are extremely sensitive to sentiment. In a zero-funding environment, the decline looks more like a snapshot of the market’s overall risk appetite shrinking rather than company-specific bad news. Conversely, if suddenly meme-stock speculation news pushes the funding rate back positive, longs would start accumulating cost pressure.
The strongest counter-evidence is a sudden reversal in retail sentiment. If a new round of GameStop calls spreads on social media, or if a broader rebound in risk appetite in the U.S. stock market lifts the meme-stock segment, $GME could bounce quickly and the funding rate could turn positive. My invalidation conditions are: price moves back above $24 and holds for at least 12 hours, or the funding rate breaks above 0.0001.
Trading tag: #TradFi #链上美股 #GME
Where do you think this framework is most likely to be wrong?
35

·
--
Over the past 24 hours, $GME is down 6.062%, and the price has fallen to 23.4. The old dog glanced at the funding rate on the perpetual contract—it sits steadily at 0. This combination is kind of interesting: with the price falling, neither longs nor shorts have to pay each other.
A zero funding rate usually signals a fragile balance at some price level, or simply the dead stillness left after liquidity is drained. Breaking it down, a 0 rate directly rules out two common scenarios: it’s not that longs are overcrowded and paying shorts, and it’s not that shorts are piled in enough to pay longs in reverse. Coupled with the open interest of 55336.04 and roughly 4.48 million in volume, the data points to a stalemate with no clear direction. The price drop didn’t trigger a big push from the shorts, and there’s no sign that longs are stubbornly holding under negative-funding conditions.
From the cycle position, this zero-funding plus slow-bid selloff pattern often isn’t the start of a new trend. More often, it’s the late stage of a consolidation period—the market is waiting for some external force to break the balance.
So my take is very straightforward: $GME is currently in directionless “trash time.” Going long or short both have a tendency to get slapped back and forth. If the market expects it to rebound by following some AI narrative from the U.S. semiconductor sector, then first it has to ask how much on-exchange capital is actually willing to do work under this zero funding rate. I won’t guess the next leg higher, because there’s no counterpart/confirmation from other tokens in the data. Betting everything on a liquidity-dried-up asset has too low a win rate. The old dog’s choice is observation—absolutely no touching.
If you really want to play, wait for two signals: either (1) the funding rate turns positive and price breaks below 22 with increased volume—then shorts may start to push, and you could consider a small short position in the move; or (2) the funding rate turns negative and a single bullish candle reclaims 24 or above—that would hint at a short squeeze, and then you could consider going long.
Where could this view be wrong? If there’s a situation where $GME’s funding stays near zero for a long time, but the price keeps grinding down and volume keeps shrinking, that would suggest even the stalemate can’t be maintained—the sell-off would become the main theme, and my “wait for external force to break the deadlock” thesis would fail. That would be a different, weaker kind of move, needing re-evaluation.
Trading tag: #BinanceFutures #TradFi #USDⓈM #GME #GMEUSDT $GME
Over the past 24 hours, $GME is down 6.062%, and the price has fallen to 23.4. The old dog glanced at the funding rate on the perpetual contract—it sits steadily at 0. This combination is kind of interesting: with the price falling, neither longs nor shorts have to pay each other.
A zero funding rate usually signals a fragile balance at some price level, or simply the dead stillness left after liquidity is drained. Breaking it down, a 0 rate directly rules out two common scenarios: it’s not that longs are overcrowded and paying shorts, and it’s not that shorts are piled in enough to pay longs in reverse. Coupled with the open interest of 55336.04 and roughly 4.48 million in volume, the data points to a stalemate with no clear direction. The price drop didn’t trigger a big push from the shorts, and there’s no sign that longs are stubbornly holding under negative-funding conditions.
From the cycle position, this zero-funding plus slow-bid selloff pattern often isn’t the start of a new trend. More often, it’s the late stage of a consolidation period—the market is waiting for some external force to break the balance.
So my take is very straightforward: $GME is currently in directionless “trash time.” Going long or short both have a tendency to get slapped back and forth. If the market expects it to rebound by following some AI narrative from the U.S. semiconductor sector, then first it has to ask how much on-exchange capital is actually willing to do work under this zero funding rate. I won’t guess the next leg higher, because there’s no counterpart/confirmation from other tokens in the data. Betting everything on a liquidity-dried-up asset has too low a win rate. The old dog’s choice is observation—absolutely no touching.
If you really want to play, wait for two signals: either (1) the funding rate turns positive and price breaks below 22 with increased volume—then shorts may start to push, and you could consider a small short position in the move; or (2) the funding rate turns negative and a single bullish candle reclaims 24 or above—that would hint at a short squeeze, and then you could consider going long.
Where could this view be wrong? If there’s a situation where $GME ’s funding stays near zero for a long time, but the price keeps grinding down and volume keeps shrinking, that would suggest even the stalemate can’t be maintained—the sell-off would become the main theme, and my “wait for external force to break the deadlock” thesis would fail. That would be a different, weaker kind of move, needing re-evaluation.
Trading tag: #BinanceFutures #TradFi #USDⓈM #GME #GMEUSDT $GME
A zero funding rate usually signals a fragile balance at some price level, or simply the dead stillness left after liquidity is drained. Breaking it down, a 0 rate directly rules out two common scenarios: it’s not that longs are overcrowded and paying shorts, and it’s not that shorts are piled in enough to pay longs in reverse. Coupled with the open interest of 55336.04 and roughly 4.48 million in volume, the data points to a stalemate with no clear direction. The price drop didn’t trigger a big push from the shorts, and there’s no sign that longs are stubbornly holding under negative-funding conditions.
From the cycle position, this zero-funding plus slow-bid selloff pattern often isn’t the start of a new trend. More often, it’s the late stage of a consolidation period—the market is waiting for some external force to break the balance.
So my take is very straightforward: $GME is currently in directionless “trash time.” Going long or short both have a tendency to get slapped back and forth. If the market expects it to rebound by following some AI narrative from the U.S. semiconductor sector, then first it has to ask how much on-exchange capital is actually willing to do work under this zero funding rate. I won’t guess the next leg higher, because there’s no counterpart/confirmation from other tokens in the data. Betting everything on a liquidity-dried-up asset has too low a win rate. The old dog’s choice is observation—absolutely no touching.
If you really want to play, wait for two signals: either (1) the funding rate turns positive and price breaks below 22 with increased volume—then shorts may start to push, and you could consider a small short position in the move; or (2) the funding rate turns negative and a single bullish candle reclaims 24 or above—that would hint at a short squeeze, and then you could consider going long.
Where could this view be wrong? If there’s a situation where $GME ’s funding stays near zero for a long time, but the price keeps grinding down and volume keeps shrinking, that would suggest even the stalemate can’t be maintained—the sell-off would become the main theme, and my “wait for external force to break the deadlock” thesis would fail. That would be a different, weaker kind of move, needing re-evaluation.
Trading tag: #BinanceFutures #TradFi #USDⓈM #GME #GMEUSDT $GME
2

·
--
📈 Naiseg Strategy Sharing
━━━━━━━━━━━━━━━━
💰 Coin: GMEUSDT
🟢 Direction: Long (buy)
📊 Signal: Buy
⭐ Confidence: 67%
📈 Trend: Uptrend
━━━━━━━━━━━━━━━━
💎 Current Price: 23.45
🔴 Resistance Levels: [25.242612, 25.25]
🟢 Support Levels: [23.235388, 22.13]
━━━━━━━━━━━━━━━━
📝 Analysis: The drop is -6.0% + RSI is relatively low + near the lower Bollinger Band track, so the probability of a rebound is high
━━━━━━━━━━━━━━━━
📅 2026.09.26 05:06 | For reference only and does not constitute investment advice
#GME #加密货币 #合约交易 #奈斯哥 #quantitative trading
📈 Naiseg Strategy Sharing
━━━━━━━━━━━━━━━━
💰 Coin: GMEUSDT
🟢 Direction: Long (buy)
📊 Signal: Buy
⭐ Confidence: 67%
📈 Trend: Uptrend
━━━━━━━━━━━━━━━━
💎 Current Price: 23.45
🔴 Resistance Levels: [25.242612, 25.25]
🟢 Support Levels: [23.235388, 22.13]
━━━━━━━━━━━━━━━━
📝 Analysis: The drop is -6.0% + RSI is relatively low + near the lower Bollinger Band track, so the probability of a rebound is high
━━━━━━━━━━━━━━━━
📅 2026.09.26 05:06 | For reference only and does not constitute investment advice
#GME #加密货币 #合约交易 #奈斯哥 #quantitative trading
━━━━━━━━━━━━━━━━
💰 Coin: GMEUSDT
🟢 Direction: Long (buy)
📊 Signal: Buy
⭐ Confidence: 67%
📈 Trend: Uptrend
━━━━━━━━━━━━━━━━
💎 Current Price: 23.45
🔴 Resistance Levels: [25.242612, 25.25]
🟢 Support Levels: [23.235388, 22.13]
━━━━━━━━━━━━━━━━
📝 Analysis: The drop is -6.0% + RSI is relatively low + near the lower Bollinger Band track, so the probability of a rebound is high
━━━━━━━━━━━━━━━━
📅 2026.09.26 05:06 | For reference only and does not constitute investment advice
#GME #加密货币 #合约交易 #奈斯哥 #quantitative trading
1
·
--
$GME is up nearly 4% intraday, but the funding rate on perpetual futures remains motionless, staying at zero. The rally hasn’t sparked a collective rush from leveraged longs, and there’s been no sign of large-scale capitulation from shorts.
This usually means the upward price move lacks positive, funding-rate-driven cumulative friction. The upside momentum may be coming from spot buying rather than perpetual-futures mania. With no crowded long positioning, the risk of liquidation stampedes during a pullback is lower.
But this also dampens the potential for short-term explosive moves. If the price holds above $25 and the funding rate slowly turns positive, that would be the sign that the leveraged market is starting to recognize the uptrend.
Trading tag: #TradFi #链上美股 #GME
Where do you think this assessment is most likely to be wrong?
$GME is up nearly 4% intraday, but the funding rate on perpetual futures remains motionless, staying at zero. The rally hasn’t sparked a collective rush from leveraged longs, and there’s been no sign of large-scale capitulation from shorts.
This usually means the upward price move lacks positive, funding-rate-driven cumulative friction. The upside momentum may be coming from spot buying rather than perpetual-futures mania. With no crowded long positioning, the risk of liquidation stampedes during a pullback is lower.
But this also dampens the potential for short-term explosive moves. If the price holds above $25 and the funding rate slowly turns positive, that would be the sign that the leveraged market is starting to recognize the uptrend.
Trading tag: #TradFi #链上美股 #GME
Where do you think this assessment is most likely to be wrong?
This usually means the upward price move lacks positive, funding-rate-driven cumulative friction. The upside momentum may be coming from spot buying rather than perpetual-futures mania. With no crowded long positioning, the risk of liquidation stampedes during a pullback is lower.
But this also dampens the potential for short-term explosive moves. If the price holds above $25 and the funding rate slowly turns positive, that would be the sign that the leveraged market is starting to recognize the uptrend.
Trading tag: #TradFi #链上美股 #GME
Where do you think this assessment is most likely to be wrong?
43

·
--
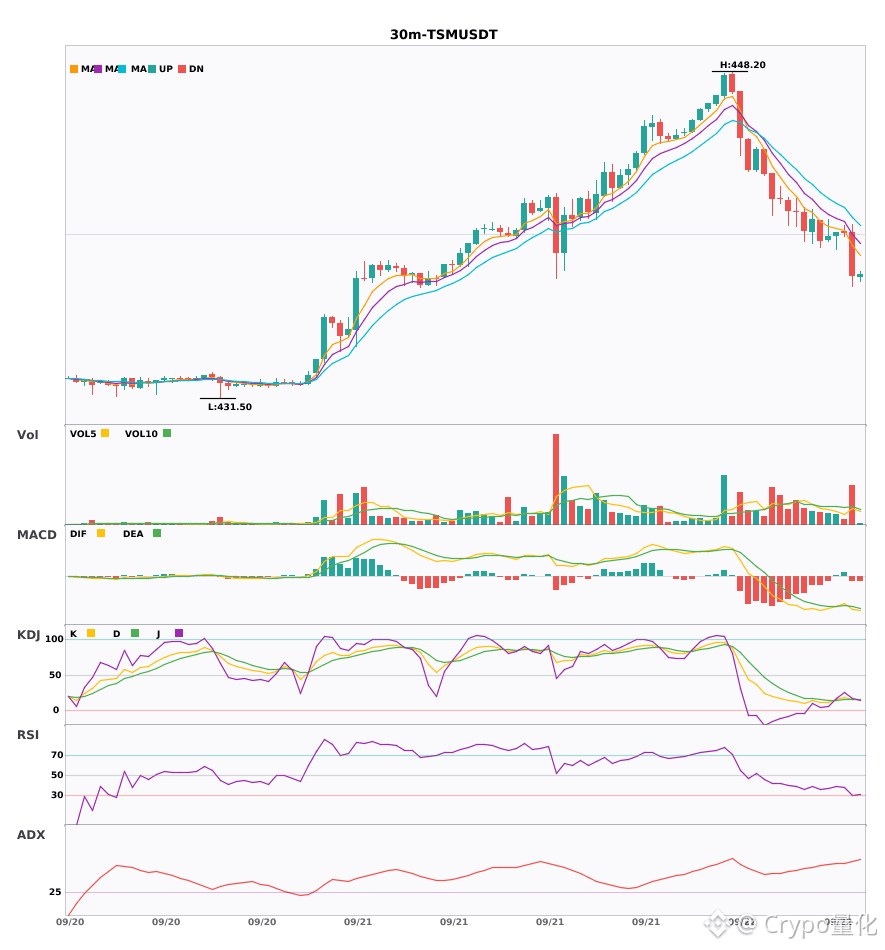
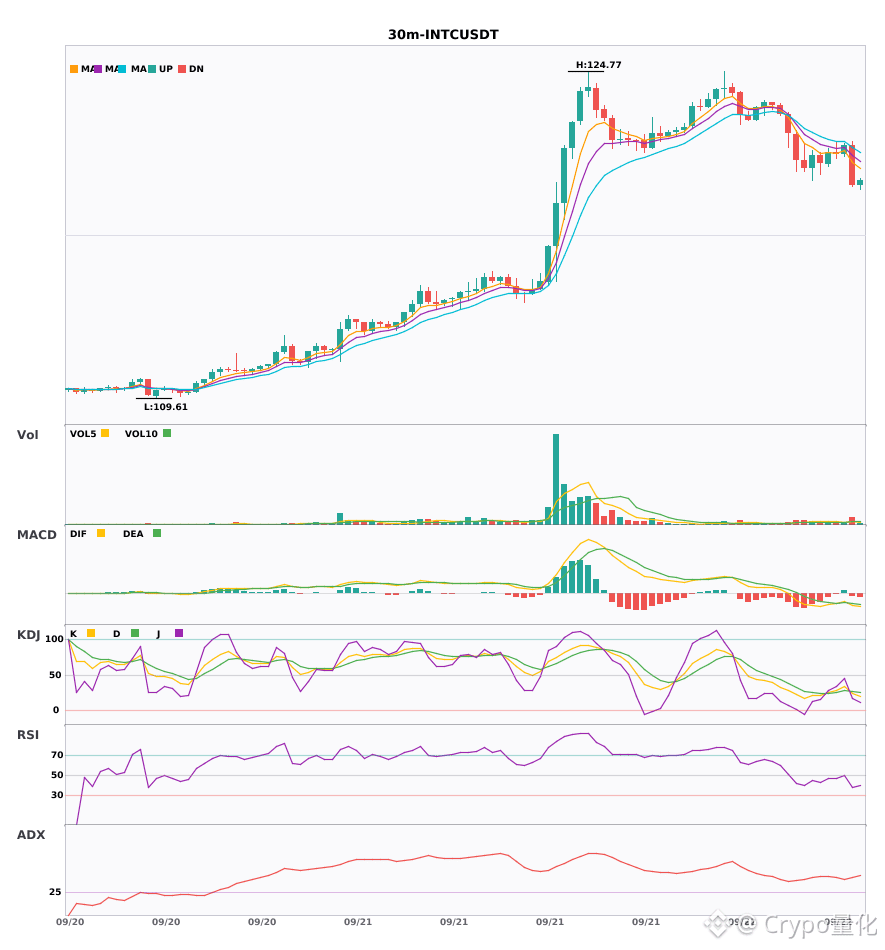
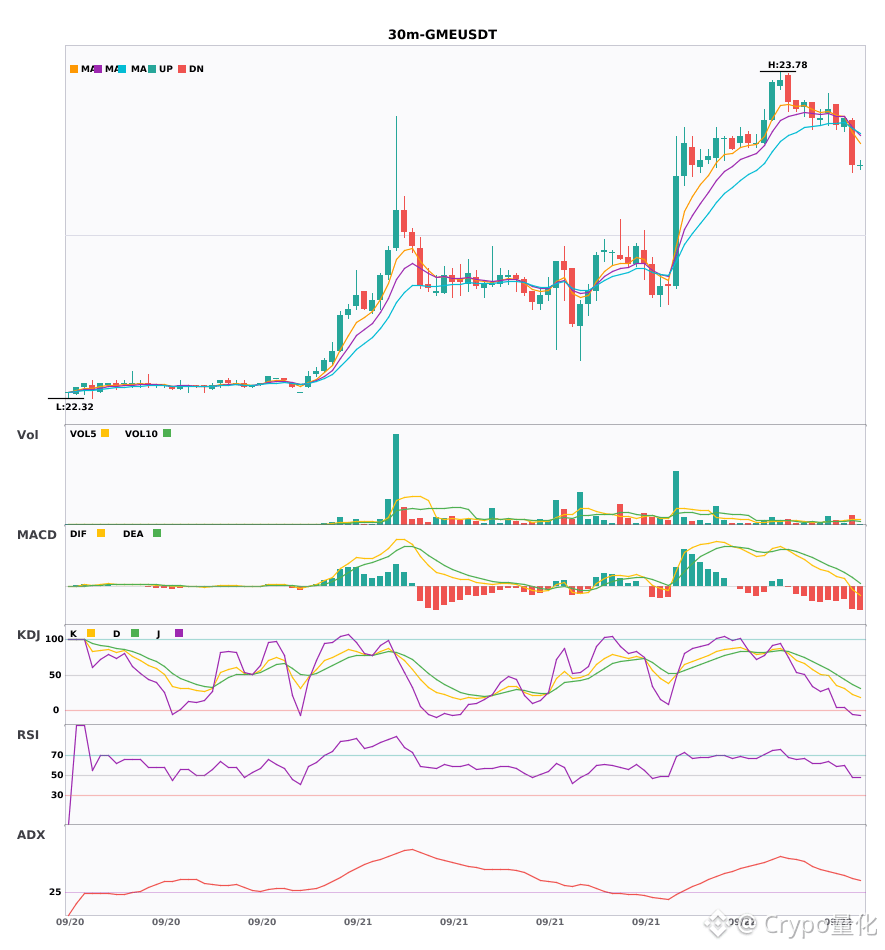
Three 30-minute-level short-signal alerts: $TSM / $INTC / $GME🔥
════════════════════
🟢 $TSM 30-minute short signal
⚠️ Technicals: ADX (64) — an extremely strong trend (watch for a hot/overheated pullback) | MACD forms a bearish “dead cross” below zero, with shorts accelerating | EMA5 < EMA8 < EMA13 (bearish alignment) | KDJ is in the oversold zone—watch for potential rebound (K is 16.2, D is 16.0) | Volume expands (2.2x)
════════════════════
🟢 $INTC 30-minute short signal
⚠️ Technicals: ADX (45) — a clear trending market | MACD bearish dead cross below zero, shorts accelerating | EMA5 < EMA8 < EMA13 (bearish alignment) | KDJ dead cross—bearish in the short term (K is 23.5, D is 27.0) | Volume expands (2.4x)
════════════════════
🟢 $GME 30-minute short signal
⚠️ Technicals: ADX (39) — a clear trending market | MACD DIF falls below the zero line, trend turns bearish | Moving averages “stuck together” as they build up energy—direction likely to be chosen soon | KDJ runs weak, bearish strength dominates (K is 23.0, D is 37.2) | Volume expands (2.4x)
════════════════════
🔔 Follow for first-hand market moves and anomalies 🔔
#技术分析 #TSM #INTC #GME
📌 When trading, pay attention to whether the candlestick patterns match
Three 30-minute-level short-signal alerts: $TSM / $INTC / $GME 🔥
════════════════════
🟢 $TSM 30-minute short signal
⚠️ Technicals: ADX (64) — an extremely strong trend (watch for a hot/overheated pullback) | MACD forms a bearish “dead cross” below zero, with shorts accelerating | EMA5 < EMA8 < EMA13 (bearish alignment) | KDJ is in the oversold zone—watch for potential rebound (K is 16.2, D is 16.0) | Volume expands (2.2x)
════════════════════
🟢 $INTC 30-minute short signal
⚠️ Technicals: ADX (45) — a clear trending market | MACD bearish dead cross below zero, shorts accelerating | EMA5 < EMA8 < EMA13 (bearish alignment) | KDJ dead cross—bearish in the short term (K is 23.5, D is 27.0) | Volume expands (2.4x)
════════════════════
🟢 $GME 30-minute short signal
⚠️ Technicals: ADX (39) — a clear trending market | MACD DIF falls below the zero line, trend turns bearish | Moving averages “stuck together” as they build up energy—direction likely to be chosen soon | KDJ runs weak, bearish strength dominates (K is 23.0, D is 37.2) | Volume expands (2.4x)
════════════════════
🔔 Follow for first-hand market moves and anomalies 🔔
#技术分析 #TSM #INTC #GME
📌 When trading, pay attention to whether the candlestick patterns match
════════════════════
🟢 $TSM 30-minute short signal
⚠️ Technicals: ADX (64) — an extremely strong trend (watch for a hot/overheated pullback) | MACD forms a bearish “dead cross” below zero, with shorts accelerating | EMA5 < EMA8 < EMA13 (bearish alignment) | KDJ is in the oversold zone—watch for potential rebound (K is 16.2, D is 16.0) | Volume expands (2.2x)
════════════════════
🟢 $INTC 30-minute short signal
⚠️ Technicals: ADX (45) — a clear trending market | MACD bearish dead cross below zero, shorts accelerating | EMA5 < EMA8 < EMA13 (bearish alignment) | KDJ dead cross—bearish in the short term (K is 23.5, D is 27.0) | Volume expands (2.4x)
════════════════════
🟢 $GME 30-minute short signal
⚠️ Technicals: ADX (39) — a clear trending market | MACD DIF falls below the zero line, trend turns bearish | Moving averages “stuck together” as they build up energy—direction likely to be chosen soon | KDJ runs weak, bearish strength dominates (K is 23.0, D is 37.2) | Volume expands (2.4x)
════════════════════
🔔 Follow for first-hand market moves and anomalies 🔔
#技术分析 #TSM #INTC #GME
📌 When trading, pay attention to whether the candlestick patterns match
98

·
--
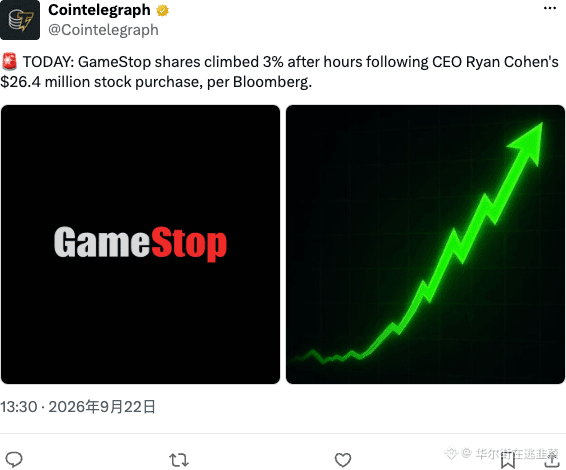
The CEO personally paid 26.4 million dollars out of his own pocket to buy the company's own stock, and GME jumped more than 3% right after hours. This move is more effective than any earnings call. The market eats these signals backed by real cash. But don’t get carried away yet—this is just the old script of meme stocks: the boss calls the shots, retail investors rush in, and in the end, you know who’s left holding the bag. The macro picture is coming in fast, and this kind of stock-specific party won’t last long.
$BTC #GME #US stocks
The CEO personally paid 26.4 million dollars out of his own pocket to buy the company's own stock, and GME jumped more than 3% right after hours. This move is more effective than any earnings call. The market eats these signals backed by real cash. But don’t get carried away yet—this is just the old script of meme stocks: the boss calls the shots, retail investors rush in, and in the end, you know who’s left holding the bag. The macro picture is coming in fast, and this kind of stock-specific party won’t last long.
$BTC #GME #US stocks
$BTC #GME #US stocks
159
·
--
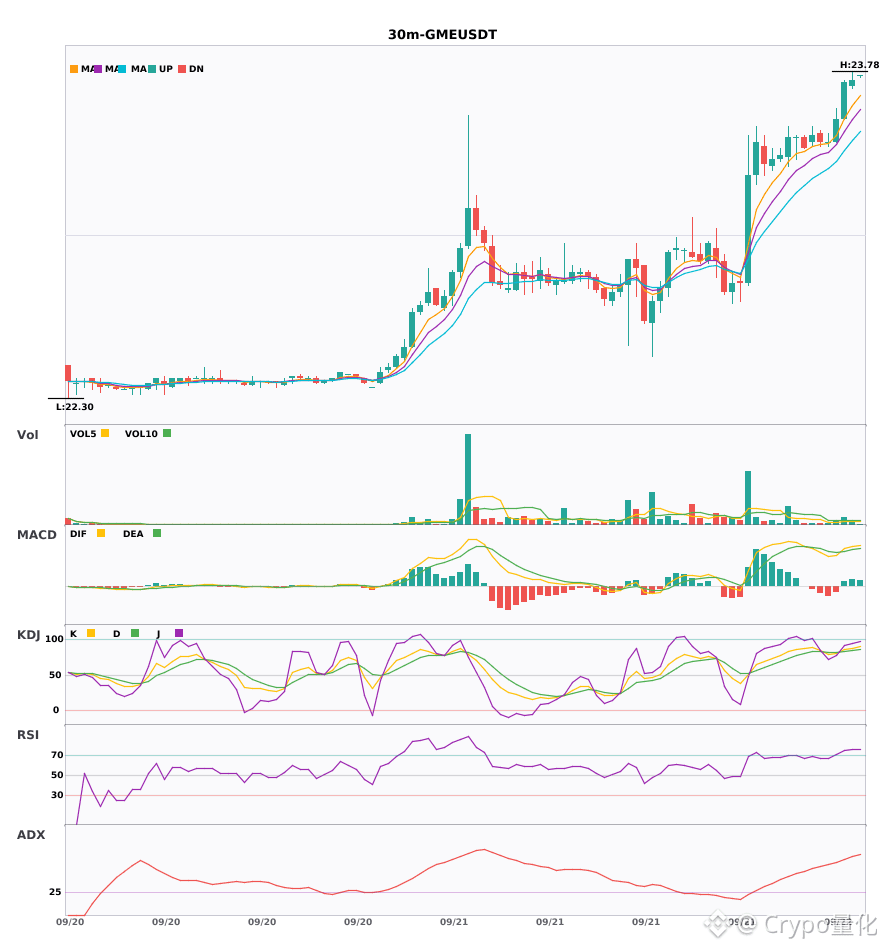
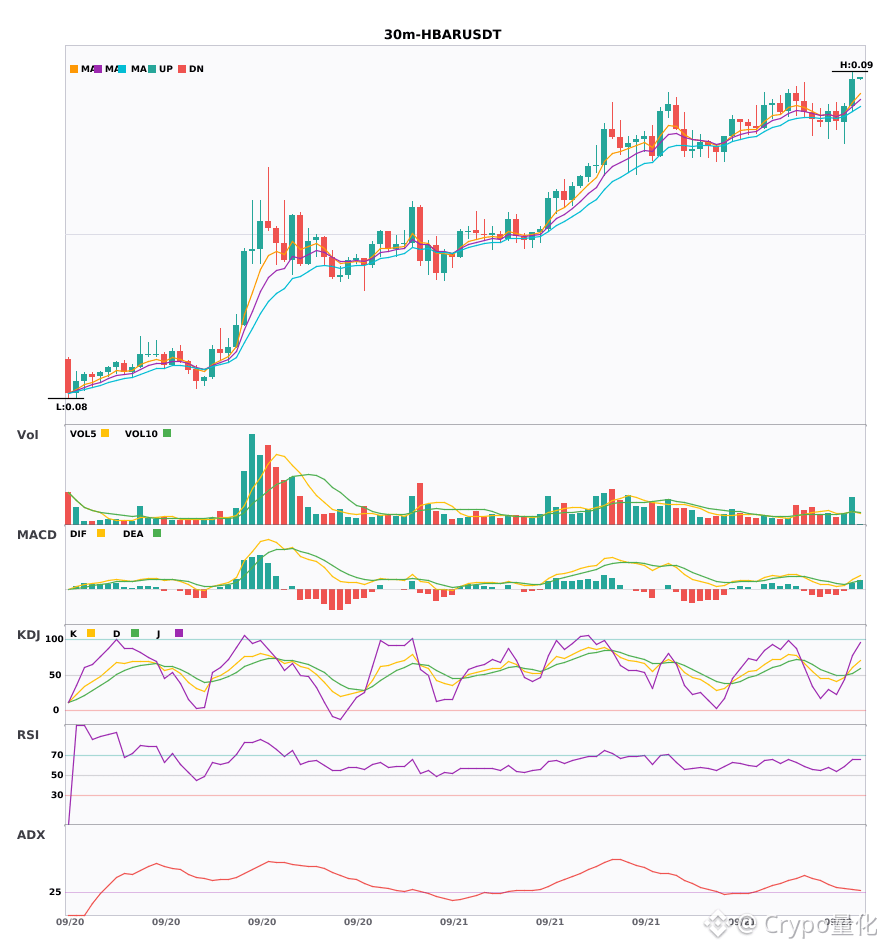
Two 30-minute-level long (bullish) signals appear at the same time: $GME / $HBAR🔥
════════════════════
🔴 $GME 30-minute bullish signal
⚠️ Technical analysis: ADX(68) is an extremely strong trend (watch out for a heated pullback) | MACD is above the zero line with a bullish crossover, bullish momentum releases | EMA5 > EMA8 > EMA13 bullish alignment | KDJ bullish crossover, bullish in the short term (K is 85.7, D is 82.7) | Volume increases (1.6x)
════════════════════
🔴 $HBAR 30-minute bullish signal
⚠️ Technical analysis: ADX(30) the trend is forming and can be entered | MACD is above the zero line with a bullish crossover, bullish momentum releases | EMA5 > EMA8 > EMA13 bullish alignment | KDJ bullish crossover, bullish in the short term (K is 60.7, D is 52.6) | Volume increases (2.1x)
════════════════════
🔔 Watch for the first-hand market news on sudden moves 🔔
#技术分析 #GME #HBAR
📌 When trading, pay attention to whether the candlestick pattern matches
Two 30-minute-level long (bullish) signals appear at the same time: $GME / $HBAR 🔥
════════════════════
🔴 $GME 30-minute bullish signal
⚠️ Technical analysis: ADX(68) is an extremely strong trend (watch out for a heated pullback) | MACD is above the zero line with a bullish crossover, bullish momentum releases | EMA5 > EMA8 > EMA13 bullish alignment | KDJ bullish crossover, bullish in the short term (K is 85.7, D is 82.7) | Volume increases (1.6x)
════════════════════
🔴 $HBAR 30-minute bullish signal
⚠️ Technical analysis: ADX(30) the trend is forming and can be entered | MACD is above the zero line with a bullish crossover, bullish momentum releases | EMA5 > EMA8 > EMA13 bullish alignment | KDJ bullish crossover, bullish in the short term (K is 60.7, D is 52.6) | Volume increases (2.1x)
════════════════════
🔔 Watch for the first-hand market news on sudden moves 🔔
#技术分析 #GME #HBAR
📌 When trading, pay attention to whether the candlestick pattern matches
════════════════════
🔴 $GME 30-minute bullish signal
⚠️ Technical analysis: ADX(68) is an extremely strong trend (watch out for a heated pullback) | MACD is above the zero line with a bullish crossover, bullish momentum releases | EMA5 > EMA8 > EMA13 bullish alignment | KDJ bullish crossover, bullish in the short term (K is 85.7, D is 82.7) | Volume increases (1.6x)
════════════════════
🔴 $HBAR 30-minute bullish signal
⚠️ Technical analysis: ADX(30) the trend is forming and can be entered | MACD is above the zero line with a bullish crossover, bullish momentum releases | EMA5 > EMA8 > EMA13 bullish alignment | KDJ bullish crossover, bullish in the short term (K is 60.7, D is 52.6) | Volume increases (2.1x)
════════════════════
🔔 Watch for the first-hand market news on sudden moves 🔔
#技术分析 #GME #HBAR
📌 When trading, pay attention to whether the candlestick pattern matches
31



GME trading value at the bottom; keep short until 0
First, the conclusion: short.
★ GME #GME 【Main】
Entry timing: 27.4560. Set up short orders in anticipation of being filled; stop loss at 10% (30.2016)
Current price 22.8800, 24h change +3.76%
24h trading value is only $2.588 million—bottom of the whole market
→ Trading volume shrank by 53.0%, buy-side is exhausted; continue holding the short until 0
Range-bound at low levels, lacking rebound momentum
These are also good opportunities to short:
····
SAGA
Current 0.021790, 24h change +10.89%
Entry timing: 0.026148. Place short order; stop loss at 10% (0.028763)
····
POWER
Current 0.129490, 24h change -1.77%
Entry timing: 0.155388. Place short order; stop loss at 10% (0.170927)
····
⚠️ Small-capital trial and error: use strict stop losses; do not trade without risk control
#做空策略 #Risk control
GME trading value at the bottom; keep short until 0
First, the conclusion: short.
★ GME #GME 【Main】
Entry timing: 27.4560. Set up short orders in anticipation of being filled; stop loss at 10% (30.2016)
Current price 22.8800, 24h change +3.76%
24h trading value is only $2.588 million—bottom of the whole market
→ Trading volume shrank by 53.0%, buy-side is exhausted; continue holding the short until 0
Range-bound at low levels, lacking rebound momentum
These are also good opportunities to short:
····
SAGA
Current 0.021790, 24h change +10.89%
Entry timing: 0.026148. Place short order; stop loss at 10% (0.028763)
····
POWER
Current 0.129490, 24h change -1.77%
Entry timing: 0.155388. Place short order; stop loss at 10% (0.170927)
····
⚠️ Small-capital trial and error: use strict stop losses; do not trade without risk control
#做空策略 #Risk control
First, the conclusion: short.
★ GME #GME 【Main】
Entry timing: 27.4560. Set up short orders in anticipation of being filled; stop loss at 10% (30.2016)
Current price 22.8800, 24h change +3.76%
24h trading value is only $2.588 million—bottom of the whole market
→ Trading volume shrank by 53.0%, buy-side is exhausted; continue holding the short until 0
Range-bound at low levels, lacking rebound momentum
These are also good opportunities to short:
····
SAGA
Current 0.021790, 24h change +10.89%
Entry timing: 0.026148. Place short order; stop loss at 10% (0.028763)
····
POWER
Current 0.129490, 24h change -1.77%
Entry timing: 0.155388. Place short order; stop loss at 10% (0.170927)
····
⚠️ Small-capital trial and error: use strict stop losses; do not trade without risk control
#做空策略 #Risk control
16

·
--
$GME 24 hours rose by 3.204%, quoted at 21.58. The funding rate is 0. With just these two numbers, it determines how I write today.
First, the conclusion: this rally lacks confirmation from the derivatives (futures/perpetuals) market. A zero funding rate indicates that the current balance of power between longs and shorts is even, but as the price moves upward, it shows there is no new long willing to pay shorts to maintain their positions. The driving force behind the move is not coming from leveraged derivatives positioning. This is a judgment based on a single signal, because trading volume and open interest—when converted into dollars—are not directly comparable dimensions, so I won’t force a comparison.
The market is pricing in the supposed positives of the Trump trade for U.S. traditional assets, but on-chain derivatives traders didn’t follow through—some even didn’t plan to use leverage to participate.
That’s the problem. The Trump trade is an emotional narrative. Markets are used to pulling up waves of U.S.-stock-related assets when he makes statements or when polls swing. For meme-like names with strong “meme” attributes, like $GME, when sentiment hits, they can surge quickly. But the funding rate didn’t move—it's 0.00000000—which suggests there’s no significant change in derivatives positioning. The open interest figure, 60042.71, by itself also can’t directly infer long/short bias. The inference is: this move is likely being dominated by the spot market, or a small portion of spot capital is pushing the price while derivatives market participants are watching.
Who is paying the cost? Right now, it looks like the people chasing spot are paying the cost, while derivatives longs aren’t paying any funding, so their cost is zero.
The counterargument is straightforward: if next, Trump releases more substantive, directly positive comments about U.S. retail or the gaming industry, or if the overall U.S. stock market pulls up broadly in an emotion-driven way, $GME could be “pulled through” the prior highs in one go by funding—at which point the funding rate might suddenly turn positive, jumping from 0 to 0.01% or higher. That would mean leveraged longs are entering and taking over the baton. But the current structure doesn’t support this view, because no incremental leveraged funding is visible.
Second-order effect: if the heat of the Trump trade cools off, or if U.S. stocks pull back for other reasons, this spot-led, derivatives-lagging situation becomes fragile. Spot longs don’t have leveraged derivatives positions from longs as allies. Once the price stalls, sell pressure will land directly on the spot order book. Derivatives shorts, because they’re currently not paying funding, have very low holding costs—they can wait more patiently. The ones trapped would be the spot buyers who chased the rally, and a tiny number of derivatives longs who rushed to open long positions during the price surge but didn’t benefit from any funding-rate “shelter.”
So the action is clear: don’t chase.
Trading tag: #TradFi #链上美股 #GME
Where do you think this reasoning is most likely to be wrong?
$GME 24 hours rose by 3.204%, quoted at 21.58. The funding rate is 0. With just these two numbers, it determines how I write today.
First, the conclusion: this rally lacks confirmation from the derivatives (futures/perpetuals) market. A zero funding rate indicates that the current balance of power between longs and shorts is even, but as the price moves upward, it shows there is no new long willing to pay shorts to maintain their positions. The driving force behind the move is not coming from leveraged derivatives positioning. This is a judgment based on a single signal, because trading volume and open interest—when converted into dollars—are not directly comparable dimensions, so I won’t force a comparison.
The market is pricing in the supposed positives of the Trump trade for U.S. traditional assets, but on-chain derivatives traders didn’t follow through—some even didn’t plan to use leverage to participate.
That’s the problem. The Trump trade is an emotional narrative. Markets are used to pulling up waves of U.S.-stock-related assets when he makes statements or when polls swing. For meme-like names with strong “meme” attributes, like $GME , when sentiment hits, they can surge quickly. But the funding rate didn’t move—it's 0.00000000—which suggests there’s no significant change in derivatives positioning. The open interest figure, 60042.71, by itself also can’t directly infer long/short bias. The inference is: this move is likely being dominated by the spot market, or a small portion of spot capital is pushing the price while derivatives market participants are watching.
Who is paying the cost? Right now, it looks like the people chasing spot are paying the cost, while derivatives longs aren’t paying any funding, so their cost is zero.
The counterargument is straightforward: if next, Trump releases more substantive, directly positive comments about U.S. retail or the gaming industry, or if the overall U.S. stock market pulls up broadly in an emotion-driven way, $GME could be “pulled through” the prior highs in one go by funding—at which point the funding rate might suddenly turn positive, jumping from 0 to 0.01% or higher. That would mean leveraged longs are entering and taking over the baton. But the current structure doesn’t support this view, because no incremental leveraged funding is visible.
Second-order effect: if the heat of the Trump trade cools off, or if U.S. stocks pull back for other reasons, this spot-led, derivatives-lagging situation becomes fragile. Spot longs don’t have leveraged derivatives positions from longs as allies. Once the price stalls, sell pressure will land directly on the spot order book. Derivatives shorts, because they’re currently not paying funding, have very low holding costs—they can wait more patiently. The ones trapped would be the spot buyers who chased the rally, and a tiny number of derivatives longs who rushed to open long positions during the price surge but didn’t benefit from any funding-rate “shelter.”
So the action is clear: don’t chase.
Trading tag: #TradFi #链上美股 #GME
Where do you think this reasoning is most likely to be wrong?
First, the conclusion: this rally lacks confirmation from the derivatives (futures/perpetuals) market. A zero funding rate indicates that the current balance of power between longs and shorts is even, but as the price moves upward, it shows there is no new long willing to pay shorts to maintain their positions. The driving force behind the move is not coming from leveraged derivatives positioning. This is a judgment based on a single signal, because trading volume and open interest—when converted into dollars—are not directly comparable dimensions, so I won’t force a comparison.
The market is pricing in the supposed positives of the Trump trade for U.S. traditional assets, but on-chain derivatives traders didn’t follow through—some even didn’t plan to use leverage to participate.
That’s the problem. The Trump trade is an emotional narrative. Markets are used to pulling up waves of U.S.-stock-related assets when he makes statements or when polls swing. For meme-like names with strong “meme” attributes, like $GME , when sentiment hits, they can surge quickly. But the funding rate didn’t move—it's 0.00000000—which suggests there’s no significant change in derivatives positioning. The open interest figure, 60042.71, by itself also can’t directly infer long/short bias. The inference is: this move is likely being dominated by the spot market, or a small portion of spot capital is pushing the price while derivatives market participants are watching.
Who is paying the cost? Right now, it looks like the people chasing spot are paying the cost, while derivatives longs aren’t paying any funding, so their cost is zero.
The counterargument is straightforward: if next, Trump releases more substantive, directly positive comments about U.S. retail or the gaming industry, or if the overall U.S. stock market pulls up broadly in an emotion-driven way, $GME could be “pulled through” the prior highs in one go by funding—at which point the funding rate might suddenly turn positive, jumping from 0 to 0.01% or higher. That would mean leveraged longs are entering and taking over the baton. But the current structure doesn’t support this view, because no incremental leveraged funding is visible.
Second-order effect: if the heat of the Trump trade cools off, or if U.S. stocks pull back for other reasons, this spot-led, derivatives-lagging situation becomes fragile. Spot longs don’t have leveraged derivatives positions from longs as allies. Once the price stalls, sell pressure will land directly on the spot order book. Derivatives shorts, because they’re currently not paying funding, have very low holding costs—they can wait more patiently. The ones trapped would be the spot buyers who chased the rally, and a tiny number of derivatives longs who rushed to open long positions during the price surge but didn’t benefit from any funding-rate “shelter.”
So the action is clear: don’t chase.
Trading tag: #TradFi #链上美股 #GME
Where do you think this reasoning is most likely to be wrong?
19

·
--
$GME 30 minutes and 4 hours simultaneously strengthening, with the moving averages in bullish alignment and diverging upward🔥
════════════════════
🔴 $GME 30-minute bullish signal
⚠️ Technicals: On the 30-minute chart, EMA5 has just crossed above EMA8. The moving averages have only just formed a bullish alignment, and the trading volume directly exploded to 4.5 times! The KDJ K value at 66.8 is moving quite strongly and hasn’t entered overbought yet. The key is that the 4-hour timeframe is also bullish—both cycles resonate in the same direction, making the short-term turn-to-bull signal fairly reliable.
════════════════════
🔔 Watch for the first-hand market update on sudden moves 🔔
#多周期共振 #GME
📌 When trading, pay attention to whether the candlestick pattern matches
$GME 30 minutes and 4 hours simultaneously strengthening, with the moving averages in bullish alignment and diverging upward🔥
════════════════════
🔴 $GME 30-minute bullish signal
⚠️ Technicals: On the 30-minute chart, EMA5 has just crossed above EMA8. The moving averages have only just formed a bullish alignment, and the trading volume directly exploded to 4.5 times! The KDJ K value at 66.8 is moving quite strongly and hasn’t entered overbought yet. The key is that the 4-hour timeframe is also bullish—both cycles resonate in the same direction, making the short-term turn-to-bull signal fairly reliable.
════════════════════
🔔 Watch for the first-hand market update on sudden moves 🔔
#多周期共振 #GME
📌 When trading, pay attention to whether the candlestick pattern matches
════════════════════
🔴 $GME 30-minute bullish signal
⚠️ Technicals: On the 30-minute chart, EMA5 has just crossed above EMA8. The moving averages have only just formed a bullish alignment, and the trading volume directly exploded to 4.5 times! The KDJ K value at 66.8 is moving quite strongly and hasn’t entered overbought yet. The key is that the 4-hour timeframe is also bullish—both cycles resonate in the same direction, making the short-term turn-to-bull signal fairly reliable.
════════════════════
🔔 Watch for the first-hand market update on sudden moves 🔔
#多周期共振 #GME
📌 When trading, pay attention to whether the candlestick pattern matches

18
·
--
$GME 24 hours up 7.193% to 21.31, volume near 7 million, but the funding rate is zero and the open interest is 53,017. This rally didn’t move the funding rate, suggesting neither side is noticeably crowded; the price action is mainly driven by demand. Old Dog’s take: currently you can hold a light position. If the price stays above 21 and the funding rate remains zero, keep observing; if it breaks below 21, reduce the position. The strongest counter-evidence is that volume increased but the price didn’t keep up, which could mean a short-term top. The second-order effect is that if it keeps rising, shorts may be forced to cover, which could push the price higher, but with the funding rate still at zero, the momentum may be insufficient.
Trading tag: #BinanceFutures #TradFi #USDⓈM #GME #GMEUSDT $GME
$GME 24 hours up 7.193% to 21.31, volume near 7 million, but the funding rate is zero and the open interest is 53,017. This rally didn’t move the funding rate, suggesting neither side is noticeably crowded; the price action is mainly driven by demand. Old Dog’s take: currently you can hold a light position. If the price stays above 21 and the funding rate remains zero, keep observing; if it breaks below 21, reduce the position. The strongest counter-evidence is that volume increased but the price didn’t keep up, which could mean a short-term top. The second-order effect is that if it keeps rising, shorts may be forced to cover, which could push the price higher, but with the funding rate still at zero, the momentum may be insufficient.
Trading tag: #BinanceFutures #TradFi #USDⓈM #GME #GMEUSDT $GME
Trading tag: #BinanceFutures #TradFi #USDⓈM #GME #GMEUSDT $GME
20
·
--
$GME In the past 24 hours, it rose 5.614%, with the price at 21.07, corresponding to an approximate trading volume of 6.86 million. The rate of increase looks substantial, but the funding rate is 0, and the open interest is 51.6k. The price moved, yet the futures market is as calm as a dead pond.
This doesn’t seem right. Typically, a leveraged rally is accompanied by a positive funding rate—longs pay shorts to maintain positions. Now that the rate is back to zero, it suggests that the longs in the futures market aren’t recklessly adding leverage to chase the spike. The driving force behind this upswing may not be originating from the derivatives/contract market itself. From a political perspective, the current U.S. election cycle is heating up; assets like $GME—once deeply tied to a retail-versus-Wall Street narrative—are prone to becoming a reflection of broader market sentiment. Election-related talking points and policy uncertainty could pull some capital out of purely crypto meme rotations and into political concept stocks with TradFi attributes.
That’s the core contradiction: the price is rising, but leveraged capital hasn’t caught up. If this is a political-narrative-driven spot-buying wave, then the futures market’s calmness is precisely evidence that it hasn’t yet been priced by mainstream leveraged traders. The counterargument is that this is purely retail follow-through, lacking confirmation from institutions or the derivatives market—so the foundation of the rally isn’t solid.
Next, if political heat continues, other assets with similar retail-uprising memories may rotate into the spotlight.
Trading tag: #TradFi #链上美股 #GME
Where do you think this thesis is most likely to be wrong?
$GME In the past 24 hours, it rose 5.614%, with the price at 21.07, corresponding to an approximate trading volume of 6.86 million. The rate of increase looks substantial, but the funding rate is 0, and the open interest is 51.6k. The price moved, yet the futures market is as calm as a dead pond.
This doesn’t seem right. Typically, a leveraged rally is accompanied by a positive funding rate—longs pay shorts to maintain positions. Now that the rate is back to zero, it suggests that the longs in the futures market aren’t recklessly adding leverage to chase the spike. The driving force behind this upswing may not be originating from the derivatives/contract market itself. From a political perspective, the current U.S. election cycle is heating up; assets like $GME —once deeply tied to a retail-versus-Wall Street narrative—are prone to becoming a reflection of broader market sentiment. Election-related talking points and policy uncertainty could pull some capital out of purely crypto meme rotations and into political concept stocks with TradFi attributes.
That’s the core contradiction: the price is rising, but leveraged capital hasn’t caught up. If this is a political-narrative-driven spot-buying wave, then the futures market’s calmness is precisely evidence that it hasn’t yet been priced by mainstream leveraged traders. The counterargument is that this is purely retail follow-through, lacking confirmation from institutions or the derivatives market—so the foundation of the rally isn’t solid.
Next, if political heat continues, other assets with similar retail-uprising memories may rotate into the spotlight.
Trading tag: #TradFi #链上美股 #GME
Where do you think this thesis is most likely to be wrong?
This doesn’t seem right. Typically, a leveraged rally is accompanied by a positive funding rate—longs pay shorts to maintain positions. Now that the rate is back to zero, it suggests that the longs in the futures market aren’t recklessly adding leverage to chase the spike. The driving force behind this upswing may not be originating from the derivatives/contract market itself. From a political perspective, the current U.S. election cycle is heating up; assets like $GME —once deeply tied to a retail-versus-Wall Street narrative—are prone to becoming a reflection of broader market sentiment. Election-related talking points and policy uncertainty could pull some capital out of purely crypto meme rotations and into political concept stocks with TradFi attributes.
That’s the core contradiction: the price is rising, but leveraged capital hasn’t caught up. If this is a political-narrative-driven spot-buying wave, then the futures market’s calmness is precisely evidence that it hasn’t yet been priced by mainstream leveraged traders. The counterargument is that this is purely retail follow-through, lacking confirmation from institutions or the derivatives market—so the foundation of the rally isn’t solid.
Next, if political heat continues, other assets with similar retail-uprising memories may rotate into the spotlight.
Trading tag: #TradFi #链上美股 #GME
Where do you think this thesis is most likely to be wrong?
8
·
--
$GME Now 21.13, the last 24 hours are up 5.65%. Funding rate is 0, with 56,000 open contracts. With this kind of rise, it looks more like traders driven by geopolitical event speculation testing the waters—not a long-biased move led by bulls.
Single-signal read: Price is rising, but the funding rate is zero, meaning neither side is willing to pay the cost to add positions. This suggests the rally lacks sustained buy-side support and looks more like quick in-and-out short-term game trading.
Strong counter-evidence: If geopolitical tensions quickly ease, this event-based trading logic could instantly stop working and the price could give back gains directly.
Trading tag: #TradFi #链上美股 #GME
Where do you think this assessment is most likely wrong?
$GME Now 21.13, the last 24 hours are up 5.65%. Funding rate is 0, with 56,000 open contracts. With this kind of rise, it looks more like traders driven by geopolitical event speculation testing the waters—not a long-biased move led by bulls.
Single-signal read: Price is rising, but the funding rate is zero, meaning neither side is willing to pay the cost to add positions. This suggests the rally lacks sustained buy-side support and looks more like quick in-and-out short-term game trading.
Strong counter-evidence: If geopolitical tensions quickly ease, this event-based trading logic could instantly stop working and the price could give back gains directly.
Trading tag: #TradFi #链上美股 #GME
Where do you think this assessment is most likely wrong?
Single-signal read: Price is rising, but the funding rate is zero, meaning neither side is willing to pay the cost to add positions. This suggests the rally lacks sustained buy-side support and looks more like quick in-and-out short-term game trading.
Strong counter-evidence: If geopolitical tensions quickly ease, this event-based trading logic could instantly stop working and the price could give back gains directly.
Trading tag: #TradFi #链上美股 #GME
Where do you think this assessment is most likely wrong?
31
·
--
$GME funding rates have stalled at zero—this cold data is even more worth watching than a 5.65% price jump. Zero-fee perpetual futures are rare; it usually means the market has already settled a round of long-vs-short disagreement, and no one is paying.
Prices are rising, but funding hasn’t turned positive, and with open interest at 56,000 contracts, there’s no surge in volume—this setup looks like it’s dodging incoming fire. From a geopolitical and military perspective, on-chain U.S.-stock futures have become a kind of hedging bid: people buying it may not be focused on earnings, they just want to decouple from the Nasdaq’s走势.
The counterargument is simple: if geopolitical tensions stay tight but don’t escalate, this risk-premium will evaporate instantly. With volume not that large and insufficient sell-off depth, it doesn’t have much force.
Trading tag: #TradFi #链上美股 #GME
Where do you think this assessment is most likely to be wrong?
$GME funding rates have stalled at zero—this cold data is even more worth watching than a 5.65% price jump. Zero-fee perpetual futures are rare; it usually means the market has already settled a round of long-vs-short disagreement, and no one is paying.
Prices are rising, but funding hasn’t turned positive, and with open interest at 56,000 contracts, there’s no surge in volume—this setup looks like it’s dodging incoming fire. From a geopolitical and military perspective, on-chain U.S.-stock futures have become a kind of hedging bid: people buying it may not be focused on earnings, they just want to decouple from the Nasdaq’s走势.
The counterargument is simple: if geopolitical tensions stay tight but don’t escalate, this risk-premium will evaporate instantly. With volume not that large and insufficient sell-off depth, it doesn’t have much force.
Trading tag: #TradFi #链上美股 #GME
Where do you think this assessment is most likely to be wrong?
Prices are rising, but funding hasn’t turned positive, and with open interest at 56,000 contracts, there’s no surge in volume—this setup looks like it’s dodging incoming fire. From a geopolitical and military perspective, on-chain U.S.-stock futures have become a kind of hedging bid: people buying it may not be focused on earnings, they just want to decouple from the Nasdaq’s走势.
The counterargument is simple: if geopolitical tensions stay tight but don’t escalate, this risk-premium will evaporate instantly. With volume not that large and insufficient sell-off depth, it doesn’t have much force.
Trading tag: #TradFi #链上美股 #GME
Where do you think this assessment is most likely to be wrong?
26
·
--
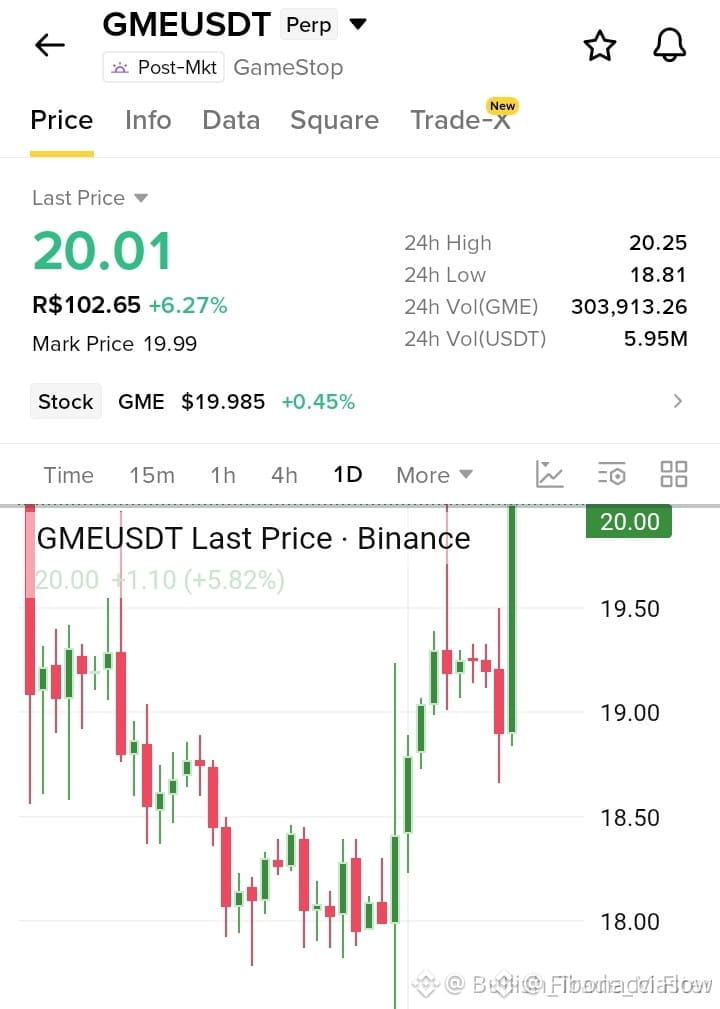
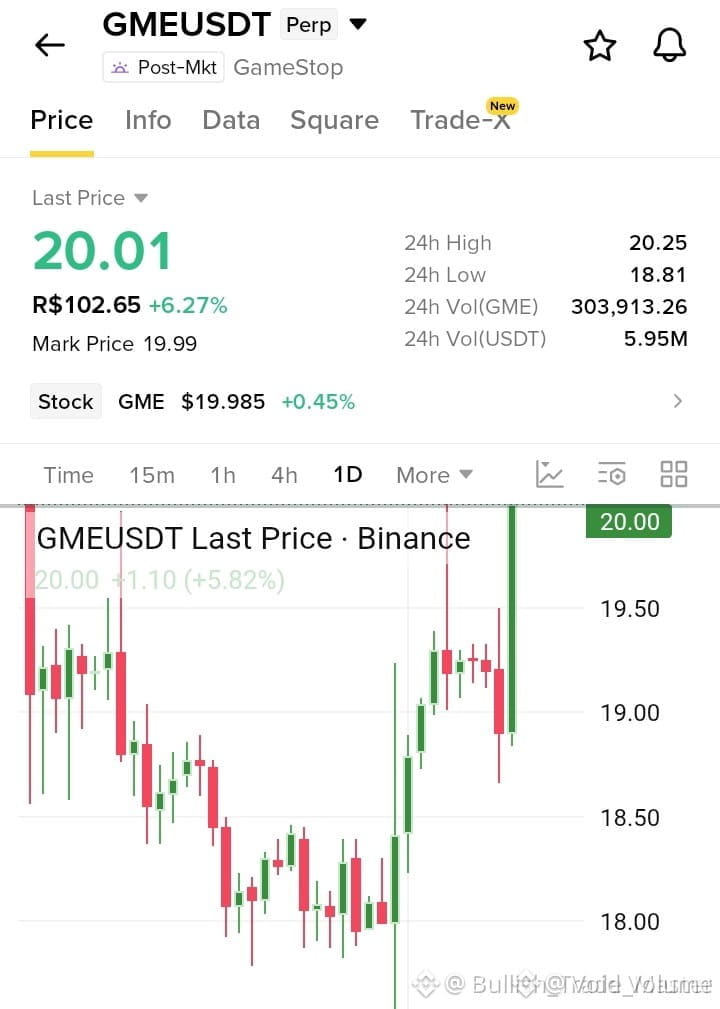
$GME 24 hours up 5.36%, current price 20.04. Funding rate is 0.00000000, open interest 45313.71, moderate. Price is trending upward, but the contract side is neutral; this buying wave may come from spot or arbitrage, not from leveraged long sentiment. With the funding rate flat, neither side currently has a clear cost advantage from positioning, so the rise hasn’t triggered aggressive additional buying. If open interest starts to increase while the funding rate stays near zero, arbitrage funds may move in. The invalidation condition is that the price falls below 20.04 and open interest drops sharply. Volatility is below 10%, so for now it’s mainly a spot trial.
Trading tag: #TradFi #链上美股 #GME
Where do you think this assessment is most likely to be wrong?
$GME 24 hours up 5.36%, current price 20.04. Funding rate is 0.00000000, open interest 45313.71, moderate. Price is trending upward, but the contract side is neutral; this buying wave may come from spot or arbitrage, not from leveraged long sentiment. With the funding rate flat, neither side currently has a clear cost advantage from positioning, so the rise hasn’t triggered aggressive additional buying. If open interest starts to increase while the funding rate stays near zero, arbitrage funds may move in. The invalidation condition is that the price falls below 20.04 and open interest drops sharply. Volatility is below 10%, so for now it’s mainly a spot trial.
Trading tag: #TradFi #链上美股 #GME
Where do you think this assessment is most likely to be wrong?
Trading tag: #TradFi #链上美股 #GME
Where do you think this assessment is most likely to be wrong?
18

🚀 $GME SURGES INTO BULLISH MOMENTUM, WHALES ON THE HUNT! 📈
The order flow on $GME is flipping the script, with aggressive buy walls carving out the last resistance. 📊 Volume spikes on the 1‑hour chart signal a fresh influx of smart‑money capital 🦈.
Meanwhile $IOST and $BTR are echoing the rally, but $GME leads the pack, riding a tight liquidity sweep that could push it toward the next breakout zone. ⚡
💬 Are you loading up on the upside or waiting for the next liquidity trap?
⚠️ Not financial advice. Always manage your risk. 🛡️
🏷️ #GME #LongSetup #BullishMomentum #Crypto
🔥 💎
🚀 $GME SURGES INTO BULLISH MOMENTUM, WHALES ON THE HUNT! 📈
The order flow on $GME is flipping the script, with aggressive buy walls carving out the last resistance. 📊 Volume spikes on the 1‑hour chart signal a fresh influx of smart‑money capital 🦈.
Meanwhile $IOST and $BTR are echoing the rally, but $GME leads the pack, riding a tight liquidity sweep that could push it toward the next breakout zone. ⚡
💬 Are you loading up on the upside or waiting for the next liquidity trap?
⚠️ Not financial advice. Always manage your risk. 🛡️
🏷️ #GME #LongSetup #BullishMomentum #Crypto
🔥 💎
The order flow on $GME is flipping the script, with aggressive buy walls carving out the last resistance. 📊 Volume spikes on the 1‑hour chart signal a fresh influx of smart‑money capital 🦈.
Meanwhile $IOST and $BTR are echoing the rally, but $GME leads the pack, riding a tight liquidity sweep that could push it toward the next breakout zone. ⚡
💬 Are you loading up on the upside or waiting for the next liquidity trap?
⚠️ Not financial advice. Always manage your risk. 🛡️
🏷️ #GME #LongSetup #BullishMomentum #Crypto
🔥 💎
301

·
--
🚀 $GME RIDE THE SMART MONEY SURGE – LIQUIDITY SWEEP IN PLAY 🦈
📊 Institutional footprints are re‑stacking on the $GME demand zone, with a fresh wave of buy‑side execution that has cleared the last liquidity pool under $12.5.
🦈 The concurrent uptick in $IOST and $BTR volumes hints at cross‑asset liquidity reallocation, a classic smart‑money rotation that often precedes a sustained rally. 📈 Watch the 4‑hour order block at $12.70 for a potential retest before the next upward thrust.
💬 Are you aligning your position with the emerging order block or waiting for the next liquidity sweep? 👇
⚠️ Not financial advice. Always manage your risk. 🛡️
🏷️ #GME #SmartMoney #LiquiditySweep #Equities #Crypto
🦈 🔥
🚀 $GME RIDE THE SMART MONEY SURGE – LIQUIDITY SWEEP IN PLAY 🦈
📊 Institutional footprints are re‑stacking on the $GME demand zone, with a fresh wave of buy‑side execution that has cleared the last liquidity pool under $12.5.
🦈 The concurrent uptick in $IOST and $BTR volumes hints at cross‑asset liquidity reallocation, a classic smart‑money rotation that often precedes a sustained rally. 📈 Watch the 4‑hour order block at $12.70 for a potential retest before the next upward thrust.
💬 Are you aligning your position with the emerging order block or waiting for the next liquidity sweep? 👇
⚠️ Not financial advice. Always manage your risk. 🛡️
🏷️ #GME #SmartMoney #LiquiditySweep #Equities #Crypto
🦈 🔥
📊 Institutional footprints are re‑stacking on the $GME demand zone, with a fresh wave of buy‑side execution that has cleared the last liquidity pool under $12.5.
🦈 The concurrent uptick in $IOST and $BTR volumes hints at cross‑asset liquidity reallocation, a classic smart‑money rotation that often precedes a sustained rally. 📈 Watch the 4‑hour order block at $12.70 for a potential retest before the next upward thrust.
💬 Are you aligning your position with the emerging order block or waiting for the next liquidity sweep? 👇
⚠️ Not financial advice. Always manage your risk. 🛡️
🏷️ #GME #SmartMoney #LiquiditySweep #Equities #Crypto
🦈 🔥
270

·
--
🚨 $GME HITS FIRST TARGET, SMART MONEY RECHARGING! 🦈
The demand block at $GME 's recent low has been aggressively defended, swallowing sell orders and signaling a smart‑money accumulation zone. 📊 Volume spikes on the 1‑hour chart confirm the liquidity sweep, while the price now respects the prior swing high as a fresh bullish order block.
A modest pullback to the 4‑hour support could offer a clean entry, with the next upside target aligned with the prior resistance cluster. 🔍 Expect the market to test the next liquidity pool before any major retracement. 📈
💬 Are you positioning for the next upward thrust or waiting for a deeper liquidity hunt?
⚠️ Not financial advice. Always manage your risk. 🛡️
🏷️ #GME #LongSetup #LiquiditySweep #SmartMoney #Crypto
🔥 💎
🚨 $GME HITS FIRST TARGET, SMART MONEY RECHARGING! 🦈
The demand block at $GME 's recent low has been aggressively defended, swallowing sell orders and signaling a smart‑money accumulation zone. 📊 Volume spikes on the 1‑hour chart confirm the liquidity sweep, while the price now respects the prior swing high as a fresh bullish order block.
A modest pullback to the 4‑hour support could offer a clean entry, with the next upside target aligned with the prior resistance cluster. 🔍 Expect the market to test the next liquidity pool before any major retracement. 📈
💬 Are you positioning for the next upward thrust or waiting for a deeper liquidity hunt?
⚠️ Not financial advice. Always manage your risk. 🛡️
🏷️ #GME #LongSetup #LiquiditySweep #SmartMoney #Crypto
🔥 💎
The demand block at $GME 's recent low has been aggressively defended, swallowing sell orders and signaling a smart‑money accumulation zone. 📊 Volume spikes on the 1‑hour chart confirm the liquidity sweep, while the price now respects the prior swing high as a fresh bullish order block.
A modest pullback to the 4‑hour support could offer a clean entry, with the next upside target aligned with the prior resistance cluster. 🔍 Expect the market to test the next liquidity pool before any major retracement. 📈
💬 Are you positioning for the next upward thrust or waiting for a deeper liquidity hunt?
⚠️ Not financial advice. Always manage your risk. 🛡️
🏷️ #GME #LongSetup #LiquiditySweep #SmartMoney #Crypto
🔥 💎
19

🚀 $GME SURFACES WITH A SURPRISE LIQUIDITY SWEEP! 🦈
📊 Smart money is dragging $GME into a tight liquidity pocket, snapping the last sell wall with a clean sweep. ⚡ The 4‑hour volume surge and a bullish divergence on the RSI signal that buyers are re‑charging the order block.
🌊 With the order flow turning aggressive, the next swing could flip the recent dip into a fresh rally, especially if the whales lock in positions above the current price. 🦈
💬 Do you see the next wave of buying pressure breaking higher or a trap waiting below? 👇
⚠️ Not financial advice. Always manage your risk. 🛡️
🏷️ #GME #SmartMoney #Momentum #Crypto
🦈 🚀
🚀 $GME SURFACES WITH A SURPRISE LIQUIDITY SWEEP! 🦈
📊 Smart money is dragging $GME into a tight liquidity pocket, snapping the last sell wall with a clean sweep. ⚡ The 4‑hour volume surge and a bullish divergence on the RSI signal that buyers are re‑charging the order block.
🌊 With the order flow turning aggressive, the next swing could flip the recent dip into a fresh rally, especially if the whales lock in positions above the current price. 🦈
💬 Do you see the next wave of buying pressure breaking higher or a trap waiting below? 👇
⚠️ Not financial advice. Always manage your risk. 🛡️
🏷️ #GME #SmartMoney #Momentum #Crypto
🦈 🚀
📊 Smart money is dragging $GME into a tight liquidity pocket, snapping the last sell wall with a clean sweep. ⚡ The 4‑hour volume surge and a bullish divergence on the RSI signal that buyers are re‑charging the order block.
🌊 With the order flow turning aggressive, the next swing could flip the recent dip into a fresh rally, especially if the whales lock in positions above the current price. 🦈
💬 Do you see the next wave of buying pressure breaking higher or a trap waiting below? 👇
⚠️ Not financial advice. Always manage your risk. 🛡️
🏷️ #GME #SmartMoney #Momentum #Crypto
🦈 🚀
35
Log in to explore more content
Join global crypto users on Binance Square
⚡️ Get latest and useful information about crypto.
💬 Trusted by the world’s largest crypto exchange.
👍 Discover real insights from verified creators.
Email / Phone number
Trending Topics
1
#BitcoinClears$85200
0 views
16 Discussing
2
#AltcoinSeasonIndexHoldsAbove60For5Days
580 views
164 Discussing
3
#BitcoinSlipsBelow$84000
803 views
55 Discussing
4
#USADPAdds90000JobsInSeptember
0 views
36 Discussing
5
#USCorePCEEasesTo3%InAugust
0 views
24 Discussing
6
#KospiPostsWorstQuarterSince2020
314 views
101 Discussing
7
#SECToClarifyOnChainFundraisingRules
4,790 views
290 Discussing
8
#UKFCAOpensCryptoFirmAuthorization
8,262 views
273 Discussing
9
#JapanMOFStudyGroupOnTokenizedGovtBonds
6,989 views
254 Discussing
10
#QNTRises287%
41,052 views
612 Discussing