
#criptovisao
criptovisao
12,855 views
417 Discussing
Hot
Latest

·
--
🌙 Daily recap — CryptoVision
IN JUST A FEW LINES
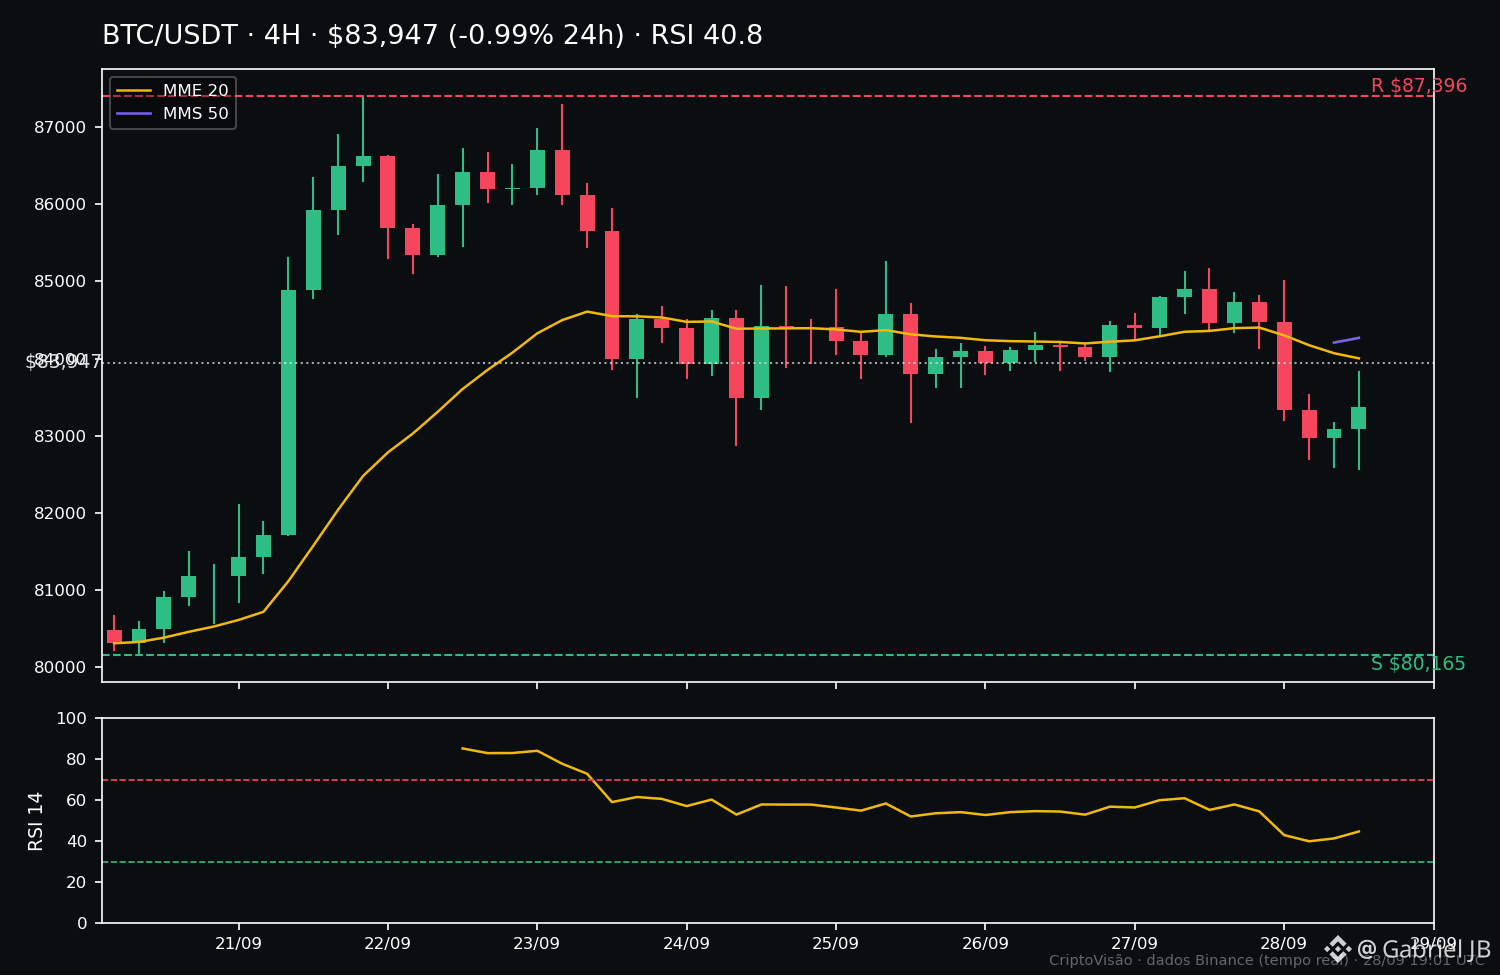
$BTC closed the day at $84.045 (-0.9% in 24h): held the $82.5k support, but still stays below the 4H moving averages (MME-20 $84.093, MMS-50 $84.268), RSI 40.8 — indecision until the end.
$ETH was the strongest of the day: $2.700 (+0.1% today, +3.9% on the week), already above both 4H averages, RSI 45.8.
$SOL pulled back to $120 (-2.7% today) but still keeps +9.4% on the week; the $117–118 zone held.
WHAT WAS CONFIRMED
— BTC: the $82.563 support held; the bearish continuation scenario from 17:30 didn’t materialize.
— ETH followed the 5pm scenario A: held $2.635, reclaimed the averages, and is on track to test $2.804.
— SOL: the $117–118 zone held, and the educational stop at $116 was never touched.
WHAT WAS NOT CONFIRMED
— BTC didn’t close above $84.2k: the recovery is incomplete and the short-term weakness wasn’t invalidated.
— SOL still hasn’t given the rejection confirmation with a strong 4H close above the zone.
LEVELS FOR TOMORROW
— BTC: closing above $84.2–84.3k invalidates the weakness; if $82.5k is lost, the next target is $80.1k.
— ETH: closing above $2.807 opens the week’s highs; if $2.635 is lost, the scenario is invalidated (next support $2.567).
— SOL: as long as it holds $117.4, the pullback remains valid; losing $116 changes the picture.
⚠️ Markets move from night to day. None of this is financial advice — and remember: if you have no position, there’s no loss.
#CriptoVisao #Bitcoin
🌙 Daily recap — CryptoVision
IN JUST A FEW LINES
$BTC closed the day at $84.045 (-0.9% in 24h): held the $82.5k support, but still stays below the 4H moving averages (MME-20 $84.093, MMS-50 $84.268), RSI 40.8 — indecision until the end.
$ETH was the strongest of the day: $2.700 (+0.1% today, +3.9% on the week), already above both 4H averages, RSI 45.8.
$SOL pulled back to $120 (-2.7% today) but still keeps +9.4% on the week; the $117–118 zone held.
WHAT WAS CONFIRMED
— BTC: the $82.563 support held; the bearish continuation scenario from 17:30 didn’t materialize.
— ETH followed the 5pm scenario A: held $2.635, reclaimed the averages, and is on track to test $2.804.
— SOL: the $117–118 zone held, and the educational stop at $116 was never touched.
WHAT WAS NOT CONFIRMED
— BTC didn’t close above $84.2k: the recovery is incomplete and the short-term weakness wasn’t invalidated.
— SOL still hasn’t given the rejection confirmation with a strong 4H close above the zone.
LEVELS FOR TOMORROW
— BTC: closing above $84.2–84.3k invalidates the weakness; if $82.5k is lost, the next target is $80.1k.
— ETH: closing above $2.807 opens the week’s highs; if $2.635 is lost, the scenario is invalidated (next support $2.567).
— SOL: as long as it holds $117.4, the pullback remains valid; losing $116 changes the picture.
⚠️ Markets move from night to day. None of this is financial advice — and remember: if you have no position, there’s no loss.
#CriptoVisao #Bitcoin
IN JUST A FEW LINES
$BTC closed the day at $84.045 (-0.9% in 24h): held the $82.5k support, but still stays below the 4H moving averages (MME-20 $84.093, MMS-50 $84.268), RSI 40.8 — indecision until the end.
$ETH was the strongest of the day: $2.700 (+0.1% today, +3.9% on the week), already above both 4H averages, RSI 45.8.
$SOL pulled back to $120 (-2.7% today) but still keeps +9.4% on the week; the $117–118 zone held.
WHAT WAS CONFIRMED
— BTC: the $82.563 support held; the bearish continuation scenario from 17:30 didn’t materialize.
— ETH followed the 5pm scenario A: held $2.635, reclaimed the averages, and is on track to test $2.804.
— SOL: the $117–118 zone held, and the educational stop at $116 was never touched.
WHAT WAS NOT CONFIRMED
— BTC didn’t close above $84.2k: the recovery is incomplete and the short-term weakness wasn’t invalidated.
— SOL still hasn’t given the rejection confirmation with a strong 4H close above the zone.
LEVELS FOR TOMORROW
— BTC: closing above $84.2–84.3k invalidates the weakness; if $82.5k is lost, the next target is $80.1k.
— ETH: closing above $2.807 opens the week’s highs; if $2.635 is lost, the scenario is invalidated (next support $2.567).
— SOL: as long as it holds $117.4, the pullback remains valid; losing $116 changes the picture.
⚠️ Markets move from night to day. None of this is financial advice — and remember: if you have no position, there’s no loss.
#CriptoVisao #Bitcoin
106
·
--
📊 MORNING OVERVIEW — CryptoVision
SITUATION
The market opens the month in balance mode: the three majors are green over 24h, but the strength indicators are all in the neutral zone and the 4H trends are unclear. This is a day for compression, not for chasing.
LEVELS (4H, real-time data)
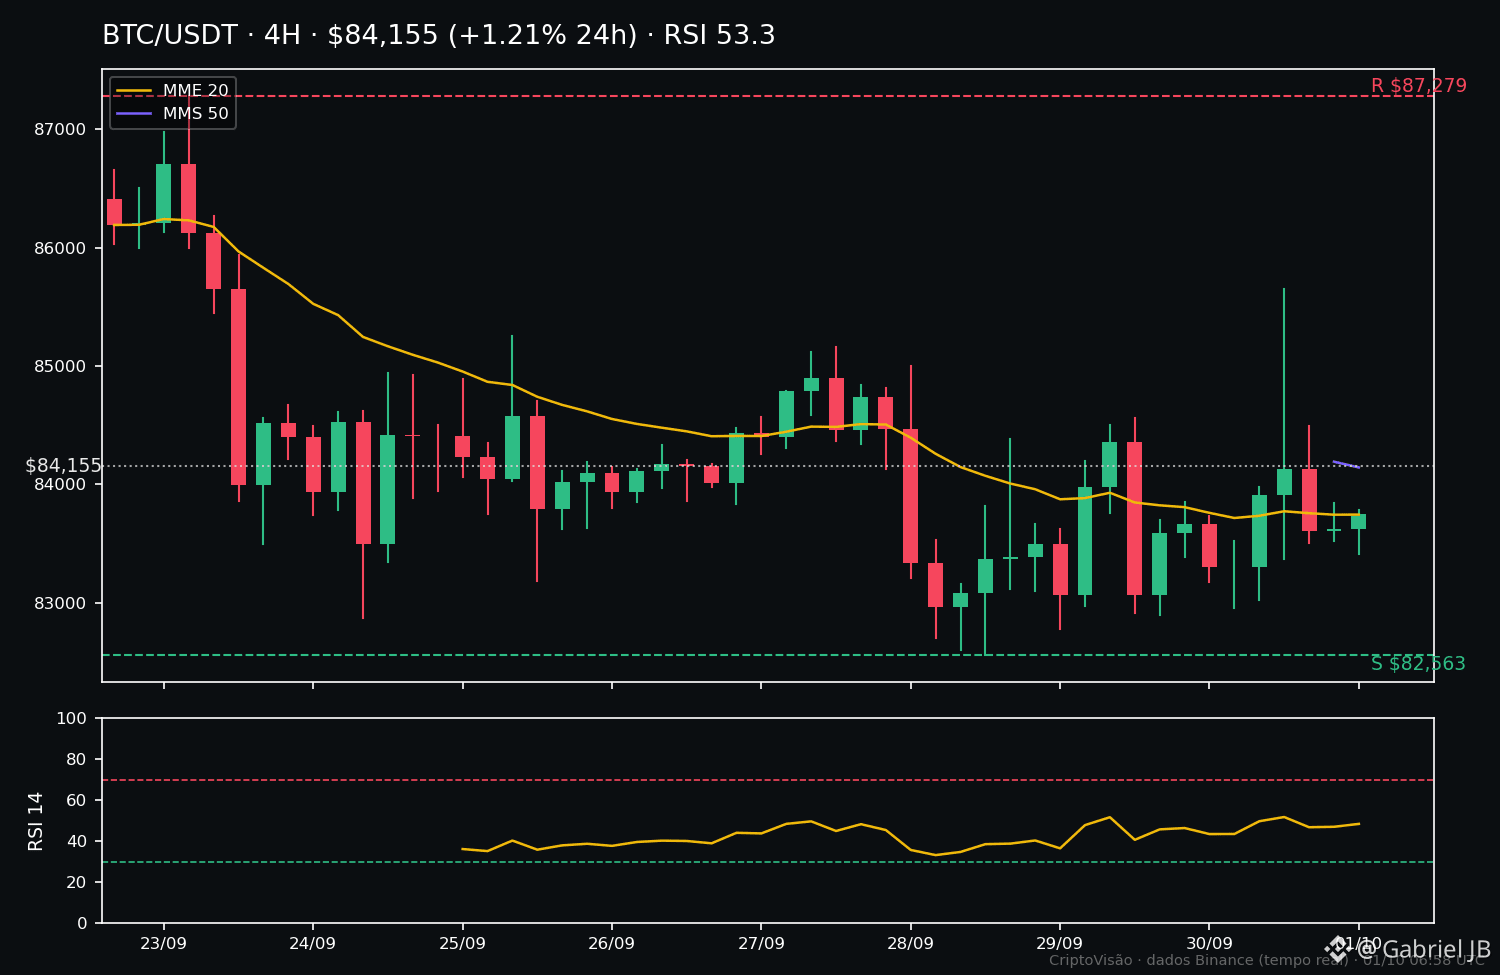
• $BTC — $84.155 (+1,21% 24h), RSI 53.3. Squeezed between the 20 ($83.574) and 50 ($84.144) period moving averages: support $82.563, resistance $87.279.
• $ETH — $2.716 (+1,95% 24h), RSI 54. Above both averages; upper end of the weekly range ($2.600–$2.789): support $2.600, resistance $2.789.
• $SOL — $119.31 (+0,84% 24h), RSI 51.4. Mid of the weekly range: support $112.52, resistance $124.95.
SCENARIO A (slight buyer bias)
As long as $BTC holds $83.500, the market keeps this week’s recovery structure — $ETH leads the relative move and tries to test the $2.789 top.
SCENARIO B (neutral/weak)
If $BTC loses $83.500 with the averages crossing down, the path opens up to $82.500 and the alts follow with the correction.
WHAT WOULD CONFIRM
A 4H close of $BTC above $84.500 confirms Scenario A; a loss of $83.000 confirms B. Until then, the market is deciding — patience pays more than haste.
RISK
A tight range + low morning volatility often misleads: false breakouts in both directions are common before real volume arrives. Anyone entering in the middle of the range pays the premium.
CONCLUSION
Neutral bias with a slight buying tilt, conditioned on the levels: $BTC is the day’s barometer. Hold $83.500 → probability favors continuation; lose it → it turns defensive. No strong directional conviction until the 4H trend is defined.
#CriptoVisao #Bitcoin
📊 MORNING OVERVIEW — CryptoVision
SITUATION
The market opens the month in balance mode: the three majors are green over 24h, but the strength indicators are all in the neutral zone and the 4H trends are unclear. This is a day for compression, not for chasing.
LEVELS (4H, real-time data)
• $BTC — $84.155 (+1,21% 24h), RSI 53.3. Squeezed between the 20 ($83.574) and 50 ($84.144) period moving averages: support $82.563, resistance $87.279.
• $ETH — $2.716 (+1,95% 24h), RSI 54. Above both averages; upper end of the weekly range ($2.600–$2.789): support $2.600, resistance $2.789.
• $SOL — $119.31 (+0,84% 24h), RSI 51.4. Mid of the weekly range: support $112.52, resistance $124.95.
SCENARIO A (slight buyer bias)
As long as $BTC holds $83.500, the market keeps this week’s recovery structure — $ETH leads the relative move and tries to test the $2.789 top.
SCENARIO B (neutral/weak)
If $BTC loses $83.500 with the averages crossing down, the path opens up to $82.500 and the alts follow with the correction.
WHAT WOULD CONFIRM
A 4H close of $BTC above $84.500 confirms Scenario A; a loss of $83.000 confirms B. Until then, the market is deciding — patience pays more than haste.
RISK
A tight range + low morning volatility often misleads: false breakouts in both directions are common before real volume arrives. Anyone entering in the middle of the range pays the premium.
CONCLUSION
Neutral bias with a slight buying tilt, conditioned on the levels: $BTC is the day’s barometer. Hold $83.500 → probability favors continuation; lose it → it turns defensive. No strong directional conviction until the 4H trend is defined.
#CriptoVisao #Bitcoin
SITUATION
The market opens the month in balance mode: the three majors are green over 24h, but the strength indicators are all in the neutral zone and the 4H trends are unclear. This is a day for compression, not for chasing.
LEVELS (4H, real-time data)
• $BTC — $84.155 (+1,21% 24h), RSI 53.3. Squeezed between the 20 ($83.574) and 50 ($84.144) period moving averages: support $82.563, resistance $87.279.
• $ETH — $2.716 (+1,95% 24h), RSI 54. Above both averages; upper end of the weekly range ($2.600–$2.789): support $2.600, resistance $2.789.
• $SOL — $119.31 (+0,84% 24h), RSI 51.4. Mid of the weekly range: support $112.52, resistance $124.95.
SCENARIO A (slight buyer bias)
As long as $BTC holds $83.500, the market keeps this week’s recovery structure — $ETH leads the relative move and tries to test the $2.789 top.
SCENARIO B (neutral/weak)
If $BTC loses $83.500 with the averages crossing down, the path opens up to $82.500 and the alts follow with the correction.
WHAT WOULD CONFIRM
A 4H close of $BTC above $84.500 confirms Scenario A; a loss of $83.000 confirms B. Until then, the market is deciding — patience pays more than haste.
RISK
A tight range + low morning volatility often misleads: false breakouts in both directions are common before real volume arrives. Anyone entering in the middle of the range pays the premium.
CONCLUSION
Neutral bias with a slight buying tilt, conditioned on the levels: $BTC is the day’s barometer. Hold $83.500 → probability favors continuation; lose it → it turns defensive. No strong directional conviction until the 4H trend is defined.
#CriptoVisao #Bitcoin
163
·
--
🌙 DAILY SUMMARY — CryptoVision
THE DAY IN A FEW LINES
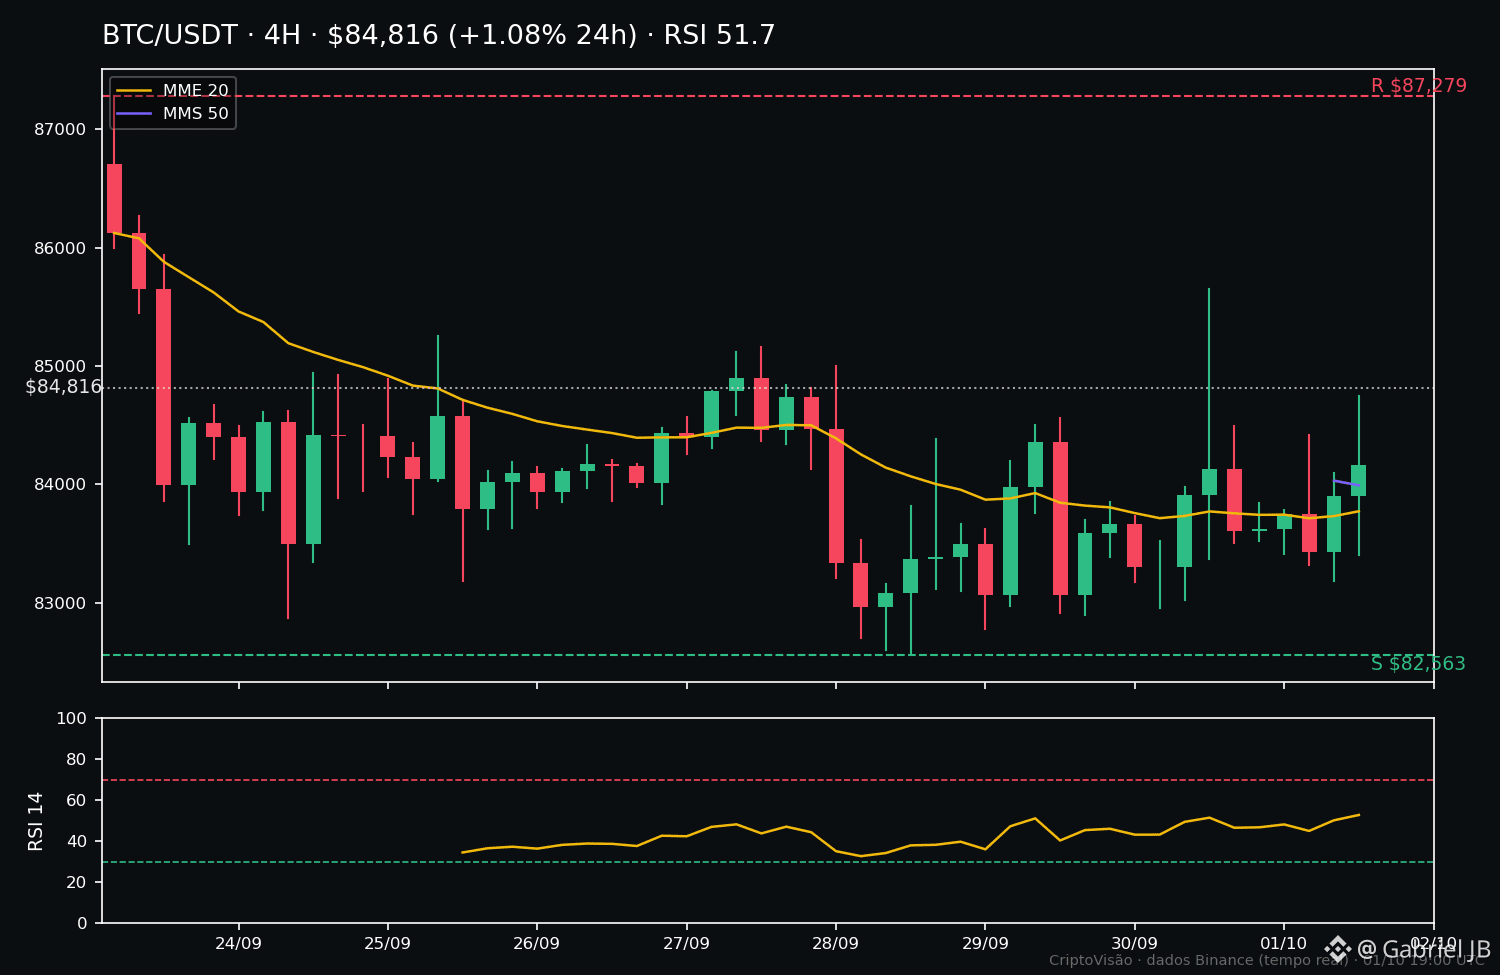
A compression day, as the morning forecast suggested. $BTC closed at $84.802 (+1.01% 24h; -2.28% 7d), RSI 51.7, between the 24h high and low ($83.186–$85.274), above both moving averages (MME-20: $83.611; MMS-50: $83.993). $ETH closed at $2.700 (+0.77% 24h; -2.20% 7d), RSI 44.4, stuck to the averages — sideways, with no direction. $SOL was the weakest: $118.38 (-0.29% 24h), RSI 40.3, already below both moving averages ($118.59/$118.90).
WHAT WAS CONFIRMED:
— Morning Scenario A: $BTC held $83.500 all day (24h low: $83.186) and closed above $84.500. The week’s recovery structure remains intact.
— $ETH did not break any extreme: it closed the day trapped between the averages, exactly the “noise, not trend” from 12:30.
— At 20:00 we said the $BTC was technically stronger than the $ETH — relative leadership held up until the close.
WHAT WAS NOT CONFIRMED:
— The buying impulse didn’t go beyond $ETH: the morning expected a test at $2.789 — the day’s high ended up at $2.722.
— $SOL never reacted to the 4h averages; it finished the day below them, with the lowest RSI among the three majors.
FOR TOMORROW (conditional)
— $BTC: if it closes 4h above $85.274 (24h high), the path opens to $87.279 (7d high). If it loses $83.993 (MMS-50), the target shifts to $83.186 and then $82.563.
— $ETH: while it stays between $2.668 and $2.722, it’s range-bound. Only a clean close outside this range sets direction — either toward $2.789 or $2.600.
— $SOL: below the averages is defensive. It needs to recover $118.90 to get back in the game; below $112.52 it spoils for good.
⚠️ Markets change overnight — these levels are for observing, not chasing. If you have no position, there’s no loss.
#CriptoVisao #Bitcoin
🌙 DAILY SUMMARY — CryptoVision
THE DAY IN A FEW LINES
A compression day, as the morning forecast suggested. $BTC closed at $84.802 (+1.01% 24h; -2.28% 7d), RSI 51.7, between the 24h high and low ($83.186–$85.274), above both moving averages (MME-20: $83.611; MMS-50: $83.993). $ETH closed at $2.700 (+0.77% 24h; -2.20% 7d), RSI 44.4, stuck to the averages — sideways, with no direction. $SOL was the weakest: $118.38 (-0.29% 24h), RSI 40.3, already below both moving averages ($118.59/$118.90).
WHAT WAS CONFIRMED:
— Morning Scenario A: $BTC held $83.500 all day (24h low: $83.186) and closed above $84.500. The week’s recovery structure remains intact.
— $ETH did not break any extreme: it closed the day trapped between the averages, exactly the “noise, not trend” from 12:30.
— At 20:00 we said the $BTC was technically stronger than the $ETH — relative leadership held up until the close.
WHAT WAS NOT CONFIRMED:
— The buying impulse didn’t go beyond $ETH : the morning expected a test at $2.789 — the day’s high ended up at $2.722.
— $SOL never reacted to the 4h averages; it finished the day below them, with the lowest RSI among the three majors.
FOR TOMORROW (conditional)
— $BTC : if it closes 4h above $85.274 (24h high), the path opens to $87.279 (7d high). If it loses $83.993 (MMS-50), the target shifts to $83.186 and then $82.563.
— $ETH : while it stays between $2.668 and $2.722, it’s range-bound. Only a clean close outside this range sets direction — either toward $2.789 or $2.600.
— $SOL : below the averages is defensive. It needs to recover $118.90 to get back in the game; below $112.52 it spoils for good.
⚠️ Markets change overnight — these levels are for observing, not chasing. If you have no position, there’s no loss.
#CriptoVisao #Bitcoin
THE DAY IN A FEW LINES
A compression day, as the morning forecast suggested. $BTC closed at $84.802 (+1.01% 24h; -2.28% 7d), RSI 51.7, between the 24h high and low ($83.186–$85.274), above both moving averages (MME-20: $83.611; MMS-50: $83.993). $ETH closed at $2.700 (+0.77% 24h; -2.20% 7d), RSI 44.4, stuck to the averages — sideways, with no direction. $SOL was the weakest: $118.38 (-0.29% 24h), RSI 40.3, already below both moving averages ($118.59/$118.90).
WHAT WAS CONFIRMED:
— Morning Scenario A: $BTC held $83.500 all day (24h low: $83.186) and closed above $84.500. The week’s recovery structure remains intact.
— $ETH did not break any extreme: it closed the day trapped between the averages, exactly the “noise, not trend” from 12:30.
— At 20:00 we said the $BTC was technically stronger than the $ETH — relative leadership held up until the close.
WHAT WAS NOT CONFIRMED:
— The buying impulse didn’t go beyond $ETH : the morning expected a test at $2.789 — the day’s high ended up at $2.722.
— $SOL never reacted to the 4h averages; it finished the day below them, with the lowest RSI among the three majors.
FOR TOMORROW (conditional)
— $BTC : if it closes 4h above $85.274 (24h high), the path opens to $87.279 (7d high). If it loses $83.993 (MMS-50), the target shifts to $83.186 and then $82.563.
— $ETH : while it stays between $2.668 and $2.722, it’s range-bound. Only a clean close outside this range sets direction — either toward $2.789 or $2.600.
— $SOL : below the averages is defensive. It needs to recover $118.90 to get back in the game; below $112.52 it spoils for good.
⚠️ Markets change overnight — these levels are for observing, not chasing. If you have no position, there’s no loss.
#CriptoVisao #Bitcoin
84
·
--
📉 $BTC tests the week's support — oversold or the start of a bigger drop?
SITUATION
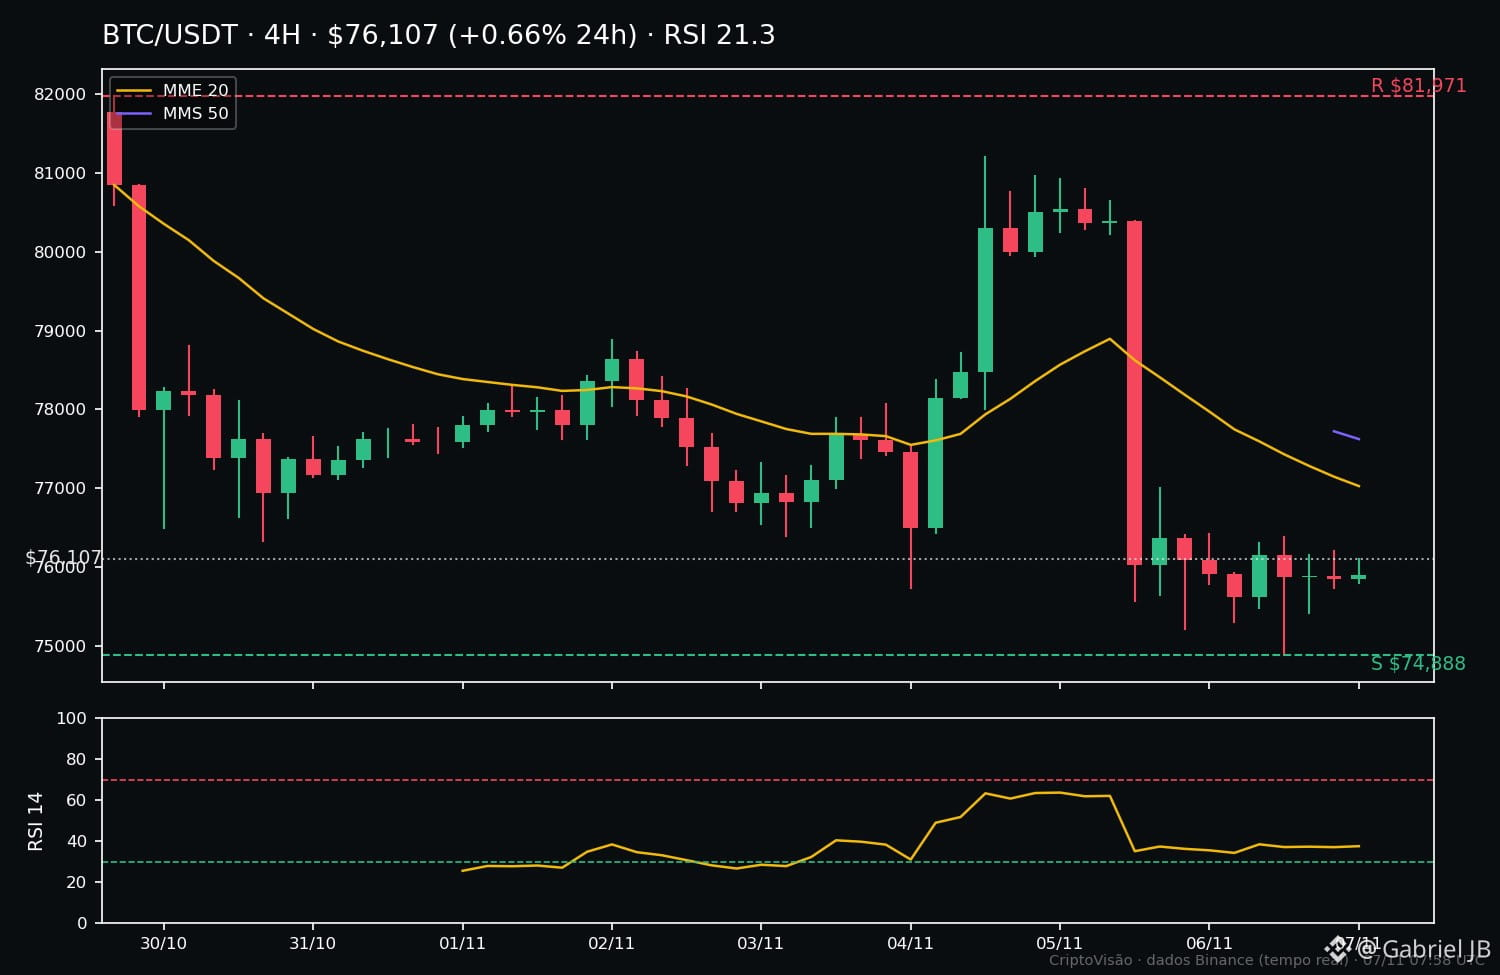
$BTC is trading at 76,107 USD this morning (07/11, ~10:00 CAT), recovering +0.66% over the past 24 hours, but still down 6.13% for the week. The RSI-14 is at 21.3 — in oversold territory — and the price remains below the 20- and 50-period moving averages (4h), both around 77,616 USD. In other words: the decline has slowed near the weekly low, but the short-term trend remains weak.
WEEKLY LEVELS
• Support: 74,888 USD (7-day low)
• Immediate resistance: 77,616 USD (moving averages)
• Major resistance: 81,971 USD (7-day high)
SCENARIO A — SUPPORT HOLDS
If the price defends 74,888 USD and closes a 4h candle above the moving averages, there is room for a recovery toward 81,971 USD. The oversold RSI favors a bounce, but only a close above the moving averages would confirm it.
SCENARIO B — SUPPORT GIVES WAY
A 4h close below 74,888 USD invalidates the bounce and opens the door to a deeper correction, with the next support to be determined by the coming candles.
WHAT WOULD CONFIRM IT
Scenario A: a 4h close above 77,616 USD, with volume backing it up. Scenario B: a 4h close below 74,888 USD. A lone wick confirms nothing — the close is what counts.
RISK
Oversold conditions can persist, and a bounce can fail near the moving averages. Anyone trading against the trend without risk management is exposed to rapid losses. This is analysis, not financial advice.
CONCLUSION
$BTC is at a decision point: either support at 74,888 USD holds and the market tries to recover, or it gives way and the correction deepens. The answer lies in the closes of the next 4h candles.
Do you think support will hold, or will the correction continue? 👇
#Bitcoin #BTC #CriptoVisao
📉 $BTC tests the week's support — oversold or the start of a bigger drop?
SITUATION
$BTC is trading at 76,107 USD this morning (07/11, ~10:00 CAT), recovering +0.66% over the past 24 hours, but still down 6.13% for the week. The RSI-14 is at 21.3 — in oversold territory — and the price remains below the 20- and 50-period moving averages (4h), both around 77,616 USD. In other words: the decline has slowed near the weekly low, but the short-term trend remains weak.
WEEKLY LEVELS
• Support: 74,888 USD (7-day low)
• Immediate resistance: 77,616 USD (moving averages)
• Major resistance: 81,971 USD (7-day high)
SCENARIO A — SUPPORT HOLDS
If the price defends 74,888 USD and closes a 4h candle above the moving averages, there is room for a recovery toward 81,971 USD. The oversold RSI favors a bounce, but only a close above the moving averages would confirm it.
SCENARIO B — SUPPORT GIVES WAY
A 4h close below 74,888 USD invalidates the bounce and opens the door to a deeper correction, with the next support to be determined by the coming candles.
WHAT WOULD CONFIRM IT
Scenario A: a 4h close above 77,616 USD, with volume backing it up. Scenario B: a 4h close below 74,888 USD. A lone wick confirms nothing — the close is what counts.
RISK
Oversold conditions can persist, and a bounce can fail near the moving averages. Anyone trading against the trend without risk management is exposed to rapid losses. This is analysis, not financial advice.
CONCLUSION
$BTC is at a decision point: either support at 74,888 USD holds and the market tries to recover, or it gives way and the correction deepens. The answer lies in the closes of the next 4h candles.
Do you think support will hold, or will the correction continue? 👇
#Bitcoin #BTC #CriptoVisao
SITUATION
$BTC is trading at 76,107 USD this morning (07/11, ~10:00 CAT), recovering +0.66% over the past 24 hours, but still down 6.13% for the week. The RSI-14 is at 21.3 — in oversold territory — and the price remains below the 20- and 50-period moving averages (4h), both around 77,616 USD. In other words: the decline has slowed near the weekly low, but the short-term trend remains weak.
WEEKLY LEVELS
• Support: 74,888 USD (7-day low)
• Immediate resistance: 77,616 USD (moving averages)
• Major resistance: 81,971 USD (7-day high)
SCENARIO A — SUPPORT HOLDS
If the price defends 74,888 USD and closes a 4h candle above the moving averages, there is room for a recovery toward 81,971 USD. The oversold RSI favors a bounce, but only a close above the moving averages would confirm it.
SCENARIO B — SUPPORT GIVES WAY
A 4h close below 74,888 USD invalidates the bounce and opens the door to a deeper correction, with the next support to be determined by the coming candles.
WHAT WOULD CONFIRM IT
Scenario A: a 4h close above 77,616 USD, with volume backing it up. Scenario B: a 4h close below 74,888 USD. A lone wick confirms nothing — the close is what counts.
RISK
Oversold conditions can persist, and a bounce can fail near the moving averages. Anyone trading against the trend without risk management is exposed to rapid losses. This is analysis, not financial advice.
CONCLUSION
$BTC is at a decision point: either support at 74,888 USD holds and the market tries to recover, or it gives way and the correction deepens. The answer lies in the closes of the next 4h candles.
Do you think support will hold, or will the correction continue? 👇
#Bitcoin #BTC #CriptoVisao
74
·
--
The stop isn’t placed at a round number — it’s placed below support 🛡️
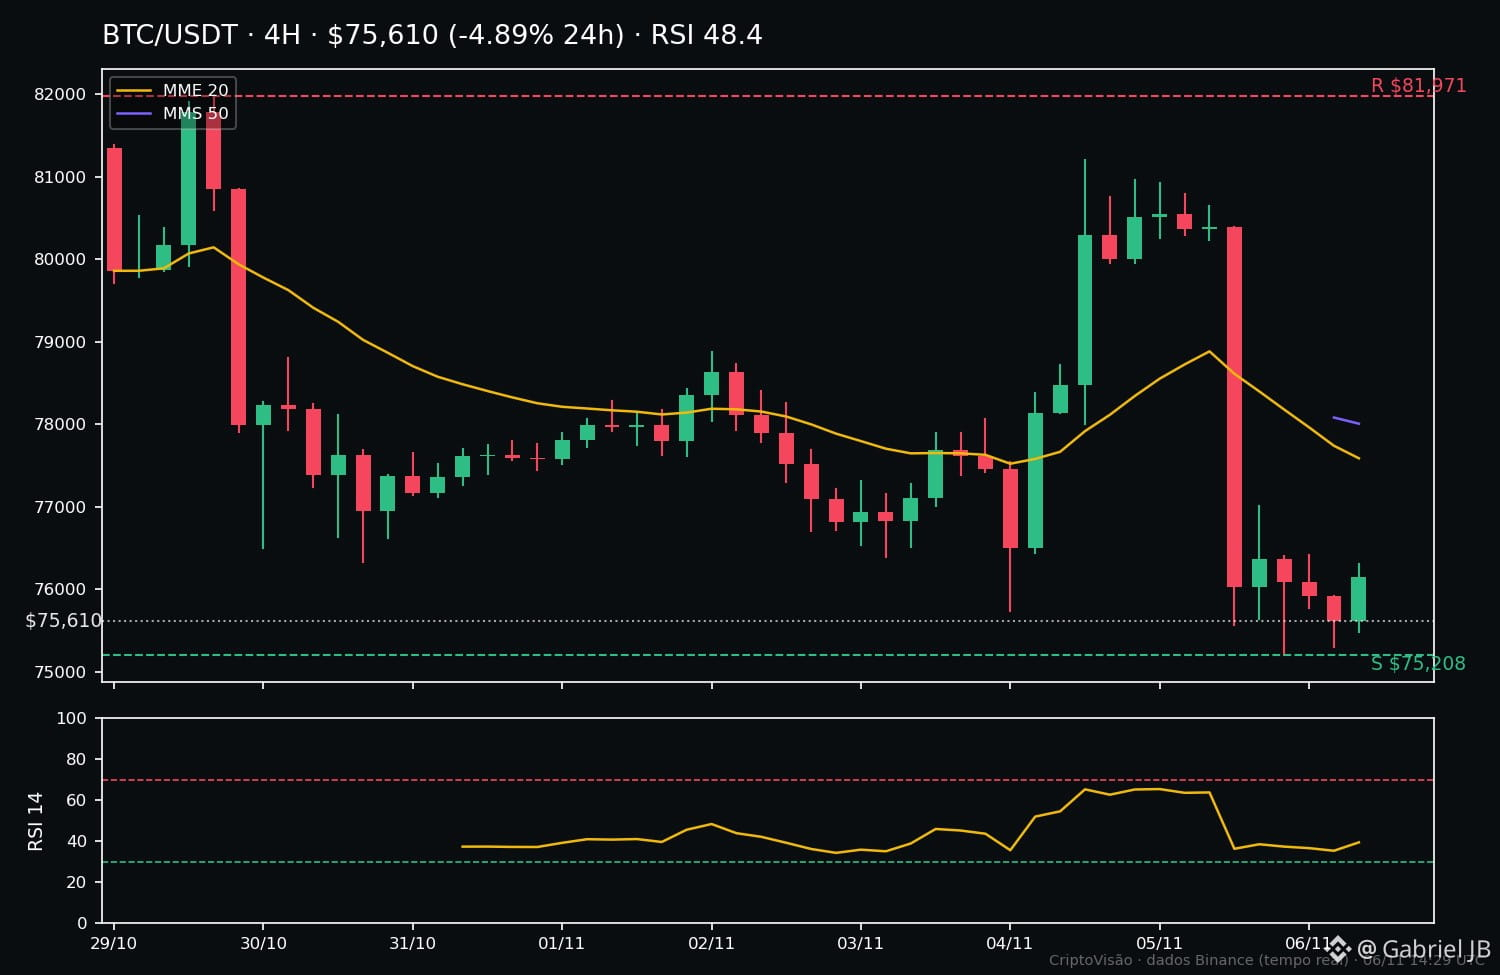
$BTC is trading at $75.641 today (-4,81% in 24h), right at the week’s support ($75.208) and below the 4h moving averages. Weekly resistance: $81.971. RSI 48,4 — neutral.
The calculation, step by step, for a $1.000 account:
1. The 1% rule: the maximum risk per trade is $10. Never more than that.
2. Stop based on structure: below actual support — $74.800, not the round number $75.000. Risk per BTC: $75.641 − $74.800 = $841.
3. The stop determines position size: $10 ÷ $841 = 0,0119 BTC (about $900). Stop first, position second — never the other way around.
4. Risk/reward test: target at resistance, $81.971 − $75.641 = $6.330 per BTC. 6.330 ÷ 841 ≈ 7,5:1 — comfortably above the 1:2 minimum.
But be careful: a high R:R isn’t a green light. The price is below the moving averages and the short-term trend is downward — the test says “worth a look,” not “get in now.”
And remember: 10 stops at 1% cost about 10% of your account. One bad all-in trade could cost you everything. Preserving capital is strategy #1.
What’s your risk limit per trade — 1% or 2%?
#Bitcoin #GestaoDeRisco #CriptoVisao
The stop isn’t placed at a round number — it’s placed below support 🛡️
$BTC is trading at $75.641 today (-4,81% in 24h), right at the week’s support ($75.208) and below the 4h moving averages. Weekly resistance: $81.971. RSI 48,4 — neutral.
The calculation, step by step, for a $1.000 account:
1. The 1% rule: the maximum risk per trade is $10. Never more than that.
2. Stop based on structure: below actual support — $74.800, not the round number $75.000. Risk per BTC: $75.641 − $74.800 = $841.
3. The stop determines position size: $10 ÷ $841 = 0,0119 BTC (about $900). Stop first, position second — never the other way around.
4. Risk/reward test: target at resistance, $81.971 − $75.641 = $6.330 per BTC. 6.330 ÷ 841 ≈ 7,5:1 — comfortably above the 1:2 minimum.
But be careful: a high R:R isn’t a green light. The price is below the moving averages and the short-term trend is downward — the test says “worth a look,” not “get in now.”
And remember: 10 stops at 1% cost about 10% of your account. One bad all-in trade could cost you everything. Preserving capital is strategy #1.
What’s your risk limit per trade — 1% or 2%?
#Bitcoin #GestaoDeRisco #CriptoVisao
$BTC is trading at $75.641 today (-4,81% in 24h), right at the week’s support ($75.208) and below the 4h moving averages. Weekly resistance: $81.971. RSI 48,4 — neutral.
The calculation, step by step, for a $1.000 account:
1. The 1% rule: the maximum risk per trade is $10. Never more than that.
2. Stop based on structure: below actual support — $74.800, not the round number $75.000. Risk per BTC: $75.641 − $74.800 = $841.
3. The stop determines position size: $10 ÷ $841 = 0,0119 BTC (about $900). Stop first, position second — never the other way around.
4. Risk/reward test: target at resistance, $81.971 − $75.641 = $6.330 per BTC. 6.330 ÷ 841 ≈ 7,5:1 — comfortably above the 1:2 minimum.
But be careful: a high R:R isn’t a green light. The price is below the moving averages and the short-term trend is downward — the test says “worth a look,” not “get in now.”
And remember: 10 stops at 1% cost about 10% of your account. One bad all-in trade could cost you everything. Preserving capital is strategy #1.
What’s your risk limit per trade — 1% or 2%?
#Bitcoin #GestaoDeRisco #CriptoVisao
9
·
--
ETH tests the weekly low — what will decide the next move? 📉
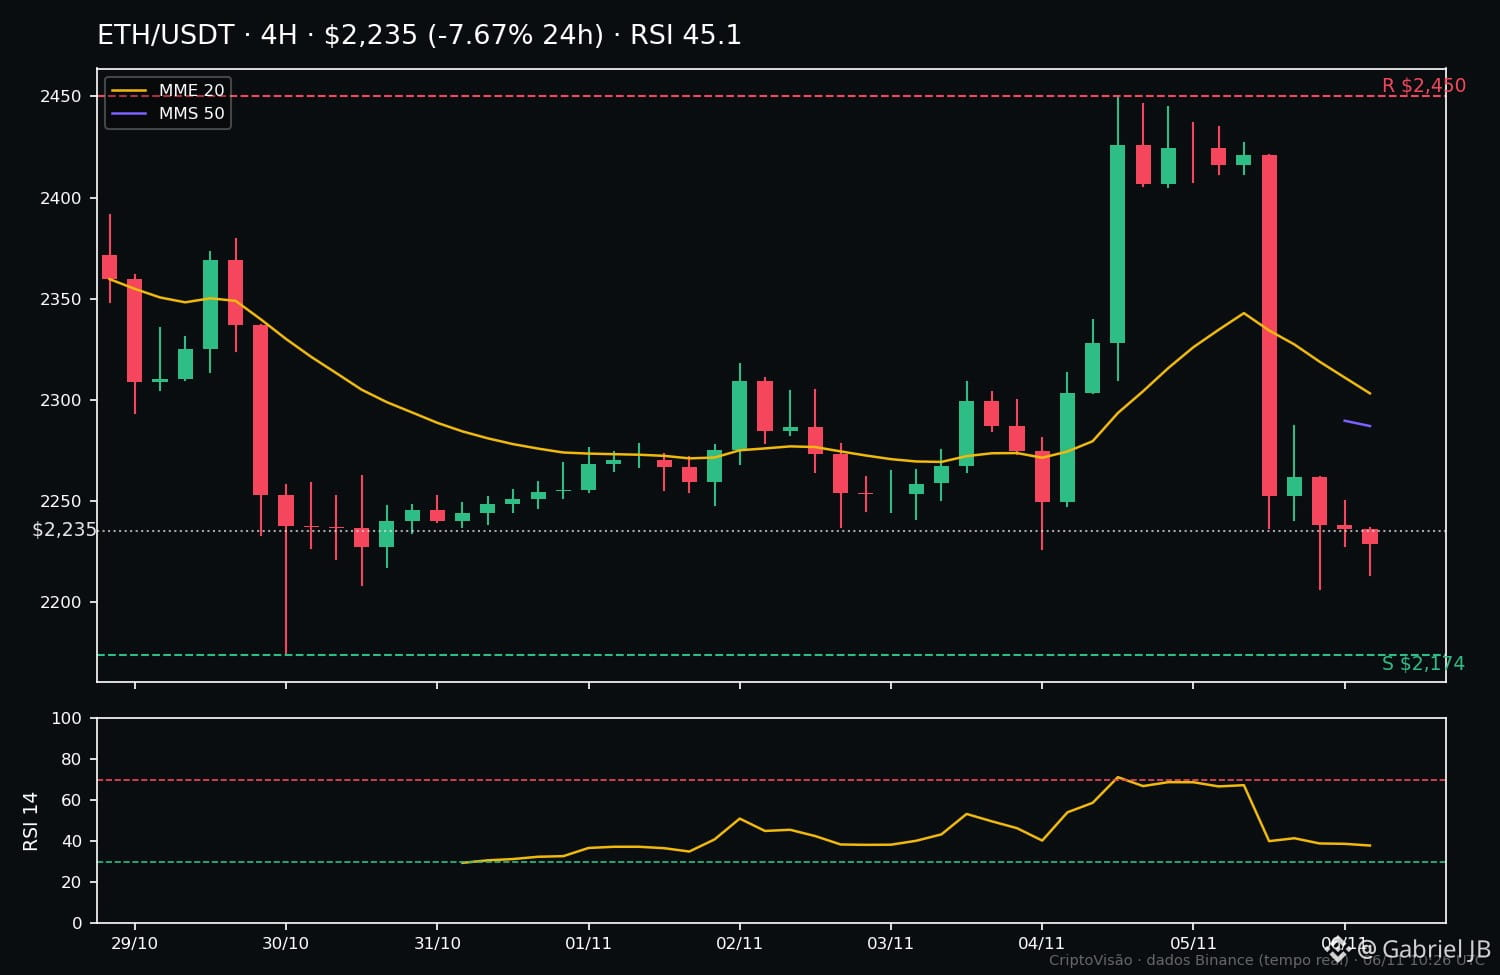
The $ETH fell to $2,235, down 7.67% over the last 24 hours — a steeper drop than $BTC today (down 5.50%, to $76,084). For the week, however, ETH is less negative (down 5.54% versus BTC’s 7.04%): today’s weakness, not the whole week’s.
SITUATION
The price is below the 4-hour moving averages (EMA-20 at $2,313 and SMA-50 at $2,287), and the RSI-14 is at 45.1 — neutral, not oversold. ETH is trading at 13% of its 24-hour range ($2,206–$2,424), meaning it is near the day’s low.
LEVELS
Support: $2,206 (24-hour low) and $2,174 (7-day low).
Resistance: $2,287–$2,313 (moving averages) and $2,450 (7-day high).
SCENARIO A — recovery: holding $2,174 and closing 4-hour candles above $2,313, with rising volume, opens the way to test $2,450.
SCENARIO B — continued decline: a 4-hour close below $2,174 confirms weakness and exposes lower levels.
WHAT WOULD CONFIRM IT
To the upside: a close above the EMA-20 and RSI rising above 50. To the downside: losing $2,174 on volume.
RISK
$BTC is also below the moving averages — this is a market-wide decline, not just an ETH decline. High volatility near support calls for patience: rushing in after the price, or using leverage, is the classic mistake in these zones.
CONCLUSION
ETH is at a decision point: either support at $2,174 holds and the price reclaims the moving averages, or losing that level confirms further weakness. Until then, this is a zone for observation, not certainty.
What do you think — will support at $2,174 hold, or will ETH test lower levels? 👇
#Ethereum #CriptoVisao #TechnicalAnalysis
ETH tests the weekly low — what will decide the next move? 📉
The $ETH fell to $2,235, down 7.67% over the last 24 hours — a steeper drop than $BTC today (down 5.50%, to $76,084). For the week, however, ETH is less negative (down 5.54% versus BTC’s 7.04%): today’s weakness, not the whole week’s.
SITUATION
The price is below the 4-hour moving averages (EMA-20 at $2,313 and SMA-50 at $2,287), and the RSI-14 is at 45.1 — neutral, not oversold. ETH is trading at 13% of its 24-hour range ($2,206–$2,424), meaning it is near the day’s low.
LEVELS
Support: $2,206 (24-hour low) and $2,174 (7-day low).
Resistance: $2,287–$2,313 (moving averages) and $2,450 (7-day high).
SCENARIO A — recovery: holding $2,174 and closing 4-hour candles above $2,313, with rising volume, opens the way to test $2,450.
SCENARIO B — continued decline: a 4-hour close below $2,174 confirms weakness and exposes lower levels.
WHAT WOULD CONFIRM IT
To the upside: a close above the EMA-20 and RSI rising above 50. To the downside: losing $2,174 on volume.
RISK
$BTC is also below the moving averages — this is a market-wide decline, not just an ETH decline. High volatility near support calls for patience: rushing in after the price, or using leverage, is the classic mistake in these zones.
CONCLUSION
ETH is at a decision point: either support at $2,174 holds and the price reclaims the moving averages, or losing that level confirms further weakness. Until then, this is a zone for observation, not certainty.
What do you think — will support at $2,174 hold, or will ETH test lower levels? 👇
#Ethereum #CriptoVisao #TechnicalAnalysis
The $ETH fell to $2,235, down 7.67% over the last 24 hours — a steeper drop than $BTC today (down 5.50%, to $76,084). For the week, however, ETH is less negative (down 5.54% versus BTC’s 7.04%): today’s weakness, not the whole week’s.
SITUATION
The price is below the 4-hour moving averages (EMA-20 at $2,313 and SMA-50 at $2,287), and the RSI-14 is at 45.1 — neutral, not oversold. ETH is trading at 13% of its 24-hour range ($2,206–$2,424), meaning it is near the day’s low.
LEVELS
Support: $2,206 (24-hour low) and $2,174 (7-day low).
Resistance: $2,287–$2,313 (moving averages) and $2,450 (7-day high).
SCENARIO A — recovery: holding $2,174 and closing 4-hour candles above $2,313, with rising volume, opens the way to test $2,450.
SCENARIO B — continued decline: a 4-hour close below $2,174 confirms weakness and exposes lower levels.
WHAT WOULD CONFIRM IT
To the upside: a close above the EMA-20 and RSI rising above 50. To the downside: losing $2,174 on volume.
RISK
$BTC is also below the moving averages — this is a market-wide decline, not just an ETH decline. High volatility near support calls for patience: rushing in after the price, or using leverage, is the classic mistake in these zones.
CONCLUSION
ETH is at a decision point: either support at $2,174 holds and the price reclaims the moving averages, or losing that level confirms further weakness. Until then, this is a zone for observation, not certainty.
What do you think — will support at $2,174 hold, or will ETH test lower levels? 👇
#Ethereum #CriptoVisao #TechnicalAnalysis
45
·
--
🛡️ The math that keeps you in the game (even when you make mistakes)
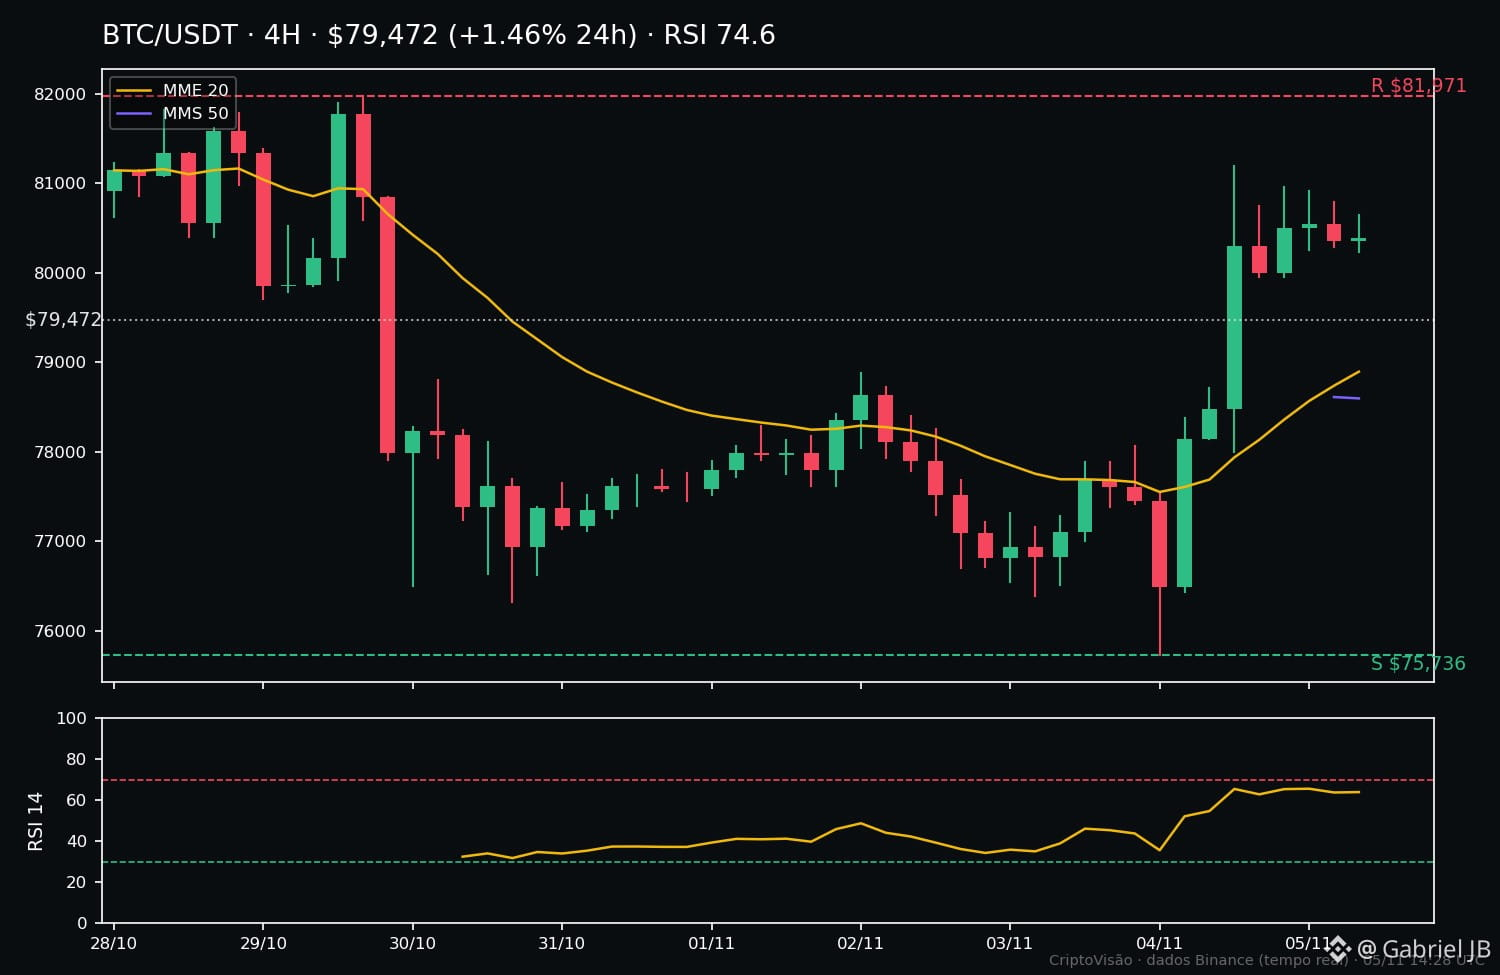
$BTC is at $79.466 today (+1.4% in 24h), between last week's support at $75.736 and resistance at $81.971. RSI at 74.6 — overbought territory. And this is where risk management decides everything.
Let's do the math together, step by step:
1️⃣ Define the risk: $2,000 account, 1% risk per trade = $20. Never more than that per trade.
2️⃣ Set the stop based on structure: below real support, at $75.150 — not just some round number.
3️⃣ Position size comes from the stop: risk per $BTC = $79.466 − $75.150 = $4.316. Position = $20 ÷ $4.316 = 0.0046 BTC (≈ $368). The stop determines the size — never a hunch.
4️⃣ Test the risk/reward: up to resistance, the potential gain is $81.971 − $79.466 = $2.505. R:R = 0.58:1. Below the minimum of 1.5:1 — this entry, at this price, FAILS. Waiting is also a decision.
And watch out for correlation: $BTC, $ETH and $SOL almost always move together. Three 1% positions in correlated coins aren't three 1% risks — they're ~3% in a single bet.
With 1% per trade, 10 consecutive stops cost ~10% of your account, and you stay in the game. Going all-in ends with the first mistake. Preserving capital is strategy No. 1 — the market will be here tomorrow.
What's your risk rule per trade: 1% or 2%? 👇
#Bitcoin #GestaoDeRisco #CryptoVision
🛡️ The math that keeps you in the game (even when you make mistakes)
$BTC is at $79.466 today (+1.4% in 24h), between last week's support at $75.736 and resistance at $81.971. RSI at 74.6 — overbought territory. And this is where risk management decides everything.
Let's do the math together, step by step:
1️⃣ Define the risk: $2,000 account, 1% risk per trade = $20. Never more than that per trade.
2️⃣ Set the stop based on structure: below real support, at $75.150 — not just some round number.
3️⃣ Position size comes from the stop: risk per $BTC = $79.466 − $75.150 = $4.316. Position = $20 ÷ $4.316 = 0.0046 BTC (≈ $368). The stop determines the size — never a hunch.
4️⃣ Test the risk/reward: up to resistance, the potential gain is $81.971 − $79.466 = $2.505. R:R = 0.58:1. Below the minimum of 1.5:1 — this entry, at this price, FAILS. Waiting is also a decision.
And watch out for correlation: $BTC , $ETH and $SOL almost always move together. Three 1% positions in correlated coins aren't three 1% risks — they're ~3% in a single bet.
With 1% per trade, 10 consecutive stops cost ~10% of your account, and you stay in the game. Going all-in ends with the first mistake. Preserving capital is strategy No. 1 — the market will be here tomorrow.
What's your risk rule per trade: 1% or 2%? 👇
#Bitcoin #GestaoDeRisco #CryptoVision
$BTC is at $79.466 today (+1.4% in 24h), between last week's support at $75.736 and resistance at $81.971. RSI at 74.6 — overbought territory. And this is where risk management decides everything.
Let's do the math together, step by step:
1️⃣ Define the risk: $2,000 account, 1% risk per trade = $20. Never more than that per trade.
2️⃣ Set the stop based on structure: below real support, at $75.150 — not just some round number.
3️⃣ Position size comes from the stop: risk per $BTC = $79.466 − $75.150 = $4.316. Position = $20 ÷ $4.316 = 0.0046 BTC (≈ $368). The stop determines the size — never a hunch.
4️⃣ Test the risk/reward: up to resistance, the potential gain is $81.971 − $79.466 = $2.505. R:R = 0.58:1. Below the minimum of 1.5:1 — this entry, at this price, FAILS. Waiting is also a decision.
And watch out for correlation: $BTC , $ETH and $SOL almost always move together. Three 1% positions in correlated coins aren't three 1% risks — they're ~3% in a single bet.
With 1% per trade, 10 consecutive stops cost ~10% of your account, and you stay in the game. Going all-in ends with the first mistake. Preserving capital is strategy No. 1 — the market will be here tomorrow.
What's your risk rule per trade: 1% or 2%? 👇
#Bitcoin #GestaoDeRisco #CryptoVision
28
·
--
XRP at resistance’s doorstep: the $1.34 test will decide what comes next 📊
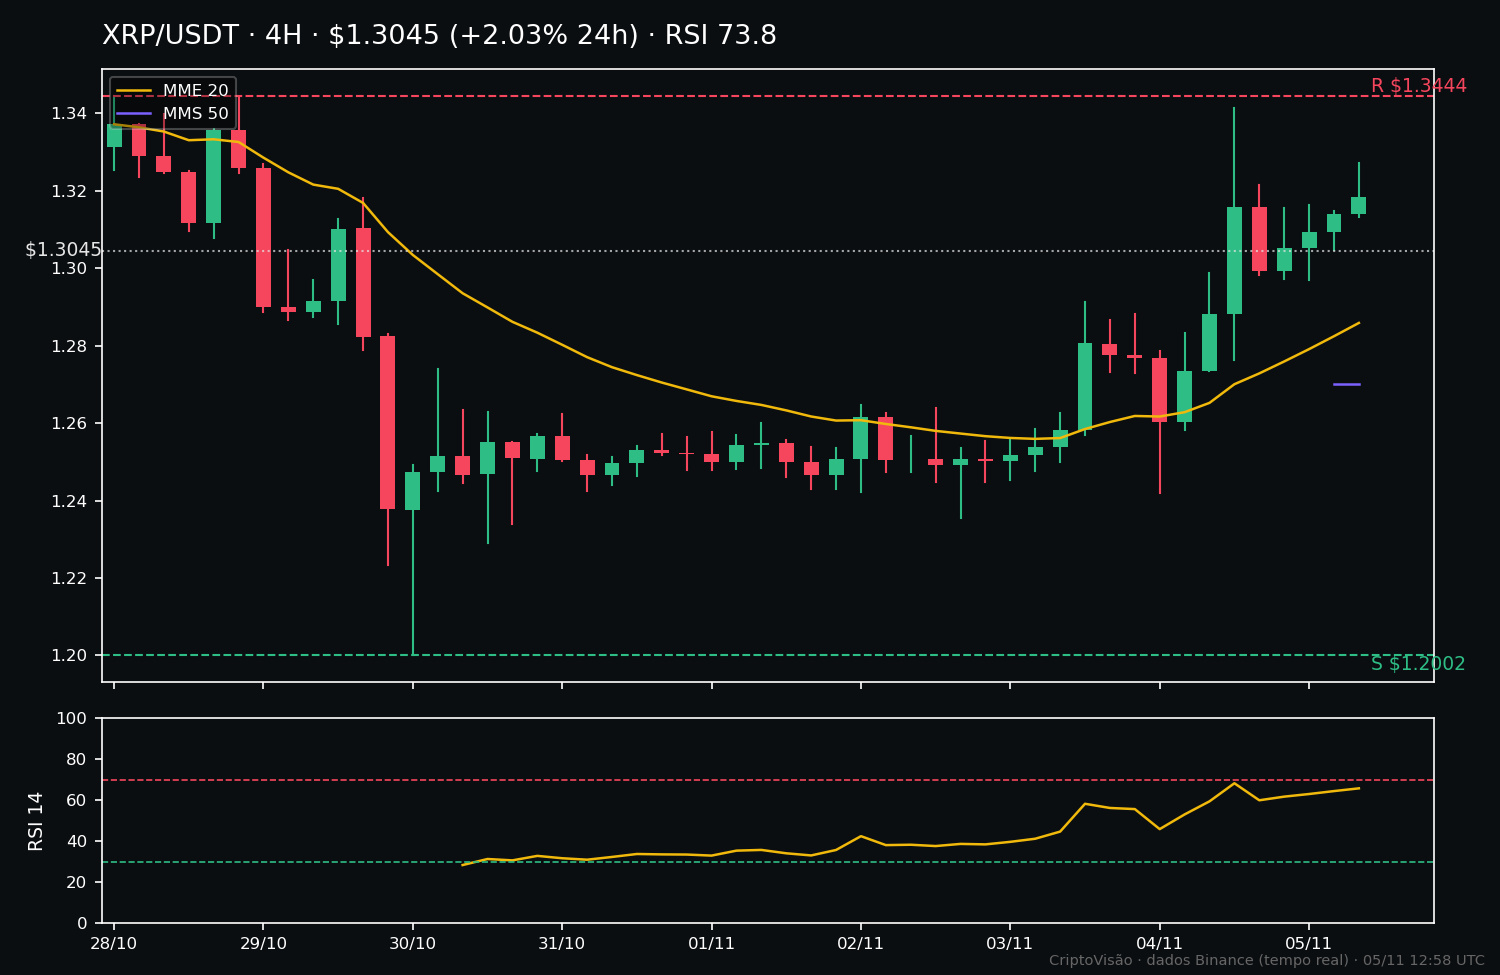
SITUATION — $XRP is trading at $1.30, up 2.1% in the last 24 hours, but still 1.4% below its price 7 days ago. It is above the 20- and 50-period averages (4h), with the RSI-14 at 73.8 — overbought territory. The short-term move is positive, but the price is approaching the test already “stretched.”
LEVELS — Resistance: $1.34 (the 7-day high; it has already touched $1.34 today). Support: $1.28 (20-period average) and $1.20 (the 7-day low).
SCENARIO A — A 4h close above $1.34 with volume opens the way to test the $1.40–$1.45 zone.
SCENARIO B — Rejection at $1.34: a natural pullback to $1.28 and, if that level breaks, to $1.20.
WHAT WOULD CONFIRM IT — In scenario A, a 4h candle close above $1.34 with above-average volume. In scenario B, a rejection candle (long upper wick) at $1.34.
RISK — An overbought RSI is not, by itself, a sell signal, but it’s a warning: buying right at resistance means paying the highest price of the week. And remember: altcoins are more volatile and have wider spreads than BTC — your stop needs room to breathe, or noise may sweep it away.
CONCLUSION — $XRP is at a decision point, not an automatic entry. Waiting for the 4h close is cheaper than guessing.
What do you think: will $XRP break through $1.34 this week, or get rejected again? 👇
#XRP #CriptoVisao #TechnicalAnalysis
XRP at resistance’s doorstep: the $1.34 test will decide what comes next 📊
SITUATION — $XRP is trading at $1.30, up 2.1% in the last 24 hours, but still 1.4% below its price 7 days ago. It is above the 20- and 50-period averages (4h), with the RSI-14 at 73.8 — overbought territory. The short-term move is positive, but the price is approaching the test already “stretched.”
LEVELS — Resistance: $1.34 (the 7-day high; it has already touched $1.34 today). Support: $1.28 (20-period average) and $1.20 (the 7-day low).
SCENARIO A — A 4h close above $1.34 with volume opens the way to test the $1.40–$1.45 zone.
SCENARIO B — Rejection at $1.34: a natural pullback to $1.28 and, if that level breaks, to $1.20.
WHAT WOULD CONFIRM IT — In scenario A, a 4h candle close above $1.34 with above-average volume. In scenario B, a rejection candle (long upper wick) at $1.34.
RISK — An overbought RSI is not, by itself, a sell signal, but it’s a warning: buying right at resistance means paying the highest price of the week. And remember: altcoins are more volatile and have wider spreads than BTC — your stop needs room to breathe, or noise may sweep it away.
CONCLUSION — $XRP is at a decision point, not an automatic entry. Waiting for the 4h close is cheaper than guessing.
What do you think: will $XRP break through $1.34 this week, or get rejected again? 👇
#XRP #CriptoVisao #TechnicalAnalysis
SITUATION — $XRP is trading at $1.30, up 2.1% in the last 24 hours, but still 1.4% below its price 7 days ago. It is above the 20- and 50-period averages (4h), with the RSI-14 at 73.8 — overbought territory. The short-term move is positive, but the price is approaching the test already “stretched.”
LEVELS — Resistance: $1.34 (the 7-day high; it has already touched $1.34 today). Support: $1.28 (20-period average) and $1.20 (the 7-day low).
SCENARIO A — A 4h close above $1.34 with volume opens the way to test the $1.40–$1.45 zone.
SCENARIO B — Rejection at $1.34: a natural pullback to $1.28 and, if that level breaks, to $1.20.
WHAT WOULD CONFIRM IT — In scenario A, a 4h candle close above $1.34 with above-average volume. In scenario B, a rejection candle (long upper wick) at $1.34.
RISK — An overbought RSI is not, by itself, a sell signal, but it’s a warning: buying right at resistance means paying the highest price of the week. And remember: altcoins are more volatile and have wider spreads than BTC — your stop needs room to breathe, or noise may sweep it away.
CONCLUSION — $XRP is at a decision point, not an automatic entry. Waiting for the 4h close is cheaper than guessing.
What do you think: will $XRP break through $1.34 this week, or get rejected again? 👇
#XRP #CriptoVisao #TechnicalAnalysis
15
·
--
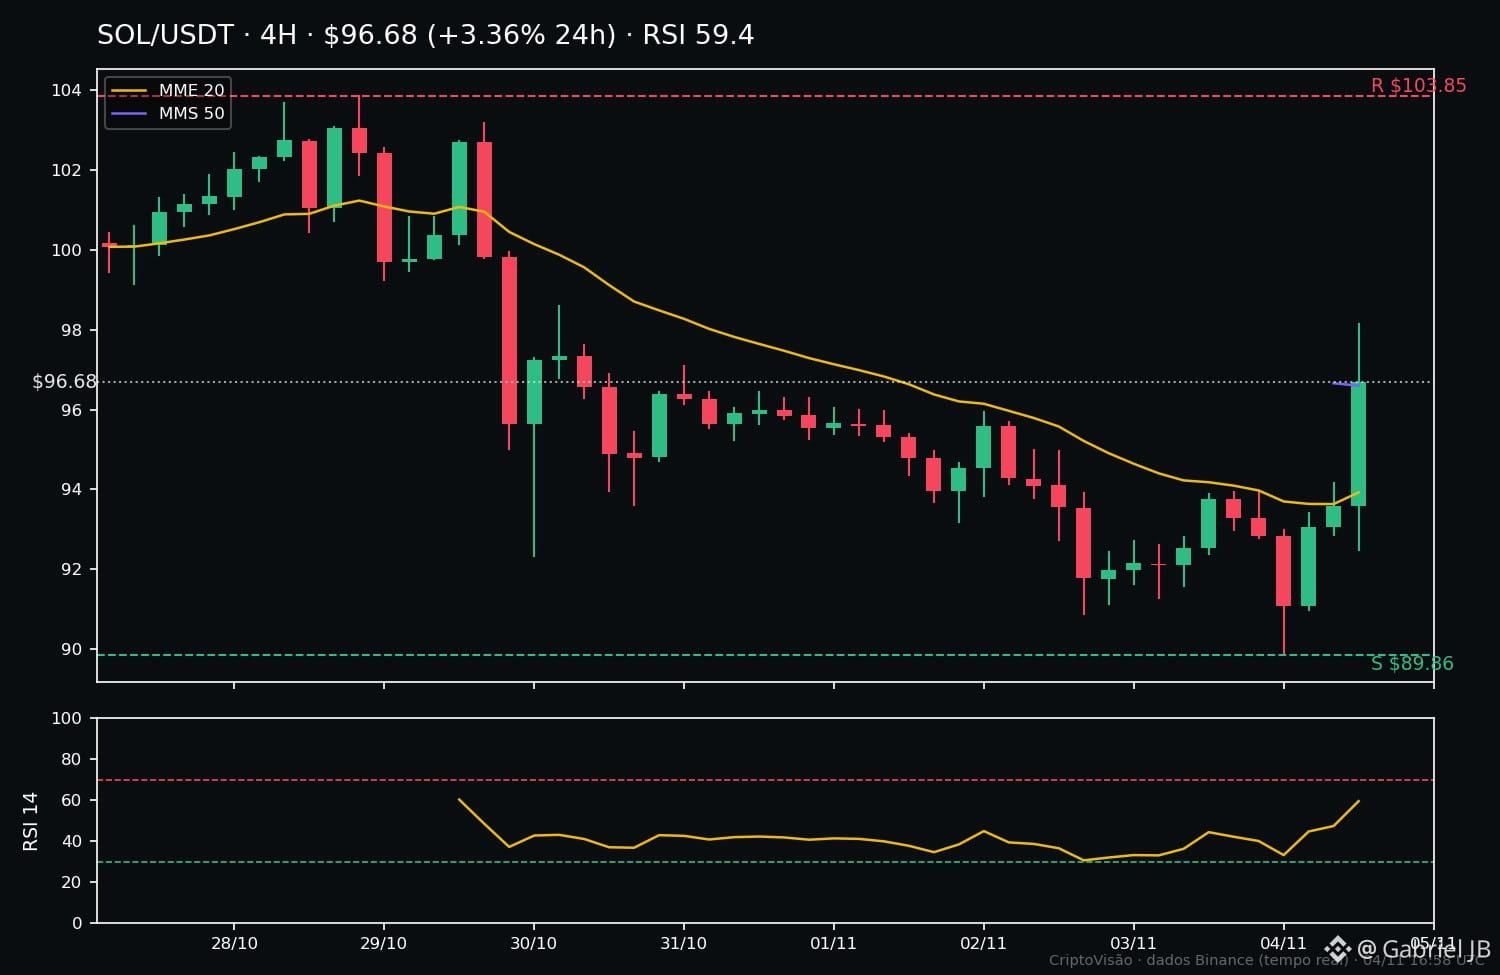
Those who chase the price pay the price: the pullback lesson in $SOL
Today, $SOL touched $89.86 — its lowest level in the last 7 days — and recovered to $96.68 (+3.37% in 24h). Those who entered near the day's high of $98.14 bought into the euphoria. Those who waited watched the move unfold calmly.
This is where the pullback strategy comes in: after a strong move, a patient trader doesn't chase the price — they wait for a retest.
Retest zone to watch: around $93.50 (the 20-period average on the 4-hour chart). If the price pulls back there, this is the zone where the move could be confirmed.
What would confirm an entry: a clear rejection at that zone — a candle closing in the right direction, with the price starting to rise again from there.
Stop (educational example): below $89.86. If that low is breached, the idea is invalidated and the outlook changes.
The classic mistake: entering at the top out of FOMO, when the move has already stretched, and leaving no room for the price to breathe.
This is not a prediction or financial advice: it's about managing your patience. Patience is a position.
What about you: do you wait for the retest or enter while the move is underway? 👇
#Solana #Estrategia #CriptoVisao
Those who chase the price pay the price: the pullback lesson in $SOL
Today, $SOL touched $89.86 — its lowest level in the last 7 days — and recovered to $96.68 (+3.37% in 24h). Those who entered near the day's high of $98.14 bought into the euphoria. Those who waited watched the move unfold calmly.
This is where the pullback strategy comes in: after a strong move, a patient trader doesn't chase the price — they wait for a retest.
Retest zone to watch: around $93.50 (the 20-period average on the 4-hour chart). If the price pulls back there, this is the zone where the move could be confirmed.
What would confirm an entry: a clear rejection at that zone — a candle closing in the right direction, with the price starting to rise again from there.
Stop (educational example): below $89.86. If that low is breached, the idea is invalidated and the outlook changes.
The classic mistake: entering at the top out of FOMO, when the move has already stretched, and leaving no room for the price to breathe.
This is not a prediction or financial advice: it's about managing your patience. Patience is a position.
What about you: do you wait for the retest or enter while the move is underway? 👇
#Solana #Estrategia #CriptoVisao
Today, $SOL touched $89.86 — its lowest level in the last 7 days — and recovered to $96.68 (+3.37% in 24h). Those who entered near the day's high of $98.14 bought into the euphoria. Those who waited watched the move unfold calmly.
This is where the pullback strategy comes in: after a strong move, a patient trader doesn't chase the price — they wait for a retest.
Retest zone to watch: around $93.50 (the 20-period average on the 4-hour chart). If the price pulls back there, this is the zone where the move could be confirmed.
What would confirm an entry: a clear rejection at that zone — a candle closing in the right direction, with the price starting to rise again from there.
Stop (educational example): below $89.86. If that low is breached, the idea is invalidated and the outlook changes.
The classic mistake: entering at the top out of FOMO, when the move has already stretched, and leaving no room for the price to breathe.
This is not a prediction or financial advice: it's about managing your patience. Patience is a position.
What about you: do you wait for the retest or enter while the move is underway? 👇
#Solana #Estrategia #CriptoVisao
32
·
--
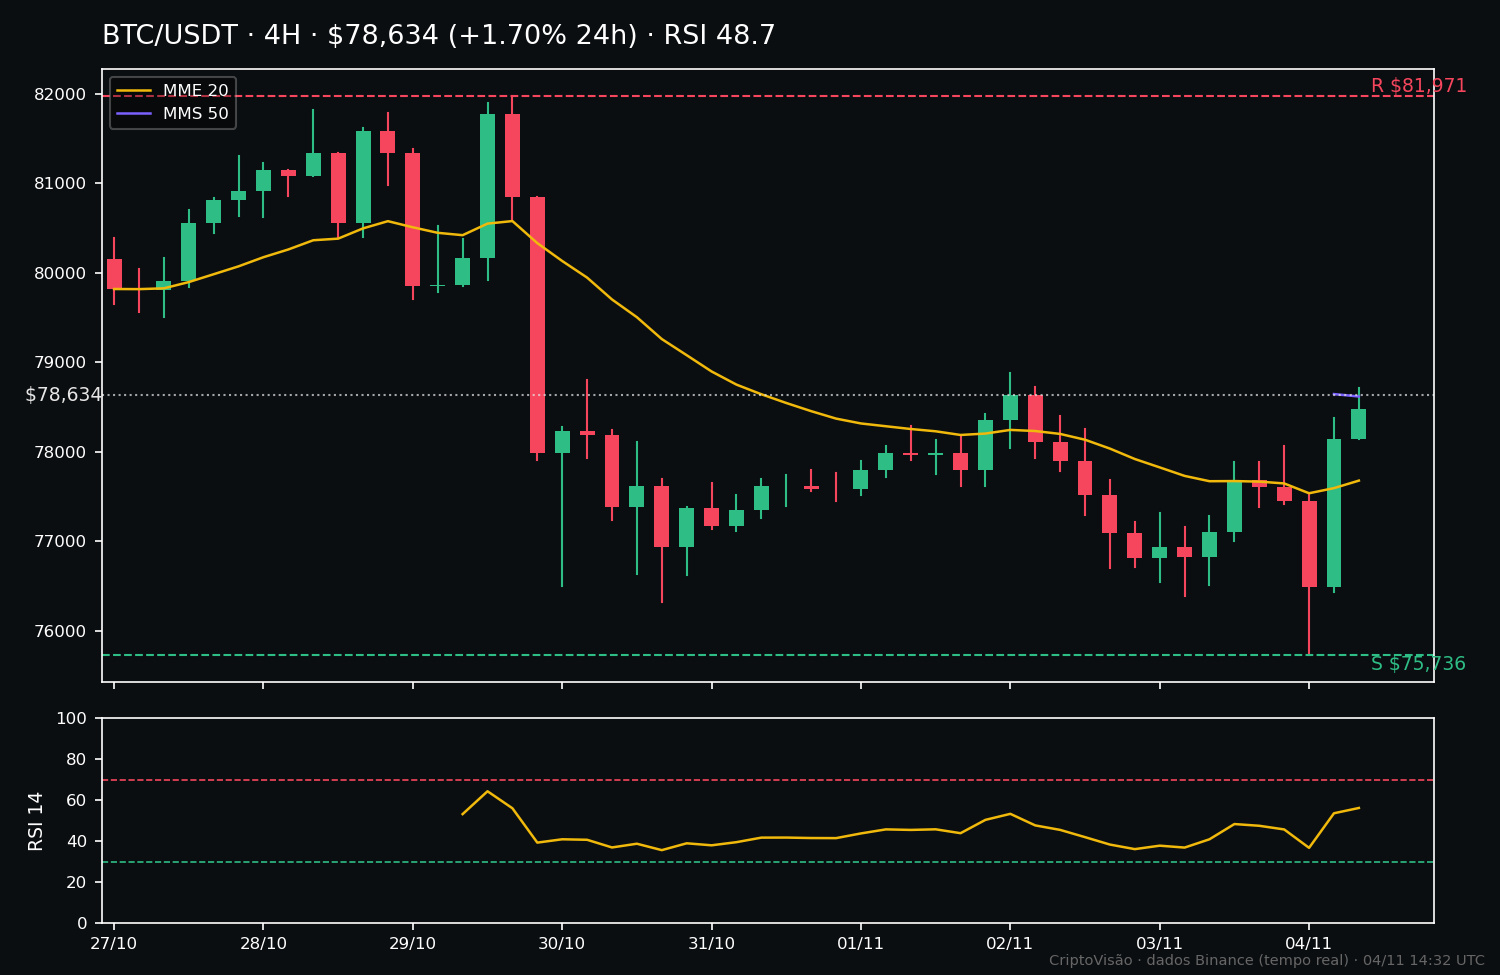
🛡️ A trade that fails the test is better left alone than lost
$BTC today (Nov 4): 78,638 USD (+1.7% in 24h). Weekly support: 75,736 USD. Resistance: 81,971 USD. RSI neutral (48.7), trend unclear — in this scenario, it’s not the price that decides the trade, it’s the plan.
The test to take before entering, in 3 steps:
1. Risk per trade: 1% of a 1,000 USD account = 10 USD. Never more than that.
2. Set the stop based on market structure, not a round number: below actual support, at 75,300 USD.
3. Position size is determined by the stop: 78,638 − 75,300 = 3,338 USD of risk per coin. 10 ÷ 3,338 = 0.0030 BTC (~236 USD). This is the position size that risks only 10 USD.
And the test that disqualifies the entry: a target at resistance gives 81,971 − 78,638 = 3,333 USD in potential profit against 3,338 USD in risk — a 1-to-1 ratio, below the minimum of 2 to 1. In this case, the best trade is no trade. Waiting for a better entry is also risk management.
What if the stop is triggered 10 times in a row? Losing 1% ten times leaves a 1,000 USD account at around 904 USD (−9.6%). A single lost “all-in” bet can cost half the account — and recovering 50% requires gaining 100%. Several small stops are worth more than one big bet.
Daily limit: 3 stops of 1% in a day = take a break. Preserving capital is strategy No. 1.
So, is the 1% rule already part of your plan, or do you still decide position size “by eye”? 👇
#Bitcoin #GestaoDeRisco #CriptoVisao
🛡️ A trade that fails the test is better left alone than lost
$BTC today (Nov 4): 78,638 USD (+1.7% in 24h). Weekly support: 75,736 USD. Resistance: 81,971 USD. RSI neutral (48.7), trend unclear — in this scenario, it’s not the price that decides the trade, it’s the plan.
The test to take before entering, in 3 steps:
1. Risk per trade: 1% of a 1,000 USD account = 10 USD. Never more than that.
2. Set the stop based on market structure, not a round number: below actual support, at 75,300 USD.
3. Position size is determined by the stop: 78,638 − 75,300 = 3,338 USD of risk per coin. 10 ÷ 3,338 = 0.0030 BTC (~236 USD). This is the position size that risks only 10 USD.
And the test that disqualifies the entry: a target at resistance gives 81,971 − 78,638 = 3,333 USD in potential profit against 3,338 USD in risk — a 1-to-1 ratio, below the minimum of 2 to 1. In this case, the best trade is no trade. Waiting for a better entry is also risk management.
What if the stop is triggered 10 times in a row? Losing 1% ten times leaves a 1,000 USD account at around 904 USD (−9.6%). A single lost “all-in” bet can cost half the account — and recovering 50% requires gaining 100%. Several small stops are worth more than one big bet.
Daily limit: 3 stops of 1% in a day = take a break. Preserving capital is strategy No. 1.
So, is the 1% rule already part of your plan, or do you still decide position size “by eye”? 👇
#Bitcoin #GestaoDeRisco #CriptoVisao
$BTC today (Nov 4): 78,638 USD (+1.7% in 24h). Weekly support: 75,736 USD. Resistance: 81,971 USD. RSI neutral (48.7), trend unclear — in this scenario, it’s not the price that decides the trade, it’s the plan.
The test to take before entering, in 3 steps:
1. Risk per trade: 1% of a 1,000 USD account = 10 USD. Never more than that.
2. Set the stop based on market structure, not a round number: below actual support, at 75,300 USD.
3. Position size is determined by the stop: 78,638 − 75,300 = 3,338 USD of risk per coin. 10 ÷ 3,338 = 0.0030 BTC (~236 USD). This is the position size that risks only 10 USD.
And the test that disqualifies the entry: a target at resistance gives 81,971 − 78,638 = 3,333 USD in potential profit against 3,338 USD in risk — a 1-to-1 ratio, below the minimum of 2 to 1. In this case, the best trade is no trade. Waiting for a better entry is also risk management.
What if the stop is triggered 10 times in a row? Losing 1% ten times leaves a 1,000 USD account at around 904 USD (−9.6%). A single lost “all-in” bet can cost half the account — and recovering 50% requires gaining 100%. Several small stops are worth more than one big bet.
Daily limit: 3 stops of 1% in a day = take a break. Preserving capital is strategy No. 1.
So, is the 1% rule already part of your plan, or do you still decide position size “by eye”? 👇
#Bitcoin #GestaoDeRisco #CriptoVisao
17
·
--
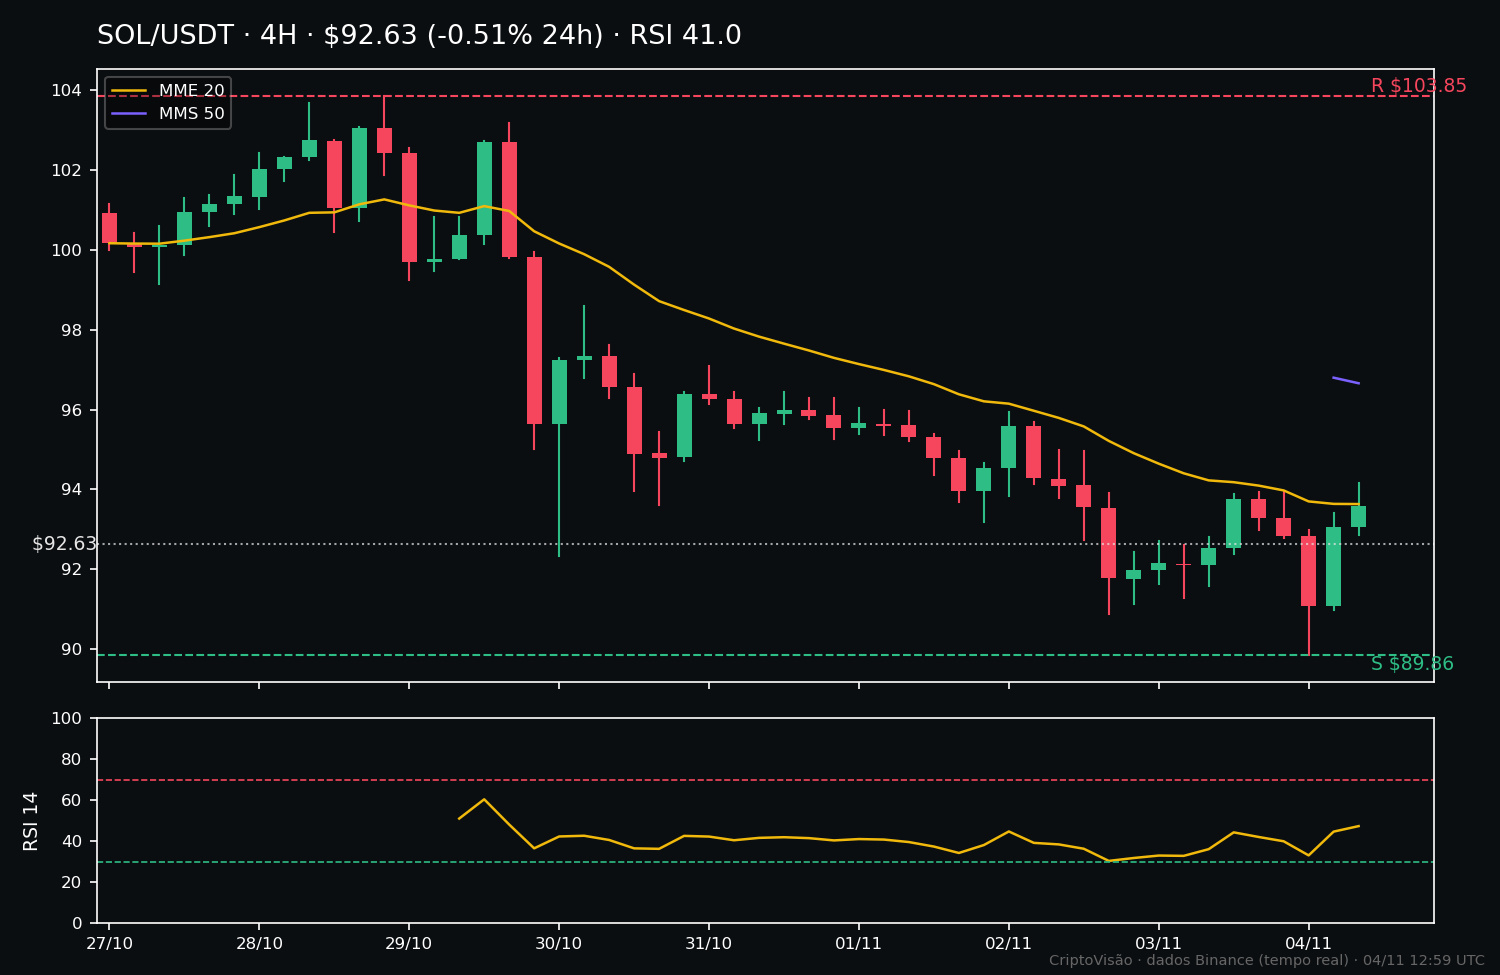
$SOL a testing support at $89.86: will it hold or give way? 📊
SITUATION: Solana is trading at $92.65 (today’s data, 04/11, around 15:00 CAT), down 0.54% over 24 hours and 6.57% over 7 days, with 24-hour trading volume of around $176 million. After a week of declines, the price is now sitting right at its 7-day low — this is where the next move will be decided.
LEVELS: Immediate support at $89.86 (7-day low). Resistance: $93.49 (20-period moving average on the 4-hour chart) and $96.66 (50-period moving average on the 4-hour chart). 7-day high: $103.85. RSI-14 at 41, in neutral territory, with neither side showing excess.
SCENARIO A: If $89.86 holds and the price recovers above $93.49, there is room to test $96.66 and then $103.85.
SCENARIO B: If there is a 4-hour close below $89.86, the weak structure remains in place, and the price will have no nearby support within the past 7-day range.
WHAT WOULD CONFIRM IT: A 4-hour close above $93.49, with the RSI rising from 41, would strengthen Scenario A. A close below $89.86 would confirm Scenario B. Until then, it’s a waiting game — not a guessing game.
RISK: Altcoins are more volatile and have wider spreads than BTC, so stop-losses need room to breathe and positions should be small. This is analysis, not financial advice, and nothing here justifies excessive leverage.
CONCLUSION: Solana is at a clear decision point: support is being tested, while the moving averages above need to be reclaimed. What matters more to you — a defense of $89.86 or the price remaining below both moving averages? Let us know in the comments. 👇
#Solana #AnaliseTecnica #CriptoVisao
$SOL a testing support at $89.86: will it hold or give way? 📊
SITUATION: Solana is trading at $92.65 (today’s data, 04/11, around 15:00 CAT), down 0.54% over 24 hours and 6.57% over 7 days, with 24-hour trading volume of around $176 million. After a week of declines, the price is now sitting right at its 7-day low — this is where the next move will be decided.
LEVELS: Immediate support at $89.86 (7-day low). Resistance: $93.49 (20-period moving average on the 4-hour chart) and $96.66 (50-period moving average on the 4-hour chart). 7-day high: $103.85. RSI-14 at 41, in neutral territory, with neither side showing excess.
SCENARIO A: If $89.86 holds and the price recovers above $93.49, there is room to test $96.66 and then $103.85.
SCENARIO B: If there is a 4-hour close below $89.86, the weak structure remains in place, and the price will have no nearby support within the past 7-day range.
WHAT WOULD CONFIRM IT: A 4-hour close above $93.49, with the RSI rising from 41, would strengthen Scenario A. A close below $89.86 would confirm Scenario B. Until then, it’s a waiting game — not a guessing game.
RISK: Altcoins are more volatile and have wider spreads than BTC, so stop-losses need room to breathe and positions should be small. This is analysis, not financial advice, and nothing here justifies excessive leverage.
CONCLUSION: Solana is at a clear decision point: support is being tested, while the moving averages above need to be reclaimed. What matters more to you — a defense of $89.86 or the price remaining below both moving averages? Let us know in the comments. 👇
#Solana #AnaliseTecnica #CriptoVisao
SITUATION: Solana is trading at $92.65 (today’s data, 04/11, around 15:00 CAT), down 0.54% over 24 hours and 6.57% over 7 days, with 24-hour trading volume of around $176 million. After a week of declines, the price is now sitting right at its 7-day low — this is where the next move will be decided.
LEVELS: Immediate support at $89.86 (7-day low). Resistance: $93.49 (20-period moving average on the 4-hour chart) and $96.66 (50-period moving average on the 4-hour chart). 7-day high: $103.85. RSI-14 at 41, in neutral territory, with neither side showing excess.
SCENARIO A: If $89.86 holds and the price recovers above $93.49, there is room to test $96.66 and then $103.85.
SCENARIO B: If there is a 4-hour close below $89.86, the weak structure remains in place, and the price will have no nearby support within the past 7-day range.
WHAT WOULD CONFIRM IT: A 4-hour close above $93.49, with the RSI rising from 41, would strengthen Scenario A. A close below $89.86 would confirm Scenario B. Until then, it’s a waiting game — not a guessing game.
RISK: Altcoins are more volatile and have wider spreads than BTC, so stop-losses need room to breathe and positions should be small. This is analysis, not financial advice, and nothing here justifies excessive leverage.
CONCLUSION: Solana is at a clear decision point: support is being tested, while the moving averages above need to be reclaimed. What matters more to you — a defense of $89.86 or the price remaining below both moving averages? Let us know in the comments. 👇
#Solana #AnaliseTecnica #CriptoVisao
14
·
--
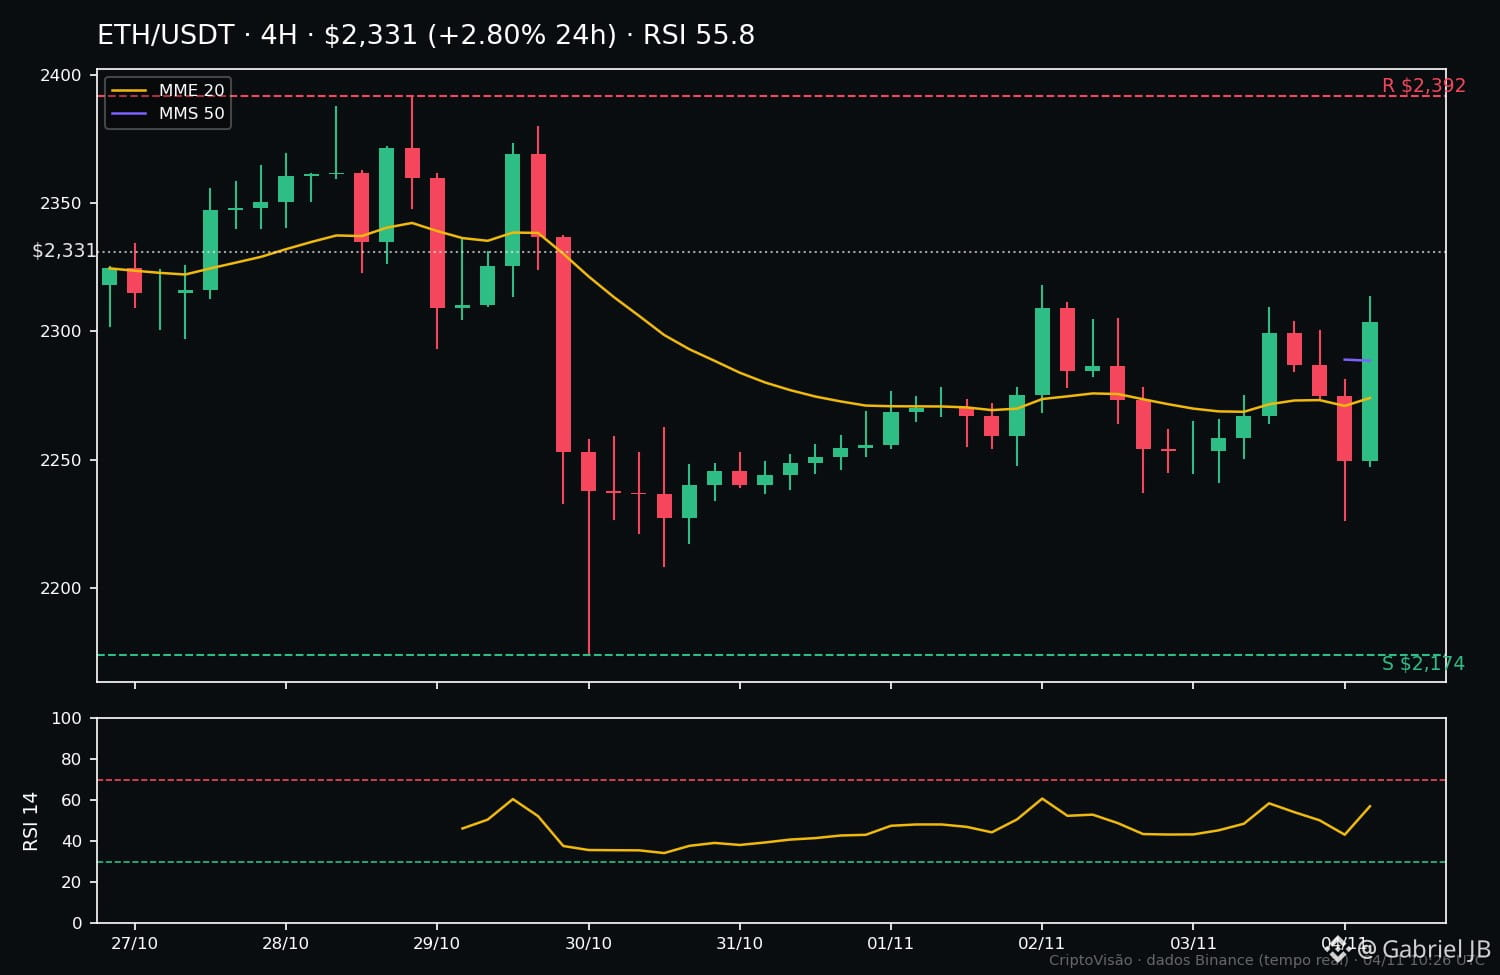
$ETH above the averages — but the week’s resistance still rules 📊
SITUATION: $ETH is trading at 2,329.91 USD, up 2.72% over the last 24 hours and down 0.9% over the last 7 days. The price is above the 20-period (2,273.27 USD) and 50-period (2,288.58 USD) averages, with the RSI-14 at 55.8 — a neutral zone with slight strength, nothing extreme. Today, $ETH is slightly stronger than $BTC (+2.03% in 24 hours), and over the week it is also down less than $BTC (-2.51%).
LEVELS: The week’s resistance is at 2,391.55 USD. Immediate support is in the averages zone, between 2,273 and 2,289 USD, with broader support at 2,174.08 USD, the low of the last 7 days. The price is near the top of the range for the last 24 hours — in other words, it’s rising, but already close to a zone where sellers have stepped in before.
SCENARIO A — Continuation: a 4-hour close above 2,391.55 USD, with volume backing it up, would open the way to test new weekly highs. That would signal that buyers have taken control.
SCENARIO B — Rejection: a rejection at 2,391.55 USD, or a loss of the averages zone (2,273–2,289 USD), would point to a pullback toward 2,174.08 USD. That would be a normal cooldown after the rise, not a confirmed reversal.
WHAT WOULD CONFIRM IT: in scenario A, a strong close above resistance; in scenario B, a close below the averages. Without one of these closes, the market remains undecided — and entering in the middle of the range means paying full price for the risk.
RISK: buying near resistance after a 2.72% rise in a day carries the risk of an immediate pullback. Anyone entering here should know where they’ll exit if the averages zone fails — and never risk more than they’re willing to lose. This is analysis, not financial advice.
CONCLUSION: $ETH shows relative strength against $BTC, but the real test is at 2,391.55 USD. Until then, patience is worth more than haste. Do you think $ETH will break resistance this week, or return to support first? Let us know in the comments 👇
#Ethereum #AnaliseTecnica #CryptoVision
$ETH above the averages — but the week’s resistance still rules 📊
SITUATION: $ETH is trading at 2,329.91 USD, up 2.72% over the last 24 hours and down 0.9% over the last 7 days. The price is above the 20-period (2,273.27 USD) and 50-period (2,288.58 USD) averages, with the RSI-14 at 55.8 — a neutral zone with slight strength, nothing extreme. Today, $ETH is slightly stronger than $BTC (+2.03% in 24 hours), and over the week it is also down less than $BTC (-2.51%).
LEVELS: The week’s resistance is at 2,391.55 USD. Immediate support is in the averages zone, between 2,273 and 2,289 USD, with broader support at 2,174.08 USD, the low of the last 7 days. The price is near the top of the range for the last 24 hours — in other words, it’s rising, but already close to a zone where sellers have stepped in before.
SCENARIO A — Continuation: a 4-hour close above 2,391.55 USD, with volume backing it up, would open the way to test new weekly highs. That would signal that buyers have taken control.
SCENARIO B — Rejection: a rejection at 2,391.55 USD, or a loss of the averages zone (2,273–2,289 USD), would point to a pullback toward 2,174.08 USD. That would be a normal cooldown after the rise, not a confirmed reversal.
WHAT WOULD CONFIRM IT: in scenario A, a strong close above resistance; in scenario B, a close below the averages. Without one of these closes, the market remains undecided — and entering in the middle of the range means paying full price for the risk.
RISK: buying near resistance after a 2.72% rise in a day carries the risk of an immediate pullback. Anyone entering here should know where they’ll exit if the averages zone fails — and never risk more than they’re willing to lose. This is analysis, not financial advice.
CONCLUSION: $ETH shows relative strength against $BTC , but the real test is at 2,391.55 USD. Until then, patience is worth more than haste. Do you think $ETH will break resistance this week, or return to support first? Let us know in the comments 👇
#Ethereum #AnaliseTecnica #CryptoVision
SITUATION: $ETH is trading at 2,329.91 USD, up 2.72% over the last 24 hours and down 0.9% over the last 7 days. The price is above the 20-period (2,273.27 USD) and 50-period (2,288.58 USD) averages, with the RSI-14 at 55.8 — a neutral zone with slight strength, nothing extreme. Today, $ETH is slightly stronger than $BTC (+2.03% in 24 hours), and over the week it is also down less than $BTC (-2.51%).
LEVELS: The week’s resistance is at 2,391.55 USD. Immediate support is in the averages zone, between 2,273 and 2,289 USD, with broader support at 2,174.08 USD, the low of the last 7 days. The price is near the top of the range for the last 24 hours — in other words, it’s rising, but already close to a zone where sellers have stepped in before.
SCENARIO A — Continuation: a 4-hour close above 2,391.55 USD, with volume backing it up, would open the way to test new weekly highs. That would signal that buyers have taken control.
SCENARIO B — Rejection: a rejection at 2,391.55 USD, or a loss of the averages zone (2,273–2,289 USD), would point to a pullback toward 2,174.08 USD. That would be a normal cooldown after the rise, not a confirmed reversal.
WHAT WOULD CONFIRM IT: in scenario A, a strong close above resistance; in scenario B, a close below the averages. Without one of these closes, the market remains undecided — and entering in the middle of the range means paying full price for the risk.
RISK: buying near resistance after a 2.72% rise in a day carries the risk of an immediate pullback. Anyone entering here should know where they’ll exit if the averages zone fails — and never risk more than they’re willing to lose. This is analysis, not financial advice.
CONCLUSION: $ETH shows relative strength against $BTC , but the real test is at 2,391.55 USD. Until then, patience is worth more than haste. Do you think $ETH will break resistance this week, or return to support first? Let us know in the comments 👇
#Ethereum #AnaliseTecnica #CryptoVision
41
·
--
$BTC caught between two moving averages: what decides the next move
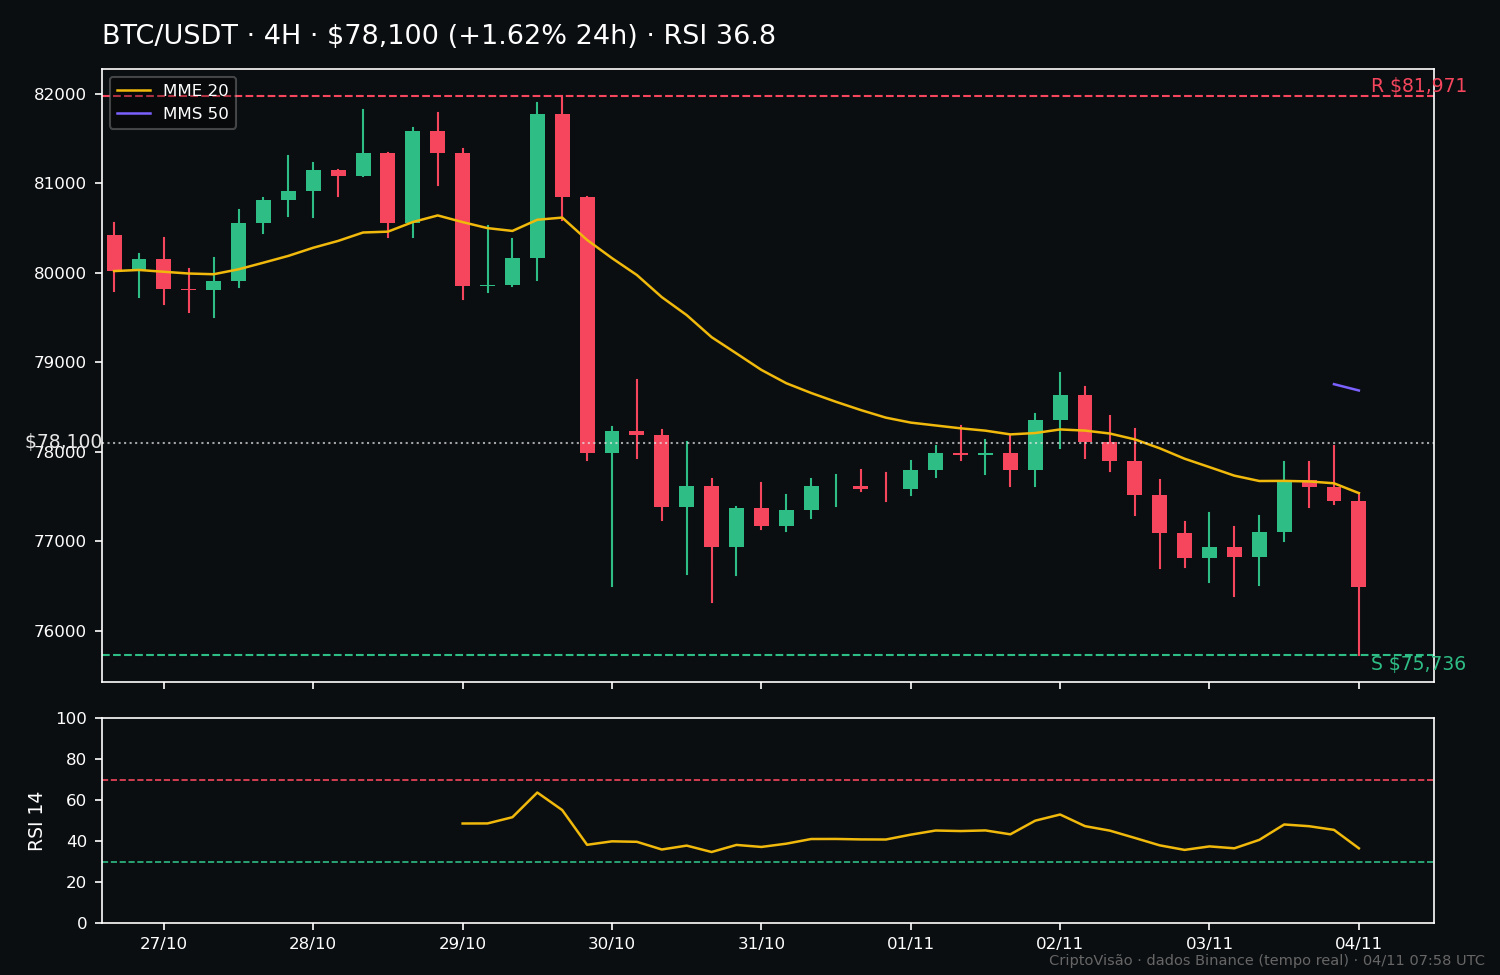
SITUATION: $BTC is trading at 78,100 USD, up +1.62% over the last 24 hours, but down -4.4% over the last 7 days. This is a recovery within a negative week, not a confirmed reversal. The RSI-14 is at 36.8, in neutral territory, and the 4-hour trend is unclear.
LEVELS: Immediate support at the 20-period moving average (77,584 USD), with weekly support at 75,736 USD. Immediate resistance in the 78,374–78,686 USD zone (24-hour high and 50-period moving average). Further up, weekly resistance is at 81,971 USD.
SCENARIO A — If the price closes a 4-hour candle above 78,686 USD, with support at 77,584 USD holding, there is room to test the 81,971 USD zone again.
SCENARIO B — If the price loses 77,584 USD on a 4-hour close, the recovery scenario weakens and a test of 75,736 USD is back on the table.
WHAT WOULD CONFIRM IT: A 4-hour candle close, not just a wick. In Scenario A, a close above 78,686 USD. In Scenario B, a close below 77,584 USD.
RISK: Buying in the middle of the range, between the two moving averages, means paying for uncertainty. The week remains negative, 24-hour volume is 1.12 billion USD, and a false breakout in either direction could catch anyone entering before confirmation. Always define the level that invalidates your idea before entering.
CONCLUSION: $BTC is at a decision point, not a point of certainty. Wait for the 4-hour close: above 78,686 USD favors the recovery continuing; below 77,584 USD favors a return to 75,736 USD. What about you—will you wait for confirmation or enter beforehand? 📊
#Bitcoin #AnaliseTecnica #CryptoVision
$BTC caught between two moving averages: what decides the next move
SITUATION: $BTC is trading at 78,100 USD, up +1.62% over the last 24 hours, but down -4.4% over the last 7 days. This is a recovery within a negative week, not a confirmed reversal. The RSI-14 is at 36.8, in neutral territory, and the 4-hour trend is unclear.
LEVELS: Immediate support at the 20-period moving average (77,584 USD), with weekly support at 75,736 USD. Immediate resistance in the 78,374–78,686 USD zone (24-hour high and 50-period moving average). Further up, weekly resistance is at 81,971 USD.
SCENARIO A — If the price closes a 4-hour candle above 78,686 USD, with support at 77,584 USD holding, there is room to test the 81,971 USD zone again.
SCENARIO B — If the price loses 77,584 USD on a 4-hour close, the recovery scenario weakens and a test of 75,736 USD is back on the table.
WHAT WOULD CONFIRM IT: A 4-hour candle close, not just a wick. In Scenario A, a close above 78,686 USD. In Scenario B, a close below 77,584 USD.
RISK: Buying in the middle of the range, between the two moving averages, means paying for uncertainty. The week remains negative, 24-hour volume is 1.12 billion USD, and a false breakout in either direction could catch anyone entering before confirmation. Always define the level that invalidates your idea before entering.
CONCLUSION: $BTC is at a decision point, not a point of certainty. Wait for the 4-hour close: above 78,686 USD favors the recovery continuing; below 77,584 USD favors a return to 75,736 USD. What about you—will you wait for confirmation or enter beforehand? 📊
#Bitcoin #AnaliseTecnica #CryptoVision
SITUATION: $BTC is trading at 78,100 USD, up +1.62% over the last 24 hours, but down -4.4% over the last 7 days. This is a recovery within a negative week, not a confirmed reversal. The RSI-14 is at 36.8, in neutral territory, and the 4-hour trend is unclear.
LEVELS: Immediate support at the 20-period moving average (77,584 USD), with weekly support at 75,736 USD. Immediate resistance in the 78,374–78,686 USD zone (24-hour high and 50-period moving average). Further up, weekly resistance is at 81,971 USD.
SCENARIO A — If the price closes a 4-hour candle above 78,686 USD, with support at 77,584 USD holding, there is room to test the 81,971 USD zone again.
SCENARIO B — If the price loses 77,584 USD on a 4-hour close, the recovery scenario weakens and a test of 75,736 USD is back on the table.
WHAT WOULD CONFIRM IT: A 4-hour candle close, not just a wick. In Scenario A, a close above 78,686 USD. In Scenario B, a close below 77,584 USD.
RISK: Buying in the middle of the range, between the two moving averages, means paying for uncertainty. The week remains negative, 24-hour volume is 1.12 billion USD, and a false breakout in either direction could catch anyone entering before confirmation. Always define the level that invalidates your idea before entering.
CONCLUSION: $BTC is at a decision point, not a point of certainty. Wait for the 4-hour close: above 78,686 USD favors the recovery continuing; below 77,584 USD favors a return to 75,736 USD. What about you—will you wait for confirmation or enter beforehand? 📊
#Bitcoin #AnaliseTecnica #CryptoVision
Extraterrestree:
BR .... oportunidade de compra 💚💹💹💹🔋🔋🟩💣🚀
1
63
·
--
📊 $BTC: support held — but confirmation hasn’t arrived yet
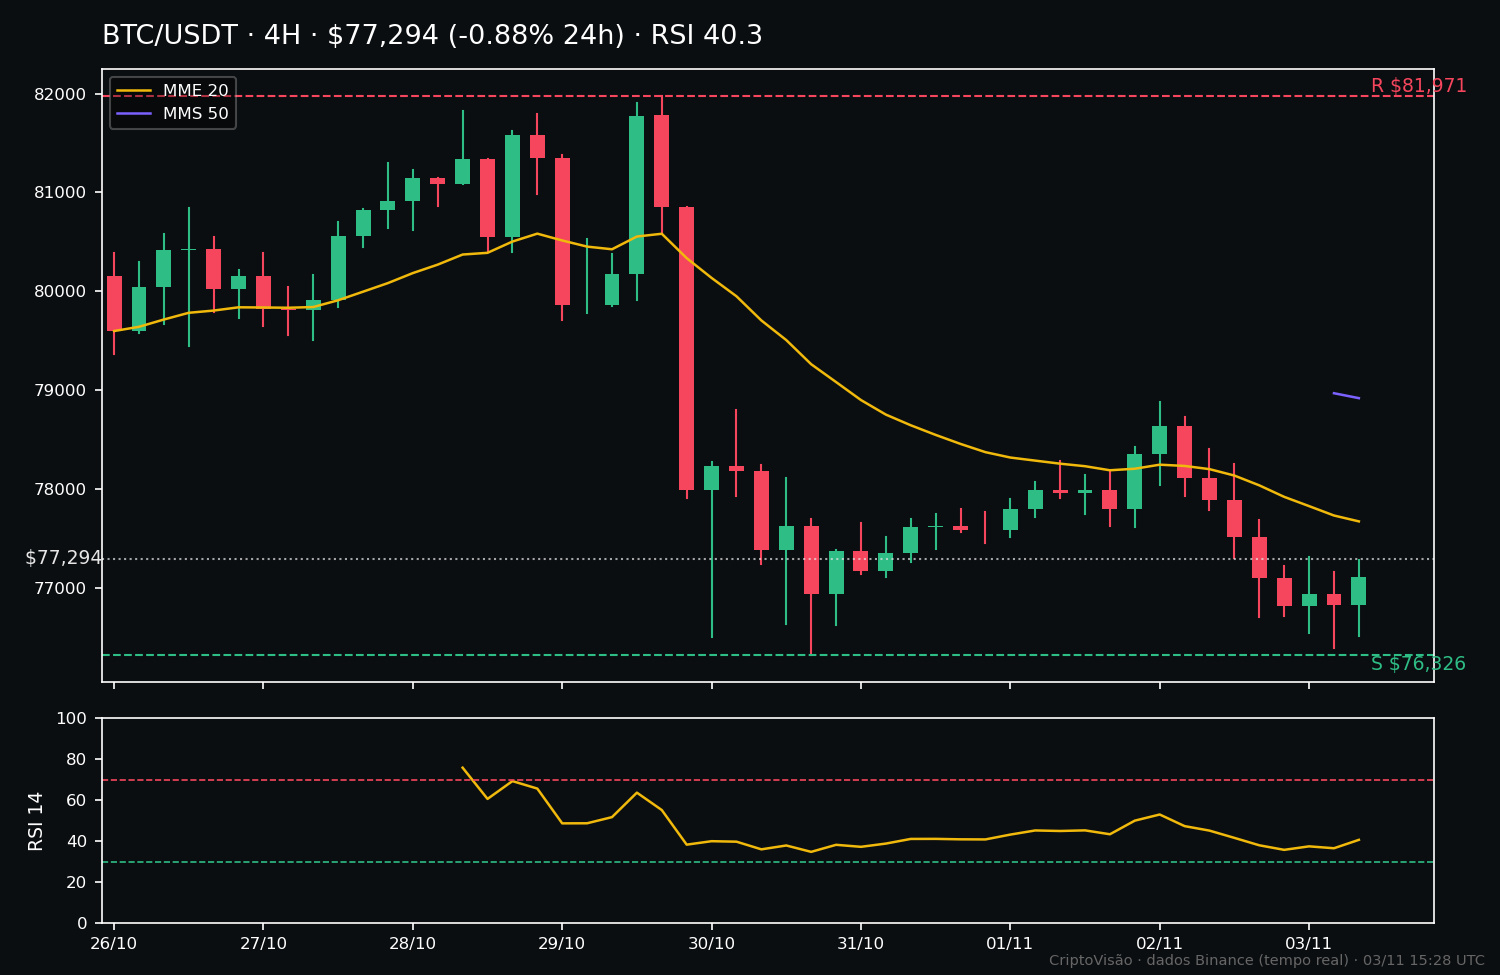
In the morning, $BTC was at $76,851, sitting on the weekly support. By afternoon, it had recovered to $77,278 (-0.91% in 24h, -3.13% in 7 days) — and for now, support has held: the 24h low was $76,389, above the critical level.
VERDICT: STILL WAITING. Neither the recovery scenario has been confirmed nor has a breakdown occurred. The price is between support and the 4h average — the next candles’ closes will decide.
CURRENT LEVELS: Support: $76,326 (7-day low). Resistance: $77,631 (SMA-20, 4h), $78,072 (24h high), and $78,919 (SMA-50). RSI-14 (4h): 40.3, neutral. Weekly high: $81,971.
SCENARIO A — Recovers: a 4h close above $77,631 opens the way to $78,072 and then the SMA-50.
SCENARIO B — Gives way: a 4h close below $76,326 confirms weakness and leaves the market without weekly support.
WHAT TO WATCH BEFORE THE DAILY CLOSE: 4h candle closes, not isolated wicks — above $77,631 or below $76,326. As long as the price moves between the two, there’s no decision.
RISK: volatility rises near support, and losing the level can accelerate the decline. Buying just because “it’s already fallen a lot” is a trap: size your position and define your invalidation level before entering. Educational analysis, not financial advice.
Do you think $BTC will close the day above the SMA-20? 👇
#Bitcoin #AnaliseTecnica #CriptoVisao
📊 $BTC : support held — but confirmation hasn’t arrived yet
In the morning, $BTC was at $76,851, sitting on the weekly support. By afternoon, it had recovered to $77,278 (-0.91% in 24h, -3.13% in 7 days) — and for now, support has held: the 24h low was $76,389, above the critical level.
VERDICT: STILL WAITING. Neither the recovery scenario has been confirmed nor has a breakdown occurred. The price is between support and the 4h average — the next candles’ closes will decide.
CURRENT LEVELS: Support: $76,326 (7-day low). Resistance: $77,631 (SMA-20, 4h), $78,072 (24h high), and $78,919 (SMA-50). RSI-14 (4h): 40.3, neutral. Weekly high: $81,971.
SCENARIO A — Recovers: a 4h close above $77,631 opens the way to $78,072 and then the SMA-50.
SCENARIO B — Gives way: a 4h close below $76,326 confirms weakness and leaves the market without weekly support.
WHAT TO WATCH BEFORE THE DAILY CLOSE: 4h candle closes, not isolated wicks — above $77,631 or below $76,326. As long as the price moves between the two, there’s no decision.
RISK: volatility rises near support, and losing the level can accelerate the decline. Buying just because “it’s already fallen a lot” is a trap: size your position and define your invalidation level before entering. Educational analysis, not financial advice.
Do you think $BTC will close the day above the SMA-20? 👇
#Bitcoin #AnaliseTecnica #CriptoVisao
In the morning, $BTC was at $76,851, sitting on the weekly support. By afternoon, it had recovered to $77,278 (-0.91% in 24h, -3.13% in 7 days) — and for now, support has held: the 24h low was $76,389, above the critical level.
VERDICT: STILL WAITING. Neither the recovery scenario has been confirmed nor has a breakdown occurred. The price is between support and the 4h average — the next candles’ closes will decide.
CURRENT LEVELS: Support: $76,326 (7-day low). Resistance: $77,631 (SMA-20, 4h), $78,072 (24h high), and $78,919 (SMA-50). RSI-14 (4h): 40.3, neutral. Weekly high: $81,971.
SCENARIO A — Recovers: a 4h close above $77,631 opens the way to $78,072 and then the SMA-50.
SCENARIO B — Gives way: a 4h close below $76,326 confirms weakness and leaves the market without weekly support.
WHAT TO WATCH BEFORE THE DAILY CLOSE: 4h candle closes, not isolated wicks — above $77,631 or below $76,326. As long as the price moves between the two, there’s no decision.
RISK: volatility rises near support, and losing the level can accelerate the decline. Buying just because “it’s already fallen a lot” is a trap: size your position and define your invalidation level before entering. Educational analysis, not financial advice.
Do you think $BTC will close the day above the SMA-20? 👇
#Bitcoin #AnaliseTecnica #CriptoVisao
25
·
--
📊 $XRP tests the 50-period average: the next close could decide the direction of the week
SITUATION
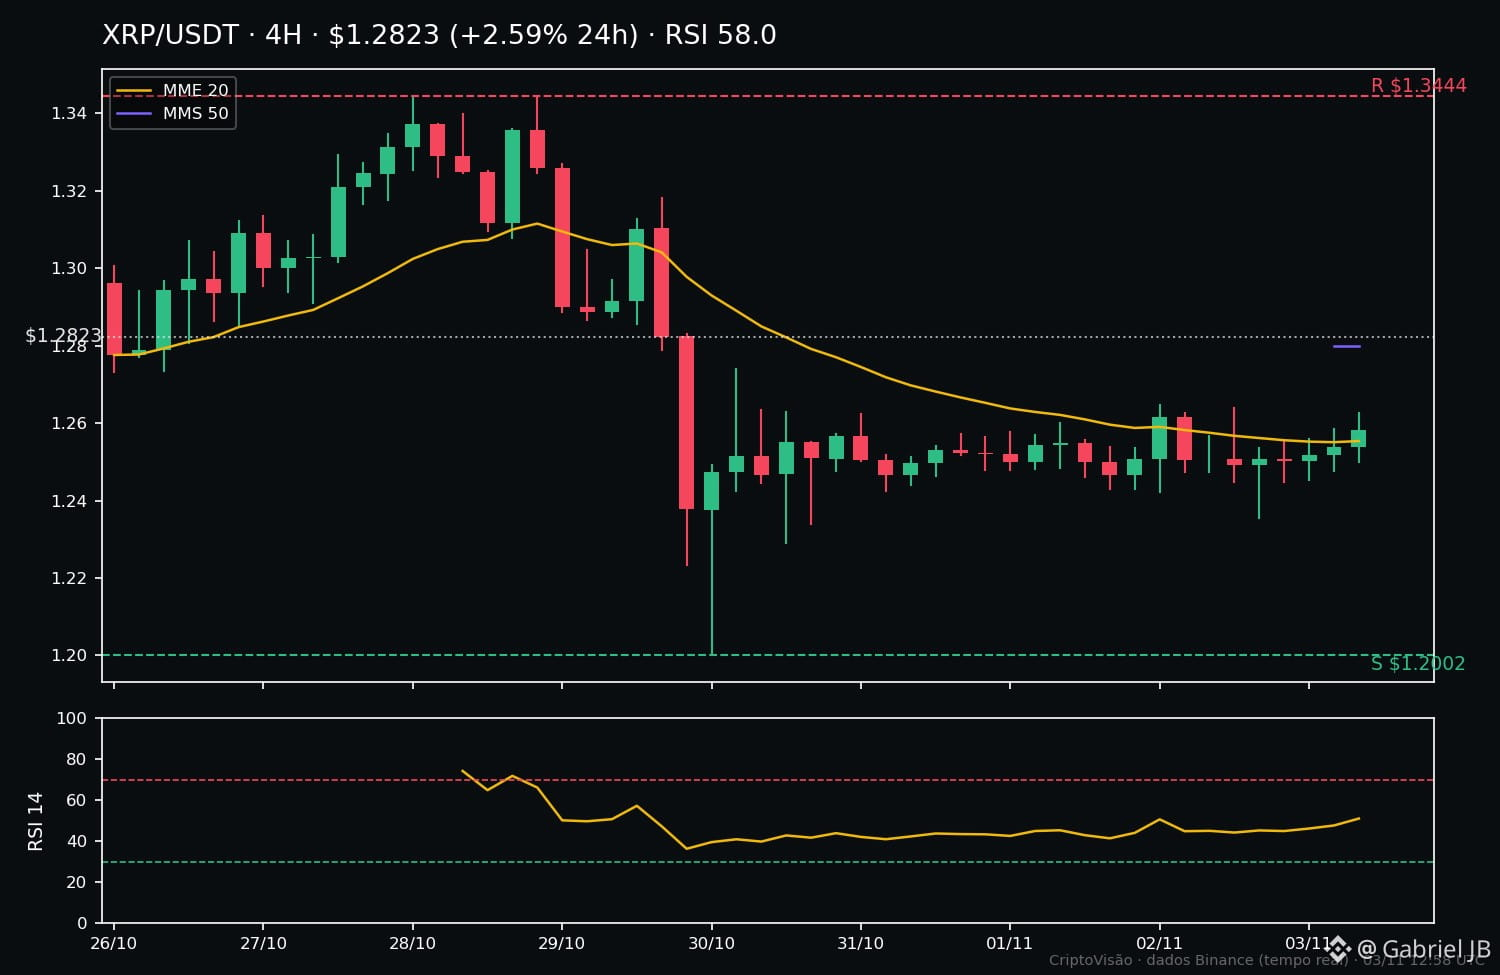
$XRP is trading at 1.28 USD, up 2.58% over the last 24 hours, after a still-negative week (-1.53% over 7 days). The price is above the 20-period average (1.25 USD) and exactly on the 50-period average (1.28 USD), with the RSI-14 at 58 — momentum is recovering, but is not yet overextended. 24-hour volume is around 108 million USD.
LEVELS
Support: 1.2355 USD (24-hour low) and 1.20 USD (7-day low).
Resistance: 1.2885 USD (24-hour high) and 1.34 USD (7-day high).
SCENARIO A — Recovery continues
A 4-hour close above 1.29 USD, accompanied by volume, opens the way for a test of 1.34 USD.
SCENARIO B — Pullback to support
A rejection in the current zone and a break below 1.2355 USD put the price back on course for 1.20 USD.
WHAT WOULD CONFIRM IT
Scenario A is confirmed by closes above the 50-period average and consistent volume; scenario B is invalidated if the price holds 1.2355 USD and starts rising again.
RISK
Altcoins are more volatile and have wider spreads than BTC — a stop that is too tight can easily be triggered by a normal market move. None of this is financial advice: size your position according to the risk you can accept and avoid leverage.
CONCLUSION
$XRP is at a decision point: holding above the 50-period average keeps the recovery alive; failing here sends the price back to the 1.20 USD base. What do you think: will $XRP close the week above 1.34 USD, or return to 1.20 USD first?
#XRP #AnaliseTecnica #CryptoVision
📊 $XRP tests the 50-period average: the next close could decide the direction of the week
SITUATION
$XRP is trading at 1.28 USD, up 2.58% over the last 24 hours, after a still-negative week (-1.53% over 7 days). The price is above the 20-period average (1.25 USD) and exactly on the 50-period average (1.28 USD), with the RSI-14 at 58 — momentum is recovering, but is not yet overextended. 24-hour volume is around 108 million USD.
LEVELS
Support: 1.2355 USD (24-hour low) and 1.20 USD (7-day low).
Resistance: 1.2885 USD (24-hour high) and 1.34 USD (7-day high).
SCENARIO A — Recovery continues
A 4-hour close above 1.29 USD, accompanied by volume, opens the way for a test of 1.34 USD.
SCENARIO B — Pullback to support
A rejection in the current zone and a break below 1.2355 USD put the price back on course for 1.20 USD.
WHAT WOULD CONFIRM IT
Scenario A is confirmed by closes above the 50-period average and consistent volume; scenario B is invalidated if the price holds 1.2355 USD and starts rising again.
RISK
Altcoins are more volatile and have wider spreads than BTC — a stop that is too tight can easily be triggered by a normal market move. None of this is financial advice: size your position according to the risk you can accept and avoid leverage.
CONCLUSION
$XRP is at a decision point: holding above the 50-period average keeps the recovery alive; failing here sends the price back to the 1.20 USD base. What do you think: will $XRP close the week above 1.34 USD, or return to 1.20 USD first?
#XRP #AnaliseTecnica #CryptoVision
SITUATION
$XRP is trading at 1.28 USD, up 2.58% over the last 24 hours, after a still-negative week (-1.53% over 7 days). The price is above the 20-period average (1.25 USD) and exactly on the 50-period average (1.28 USD), with the RSI-14 at 58 — momentum is recovering, but is not yet overextended. 24-hour volume is around 108 million USD.
LEVELS
Support: 1.2355 USD (24-hour low) and 1.20 USD (7-day low).
Resistance: 1.2885 USD (24-hour high) and 1.34 USD (7-day high).
SCENARIO A — Recovery continues
A 4-hour close above 1.29 USD, accompanied by volume, opens the way for a test of 1.34 USD.
SCENARIO B — Pullback to support
A rejection in the current zone and a break below 1.2355 USD put the price back on course for 1.20 USD.
WHAT WOULD CONFIRM IT
Scenario A is confirmed by closes above the 50-period average and consistent volume; scenario B is invalidated if the price holds 1.2355 USD and starts rising again.
RISK
Altcoins are more volatile and have wider spreads than BTC — a stop that is too tight can easily be triggered by a normal market move. None of this is financial advice: size your position according to the risk you can accept and avoid leverage.
CONCLUSION
$XRP is at a decision point: holding above the 50-period average keeps the recovery alive; failing here sends the price back to the 1.20 USD base. What do you think: will $XRP close the week above 1.34 USD, or return to 1.20 USD first?
#XRP #AnaliseTecnica #CryptoVision
27
·
--
BTC vs ETH: Which Is Holding Up Better in the Correction?
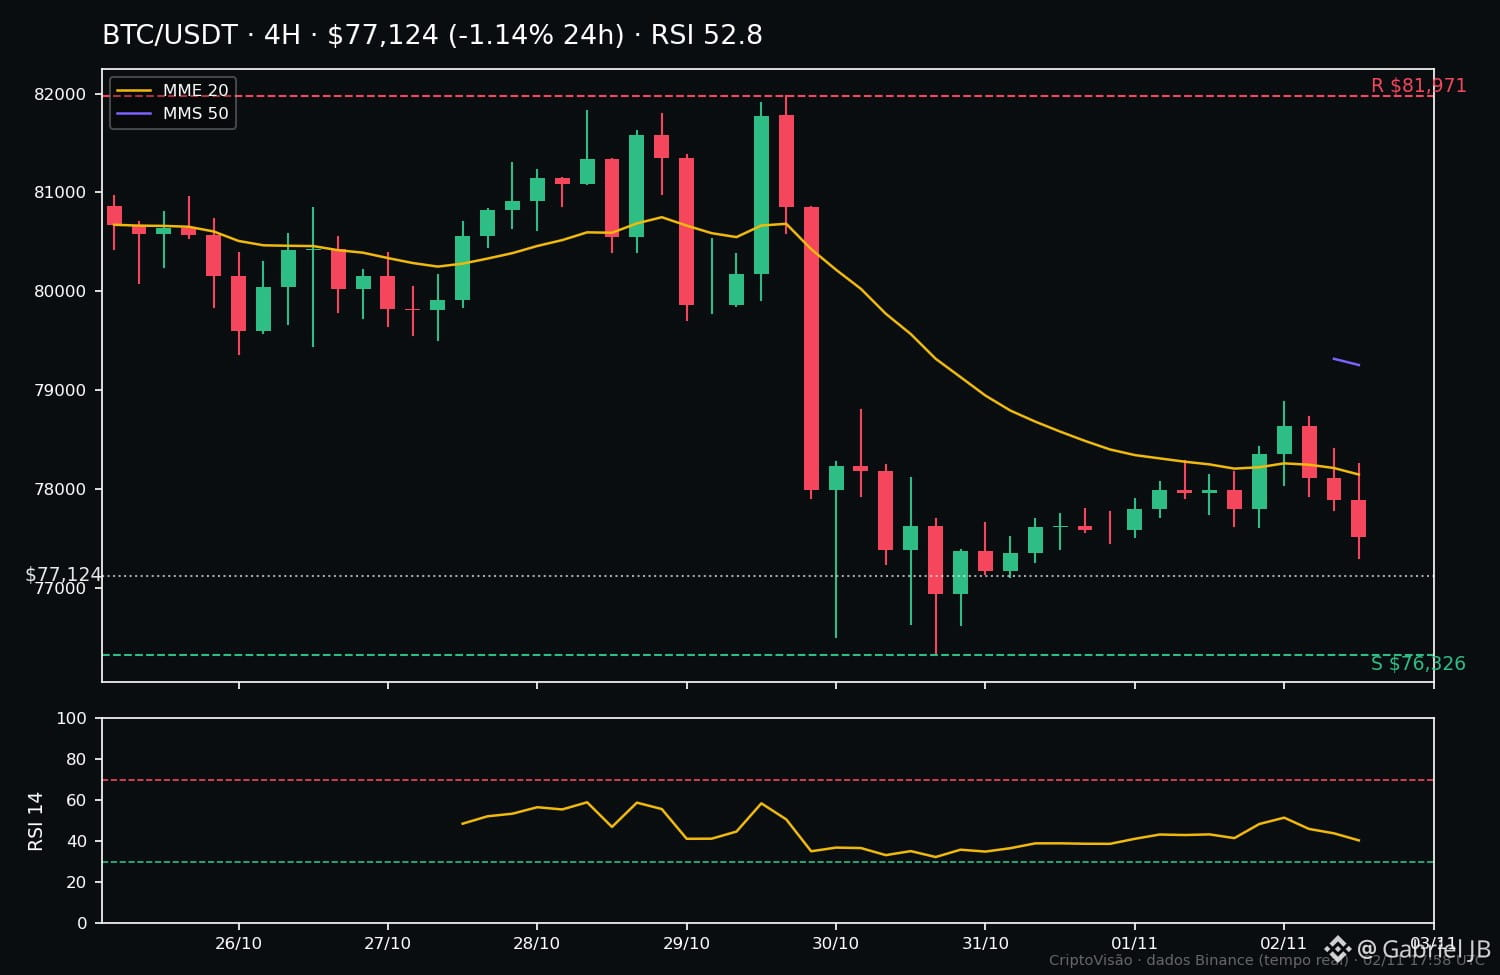
📊 The numbers side by side (November 2, ~20:00 CAT, Binance data):
$BTC — 77 124 USD | 24h: -1,14% | 7d: -3,91% | RSI: 52,8 | below the SMA-20 (77 716) and SMA-50 (79 254) | near the 7-day low (76 326)
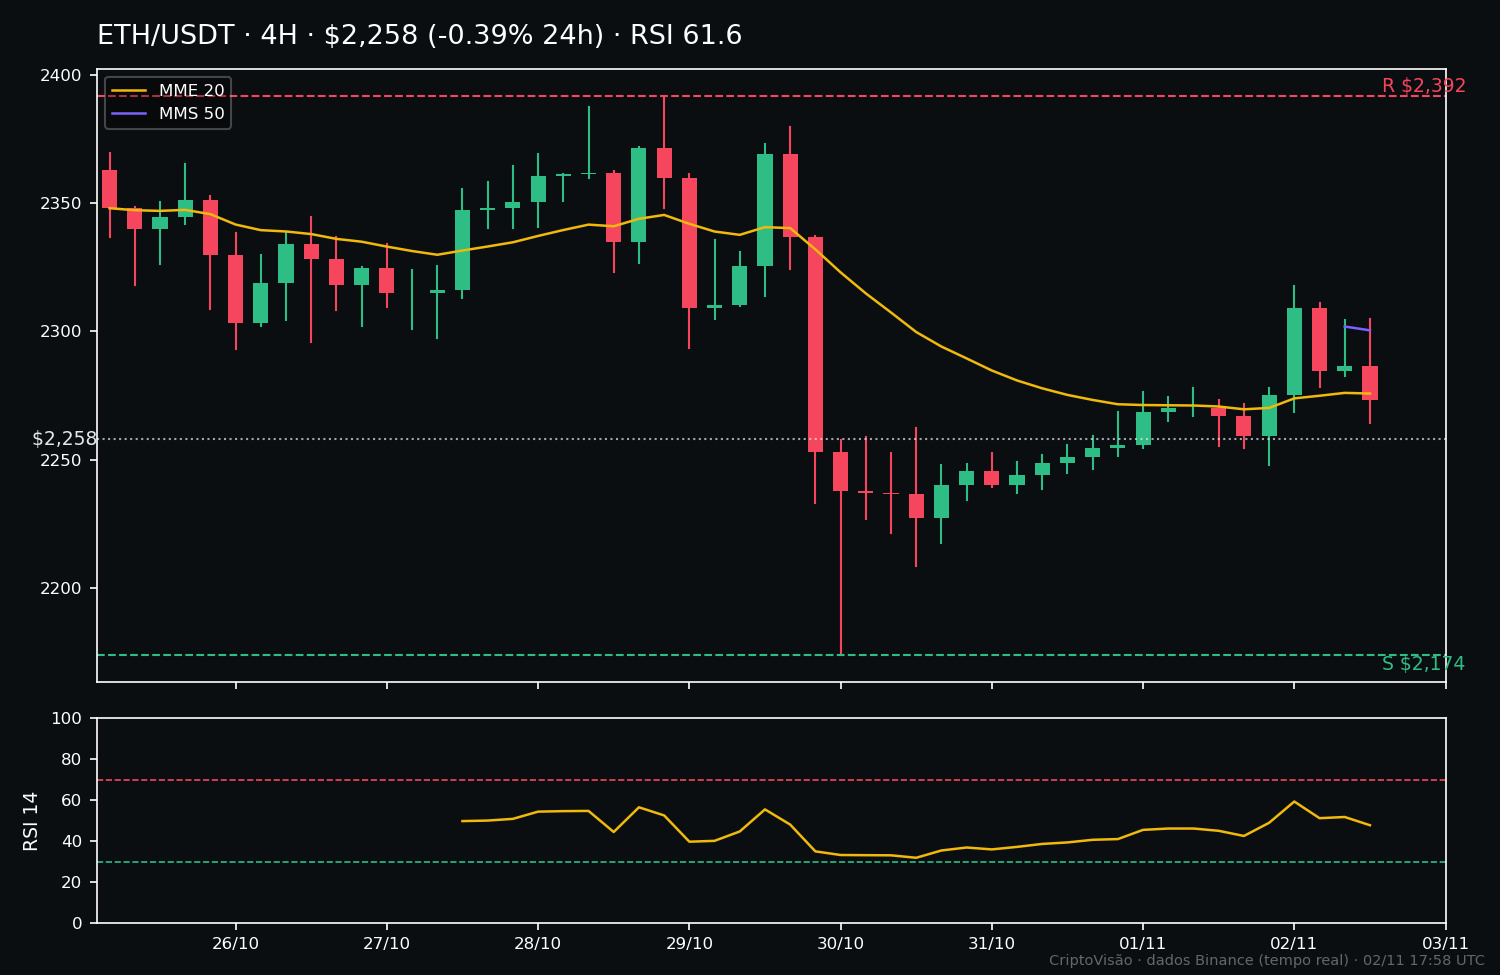
$ETH — 2 257 USD | 24h: -0,45% | 7d: -3,18% | RSI: 61,6 | practically at the SMA-20 (2 260) and below the SMA-50 (2 300) | also near the 7-day low (2 174)
Which is stronger? $ETH — and the data is clear: it is down less over 24 hours and 7 days, has a higher RSI, and is closer to its moving averages. $BTC, on the other hand, is further from the SMA-50 and closer to the weekly low.
What this means: in a week of correction for both, capital is not leaving ETH faster than BTC—quite the opposite. It’s a sign of relative resilience, not absolute strength: both remain below the 4-hour averages and near their lows.
What would confirm or invalidate this reading: if ETH recovers the SMA-50 (2 300), its relative leadership gains weight; if it falls below the 7-day low (2 174), just as BTC falls below 76 326, the correction deepens for both.
⚠️ Be careful about reading too much into a single day: relative strength is not a prediction of a rise. One resilient day does not cancel out a corrective trend.
ETH resilience: capital rotation or just a slower decline? Share your opinion in the comments.
#Bitcoin #Ethereum #CriptoVisao
BTC vs ETH: Which Is Holding Up Better in the Correction?
📊 The numbers side by side (November 2, ~20:00 CAT, Binance data):
$BTC — 77 124 USD | 24h: -1,14% | 7d: -3,91% | RSI: 52,8 | below the SMA-20 (77 716) and SMA-50 (79 254) | near the 7-day low (76 326)
$ETH — 2 257 USD | 24h: -0,45% | 7d: -3,18% | RSI: 61,6 | practically at the SMA-20 (2 260) and below the SMA-50 (2 300) | also near the 7-day low (2 174)
Which is stronger? $ETH — and the data is clear: it is down less over 24 hours and 7 days, has a higher RSI, and is closer to its moving averages. $BTC , on the other hand, is further from the SMA-50 and closer to the weekly low.
What this means: in a week of correction for both, capital is not leaving ETH faster than BTC—quite the opposite. It’s a sign of relative resilience, not absolute strength: both remain below the 4-hour averages and near their lows.
What would confirm or invalidate this reading: if ETH recovers the SMA-50 (2 300), its relative leadership gains weight; if it falls below the 7-day low (2 174), just as BTC falls below 76 326, the correction deepens for both.
⚠️ Be careful about reading too much into a single day: relative strength is not a prediction of a rise. One resilient day does not cancel out a corrective trend.
ETH resilience: capital rotation or just a slower decline? Share your opinion in the comments.
#Bitcoin #Ethereum #CriptoVisao
📊 The numbers side by side (November 2, ~20:00 CAT, Binance data):
$BTC — 77 124 USD | 24h: -1,14% | 7d: -3,91% | RSI: 52,8 | below the SMA-20 (77 716) and SMA-50 (79 254) | near the 7-day low (76 326)
$ETH — 2 257 USD | 24h: -0,45% | 7d: -3,18% | RSI: 61,6 | practically at the SMA-20 (2 260) and below the SMA-50 (2 300) | also near the 7-day low (2 174)
Which is stronger? $ETH — and the data is clear: it is down less over 24 hours and 7 days, has a higher RSI, and is closer to its moving averages. $BTC , on the other hand, is further from the SMA-50 and closer to the weekly low.
What this means: in a week of correction for both, capital is not leaving ETH faster than BTC—quite the opposite. It’s a sign of relative resilience, not absolute strength: both remain below the 4-hour averages and near their lows.
What would confirm or invalidate this reading: if ETH recovers the SMA-50 (2 300), its relative leadership gains weight; if it falls below the 7-day low (2 174), just as BTC falls below 76 326, the correction deepens for both.
⚠️ Be careful about reading too much into a single day: relative strength is not a prediction of a rise. One resilient day does not cancel out a corrective trend.
ETH resilience: capital rotation or just a slower decline? Share your opinion in the comments.
#Bitcoin #Ethereum #CriptoVisao
30
·
--
$SOL tests the $92.34 support — and the RSI approaches oversold territory 📊
SITUATION: $SOL is trading at $93.99 (-0.95% in 24h; -8.14% in 7 days), below the 20-period ($95.45) and 50-period ($98.71) moving averages on the 4-hour chart, with the RSI-14 at 32.9. The price is near the 7-day low, and that level is the key focus of today’s analysis.
LEVELS: Support — $92.34. Immediate resistance — $95.45 (20-period moving average). Next resistance — $98.71 (50-period moving average) and $103.85 (7-day high).
SCENARIO A (bounce at support): if the price holds $92.34 and recovers $95.45, there is room for a test of $98.71.
SCENARIO B (support breakdown): if the price closes below $92.34, selling pressure gains strength, and the next level to watch is below that support, with no target invented.
WHAT WOULD CONFIRM IT: in scenario A, a close above $95.45 with rising volume; in scenario B, a close below $92.34.
RISK: altcoins are more volatile and have wider spreads than BTC — a very tight stop can be triggered by noise. Any protection needs to account for that distance, and the position should be sized to keep losses acceptable.
CONCLUSION: $SOL is at a decision point, not an automatic signal. The analysis hinges on the reaction at support, not on a prediction.
What’s your take: will support hold or give way first? 👇
#Solana #CriptoVisao #TechnicalAnalysis
$SOL tests the $92.34 support — and the RSI approaches oversold territory 📊
SITUATION: $SOL is trading at $93.99 (-0.95% in 24h; -8.14% in 7 days), below the 20-period ($95.45) and 50-period ($98.71) moving averages on the 4-hour chart, with the RSI-14 at 32.9. The price is near the 7-day low, and that level is the key focus of today’s analysis.
LEVELS: Support — $92.34. Immediate resistance — $95.45 (20-period moving average). Next resistance — $98.71 (50-period moving average) and $103.85 (7-day high).
SCENARIO A (bounce at support): if the price holds $92.34 and recovers $95.45, there is room for a test of $98.71.
SCENARIO B (support breakdown): if the price closes below $92.34, selling pressure gains strength, and the next level to watch is below that support, with no target invented.
WHAT WOULD CONFIRM IT: in scenario A, a close above $95.45 with rising volume; in scenario B, a close below $92.34.
RISK: altcoins are more volatile and have wider spreads than BTC — a very tight stop can be triggered by noise. Any protection needs to account for that distance, and the position should be sized to keep losses acceptable.
CONCLUSION: $SOL is at a decision point, not an automatic signal. The analysis hinges on the reaction at support, not on a prediction.
What’s your take: will support hold or give way first? 👇
#Solana #CriptoVisao #TechnicalAnalysis
SITUATION: $SOL is trading at $93.99 (-0.95% in 24h; -8.14% in 7 days), below the 20-period ($95.45) and 50-period ($98.71) moving averages on the 4-hour chart, with the RSI-14 at 32.9. The price is near the 7-day low, and that level is the key focus of today’s analysis.
LEVELS: Support — $92.34. Immediate resistance — $95.45 (20-period moving average). Next resistance — $98.71 (50-period moving average) and $103.85 (7-day high).
SCENARIO A (bounce at support): if the price holds $92.34 and recovers $95.45, there is room for a test of $98.71.
SCENARIO B (support breakdown): if the price closes below $92.34, selling pressure gains strength, and the next level to watch is below that support, with no target invented.
WHAT WOULD CONFIRM IT: in scenario A, a close above $95.45 with rising volume; in scenario B, a close below $92.34.
RISK: altcoins are more volatile and have wider spreads than BTC — a very tight stop can be triggered by noise. Any protection needs to account for that distance, and the position should be sized to keep losses acceptable.
CONCLUSION: $SOL is at a decision point, not an automatic signal. The analysis hinges on the reaction at support, not on a prediction.
What’s your take: will support hold or give way first? 👇
#Solana #CriptoVisao #TechnicalAnalysis
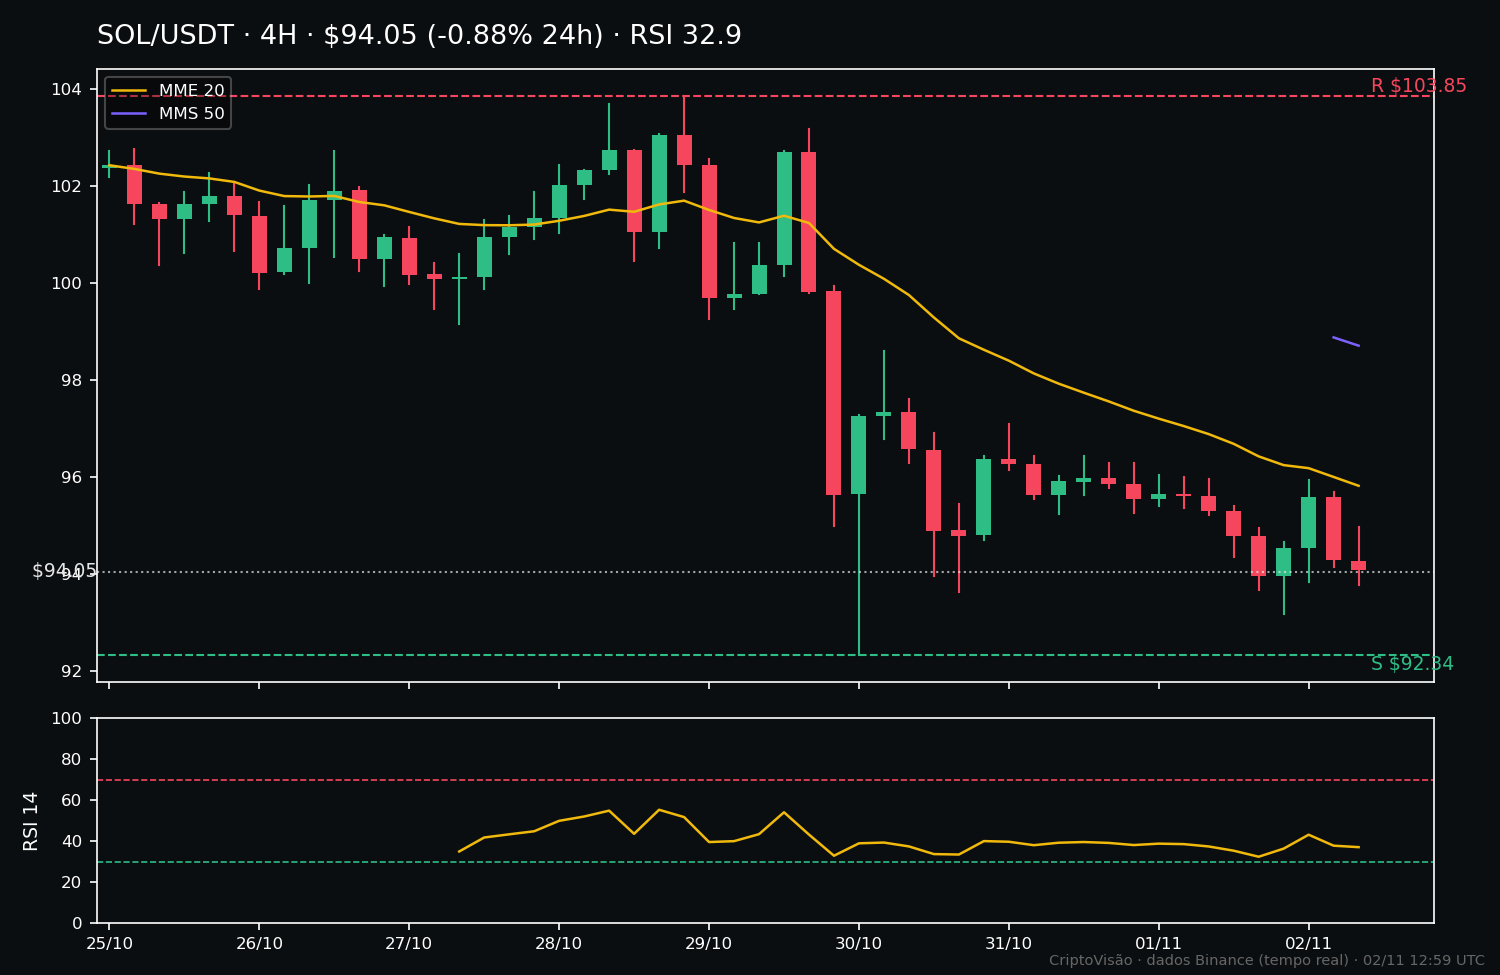
41
·
--
📊 $ETH between two moving averages: who wins today, buyers or sellers?
SITUATION: $ETH is worth $2,287.62 at 12:30 CAT on November 2, up 0.68% in 24 hours and down 3.15% in 7 days. The RSI-14 (4h) is at 66.1, in neutral territory but near the top, and the 4-hour trend is undefined/mixed. In other words: a recovery today, without confirmation of a reversal for the week.
LEVELS: Weekly support: $2,174.08. Weekly resistance: $2,391.55. In the short term, the 20-period moving average (4h) is at $2,256.16 and the 50-period moving average is at $2,303.42—the price is between the two. The range over the past 24 hours was $2,247.84–$2,317.84.
RELATIVE STRENGTH: Today, $ETH is showing more strength than $BTC: $BTC is down 0.16% in 24 hours, at $77,998.28, with an RSI-14 of 63.8. For the week, both have declined by similar amounts (-3.15% for $ETH, -3.43% for $BTC). That’s a difference in today’s momentum, not confirmed leadership.
SCENARIO A (continuation): A 4-hour close above $2,303.42, with the price holding above that level, opens the way to test $2,391.55.
SCENARIO B (pullback): A break below $2,256.16 puts $2,174.08 under pressure. Below that support, the bearish reading gains weight.
WHAT WOULD CONFIRM IT: In scenario A, sustained closes above the 50-period moving average. In scenario B, closes below the 20-period moving average. A single wick without a close confirms neither scenario.
RISK: With the RSI near the upper zone and the trend mixed, the risk of a false breakout is real. This is not a buy or sell recommendation: define the invalidation level before entering and size your position for the possibility that the scenario fails.
CONCLUSION: $ETH is at a decision point between $2,256 and $2,303. The next 4-hour close will say more than today’s move. Do you think $ETH will close the day above $2,303?
$ETH $BTC #Ethereum #CriptoVisao #TechnicalAnalysis
📊 $ETH between two moving averages: who wins today, buyers or sellers?
SITUATION: $ETH is worth $2,287.62 at 12:30 CAT on November 2, up 0.68% in 24 hours and down 3.15% in 7 days. The RSI-14 (4h) is at 66.1, in neutral territory but near the top, and the 4-hour trend is undefined/mixed. In other words: a recovery today, without confirmation of a reversal for the week.
LEVELS: Weekly support: $2,174.08. Weekly resistance: $2,391.55. In the short term, the 20-period moving average (4h) is at $2,256.16 and the 50-period moving average is at $2,303.42—the price is between the two. The range over the past 24 hours was $2,247.84–$2,317.84.
RELATIVE STRENGTH: Today, $ETH is showing more strength than $BTC : $BTC is down 0.16% in 24 hours, at $77,998.28, with an RSI-14 of 63.8. For the week, both have declined by similar amounts (-3.15% for $ETH , -3.43% for $BTC ). That’s a difference in today’s momentum, not confirmed leadership.
SCENARIO A (continuation): A 4-hour close above $2,303.42, with the price holding above that level, opens the way to test $2,391.55.
SCENARIO B (pullback): A break below $2,256.16 puts $2,174.08 under pressure. Below that support, the bearish reading gains weight.
WHAT WOULD CONFIRM IT: In scenario A, sustained closes above the 50-period moving average. In scenario B, closes below the 20-period moving average. A single wick without a close confirms neither scenario.
RISK: With the RSI near the upper zone and the trend mixed, the risk of a false breakout is real. This is not a buy or sell recommendation: define the invalidation level before entering and size your position for the possibility that the scenario fails.
CONCLUSION: $ETH is at a decision point between $2,256 and $2,303. The next 4-hour close will say more than today’s move. Do you think $ETH will close the day above $2,303?
$ETH $BTC #Ethereum #CriptoVisao #TechnicalAnalysis
SITUATION: $ETH is worth $2,287.62 at 12:30 CAT on November 2, up 0.68% in 24 hours and down 3.15% in 7 days. The RSI-14 (4h) is at 66.1, in neutral territory but near the top, and the 4-hour trend is undefined/mixed. In other words: a recovery today, without confirmation of a reversal for the week.
LEVELS: Weekly support: $2,174.08. Weekly resistance: $2,391.55. In the short term, the 20-period moving average (4h) is at $2,256.16 and the 50-period moving average is at $2,303.42—the price is between the two. The range over the past 24 hours was $2,247.84–$2,317.84.
RELATIVE STRENGTH: Today, $ETH is showing more strength than $BTC : $BTC is down 0.16% in 24 hours, at $77,998.28, with an RSI-14 of 63.8. For the week, both have declined by similar amounts (-3.15% for $ETH , -3.43% for $BTC ). That’s a difference in today’s momentum, not confirmed leadership.
SCENARIO A (continuation): A 4-hour close above $2,303.42, with the price holding above that level, opens the way to test $2,391.55.
SCENARIO B (pullback): A break below $2,256.16 puts $2,174.08 under pressure. Below that support, the bearish reading gains weight.
WHAT WOULD CONFIRM IT: In scenario A, sustained closes above the 50-period moving average. In scenario B, closes below the 20-period moving average. A single wick without a close confirms neither scenario.
RISK: With the RSI near the upper zone and the trend mixed, the risk of a false breakout is real. This is not a buy or sell recommendation: define the invalidation level before entering and size your position for the possibility that the scenario fails.
CONCLUSION: $ETH is at a decision point between $2,256 and $2,303. The next 4-hour close will say more than today’s move. Do you think $ETH will close the day above $2,303?
$ETH $BTC #Ethereum #CriptoVisao #TechnicalAnalysis
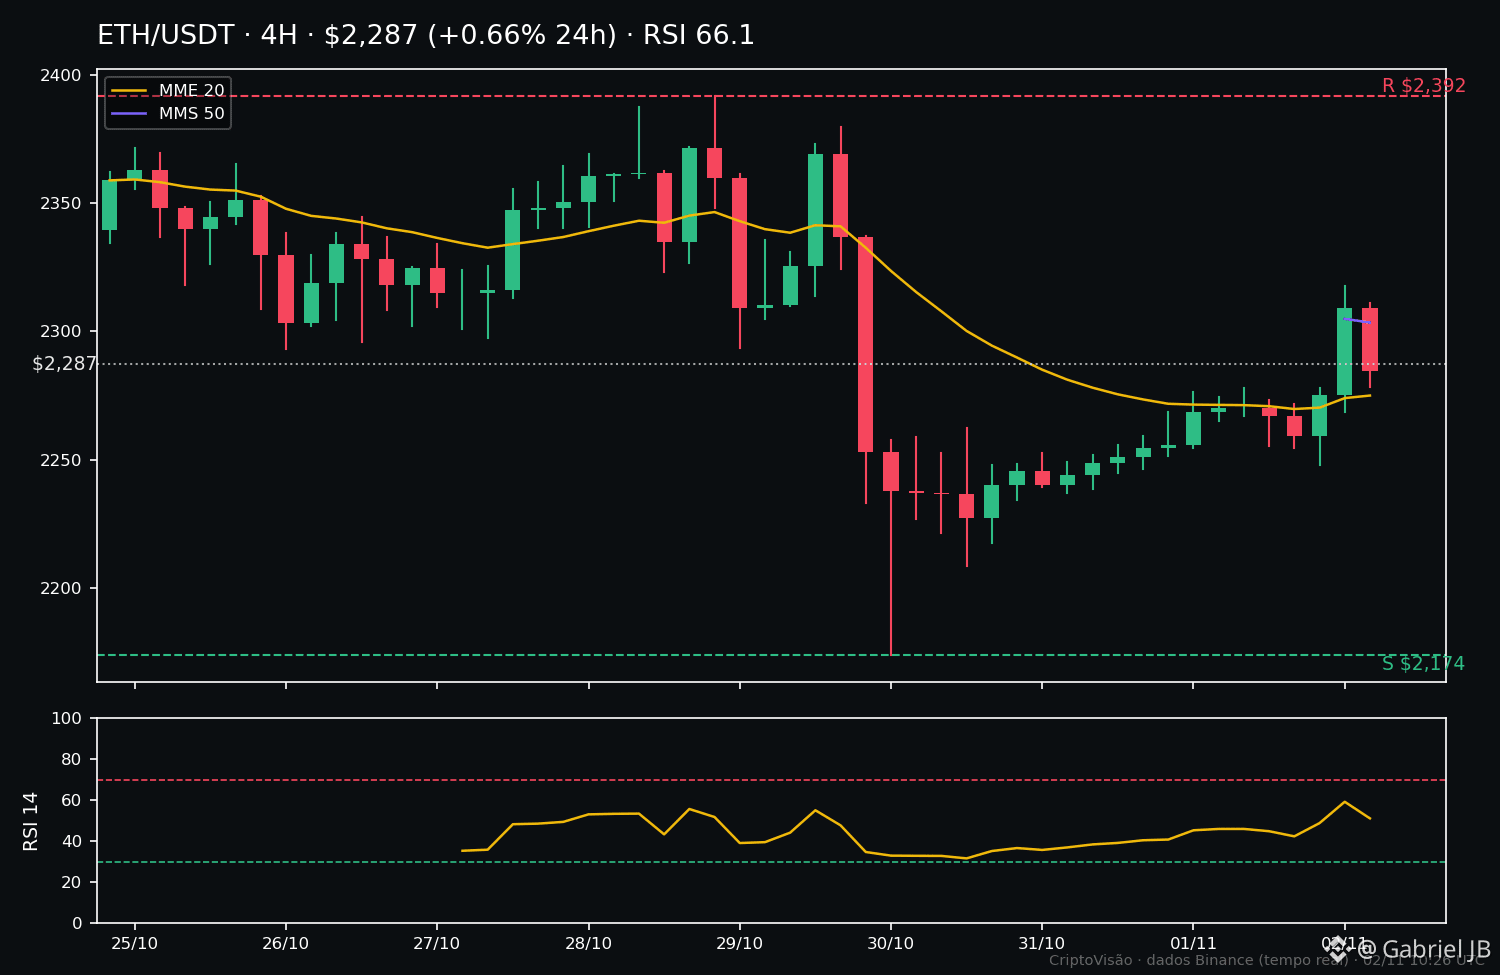
56
·
--
🛡️ Risk management: several small stops are worth more than going all-in
$BTC is currently at 78,028 USD, with weekly support at 76,326 USD and resistance at 81,971 USD. Let’s turn this into a lesson you can apply to any trade.
1️⃣ The 1% rule: in a sample account of 1,000 USD, you risk a maximum of 10 USD per trade. That’s not the position value—it’s the amount you’re willing to lose if your stop is triggered.
2️⃣ Place the stop below support, not at some random round number: entry at 78,028 USD, stop at 76,200 USD (just below 76,326 USD). Risk distance: 1,828 USD.
3️⃣ Calculate your position size; don’t guess: 10 USD ÷ 1,828 USD = 0.00547 BTC, or about 427 USD worth of position. That’s how you keep your risk at 1%, even with a position worth more than 10 USD.
4️⃣ Only enter trades with a risk/reward ratio of at least 1:2: with 1,828 USD at risk, the minimum target is 78,028 + 3,656 = 81,684 USD—just below weekly resistance. If the target doesn’t reach that level, don’t enter.
Why is this better than going all-in? With the same 1,000 USD fully invested, a drop to support would cost about 22 USD—more than double the risk under the 1% rule. Ten small stops cost 100 USD and keep you in the game; one poorly calculated all-in trade can knock you out in a single day.
Preserving capital is strategy number one. Without capital, there’s no next opportunity. Educational content, not financial advice.
#Bitcoin #GestaoDeRisco #CryptoVision
🛡️ Risk management: several small stops are worth more than going all-in
$BTC is currently at 78,028 USD, with weekly support at 76,326 USD and resistance at 81,971 USD. Let’s turn this into a lesson you can apply to any trade.
1️⃣ The 1% rule: in a sample account of 1,000 USD, you risk a maximum of 10 USD per trade. That’s not the position value—it’s the amount you’re willing to lose if your stop is triggered.
2️⃣ Place the stop below support, not at some random round number: entry at 78,028 USD, stop at 76,200 USD (just below 76,326 USD). Risk distance: 1,828 USD.
3️⃣ Calculate your position size; don’t guess: 10 USD ÷ 1,828 USD = 0.00547 BTC, or about 427 USD worth of position. That’s how you keep your risk at 1%, even with a position worth more than 10 USD.
4️⃣ Only enter trades with a risk/reward ratio of at least 1:2: with 1,828 USD at risk, the minimum target is 78,028 + 3,656 = 81,684 USD—just below weekly resistance. If the target doesn’t reach that level, don’t enter.
Why is this better than going all-in? With the same 1,000 USD fully invested, a drop to support would cost about 22 USD—more than double the risk under the 1% rule. Ten small stops cost 100 USD and keep you in the game; one poorly calculated all-in trade can knock you out in a single day.
Preserving capital is strategy number one. Without capital, there’s no next opportunity. Educational content, not financial advice.
#Bitcoin #GestaoDeRisco #CryptoVision
$BTC is currently at 78,028 USD, with weekly support at 76,326 USD and resistance at 81,971 USD. Let’s turn this into a lesson you can apply to any trade.
1️⃣ The 1% rule: in a sample account of 1,000 USD, you risk a maximum of 10 USD per trade. That’s not the position value—it’s the amount you’re willing to lose if your stop is triggered.
2️⃣ Place the stop below support, not at some random round number: entry at 78,028 USD, stop at 76,200 USD (just below 76,326 USD). Risk distance: 1,828 USD.
3️⃣ Calculate your position size; don’t guess: 10 USD ÷ 1,828 USD = 0.00547 BTC, or about 427 USD worth of position. That’s how you keep your risk at 1%, even with a position worth more than 10 USD.
4️⃣ Only enter trades with a risk/reward ratio of at least 1:2: with 1,828 USD at risk, the minimum target is 78,028 + 3,656 = 81,684 USD—just below weekly resistance. If the target doesn’t reach that level, don’t enter.
Why is this better than going all-in? With the same 1,000 USD fully invested, a drop to support would cost about 22 USD—more than double the risk under the 1% rule. Ten small stops cost 100 USD and keep you in the game; one poorly calculated all-in trade can knock you out in a single day.
Preserving capital is strategy number one. Without capital, there’s no next opportunity. Educational content, not financial advice.
#Bitcoin #GestaoDeRisco #CryptoVision
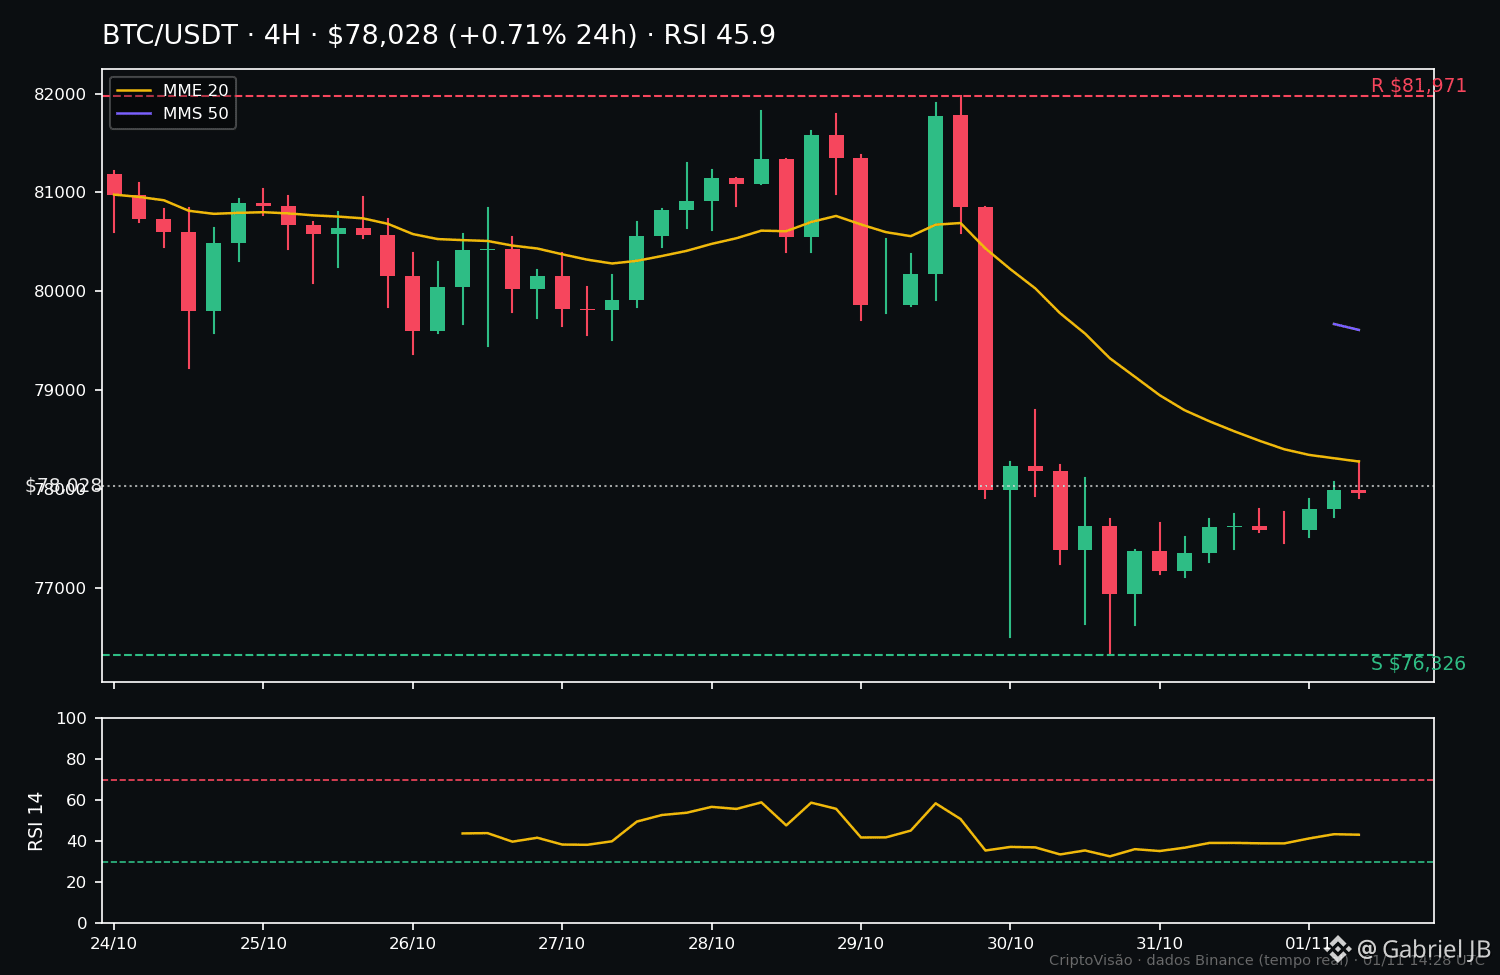
9
·
--
📊 $SOL testing 7-day support
SITUATION: SOL is trading around $94.90, down 1.3% over the last 24 hours and 7.2% over the last 7 days, below the 20- and 50-period moving averages (4h). The RSI-14 is at 34.5—near oversold territory, but with no reversal confirmation yet.
LEVELS: 7-day support at $92.34; immediate resistance at the moving averages ($96.86 and $99.55), with the 7-day ceiling at $103.85.
SCENARIO A — support holds: if the price holds above $92.34 and the RSI rebounds from 34, the path opens for a test of the moving averages, first at $96.86.
SCENARIO B — support breaks: a 4h candle close below $92.34 would invalidate the defense and open the way for buyers to be sought again at lower levels.
WHAT WOULD CONFIRM IT: a 4h candle close above $96.86 with volume backing it, or, in the opposite direction, a close below $92.34.
RISK: altcoins are more volatile and have wider spreads than BTC—a stop that is too tight can easily be swept by market noise. Size your position according to the risk you are willing to take and avoid excessive leverage.
CONCLUSION: a support-test setup with the RSI in a relevant zone—interesting to watch, but with no trigger yet. Observe the closes of the next 4h candles before making any decisions.
This is educational analysis, not financial advice.
#Solana #CryptoVision
📊 $SOL testing 7-day support
SITUATION: SOL is trading around $94.90, down 1.3% over the last 24 hours and 7.2% over the last 7 days, below the 20- and 50-period moving averages (4h). The RSI-14 is at 34.5—near oversold territory, but with no reversal confirmation yet.
LEVELS: 7-day support at $92.34; immediate resistance at the moving averages ($96.86 and $99.55), with the 7-day ceiling at $103.85.
SCENARIO A — support holds: if the price holds above $92.34 and the RSI rebounds from 34, the path opens for a test of the moving averages, first at $96.86.
SCENARIO B — support breaks: a 4h candle close below $92.34 would invalidate the defense and open the way for buyers to be sought again at lower levels.
WHAT WOULD CONFIRM IT: a 4h candle close above $96.86 with volume backing it, or, in the opposite direction, a close below $92.34.
RISK: altcoins are more volatile and have wider spreads than BTC—a stop that is too tight can easily be swept by market noise. Size your position according to the risk you are willing to take and avoid excessive leverage.
CONCLUSION: a support-test setup with the RSI in a relevant zone—interesting to watch, but with no trigger yet. Observe the closes of the next 4h candles before making any decisions.
This is educational analysis, not financial advice.
#Solana #CryptoVision
SITUATION: SOL is trading around $94.90, down 1.3% over the last 24 hours and 7.2% over the last 7 days, below the 20- and 50-period moving averages (4h). The RSI-14 is at 34.5—near oversold territory, but with no reversal confirmation yet.
LEVELS: 7-day support at $92.34; immediate resistance at the moving averages ($96.86 and $99.55), with the 7-day ceiling at $103.85.
SCENARIO A — support holds: if the price holds above $92.34 and the RSI rebounds from 34, the path opens for a test of the moving averages, first at $96.86.
SCENARIO B — support breaks: a 4h candle close below $92.34 would invalidate the defense and open the way for buyers to be sought again at lower levels.
WHAT WOULD CONFIRM IT: a 4h candle close above $96.86 with volume backing it, or, in the opposite direction, a close below $92.34.
RISK: altcoins are more volatile and have wider spreads than BTC—a stop that is too tight can easily be swept by market noise. Size your position according to the risk you are willing to take and avoid excessive leverage.
CONCLUSION: a support-test setup with the RSI in a relevant zone—interesting to watch, but with no trigger yet. Observe the closes of the next 4h candles before making any decisions.
This is educational analysis, not financial advice.
#Solana #CryptoVision
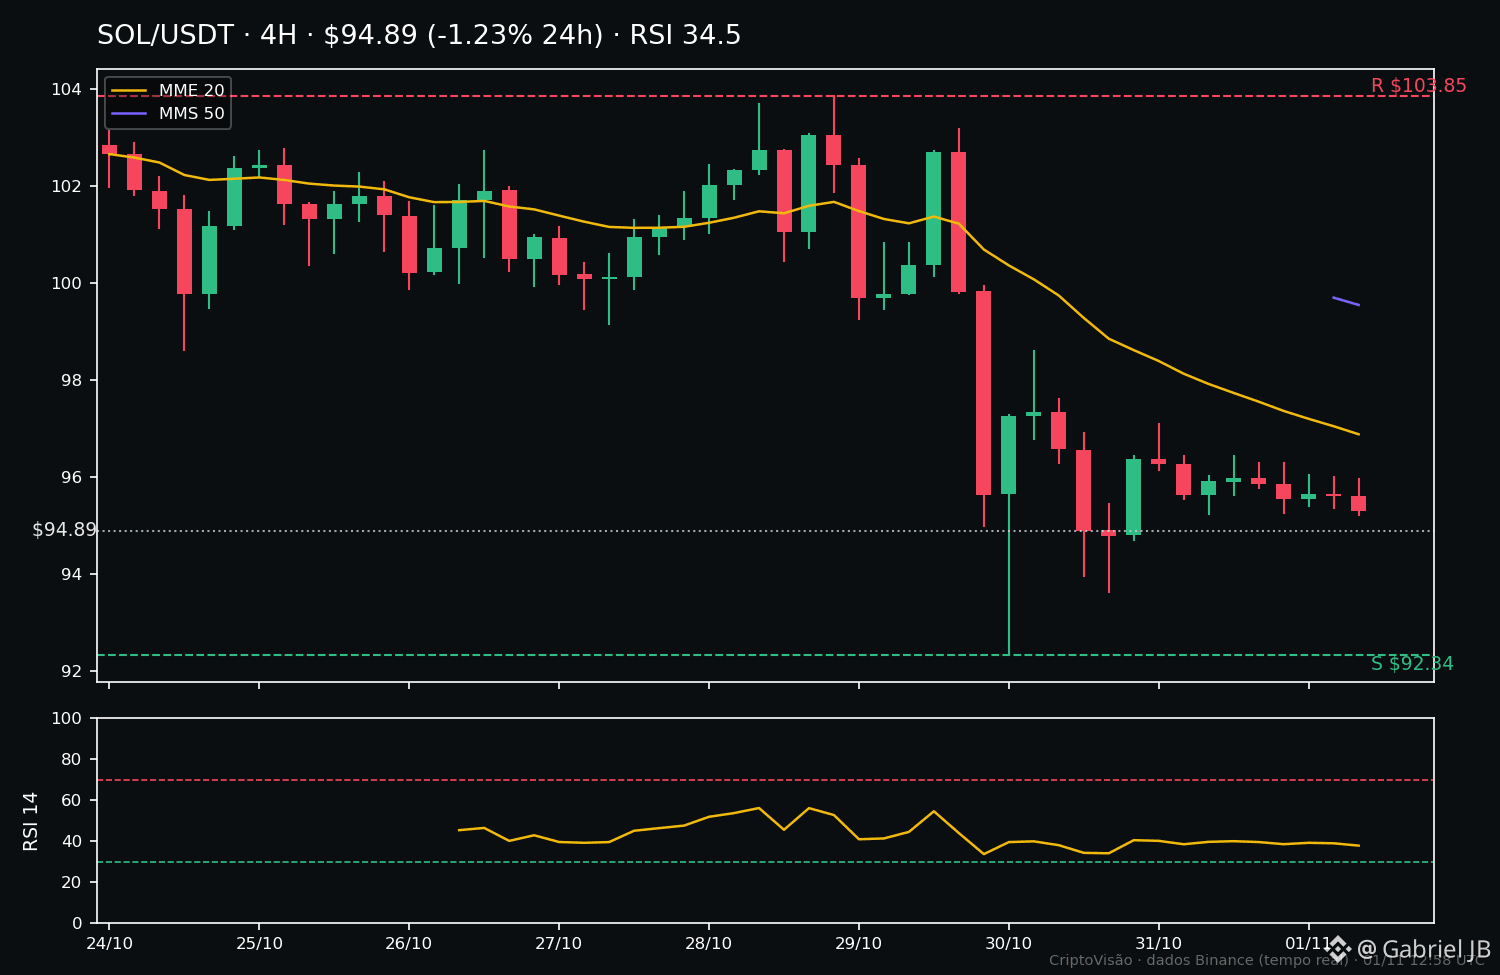
16
Log in to explore more content
Join global crypto users on Binance Square
⚡️ Get latest and useful information about crypto.
💬 Trusted by the world’s largest crypto exchange.
👍 Discover real insights from verified creators.
Email / Phone number
Trending Topics
1
#JobsReportRaisesHikeOdds
229,293 views
1,844 Discussing
2
#CPITestsDecemberRateOutlook
13,318 views
199 Discussing
3
#BitcoinRebounds$75KAsChipsLead
19,683 views
210 Discussing
4
#US Data Center Rules May Constrain AI Expansion
36,148 views
148 Discussing
5
#ARKPlans14ThematicETFsCoveringAIAndTokenizedMarkets
100 views
4 Discussing
6
#WillAnthropicListOnTime
53,924 views
702 Discussing
7
#WillUS-IranTensionsBoostSafe-HavenDemand?
7,064 views
70 Discussing
8
#BitcoinETFsSee$412MNetOutflows
2,091 views
43 Discussing
9
#HKSFCPlansToRestrictCryptoAndExchangeTerms
10,108 views
189 Discussing
10
#TradFiForBeginners
36,259 views
546 Discussing