
#cohr
cohr
38,402 views
378 Discussing
Hot
Latest

$COHR rose 6% intraday, quoted at 282.41. Trading volume was nearly eight million dollars, and open interest was a little over 28,000. Funding rates went to zero, so neither longs nor shorts are paying the other side for now.
In my view, this rally is closely tied to rising expectations of geopolitical tension. Semiconductors are the choke point for defense and high-end manufacturing, and any hint of supply chain security concerns or technology restrictions tends to push money into these hard assets. COHR was simply picked at this point in time.
But a zero funding rate means long and short forces are currently balanced. This 6% move lacks follow-through funding-cost support and is driven purely by sentiment and events. Open interest did not show a sharp surge, which suggests incremental funds are still on the sidelines.
The strongest counterargument is that if the geopolitical situation does not materially escalate further, or if market risk appetite shifts quickly, this event-driven premium will fade fast. Those chasing it now may just be paying for sentiment.
My action is very clear: if you want to trade it, you can try a small long position near the current price, but the stop loss must be strictly set below 275. A break below 275 means this sentiment-driven move has completely failed, and you should exit immediately without hesitation. If the price can hold above 280 and open interest rises modestly, then consider adding. At this level, the risk-reward is not suitable for a large directional bet.
Trade tag: #TradFi #链上美股 #COHR
Where do you think this judgment is most likely to be wrong?
In my view, this rally is closely tied to rising expectations of geopolitical tension. Semiconductors are the choke point for defense and high-end manufacturing, and any hint of supply chain security concerns or technology restrictions tends to push money into these hard assets. COHR was simply picked at this point in time.
But a zero funding rate means long and short forces are currently balanced. This 6% move lacks follow-through funding-cost support and is driven purely by sentiment and events. Open interest did not show a sharp surge, which suggests incremental funds are still on the sidelines.
The strongest counterargument is that if the geopolitical situation does not materially escalate further, or if market risk appetite shifts quickly, this event-driven premium will fade fast. Those chasing it now may just be paying for sentiment.
My action is very clear: if you want to trade it, you can try a small long position near the current price, but the stop loss must be strictly set below 275. A break below 275 means this sentiment-driven move has completely failed, and you should exit immediately without hesitation. If the price can hold above 280 and open interest rises modestly, then consider adding. At this level, the risk-reward is not suitable for a large directional bet.
Trade tag: #TradFi #链上美股 #COHR
Where do you think this judgment is most likely to be wrong?
COHR rose 6% in 24 hours, pushing it to 282. This move was driven entirely by geopolitical news, with semiconductors catching both a risk-off bid and policy-expectation tailwinds.
But don’t rush to chase it. The funding rate is 0, meaning neither longs nor shorts are paying, which suggests institutional money hasn’t really stepped in. This whole move is just retail sentiment trading; open interest is only 28,000, and liquidity is paper-thin. The last time semiconductors were hyped on a similar political event, a trend only formed after the funding rate turned positive. Right now, this zero-rate setup is just a castle in the air.
My contrarian view: chasing longs now is just throwing yourself into the grinder. Wait for two signals. Either the funding rate turns positive and rises above 0.01%, confirming institutional follow-through, and I’ll try a long at 283 with a stop at 275, targeting the previous high at 295. Or it breaks below 275 outright, showing the political premium has fully unwound, then I’ll flip short. A 6% single-day swing in the futures market isn’t that big, but when liquidity is poor, even a small order can punch a hole in the chart.
Trading tag: #TradFi #链上美股 #COHR
Where do you think this judgment is most likely to be wrong?
But don’t rush to chase it. The funding rate is 0, meaning neither longs nor shorts are paying, which suggests institutional money hasn’t really stepped in. This whole move is just retail sentiment trading; open interest is only 28,000, and liquidity is paper-thin. The last time semiconductors were hyped on a similar political event, a trend only formed after the funding rate turned positive. Right now, this zero-rate setup is just a castle in the air.
My contrarian view: chasing longs now is just throwing yourself into the grinder. Wait for two signals. Either the funding rate turns positive and rises above 0.01%, confirming institutional follow-through, and I’ll try a long at 283 with a stop at 275, targeting the previous high at 295. Or it breaks below 275 outright, showing the political premium has fully unwound, then I’ll flip short. A 6% single-day swing in the futures market isn’t that big, but when liquidity is poor, even a small order can punch a hole in the chart.
Trading tag: #TradFi #链上美股 #COHR
Where do you think this judgment is most likely to be wrong?
$COHR 24 hours up 6%, funding rate is still zero. The move is strong, but longs and shorts aren’t really fighting, which doesn’t look like a pure sentiment-driven trade.
With political and military events escalating, semiconductor supply chains are a classic sector that gets priced for risk. COHR’s core business has defense exposure, and the market is already starting to assign it a geopolitical premium. A zero funding rate means that in this rally, longs haven’t become crowded, and shorts haven’t been squeezed to the wall. Looking at the single signal, price is rising while funding stays neutral, which looks more like specific capital making a targeted bet rather than retail FOMO.
The bearish case is simple: if tensions ease, the money betting on geopolitical risk will leave faster than anything else. Looking one step further, if conflict becomes the norm, institutions may rotate from pure AI compute stocks into semiconductor companies with defense-related backgrounds.
The point where my view would fail is price. If it breaks below 260, meaning most of the recent gains have been given back, then the geopolitical premium story is no longer working and I have to get out.
Action: I wouldn’t chase here. Wait for a pullback into the 275-280 range to enter, and keep a hard stop at 260. On the upside, first target is the round-number 300 level.
Trade tag: #TradFi #链上美股 #COHR
Where do you think this whole thesis is most likely to be wrong?
With political and military events escalating, semiconductor supply chains are a classic sector that gets priced for risk. COHR’s core business has defense exposure, and the market is already starting to assign it a geopolitical premium. A zero funding rate means that in this rally, longs haven’t become crowded, and shorts haven’t been squeezed to the wall. Looking at the single signal, price is rising while funding stays neutral, which looks more like specific capital making a targeted bet rather than retail FOMO.
The bearish case is simple: if tensions ease, the money betting on geopolitical risk will leave faster than anything else. Looking one step further, if conflict becomes the norm, institutions may rotate from pure AI compute stocks into semiconductor companies with defense-related backgrounds.
The point where my view would fail is price. If it breaks below 260, meaning most of the recent gains have been given back, then the geopolitical premium story is no longer working and I have to get out.
Action: I wouldn’t chase here. Wait for a pullback into the 275-280 range to enter, and keep a hard stop at 260. On the upside, first target is the round-number 300 level.
Trade tag: #TradFi #链上美股 #COHR
Where do you think this whole thesis is most likely to be wrong?

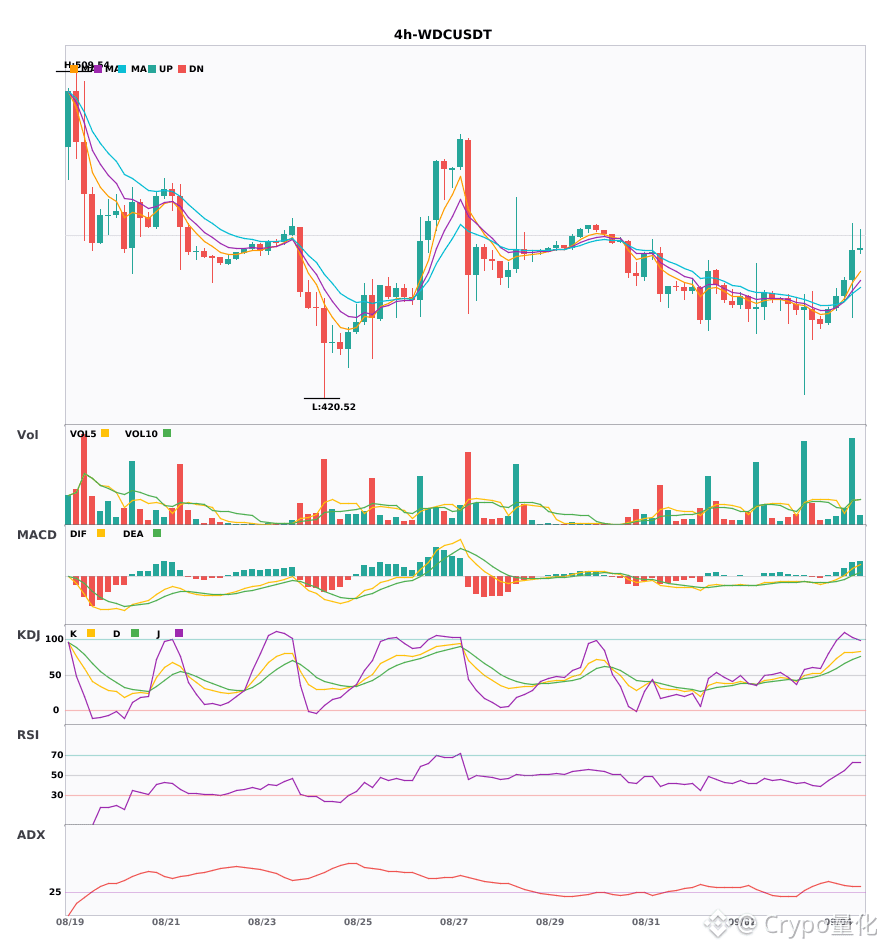
$AMAT $WDC $COHR 4 hourly-level resonance is strengthening, who will break out first with price and volume coordination?
📈 $AMAT | 4-hour bullish signal
━━━━━━━━━━━━━━━━━━
Technical analysis: ADX(49) indicates a very strong trend, with overheating and pullback risk; MACD is in a bullish run, volume supports the EMA5>EMA8>EMA13 bullish structure, and KDJ remains strong (K81.5/D68.2), with volume expanding to 3.3x.
Price change: 1.3800%
📈 $WDC | 4-hour bullish signal
━━━━━━━━━━━━━━━━━━
Technical analysis: ADX reaches 33, showing a clear trend; MACD is in a bullish structure, with volume continuing to expand; EMA5>EMA8>EMA13 shows a bullish alignment; KDJ remains strong (K81.9,D71.8); volume expands to 3.5x, with ample bullish momentum.
Price change: 1.7700%
📌 Market update: Binance will support cash dividend distributions for Western Digital (WDC) and NVIDIA (NVDA) through bStocks.
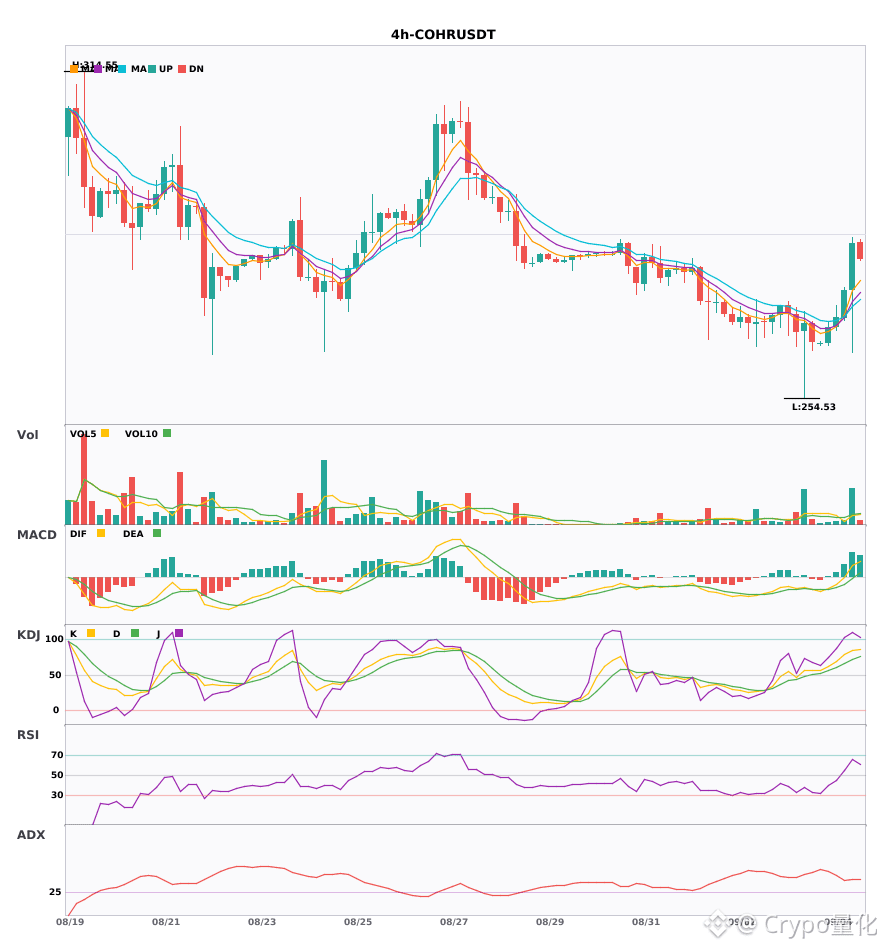
📈 $COHR | 4-hour bullish signal
━━━━━━━━━━━━━━━━━━
Technical analysis: ADX(39) indicates a clear trending market; MACD is running bullish, with strengthening momentum; EMA shows a 5>8>13 bullish alignment; KDJ is operating in a strong zone, with K value 84.5 and D value 72.3; volume has significantly expanded to 3.4x.
Price change: 3.1800%
━━━━━━━━━━━━━━━━━━
#技术分析 #AMAT #WDC #COHR
📌 The above content is for reference only and does not constitute investment advice
📈 $AMAT | 4-hour bullish signal
━━━━━━━━━━━━━━━━━━
Technical analysis: ADX(49) indicates a very strong trend, with overheating and pullback risk; MACD is in a bullish run, volume supports the EMA5>EMA8>EMA13 bullish structure, and KDJ remains strong (K81.5/D68.2), with volume expanding to 3.3x.
Price change: 1.3800%
📈 $WDC | 4-hour bullish signal
━━━━━━━━━━━━━━━━━━
Technical analysis: ADX reaches 33, showing a clear trend; MACD is in a bullish structure, with volume continuing to expand; EMA5>EMA8>EMA13 shows a bullish alignment; KDJ remains strong (K81.9,D71.8); volume expands to 3.5x, with ample bullish momentum.
Price change: 1.7700%
📌 Market update: Binance will support cash dividend distributions for Western Digital (WDC) and NVIDIA (NVDA) through bStocks.
📈 $COHR | 4-hour bullish signal
━━━━━━━━━━━━━━━━━━
Technical analysis: ADX(39) indicates a clear trending market; MACD is running bullish, with strengthening momentum; EMA shows a 5>8>13 bullish alignment; KDJ is operating in a strong zone, with K value 84.5 and D value 72.3; volume has significantly expanded to 3.4x.
Price change: 3.1800%
━━━━━━━━━━━━━━━━━━
#技术分析 #AMAT #WDC #COHR
📌 The above content is for reference only and does not constitute investment advice
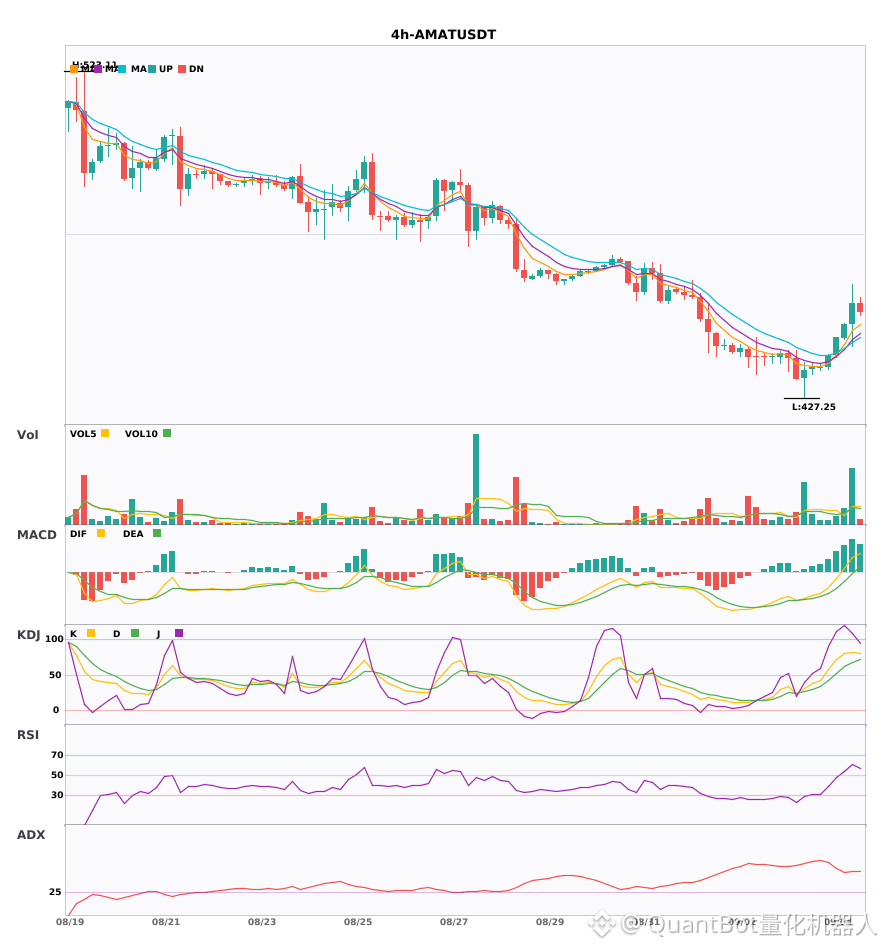
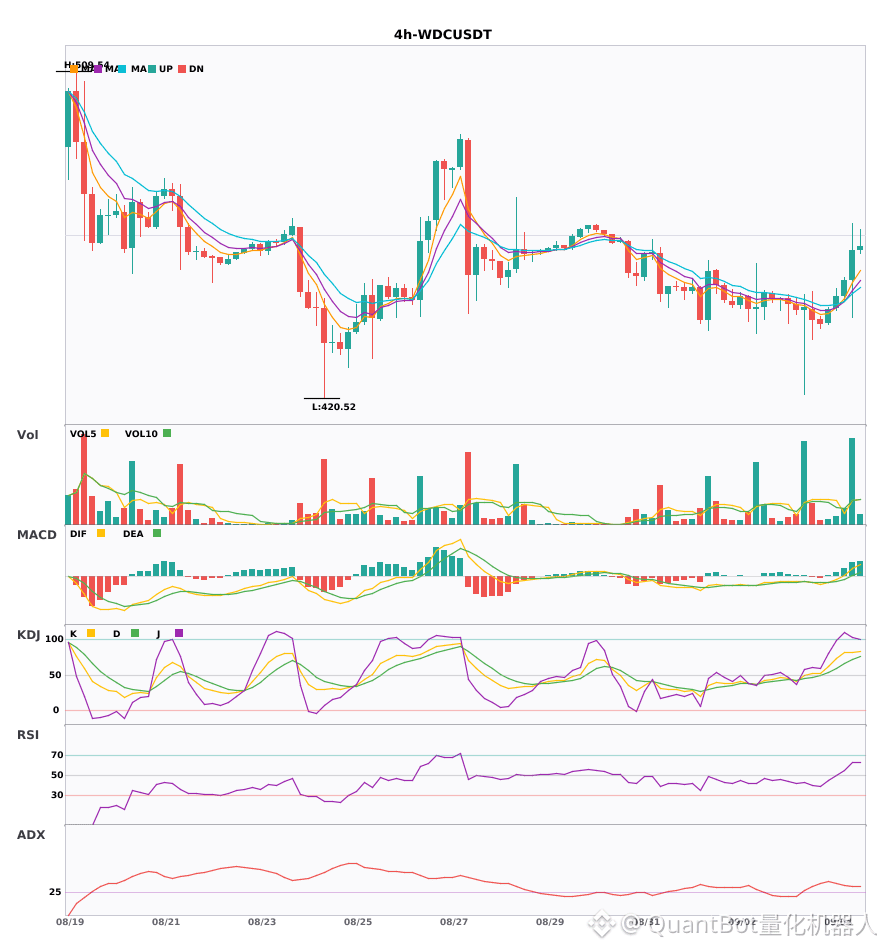
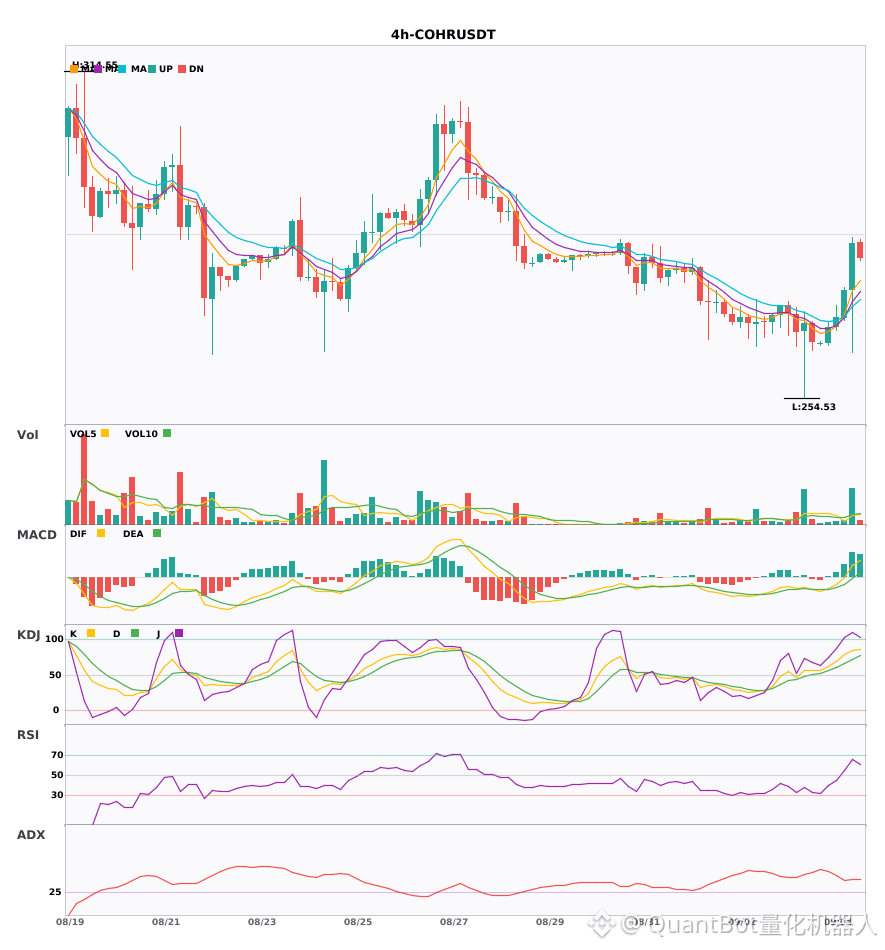

4-hour three-coin resonance turns bullish, moving averages are in a bullish alignment, MACD golden cross with expanding red bars🔥
════════════════════
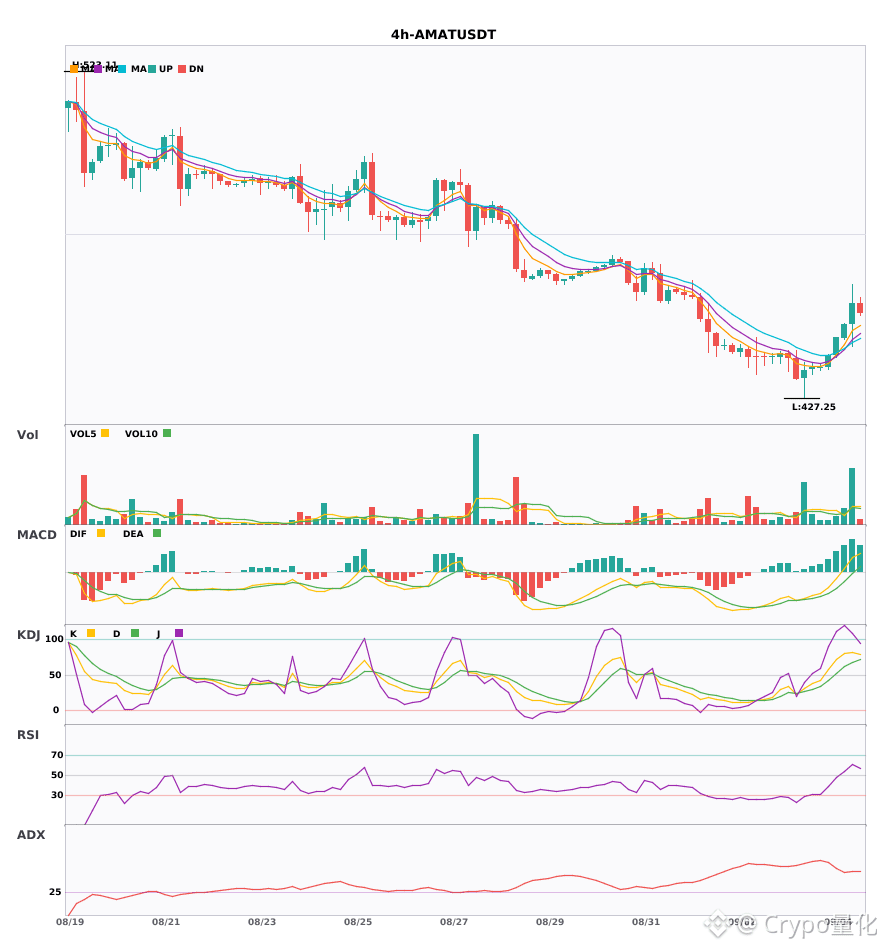
🔴 $AMAT 4-hour bullish signal
⚠️Technical analysis: This coin’s trend is insanely strong, with ADX surging to 49, so be careful not to chase highs and get trapped. After the MACD golden cross, the red bars keep getting longer, showing strong momentum. The 5, 8, and 13 moving averages are in a bullish alignment and spreading upward, moving very nicely. K in the KDJ crossed above D, with K at 81.5 and still not in the overbought zone. Trading volume exploded by 3.3x, with funds pouring in.
════════════════════
🔴 $WDC 4-hour bullish signal
⚠️Technical analysis: ADX is 33, indicating a clear trend. After the MACD golden cross, the red bars got longer, showing bullish strength. The moving averages are in a bullish alignment and moving upward. In KDJ, K is at 81.9 and D is at 71.8, remaining strong without entering the overbought zone. Trading volume exploded by 3.5x.
📢Market update: Binance will support cash dividend distributions for Western Digital (WDC) and Nvidia (NVDA) through bStocks.
════════════════════
🔴 $COHR 4-hour bullish signal
⚠️Technical analysis: ADX 39 indicates a clear trend. MACD bullish momentum is increasing with longer red bars, the 5/8/13 moving averages are in a bullish spread upward, and KDJ K at 84.5 crossed above D at 72.3, staying strong and not overbought. Volume surged by 3.4x, bullish.
════════════════════
🔔 Follow to get first-hand market moves 🔔
#技术分析 #AMAT #WDC #COHR
📌 When trading, pay attention to whether the candlestick pattern matches
════════════════════
🔴 $AMAT 4-hour bullish signal
⚠️Technical analysis: This coin’s trend is insanely strong, with ADX surging to 49, so be careful not to chase highs and get trapped. After the MACD golden cross, the red bars keep getting longer, showing strong momentum. The 5, 8, and 13 moving averages are in a bullish alignment and spreading upward, moving very nicely. K in the KDJ crossed above D, with K at 81.5 and still not in the overbought zone. Trading volume exploded by 3.3x, with funds pouring in.
════════════════════
🔴 $WDC 4-hour bullish signal
⚠️Technical analysis: ADX is 33, indicating a clear trend. After the MACD golden cross, the red bars got longer, showing bullish strength. The moving averages are in a bullish alignment and moving upward. In KDJ, K is at 81.9 and D is at 71.8, remaining strong without entering the overbought zone. Trading volume exploded by 3.5x.
📢Market update: Binance will support cash dividend distributions for Western Digital (WDC) and Nvidia (NVDA) through bStocks.
════════════════════
🔴 $COHR 4-hour bullish signal
⚠️Technical analysis: ADX 39 indicates a clear trend. MACD bullish momentum is increasing with longer red bars, the 5/8/13 moving averages are in a bullish spread upward, and KDJ K at 84.5 crossed above D at 72.3, staying strong and not overbought. Volume surged by 3.4x, bullish.
════════════════════
🔔 Follow to get first-hand market moves 🔔
#技术分析 #AMAT #WDC #COHR
📌 When trading, pay attention to whether the candlestick pattern matches
$COHR 24-hour increase of 6.002%, price stuck at 282.41, funding rate still zero, open interest at 28730.65. Political and military tensions are heating up, and the semiconductor sector is among the first to be hit, but the derivatives market is eerily quiet.
My判断 is that this is an event-driven false breakout. A zero funding rate means both longs and shorts are sitting still, with neither side willing to pay the other. Price has risen a bit, but open interest hasn’t surged along with it; this kind of move looks more like retail sentiment than real money entering.
The bearish counterargument is strong: if geopolitical conflict really escalates, the tech supply chain will be the first to crack, and semiconductor stocks will likely fall faster than anything else. Right now everyone is pretending nothing is wrong, but once a black swan appears, selling pressure could explode instantly.
The next key level to watch is 270. If it breaks below that, longs will be forced to cut positions, and shorts may seize the opportunity to slam the market down. But if it holds, shorts may not be able to withstand the zero-funding environment and could be squeezed out.
Invalidation condition: if price falls below 270, my bullish logic is done, and I’ll admit I was wrong. In practice, I’m taking a light long at the current price of 282, stop loss at 275, target 295, and keeping the position under 20%. The political-event bet is on panic stockpiling in the supply chain, but I’m ready to run at any time.
Trading tag: #TradFi #链上美股 #COHR
Where do you think this judgment is most likely to be wrong?
My判断 is that this is an event-driven false breakout. A zero funding rate means both longs and shorts are sitting still, with neither side willing to pay the other. Price has risen a bit, but open interest hasn’t surged along with it; this kind of move looks more like retail sentiment than real money entering.
The bearish counterargument is strong: if geopolitical conflict really escalates, the tech supply chain will be the first to crack, and semiconductor stocks will likely fall faster than anything else. Right now everyone is pretending nothing is wrong, but once a black swan appears, selling pressure could explode instantly.
The next key level to watch is 270. If it breaks below that, longs will be forced to cut positions, and shorts may seize the opportunity to slam the market down. But if it holds, shorts may not be able to withstand the zero-funding environment and could be squeezed out.
Invalidation condition: if price falls below 270, my bullish logic is done, and I’ll admit I was wrong. In practice, I’m taking a light long at the current price of 282, stop loss at 275, target 295, and keeping the position under 20%. The political-event bet is on panic stockpiling in the supply chain, but I’m ready to run at any time.
Trading tag: #TradFi #链上美股 #COHR
Where do you think this judgment is most likely to be wrong?
$COHR rose 6 points, but the funding rate stayed at zero, meaning neither longs nor shorts are paying. Spot is up, yet the futures market feels like it didn’t even notice.
This suggests the rally lacks consensus on the derivatives side. It may be driven by spot buying or an event impulse, while leveraged money hasn’t caught up yet. When the funding rate is zero, price is more likely to be dominated by spot flows; light futures positioning doesn’t mean it will unwind, but rather that if sentiment is later ignited, there is plenty of room for the funding rate to surge upward from zero.
The reverse is also true: if the spot bid is just a flash in the pan and no sustained capital comes in, price will quickly pull back, after all, the derivatives side isn’t providing any extra liquidity from stop-loss orders or short covering.
Next, watch whether anyone dares to add leverage and chase longs here. If spot flow continues, price stays above 280, and the funding rate starts turning positive, that would mean the futures market has begun to believe and follow. Otherwise, this 6% gain lacks a solid foundation.
Chasing longs right now has poor risk-reward. I’m waiting for two signals: if price retests around 275 and the funding rate is still zero, that’s a trial-long point, with a stop below 270. Or if price breaks straight above 290 and the funding rate spikes above 0.01, then I’ll follow the trend, which would mean sentiment has finally been ignited. At 282, stuck in the middle, I’ll keep my hands in my pockets and watch the show.
Trading tag: #TradFi #链上美股 #COHR
Where do you think this whole judgment is most likely to be wrong?
This suggests the rally lacks consensus on the derivatives side. It may be driven by spot buying or an event impulse, while leveraged money hasn’t caught up yet. When the funding rate is zero, price is more likely to be dominated by spot flows; light futures positioning doesn’t mean it will unwind, but rather that if sentiment is later ignited, there is plenty of room for the funding rate to surge upward from zero.
The reverse is also true: if the spot bid is just a flash in the pan and no sustained capital comes in, price will quickly pull back, after all, the derivatives side isn’t providing any extra liquidity from stop-loss orders or short covering.
Next, watch whether anyone dares to add leverage and chase longs here. If spot flow continues, price stays above 280, and the funding rate starts turning positive, that would mean the futures market has begun to believe and follow. Otherwise, this 6% gain lacks a solid foundation.
Chasing longs right now has poor risk-reward. I’m waiting for two signals: if price retests around 275 and the funding rate is still zero, that’s a trial-long point, with a stop below 270. Or if price breaks straight above 290 and the funding rate spikes above 0.01, then I’ll follow the trend, which would mean sentiment has finally been ignited. At 282, stuck in the middle, I’ll keep my hands in my pockets and watch the show.
Trading tag: #TradFi #链上美股 #COHR
Where do you think this whole judgment is most likely to be wrong?
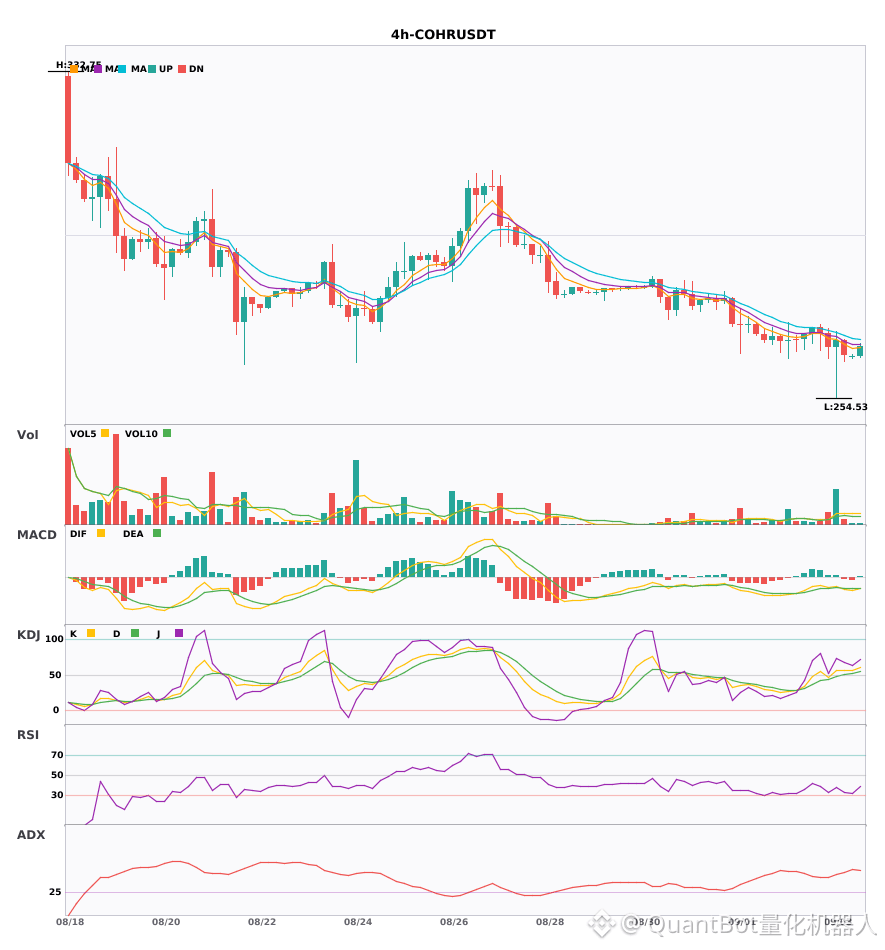
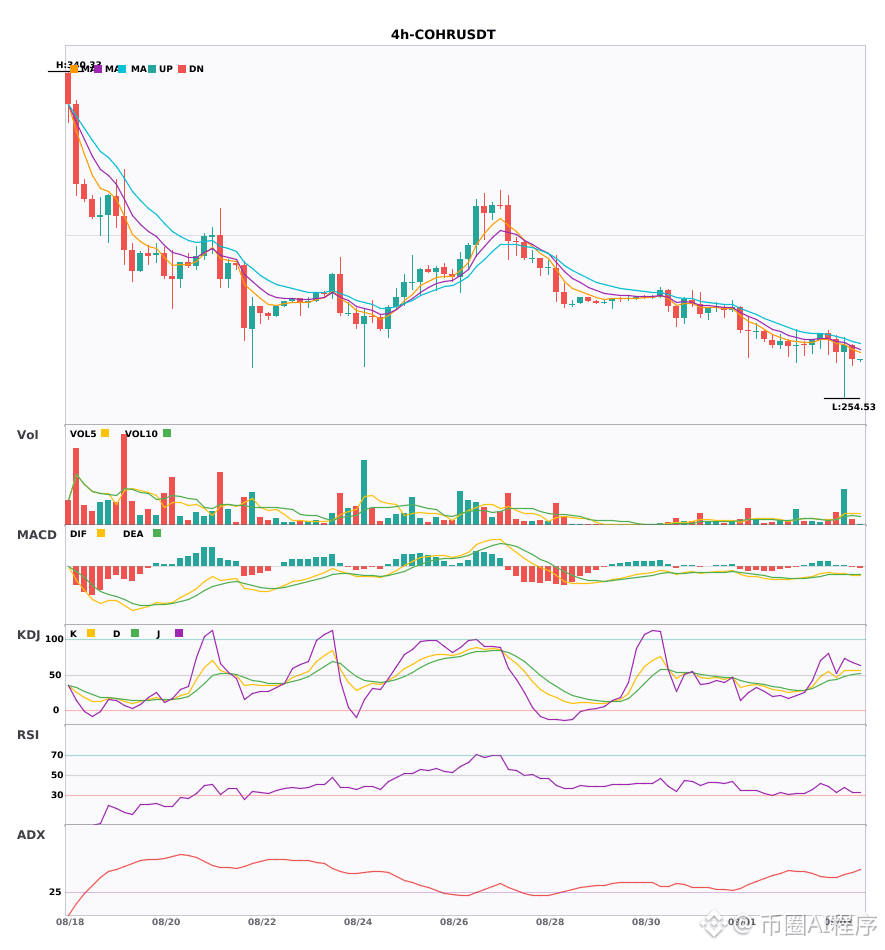
$COHR 4H level bearish structure continues Pressure downward in the short term
📉 $COHR | 4-hour Bearish signal
━━━━━━━━━━━━━━━━━━
Technical Analysis: ADX is up to 48, the trend is strong and needs caution against overheating pullbacks; MACD has a bearish dead cross below zero, amplifying bearish momentum; EMA5/8/13 are in a bearish alignment; KDJ remains strong, with K56.3 and D50.8 slightly bullish; Trading volume has surged to 4 times.
Price Movement: -1.3400%
━━━━━━━━━━━━━━━━━━
#技术分析 #COHR
📌 The above content is for reference only and does not constitute investment advice
📉 $COHR | 4-hour Bearish signal
━━━━━━━━━━━━━━━━━━
Technical Analysis: ADX is up to 48, the trend is strong and needs caution against overheating pullbacks; MACD has a bearish dead cross below zero, amplifying bearish momentum; EMA5/8/13 are in a bearish alignment; KDJ remains strong, with K56.3 and D50.8 slightly bullish; Trading volume has surged to 4 times.
Price Movement: -1.3400%
━━━━━━━━━━━━━━━━━━
#技术分析 #COHR
📌 The above content is for reference only and does not constitute investment advice
COHR four-hour dead cross, short-term is about to get smashed 🔥
════════════════════
🟢 $COHR 4-hour bearish signal
⚠️ Technicals: ADX has surged to 48—trend strength is really “hot”; watch out for a pullback. MACD is in a negative dead cross—shorts are adding positions. Moving averages are arranged bearishly and pressing downward. KDJ favors bulls, but it’s not overbought yet. Trading volume has surged 4x directly—this is intense.
════════════════════
🔔 Watch for real-time market jitters first-hand 🔔
#技术分析 #COHR
📌 When trading, pay attention to whether the candlestick pattern matches
════════════════════
🟢 $COHR 4-hour bearish signal
⚠️ Technicals: ADX has surged to 48—trend strength is really “hot”; watch out for a pullback. MACD is in a negative dead cross—shorts are adding positions. Moving averages are arranged bearishly and pressing downward. KDJ favors bulls, but it’s not overbought yet. Trading volume has surged 4x directly—this is intense.
════════════════════
🔔 Watch for real-time market jitters first-hand 🔔
#技术分析 #COHR
📌 When trading, pay attention to whether the candlestick pattern matches
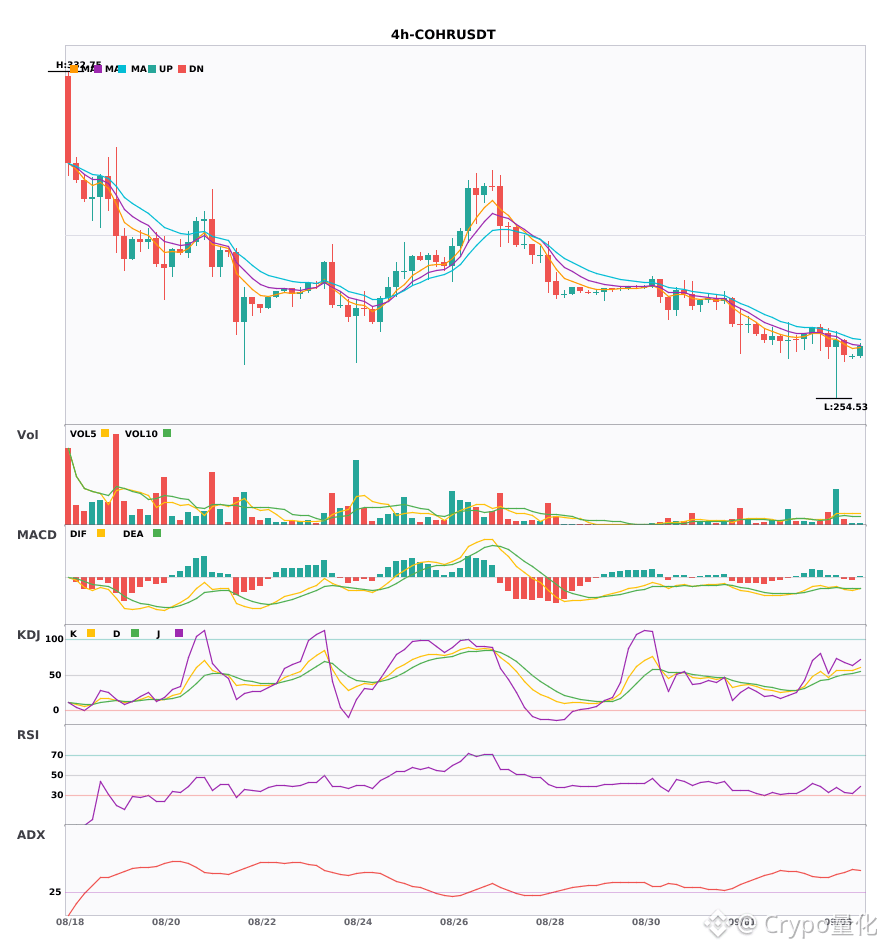
$WDC / $LITE / $COHR 4 hourly level is about to fall; the short-term support can’t hold 🔥
════════════════════
🟢 $WDC 4 hourly Bearish Signal
⚠️ Technicals: DOGE is dropping hard right now. The MACD has formed a dead cross below the zero line, moving averages are arranged bearishly, and volume has surged to 3.9x—clearly an accelerating downtrend.
════════════════════
🟢 $LITE 4 hourly Bearish Signal
⚠️ Technicals: ADX has spiked to 31, and the direction is very clear. MACD dead cross below zero—shorts are accelerating the sell-off. The 5/8/13 moving averages are all in a bearish alignment, pushing downward. KDJ is weak, with bears in control: K = 46.7, D = 41.4. Volume exploded to 4.3x, and the down move is still accelerating.
════════════════════
🟢 $COHR 4 hourly Bearish Signal
⚠️ Technicals: ADX is as high as 48—trend is strong, but watch out for a pullback. MACD dead cross below zero—shorts are accelerating the sell-off. Moving averages diverge bearishly to the downside. KDJ favors bulls, but K at 56 isn’t overbought. Volume is up 4x!
════════════════════
🔔 Watch for first-hand market moves and anomalies 🔔
#技术分析 #WDC #LITE #COHR
📌 When trading, pay attention to whether the candlestick patterns match the situation
════════════════════
🟢 $WDC 4 hourly Bearish Signal
⚠️ Technicals: DOGE is dropping hard right now. The MACD has formed a dead cross below the zero line, moving averages are arranged bearishly, and volume has surged to 3.9x—clearly an accelerating downtrend.
════════════════════
🟢 $LITE 4 hourly Bearish Signal
⚠️ Technicals: ADX has spiked to 31, and the direction is very clear. MACD dead cross below zero—shorts are accelerating the sell-off. The 5/8/13 moving averages are all in a bearish alignment, pushing downward. KDJ is weak, with bears in control: K = 46.7, D = 41.4. Volume exploded to 4.3x, and the down move is still accelerating.
════════════════════
🟢 $COHR 4 hourly Bearish Signal
⚠️ Technicals: ADX is as high as 48—trend is strong, but watch out for a pullback. MACD dead cross below zero—shorts are accelerating the sell-off. Moving averages diverge bearishly to the downside. KDJ favors bulls, but K at 56 isn’t overbought. Volume is up 4x!
════════════════════
🔔 Watch for first-hand market moves and anomalies 🔔
#技术分析 #WDC #LITE #COHR
📌 When trading, pay attention to whether the candlestick patterns match the situation
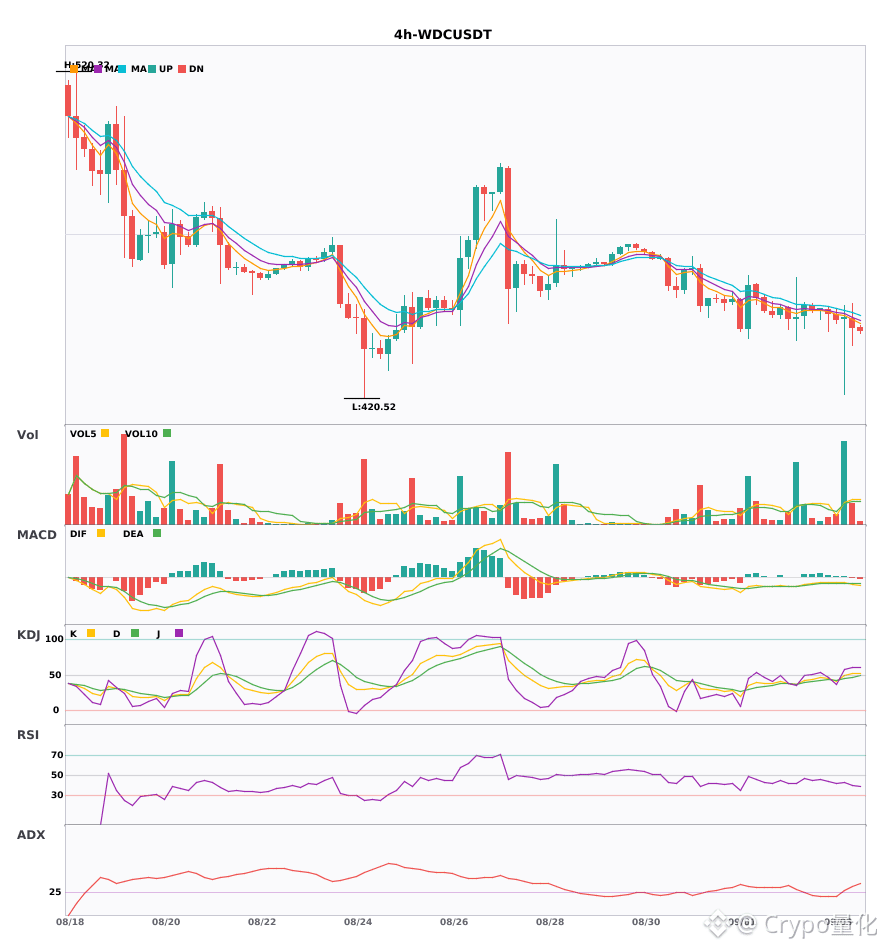
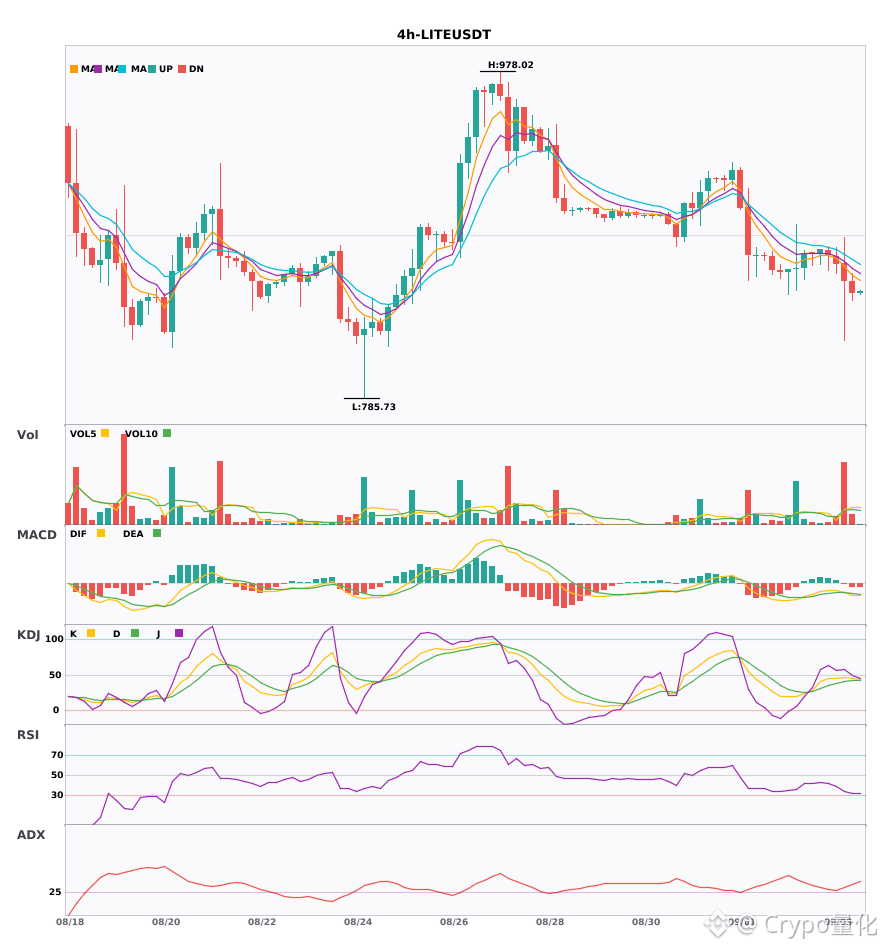
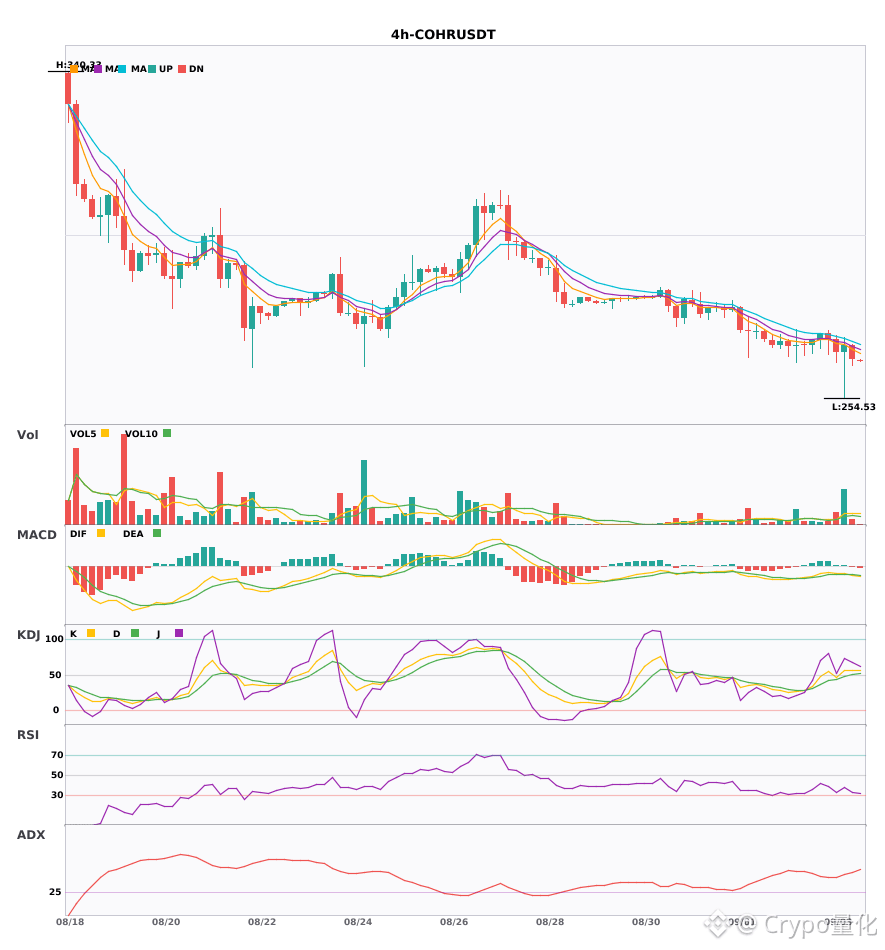

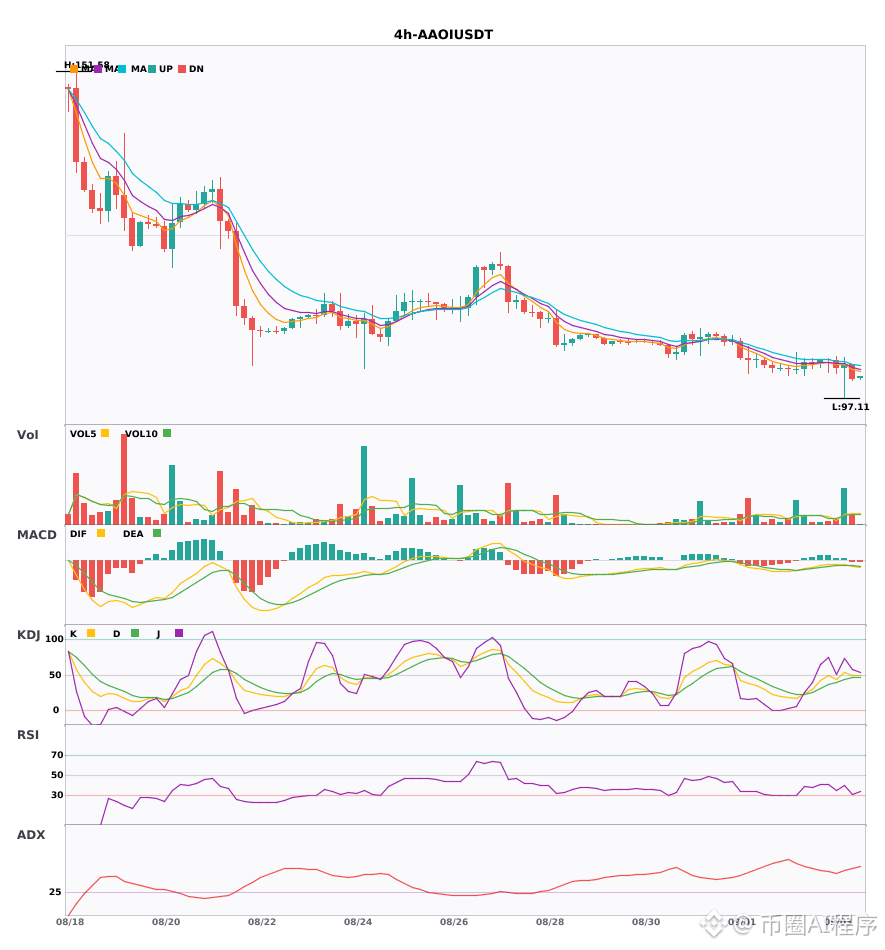
$WDC /$AAOI /$COHR 4-hour daily line: both double dead crosses with a volume spike and a heavy sell-off—run quickly🔥
════════════════════
🟢 $WDC 4 hours Bearish signal
⚠️ Technicals: The daily chart has already turned bearish; the 4-hour MACD is still accelerating after a dead cross below zero. The 5/8/13 moving averages are spreading to the downside, and volume has surged 3.9x. Multi-timeframe resonance points bearish.
════════════════════
🟢 $AAOI 4 hours Bearish signal
⚠️ Technicals: Both the daily and 4-hour charts are bearish. After the MACD dead cross, the green histogram bars are still expanding. The moving averages are diverging bearishly, and the KDJ is weak and hasn’t bottomed out yet. Volume is up by more than 3x—bearish power is strong. Don’t rush to bottom-fish.
════════════════════
🟢 $COHR 4 hours Bearish signal
⚠️ Technicals: The daily chart faces heavy bearish pressure. On the 4-hour chart, the MACD dead cross below zero is accelerating the sell-off. The 5/8/13 moving averages are spreading bearishly. However, the KDJ favors bulls and has expanded in volume—watch out for a rebound.
════════════════════
🔔 Follow for the first-hand updates on market anomalies 🔔
#多周期共振 #WDC #AAOI #COHR
📌 When trading, pay attention to whether the candlestick pattern matches
════════════════════
🟢 $WDC 4 hours Bearish signal
⚠️ Technicals: The daily chart has already turned bearish; the 4-hour MACD is still accelerating after a dead cross below zero. The 5/8/13 moving averages are spreading to the downside, and volume has surged 3.9x. Multi-timeframe resonance points bearish.
════════════════════
🟢 $AAOI 4 hours Bearish signal
⚠️ Technicals: Both the daily and 4-hour charts are bearish. After the MACD dead cross, the green histogram bars are still expanding. The moving averages are diverging bearishly, and the KDJ is weak and hasn’t bottomed out yet. Volume is up by more than 3x—bearish power is strong. Don’t rush to bottom-fish.
════════════════════
🟢 $COHR 4 hours Bearish signal
⚠️ Technicals: The daily chart faces heavy bearish pressure. On the 4-hour chart, the MACD dead cross below zero is accelerating the sell-off. The 5/8/13 moving averages are spreading bearishly. However, the KDJ favors bulls and has expanded in volume—watch out for a rebound.
════════════════════
🔔 Follow for the first-hand updates on market anomalies 🔔
#多周期共振 #WDC #AAOI #COHR
📌 When trading, pay attention to whether the candlestick pattern matches
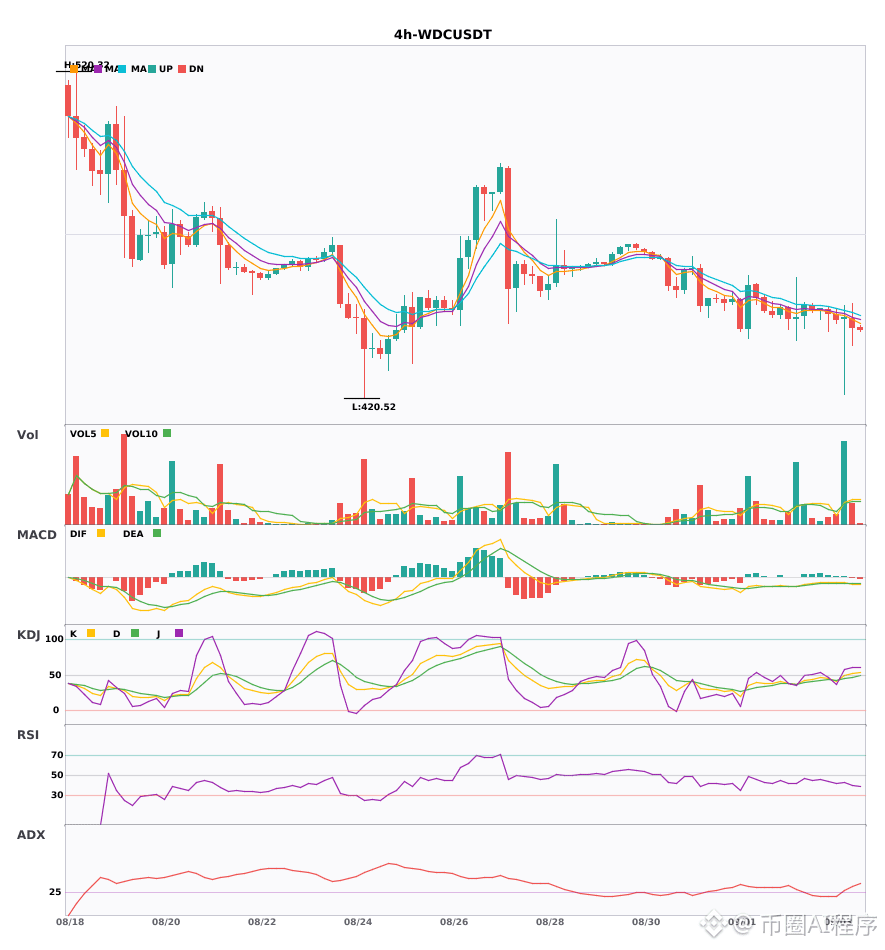

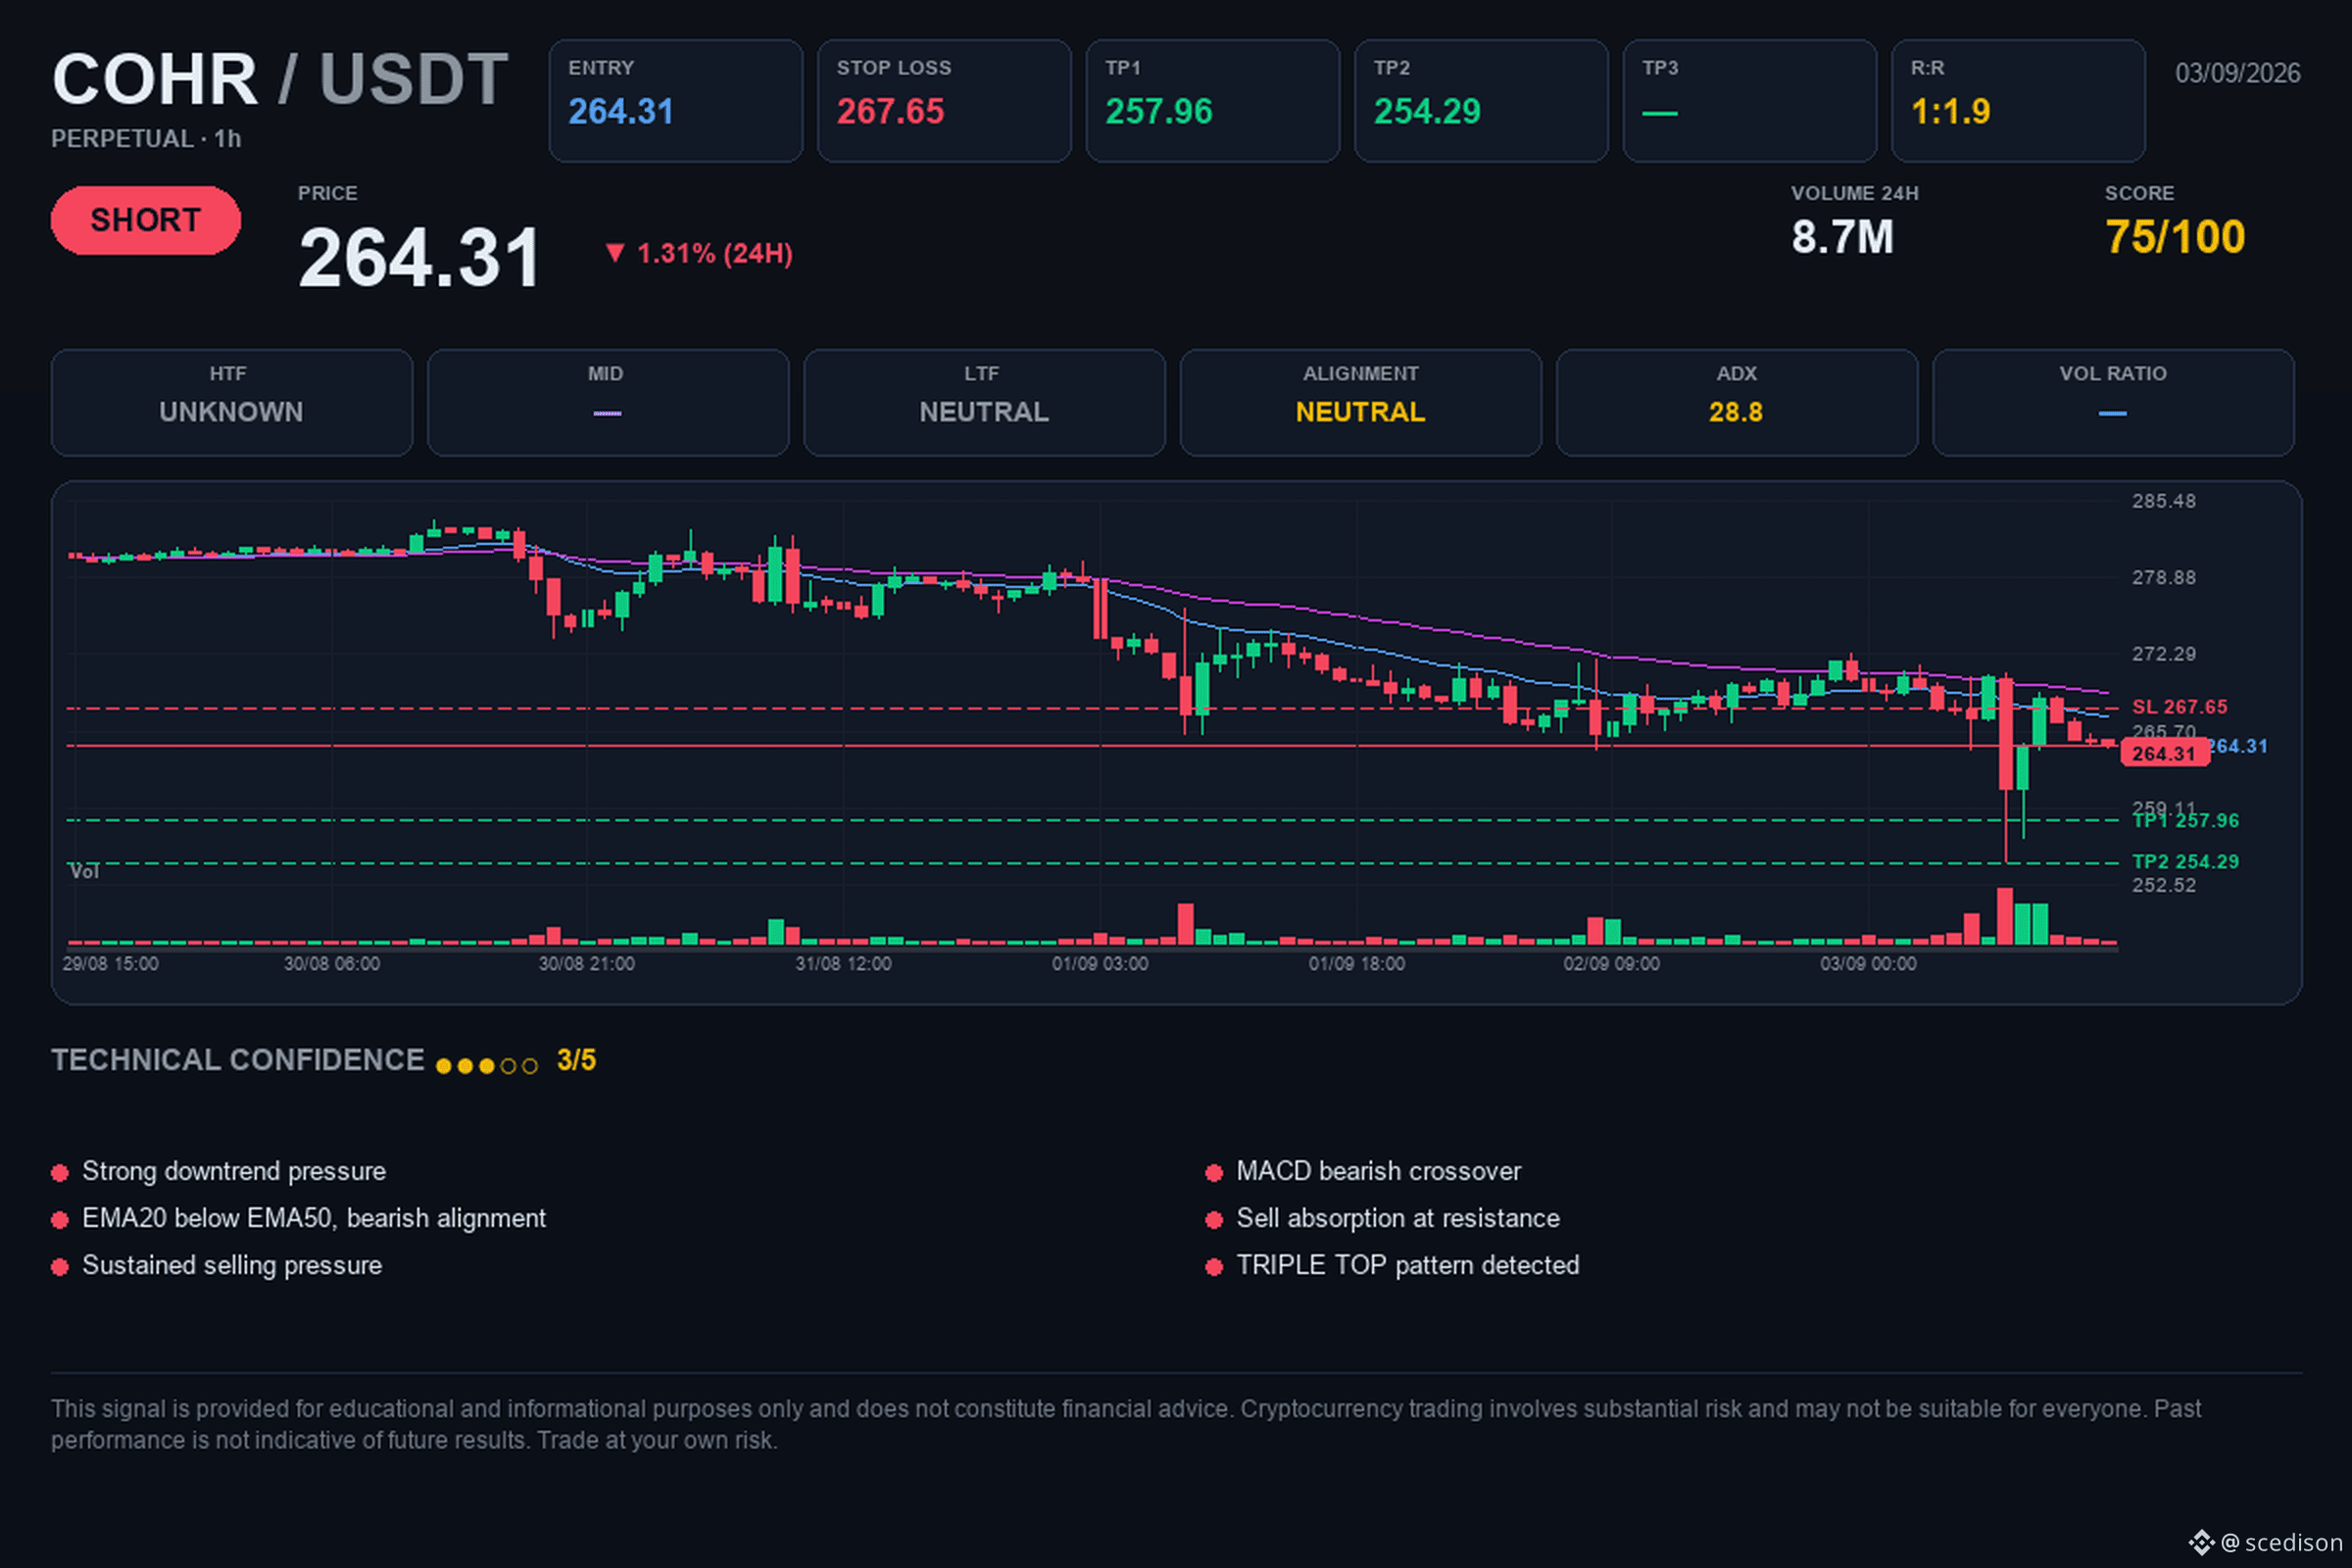
📢 $COHR / $USDT | 🔴 SHORT | ⭐ 75%
🎯 Target: $257.96. Is it still falling?
🎯 Trading levels:
🟢 Entry: $264.31
🛑 Stop Loss: $267.65
🏁 TP1: $257.96
🏁 TP2: $254.29
📉 Analysis:
The structure of $COHR shows a confirmed triple top with sustained selling pressure that invalidates attempts at recovery. The ADX of 28.76 confirms a solid bearish trend, while the bearish MACD cross (an indicator that measures the strength and direction of momentum) and the alignment of the moving averages with EMA20 below EMA50 reinforce the dominance of supply. The RSI at 43.44 (an index that measures the speed of price movement) still allows room for the decline to continue toward the support zone.
⚖️ Risk/Reward: 1:1.9
⏱️ Timeframe: 1H
📐 Technical confidence: 3/5
The invalidation level is set at the stop loss, protecting the position in case of a possible recovery of the short-term bullish structure. The bearish thesis remains valid as long as selling volume absorbs any attempt of a rebound from the immediate resistance.
What confirmation do you expect to see in order to consider closing this position at the first target?
💡 This analysis is for educational purposes and not financial advice. Do your own research and decide calmly.
#crypto #COHR #trading #Futures #Bearish
🎯 Target: $257.96. Is it still falling?
🎯 Trading levels:
🟢 Entry: $264.31
🛑 Stop Loss: $267.65
🏁 TP1: $257.96
🏁 TP2: $254.29
📉 Analysis:
The structure of $COHR shows a confirmed triple top with sustained selling pressure that invalidates attempts at recovery. The ADX of 28.76 confirms a solid bearish trend, while the bearish MACD cross (an indicator that measures the strength and direction of momentum) and the alignment of the moving averages with EMA20 below EMA50 reinforce the dominance of supply. The RSI at 43.44 (an index that measures the speed of price movement) still allows room for the decline to continue toward the support zone.
⚖️ Risk/Reward: 1:1.9
⏱️ Timeframe: 1H
📐 Technical confidence: 3/5
The invalidation level is set at the stop loss, protecting the position in case of a possible recovery of the short-term bullish structure. The bearish thesis remains valid as long as selling volume absorbs any attempt of a rebound from the immediate resistance.
What confirmation do you expect to see in order to consider closing this position at the first target?
💡 This analysis is for educational purposes and not financial advice. Do your own research and decide calmly.
#crypto #COHR #trading #Futures #Bearish
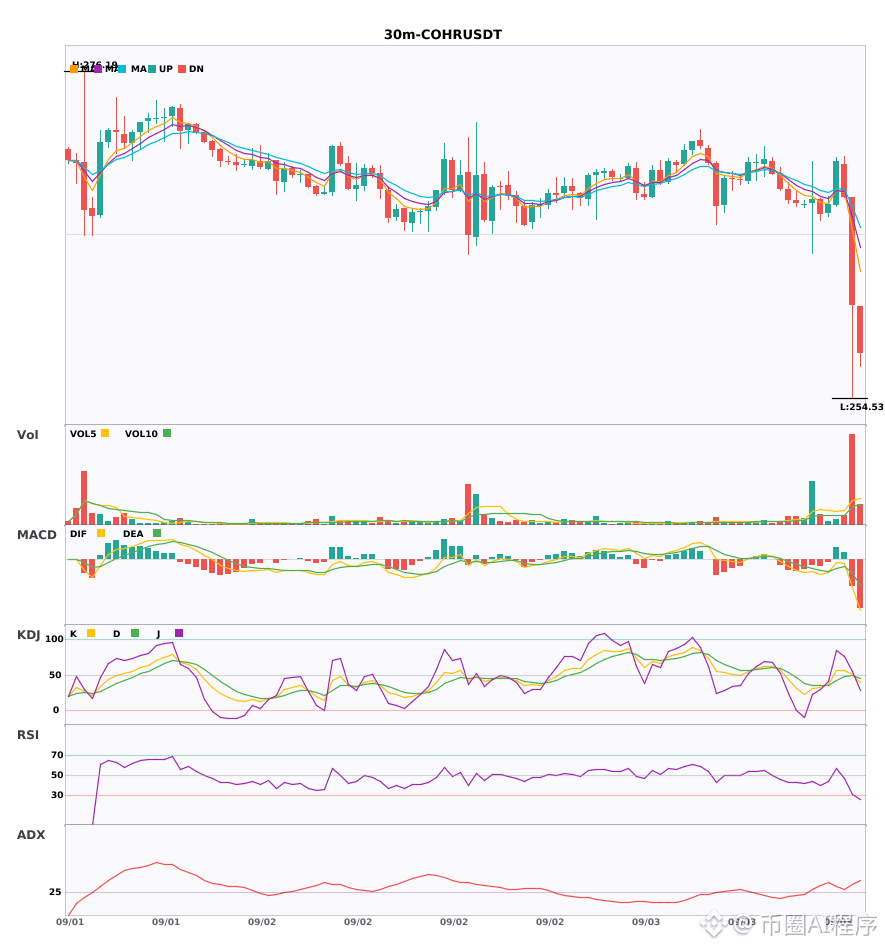
COHR/AAOI/SKR 30-minute MACD bearish crossover with volume surge, the 4-hour trend has already turned bearish 🔥
════════════════════
🟢 $COHR 30 minutes Bearish signal
⚠️ Technicals: The 4-hour trend is confirmed bearish. The 30-minute MACD is below zero and the bearish crossover has accelerated with expanding volume; the 5/8/13 moving averages are aligned bearish; volume surged by 4.8x. A bearish resonance opportunity is here.
════════════════════
🟢 $AAOI 30 minutes Bearish signal
⚠️ Technicals: The 4-hour bearish confirmation aligns with the setup. The 30-minute MACD is below zero with a bearish crossover and volume expansion. EMA5/8/13 are diverging to the downside; KDJ bearish crossover with K value at 38.6—bearish in the short term.
════════════════════
🟢 $SKR 30 minutes Bearish signal
⚠️ Technicals: The 4-hour is firmly set to go bearish. The 30-minute MACD bearish crossover below zero is accelerating with a volume surge. EMA bearish divergence is expanding; KDJ has entered the oversold area. Be ready—wait for a rebound to sell into.
════════════════════
🔔 Follow to get the first-hand market moves 🔔
#多周期共振 #COHR #AAOI #SKR
📌 When trading, pay attention to whether the candlestick pattern matches
════════════════════
🟢 $COHR 30 minutes Bearish signal
⚠️ Technicals: The 4-hour trend is confirmed bearish. The 30-minute MACD is below zero and the bearish crossover has accelerated with expanding volume; the 5/8/13 moving averages are aligned bearish; volume surged by 4.8x. A bearish resonance opportunity is here.
════════════════════
🟢 $AAOI 30 minutes Bearish signal
⚠️ Technicals: The 4-hour bearish confirmation aligns with the setup. The 30-minute MACD is below zero with a bearish crossover and volume expansion. EMA5/8/13 are diverging to the downside; KDJ bearish crossover with K value at 38.6—bearish in the short term.
════════════════════
🟢 $SKR 30 minutes Bearish signal
⚠️ Technicals: The 4-hour is firmly set to go bearish. The 30-minute MACD bearish crossover below zero is accelerating with a volume surge. EMA bearish divergence is expanding; KDJ has entered the oversold area. Be ready—wait for a rebound to sell into.
════════════════════
🔔 Follow to get the first-hand market moves 🔔
#多周期共振 #COHR #AAOI #SKR
📌 When trading, pay attention to whether the candlestick pattern matches
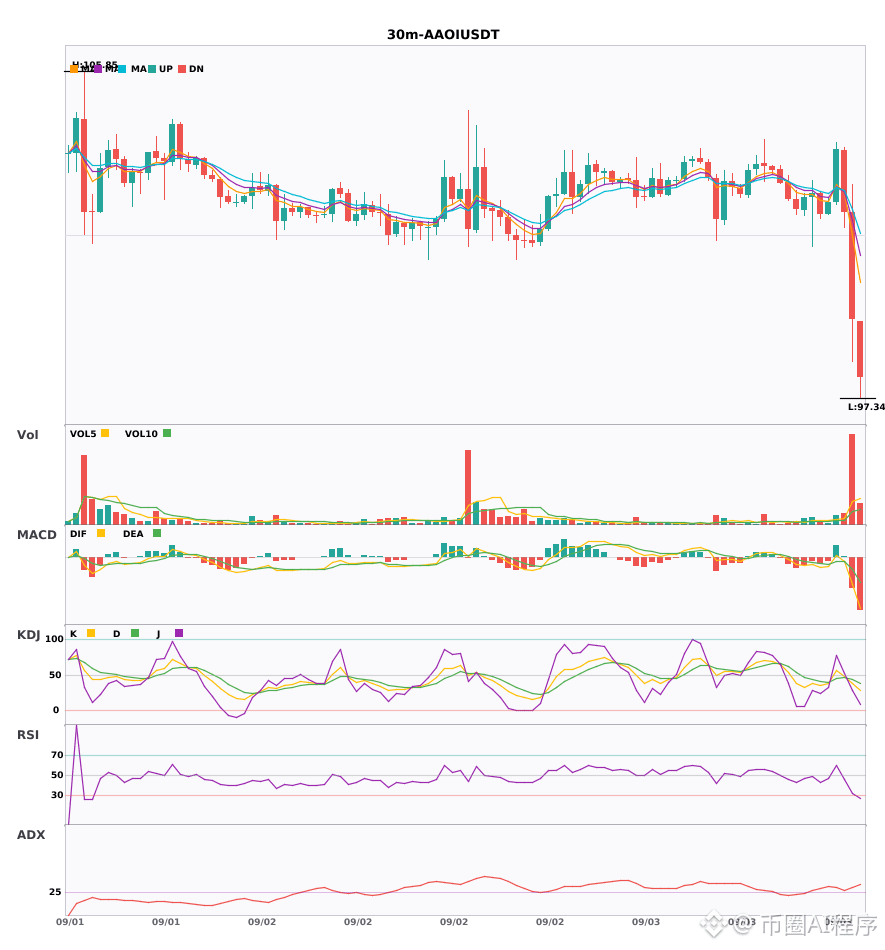
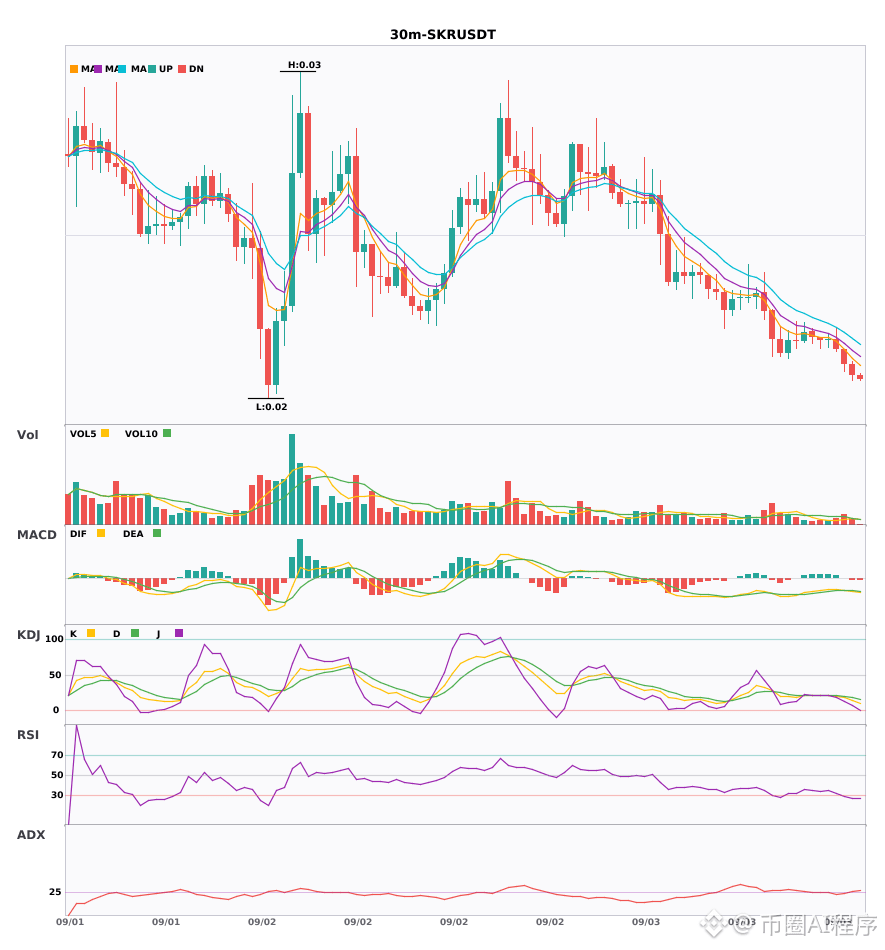
30-minute triple coin simultaneous sell-off alert—check if you have 🔥 in your hands
════════════════════
🟢 $MUU 30-minute bearish signal
⚠️ Technicals: ADX surged to 43— the trend is moving aggressively. MACD has a bearish crossover below zero; shorts are accelerating the sell-off. The short-term moving averages have just turned from a death cross to bearish. Trading volume is up more than 7x, indicating strong sell-off momentum.
════════════════════
🟢 $COHR 30-minute bearish signal
⚠️ Technicals: ADX is as high as 36—the move is very strong. MACD has a death cross below the zero line; shorts are accelerating the sell-off. Moving averages are arranged bearishly and moving downward. Trading volume has jumped 4.8x directly.
════════════════════
🟢 $AAOI 30-minute bearish signal
⚠️ Technicals: ADX at 33—the trend is clearly strengthening. MACD has a bearish crossover below zero; shorts are exerting pressure. 5-day, 8-day, and 13-day moving averages are in a bearish alignment; KDJ is forming a death cross— the price is likely to keep falling in the short term. K is 38.6, D is 43.8, and volume has surged 6.7x.
════════════════════
🔔 Follow to get the first-hand market moves 🔔
#技术分析 #MUU #COHR #AAOI
📌 When trading, pay attention to whether the candlestick patterns match
════════════════════
🟢 $MUU 30-minute bearish signal
⚠️ Technicals: ADX surged to 43— the trend is moving aggressively. MACD has a bearish crossover below zero; shorts are accelerating the sell-off. The short-term moving averages have just turned from a death cross to bearish. Trading volume is up more than 7x, indicating strong sell-off momentum.
════════════════════
🟢 $COHR 30-minute bearish signal
⚠️ Technicals: ADX is as high as 36—the move is very strong. MACD has a death cross below the zero line; shorts are accelerating the sell-off. Moving averages are arranged bearishly and moving downward. Trading volume has jumped 4.8x directly.
════════════════════
🟢 $AAOI 30-minute bearish signal
⚠️ Technicals: ADX at 33—the trend is clearly strengthening. MACD has a bearish crossover below zero; shorts are exerting pressure. 5-day, 8-day, and 13-day moving averages are in a bearish alignment; KDJ is forming a death cross— the price is likely to keep falling in the short term. K is 38.6, D is 43.8, and volume has surged 6.7x.
════════════════════
🔔 Follow to get the first-hand market moves 🔔
#技术分析 #MUU #COHR #AAOI
📌 When trading, pay attention to whether the candlestick patterns match
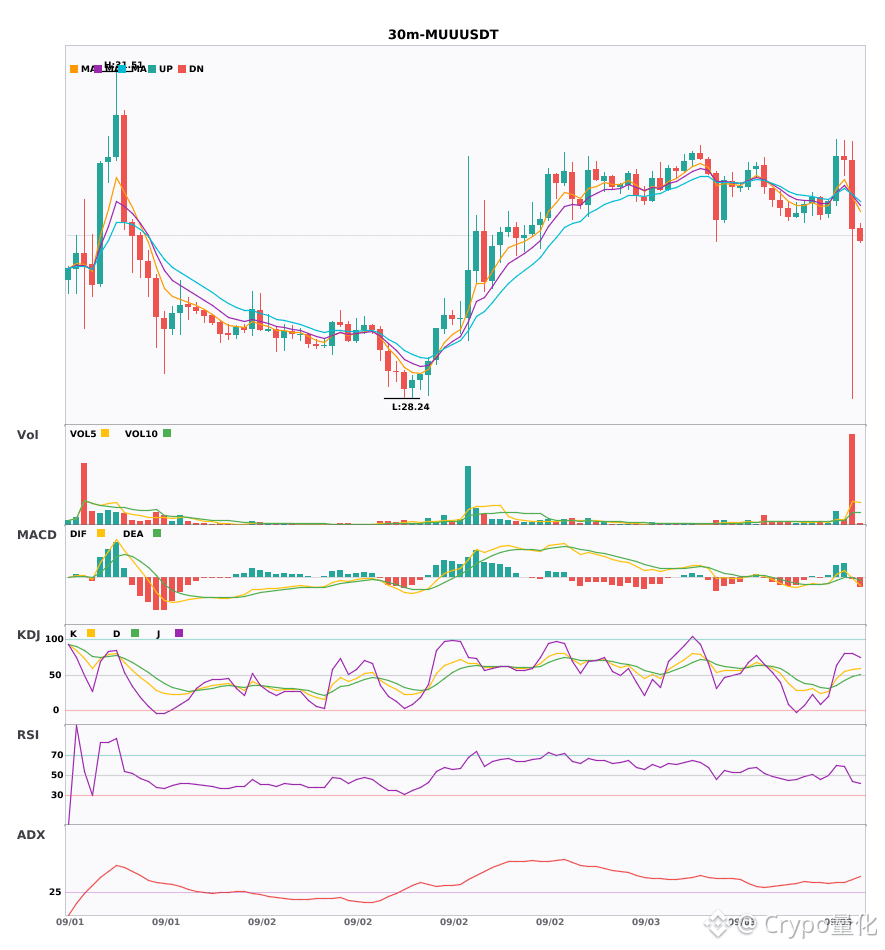
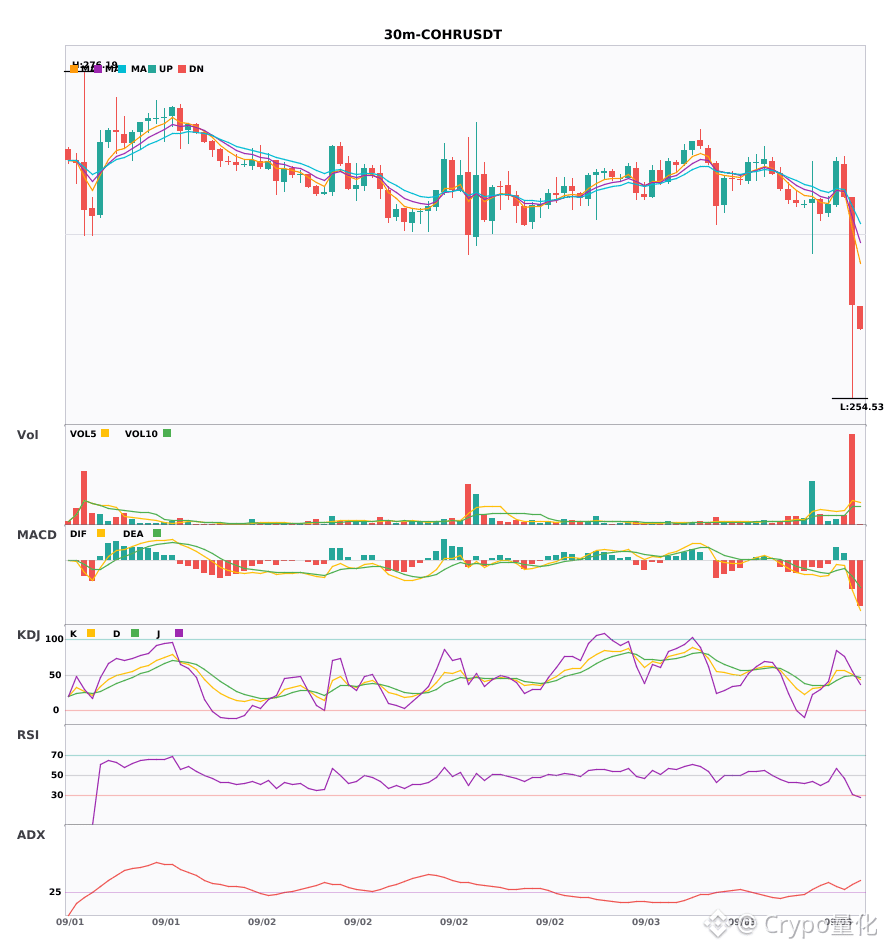
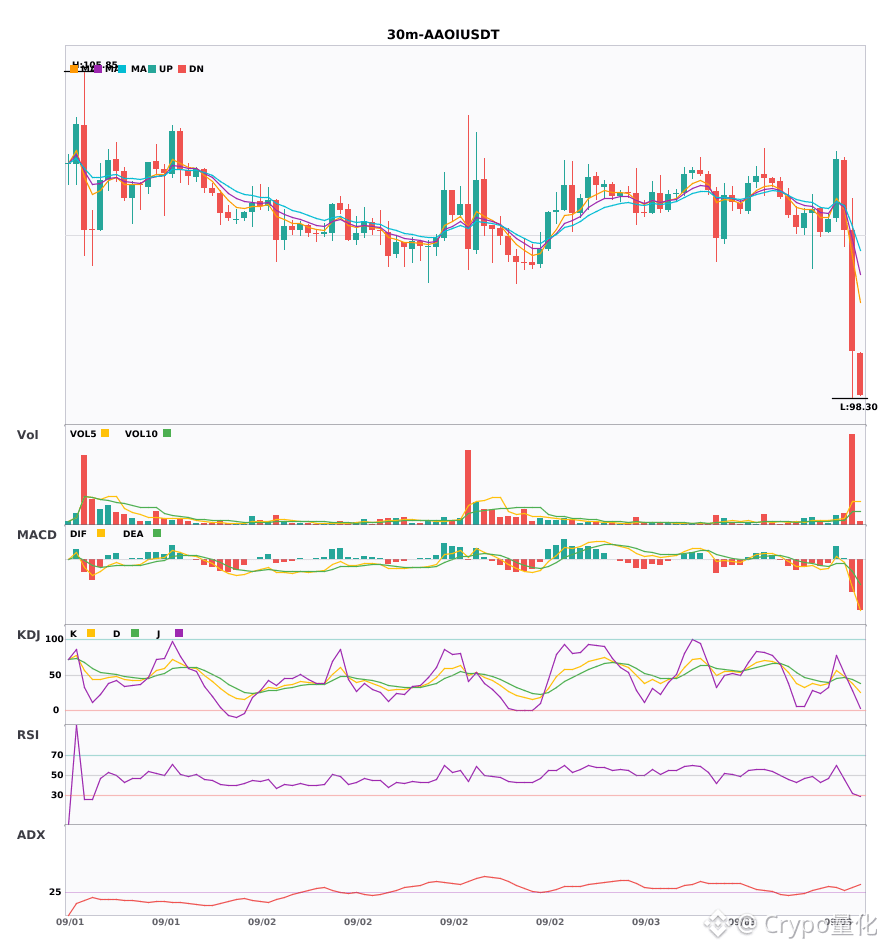

$COHR SHORT
Bearish control of the price remains relevant after testing the entry area.
If selling pressure persists, the asset may continue moving downward.
🔹Entry zone: 264.95
✅Take Profit 1: 261.3095585 (+1.37%)
✅Take Profit 2: 257.599117 (+2.77%)
✅Take Profit 3: 252.03345475 (+4.88%)
❌Stop-loss: 270.58566225 (-2.13%)
⚠️ This is not financial advice. Trade at your own risk. DYOR.
#COHR #BIP110ForkSignalingExpectedThisWeekend #AKE 📈
$COHR
Bearish control of the price remains relevant after testing the entry area.
If selling pressure persists, the asset may continue moving downward.
🔹Entry zone: 264.95
✅Take Profit 1: 261.3095585 (+1.37%)
✅Take Profit 2: 257.599117 (+2.77%)
✅Take Profit 3: 252.03345475 (+4.88%)
❌Stop-loss: 270.58566225 (-2.13%)
⚠️ This is not financial advice. Trade at your own risk. DYOR.
#COHR #BIP110ForkSignalingExpectedThisWeekend #AKE 📈
$COHR

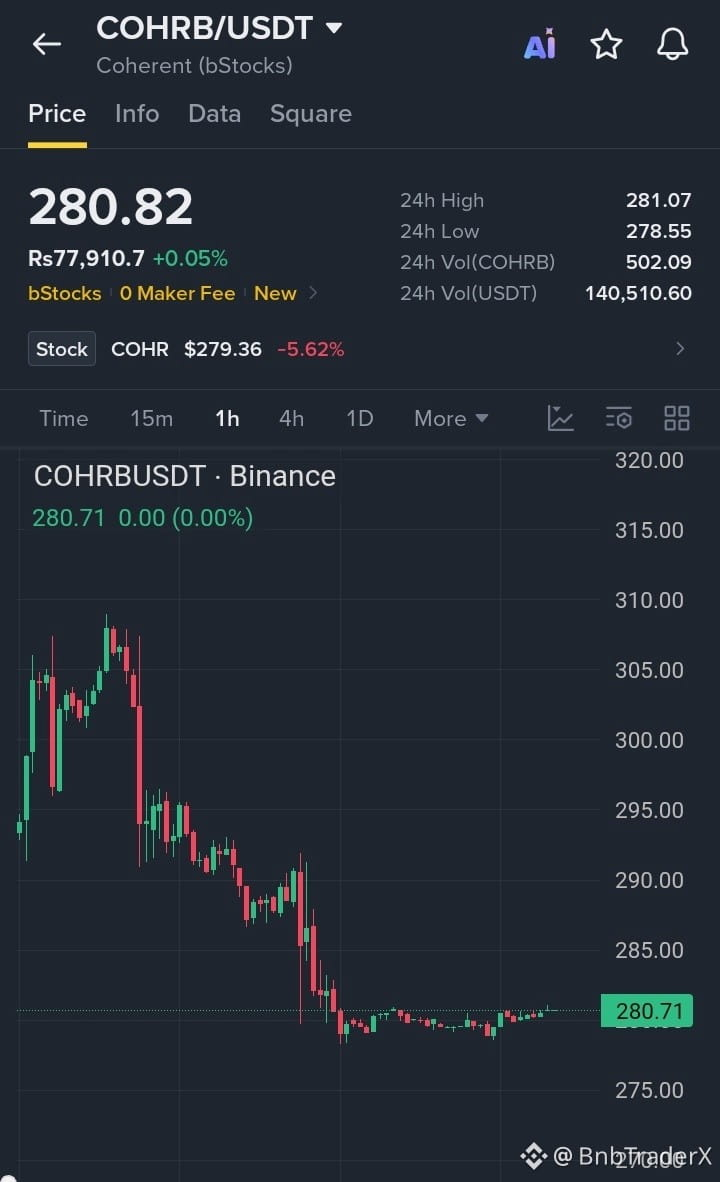
$COHRB USDT is holding around $280.82, with the bStocks market showing a tight range near the $278.55–$281.07 zone. The underlying COHR stock has been volatile recently, while AI infrastructure and optical-networking demand remain important catalysts for Coherent.
Target 1: $285
Target 2: $295
Target 3: $305
#COHRB #COHR #AI
$DEXE
$AKE
Target 1: $285
Target 2: $295
Target 3: $305
#COHRB #COHR #AI
$DEXE
$AKE

$COHR current price 282.63, up 0.878% in the past 24 hours. The funding fee is 0. This rate is the most straightforward: no bulls or bears are willing to pay for positions, which suggests this stock is not crowded right now—no one is getting squeezed. It’s purely a slow knife. OI 30288.14; the market is not very lively.
I lean toward a pullback to go long, not chasing. First resistance to watch is 285.1—that’s the symmetric level of the current price based on the 24-hour move. Set the stop-loss at 280.17 below; that level is the price from 24 hours ago. If it breaks that, it means today’s gains were essentially wasted. Use 2x leverage with a light position to test; add only if it holds steady at 282.63.
On Trump’s side there’s no new headline pressuring this semiconductor stock. In the short term, just watch how price moves on its own. The strongest counter-evidence is that the 0.878% gain is too weak—it could just be tracking the broader market, not independent buying. With the funding fee at zero, there’s also no “smart money” rushing to pay and open longs.
If it breaks below 280.17, my long thesis is invalid and I’ll cancel orders and stand aside. Only if it gets back above 282.63 is it worth holding a position; chasing here isn’t necessary.
Trading tag: #TradFi #链上美股 #COHR
Where do you think this judgment is most likely to be wrong?
I lean toward a pullback to go long, not chasing. First resistance to watch is 285.1—that’s the symmetric level of the current price based on the 24-hour move. Set the stop-loss at 280.17 below; that level is the price from 24 hours ago. If it breaks that, it means today’s gains were essentially wasted. Use 2x leverage with a light position to test; add only if it holds steady at 282.63.
On Trump’s side there’s no new headline pressuring this semiconductor stock. In the short term, just watch how price moves on its own. The strongest counter-evidence is that the 0.878% gain is too weak—it could just be tracking the broader market, not independent buying. With the funding fee at zero, there’s also no “smart money” rushing to pay and open longs.
If it breaks below 280.17, my long thesis is invalid and I’ll cancel orders and stand aside. Only if it gets back above 282.63 is it worth holding a position; chasing here isn’t necessary.
Trading tag: #TradFi #链上美股 #COHR
Where do you think this judgment is most likely to be wrong?
$COHR current price 282.63, up 0.878% over the past 24 hours. Funding rate is exactly 0.00000000, so neither the long side nor the short side pays interest. OI is 30288.14.
This kind of pump is the most boring. A 0.878% move with a zero fee rate—people pushing the price didn’t have to pay carry costs for holding positions, but on the flip side, there’s also no reason for longs to pay extra to lock their positions. This suggests the buy-side is lightly probing rather than making a real push. For this structure, I’ll treat it as a range and won’t chase.
The strongest counter-evidence: OI is still sitting at around 30k—positions haven’t collapsed. Either someone is waiting to pick up near 280, or shorts are holding their ground and not running. The zero-fee setup provides capital for both sides to keep dragging.
My order: I’m not entering now. If it breaks above 283, I’ll go long with 2x on a light position; stop loss at 280; take profit at 286. If it drops straight back from 282 to below 280, I won’t buy longs—I’ll first watch whether OI also collapses. If it does, I’ll short opportunistically.
Invalidation condition: After breaking below 280, if OI is still elevated or continues to rise, it means someone is genuinely propping up from below. In that case, I’ll close the short and won’t chase.
Trading tag: #TradFi #链上美股 #COHR
Where do you think this assessment is most likely to be wrong?
This kind of pump is the most boring. A 0.878% move with a zero fee rate—people pushing the price didn’t have to pay carry costs for holding positions, but on the flip side, there’s also no reason for longs to pay extra to lock their positions. This suggests the buy-side is lightly probing rather than making a real push. For this structure, I’ll treat it as a range and won’t chase.
The strongest counter-evidence: OI is still sitting at around 30k—positions haven’t collapsed. Either someone is waiting to pick up near 280, or shorts are holding their ground and not running. The zero-fee setup provides capital for both sides to keep dragging.
My order: I’m not entering now. If it breaks above 283, I’ll go long with 2x on a light position; stop loss at 280; take profit at 286. If it drops straight back from 282 to below 280, I won’t buy longs—I’ll first watch whether OI also collapses. If it does, I’ll short opportunistically.
Invalidation condition: After breaking below 280, if OI is still elevated or continues to rise, it means someone is genuinely propping up from below. In that case, I’ll close the short and won’t chase.
Trading tag: #TradFi #链上美股 #COHR
Where do you think this assessment is most likely to be wrong?
$COHR It’s currently 282.63, up 0.878% over the past 24 hours. Funding fee is 0, and open interest is 30,288.14. The order book is very quiet—no side is willing to pay the cost to hold the position.
I won’t chase long with this setup. If it can’t even move by one point, and the funding fee is zero, that means both longs and shorts are lazy. Even with OI at over 30,000 contracts, I can’t see any new money rushing in. If a Trump semiconductor tariff headline or a geopolitical news alert sweeps through, the first thing hit will be the short-term long-chasing orders.
For this single-contract setup, use these 5 parameters: direction—pull back to test for a long; leverage—3x; stop loss—273.5; take profit—292.8; position size—20%. If it doesn’t give a signal to break through 285 with volume, I won’t move.
The strongest counter-evidence is if it directly breaks up through 285 with volume. In that case, I’ll wait for the pullback and risk getting left behind. Getting left behind is acceptable—I won’t chase. This is a product with funding fee at 0 truly starting to move. The second wave is often cleaner; the first wave doesn’t play with you.
Invalidation conditions: if it falls below 273.5, I won’t go long—switch to watching. If Trump’s headline causes a gap up/down with the news, reduce the position size by 10% immediately; I won’t hold through the news.
Trading tag: #TradFi #链上美股 #COHR
Where do you think this judgment is most likely to be wrong?
I won’t chase long with this setup. If it can’t even move by one point, and the funding fee is zero, that means both longs and shorts are lazy. Even with OI at over 30,000 contracts, I can’t see any new money rushing in. If a Trump semiconductor tariff headline or a geopolitical news alert sweeps through, the first thing hit will be the short-term long-chasing orders.
For this single-contract setup, use these 5 parameters: direction—pull back to test for a long; leverage—3x; stop loss—273.5; take profit—292.8; position size—20%. If it doesn’t give a signal to break through 285 with volume, I won’t move.
The strongest counter-evidence is if it directly breaks up through 285 with volume. In that case, I’ll wait for the pullback and risk getting left behind. Getting left behind is acceptable—I won’t chase. This is a product with funding fee at 0 truly starting to move. The second wave is often cleaner; the first wave doesn’t play with you.
Invalidation conditions: if it falls below 273.5, I won’t go long—switch to watching. If Trump’s headline causes a gap up/down with the news, reduce the position size by 10% immediately; I won’t hold through the news.
Trading tag: #TradFi #链上美股 #COHR
Where do you think this judgment is most likely to be wrong?

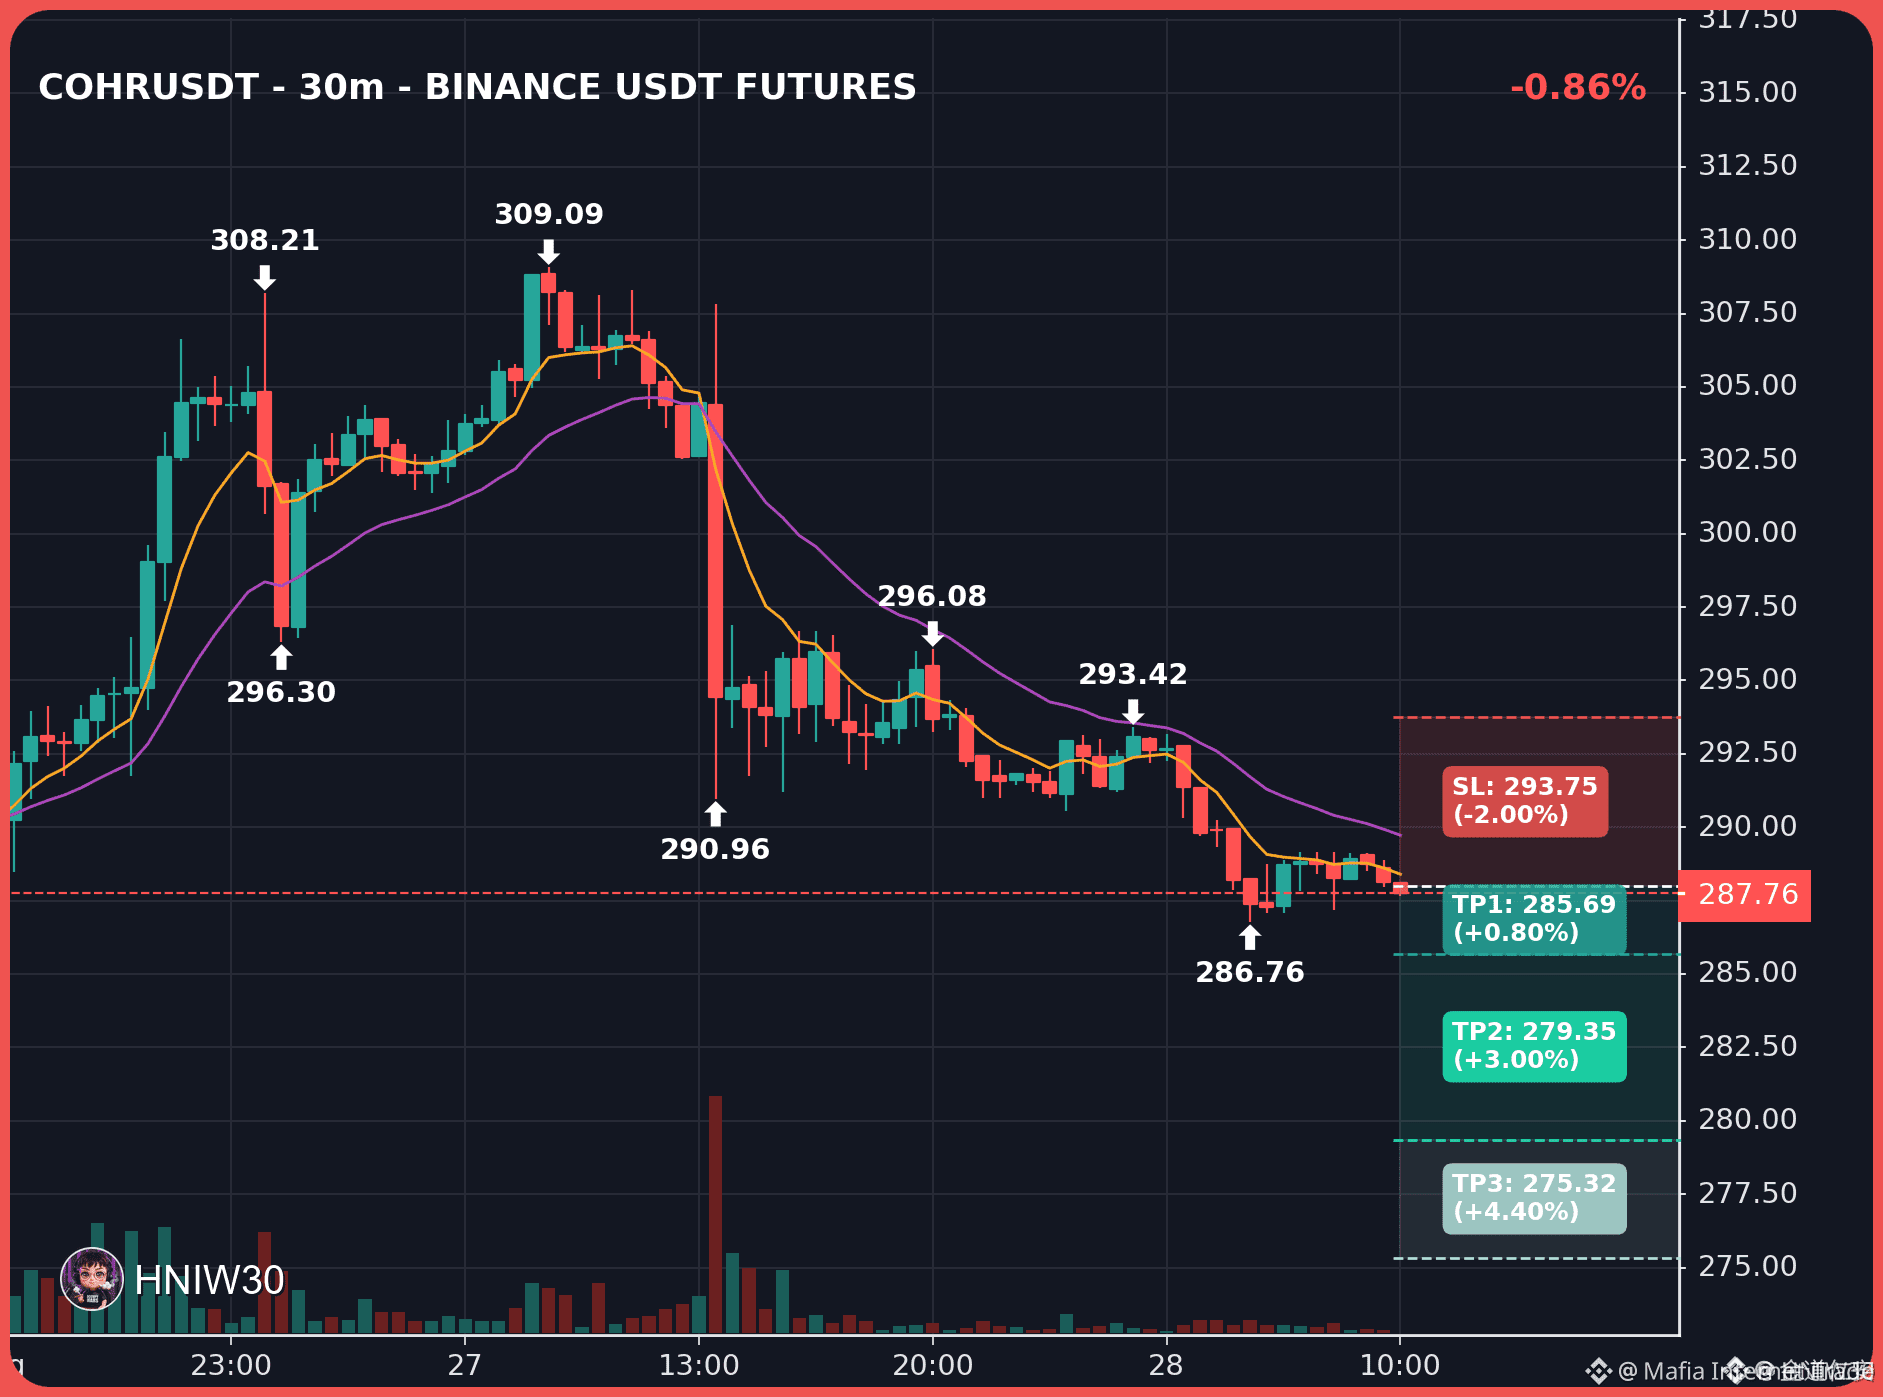
🔴 $COHR REJECTING KEY RESISTANCE AS LONG-TERM DOWNTREND REASSERTS DOMINANCE! 📉
Entry: 287.86 - 288.12 ⚡
Target: 285.69 - 279.35 - 275.32 🎯
Stop Loss: 293.75 ⚠️
Price action on $COHR is currently testing critical near-term overhead resistance right inside a macro downtrend structure. 📊 Sellers are defense-lining this zone aggressively, showing distinct exhaustion from the recent corrective bounce.
🔍 Order flow points to heavy supply stacking up above 288, setting up a high-conviction short as momentum flips downward. ⚡ As long as buyers fail to claim higher ground, the path of least resistance leads straight down into lower liquidity pools.
💬 Are you loading up short orders on this rejection or waiting for a cleaner breakdown confirmation? 👇
⚠️ Not financial advice. Always manage your risk. 🛡️
🏷️ #COHR #ShortSetup #Bearish #Crypto
🔴 📉
Entry: 287.86 - 288.12 ⚡
Target: 285.69 - 279.35 - 275.32 🎯
Stop Loss: 293.75 ⚠️
Price action on $COHR is currently testing critical near-term overhead resistance right inside a macro downtrend structure. 📊 Sellers are defense-lining this zone aggressively, showing distinct exhaustion from the recent corrective bounce.
🔍 Order flow points to heavy supply stacking up above 288, setting up a high-conviction short as momentum flips downward. ⚡ As long as buyers fail to claim higher ground, the path of least resistance leads straight down into lower liquidity pools.
💬 Are you loading up short orders on this rejection or waiting for a cleaner breakdown confirmation? 👇
⚠️ Not financial advice. Always manage your risk. 🛡️
🏷️ #COHR #ShortSetup #Bearish #Crypto
🔴 📉
Log in to explore more content