

#bitcointops$80kthreemonthhigh
bitcointops$80kthreemonthhigh
15,530 views
145 Discussing
Hot
Latest

·
--
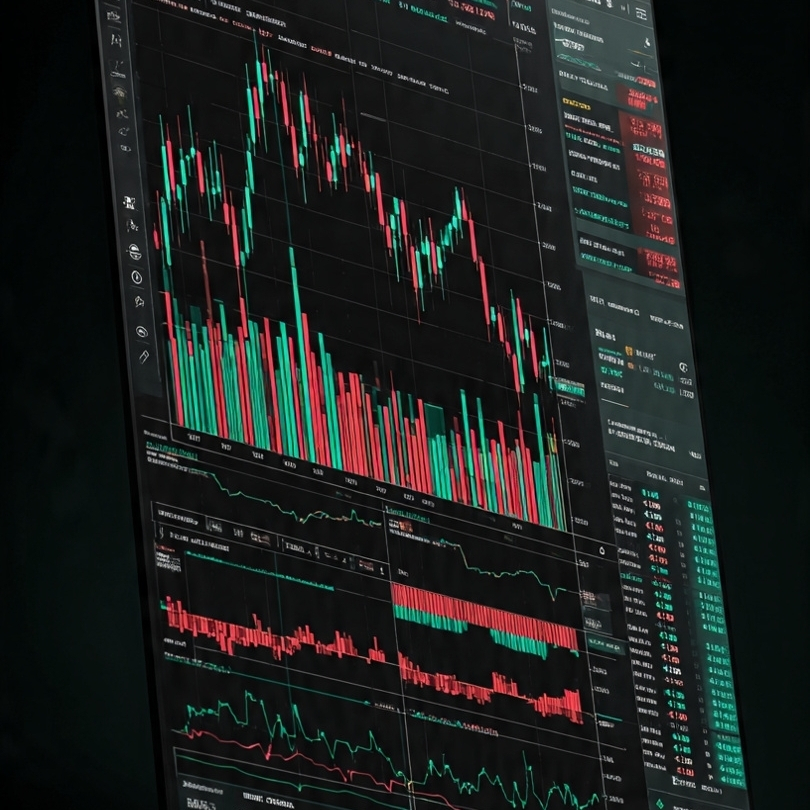
#BitcoinTops$80KThreeMonthHigh Bitcoin has officially broken past the $80,000 mark, reaching its highest level in three months. This recent price surge is driven by strong inflows into spot ETFs and a weakening US dollar. Investors are turning to the cryptocurrency amid growing concerns about inflation and rising national debt. Although the price briefly touched $81,000 before consolidating near $79,000, experts suggest this rally has a solid foundation. Market watchers are now closely monitoring upcoming economic data to see if buyers can push prices higher.
CLICK BELOW TO TRADE : $BTC
{future}(BTCUSDT)
#BitcoinTops$80KThreeMonthHigh Bitcoin has officially broken past the $80,000 mark, reaching its highest level in three months. This recent price surge is driven by strong inflows into spot ETFs and a weakening US dollar. Investors are turning to the cryptocurrency amid growing concerns about inflation and rising national debt. Although the price briefly touched $81,000 before consolidating near $79,000, experts suggest this rally has a solid foundation. Market watchers are now closely monitoring upcoming economic data to see if buyers can push prices higher.
CLICK BELOW TO TRADE : $BTC
CLICK BELOW TO TRADE : $BTC
70
Article
*BTC Update - Today, 28 Aug 2026* 📊
*Current Price*
- *$79,918 - $80,314 USD* across exchanges
- *$BTC Update - Today, 28 Aug 2026 📊
Current Price
- $79,918 - $80,314 USD across exchanges
- 24H Change: +1.33% to +1.44%
- 24H Range: $78,598 - $81,282 f722dd5f760c70fd
Key Stats
- Market Cap: $1.60 - $1.61 Trillion
- 24H Trading Volume: ∼$35B - $36.5B
- Dominance: 61.25% of total crypto market
- Circulating Supply: 20.1M $BTC out of 21M max f722760c70fda0d4dc85
Market Notes
$BTC is holding steady around the $80K level. Analysts note:
- Bullish: ETF inflows continuing for 8 days straight, +11% gain over the past week
- Caution: Some profit-taking and range-bound consolidation around $73K-$80K a0d428c9
#NvidiaTrades$33.5BInFirst140Minutes #CentralBanksBuy289TonsGoldInQ2 #BitcoinTops$80KThreeMonthHigh #WTICrudeRises1.6%To$84 #MarvellFallsOver5%AfterHours
*BTC Update - Today, 28 Aug 2026* 📊 *Current Price* - *$79,918 - $80,314 USD* across exchanges - *
$BTC Update - Today, 28 Aug 2026 📊
Current Price
- $79,918 - $80,314 USD across exchanges
- 24H Change: +1.33% to +1.44%
- 24H Range: $78,598 - $81,282 f722dd5f760c70fd
Key Stats
- Market Cap: $1.60 - $1.61 Trillion
- 24H Trading Volume: ∼$35B - $36.5B
- Dominance: 61.25% of total crypto market
- Circulating Supply: 20.1M $BTC out of 21M max f722760c70fda0d4dc85
Market Notes
$BTC is holding steady around the $80K level. Analysts note:
- Bullish: ETF inflows continuing for 8 days straight, +11% gain over the past week
- Caution: Some profit-taking and range-bound consolidation around $73K-$80K a0d428c9
#NvidiaTrades$33.5BInFirst140Minutes #CentralBanksBuy289TonsGoldInQ2 #BitcoinTops$80KThreeMonthHigh #WTICrudeRises1.6%To$84 #MarvellFallsOver5%AfterHours
Current Price
- $79,918 - $80,314 USD across exchanges
- 24H Change: +1.33% to +1.44%
- 24H Range: $78,598 - $81,282 f722dd5f760c70fd
Key Stats
- Market Cap: $1.60 - $1.61 Trillion
- 24H Trading Volume: ∼$35B - $36.5B
- Dominance: 61.25% of total crypto market
- Circulating Supply: 20.1M $BTC out of 21M max f722760c70fda0d4dc85
Market Notes
$BTC is holding steady around the $80K level. Analysts note:
- Bullish: ETF inflows continuing for 8 days straight, +11% gain over the past week
- Caution: Some profit-taking and range-bound consolidation around $73K-$80K a0d428c9
#NvidiaTrades$33.5BInFirst140Minutes #CentralBanksBuy289TonsGoldInQ2 #BitcoinTops$80KThreeMonthHigh #WTICrudeRises1.6%To$84 #MarvellFallsOver5%AfterHours
157

·
--
$BTC just crossed the $80k mark for the first time since mid-May, shaking off the summer consolidation blues.📈🚀🚀🌟
$BTC going higher and higher with the following key points.
Huge Market Cap : $1.61T
Immense Volume : $34.09B
And as you all now very well it is on the 1st Rank
So what do you have in your mind will it crosses $100K or not❌❓
Tell me if you agree
#BTC #bitcoin #BitcoinTops$80KThreeMonthHigh
{spot}(BTCUSDT)
$BTC just crossed the $80k mark for the first time since mid-May, shaking off the summer consolidation blues.📈🚀🚀🌟
$BTC going higher and higher with the following key points.
Huge Market Cap : $1.61T
Immense Volume : $34.09B
And as you all now very well it is on the 1st Rank
So what do you have in your mind will it crosses $100K or not❌❓
Tell me if you agree
#BTC #bitcoin #BitcoinTops$80KThreeMonthHigh
$BTC going higher and higher with the following key points.
Huge Market Cap : $1.61T
Immense Volume : $34.09B
And as you all now very well it is on the 1st Rank
So what do you have in your mind will it crosses $100K or not❌❓
Tell me if you agree
#BTC #bitcoin #BitcoinTops$80KThreeMonthHigh
144

·
--
🚨 Bitcoin Tops $80K Three-Month High! 🚀📈
#BitcoinTops$80KThreeMonthHigh
Bitcoin is officially back above a level that traders have been waiting for. 👀
BTC surged above $80,000, reaching around $81,200, its highest level in more than three months. 🔥
But what’s driving this sudden comeback?
🐂 Bulls Are Back;
Bitcoin’s rally has been supported by several factors, including strong ETF inflows, a weaker U.S. dollar, and heavy short liquidations.
U.S. spot Bitcoin ETFs have also seen strong demand, with billions flowing into the market during the recent rally. 🏦💰
And there’s another important factor…
Growing concerns about the U.S. dollar and government debt are pushing some investors toward scarce assets like Bitcoin and gold.
⚠️ But $80K Is Not Guaranteed Support Yet:
Bitcoin has already faced strong selling around the $80K–$82K zone.
If BTC can break above this area and hold it as support, the rally could continue toward higher levels. 🚀
But if sellers take control again, Bitcoin could see another pullback as traders lock in profits.
🔥 The Big Question;
Bitcoin has gone from fear to excitement extremely quickly.
Now the market wants to know:
Can BTC turn $80K from resistance into support? 👀
If bulls succeed, this three-month high could be more than just a short-term rally.
It could be the beginning of Bitcoin’s next major move. 🚀📊
#Bitcoin #BTC #Crypto #CryptoNews #BitcoinNews #BTCUSD #cryptotrading #BitcoinPrice
$BTC $
{spot}(BTCUSDT)
$ETH
{spot}(ETHUSDT)
$NVDA.US
{stock_us}(NVDA.US)
🚨 Bitcoin Tops $80K Three-Month High! 🚀📈
#BitcoinTops$80KThreeMonthHigh
Bitcoin is officially back above a level that traders have been waiting for. 👀
BTC surged above $80,000, reaching around $81,200, its highest level in more than three months. 🔥
But what’s driving this sudden comeback?
🐂 Bulls Are Back;
Bitcoin’s rally has been supported by several factors, including strong ETF inflows, a weaker U.S. dollar, and heavy short liquidations.
U.S. spot Bitcoin ETFs have also seen strong demand, with billions flowing into the market during the recent rally. 🏦💰
And there’s another important factor…
Growing concerns about the U.S. dollar and government debt are pushing some investors toward scarce assets like Bitcoin and gold.
⚠️ But $80K Is Not Guaranteed Support Yet:
Bitcoin has already faced strong selling around the $80K–$82K zone.
If BTC can break above this area and hold it as support, the rally could continue toward higher levels. 🚀
But if sellers take control again, Bitcoin could see another pullback as traders lock in profits.
🔥 The Big Question;
Bitcoin has gone from fear to excitement extremely quickly.
Now the market wants to know:
Can BTC turn $80K from resistance into support? 👀
If bulls succeed, this three-month high could be more than just a short-term rally.
It could be the beginning of Bitcoin’s next major move. 🚀📊
#Bitcoin #BTC #Crypto #CryptoNews #BitcoinNews #BTCUSD #cryptotrading #BitcoinPrice
$BTC $
$ETH
$NVDA.US
#BitcoinTops$80KThreeMonthHigh
Bitcoin is officially back above a level that traders have been waiting for. 👀
BTC surged above $80,000, reaching around $81,200, its highest level in more than three months. 🔥
But what’s driving this sudden comeback?
🐂 Bulls Are Back;
Bitcoin’s rally has been supported by several factors, including strong ETF inflows, a weaker U.S. dollar, and heavy short liquidations.
U.S. spot Bitcoin ETFs have also seen strong demand, with billions flowing into the market during the recent rally. 🏦💰
And there’s another important factor…
Growing concerns about the U.S. dollar and government debt are pushing some investors toward scarce assets like Bitcoin and gold.
⚠️ But $80K Is Not Guaranteed Support Yet:
Bitcoin has already faced strong selling around the $80K–$82K zone.
If BTC can break above this area and hold it as support, the rally could continue toward higher levels. 🚀
But if sellers take control again, Bitcoin could see another pullback as traders lock in profits.
🔥 The Big Question;
Bitcoin has gone from fear to excitement extremely quickly.
Now the market wants to know:
Can BTC turn $80K from resistance into support? 👀
If bulls succeed, this three-month high could be more than just a short-term rally.
It could be the beginning of Bitcoin’s next major move. 🚀📊
#Bitcoin #BTC #Crypto #CryptoNews #BitcoinNews #BTCUSD #cryptotrading #BitcoinPrice
$BTC $
$ETH
$NVDA.US
151

·
--
Bullish
#BitcoinTops$80KThreeMonthHigh
🚀 BITCOIN BREAKS ABOVE $80K! 📈
BTC has pushed above $80K, marking a strong 3-month high, supported by an 8-day ETF inflow streak and around $2.8B in monthly ETF inflows.
🎯 $83K is now the key resistance. If BTC breaks it with strong spot demand, the rally could extend further. Traders should watch price action and ETF flows closely.
TRADING VIEW: BUY 📈
The momentum remains bullish while spot demand stays strong, but avoid excessive leverage.
❓ Can BTC break $83K next? "CLICK ON THE BELOW YELLOW COIN TAG TO GO TO DESIRED TRADING PAGE TO GET BENEFIT TRADE"$BNB $BTC $ETH
{spot}(ETHUSDT)
{spot}(BTCUSDT)
{spot}(BNBUSDT)
#bitcoin #BitcoinETFs
#BitcoinTops$80KThreeMonthHigh
🚀 BITCOIN BREAKS ABOVE $80K! 📈
BTC has pushed above $80K, marking a strong 3-month high, supported by an 8-day ETF inflow streak and around $2.8B in monthly ETF inflows.
🎯 $83K is now the key resistance. If BTC breaks it with strong spot demand, the rally could extend further. Traders should watch price action and ETF flows closely.
TRADING VIEW: BUY 📈
The momentum remains bullish while spot demand stays strong, but avoid excessive leverage.
❓ Can BTC break $83K next? "CLICK ON THE BELOW YELLOW COIN TAG TO GO TO DESIRED TRADING PAGE TO GET BENEFIT TRADE"$BNB $BTC $ETH
#bitcoin #BitcoinETFs
🚀 BITCOIN BREAKS ABOVE $80K! 📈
BTC has pushed above $80K, marking a strong 3-month high, supported by an 8-day ETF inflow streak and around $2.8B in monthly ETF inflows.
🎯 $83K is now the key resistance. If BTC breaks it with strong spot demand, the rally could extend further. Traders should watch price action and ETF flows closely.
TRADING VIEW: BUY 📈
The momentum remains bullish while spot demand stays strong, but avoid excessive leverage.
❓ Can BTC break $83K next? "CLICK ON THE BELOW YELLOW COIN TAG TO GO TO DESIRED TRADING PAGE TO GET BENEFIT TRADE"$BNB $BTC $ETH
#bitcoin #BitcoinETFs
2
116

·
--
$BTC Bitcoin (BTC) is showing strong bullish momentum after reclaiming the $80,000 area and recently reaching around $81,200.
🟢 Resistance: $81,000–$82,000 🟢 Next target: $85,000–$90,000 if BTC breaks and holds above $82K 🔴 Support: $78,000–$80,000 ⚠️ A rejection around $81K–$82K could trigger a short-term pullback.
Overall: BTC remains bullish, but traders should watch the $82K breakout carefully because profit-taking could increase near this resistance zone.#BitcoinHoldsNear$79400 #BitcoinTops$80KThreeMonthHigh
{spot}(BTCUSDT)
$BTC Bitcoin (BTC) is showing strong bullish momentum after reclaiming the $80,000 area and recently reaching around $81,200.
🟢 Resistance: $81,000–$82,000 🟢 Next target: $85,000–$90,000 if BTC breaks and holds above $82K 🔴 Support: $78,000–$80,000 ⚠️ A rejection around $81K–$82K could trigger a short-term pullback.
Overall: BTC remains bullish, but traders should watch the $82K breakout carefully because profit-taking could increase near this resistance zone.#BitcoinHoldsNear$79400 #BitcoinTops$80KThreeMonthHigh
🟢 Resistance: $81,000–$82,000 🟢 Next target: $85,000–$90,000 if BTC breaks and holds above $82K 🔴 Support: $78,000–$80,000 ⚠️ A rejection around $81K–$82K could trigger a short-term pullback.
Overall: BTC remains bullish, but traders should watch the $82K breakout carefully because profit-taking could increase near this resistance zone.#BitcoinHoldsNear$79400 #BitcoinTops$80KThreeMonthHigh
144

$BTC
{spot}(BTCUSDT)
$ETH
{spot}(ETHUSDT)
$XRP
{spot}(XRPUSDT)
🚨 Bitcoin Tops $80K — 3-Month High! ₿🔥
Bitcoin has broken back above $80,000, reaching around $81,200+, its highest level in roughly three months. 
Key levels to watch:
• 🟢 $80K: important support if bulls hold it
• 🔥 $81K–$82K: major resistance zone
• 🚀 Break above $82K: could open the path toward $85K–$90K
• 🔴 Rejection below $80K: risk of a pullback toward $78K–$75K
The current momentum is bullish, but today’s large BTC options expiry could increase short-term volatility. 
Title: 🚨 Bitcoin Tops $80K: 3-Month High — Can BTC Break $82K Next?#BitcoinTops$80KThreeMonthHigh
$BTC
$ETH
$XRP
🚨 Bitcoin Tops $80K — 3-Month High! ₿🔥
Bitcoin has broken back above $80,000, reaching around $81,200+, its highest level in roughly three months. 
Key levels to watch:
• 🟢 $80K: important support if bulls hold it
• 🔥 $81K–$82K: major resistance zone
• 🚀 Break above $82K: could open the path toward $85K–$90K
• 🔴 Rejection below $80K: risk of a pullback toward $78K–$75K
The current momentum is bullish, but today’s large BTC options expiry could increase short-term volatility. 
Title: 🚨 Bitcoin Tops $80K: 3-Month High — Can BTC Break $82K Next?#BitcoinTops$80KThreeMonthHigh
$ETH
$XRP
🚨 Bitcoin Tops $80K — 3-Month High! ₿🔥
Bitcoin has broken back above $80,000, reaching around $81,200+, its highest level in roughly three months. 
Key levels to watch:
• 🟢 $80K: important support if bulls hold it
• 🔥 $81K–$82K: major resistance zone
• 🚀 Break above $82K: could open the path toward $85K–$90K
• 🔴 Rejection below $80K: risk of a pullback toward $78K–$75K
The current momentum is bullish, but today’s large BTC options expiry could increase short-term volatility. 
Title: 🚨 Bitcoin Tops $80K: 3-Month High — Can BTC Break $82K Next?#BitcoinTops$80KThreeMonthHigh
145

·
--
Bullish
#BitcoinTops$80KThreeMonthHigh
₿ Bitcoin Hit $80K… But the $81K–$82K Wall Is What Matters 👀
Bitcoin pushed above $80,000, reaching around $81,265 — its highest level in roughly three months.
Everyone is watching $80K.
But the bigger question is:
Can $BTC actually turn this breakout into support?
🔥 What Powered the Move?
This rally wasn't driven by one factor.
🏦 ETF demand: U.S. spot Bitcoin ETFs recorded 8 straight sessions of inflows, with roughly $2.8B flowing in during the streak.
💧 Macro liquidity: Larger U.S. Treasury long-term bond buybacks helped push yields and the dollar lower, giving risk assets another tailwind.
⚡ Short squeeze: More than $4B in short positions were reportedly liquidated over several days, adding forced buying pressure.
So the move became a feedback loop:
Spot demand added fuel.
Short liquidations accelerated it.
📉 Then BTC Hit the Wall
Bitcoin reached roughly $81,265 before pulling back.
The weekly chart shows why this area matters:
→ $80K: psychological level
→ $81K–$81.3K: immediate resistance / 50-week MA area
→ ~$82.2K: next breakout test
So $80K is the headline.
$81K–$82K is the real test.
🧠 What Most People Miss
Rising ETF assets don't automatically mean the same amount of new money entered Bitcoin.
Part of the increase can simply come from BTC already held by ETFs becoming more valuable as price rises.
That's why ETF inflows matter more than headline AUM growth.
⚠️ And the Weekly Close Matters
BTC has reclaimed $80K, but the current weekly candle has not closed yet.
If BTC holds above $80K and breaks the $81K–$82K zone, the recovery becomes much more interesting.
If rejected, the market may need more time to build a base.
💡 Square Insight:
The $80K comeback is real.
But the next signal isn't another headline.
It's whether spot demand can keep $BTC above $80K after the short-squeeze fuel fades.
Can BTC close the week above $80K and break $81K–$82K — or is this another rejection? 👀
#Bitcoin #BTC #CryptoMarket $BTC
{future}(BTCUSDT)
#BitcoinTops$80KThreeMonthHigh
₿ Bitcoin Hit $80K… But the $81K–$82K Wall Is What Matters 👀
Bitcoin pushed above $80,000, reaching around $81,265 — its highest level in roughly three months.
Everyone is watching $80K.
But the bigger question is:
Can $BTC actually turn this breakout into support?
🔥 What Powered the Move?
This rally wasn't driven by one factor.
🏦 ETF demand: U.S. spot Bitcoin ETFs recorded 8 straight sessions of inflows, with roughly $2.8B flowing in during the streak.
💧 Macro liquidity: Larger U.S. Treasury long-term bond buybacks helped push yields and the dollar lower, giving risk assets another tailwind.
⚡ Short squeeze: More than $4B in short positions were reportedly liquidated over several days, adding forced buying pressure.
So the move became a feedback loop:
Spot demand added fuel.
Short liquidations accelerated it.
📉 Then BTC Hit the Wall
Bitcoin reached roughly $81,265 before pulling back.
The weekly chart shows why this area matters:
→ $80K: psychological level
→ $81K–$81.3K: immediate resistance / 50-week MA area
→ ~$82.2K: next breakout test
So $80K is the headline.
$81K–$82K is the real test.
🧠 What Most People Miss
Rising ETF assets don't automatically mean the same amount of new money entered Bitcoin.
Part of the increase can simply come from BTC already held by ETFs becoming more valuable as price rises.
That's why ETF inflows matter more than headline AUM growth.
⚠️ And the Weekly Close Matters
BTC has reclaimed $80K, but the current weekly candle has not closed yet.
If BTC holds above $80K and breaks the $81K–$82K zone, the recovery becomes much more interesting.
If rejected, the market may need more time to build a base.
💡 Square Insight:
The $80K comeback is real.
But the next signal isn't another headline.
It's whether spot demand can keep $BTC above $80K after the short-squeeze fuel fades.
Can BTC close the week above $80K and break $81K–$82K — or is this another rejection? 👀
#Bitcoin #BTC #CryptoMarket $BTC
₿ Bitcoin Hit $80K… But the $81K–$82K Wall Is What Matters 👀
Bitcoin pushed above $80,000, reaching around $81,265 — its highest level in roughly three months.
Everyone is watching $80K.
But the bigger question is:
Can $BTC actually turn this breakout into support?
🔥 What Powered the Move?
This rally wasn't driven by one factor.
🏦 ETF demand: U.S. spot Bitcoin ETFs recorded 8 straight sessions of inflows, with roughly $2.8B flowing in during the streak.
💧 Macro liquidity: Larger U.S. Treasury long-term bond buybacks helped push yields and the dollar lower, giving risk assets another tailwind.
⚡ Short squeeze: More than $4B in short positions were reportedly liquidated over several days, adding forced buying pressure.
So the move became a feedback loop:
Spot demand added fuel.
Short liquidations accelerated it.
📉 Then BTC Hit the Wall
Bitcoin reached roughly $81,265 before pulling back.
The weekly chart shows why this area matters:
→ $80K: psychological level
→ $81K–$81.3K: immediate resistance / 50-week MA area
→ ~$82.2K: next breakout test
So $80K is the headline.
$81K–$82K is the real test.
🧠 What Most People Miss
Rising ETF assets don't automatically mean the same amount of new money entered Bitcoin.
Part of the increase can simply come from BTC already held by ETFs becoming more valuable as price rises.
That's why ETF inflows matter more than headline AUM growth.
⚠️ And the Weekly Close Matters
BTC has reclaimed $80K, but the current weekly candle has not closed yet.
If BTC holds above $80K and breaks the $81K–$82K zone, the recovery becomes much more interesting.
If rejected, the market may need more time to build a base.
💡 Square Insight:
The $80K comeback is real.
But the next signal isn't another headline.
It's whether spot demand can keep $BTC above $80K after the short-squeeze fuel fades.
Can BTC close the week above $80K and break $81K–$82K — or is this another rejection? 👀
#Bitcoin #BTC #CryptoMarket $BTC
123

·
--
$BTC is showing strong bullish momentum after breaking above the $80,000 level. BTC recently climbed to around $81,200, reaching a three-month high as renewed institutional demand and strong spot Bitcoin ETF inflows supported the rally.
📊 Key Levels
Current zone: Around $79K–$80K
Resistance: $80K–$82K
Next target: $85K–$90K
Major support: $76K–$77.5K
If $BTC can hold above $80K and break through the $82K resistance, the next major target could be the $85K–$90K zone. Continued ETF inflows are also strengthening the bullish market sentiment.
Overall: 🟢 Bullish
Bitcoin's momentum remains strong, with $82K acting as the key level to watch next.
{spot}(BTCUSDT)
#OktaCrowdStrikeSurgeOnEarningsBeat #BitcoinHoldsNear$79400 #BitcoinTops$80KThreeMonthHigh #BestBuyQ2RevenueTopsEstimatesLiftsOutlook
$BTC is showing strong bullish momentum after breaking above the $80,000 level. BTC recently climbed to around $81,200, reaching a three-month high as renewed institutional demand and strong spot Bitcoin ETF inflows supported the rally.
📊 Key Levels
Current zone: Around $79K–$80K
Resistance: $80K–$82K
Next target: $85K–$90K
Major support: $76K–$77.5K
If $BTC can hold above $80K and break through the $82K resistance, the next major target could be the $85K–$90K zone. Continued ETF inflows are also strengthening the bullish market sentiment.
Overall: 🟢 Bullish
Bitcoin's momentum remains strong, with $82K acting as the key level to watch next.
#OktaCrowdStrikeSurgeOnEarningsBeat #BitcoinHoldsNear$79400 #BitcoinTops$80KThreeMonthHigh #BestBuyQ2RevenueTopsEstimatesLiftsOutlook
📊 Key Levels
Current zone: Around $79K–$80K
Resistance: $80K–$82K
Next target: $85K–$90K
Major support: $76K–$77.5K
If $BTC can hold above $80K and break through the $82K resistance, the next major target could be the $85K–$90K zone. Continued ETF inflows are also strengthening the bullish market sentiment.
Overall: 🟢 Bullish
Bitcoin's momentum remains strong, with $82K acting as the key level to watch next.
#OktaCrowdStrikeSurgeOnEarningsBeat #BitcoinHoldsNear$79400 #BitcoinTops$80KThreeMonthHigh #BestBuyQ2RevenueTopsEstimatesLiftsOutlook
157

$80K is no longer just a target — Bitcoin has touched it again. 🔥
$BTC climbed above $80,000 for the first time in more than three months, showing renewed strength across the market.
Now the focus shifts toward whether buyers can maintain these elevated levels.
#BitcoinTops$80KThreeMonthHigh
$80K is no longer just a target — Bitcoin has touched it again. 🔥
$BTC climbed above $80,000 for the first time in more than three months, showing renewed strength across the market.
Now the focus shifts toward whether buyers can maintain these elevated levels.
#BitcoinTops$80KThreeMonthHigh
$BTC climbed above $80,000 for the first time in more than three months, showing renewed strength across the market.
Now the focus shifts toward whether buyers can maintain these elevated levels.
#BitcoinTops$80KThreeMonthHigh
59
Three months later, Bitcoin is back at $80K. 📈
The latest $BTC move pushed price above a major psychological level and toward the $81K area.
Strong rallies can bring volatility, but reclaiming important levels keeps long-term investors watching closely.
#BitcoinTops$80KThreeMonthHigh
Three months later, Bitcoin is back at $80K. 📈
The latest $BTC move pushed price above a major psychological level and toward the $81K area.
Strong rallies can bring volatility, but reclaiming important levels keeps long-term investors watching closely.
#BitcoinTops$80KThreeMonthHigh
The latest $BTC move pushed price above a major psychological level and toward the $81K area.
Strong rallies can bring volatility, but reclaiming important levels keeps long-term investors watching closely.
#BitcoinTops$80KThreeMonthHigh
54

Bitcoin (BTC) — Latest Analysis
$BTC is trading near $79K, after briefly breaking above $80K. Analysts are watching $80K–$82K as the major resistance zone, while $77K is an important near-term support.
🟢 Bullish: Break above $82K → potential continuation toward $85K+
🔴 Bearish: Drop below $77K → possible deeper consolidation
📊 Analyst view: Cautiously bullish, but elevated RSI suggests a pullback/consolidation is possible.
{spot}(BTCUSDT)
#OktaCrowdStrikeSurgeOnEarningsBeat #BitcoinHoldsNear$79400 #BitcoinTops$80KThreeMonthHigh #BestBuyQ2RevenueTopsEstimatesLiftsOutlook
Bitcoin (BTC) — Latest Analysis
$BTC is trading near $79K, after briefly breaking above $80K. Analysts are watching $80K–$82K as the major resistance zone, while $77K is an important near-term support.
🟢 Bullish: Break above $82K → potential continuation toward $85K+
🔴 Bearish: Drop below $77K → possible deeper consolidation
📊 Analyst view: Cautiously bullish, but elevated RSI suggests a pullback/consolidation is possible.
#OktaCrowdStrikeSurgeOnEarningsBeat #BitcoinHoldsNear$79400 #BitcoinTops$80KThreeMonthHigh #BestBuyQ2RevenueTopsEstimatesLiftsOutlook
$BTC is trading near $79K, after briefly breaking above $80K. Analysts are watching $80K–$82K as the major resistance zone, while $77K is an important near-term support.
🟢 Bullish: Break above $82K → potential continuation toward $85K+
🔴 Bearish: Drop below $77K → possible deeper consolidation
📊 Analyst view: Cautiously bullish, but elevated RSI suggests a pullback/consolidation is possible.
#OktaCrowdStrikeSurgeOnEarningsBeat #BitcoinHoldsNear$79400 #BitcoinTops$80KThreeMonthHigh #BestBuyQ2RevenueTopsEstimatesLiftsOutlook
133

Bitcoin back above $80K changes the psychology fast.
A three-month high isn't just another number. It puts BTC back near a zone where momentum traders start paying attention and sidelined liquidity can return.
The key question now: breakout continuation or liquidity trap?
$RUNE $ENA $CHIP
#BTC #Bitcoin #CryptoTrading #BitcoinTops$80KThreeMonthHigh
Bitcoin back above $80K changes the psychology fast.
A three-month high isn't just another number. It puts BTC back near a zone where momentum traders start paying attention and sidelined liquidity can return.
The key question now: breakout continuation or liquidity trap?
$RUNE $ENA $CHIP
#BTC #Bitcoin #CryptoTrading #BitcoinTops$80KThreeMonthHigh
A three-month high isn't just another number. It puts BTC back near a zone where momentum traders start paying attention and sidelined liquidity can return.
The key question now: breakout continuation or liquidity trap?
$RUNE $ENA $CHIP
#BTC #Bitcoin #CryptoTrading #BitcoinTops$80KThreeMonthHigh
1
71

·
--
Bullish
🚀 #BitcoinTops$80KThreeMonthHigh and the bulls are officially out of hibernation! 🐻❌ BTC just smashed past 80,000 USDT like it was a cheap meme coin, fueled by a massive 8-day ETF buying streak.
With $2.8B flooding into ETFs this month, we aren't just squeezing shorts anymore—this is pure, institutional spot-buying power. So, what’s next? Is the $83K resistance the next stop, or are we blasting straight to the moon? 📈
What should traders do?
1️⃣ Stop checking your portfolio every 5 seconds (just kidding, do it).
2️⃣ Watch the $83K wall closely.
3️⃣ Don’t leverage your house; this rally is driven by spot, not crazy leverage!
⚠️ Not financial advice. Always DYOR!
New to the rocket ship? Register on Binance using code VINHTOCDO or click here: [https://www.binance.com/register?ref=VINHTOCDO](https://www.binance.com/register?ref=VINHTOCDO) 💰
#BTC #BitcoinETF #VINHTOCDO #BullMarket
$BTC
{future}(BTCUSDT)
$ETH
{future}(ETHUSDT)
$BNB
{future}(BNBUSDT)
🚀 #BitcoinTops$80KThreeMonthHigh and the bulls are officially out of hibernation! 🐻❌ BTC just smashed past 80,000 USDT like it was a cheap meme coin, fueled by a massive 8-day ETF buying streak.
With $2.8B flooding into ETFs this month, we aren't just squeezing shorts anymore—this is pure, institutional spot-buying power. So, what’s next? Is the $83K resistance the next stop, or are we blasting straight to the moon? 📈
What should traders do?
1️⃣ Stop checking your portfolio every 5 seconds (just kidding, do it).
2️⃣ Watch the $83K wall closely.
3️⃣ Don’t leverage your house; this rally is driven by spot, not crazy leverage!
⚠️ Not financial advice. Always DYOR!
New to the rocket ship? Register on Binance using code VINHTOCDO or click here: https://www.binance.com/register?ref=VINHTOCDO 💰
#BTC #BitcoinETF #VINHTOCDO #BullMarket
$BTC
$ETH
$BNB
With $2.8B flooding into ETFs this month, we aren't just squeezing shorts anymore—this is pure, institutional spot-buying power. So, what’s next? Is the $83K resistance the next stop, or are we blasting straight to the moon? 📈
What should traders do?
1️⃣ Stop checking your portfolio every 5 seconds (just kidding, do it).
2️⃣ Watch the $83K wall closely.
3️⃣ Don’t leverage your house; this rally is driven by spot, not crazy leverage!
⚠️ Not financial advice. Always DYOR!
New to the rocket ship? Register on Binance using code VINHTOCDO or click here: https://www.binance.com/register?ref=VINHTOCDO 💰
#BTC #BitcoinETF #VINHTOCDO #BullMarket
$BTC
$ETH
$BNB
4
189

·
--
Bullish
$BTC
BTC respects the institutional demand block and maintains its bullish channel. We expect a break of the nearest highest point to sweep the upper liquidity pool.
✅ Entry price: 80010
📈 Targets: 81250, 82800, 85000
📉 Stop loss: 78200
{future}(BTCUSDT)
#BTC #BitcoinHoldsNear$79400 #BitcoinTops$80KThreeMonthHigh #trading
$BTC
BTC respects the institutional demand block and maintains its bullish channel. We expect a break of the nearest highest point to sweep the upper liquidity pool.
✅ Entry price: 80010
📈 Targets: 81250, 82800, 85000
📉 Stop loss: 78200
#BTC #BitcoinHoldsNear$79400 #BitcoinTops$80KThreeMonthHigh #trading
BTC respects the institutional demand block and maintains its bullish channel. We expect a break of the nearest highest point to sweep the upper liquidity pool.
✅ Entry price: 80010
📈 Targets: 81250, 82800, 85000
📉 Stop loss: 78200
#BTC #BitcoinHoldsNear$79400 #BitcoinTops$80KThreeMonthHigh #trading
136

·
--
$BTC Bitcoin (BTC) — Latest Analysis
Bitcoin is trading around $80.6K, after recently breaking above the $80K area and reaching roughly $81.2K. Momentum remains bullish, but the move is becoming stretched: analysts are watching $80K–$82K as major resistance, while a loss of $80K could trigger profit-taking and a deeper pullback. (The Cryptonomist)
Outlook: Bullish above $80K, with a possible push toward new highs if resistance breaks convincingly. Short-term volatility remains high, so risk management is important. This is market analysis, not financial advice.$BTC
#OktaCrowdStrikeSurgeOnEarningsBeat #BitcoinHoldsNear$79400 #BitcoinTops$80KThreeMonthHigh #BestBuyQ2RevenueTopsEstimatesLiftsOutlook #BestBuyQ2RevenueTopsEstimatesLiftsOutlook
$BTC Bitcoin (BTC) — Latest Analysis
Bitcoin is trading around $80.6K, after recently breaking above the $80K area and reaching roughly $81.2K. Momentum remains bullish, but the move is becoming stretched: analysts are watching $80K–$82K as major resistance, while a loss of $80K could trigger profit-taking and a deeper pullback. (The Cryptonomist)
Outlook: Bullish above $80K, with a possible push toward new highs if resistance breaks convincingly. Short-term volatility remains high, so risk management is important. This is market analysis, not financial advice.$BTC
#OktaCrowdStrikeSurgeOnEarningsBeat #BitcoinHoldsNear$79400 #BitcoinTops$80KThreeMonthHigh #BestBuyQ2RevenueTopsEstimatesLiftsOutlook #BestBuyQ2RevenueTopsEstimatesLiftsOutlook
Bitcoin is trading around $80.6K, after recently breaking above the $80K area and reaching roughly $81.2K. Momentum remains bullish, but the move is becoming stretched: analysts are watching $80K–$82K as major resistance, while a loss of $80K could trigger profit-taking and a deeper pullback. (The Cryptonomist)
Outlook: Bullish above $80K, with a possible push toward new highs if resistance breaks convincingly. Short-term volatility remains high, so risk management is important. This is market analysis, not financial advice.$BTC
#OktaCrowdStrikeSurgeOnEarningsBeat #BitcoinHoldsNear$79400 #BitcoinTops$80KThreeMonthHigh #BestBuyQ2RevenueTopsEstimatesLiftsOutlook #BestBuyQ2RevenueTopsEstimatesLiftsOutlook
1
2
140

·
--
Article
Aug 27 - Crypto Market Snapshot: BTC Reclaims $80K as Volatility Builds$BTC Bitcoin is back above $80,000, but the market is heading into a decisive 24 hours.
After briefly slipping below $79K earlier today, BTC saw aggressive buy-side demand and quickly reclaimed the $80K level. $ETH Ethereum is holding steady around $2,4940 - $2,520, $SOL Solana has pushed back above $104, and total crypto market capitalization sits between $2.75T and $2.78T.
The bounce is encouraging, but volatility remains elevated. For now, the broader bullish structure is still intact.
Institutional Demand Keeps The Bid Alive
The core support for this move continues to be spot ETF flows. U.S. Spot Bitcoin ETFs recorded approximately $1.92B in net inflows last week, marking multiple consecutive days of positive inflows.
This sustained institutional demand is the primary reason BTC continues to challenge and hold above $80K despite short-term shakeouts.
$6.4 Billion Options Expiry Puts $80K to the Test
The next major hurdle is tomorrow. On August 28, around 81,700 BTC options with a notional value of $6.4B are set to expire on Deribit.
Open interest is heavily concentrated around the $75K and $80K strikes, which sets the stage for increased volatility. Expect sharp up-and-down sweeps as market makers hedge. $80K is once again the key battleground to watch.
Regulatory and Ecosystem Updates
On the regulatory front, the SEC's proposed amendments to digital asset custody rules have entered White House review. If finalized, the changes would directly impact how investment advisers and qualified custodians handle crypto, potentially opening the door for much larger institutional capital inflows.
On Ethereum, the upcoming Glamsterdam upgrade has moved into pre-testing. The upgrade will adjust certain gas costs, which may affect a small number of smart contracts. No action is required for regular users, but development teams are advised to begin compatibility testing.
All Eyes on Jackson Hole
The biggest macro catalyst this week is still Jackson Hole. Fed Chair Kevin Warsh is scheduled to speak on August 28, and markets will be closely parsing his comments on interest rates, liquidity, and the future policy path.
Final Take
Bitcoin has reclaimed $80K, but this is more than just a recovery. With a $6.4B options expiry, the Jackson Hole meeting, and stretched sentiment all converging tomorrow, the real question for the market is no longer can BTC rise - it's whether $80K can finally flip from resistance into solid support
#BitcoinHoldsNear$79400
#Write2Earn #BitcoinTops$80KThreeMonthHigh #ChinaOpposesUSProposed7.5%Tariff
Aug 27 - Crypto Market Snapshot: BTC Reclaims $80K as Volatility Builds
$BTC Bitcoin is back above $80,000, but the market is heading into a decisive 24 hours.
After briefly slipping below $79K earlier today, BTC saw aggressive buy-side demand and quickly reclaimed the $80K level. $ETH Ethereum is holding steady around $2,4940 - $2,520, $SOL Solana has pushed back above $104, and total crypto market capitalization sits between $2.75T and $2.78T.
The bounce is encouraging, but volatility remains elevated. For now, the broader bullish structure is still intact.
Institutional Demand Keeps The Bid Alive
The core support for this move continues to be spot ETF flows. U.S. Spot Bitcoin ETFs recorded approximately $1.92B in net inflows last week, marking multiple consecutive days of positive inflows.
This sustained institutional demand is the primary reason BTC continues to challenge and hold above $80K despite short-term shakeouts.
$6.4 Billion Options Expiry Puts $80K to the Test
The next major hurdle is tomorrow. On August 28, around 81,700 BTC options with a notional value of $6.4B are set to expire on Deribit.
Open interest is heavily concentrated around the $75K and $80K strikes, which sets the stage for increased volatility. Expect sharp up-and-down sweeps as market makers hedge. $80K is once again the key battleground to watch.
Regulatory and Ecosystem Updates
On the regulatory front, the SEC's proposed amendments to digital asset custody rules have entered White House review. If finalized, the changes would directly impact how investment advisers and qualified custodians handle crypto, potentially opening the door for much larger institutional capital inflows.
On Ethereum, the upcoming Glamsterdam upgrade has moved into pre-testing. The upgrade will adjust certain gas costs, which may affect a small number of smart contracts. No action is required for regular users, but development teams are advised to begin compatibility testing.
All Eyes on Jackson Hole
The biggest macro catalyst this week is still Jackson Hole. Fed Chair Kevin Warsh is scheduled to speak on August 28, and markets will be closely parsing his comments on interest rates, liquidity, and the future policy path.
Final Take
Bitcoin has reclaimed $80K, but this is more than just a recovery. With a $6.4B options expiry, the Jackson Hole meeting, and stretched sentiment all converging tomorrow, the real question for the market is no longer can BTC rise - it's whether $80K can finally flip from resistance into solid support
#BitcoinHoldsNear$79400
#Write2Earn #BitcoinTops$80KThreeMonthHigh #ChinaOpposesUSProposed7.5%Tariff
After briefly slipping below $79K earlier today, BTC saw aggressive buy-side demand and quickly reclaimed the $80K level. $ETH Ethereum is holding steady around $2,4940 - $2,520, $SOL Solana has pushed back above $104, and total crypto market capitalization sits between $2.75T and $2.78T.
The bounce is encouraging, but volatility remains elevated. For now, the broader bullish structure is still intact.
Institutional Demand Keeps The Bid Alive
The core support for this move continues to be spot ETF flows. U.S. Spot Bitcoin ETFs recorded approximately $1.92B in net inflows last week, marking multiple consecutive days of positive inflows.
This sustained institutional demand is the primary reason BTC continues to challenge and hold above $80K despite short-term shakeouts.
$6.4 Billion Options Expiry Puts $80K to the Test
The next major hurdle is tomorrow. On August 28, around 81,700 BTC options with a notional value of $6.4B are set to expire on Deribit.
Open interest is heavily concentrated around the $75K and $80K strikes, which sets the stage for increased volatility. Expect sharp up-and-down sweeps as market makers hedge. $80K is once again the key battleground to watch.
Regulatory and Ecosystem Updates
On the regulatory front, the SEC's proposed amendments to digital asset custody rules have entered White House review. If finalized, the changes would directly impact how investment advisers and qualified custodians handle crypto, potentially opening the door for much larger institutional capital inflows.
On Ethereum, the upcoming Glamsterdam upgrade has moved into pre-testing. The upgrade will adjust certain gas costs, which may affect a small number of smart contracts. No action is required for regular users, but development teams are advised to begin compatibility testing.
All Eyes on Jackson Hole
The biggest macro catalyst this week is still Jackson Hole. Fed Chair Kevin Warsh is scheduled to speak on August 28, and markets will be closely parsing his comments on interest rates, liquidity, and the future policy path.
Final Take
Bitcoin has reclaimed $80K, but this is more than just a recovery. With a $6.4B options expiry, the Jackson Hole meeting, and stretched sentiment all converging tomorrow, the real question for the market is no longer can BTC rise - it's whether $80K can finally flip from resistance into solid support
#BitcoinHoldsNear$79400
#Write2Earn #BitcoinTops$80KThreeMonthHigh #ChinaOpposesUSProposed7.5%Tariff
2
6
416
$BTC just made a statement. ⚡
Bitcoin pushed through $80K and reached a three-month high around $81K.
The next chapter could be about consolidation, accumulation, and whether this breakout can hold its ground.
#BitcoinTops$80KThreeMonthHigh
$BTC just made a statement. ⚡
Bitcoin pushed through $80K and reached a three-month high around $81K.
The next chapter could be about consolidation, accumulation, and whether this breakout can hold its ground.
#BitcoinTops$80KThreeMonthHigh
Bitcoin pushed through $80K and reached a three-month high around $81K.
The next chapter could be about consolidation, accumulation, and whether this breakout can hold its ground.
#BitcoinTops$80KThreeMonthHigh
1
67

·
--
Article
Bitcoin at $80K: Breakout to $100K or Correction to $70K?📈📈Bitcoin has seen a rapid move upward and is now approaching a very important resistance zone around $82,000.*
If Bitcoin manages to break through this level and hold above it, the next main target could be $100,000.
If it fails to break through, we need to be prepared for a correction toward the $70,000 area.
Bitcoin at $80K: Breakout to $100K or Correction to $70K?📈📈
Bitcoin has seen a rapid move upward and is now approaching a very important resistance zone around $82,000.*
If Bitcoin manages to break through this level and hold above it, the next main target could be $100,000.
If it fails to break through, we need to be prepared for a correction toward the $70,000 area.
If Bitcoin manages to break through this level and hold above it, the next main target could be $100,000.
If it fails to break through, we need to be prepared for a correction toward the $70,000 area.
2
157

·
--
Bullish
#BitcoinTops$80KThreeMonthHigh
Bitcoin Reclaims $80K: The Real Trade Starts Here
BITCOIN IS BACK ABOVE $80,000
Bitcoin has climbed above the $80,000 level and reached its highest price in more than three months, with the move supported by renewed ETF demand, a softer U.S. dollar and improving liquidity expectations.
For traders, the key question is no longer simply whether BTC can touch $80K.
The real question is whether $80K can become strong support.
TRADER LEVELS TO WATCH:
$80,000–$82,000: Major resistance and breakout zone
Above $82,000: A confirmed breakout could strengthen bullish momentum
Around $78,800: Important short-term support area
Below $78,800: Momentum could weaken and trigger a deeper pullback
Bitcoin is currently showing strong momentum, but chasing a vertical move can be dangerous. The smarter approach is to watch how price reacts around $80K and wait for confirmation.
If BTC breaks and holds above resistance, traders may get a much cleaner continuation setup.
If price gets rejected, a retest of lower support could provide the next high-quality trading opportunity.
No FOMO. No blind leverage. Wait for confirmation, manage risk, and let price action make the decision.
BTC is at a critical level.
Are you watching the breakout or waiting for the retest?
$MOVR $VET $BEAMX
{future}(MOVRUSDT)
{future}(VETUSDT)
{future}(BEAMXUSDT)
#BitcoinTops$80KThreeMonthHigh
Bitcoin Reclaims $80K: The Real Trade Starts Here
BITCOIN IS BACK ABOVE $80,000
Bitcoin has climbed above the $80,000 level and reached its highest price in more than three months, with the move supported by renewed ETF demand, a softer U.S. dollar and improving liquidity expectations.
For traders, the key question is no longer simply whether BTC can touch $80K.
The real question is whether $80K can become strong support.
TRADER LEVELS TO WATCH:
$80,000–$82,000: Major resistance and breakout zone
Above $82,000: A confirmed breakout could strengthen bullish momentum
Around $78,800: Important short-term support area
Below $78,800: Momentum could weaken and trigger a deeper pullback
Bitcoin is currently showing strong momentum, but chasing a vertical move can be dangerous. The smarter approach is to watch how price reacts around $80K and wait for confirmation.
If BTC breaks and holds above resistance, traders may get a much cleaner continuation setup.
If price gets rejected, a retest of lower support could provide the next high-quality trading opportunity.
No FOMO. No blind leverage. Wait for confirmation, manage risk, and let price action make the decision.
BTC is at a critical level.
Are you watching the breakout or waiting for the retest?
$MOVR $VET $BEAMX
Bitcoin Reclaims $80K: The Real Trade Starts Here
BITCOIN IS BACK ABOVE $80,000
Bitcoin has climbed above the $80,000 level and reached its highest price in more than three months, with the move supported by renewed ETF demand, a softer U.S. dollar and improving liquidity expectations.
For traders, the key question is no longer simply whether BTC can touch $80K.
The real question is whether $80K can become strong support.
TRADER LEVELS TO WATCH:
$80,000–$82,000: Major resistance and breakout zone
Above $82,000: A confirmed breakout could strengthen bullish momentum
Around $78,800: Important short-term support area
Below $78,800: Momentum could weaken and trigger a deeper pullback
Bitcoin is currently showing strong momentum, but chasing a vertical move can be dangerous. The smarter approach is to watch how price reacts around $80K and wait for confirmation.
If BTC breaks and holds above resistance, traders may get a much cleaner continuation setup.
If price gets rejected, a retest of lower support could provide the next high-quality trading opportunity.
No FOMO. No blind leverage. Wait for confirmation, manage risk, and let price action make the decision.
BTC is at a critical level.
Are you watching the breakout or waiting for the retest?
$MOVR $VET $BEAMX
263
Log in to explore more content
Join global crypto users on Binance Square
⚡️ Get latest and useful information about crypto.
💬 Trusted by the world’s largest crypto exchange.
👍 Discover real insights from verified creators.
Email / Phone number
Trending Topics
1
#ArgentinaCentralBankWillNotPushCryptoIntoBankingForTwoYears
6,617 views
185 Discussing
2
#LedgerConfirmsUnauthorizedHardwareImplantInUserDevice
37,576 views
225 Discussing
3
#EtherETFsExtendOutflowsToNineDays
148,908 views
1,921 Discussing
4
#EthereumSurpasses2500USDT
335,608 views
3,012 Discussing
5
#XRPLedgerPatchesXRPCreationBug
370,052 views
3,316 Discussing
6
#STRKRisesAbout20%In24Hours
331,496 views
3,048 Discussing
7
#TetherFreezesUSDTLinkedToLedgerTheft
130,047 views
1,957 Discussing
8
#CFTCMovesToFoldEventContractsIntoSwapsRules
55,447 views
1,173 Discussing
9
#LedgerPausesCryptoBilisSales
98,588 views
1,062 Discussing
10
#EvernorthCompletesSPACMergerWithArmadaII
62,725 views
611 Discussing