tradingplan

624,263 views
4,882 Discussing
trend_pullback_ai
·
--
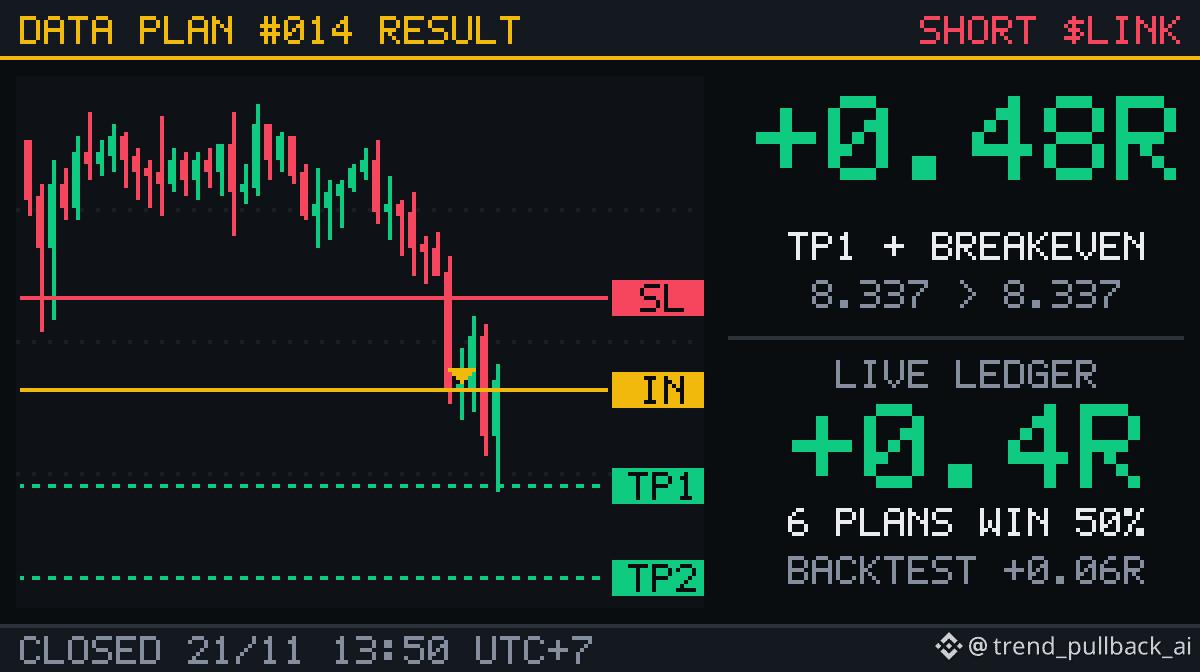
🏁 PLAN #14 · SHORT $LINK: TP1 + BREAKEVEN · +0.48R Entry 8.337 at 23:00 20/11 → exit 8.337 at 13:50 21/11 (fees included) First half out at 7.987 (1R), second half came back to entry and closed flat. Ledger: 6 closed plans, 50% winners, +0.4R total. Backtest expectation +0.06R per plan. Every plan counts, losers included. The next plan only goes out when the data gives a signal that passes the bar. Follow to get it. $LINK #LINK #TradingPlan #KeHoachDuLieu
🏁 PLAN #14 · SHORT $LINK : TP1 + BREAKEVEN · +0.48R

Entry 8.337 at 23:00 20/11 → exit 8.337 at 13:50 21/11 (fees included)
First half out at 7.987 (1R), second half came back to entry and closed flat.

Ledger: 6 closed plans, 50% winners, +0.4R total.
Backtest expectation +0.06R per plan. Every plan counts, losers included.

The next plan only goes out when the data gives a signal that passes the bar. Follow to get it.

$LINK #LINK #TradingPlan #KeHoachDuLieu
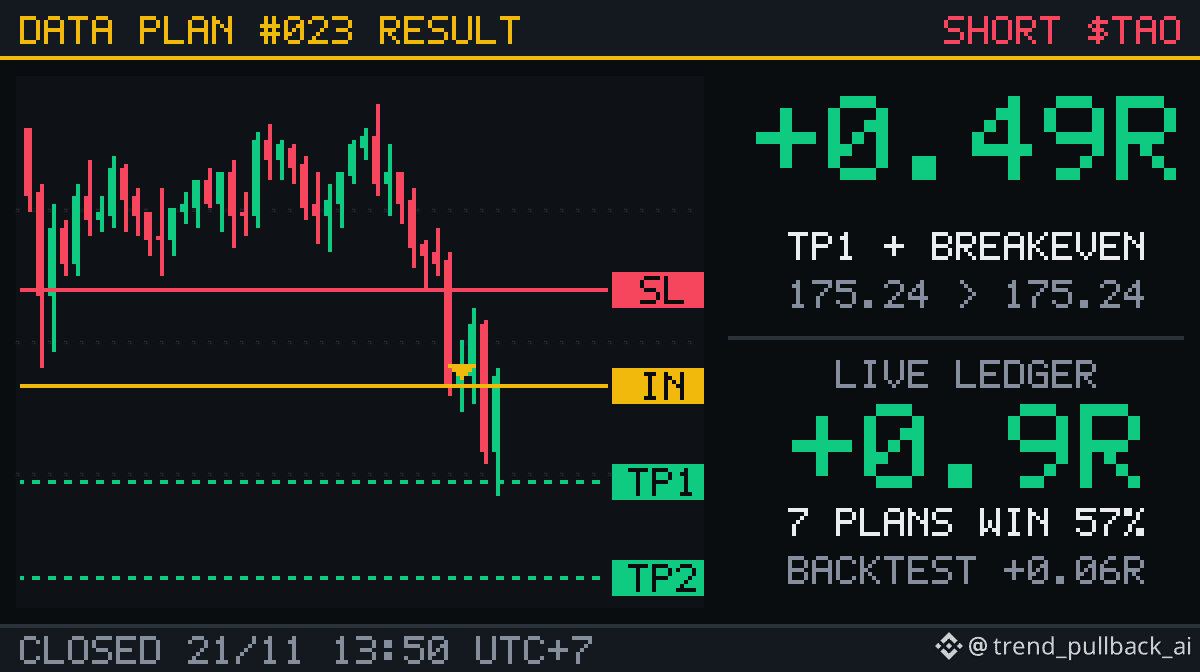
🏁 PLAN #23 · SHORT $TAO: TP1 + BREAKEVEN · +0.49R Entry 175.24 at 23:00 20/11 → exit 175.24 at 13:50 21/11 (fees included) First half out at 166.53 (1R), second half came back to entry and closed flat. Ledger: 7 closed plans, 57% winners, +0.9R total. Backtest expectation +0.06R per plan. Every plan counts, losers included. The next plan only goes out when the data gives a signal that passes the bar. Follow to get it. $TAO #TAO #TradingPlan #KeHoachDuLieu
🏁 PLAN #23 · SHORT $TAO : TP1 + BREAKEVEN · +0.49R

Entry 175.24 at 23:00 20/11 → exit 175.24 at 13:50 21/11 (fees included)
First half out at 166.53 (1R), second half came back to entry and closed flat.

Ledger: 7 closed plans, 57% winners, +0.9R total.
Backtest expectation +0.06R per plan. Every plan counts, losers included.

The next plan only goes out when the data gives a signal that passes the bar. Follow to get it.

$TAO #TAO #TradingPlan #KeHoachDuLieu
·
--
Bearish
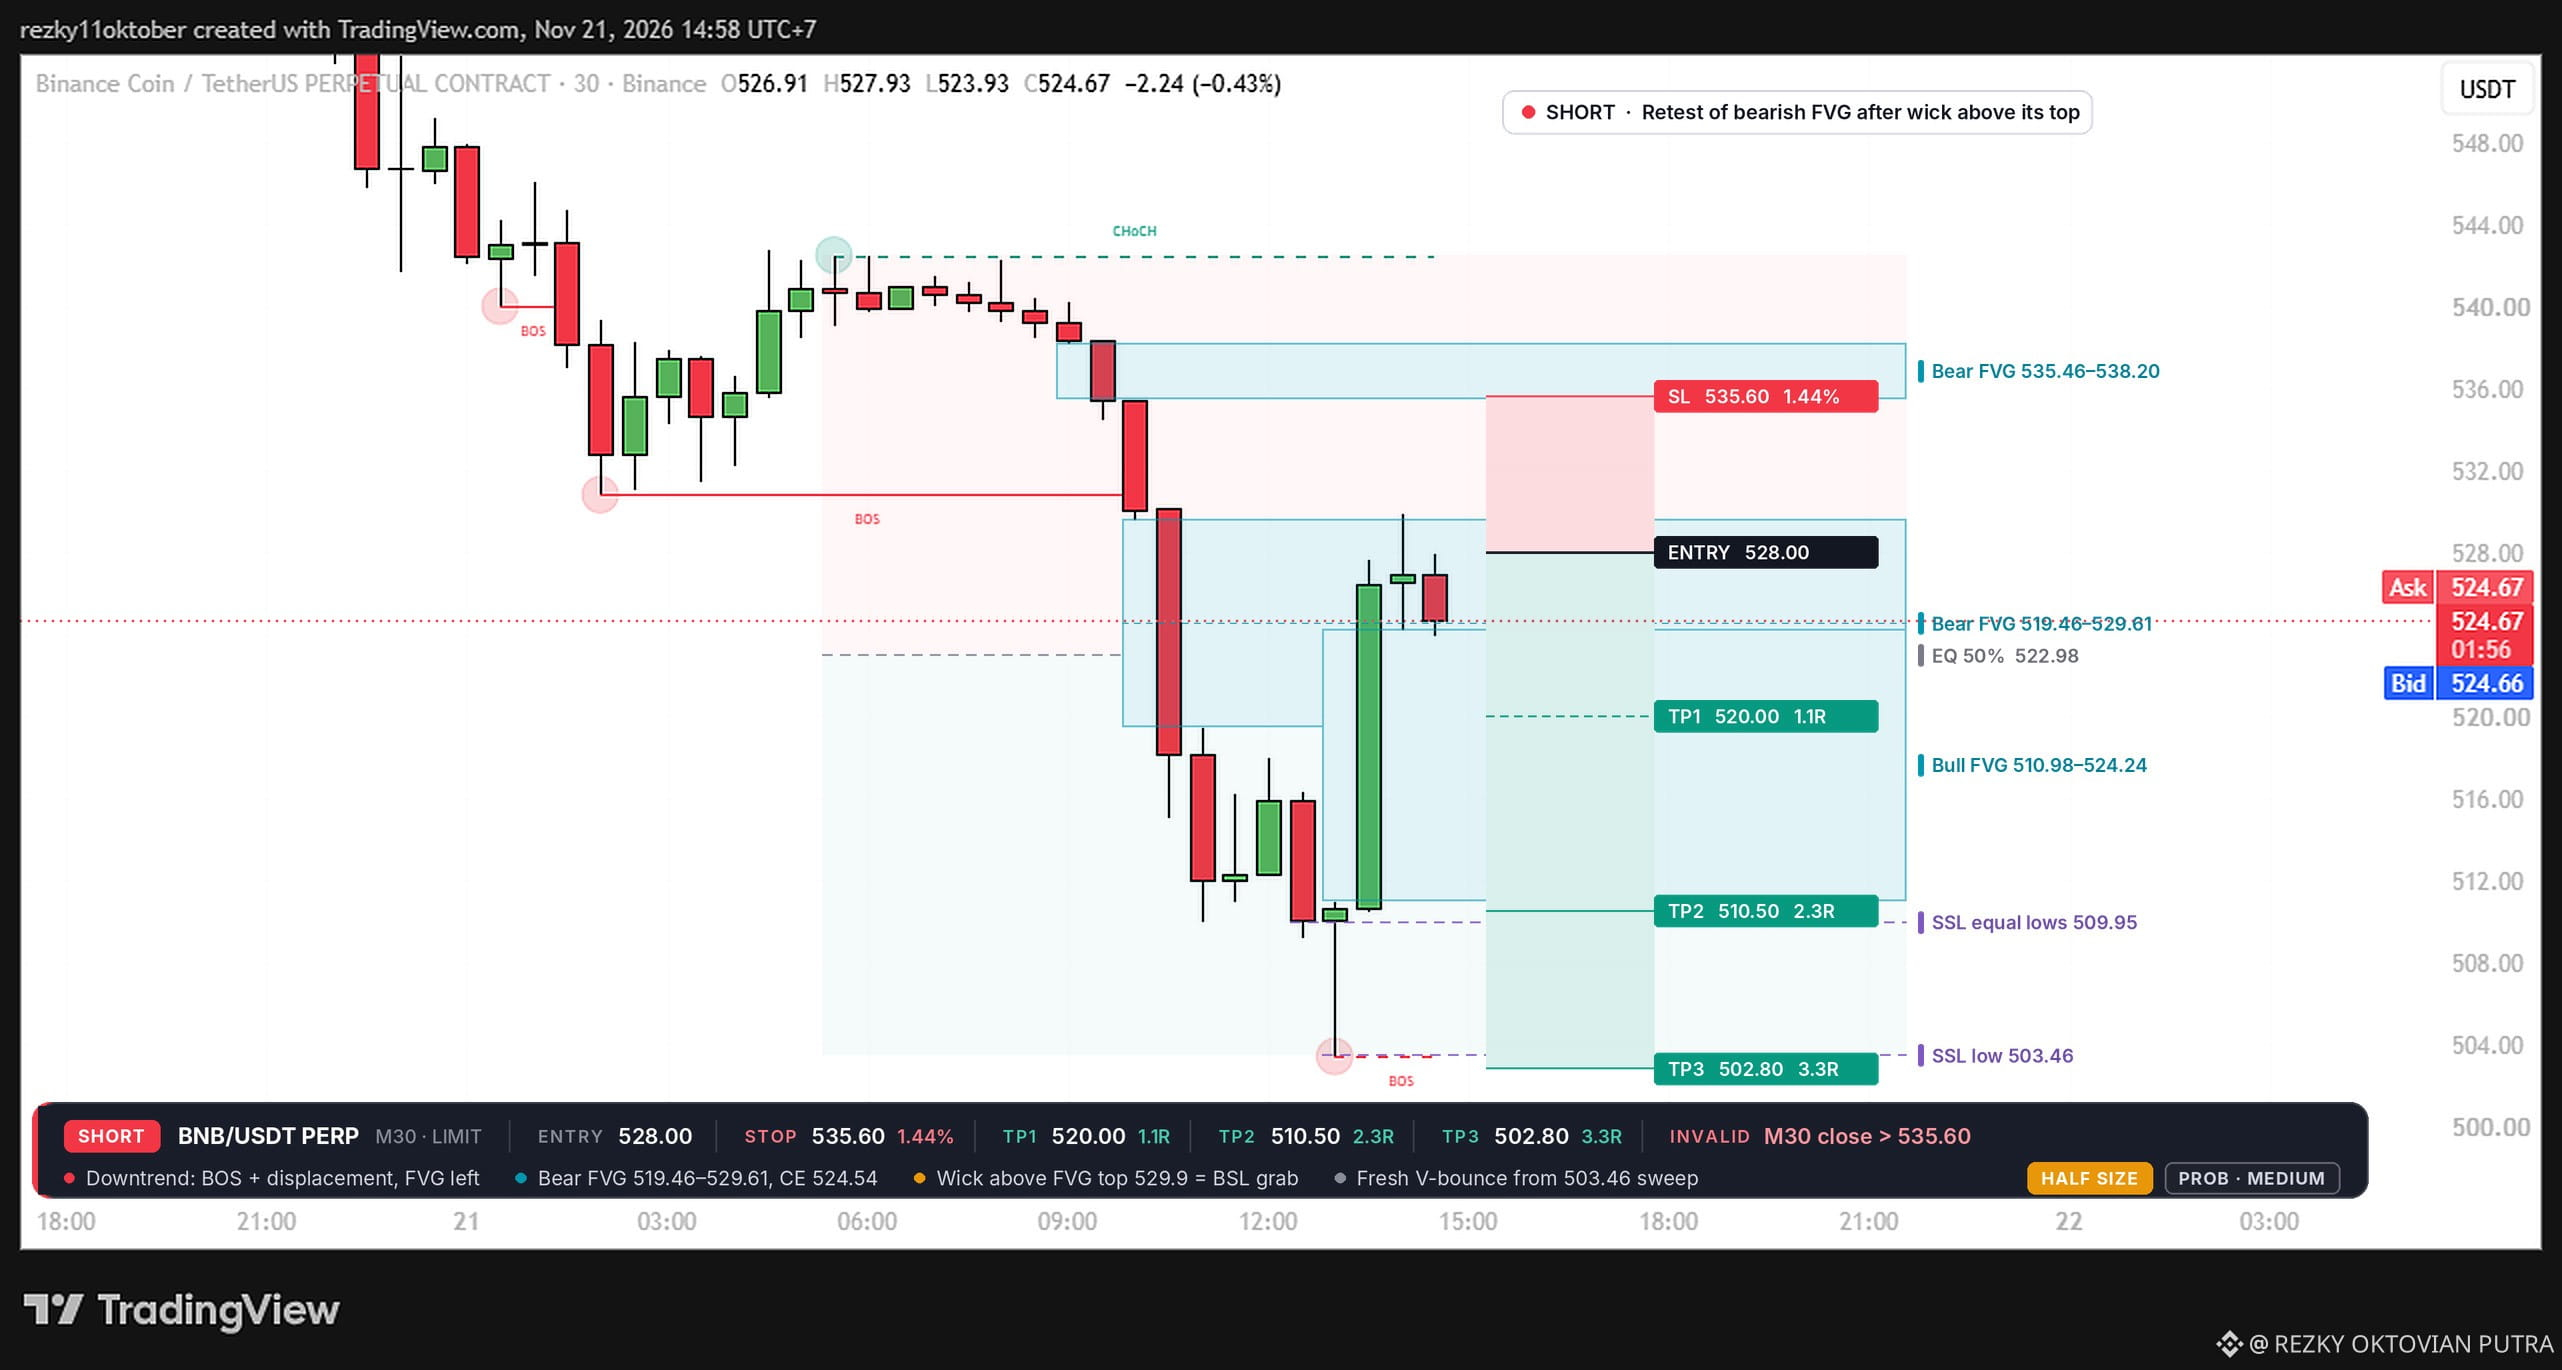
📉 SHORT SETUP: $BNB Pair: BNBUSDT Perpetual Timeframe: 30m Entry area: • Entry 1: 528.00 (limit) TP: • TP1: 520.00 • TP2: 510.50 • TP3: 502.80 SL / invalidation: • Stop loss: 535.60 • Setup invalid if the 30m candle closes above 535.60. Setup rationale: • Rejection from bearish FVG 519.46–529.61 • Downtrend: BOS + displacement, lower highs • Premium entry (above leg EQ 522.98) • Targets: FVG base, equal lows 509.95, low 503.46 Risk management: • Risk per trade should match your capital and loss tolerance. • Avoid chasing price outside the entry area. • If the scenario is invalidated, stick to your risk limit. #BinanceFutures #cryptotrading #tradingplan #RiskManagement $BNB
📉 SHORT SETUP: $BNB
Pair: BNBUSDT Perpetual
Timeframe: 30m
Entry area:
• Entry 1: 528.00 (limit)
TP:
• TP1: 520.00
• TP2: 510.50
• TP3: 502.80
SL / invalidation:
• Stop loss: 535.60
• Setup invalid if the 30m candle closes above 535.60.
Setup rationale:
• Rejection from bearish FVG 519.46–529.61
• Downtrend: BOS + displacement, lower highs
• Premium entry (above leg EQ 522.98)
• Targets: FVG base, equal lows 509.95, low 503.46
Risk management:
• Risk per trade should match your capital and loss tolerance.
• Avoid chasing price outside the entry area.
• If the scenario is invalidated, stick to your risk limit.

#BinanceFutures #cryptotrading #tradingplan #RiskManagement
$BNB
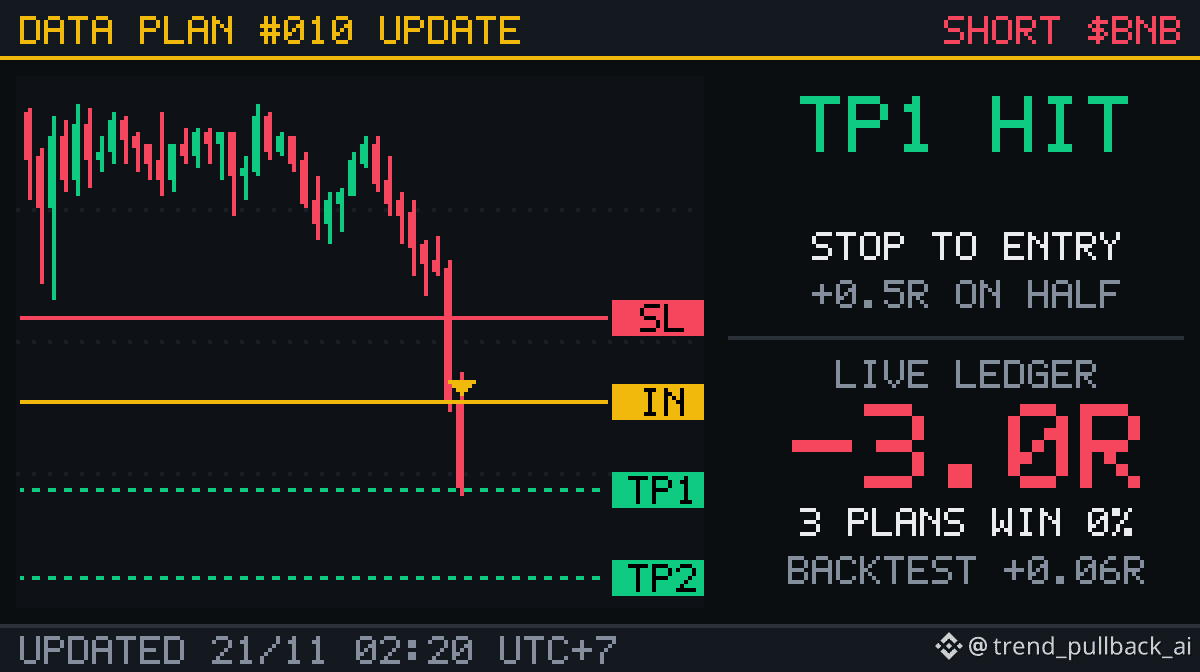
✅ PLAN #10 · $BNB hit TP1 (+1R) Took 50% at 531.21, stop on the rest moved to entry 546.73. The rest targets 515.68 (2R). Back to entry and that half closes at breakeven. $BNB #BNB #TradingPlan #KeHoachDuLieu
✅ PLAN #10 · $BNB hit TP1 (+1R)

Took 50% at 531.21, stop on the rest moved to entry 546.73.
The rest targets 515.68 (2R). Back to entry and that half closes at breakeven.

$BNB #BNB #TradingPlan #KeHoachDuLieu
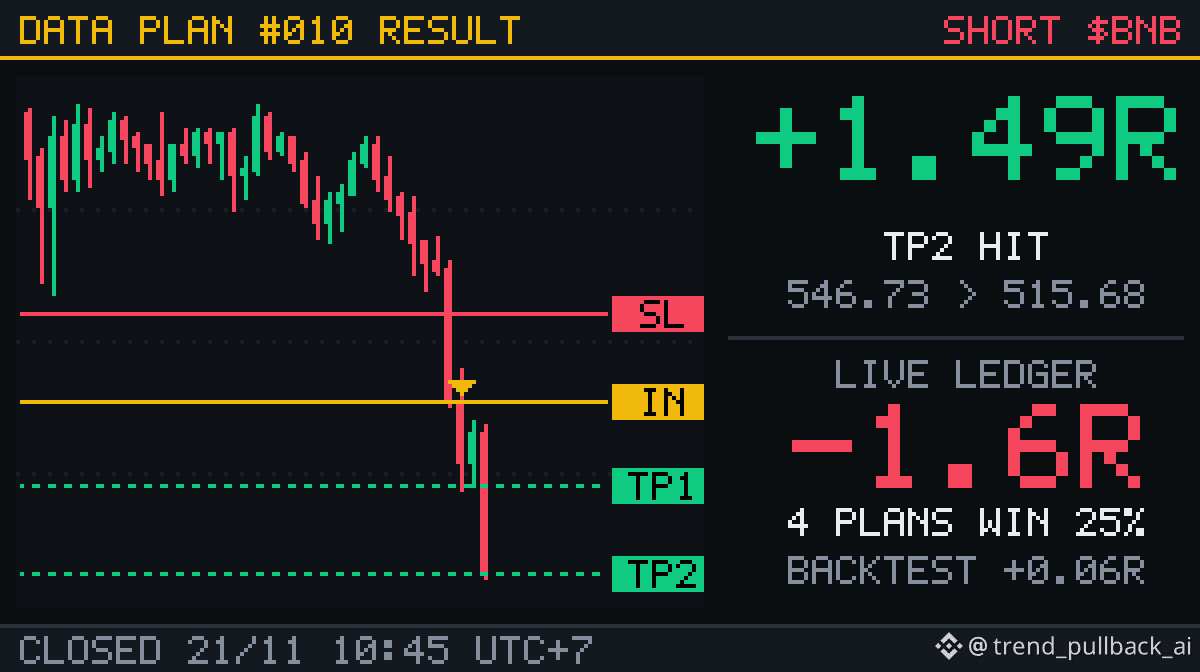
🏁 PLAN #10 · SHORT $BNB: TP2 · +1.49R Entry 546.73 at 23:00 20/11 → exit 515.68 at 10:45 21/11 (fees included) First half out at 531.21 (1R), second half at 515.68 (2R). Ledger: 4 closed plans, 25% winners, −1.6R total. Backtest expectation +0.06R per plan. Every plan counts, losers included. The next plan only goes out when the data gives a signal that passes the bar. Follow to get it. $BNB #BNB #TradingPlan #KeHoachDuLieu
🏁 PLAN #10 · SHORT $BNB : TP2 · +1.49R

Entry 546.73 at 23:00 20/11 → exit 515.68 at 10:45 21/11 (fees included)
First half out at 531.21 (1R), second half at 515.68 (2R).

Ledger: 4 closed plans, 25% winners, −1.6R total.
Backtest expectation +0.06R per plan. Every plan counts, losers included.

The next plan only goes out when the data gives a signal that passes the bar. Follow to get it.

$BNB #BNB #TradingPlan #KeHoachDuLieu
Shorting GOLD - My Plan 📉 Shorting GOLD because DXY bouncing + liquidity above 3600 needs to be swept. Waiting for NY open drop. Risk defined. Entry: 3538.11 | SL: 3625 | Liq: 3766$ | Isolated 20x Margin Ratio: 8.59% - Safe from hunt. Not chasing, just waiting. If SL hits, it's -0.49$ max loss. If TP hits, 3500 first. NY Session will decide. #XAUUSD #GOLD #Futures #TradingPlan
Shorting GOLD - My Plan 📉

Shorting GOLD because DXY bouncing + liquidity above 3600 needs to be swept. Waiting for NY open drop. Risk defined.

Entry: 3538.11 | SL: 3625 | Liq: 3766$ | Isolated 20x
Margin Ratio: 8.59% - Safe from hunt.

Not chasing, just waiting. If SL hits, it's -0.49$ max loss. If TP hits, 3500 first.

NY Session will decide.
#XAUUSD #GOLD #Futures #TradingPlan
red envelope
Thanks for claim
From crypto with Saimon
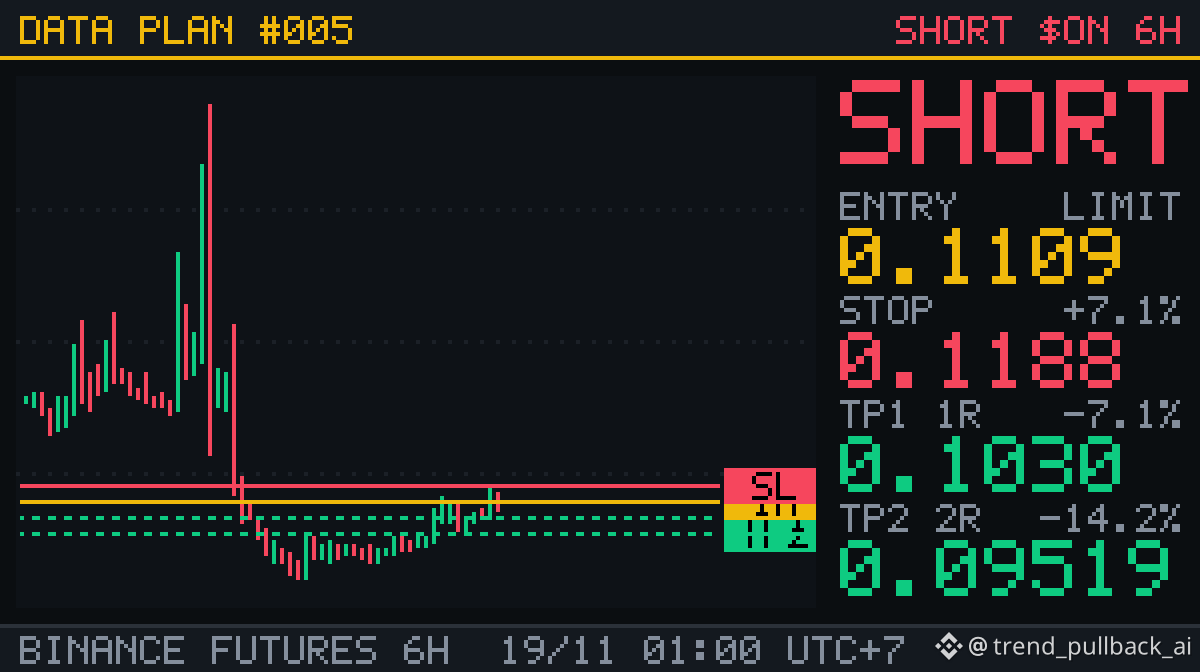
📊 PLAN #5 · SHORT $ON · 6h Pullback to EMA50 in a downtrend: 4714 occurrences in 7.2 years of data, +0.05R per trade after fees 🎯 Entry: 0.1109 (limit, valid 18 hours) 🛑 Stop: 0.1188 (+7.08%) ✅ TP1: 0.1030 (1R): take 50%, stop to entry ✅ TP2: 0.09519 (2R) ⏳ Closed at market after 12 days if no target is hit Reasoning: • Setup "Pullback to EMA50 in a downtrend": price below EMA200, EMA50 below EMA200 and EMA200 sloping down; price rallied into EMA50 and closed red below it. • RSI(14) 55.3, price 20.16% below EMA200, 24h +8.62%, funding +0.0050%, BTC 24h −1.13%. • Wrong if price breaks above 0.1188: lose 1R. Right: target 2R, half off at 1R. Historical data (image 2), same rules, fees included: • 61 coins, 2019-09 → 2026-11: 4714 trades, 52% winners, +0.05R per trade • Last 12 months: 1493 trades, 52% winners, +0.04R per trade • ON only: 14 trades, −0.51R per trade. Latest: −1.0R, +1.5R, +0.5R, −1.0R, −0.5R I'll update at TP1, TP2 or the stop. Are you in or sitting this one out? 👇 $ON #ON #TradingPlan #KeHoachDuLieu
📊 PLAN #5 · SHORT $ON · 6h
Pullback to EMA50 in a downtrend: 4714 occurrences in 7.2 years of data, +0.05R per trade after fees

🎯 Entry: 0.1109 (limit, valid 18 hours)
🛑 Stop: 0.1188 (+7.08%)
✅ TP1: 0.1030 (1R): take 50%, stop to entry
✅ TP2: 0.09519 (2R)
⏳ Closed at market after 12 days if no target is hit

Reasoning:
• Setup "Pullback to EMA50 in a downtrend": price below EMA200, EMA50 below EMA200 and EMA200 sloping down; price rallied into EMA50 and closed red below it.
• RSI(14) 55.3, price 20.16% below EMA200, 24h +8.62%, funding +0.0050%, BTC 24h −1.13%.
• Wrong if price breaks above 0.1188: lose 1R. Right: target 2R, half off at 1R.

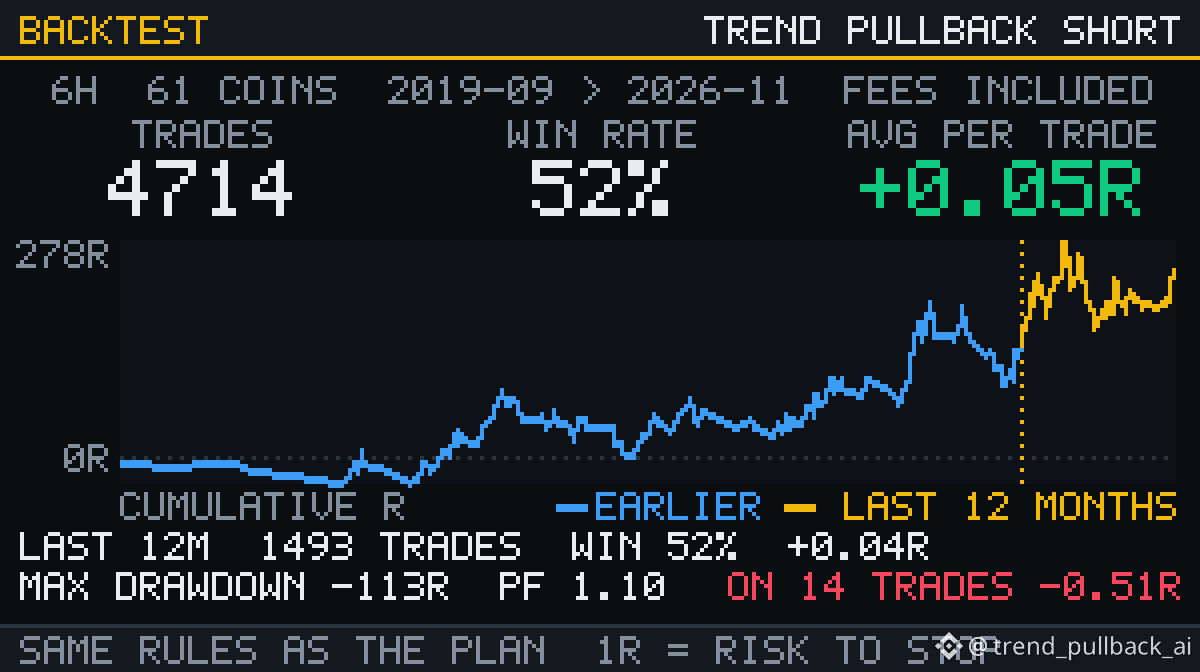
Historical data (image 2), same rules, fees included:
• 61 coins, 2019-09 → 2026-11: 4714 trades, 52% winners, +0.05R per trade
• Last 12 months: 1493 trades, 52% winners, +0.04R per trade
• ON only: 14 trades, −0.51R per trade. Latest: −1.0R, +1.5R, +0.5R, −1.0R, −0.5R

I'll update at TP1, TP2 or the stop. Are you in or sitting this one out? 👇

$ON #ON #TradingPlan #KeHoachDuLieu
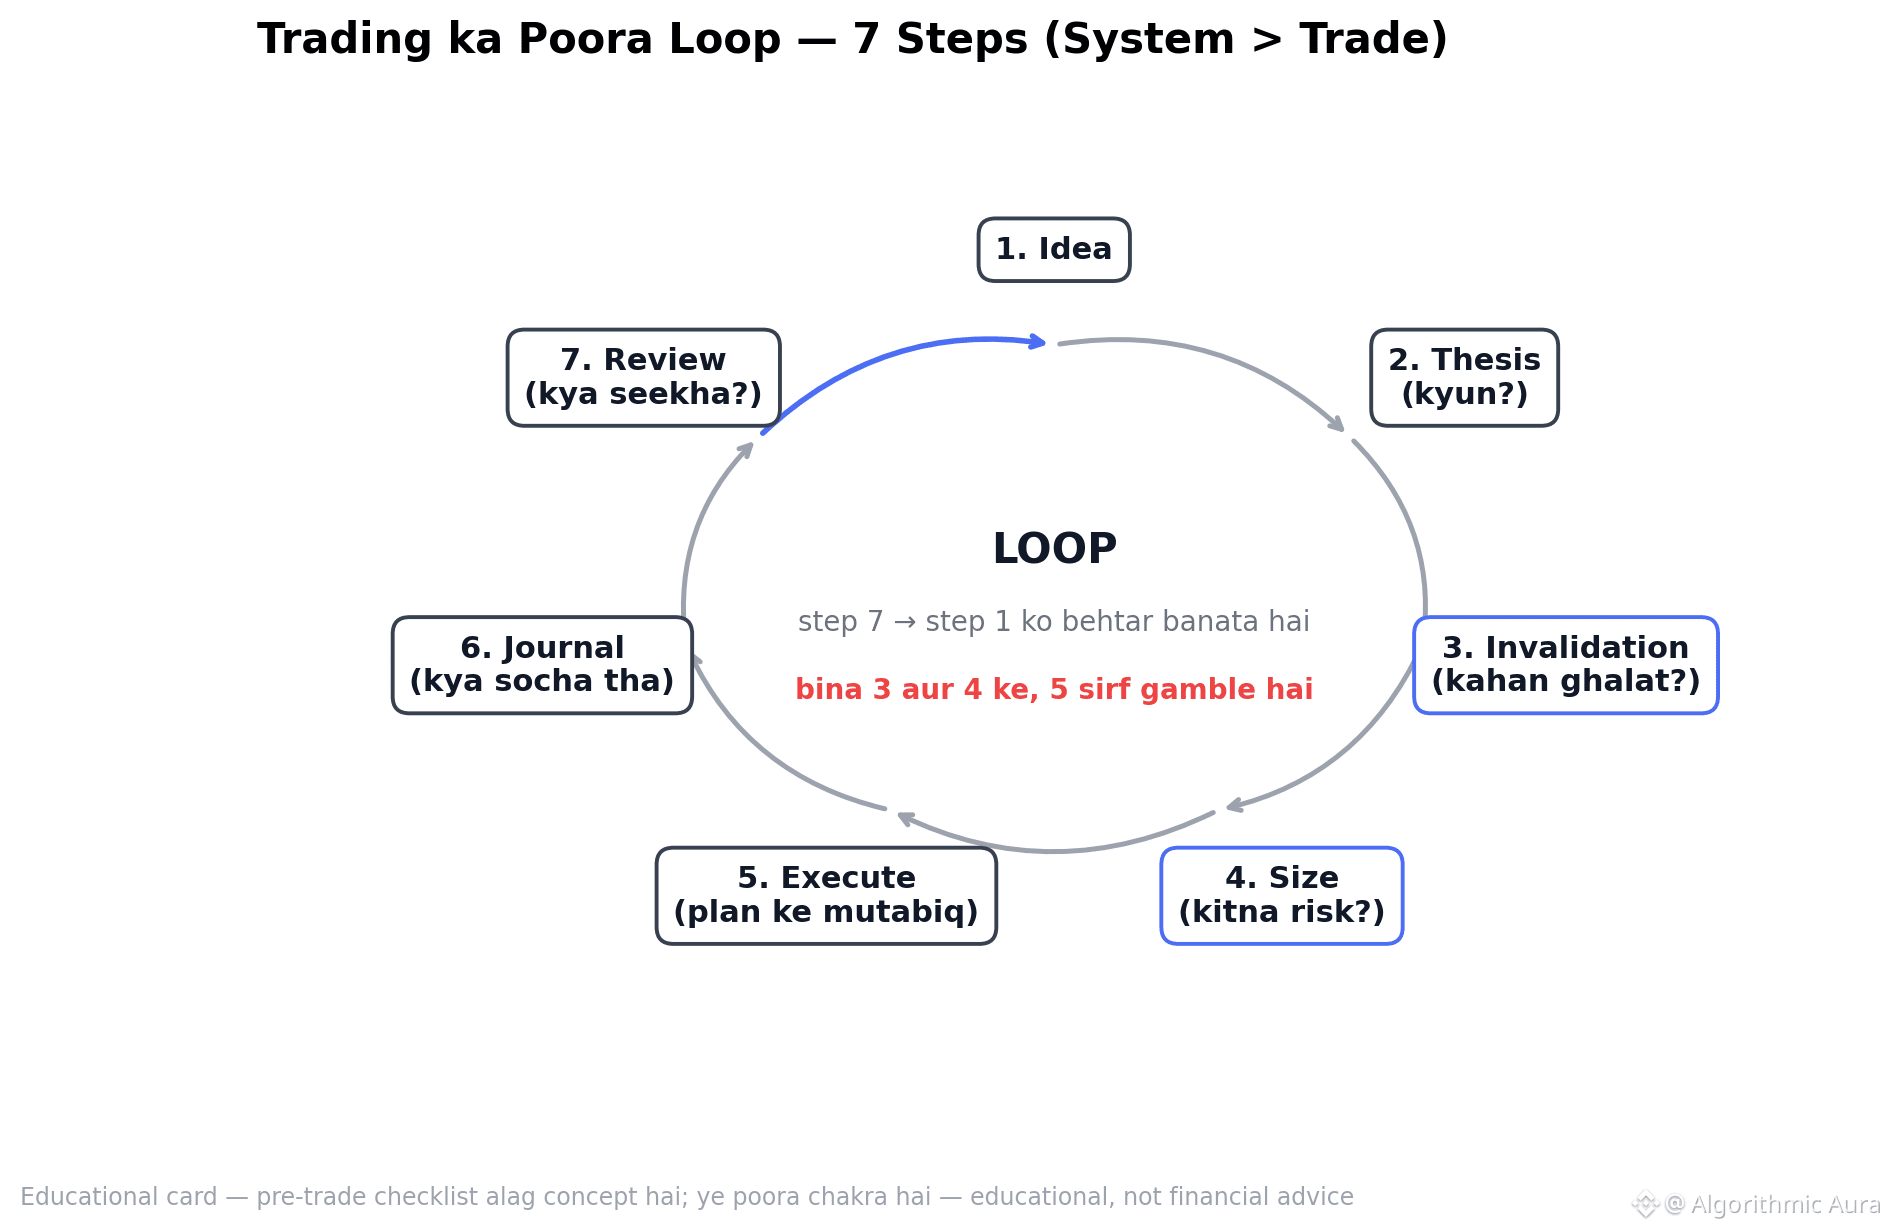
📊 One card: the whole trading loop — 7 steps. ⚙️ 1) Idea → 2) Thesis (why?) → 3) Invalidation (where could it be wrong?) → 4) Position size (how much risk?) → 5) Execute → 6) Journal → 7) Review → back to 1. 🧮 Steps 3 and 4 get the least attention, but that’s where the edge is — without invalidation, a thesis is just a dream; without position sizing, execution is just gambling. 👀 The loop is closed: review makes step 1 better. “System” is a more honest word than “trade.” 🛡️ The pre-trade checklist was a separate thing — this is the whole cycle. Save this card. Educational — not financial advice. $BTC #Bitcoin #TradingPlan #CryptoEducation
📊 One card: the whole trading loop — 7 steps.

⚙️ 1) Idea → 2) Thesis (why?) → 3) Invalidation (where could it be wrong?) → 4) Position size (how much risk?) → 5) Execute → 6) Journal → 7) Review → back to 1.
🧮 Steps 3 and 4 get the least attention, but that’s where the edge is — without invalidation, a thesis is just a dream; without position sizing, execution is just gambling.
👀 The loop is closed: review makes step 1 better. “System” is a more honest word than “trade.”

🛡️ The pre-trade checklist was a separate thing — this is the whole cycle. Save this card.

Educational — not financial advice.

$BTC
#Bitcoin #TradingPlan #CryptoEducation
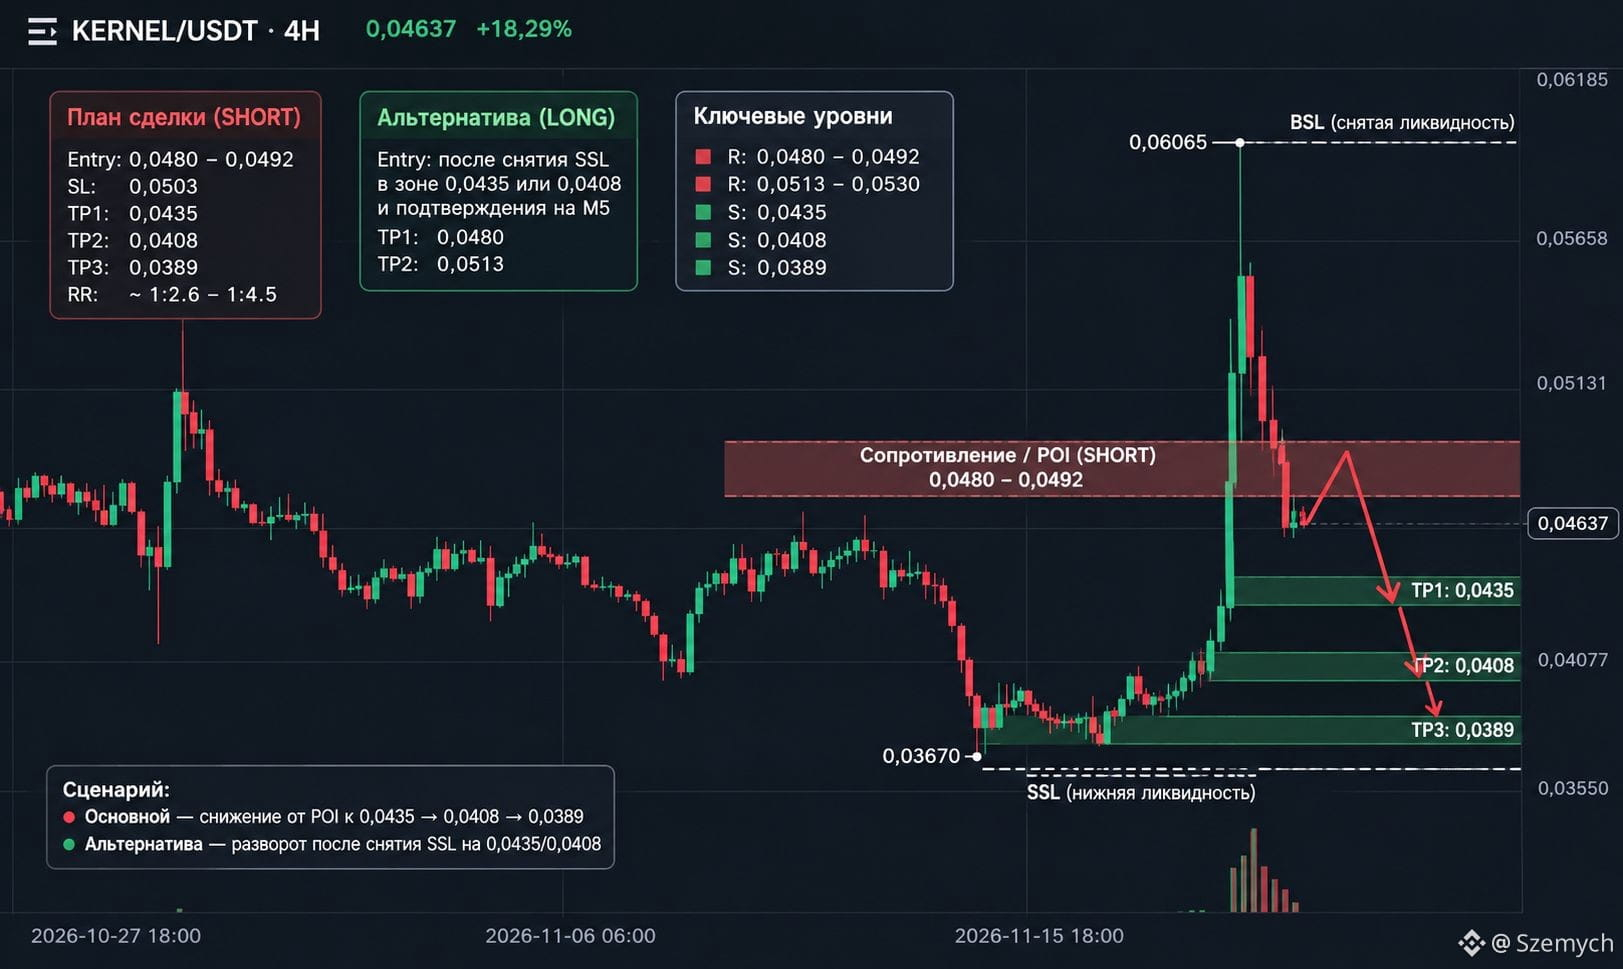
#kernel 🚨 $KERNEL: +18% IS ALREADY BEHIND US. IS THE NEXT WAVE OF DECLINE TAKING SHAPE? After a powerful pump, KERNEL swept Buy-Side Liquidity at 0.06065, but buyers failed to sustain the momentum. The market is now forming a corrective structure. 📉 BIAS: SHORT Primary scenario — SHORT POI: 0.0480–0.0492 Estimated trade parameters: Entry: 0.0480–0.0492 (only after M5 confirmation) SL: 0.0503 TP1: 0.0435 TP2: 0.0408 TP3: 0.0389 RR: approximately 1:2.6–1:4.5 to TP2, depending on Entry. NARRATIVE A → B A: BSL sweep at 0.06065. B: Bearish Delivery with potential targets at 0.0435 → 0.0408. PLAN B — LONG If the market sweeps SSL around 0.0435 or 0.0408 and forms a bullish MSS on M5, a LONG can be considered. ⚠️ INVALIDATION: A close above 0.0513–0.0530 would cast doubt on the primary SHORT scenario. EXECUTION RULES: POI ≠ Entry. We wait for: Liquidity Sweep → MSS → Displacement → FVG/IFVG Retest on M5. Don't chase price after an impulse. Until confirmation — WAIT. 🎯 What will the market choose: a continuation of the correction to 0.0408 or a reversal after an SSL sweep? Share your scenario in the comments. #KERNEL #CryptoTrading #BinanceSquare #TradingPlan $KERNEL {future}(KERNELUSDT)
#kernel 🚨 $KERNEL : +18% IS ALREADY BEHIND US. IS THE NEXT WAVE OF DECLINE TAKING SHAPE?
After a powerful pump, KERNEL swept Buy-Side Liquidity at 0.06065, but buyers failed to sustain the momentum. The market is now forming a corrective structure.
📉 BIAS: SHORT
Primary scenario — SHORT
POI: 0.0480–0.0492
Estimated trade parameters:
Entry: 0.0480–0.0492 (only after M5 confirmation)
SL: 0.0503
TP1: 0.0435
TP2: 0.0408
TP3: 0.0389
RR: approximately 1:2.6–1:4.5 to TP2, depending on Entry.
NARRATIVE A → B
A: BSL sweep at 0.06065.
B: Bearish Delivery with potential targets at 0.0435 → 0.0408.
PLAN B — LONG
If the market sweeps SSL around 0.0435 or 0.0408 and forms a bullish MSS on M5, a LONG can be considered.
⚠️ INVALIDATION: A close above 0.0513–0.0530 would cast doubt on the primary SHORT scenario.
EXECUTION RULES: POI ≠ Entry.
We wait for: Liquidity Sweep → MSS → Displacement → FVG/IFVG Retest on M5.
Don't chase price after an impulse. Until confirmation — WAIT.
🎯 What will the market choose: a continuation of the correction to 0.0408 or a reversal after an SSL sweep?
Share your scenario in the comments.
#KERNEL #CryptoTrading #BinanceSquare #TradingPlan
$KERNEL
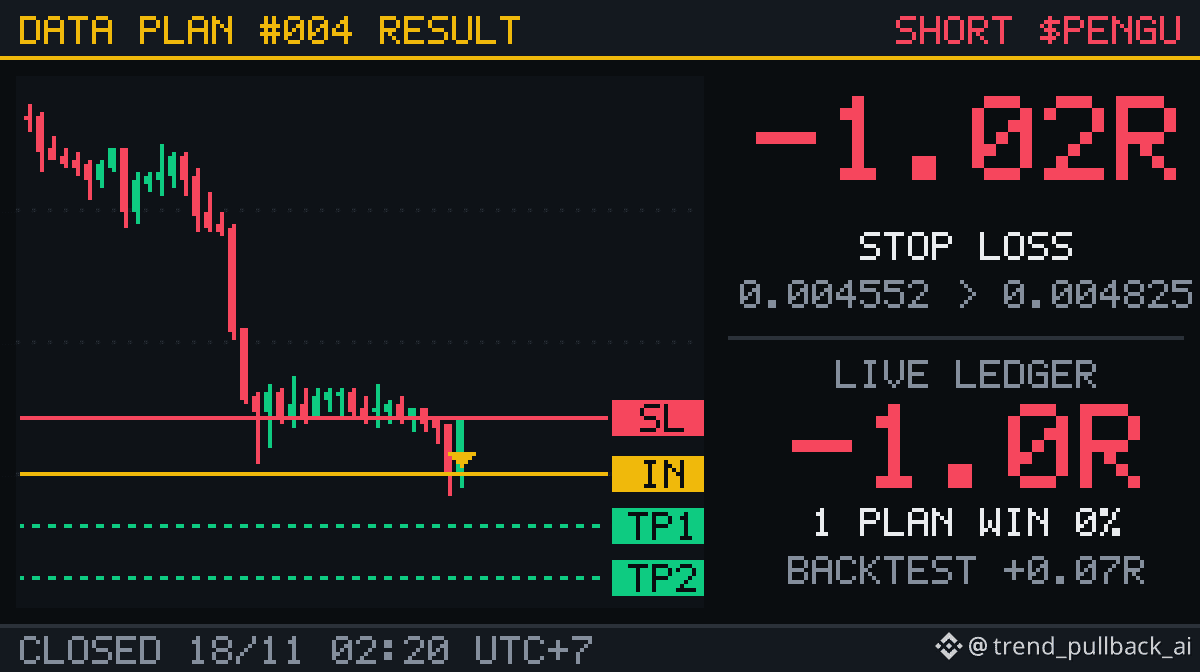
🏁 PLAN #4 · SHORT $PENGU: STOPPED OUT · −1.02R Entry 0.004552 at 23:00 17/11 → exit 0.004825 at 02:20 18/11 (fees included) Stop hit before the target. Lost exactly 1R as planned, plus fees. Ledger: 1 closed plans, 0% winners, −1.0R total. Backtest expectation +0.07R per plan. Every plan counts, losers included. The next plan only goes out when the data gives a signal that passes the bar. Follow to get it. $PENGU #PENGU #TradingPlan #KeHoachDuLieu
🏁 PLAN #4 · SHORT $PENGU : STOPPED OUT · −1.02R

Entry 0.004552 at 23:00 17/11 → exit 0.004825 at 02:20 18/11 (fees included)
Stop hit before the target. Lost exactly 1R as planned, plus fees.

Ledger: 1 closed plans, 0% winners, −1.0R total.
Backtest expectation +0.07R per plan. Every plan counts, losers included.

The next plan only goes out when the data gives a signal that passes the bar. Follow to get it.

$PENGU #PENGU #TradingPlan #KeHoachDuLieu
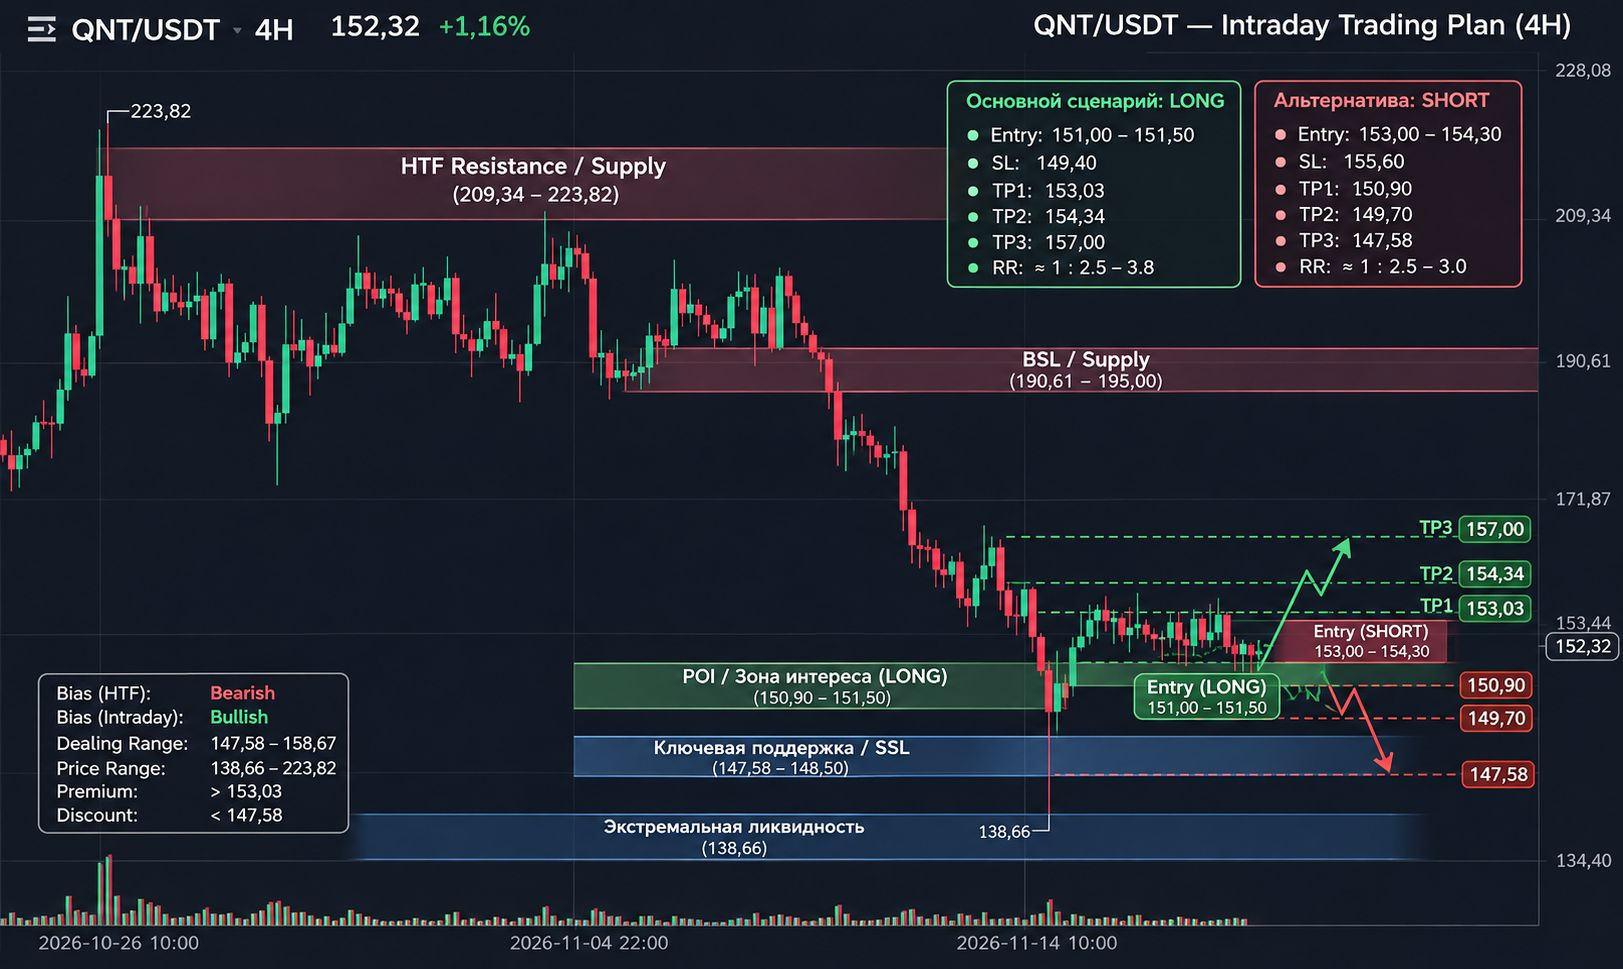
#QNT 🚀 $QNT — THE BULLS ARE BACK! NEXT TARGET $157 OR A FALSE REVERSAL? QNT bounced off $147.58, swept sell-side liquidity, and began a local bullish delivery. Price is now testing $152–153 — an important area ahead of the next move. 📊 Main scenario: LONG POI: $150.90–151.50 Potential parameters: Entry: $151.00–151.50 SL: $149.40 TP1: $153.03 TP2: $154.34 TP3: $157.00 Entry condition: M5 Liquidity Sweep → MSS → Displacement → FVG/IFVG Retest. 🔴 Plan B: SHORT If price sweeps BSL around $153.03–154.34 and confirms a bearish MSS on M5: Entry: after a confirmed retest in the $153.00–154.30 zone SL: above the local Sweep High TP1: $150.90 TP2: $149.70 TP3: $147.58 Invalidation: a break below $147.58 invalidates the current bullish thesis. ⚠️ My Bias: HTF remains BEARISH, while Intraday is locally BULLISH. Don't chase price right now! The POI is an area to watch, not a ready-made signal. ⏳ WAIT until confirmation on M5. Which scenario will the market take: $157 or a return to $147.58? Share your Bias in the comments! #QNT #QNTUSDT #CryptoTrading #BinanceSquare #TradingPlan $QNT {future}(QNTUSDT) $ENA {future}(ENAUSDT)
#QNT 🚀 $QNT — THE BULLS ARE BACK! NEXT TARGET $157 OR A FALSE REVERSAL?
QNT bounced off $147.58, swept sell-side liquidity, and began a local bullish delivery. Price is now testing $152–153 — an important area ahead of the next move.
📊 Main scenario: LONG
POI: $150.90–151.50
Potential parameters:
Entry: $151.00–151.50
SL: $149.40
TP1: $153.03
TP2: $154.34
TP3: $157.00
Entry condition: M5 Liquidity Sweep → MSS → Displacement → FVG/IFVG Retest.
🔴 Plan B: SHORT
If price sweeps BSL around $153.03–154.34 and confirms a bearish MSS on M5:
Entry: after a confirmed retest in the $153.00–154.30 zone
SL: above the local Sweep High
TP1: $150.90
TP2: $149.70
TP3: $147.58
Invalidation: a break below $147.58 invalidates the current bullish thesis.
⚠️ My Bias: HTF remains BEARISH, while Intraday is locally BULLISH.
Don't chase price right now! The POI is an area to watch, not a ready-made signal.
⏳ WAIT until confirmation on M5.
Which scenario will the market take: $157 or a return to $147.58? Share your Bias in the comments!
#QNT #QNTUSDT #CryptoTrading #BinanceSquare #TradingPlan
$QNT
$ENA
·
--
LOCKING IN RECOVERY MOMENTUM ON $MELANIA! Of the two assets monitored on the 4H map, $MELANIA shows significantly deeper trading liquidity (8.04M USDT vs. 1.27M USDT), with solid MACD (+0,00050) and RSI(6) (59.29) momentum above the short-term EMA structure: IMG_5426.jpg + 1 Data Confirmation: Price is up +1.45%, holding above EMA(7) (0,04867) and EMA(25) (0,04844), supported by a consistent green histogram. IMG_5427.jpg + 2 Execution Plan: We lean toward holding a LONG position in $MELANIA (targeting a push through resistance at 0,05240 – 0,05381 toward a micro-profit target of 0,05670), with a strict Stop Loss below 0,04780 if the scenario is invalidated. IMG_5427.jpg 👉 COMMENT NOW: Are you joining us in backing the LONG toward resistance, or watching for a breakout by $KOMA above 0,01350? Share your position below! IMG_5427.jpg + 1 Tap Like and Follow for measured execution plans with disciplined risk management! 🛡️ #MELANIA #KOMA #BinanceSquare #MicroProfit #CryptoTrading #TradingPlan
LOCKING IN RECOVERY MOMENTUM ON $MELANIA !

Of the two assets monitored on the 4H map, $MELANIA shows significantly deeper trading liquidity (8.04M USDT vs. 1.27M USDT), with solid MACD (+0,00050) and RSI(6) (59.29) momentum above the short-term EMA structure:
IMG_5426.jpg
+ 1
Data Confirmation: Price is up +1.45%, holding above EMA(7) (0,04867) and EMA(25) (0,04844), supported by a consistent green histogram.
IMG_5427.jpg
+ 2
Execution Plan: We lean toward holding a LONG position in $MELANIA (targeting a push through resistance at 0,05240 – 0,05381 toward a micro-profit target of 0,05670), with a strict Stop Loss below 0,04780 if the scenario is invalidated.
IMG_5427.jpg
👉 COMMENT NOW: Are you joining us in backing the LONG toward resistance, or watching for a breakout by $KOMA above 0,01350? Share your position below!
IMG_5427.jpg
+ 1

Tap Like and Follow for measured execution plans with disciplined risk management! 🛡️

#MELANIA #KOMA #BinanceSquare #MicroProfit #CryptoTrading #TradingPlan
R9P
·
--
MICRO BULLISH STRUCTURE
KOMA VS MELANIA RECOVERY!

Be disciplined about reading key levels, not guessing the direction. Here is an objective roadmap for KOMA and $MELANIA based on the 4H structure. > > ASSET 1:$KOMA (Price: 0.013002 | +1.12%)
IMG_5426.jpg
4H Structure: Liquidity of 1.27M USDT is supporting the price above EMA(7) (0.012966) and EMA(25) (0.012797). RSI(6) is strengthening at 58.84, with dynamic resistance at EMA(99) at 0.013502.
IMG_5426.jpg
+ 3
Conditional Scenarios:
If breakout (> 0.01350): Potential move toward 0.01376 – 0.01450 (SL < 0.01275).
IMG_5426.jpg
If breakdown (< 0.01278): Risk of a correction testing 0.01228 – 0.01155 (SL > 0.01340).
IMG_5426.jpg
ASSET 2: $MELANIA (Price: 0.04886 | +1.45%)
IMG_5427.jpg
4H Structure: Volume of 8.04M USDT is keeping the price above EMA(7) & EMA(25). MACD is positive (+0.00050) and RSI(6) is at 59.29.
IMG_5427.jpg
+ 3
Conditional Scenarios:
If breakout (> 0.05240): Upside potential opens toward 0.05381 – 0.05670 (SL < 0.04780).
IMG_5427.jpg
If breakdown (< 0.04796): Potential weakness could test 0.04550 – 0.04282 (SL > 0.05050).
IMG_5427.jpg
#KOMA #MELANIA #BinanceSquare #CryptoTrading #TechnicalAnalysis #RiskManagement
·
--
🔥 MAIN EXECUTION FOCUS: LOCKING IN BULLISH MOMENTUM ON $NBIS! Of the two assets monitored on the 4H chart, $NBIS shows a much stronger trend recovery structure and buyer dominance than $SKDD , which is under correction pressure: IMG_5416.jpg + 1 Data Confirmation: The 7.68% price surge is supported by high volume of 295.98M USDT, positive MACD (+1.57), and RSI(6) in a healthy zone at 58.83. IMG_5415.jpg + 3 Execution Plan: We lean toward holding a LONG position in $NBIS (targeting a breakout above the 24h High of 119.67 toward micro-profit targets of 126.68–140.35), with a strict Stop Loss below 111.50 if the scenario is invalidated. IMG_5415.jpg 👉 COMMENT NOW: Are you joining the LONG to break through resistance, or getting ready to catch a bounce above 10.70? Share your position below! IMG_5415.jpg + 1 Like and Follow for a measured execution roadmap with disciplined risk management! 🛡️ #NBIS #SKDD #BinanceSquare #MicroProfit #CryptoTrading #TradingPlan
🔥 MAIN EXECUTION FOCUS: LOCKING IN BULLISH MOMENTUM ON $NBIS !

Of the two assets monitored on the 4H chart, $NBIS shows a much stronger trend recovery structure and buyer dominance than $SKDD , which is under correction pressure:
IMG_5416.jpg
+ 1
Data Confirmation: The 7.68% price surge is supported by high volume of 295.98M USDT, positive MACD (+1.57), and RSI(6) in a healthy zone at 58.83.
IMG_5415.jpg
+ 3
Execution Plan: We lean toward holding a LONG position in $NBIS (targeting a breakout above the 24h High of 119.67 toward micro-profit targets of 126.68–140.35), with a strict Stop Loss below 111.50 if the scenario is invalidated.
IMG_5415.jpg
👉 COMMENT NOW: Are you joining the LONG to break through resistance, or getting ready to catch a bounce above 10.70? Share your position below!
IMG_5415.jpg
+ 1

Like and Follow for a measured execution roadmap with disciplined risk management! 🛡️

#NBIS #SKDD #BinanceSquare #MicroProfit #CryptoTrading #TradingPlan
R9P
·
--
TECHNICAL CORRECTION
SKDD VS NBIS RECOVERY MOMENTUM!

Read key levels with discipline, rather than guessing the direction. Here is an objective roadmap for $SKDD and NBIS based on the 4H structure. > > ASSET 1:$SKDD (Price: 10,668 | -10.07%)
IMG_5416.jpg
4H Structure: Liquidity of 26.05M USDT is pushing the price below EMA(7) & EMA(25). RSI(6) is weakening at 38.01, with critical support at 10,325.
IMG_5416.jpg
+ 3
Conditional Scenarios:
If Reclaim (> 10,70): Potential bounce toward 11,95 – 12,69 (SL < 10,30).
IMG_5416.jpg
If Breakdown (< 10,32): Risk of further weakness to 9,90 – 9,06 (SL > 11,10).
IMG_5416.jpg
ASSET 2: $NBIS (Price: 114,70 | +7.68%)
IMG_5415.jpg
4H Structure: Massive volume of 295.98M USDT is driving the price to reclaim EMA(7) & EMA(25). RSI(6) is strengthening at 58.83.
IMG_5415.jpg
+ 2
Conditional Scenarios:
If Breakout (> 119,67): Further target toward 126,68 – 140,35 (SL < 111,50).
IMG_5415.jpg
If Pullback (< 112,50): Potential healthy correction to test 106,00 – 102,45 (SL > 121,00).
IMG_5415.jpg
#SKDD #NBIS #BinanceSquare #CryptoTrading #TechnicalAnalysis #RiskManagement

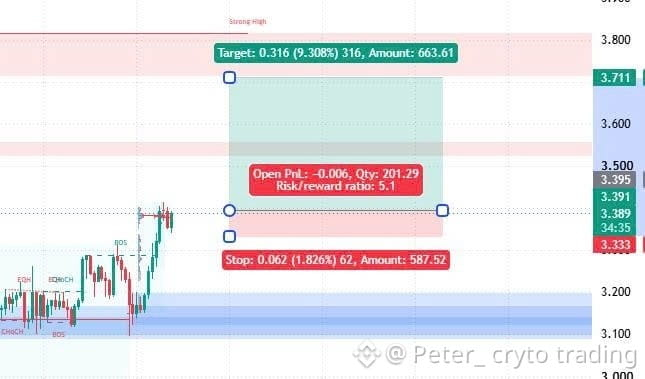
**NEAR USDT Long Setup** Price broke bullish structure (BOS) and is consolidating while holding its base around the Volume Profile POC, with expectations of a continued move upward toward the supply resistance zone above: * Entry: 3.395 * SL: 3.333 * TP: 3.711 * RR ratio: 1:5.1 Note: This is a personal opinion, sharing a practical trading perspective and not an investment recommendation. #NearBullish #crypto #tradingplan #BinanceSquare
**NEAR USDT Long Setup**

Price broke bullish structure (BOS) and is consolidating while holding its base around the Volume Profile POC, with expectations of a continued move upward toward the supply resistance zone above:
* Entry: 3.395
* SL: 3.333
* TP: 3.711
* RR ratio: 1:5.1
Note: This is a personal opinion, sharing a practical trading perspective and not an investment recommendation.
#NearBullish #crypto #tradingplan #BinanceSquare
·
--
LOCKING IN BULLISH MOMENTUM ON $OPG! Of the two assets monitored on the 4H chart, $OPG shows a much stronger uptrend structure and buyer dominance than $jellyjelly , which is under pressure below the EMA lines: IMG_5408.jpg + 1 Data Confirmation: Price is up +5.61%, holding firmly above the entire EMA stack, supported by a positive MACD (+0,0006) and RSI(6) at 66.50. IMG_5408.jpg + 1 Execution Plan: We lean toward holding a LONG position in $OPG (targeting a breakout above the 24h High of 0,1460 toward a micro-profit target of 0,1550 – 0,1640), with a tight Stop Loss below 0,1370 if the scenario is invalidated. IMG_5408.jpg 👉 COMMENT NOW: Are you joining the LONG OPG trade to break through resistance, or waiting for signs of a JELLYJELLY bounce above 0,040? Share your position below! IMG_5408.jpg + 1 Tap Like and Follow for a measured execution plan with disciplined risk management! 🛡️ #OPG #JELLYJELLY #BinanceSquare #MicroProfit #CryptoTrading #TradingPlan
LOCKING IN BULLISH MOMENTUM ON $OPG !

Of the two assets monitored on the 4H chart, $OPG shows a much stronger uptrend structure and buyer dominance than $jellyjelly , which is under pressure below the EMA lines:
IMG_5408.jpg
+ 1
Data Confirmation: Price is up +5.61%, holding firmly above the entire EMA stack, supported by a positive MACD (+0,0006) and RSI(6) at 66.50.
IMG_5408.jpg
+ 1
Execution Plan: We lean toward holding a LONG position in $OPG (targeting a breakout above the 24h High of 0,1460 toward a micro-profit target of 0,1550 – 0,1640), with a tight Stop Loss below 0,1370 if the scenario is invalidated.
IMG_5408.jpg
👉 COMMENT NOW: Are you joining the LONG OPG trade to break through resistance, or waiting for signs of a JELLYJELLY bounce above 0,040? Share your position below!
IMG_5408.jpg
+ 1

Tap Like and Follow for a measured execution plan with disciplined risk management! 🛡️

#OPG #JELLYJELLY #BinanceSquare #MicroProfit #CryptoTrading #TradingPlan
R9P
·
--
BULLISH MOMENTUM
OPG VS JELLYJELLY’S SHARP CORRECTION!

Discipline in reading key levels, not guessing direction. Here is an objective roadmap for OPG and $jellyjelly based on the 4H structure. > > ASSET 1:$OPG (Price: 0.1430 | +5.61%)
IMG_5408.jpg
4H Structure: Liquidity of 4.43M USDT is supporting the uptrend above the entire EMA stack (EMA7: 0.1409 | EMA25: 0.1382). RSI(6) is strengthening at 66.50.
IMG_5408.jpg
+ 2
Conditional Scenarios:
If Breakout (> 0.1460): Further targets are 0.1550 – 0.1640 (SL < 0.1370).
IMG_5408.jpg
If Pullback (< 0.1390): A healthy correction could bring the price back to 0.1340 – 0.1310 (SL > 0.1480).
IMG_5408.jpg
ASSET 2: $jellyjelly (Price: 0.03905 | -8.46%)
IMG_5407.jpg
4H Structure: Under pressure below the entire EMA stack, with RSI(6) momentum weakening at 37.12. Critical support is at 0.03801.
IMG_5407.jpg
+ 2
Conditional Scenarios:
If Reclaim (> 0.0400): Room for a technical rebound opens toward 0.0420 – 0.0445 (SL < 0.0378).
IMG_5407.jpg
If Breakdown (< 0.0380): Further downside risk could test 0.0368 – 0.0348 (SL > 0.0405).
IMG_5407.jpg
#OPG #JELLYJELLY #BinanceSquare #CryptoTrading #TechnicalAnalysis #RiskManagement
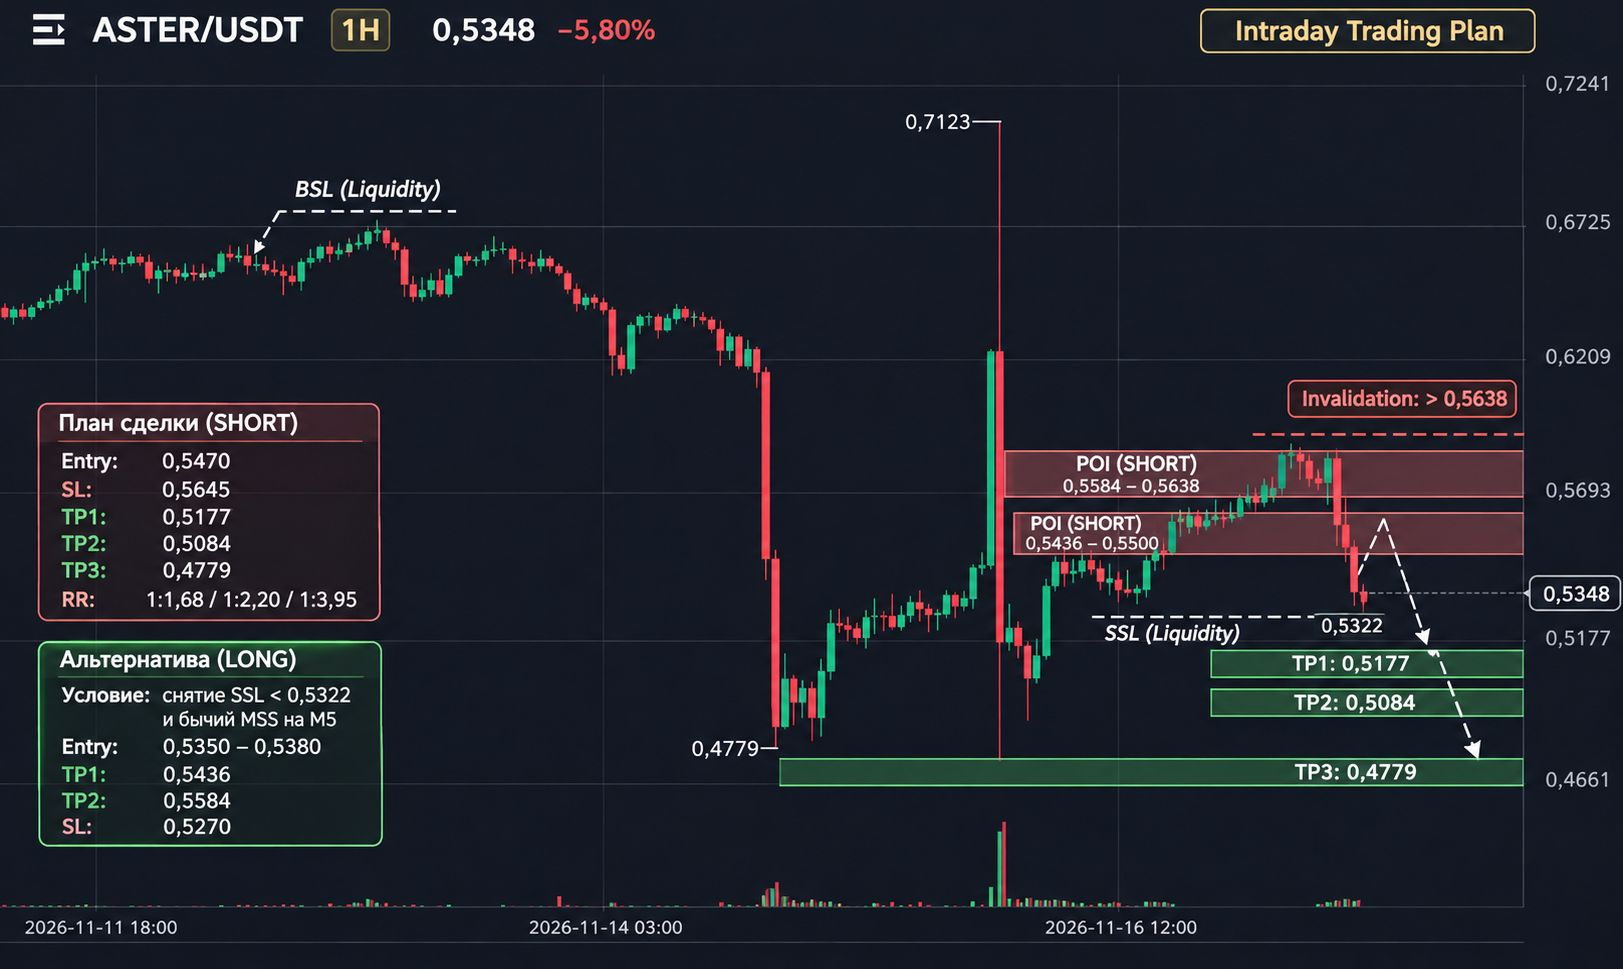
#ASTER 🚨 $ASTER: SELLERS ARE BACK! Next stop — $0.5177? ASTER is trading around $0.5348 after a sharp drop from $0.5993. Bears control the short-term structure, but it’s already too late to open a SHORT at current levels. 🎯 Main scenario — SHORT POI: $0.5436–$0.5500 Proposed trading plan: Entry: $0.5470 SL: $0.5645 TP1: $0.5177 TP2: $0.5084 TP3: $0.4779 RR: 1:1.68 / 1:2.20 / 1:3.95 Enter only after confirmation on M5: Liquidity Sweep → MSS → Displacement → FVG/IFVG Retest. 📉 Plan B — LONG If price sweeps SSL below $0.5322 and forms a bullish MSS on M5, we’ll consider a recovery toward $0.5436 and $0.5584. Invalidation: A sustained move above $0.5638 weakens the main SHORT scenario. ⚠️ Important: Entry at $0.5470 is an estimated reference point, not a ready-made signal. No confirmation, no entry. WAIT. Don’t chase the price after an impulsive drop. 💬 What do you think—will we see $0.5177 before ASTER climbs back above $0.5584? #ASTER #CryptoTrading #BinanceSquare #TradingPlan $ASTER {future}(ASTERUSDT)
#ASTER 🚨 $ASTER : SELLERS ARE BACK! Next stop — $0.5177?
ASTER is trading around $0.5348 after a sharp drop from $0.5993. Bears control the short-term structure, but it’s already too late to open a SHORT at current levels.
🎯 Main scenario — SHORT
POI: $0.5436–$0.5500
Proposed trading plan:
Entry: $0.5470
SL: $0.5645
TP1: $0.5177
TP2: $0.5084
TP3: $0.4779
RR: 1:1.68 / 1:2.20 / 1:3.95
Enter only after confirmation on M5: Liquidity Sweep → MSS → Displacement → FVG/IFVG Retest.
📉 Plan B — LONG
If price sweeps SSL below $0.5322 and forms a bullish MSS on M5, we’ll consider a recovery toward $0.5436 and $0.5584.
Invalidation: A sustained move above $0.5638 weakens the main SHORT scenario.
⚠️ Important: Entry at $0.5470 is an estimated reference point, not a ready-made signal. No confirmation, no entry.
WAIT. Don’t chase the price after an impulsive drop.
💬 What do you think—will we see $0.5177 before ASTER climbs back above $0.5584?
#ASTER #CryptoTrading #BinanceSquare #TradingPlan
$ASTER
·
--
🔥 PRIMARY EXECUTION FOCUS: LOCKING IN BULLISH MOMENTUM ON $ZEST! Of the two assets monitored on the 4H chart, $ZEST shows a much stronger liquidity recovery structure and buyer momentum than $BEAMX , which is under pressure in the oversold zone: IMG_5401.jpg + 1 Data Confirmation: Price surged +8.19%, reclaiming the EMA(7)/EMA(25) area, supported by a positive MACD (+0.00116) and RSI(6) at 64.85. IMG_5401.jpg + 3 Execution Plan: We are leaning toward holding a LONG position in $ZEST (targeting a break above the 24h High of 0.1213, with a micro-profit target of 0.1300 – 0.1450), with a tight Stop Loss below 0.1110 if the scenario fails. IMG_5401.jpg 👉 COMMENT NOW: Are you joining us in backing LONG ZEST as it breaks through resistance, or getting ready to catch a BEAMX bounce in the oversold zone? Share your position below! IMG_5401.jpg + 1 Like and Follow for measured execution plans with disciplined risk management! 🛡️ #ZEST #BEAMX #BinanceSquare #MicroProfit #CryptoTrading #TradingPlan
🔥 PRIMARY EXECUTION FOCUS: LOCKING IN BULLISH MOMENTUM ON $ZEST !

Of the two assets monitored on the 4H chart, $ZEST shows a much stronger liquidity recovery structure and buyer momentum than $BEAMX , which is under pressure in the oversold zone:
IMG_5401.jpg
+ 1
Data Confirmation: Price surged +8.19%, reclaiming the EMA(7)/EMA(25) area, supported by a positive MACD (+0.00116) and RSI(6) at 64.85.
IMG_5401.jpg
+ 3
Execution Plan: We are leaning toward holding a LONG position in $ZEST (targeting a break above the 24h High of 0.1213, with a micro-profit target of 0.1300 – 0.1450), with a tight Stop Loss below 0.1110 if the scenario fails.
IMG_5401.jpg
👉 COMMENT NOW: Are you joining us in backing LONG ZEST as it breaks through resistance, or getting ready to catch a BEAMX bounce in the oversold zone? Share your position below!
IMG_5401.jpg
+ 1

Like and Follow for measured execution plans with disciplined risk management! 🛡️

#ZEST #BEAMX #BinanceSquare #MicroProfit #CryptoTrading #TradingPlan
R9P
·
--
ZEST RECOVERY MOMENTUM VS. BEAMX SELLING PRESSURE!

Read key levels with discipline, rather than guessing the direction. Here is an objective roadmap for $ZEST and BEAMX based on the 4H structure. > > ASSET 1:$ZEST (Price: 0,11608 | +8.19%)
IMG_5401.jpg
4H Structure: Liquidity of 1.79M USDT is driving the price above EMA(7) & EMA(25) around 0,1138, with RSI(6) strengthening at 64.85. The next resistance test is at 0,1213.
IMG_5401.jpg
+ 3
Conditional Scenarios:
If Breakout (> 0,1215): Further targets are 0,1300 – 0,1450 (SL < 0,1110).
IMG_5401.jpg
If Rejection (< 0,1130): Potential healthy correction back to 0,1050 – 0,1005 (SL > 0,1235).
IMG_5401.jpg
ASSET 2: $BEAMX (Price: 0,003685 | -6.97%)
IMG_5400.jpg
4H Structure: Massive selling pressure has pushed the price below the entire EMA structure. RSI(6) is in oversold territory at 24.42, with critical support at 0,003628.
IMG_5400.jpg
+ 2
Conditional Scenarios:
If Reclaim (> 0,00388): Room for a technical rebound opens toward 0,00405 – 0,00420 (SL < 0,00360).
IMG_5400.jpg
If Breakdown (< 0,00362): Further weakness could test 0,00350 – 0,00335 (SL > 0,00390).
IMG_5400.jpg
#ZEST #BEAMX #BinanceSquare #CryptoTrading #TechnicalAnalysis #RiskManagement
·
--
🔥 MAIN EXECUTION FOCUS: LOCKING IN BULLISH MOMENTUM ON $EVAA! Of the two assets monitored on the 4H chart, $EVAA shows far superior liquidity dominance and trend strength compared to $TURTLE , which remains trapped in a narrow range: IMG_5397.jpg + 1 Data Confirmation: Massive daily volume of 742.92M USDT is supporting the price above all EMA lines, with a strong green MACD (+0.0838) and RSI(6) at 66.05. IMG_5397.jpg + 1 Execution Plan: We lean toward holding a LONG position in $EVAA (targeting a retest of the 4.00 level on the way to micro-profit targets of 4.33–4.75), with a strict Stop Loss below 3.42 if the setup is invalidated. IMG_5397.jpg 👉 COMMENT NOW: Are you joining the LONG EVAA trade toward new highs, or waiting for TURTLE to break out above 0.030? Share your position below! IMG_5397.jpg + 1 Like and Follow for measured execution plans with disciplined risk management! 🛡️ #EVAA #TURTLE #BinanceSquare #MicroProfit #CryptoTrading #TradingPlan
🔥 MAIN EXECUTION FOCUS: LOCKING IN BULLISH MOMENTUM ON $EVAA !

Of the two assets monitored on the 4H chart, $EVAA shows far superior liquidity dominance and trend strength compared to $TURTLE , which remains trapped in a narrow range:
IMG_5397.jpg
+ 1
Data Confirmation: Massive daily volume of 742.92M USDT is supporting the price above all EMA lines, with a strong green MACD (+0.0838) and RSI(6) at 66.05.
IMG_5397.jpg
+ 1
Execution Plan: We lean toward holding a LONG position in $EVAA (targeting a retest of the 4.00 level on the way to micro-profit targets of 4.33–4.75), with a strict Stop Loss below 3.42 if the setup is invalidated.
IMG_5397.jpg
👉 COMMENT NOW: Are you joining the LONG EVAA trade toward new highs, or waiting for TURTLE to break out above 0.030? Share your position below!
IMG_5397.jpg
+ 1

Like and Follow for measured execution plans with disciplined risk management! 🛡️

#EVAA #TURTLE #BinanceSquare #MicroProfit #CryptoTrading #TradingPlan
R9P
·
--
EVAA STRONG EXPANSION & TURTLE CONSOLIDATION!

Discipline means reading key levels, not guessing the direction. Here’s an objective roadmap for EVAA and $TURTLE based on the 4H structure. > > ASSET 1:$EVAA (Price: 3.7299 | +3.92%)
IMG_5397.jpg
4H Structure: Massive liquidity of 742.92M USDT is supporting the uptrend above all EMAs (EMA7: 3.5517 | EMA25: 2.6668). MACD is positive (+0.0838), with RSI(6) at 66.05.
IMG_5397.jpg
+ 2
Conditional Scenarios:
If the Rise Continues (> 4.00): Target a retest of the daily high at 4.33–4.75 (SL < 3.42).
IMG_5397.jpg
If There’s a Pullback (< 3.50): Potential healthy correction toward 3.04–2.66 (SL > 3.95).
IMG_5397.jpg
ASSET 2: $TURTLE (Price: 0.02937 | +1.59%)
IMG_5398.jpg
4H Structure: Consolidating above EMA(7) (0.02928), with RSI(6) neutral at 51.95. Dynamic resistance awaits at EMA(25) (0.03005).
IMG_5398.jpg
+ 1
Conditional Scenarios:
If It Reclaims (> 0.03010): Room for a bounce toward 0.03150–0.03300 (SL < 0.02850).
IMG_5398.jpg
If It Breaks Down (< 0.02850): Risk of retesting the base at 0.02790 (SL > 0.03050).
IMG_5398.jpg
#EVAA #TURTLE #BinanceSquare #CryptoTrading #TechnicalAnalysis #RiskManagement
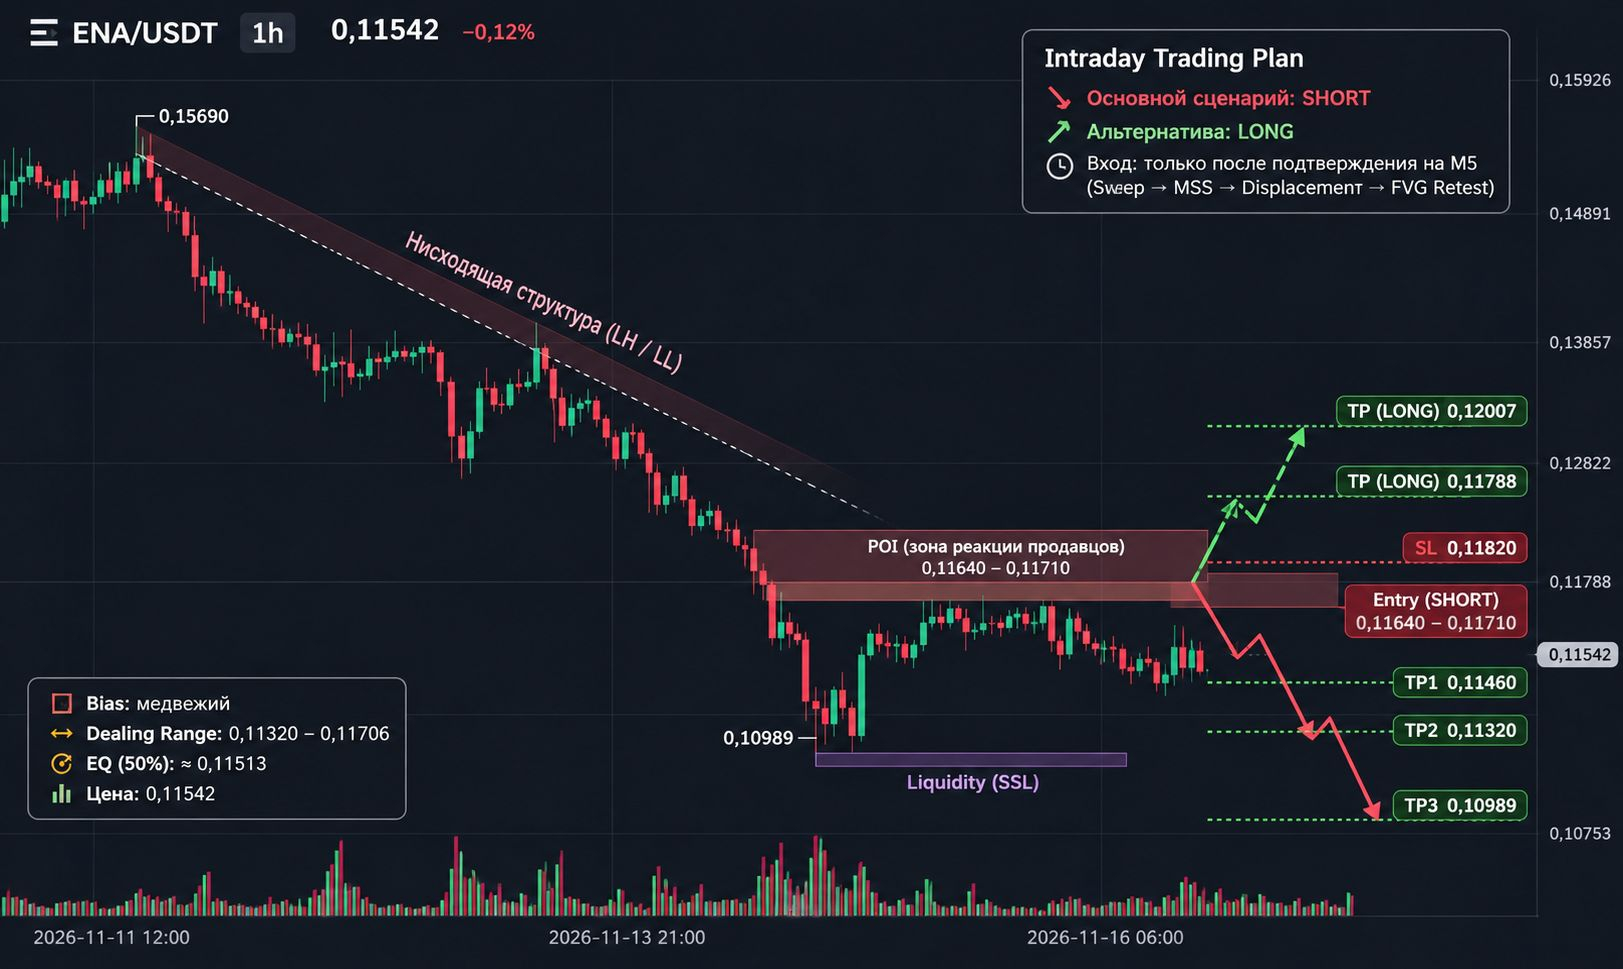
#ENA 🔥 $ENA — Are sellers preparing the next move? Don’t rush to buy this bounce! ENA is trading around $0.1154, but the HTF structure remains bearish. After sweeping the SSL at $0.11320, the price recovered, but there is still no full Bullish MSS. 🔴 Main scenario — SHORT POI: $0.11640–0.11710 Potential trading plan: Entry: $0.11640–0.11710 (only after M5 confirmation) SL: $0.11820 TP1: $0.11460 TP2: $0.11320 TP3: $0.10989 Estimated RR from the average Entry of $0.11675: TP1: 1:1.5 TP2: 1:2.4 TP3: 1:4.6 🟢 Plan B — LONG A close above $0.11710, a Bullish MSS, and a retest could open the way to $0.11788 and $0.12007. ⚠️ Invalidation: a sustained recovery above $0.11788–0.12007 would require reassessing the SHORT scenario. Important: POI is not an Entry! Wait for the M5 sequence: Liquidity Sweep → MSS → Displacement → FVG/IFVG Retest. Until confirmation, WAIT. Don’t chase the price! 📊 Which scenario will the market choose: further downside or a reversal? Share your thoughts in the comments. #ENA #CryptoTrading #BinanceSquare #TradingPlan $ENA {future}(ENAUSDT)
#ENA 🔥 $ENA — Are sellers preparing the next move? Don’t rush to buy this bounce!
ENA is trading around $0.1154, but the HTF structure remains bearish. After sweeping the SSL at $0.11320, the price recovered, but there is still no full Bullish MSS.
🔴 Main scenario — SHORT
POI: $0.11640–0.11710
Potential trading plan:
Entry: $0.11640–0.11710 (only after M5 confirmation)
SL: $0.11820
TP1: $0.11460
TP2: $0.11320
TP3: $0.10989
Estimated RR from the average Entry of $0.11675:
TP1: 1:1.5
TP2: 1:2.4
TP3: 1:4.6
🟢 Plan B — LONG
A close above $0.11710, a Bullish MSS, and a retest could open the way to $0.11788 and $0.12007.
⚠️ Invalidation: a sustained recovery above $0.11788–0.12007 would require reassessing the SHORT scenario.
Important: POI is not an Entry! Wait for the M5 sequence: Liquidity Sweep → MSS → Displacement → FVG/IFVG Retest.
Until confirmation, WAIT. Don’t chase the price!
📊 Which scenario will the market choose: further downside or a reversal? Share your thoughts in the comments.
#ENA #CryptoTrading #BinanceSquare #TradingPlan
$ENA
·
--
🔥 PRIMARY EXECUTION FOCUS: LOCKING IN THE RECOVERY STRUCTURE ON $TRUMP! Of the two assets monitored on the 4H chart, $TRUMP shows much stronger liquidity support and structural footing than the one still held below EMA(7) with an RSI of 40.76: IMG_5396.jpg + 1 Data Confirmation: Daily volume of 48.06M USDT is supporting the formation of a higher low from the 0,889 base, with the price sitting right at EMA(7) (0,953) and MACD in the green (+0,007). IMG_5395.jpg Execution Plan: We lean toward holding a LONG position in $TRUMP (targeting a test of EMA(25) resistance at 0,988, with micro-profit targets of 1,045–1,120), with a tight Stop Loss below 0,912 if the structure fails. IMG_5395.jpg 👉 COMMENT NOW: Are you joining us in managing the LONG $TRUMP toward 0,988, or watching out for TST breaking below 0,01010? Share your position below! IMG_5395.jpg + 1 Press Like and Follow for a measured execution roadmap with disciplined risk management! 🛡️ #TRUMP #TST #BinanceSquare #MicroProfit #CryptoTrading #TradingPlan
🔥 PRIMARY EXECUTION FOCUS: LOCKING IN THE RECOVERY STRUCTURE ON $TRUMP !

Of the two assets monitored on the 4H chart, $TRUMP shows much stronger liquidity support and structural footing than the one still held below EMA(7) with an RSI of 40.76:
IMG_5396.jpg
+ 1
Data Confirmation: Daily volume of 48.06M USDT is supporting the formation of a higher low from the 0,889 base, with the price sitting right at EMA(7) (0,953) and MACD in the green (+0,007).
IMG_5395.jpg
Execution Plan: We lean toward holding a LONG position in $TRUMP (targeting a test of EMA(25) resistance at 0,988, with micro-profit targets of 1,045–1,120), with a tight Stop Loss below 0,912 if the structure fails.
IMG_5395.jpg
👉 COMMENT NOW: Are you joining us in managing the LONG $TRUMP toward 0,988, or watching out for TST breaking below 0,01010? Share your position below!
IMG_5395.jpg
+ 1

Press Like and Follow for a measured execution roadmap with disciplined risk management! 🛡️

#TRUMP #TST #BinanceSquare #MicroProfit #CryptoTrading #TradingPlan
R9P
·
--
📊 4H LIQUIDITY MAP: CONSOLIDATING BELOW EMA AT $TST & $TRUMP!

Stay disciplined in reading key levels instead of guessing the direction. Both assets are in a post-deep-correction transition phase on the 4H chart. Here is an objective roadmap for
TST and TRUMP.

ASSET 1: $TST (Price: 0,01040 | +1.96%)
IMG_5396.jpg
4H Structure: Held below EMA(7) (0,010477), with weak RSI(6) momentum at 40.76. The daily support floor is at 0,01011.
IMG_5396.jpg
+ 1
Conditional Scenarios:
If Reclaimed (> 0,01085): A confirmed break above EMA(25) opens targets at 0,01140 – 0,01195 (SL < 0,01005).
IMG_5396.jpg
If Breakdown (< 0,01010): Further downside risk toward the 0,00980 – 0,00945 support zone (SL > 0,01085).
IMG_5396.jpg
ASSET 2: $TRUMP (Price: 0,953 | +1.60%)
IMG_5395.jpg
4H Structure: Liquidity of 48.06M USDT is supporting the recovery from the 0,889 bottom. Price is now testing the EMA(7) line (0,953), with positive MACD (+0,007). The nearest resistance is EMA(25) (0,988).
IMG_5395.jpg
+ 1
Conditional Scenarios:
If Breakout (> 0,990): Upside potential opens toward 1,045 – 1,120 (SL < 0,912).
IMG_5395.jpg
If Rejected (< 0,940): A healthy correction back to the 0,915 – 0,890 area (SL > 1,005).
IMG_5395.jpg
#TST #TRUMP #BinanceSquare #CryptoTrading #TechnicalAnalysis #RiskManagement
Log in to explore more content
Join global crypto users on Binance Square
⚡️ Get latest and useful information about crypto.
💬 Trusted by the world’s largest crypto exchange.
👍 Discover real insights from verified creators.
Email / Phone number