Binance Square
#solanastrong

solanastrong

5.8M views
11,037 Discussing
F K _Trader
·
--
Solana $SOL Back in Focus: ETFs Inflows and Network Upgrades Drive Market Attention Solana $SOL is back in the spotlight as the cryptocurrency market continues to watch major altcoins closely. After a strong recovery during September, SOL is now trading around the $117 area, although the token has pulled back slightly from its recent highs. One of the major developments attracting attention is institutional interest. $SOL related ETFs recorded around $188 million in net inflows during the week ending September 25, according to recent market reports. Bitwise's Solana ETFs accounted for a large portion of those inflows. At the same time, Solana's network continues to see development. The Alpenglow upgrade has entered the testnet and devnet stages, with the upgrade designed to significantly reduce transaction finality times. However, the exact mainnet deployment timeline remains subject to the required validator adoption. The broader market remains challenging, with higher U.S. Treasury yields and rising oil prices put pressure on risk assets, including cryptocurrencies. This means {spot}(SOLUSDT) #SolanaStrong #ETF #Binance #EarningsSeason
Solana $SOL Back in Focus: ETFs Inflows and Network Upgrades Drive Market Attention

Solana $SOL is back in the spotlight as the cryptocurrency market continues to watch major altcoins closely. After a strong recovery during September, SOL is now trading around the $117 area, although the token has pulled back slightly from its recent highs.

One of the major developments attracting attention is institutional interest. $SOL related ETFs recorded around $188 million in net inflows during the week ending September 25, according to recent market reports. Bitwise's Solana ETFs accounted for a large portion of those inflows.

At the same time, Solana's network continues to see development. The Alpenglow upgrade has entered the testnet and devnet stages, with the upgrade designed to significantly reduce transaction finality times. However, the exact mainnet deployment timeline remains subject to the required validator adoption.

The broader market remains challenging, with higher U.S. Treasury yields and rising oil prices put pressure on risk assets, including cryptocurrencies. This means


#SolanaStrong #ETF #Binance #EarningsSeason
Will $HYPE flip $SOL by October?

Will $HYPE flip $SOL by October?

1%Yes99%No
Volume $505.16
$SOL (Solana) Analysis — 29 Sep 2026 Solana is trading around $116–$118 currently. CoinMarketCap reports about $116.65, with a 24-hour range of roughly $116.53–$120.33. � CoinMarketCap Key levels: 🟢 Support: $115–$116 🟢 Stronger support: $110–$113 🔴 Resistance: $120–$123 🔴 Major resistance: $124–$125 Bullish scenario: A sustained move above $120–$123 could bring the $124–$125 area back into focus. � CoinMarketCap +1 Bearish scenario: Losing $115 could increase downside pressure, with the $110–$113 area becoming important. A larger breakdown could put the $100–$105 zone on watch. � MetaTrader Technical indicators are mixed: Investing.com currently shows RSI around 45, while several short-term moving averages are giving sell signals. � Investing.com India Recent Solana ETF inflows have been notable, with one report saying weekly inflows reached a record $188 million, while the Alpenglow upgrade remains an important development to watch.#EarningsSeason #SolanaStrong #StrategyAdds1666BTCHoldingsReach847666 #OpenAIDelaysGPT6.1OverSafetyIssues {spot}(SOLUSDT) $SOL
$SOL (Solana) Analysis — 29 Sep 2026
Solana is trading around $116–$118 currently. CoinMarketCap reports about $116.65, with a 24-hour range of roughly $116.53–$120.33. �
CoinMarketCap
Key levels:
🟢 Support: $115–$116
🟢 Stronger support: $110–$113
🔴 Resistance: $120–$123
🔴 Major resistance: $124–$125
Bullish scenario: A sustained move above $120–$123 could bring the $124–$125 area back into focus. �
CoinMarketCap +1
Bearish scenario: Losing $115 could increase downside pressure, with the $110–$113 area becoming important. A larger breakdown could put the $100–$105 zone on watch. �
MetaTrader
Technical indicators are mixed: Investing.com currently shows RSI around 45, while several short-term moving averages are giving sell signals. �
Investing.com India
Recent Solana ETF inflows have been notable, with one report saying weekly inflows reached a record $188 million, while the Alpenglow upgrade remains an important development to watch.#EarningsSeason #SolanaStrong #StrategyAdds1666BTCHoldingsReach847666 #OpenAIDelaysGPT6.1OverSafetyIssues
$SOL
·
--
Bullish
🚨 🚀🚀2 ALTCOINS TO WATCH — KEY LEVELS 🔥 $ETH 📍 Support: $2,630–2,650 ⚡ Resistance: $2,700–2,720 🎯 Breakout above $2,720 → next upside zone $2,780–2,800 ⚠️ Below $2,630 → weakness can increase ⚡ $SOL 📍 Support: $114–117 ⚡ Resistance: $122–125 🎯 Breakout above $125 → next zone $130–135 ⚠️ Below $114 🚀 $LINK — ALTCOIN TO WATCH 📈 Momentum strong, buyers active. 🎯 Key zone: $15–$16 🔥 Break & hold above resistance → next upside zone watch. #LINK🔥🔥🔥 {future}(LINKUSDT) {future}(ETHUSDT) {future}(SOLUSDT) #Ethereum #SolanaStrong #BinanceExplorers 🚀⭐️
🚨 🚀🚀2 ALTCOINS TO WATCH — KEY LEVELS
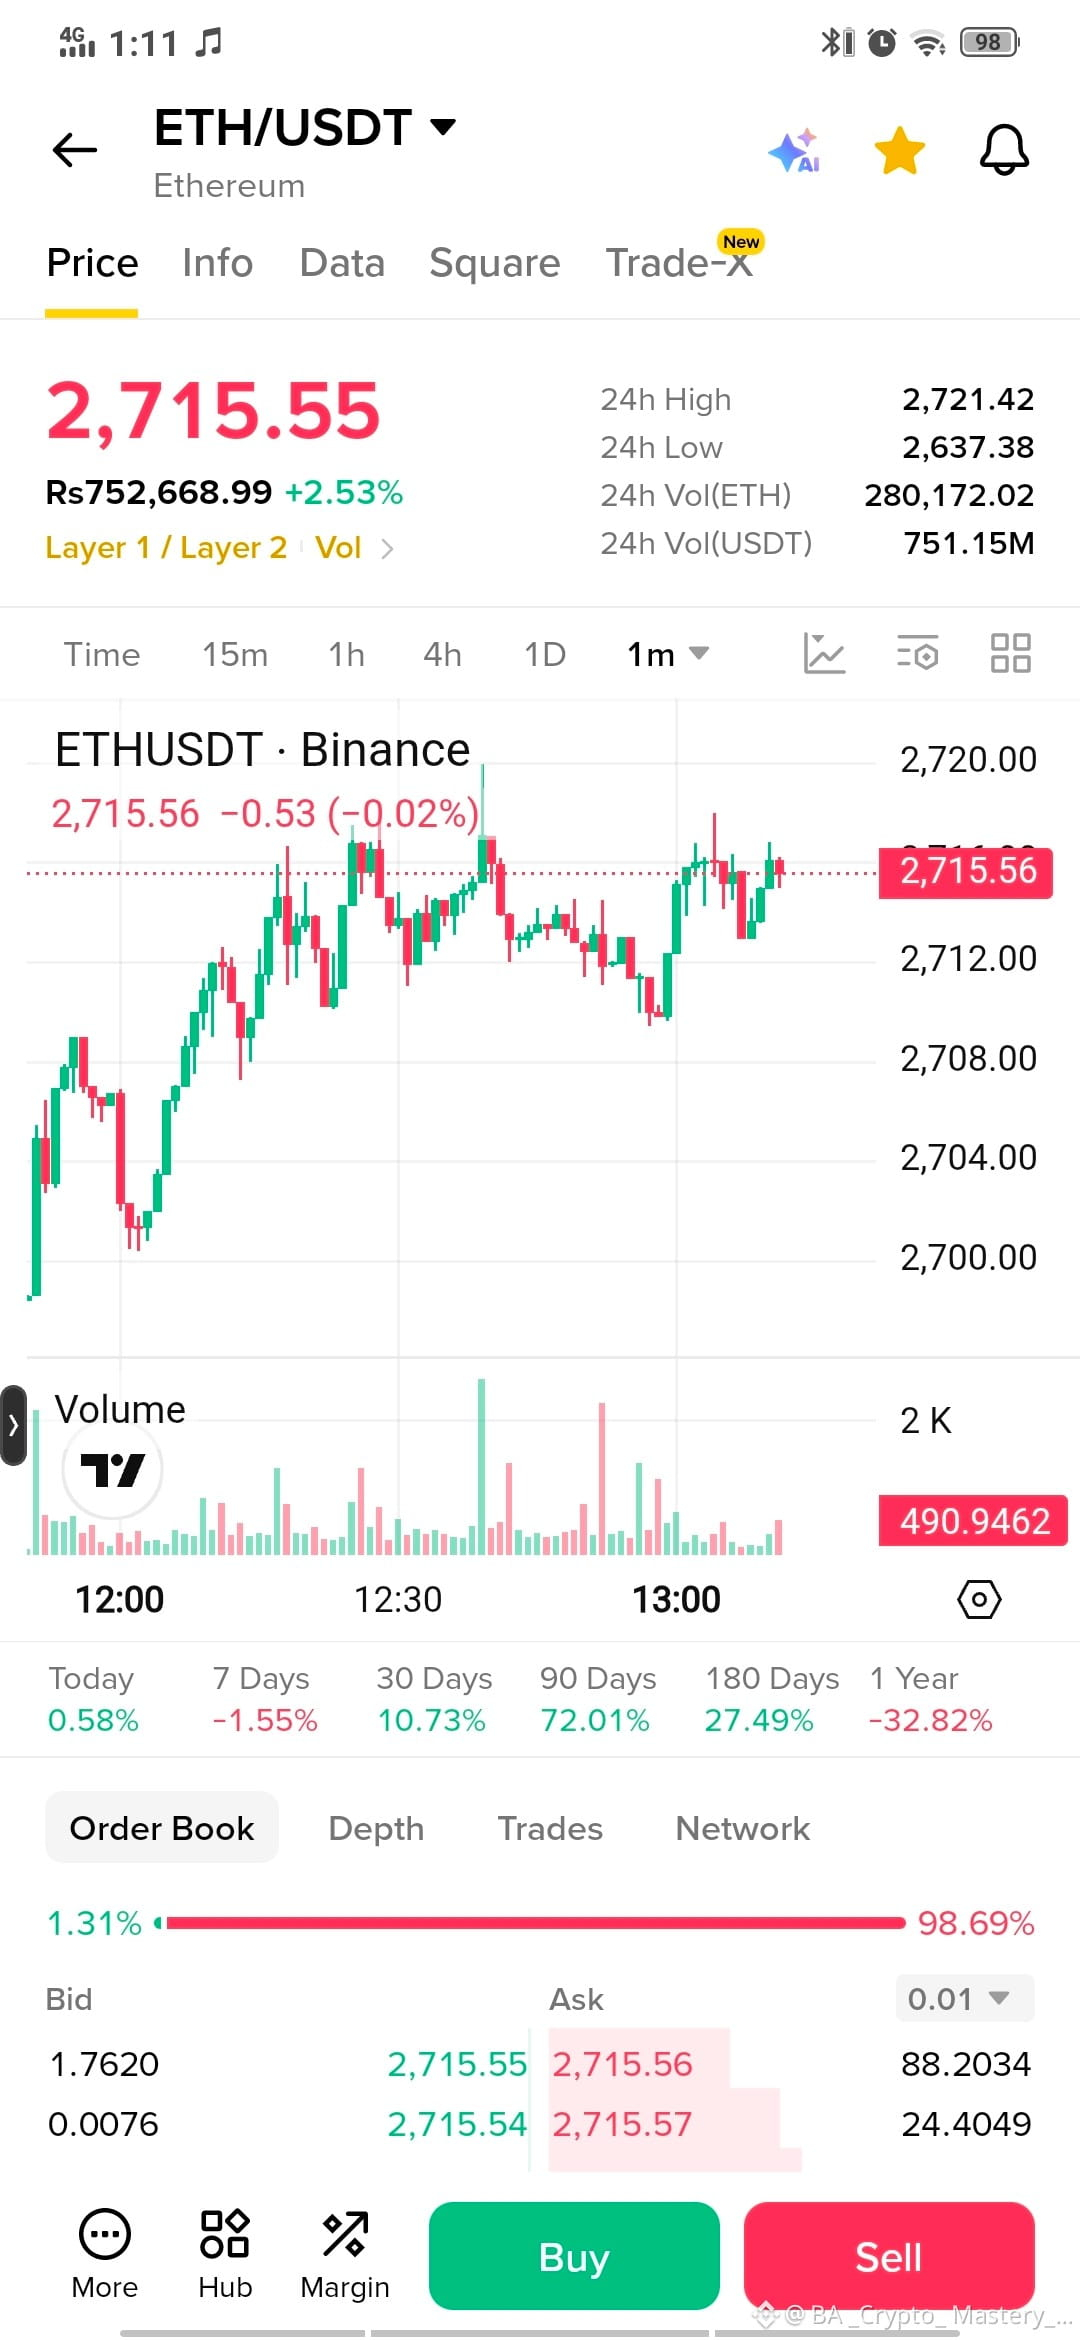
🔥 $ETH 📍 Support: $2,630–2,650 ⚡ Resistance: $2,700–2,720 🎯 Breakout above $2,720 → next upside zone $2,780–2,800 ⚠️ Below $2,630 → weakness can increase
⚡ $SOL 📍 Support: $114–117 ⚡ Resistance: $122–125 🎯 Breakout above $125 → next zone $130–135 ⚠️ Below $114

🚀 $LINK — ALTCOIN TO WATCH
📈 Momentum strong, buyers active.
🎯 Key zone: $15–$16
🔥 Break & hold above resistance → next upside zone watch.
#LINK🔥🔥🔥


#Ethereum
#SolanaStrong
#BinanceExplorers 🚀⭐️
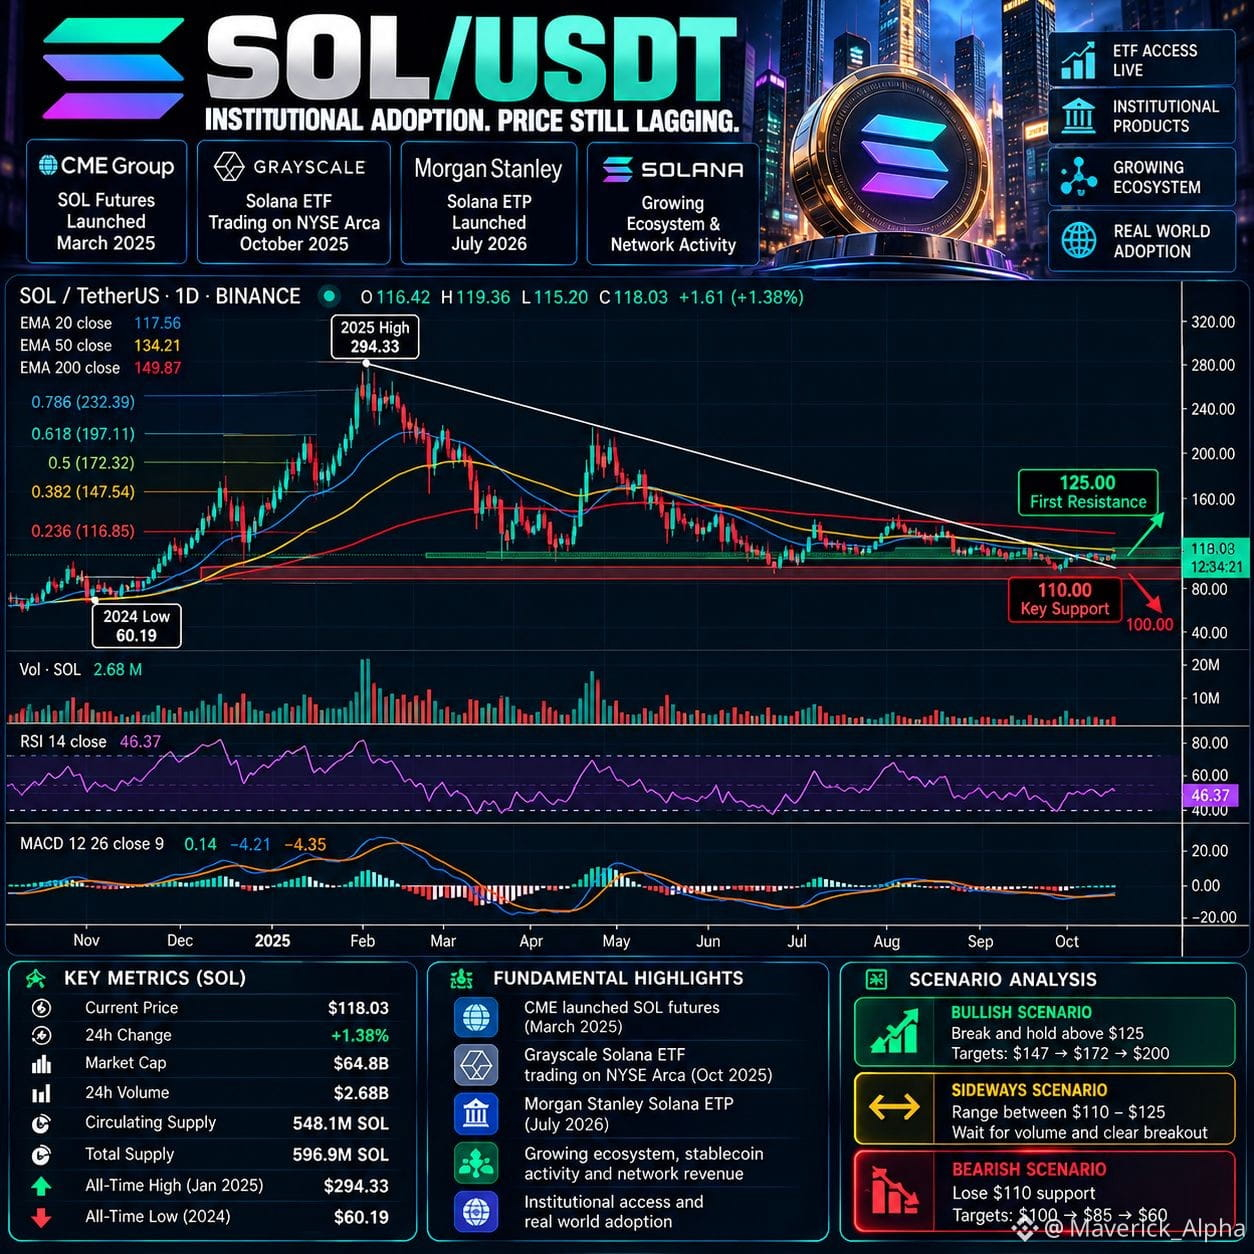
SOL: INSTITUTIONAL ADOPTION GROWS AS PRICE LAGS Solana has made serious progress. CME futures, Grayscale's Solana ETF and expanding institutional access are bringing SOL closer to traditional finance. Yet price still hasn't caught up. SOL recently traded near $118, well below its 2025 high of $294. $110 is the level that matters. Losing it signals weakness. Reclaiming $125 with strong volume would be the first sign sentiment is turning. My take: Watch, not a long. Sustained ETF inflows, growing stablecoin activity and stronger network revenue matter more than another announcement. Will institutional adoption finally translate into sustained demand? #SOL #SolanaStrong $SOL {future}(SOLUSDT)
SOL: INSTITUTIONAL ADOPTION GROWS AS PRICE LAGS

Solana has made serious progress. CME futures, Grayscale's Solana ETF and expanding institutional access are bringing SOL closer to traditional finance.

Yet price still hasn't caught up.

SOL recently traded near $118, well below its 2025 high of $294.

$110 is the level that matters. Losing it signals weakness. Reclaiming $125 with strong volume would be the first sign sentiment is turning.

My take: Watch, not a long. Sustained ETF inflows, growing stablecoin activity and stronger network revenue matter more than another announcement.

Will institutional adoption finally translate into sustained demand?

#SOL #SolanaStrong
$SOL
·
--
Bullish
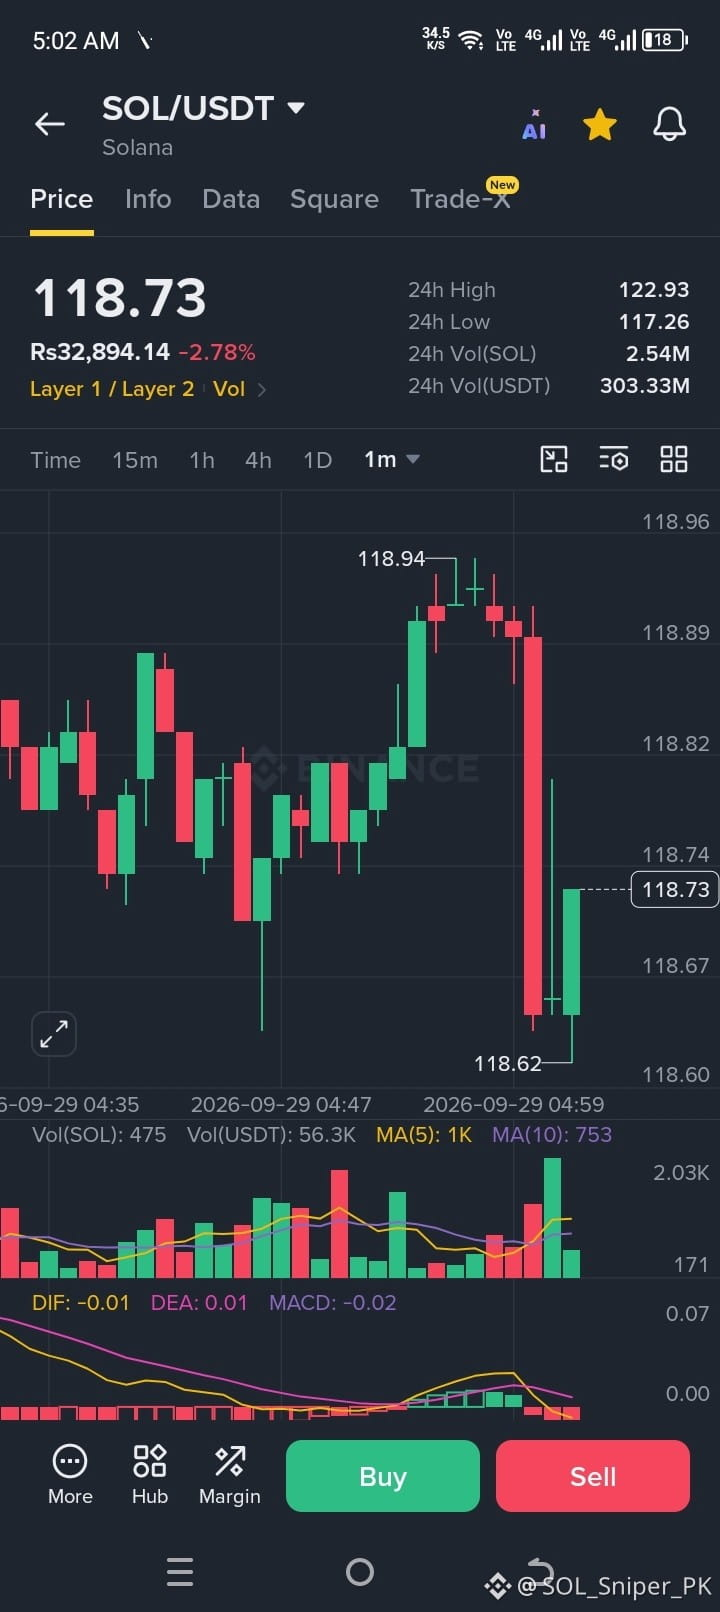
#SolanaStrong *For Binance Square (English - For Likes/Shares):* > *SOL/USDT LIVE ANALYSIS - Panic or Opportunity? 📉* > > SOL is currently at *$118.73 (-2.78%)* after rejecting from 24h High of $122.93. > > *What I'm seeing on 1m Chart:* > Strong red candle drop to $118.62 and now buyers are stepping in. Volume is increasing (2.03K) and MACD is showing -0.02 which means selling pressure is almost over. > > *My Plan:* > I am looking for a long entry around $118.60 - $118.70 zone. > SL: $117.26 (Today's Low) > TP1: $119.50 / TP2: $122.00 > > Risk management first! This is not financial advice, just my view. > > What is your view on SOL? Long or Short? > > #SOL #Solana #CryptoAnalysis #TradeSetup #SOLUSDT
#SolanaStrong *For Binance Square (English - For Likes/Shares):*

> *SOL/USDT LIVE ANALYSIS - Panic or Opportunity? 📉*
>
> SOL is currently at *$118.73 (-2.78%)* after rejecting from 24h High of $122.93.
>
> *What I'm seeing on 1m Chart:*
> Strong red candle drop to $118.62 and now buyers are stepping in. Volume is increasing (2.03K) and MACD is showing -0.02 which means selling pressure is almost over.
>
> *My Plan:*
> I am looking for a long entry around $118.60 - $118.70 zone.
> SL: $117.26 (Today's Low)
> TP1: $119.50 / TP2: $122.00
>
> Risk management first! This is not financial advice, just my view.
>
> What is your view on SOL? Long or Short?
>
> #SOL #Solana #CryptoAnalysis #TradeSetup #SOLUSDT
·
--
Bearish
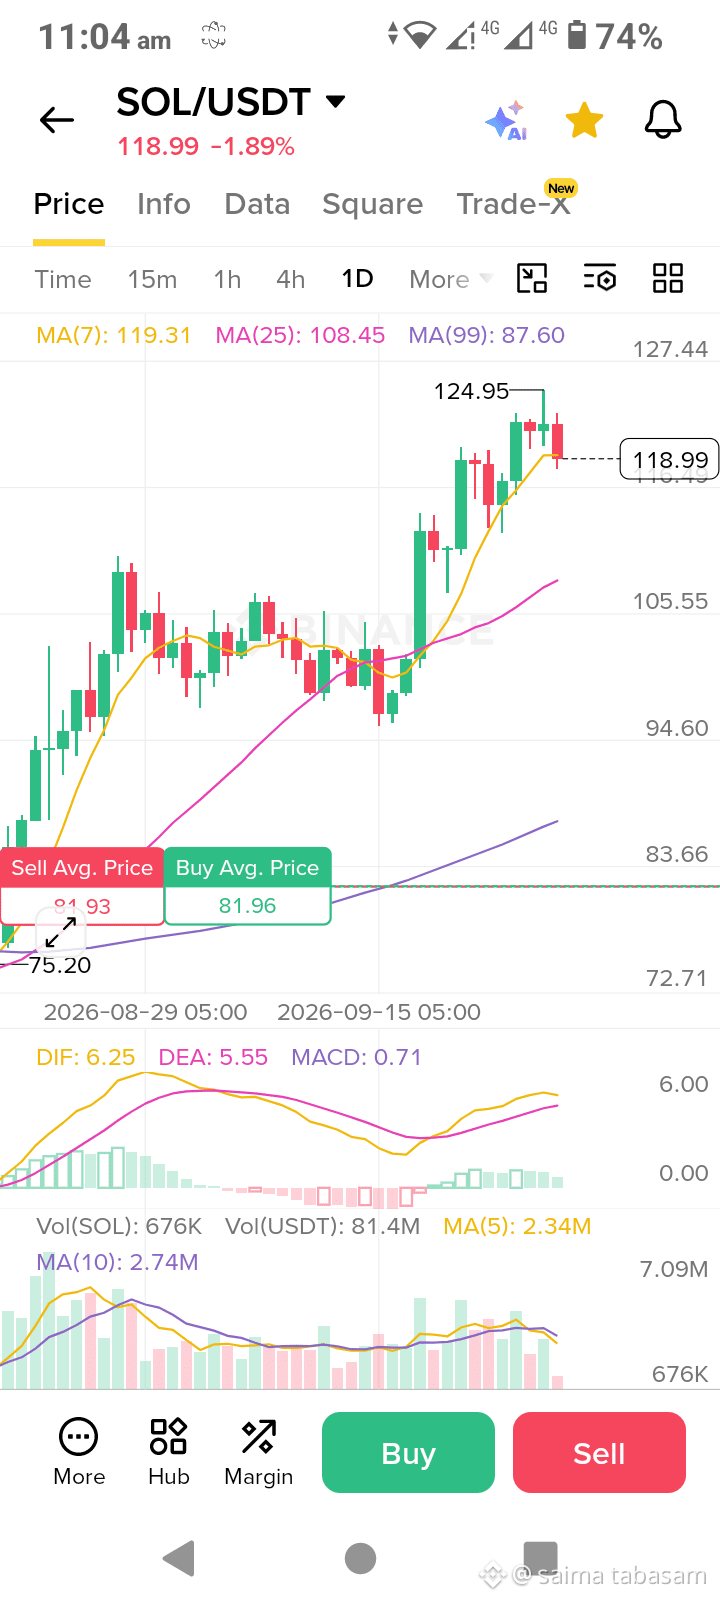
$SOL {future}(SOLUSDT) #SolanaStrong #solonapumping 📈 SOL/USDT — Bullish Momentum, But $125 Resistance in Focus SOL/USDT is currently trading around $119, after recently reaching a high near $124.95. The daily chart shows that SOL remains above its MA(25) at $108.45 and MA(99) at $87.60, which indicates that the broader trend is still positive. However, price is currently pulling back from the $124–$125 resistance zone. If SOL breaks and holds above $125 with strong volume, the bullish momentum could strengthen. On the other hand, failure to break this area may lead to a short-term correction toward the $115–$112 support zone. The MACD remains positive, while the recent pullback shows some profit-taking. Current market dat also shows SOL around $121 with a 24-hour range near $120–$125. Key Levels: 🟢 Resistance: $124–$125 🟢 Breakout above $125 → bullish momentum may continue 🔴 Support: $115–$112 🔴 Below $112 → further downside risk increases Conclusion: The chart currently has a bullish structure, but confirmation above $125 is important. Traders should watch volume and the daily candle close before making a decision. This is technical analysis, not financial advice.
$SOL
#SolanaStrong #solonapumping 📈 SOL/USDT — Bullish Momentum, But $125 Resistance in Focus

SOL/USDT is currently trading around $119, after recently reaching a high near $124.95. The daily chart shows that SOL remains above its MA(25) at $108.45 and MA(99) at $87.60, which indicates that the broader trend is still positive.

However, price is currently pulling back from the $124–$125 resistance zone. If SOL breaks and holds above $125 with strong volume, the bullish momentum could strengthen. On the other hand, failure to break this area may lead to a short-term correction toward the $115–$112 support zone.

The MACD remains positive, while the recent pullback shows some profit-taking. Current market dat also shows SOL around $121 with a 24-hour range near $120–$125.

Key Levels:
🟢 Resistance: $124–$125
🟢 Breakout above $125 → bullish momentum may continue
🔴 Support: $115–$112
🔴 Below $112 → further downside risk increases

Conclusion: The chart currently has a bullish structure, but confirmation above $125 is important. Traders should watch volume and the daily candle close before making a decision.

This is technical analysis, not financial advice.
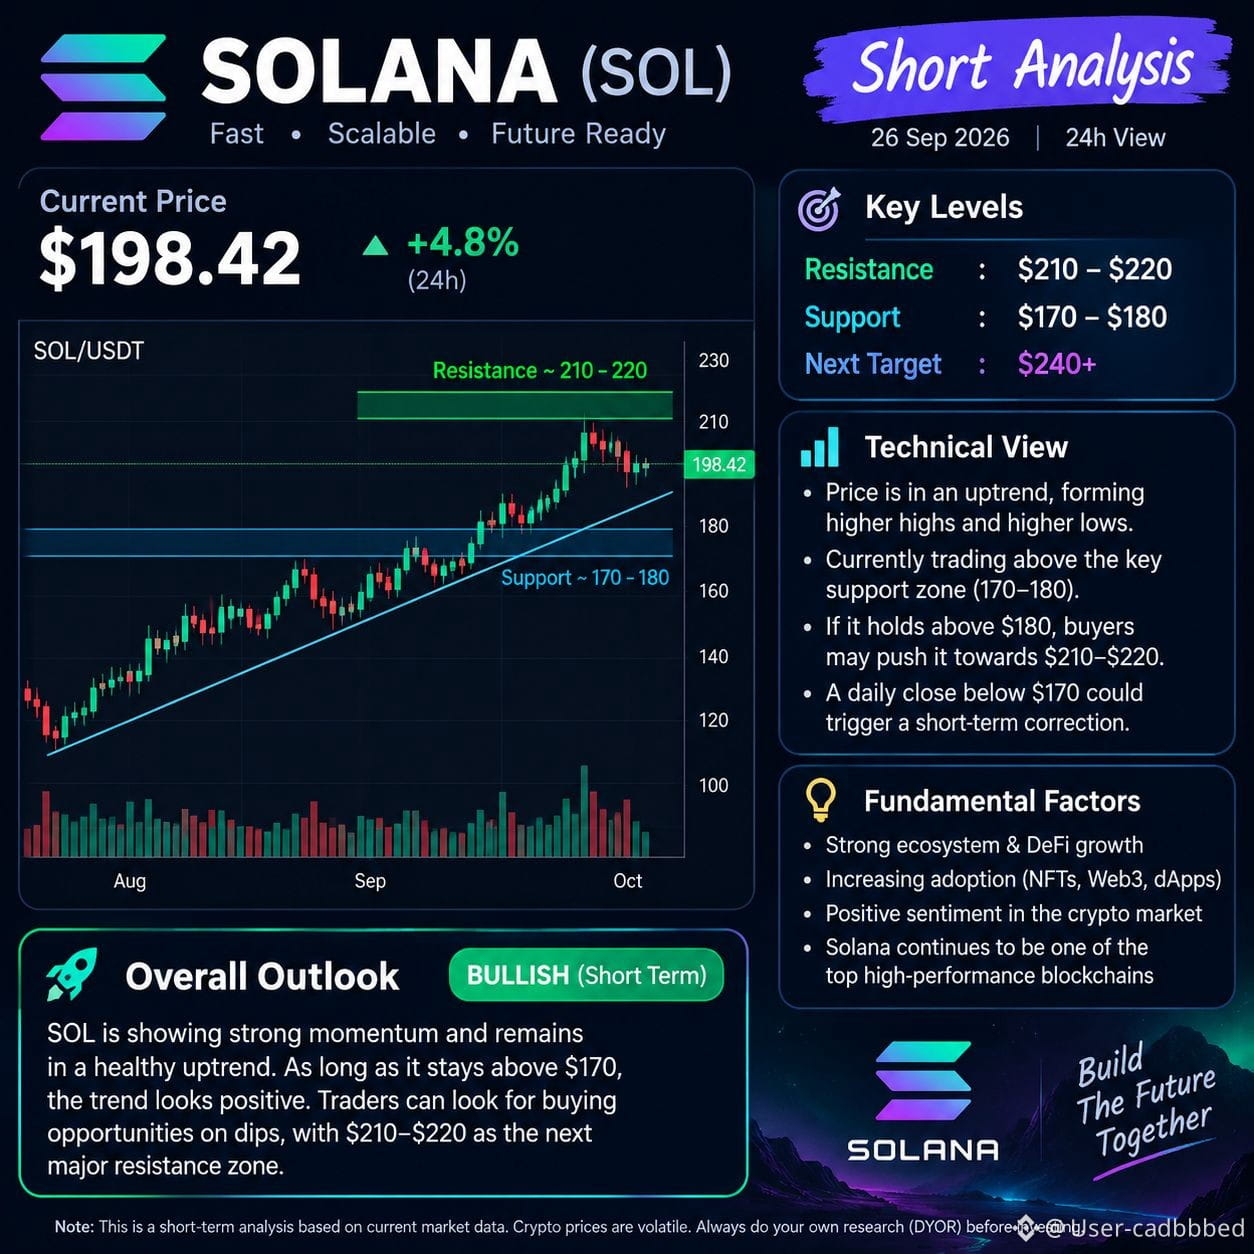
$SOL (Solana) — Short Analysis Trend: Short-term momentum is positive. Resistance: $210–$220 Support: $170–$180 Potential target: $240+ Risk: A break below $170 could signal a short-term correction. #solana #SolanaStrong #SOL空投 {spot}(SOLUSDT)
$SOL (Solana) — Short Analysis
Trend: Short-term momentum is positive.
Resistance: $210–$220
Support: $170–$180
Potential target: $240+
Risk: A break below $170 could signal a short-term correction.
#solana #SolanaStrong #SOL空投
$SOL 🔥 What’s your target for $SOL this month? Let me know below! 👇 #Solana #SOL #CryptoAnalysis #BinanceSquare #TradingTips $SOL $SOL is showing strong momentum on the daily charts, holding strong near key support levels while testing critical resistance zones. Trader interest and ecosystem volume are spiking! Here is the current breakdown for $SOL: 🔑 Key Technical Levels: • Major Resistance: Primary overhead resistance to clear for the next leg up. • Strong Support Floor: Key buying zone holding back bearish momentum. • Trend Support: Crucial level for maintaining the macro bullish structure. 💡 Why solana is Looking Strong: 1️⃣ Ecosystem Growth: High DEX trading volume and strong active wallet addresses on-chain. 2️⃣ Institutional Interest: Sol ecosystem continues to see solid institutional sentiment and net inflows. 3️⃣ Technical Indicators: RSI and MACD on daily timeframes indicate strong buyers step in on every dip. 🎯 What To Watch Next: • Bullish Scenario: A clean daily close above current resistance can spark a fast rally toward higher targets. • Consolidation Scenario: Holding the current support range allows to build a solid foundation before its next big expansion.#SolanaStrong
$SOL 🔥

What’s your target for $SOL this month? Let me know below! 👇

#Solana #SOL #CryptoAnalysis #BinanceSquare #TradingTips $SOL

$SOL is showing strong momentum on the daily charts, holding strong near key support levels while testing critical resistance zones. Trader interest and ecosystem volume are spiking!

Here is the current breakdown for $SOL :

🔑 Key Technical Levels: • Major Resistance: Primary overhead resistance to clear for the next leg up. • Strong Support Floor: Key buying zone holding back bearish momentum. • Trend Support: Crucial level for maintaining the macro bullish structure.

💡 Why solana is Looking Strong: 1️⃣ Ecosystem Growth: High DEX trading volume and strong active wallet addresses on-chain. 2️⃣ Institutional Interest: Sol ecosystem continues to see solid institutional sentiment and net inflows. 3️⃣ Technical Indicators: RSI and MACD on daily timeframes indicate strong buyers step in on every dip.

🎯 What To Watch Next: • Bullish Scenario: A clean daily close above current resistance can spark a fast rally toward higher targets. • Consolidation Scenario: Holding the current support range allows to build a solid foundation before its next big expansion.#SolanaStrong
·
--
Bullish
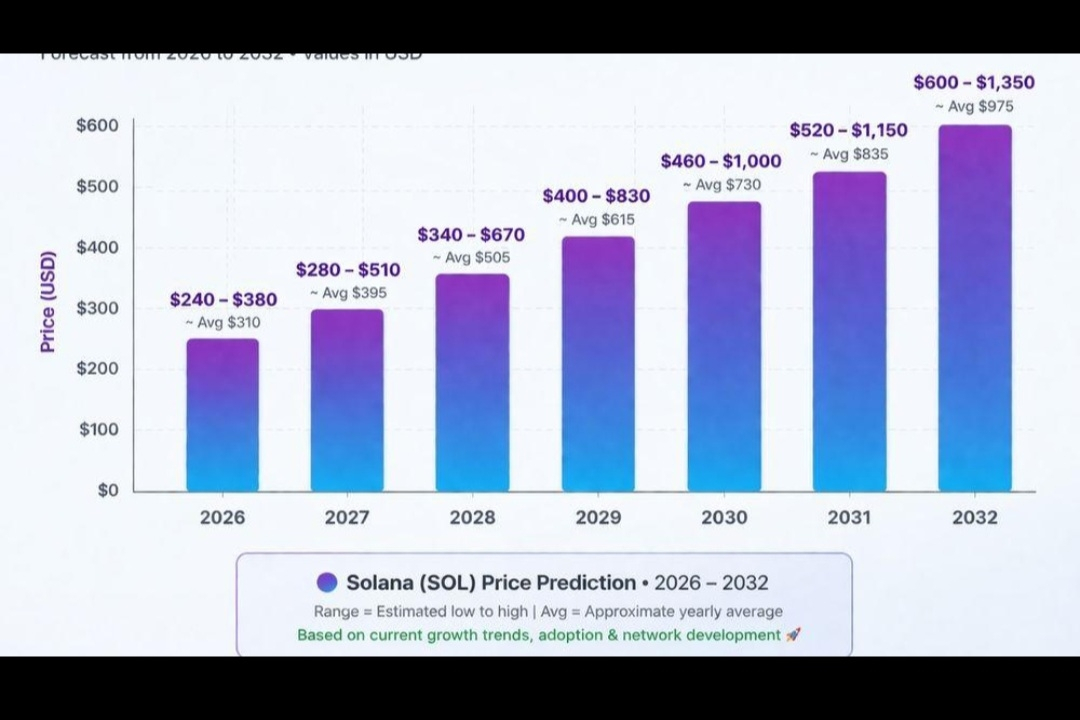
$SOL 🔮 Solana (SOL) — 2030 Price Outlook 2030 predictions vary very widely because they depend on Solana adoption, crypto market cycles, network revenue and competition. PrimeXBT 2030 forecast: approximately $254–$389, with an average around $319. � PrimeXBT VanEck's older 2030 scenarios: its model ranged from $9.81 bear case to $3,211 bull case, based on very different adoption assumptions. � ETF & UCITS Fund Manager | VanEck Solana is continuing major network upgrades in 2026, including faster transaction processing and Firedancer development. � Solana +1 Simple scenario: 🟢 Strong adoption → potentially $500+ 🟡 Moderate adoption → roughly $250–$400 🔴 Weak adoption / prolonged bear market → potentially below $200 #solana #sol #SolanaStrong #solonapumping
$SOL 🔮 Solana (SOL) — 2030 Price Outlook
2030 predictions vary very widely because they depend on Solana adoption, crypto market cycles, network revenue and competition.
PrimeXBT 2030 forecast: approximately $254–$389, with an average around $319. �
PrimeXBT
VanEck's older 2030 scenarios: its model ranged from $9.81 bear case to $3,211 bull case, based on very different adoption assumptions. �
ETF & UCITS Fund Manager | VanEck
Solana is continuing major network upgrades in 2026, including faster transaction processing and Firedancer development. �
Solana +1
Simple scenario:
🟢 Strong adoption → potentially $500+
🟡 Moderate adoption → roughly $250–$400
🔴 Weak adoption / prolonged bear market → potentially below $200
#solana #sol #SolanaStrong #solonapumping
·
--
Bullish
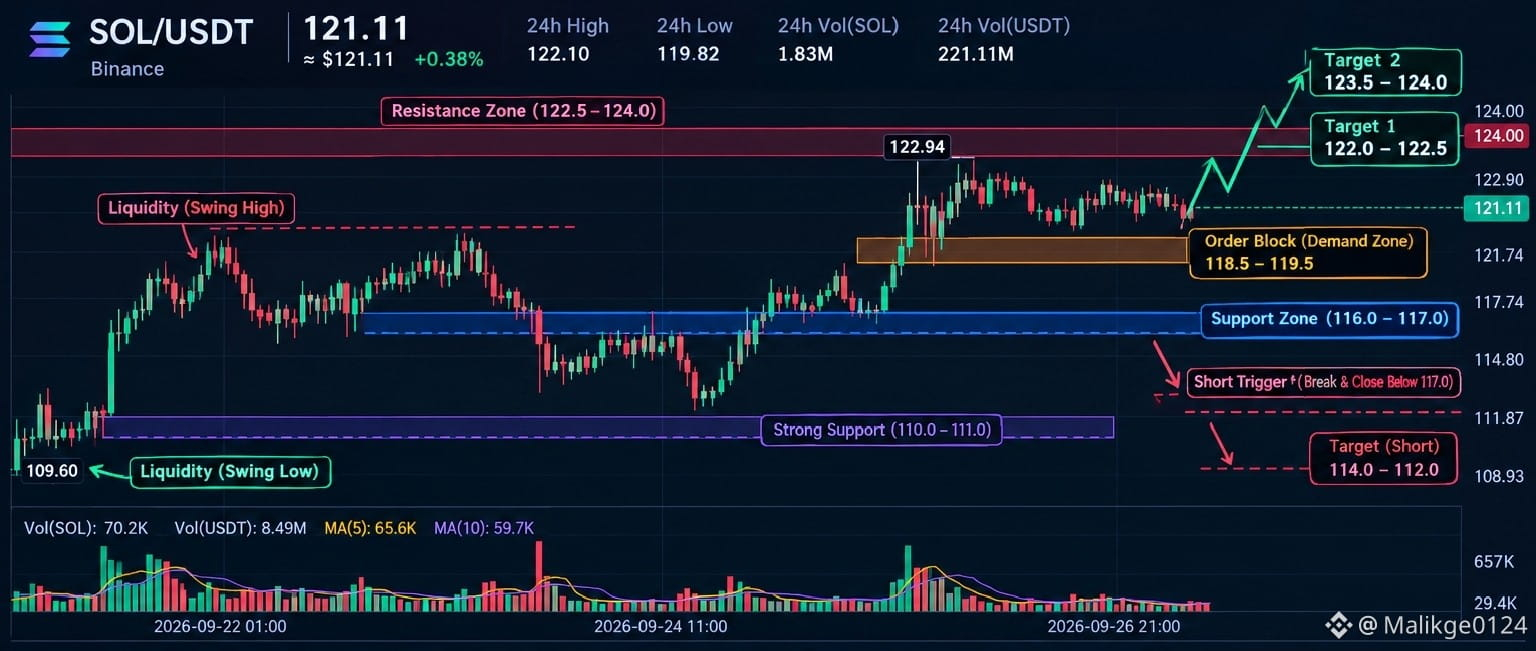
SOL/USDT Quick Analysis (1H) Current Price: $121.11 SOL remains bullish on the 1-hour chart, trading above key support levels while consolidating below resistance. Key Support $118.5 - $119.5 → Main demand zone (bullish order block) $116 - $117 → Critical support $110 - $111 → Strong support and liquidity area Key Resistance $122.5 - $123 → Immediate resistance $123.5 - $124 → Major liquidity zone Long Setup Entry: $118.5 - $119.5 Stop Loss: Below $117 Target 1: $122 - $122.5 Target 2: $123.5 - $124 Short Setup Only if a 1H candle closes below $117: Entry: Below $117 Target: $114 → $112 Stop Loss: Around $119 Liquidity & Order Blocks Buy-side liquidity sits above $122.94. Sell-side liquidity sits below $118.5. Main bullish order block is $118.5 - $119.5. Overall View The structure remains neutral-to-bullish while price stays above $117. A breakout above $123 could lead to further upside, while a breakdown below $117 may trigger a move toward $114-$112. #sol #SolanaStrong
SOL/USDT Quick Analysis (1H)

Current Price: $121.11

SOL remains bullish on the 1-hour chart, trading above key support levels while consolidating below resistance.

Key Support

$118.5 - $119.5 → Main demand zone (bullish order block)

$116 - $117 → Critical support

$110 - $111 → Strong support and liquidity area

Key Resistance

$122.5 - $123 → Immediate resistance

$123.5 - $124 → Major liquidity zone

Long Setup

Entry: $118.5 - $119.5

Stop Loss: Below $117

Target 1: $122 - $122.5

Target 2: $123.5 - $124

Short Setup

Only if a 1H candle closes below $117:

Entry: Below $117

Target: $114 → $112

Stop Loss: Around $119

Liquidity & Order Blocks

Buy-side liquidity sits above $122.94.

Sell-side liquidity sits below $118.5.

Main bullish order block is $118.5 - $119.5.

Overall View

The structure remains neutral-to-bullish while price stays above $117. A breakout above $123 could lead to further upside, while a breakdown below $117 may trigger a move toward $114-$112.

#sol #SolanaStrong
#sol板块 #solanAnalysis 📌 Title: Is Solana ($SOL) Ready to Break Its All-Time High? Key Levels to Watch Now! When it comes to layer-1 blockchains, Solana ($SOL) is hands down the most talked-after coin in the market right now. Thanks to its massive on-chain volume, booming meme coin ecosystem, and surging network activity, SOL is showing an incredibly strong bullish momentum. If you are looking for high-liquidity setups, Solana’s current price action is something you absolutely cannot ignore. 📊 Technical Analysis & Key Levels: • Strong Support: SOL has established a rock-solid support base. As long as the price holds above this zone, the macro uptrend remains perfectly intact. • Bullish Breakout: On the daily chart, we are seeing a clear continuation pattern (Bullish Flag/Pennant). A high-volume breakout above the current resistance could trigger a massive rally toward new yearly highs. 💡 Why is $SOL Skyrocketing? 1. DEX Volume Dominance: Solana's Decentralized Exchange (DEX) volume frequently surpasses Ethereum, driven by non-stop retail hype and high-speed, low-fee transactions. 2. Institutional Interest: Major asset managers are continually pushing for Solana ETFs, bringing massive long-term credibility to the ecosystem. 🎯 Trading Strategy & Targets: • Entry Zone: Consider scaling in (DCA) around the current market price or waiting for a successful retest of the breakout line. • Short-term Target: [Insert your short-term target, e.g., $195 / $210] • Mid-term Target: [Insert your mid-term target, e.g., $240+] • Stop Loss: Always manage your risk! Keep a tight stop loss just below the immediate key support level. #SolanaStrong
#sol板块 #solanAnalysis
📌 Title: Is Solana ($SOL) Ready to Break Its All-Time High? Key Levels to Watch Now!
When it comes to layer-1 blockchains, Solana ($SOL) is hands down the most talked-after coin in the market right now. Thanks to its massive on-chain volume, booming meme coin ecosystem, and surging network activity, SOL is showing an incredibly strong bullish momentum.
If you are looking for high-liquidity setups, Solana’s current price action is something you absolutely cannot ignore.
📊 Technical Analysis & Key Levels:
• Strong Support: SOL has established a rock-solid support base. As long as the price holds above this zone, the macro uptrend remains perfectly intact.
• Bullish Breakout: On the daily chart, we are seeing a clear continuation pattern (Bullish Flag/Pennant). A high-volume breakout above the current resistance could trigger a massive rally toward new yearly highs.
💡 Why is $SOL Skyrocketing?
1. DEX Volume Dominance: Solana's Decentralized Exchange (DEX) volume frequently surpasses Ethereum, driven by non-stop retail hype and high-speed, low-fee transactions.
2. Institutional Interest: Major asset managers are continually pushing for Solana ETFs, bringing massive long-term credibility to the ecosystem.
🎯 Trading Strategy & Targets:
• Entry Zone: Consider scaling in (DCA) around the current market price or waiting for a successful retest of the breakout line.
• Short-term Target: [Insert your short-term target, e.g., $195 / $210]
• Mid-term Target: [Insert your mid-term target, e.g., $240+]
• Stop Loss: Always manage your risk! Keep a tight stop loss just below the immediate key support level.
#SolanaStrong
Solana’s biggest consensus overhaul since launch has crossed a major hurdle. Alpenglow activated on testnet Sept. 24 and devnet Sept. 25, replacing TowerBFT with Votor and targeting transaction finality in just 100 to 150 milliseconds. Solana co-founder Anatoly Yakovenko declared, “You are not ready for this.” However, those speeds remain unproven under full mainnet conditions, and competing validator clients still have work to do before the transition is complete. #SOL #SolanaStrong
Solana’s biggest consensus overhaul since launch has crossed a major hurdle. Alpenglow activated on testnet Sept. 24 and devnet Sept. 25, replacing TowerBFT with Votor and targeting transaction finality in just 100 to 150 milliseconds. Solana co-founder Anatoly Yakovenko declared, “You are not ready for this.” However, those speeds remain unproven under full mainnet conditions, and competing validator clients still have work to do before the transition is complete.
#SOL #SolanaStrong
Asset Analysis SOL/USDT — 8h Chart The chart shows Solana (SOL) against USDT on the 8-hour timeframe, and the current technical scenario is a transition moment. There is an ascending channel (bounded by the yellow diagonal lines) that has recently broken downwards. This breakdown is a sign of weakening buying pressure in the short term, with a moderate probability of a pullback or a longer sideways movement if the price does not recover quickly. The current price is 119.78, in a consolidation zone between support at 117.25 and resistance at 119.92. The asset is testing the base of the previous trend channel, making these levels decisive. The outlook is neutral with a bearish bias in the short term, given the channel breakdown. If the price holds 117.25, there is a possibility of a renewed attempt to resume the uptrend. If it breaks below 117.25, the trend points toward a pullback or a longer sideways phase. The RSI(6) is at 51.39, in a neutral zone, with no clear signs of overbought or oversold conditions. Remember, this is a technical analysis based only on the visual chart data and does not constitute investment advice. #SolanaStrong $SOL
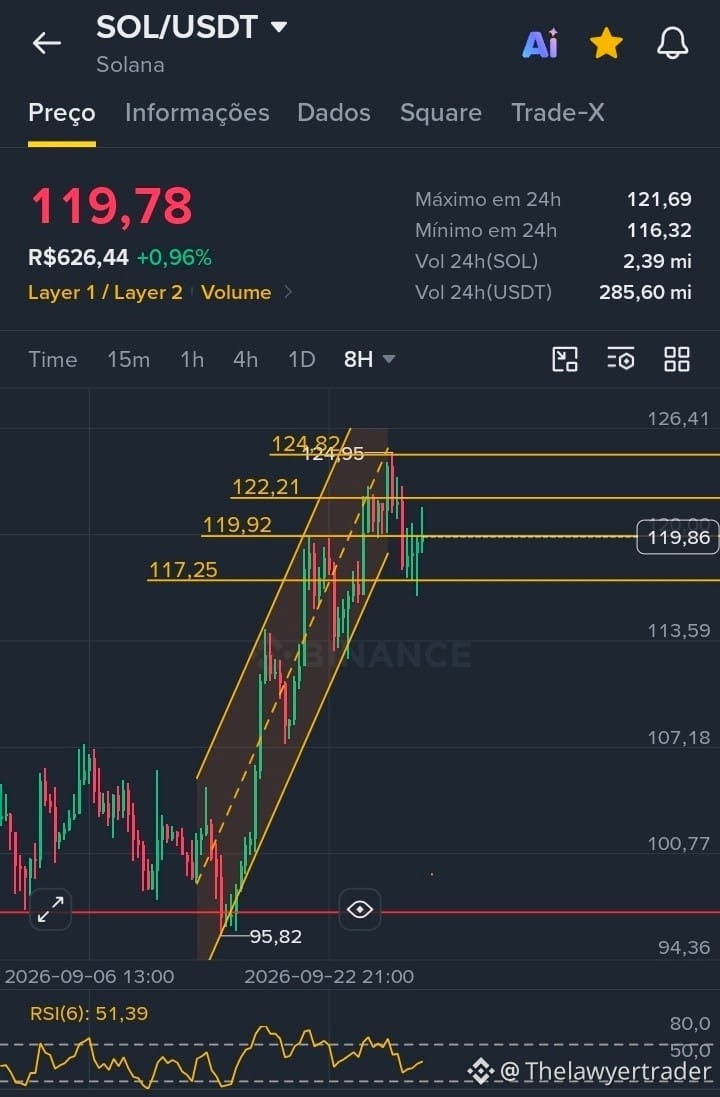
Asset Analysis SOL/USDT — 8h Chart

The chart shows Solana (SOL) against USDT on the 8-hour timeframe, and the current technical scenario is a transition moment.

There is an ascending channel (bounded by the yellow diagonal lines) that has recently broken downwards. This breakdown is a sign of weakening buying pressure in the short term, with a moderate probability of a pullback or a longer sideways movement if the price does not recover quickly.

The current price is 119.78, in a consolidation zone between support at 117.25 and resistance at 119.92. The asset is testing the base of the previous trend channel, making these levels decisive.

The outlook is neutral with a bearish bias in the short term, given the channel breakdown.
If the price holds 117.25, there is a possibility of a renewed attempt to resume the uptrend.
If it breaks below 117.25, the trend points toward a pullback or a longer sideways phase.

The RSI(6) is at 51.39, in a neutral zone, with no clear signs of overbought or oversold conditions.

Remember, this is a technical analysis based only on the visual chart data and does not constitute investment advice.

#SolanaStrong $SOL

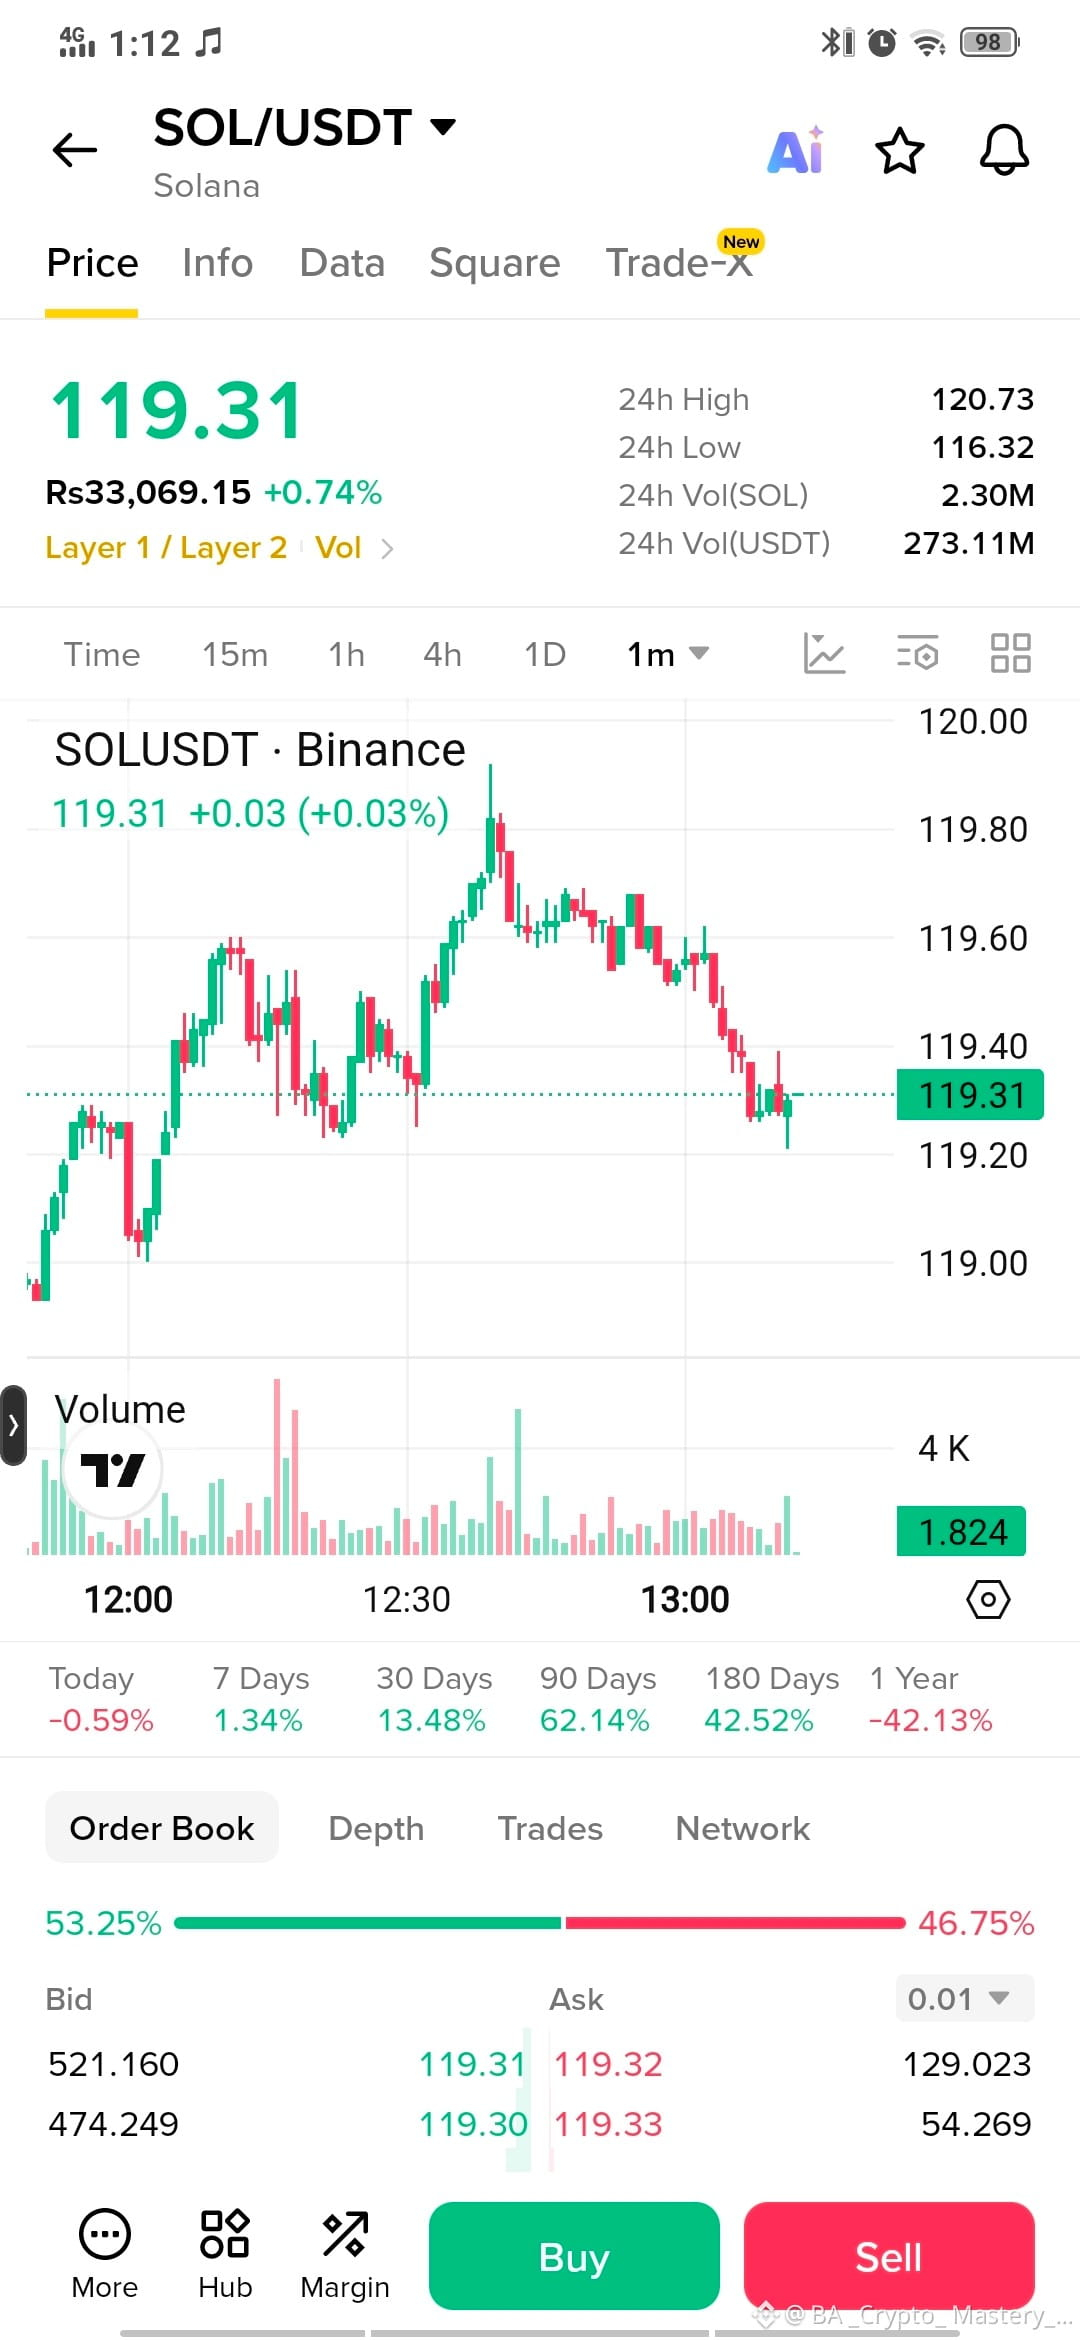
🚀 Technical Update & SOL/USDT Price Analysis • Current Price: $119,85 (+1,01%) • Main Resistance Level: $124,95 (highest zone recently) • Key Support: $116,32 (24-hour low & direct defense) • Secondary Support: $105,25 (main structural level) • 24-hour price range: $116,32 – $120,73 • Market Structure: Price drop after testing the $124,95 peak. • Key Level: Holding above $116,30 is very important for buyers. • Strategy: A bounce near the support level paves the way back to $124,95. • Disclaimer: Do your own research (DYOR) & manage your trading risk carefully! $SOL #solana #SolanaStrong
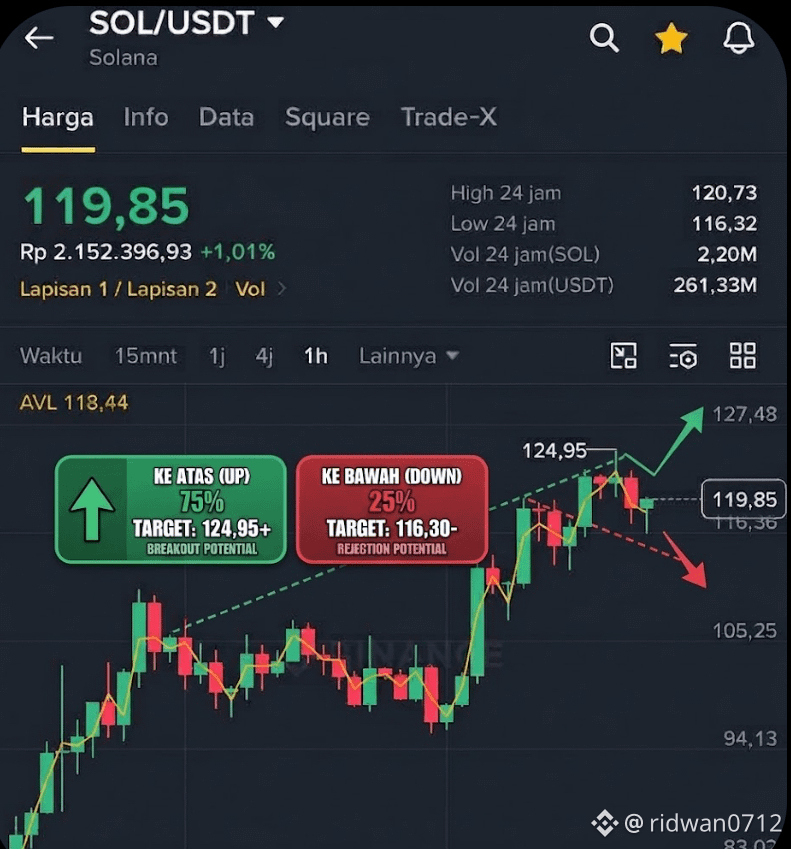
🚀 Technical Update & SOL/USDT Price Analysis
• Current Price: $119,85 (+1,01%)
• Main Resistance Level: $124,95 (highest zone recently)
• Key Support: $116,32 (24-hour low & direct defense)
• Secondary Support: $105,25 (main structural level)
• 24-hour price range: $116,32 – $120,73
• Market Structure: Price drop after testing the $124,95 peak.
• Key Level: Holding above $116,30 is very important for buyers.
• Strategy: A bounce near the support level paves the way back to $124,95.
• Disclaimer: Do your own research (DYOR) & manage your trading risk carefully! $SOL #solana #SolanaStrong

$SOL $​🚀 Solana ($SOL) Trading & Market Update: Key Tips for Today! ⚡ ​Solana continues to prove why it remains one of the fastest and most active Layer-1 networks in the crypto space. Whether you are day trading or holding long-term, keep these essential strategies in mind today: #solana #SolanaStrong Keep a close eye on major support and resistance levels on the 4H/Daily charts before opening a position. ​Confirm high trading volume before taking breakout trades to avoid false moves. ​DCA Over All-In (Risk Management) 🛡️ ​Instead of buying all at once, use Dollar-Cost Averaging (DCA) or Binance Auto-Invest to smooth out entry points across volatility. ​Always set a strict Stop-Loss (SL) to manage downside exposure.

$SOL $​🚀 Solana ($SOL ) Trading & Market Update: Key Tips for Today! ⚡
​Solana continues to prove why it remains one of the fastest and most active Layer-1 networks in the crypto space. Whether you are day trading or holding long-term, keep these essential strategies in mind today:
#solana #SolanaStrong
Keep a close eye on major support and resistance levels on the 4H/Daily charts before opening a position.
​Confirm high trading volume before taking breakout trades to avoid false moves.
​DCA Over All-In (Risk Management) 🛡️
​Instead of buying all at once, use Dollar-Cost Averaging (DCA) or Binance Auto-Invest to smooth out entry points across volatility.
​Always set a strict Stop-Loss (SL) to manage downside exposure.
What price will Solana hit in September?

What price will Solana hit in September?

↑ 12099%↑ 11099%↑ 1303%
Volume $1,844.3
206 Atlas:
DCA is sound, but waiting for volume confirmation on breakouts often means entering after the move has already happened.
THE SNIPER’S CROSSHAIR: Indicator convergence on Solana and the shadow of BTC 📉 Tactical X-Ray (1H Chart): The EMA Clamp: The price is boxed in. Below, the 200 EMA at $117.11 is acting like a concrete floor. Above, we have immediate bearish pressure from the 20 EMA ($119.81) and the 50 EMA ($120.46). Price will need to break one of the two levels with volume. Oscillators Under Tension: The KDJ oscillator shows an ongoing recovery, with the 'J' line at 58.41 (neutral territory). The MACD is at -0.04, on the verge of a bullish cross if capital flow enters. Institutional Wall: The order book confirms our floor. There’s a massive wall of 3.66 million SOL placed at $118.03. The whales don’t want to let the price fall from here. The Bitcoin Factor (BTC): No altcoin setup survives a king’s whip. Bitcoin is the “wind” behind our shot. If BTC holds its consolidation or rises, the $118 wall on Solana will push the price up. But if BTC triggers a cascade of liquidations, it will drag SOL down, breaking the 200 EMA and punching through the institutional wall. That’s why risk control is non-negotiable. 🎯 Sniper Zones on SOL/USDT: Entry Zone (Liquidity Hunt): $117.20 – $118.05. (We’re supported millimeter-perfectly above the 200 EMA and the large wall of 3.66M coins). Take Profit 1 (Tactical): $120.40 (Testing the resistance at the 50 EMA on the 1H timeframe). Take Profit 2 (Macro): $124.95 (Targeting the liquidity of the previous intraday high). Stop Loss (The Armor): $115.80. (A candle close below the 200 EMA invalidates the structure. If BTC drags the market, we exit with a tightly controlled minimal loss). The trap is set on mathematical foundations. Will Bitcoin’s volume show up, or will we see a deep liquidity sweep? I’m listening. RelatoCripto PRO {spot}(BTCUSDT) {spot}(SOLUSDT) #SolanaStrong

THE SNIPER’S CROSSHAIR: Indicator convergence on Solana and the shadow of BTC 📉

Tactical X-Ray (1H Chart):
The EMA Clamp: The price is boxed in. Below, the 200 EMA at $117.11 is acting like a concrete floor. Above, we have immediate bearish pressure from the 20 EMA ($119.81) and the 50 EMA ($120.46). Price will need to break one of the two levels with volume.
Oscillators Under Tension: The KDJ oscillator shows an ongoing recovery, with the 'J' line at 58.41 (neutral territory). The MACD is at -0.04, on the verge of a bullish cross if capital flow enters.
Institutional Wall: The order book confirms our floor. There’s a massive wall of 3.66 million SOL placed at $118.03. The whales don’t want to let the price fall from here.
The Bitcoin Factor (BTC):
No altcoin setup survives a king’s whip. Bitcoin is the “wind” behind our shot. If BTC holds its consolidation or rises, the $118 wall on Solana will push the price up. But if BTC triggers a cascade of liquidations, it will drag SOL down, breaking the 200 EMA and punching through the institutional wall. That’s why risk control is non-negotiable.
🎯 Sniper Zones on SOL/USDT:
Entry Zone (Liquidity Hunt): $117.20 – $118.05. (We’re supported millimeter-perfectly above the 200 EMA and the large wall of 3.66M coins).
Take Profit 1 (Tactical): $120.40 (Testing the resistance at the 50 EMA on the 1H timeframe).
Take Profit 2 (Macro): $124.95 (Targeting the liquidity of the previous intraday high).
Stop Loss (The Armor): $115.80. (A candle close below the 200 EMA invalidates the structure. If BTC drags the market, we exit with a tightly controlled minimal loss).
The trap is set on mathematical foundations. Will Bitcoin’s volume show up, or will we see a deep liquidity sweep? I’m listening.
RelatoCripto PRO
#SolanaStrong

What is Solana? A fast network with low fees... but what makes Solana different from Bitcoin and Ethereum? - High speed Processes a large number of transactions - Low fees Transaction costs are usually low - Decentralized system Operates through a network of participants around the world - The network’s SOL token Used to pay fees and interact with the network #SolanaStrong #solana #Bitcoin #cryptovision #trading

What is Solana?

A fast network with low fees... but what makes Solana different from Bitcoin and Ethereum?

- High speed
Processes a large number of transactions
- Low fees
Transaction costs are usually low
- Decentralized system
Operates through a network of participants around the world
- The network’s SOL token
Used to pay fees and interact with the network
#SolanaStrong #solana #Bitcoin #cryptovision #trading

SOL/USDT Market Update Current Price: $120.52 24h Change: +1.38% 24h Range: $118.27 – $122.94 24-hour trading volume: 3.66 million SOL (≈ $442 million USDT). Price has recovered from earlier lows and is consolidating near the 60-period moving average ($120.23). Buying interest remains visible at current levels. #USDT #BinanceSquareTalks #SolanaStrong
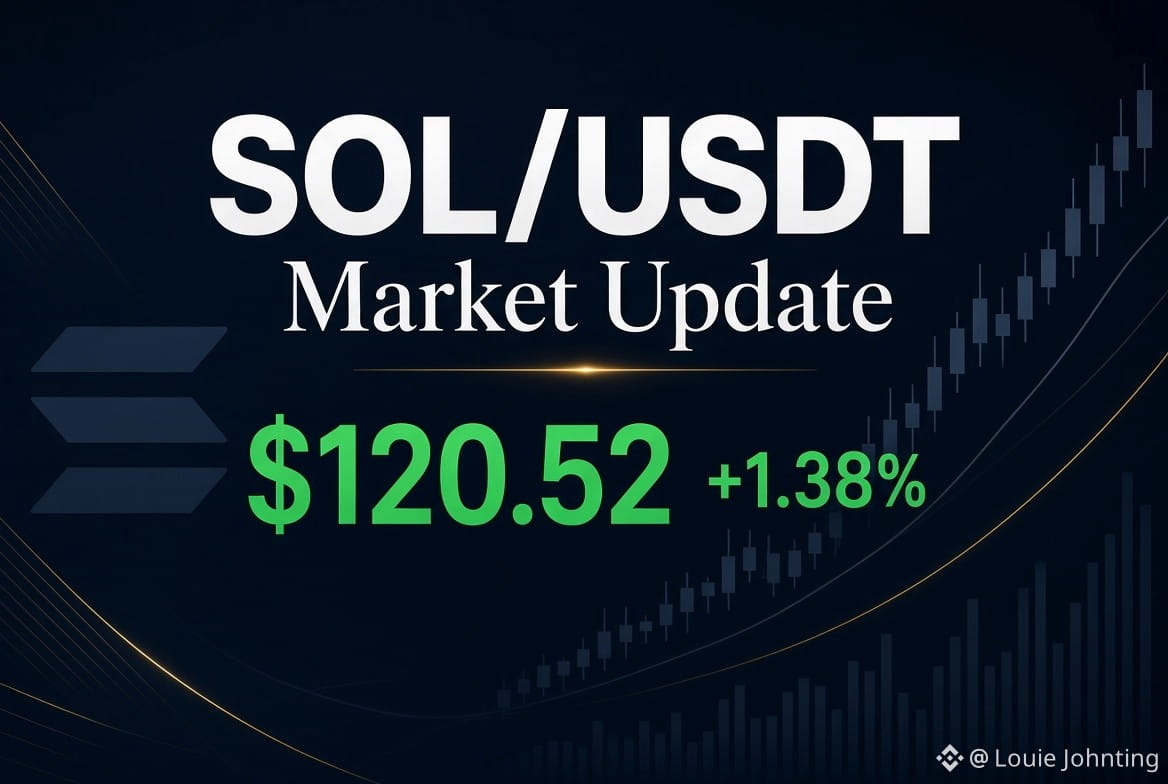
SOL/USDT Market Update

Current Price: $120.52
24h Change: +1.38%
24h Range: $118.27 – $122.94
24-hour trading volume: 3.66 million SOL (≈ $442 million USDT).
Price has recovered from earlier lows and is consolidating near the 60-period moving average ($120.23). Buying interest remains visible at current levels.
#USDT #BinanceSquareTalks #SolanaStrong
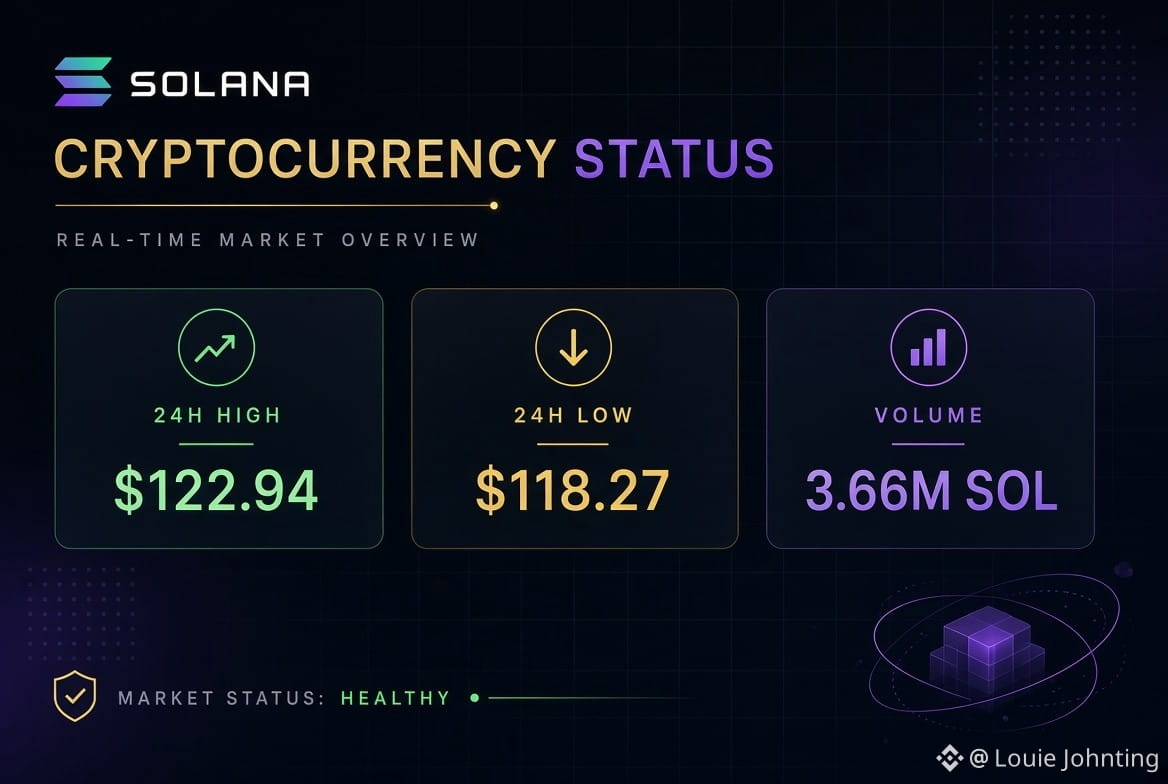
$SOL short analysis (26 Sep 2026): SOL is around $122, up roughly 4% in 24h. Key resistance is $120–$122; support is around $110–$115. A strong breakout above resistance could open the way toward $130+, while rejection could bring a pullback. #solana #sol板块 #SolanaStrong {spot}(SOLUSDT)
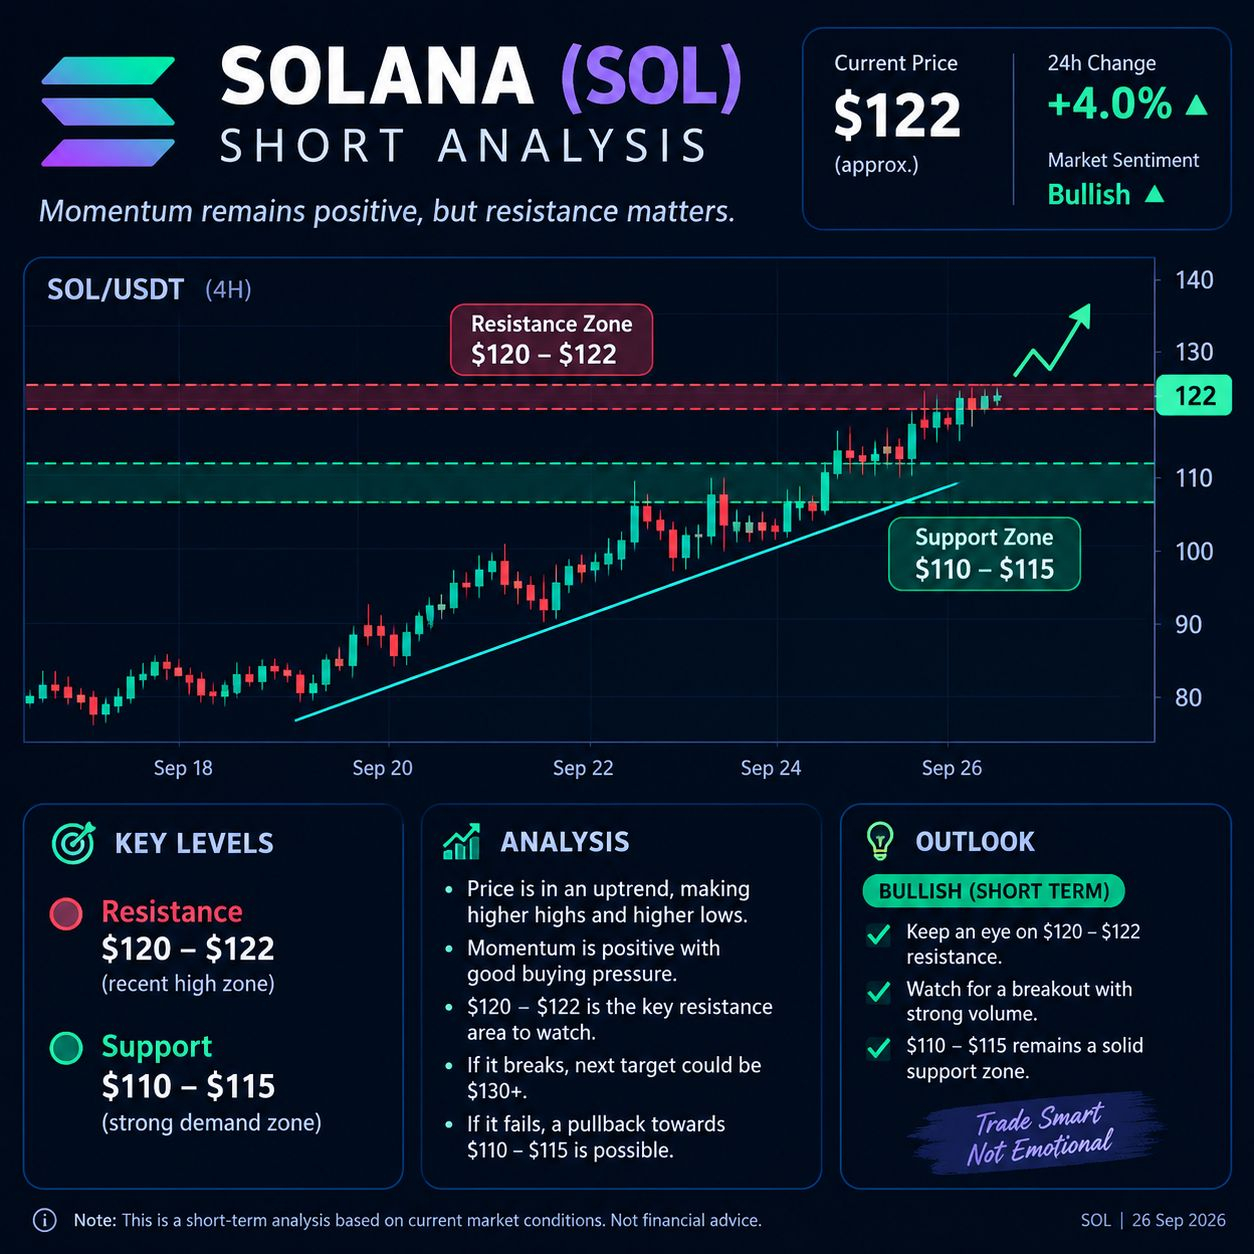
$SOL short analysis (26 Sep 2026): SOL is around $122, up roughly 4% in 24h. Key resistance is $120–$122; support is around $110–$115. A strong breakout above resistance could open the way toward $130+, while rejection could bring a pullback.
#solana #sol板块 #SolanaStrong
Log in to explore more content
Join global crypto users on Binance Square
⚡️ Get latest and useful information about crypto.
💬 Trusted by the world’s largest crypto exchange.
👍 Discover real insights from verified creators.
Email / Phone number