
#nbis
nbis
98,300 views
1,895 Discussing
Hot
Latest

·
--
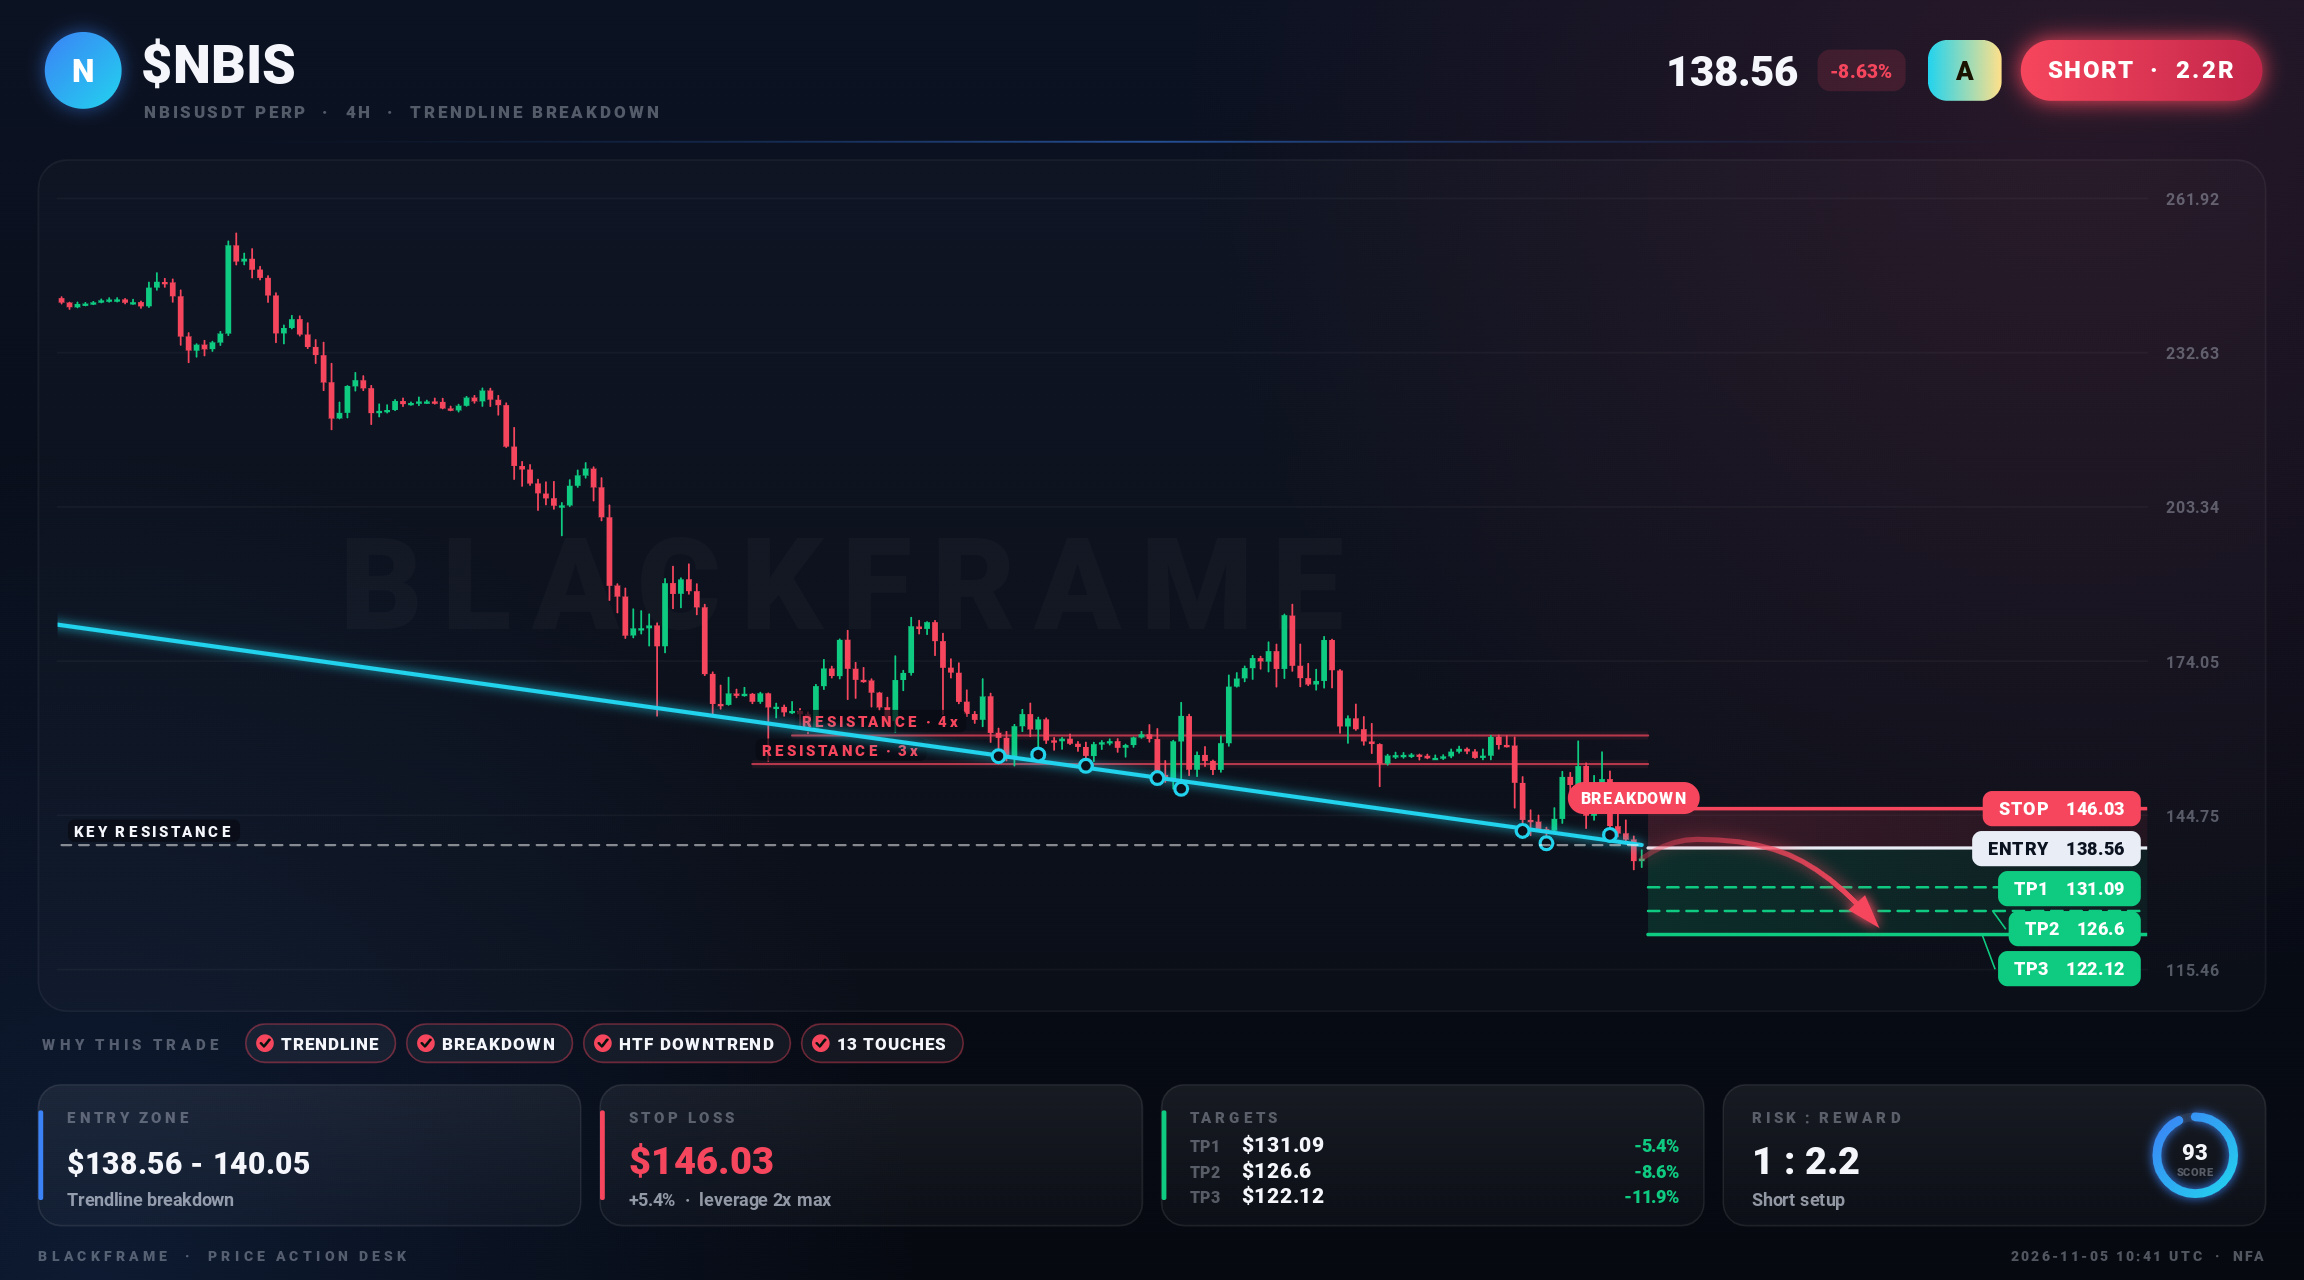
🩸 $NBIS just lost the floor
SHORT · 4H
Entry: $138.56 - $140.43
TP1: $131.09
TP2: $126.6
TP3: $122.12
SL: $146.03
Price broke below a trendline near $139.11 and is holding it. The higher timeframe trend agrees.
#NBIS #TechnicalAnalysis #Trading · NFA
🩸 $NBIS just lost the floor
SHORT · 4H
Entry: $138.56 - $140.43
TP1: $131.09
TP2: $126.6
TP3: $122.12
SL: $146.03
Price broke below a trendline near $139.11 and is holding it. The higher timeframe trend agrees.
#NBIS #TechnicalAnalysis #Trading · NFA
SHORT · 4H
Entry: $138.56 - $140.43
TP1: $131.09
TP2: $126.6
TP3: $122.12
SL: $146.03
Price broke below a trendline near $139.11 and is holding it. The higher timeframe trend agrees.
#NBIS #TechnicalAnalysis #Trading · NFA
2

·
--
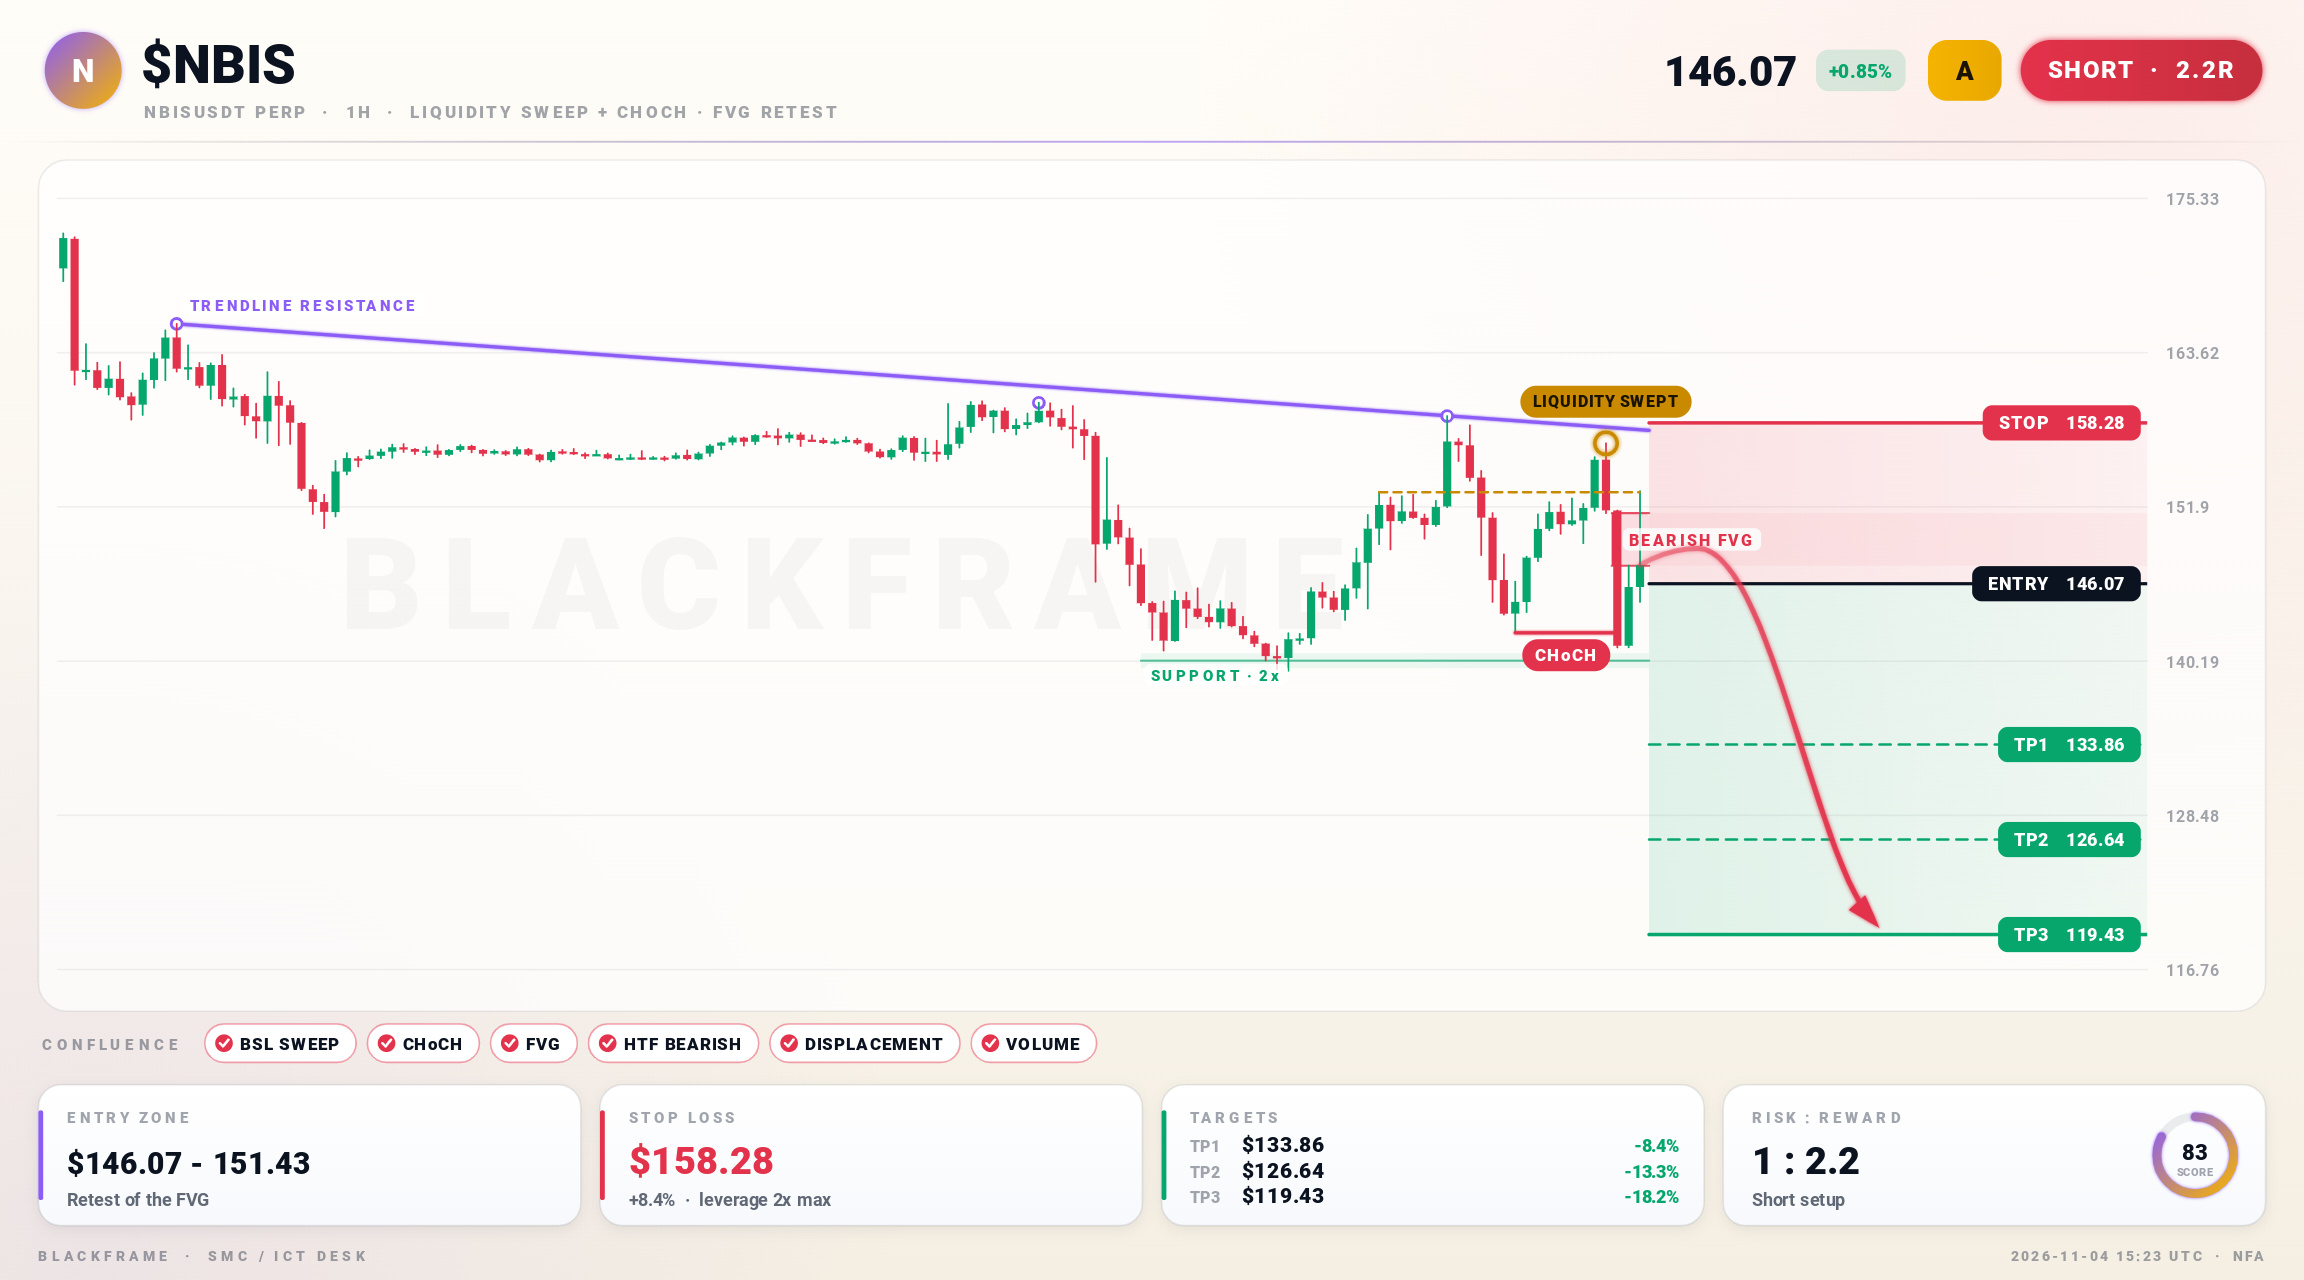
🔻 $NBIS under pressure as NY killzone sweeps liquidity
SHORT · 1H
Entry: $146.07 - $147.44
TP1: $133.86
TP2: $126.64
TP3: $119.43
SL: $158.28
Buy‑side liquidity was swept and CHoCH confirmed on the 1H. Price hit the bearish FVG and a strong displacement out of the $147.44-151.43 zone aligns with the HTF bearish bias. Target is $119.43 with stop at $158.28.
#NBIS #SmartMoney · NFA
🔻 $NBIS under pressure as NY killzone sweeps liquidity
SHORT · 1H
Entry: $146.07 - $147.44
TP1: $133.86
TP2: $126.64
TP3: $119.43
SL: $158.28
Buy‑side liquidity was swept and CHoCH confirmed on the 1H. Price hit the bearish FVG and a strong displacement out of the $147.44-151.43 zone aligns with the HTF bearish bias. Target is $119.43 with stop at $158.28.
#NBIS #SmartMoney · NFA
SHORT · 1H
Entry: $146.07 - $147.44
TP1: $133.86
TP2: $126.64
TP3: $119.43
SL: $158.28
Buy‑side liquidity was swept and CHoCH confirmed on the 1H. Price hit the bearish FVG and a strong displacement out of the $147.44-151.43 zone aligns with the HTF bearish bias. Target is $119.43 with stop at $158.28.
#NBIS #SmartMoney · NFA
1k

·
--
Satellite scan finished 🛰️ 2 signals beamed down
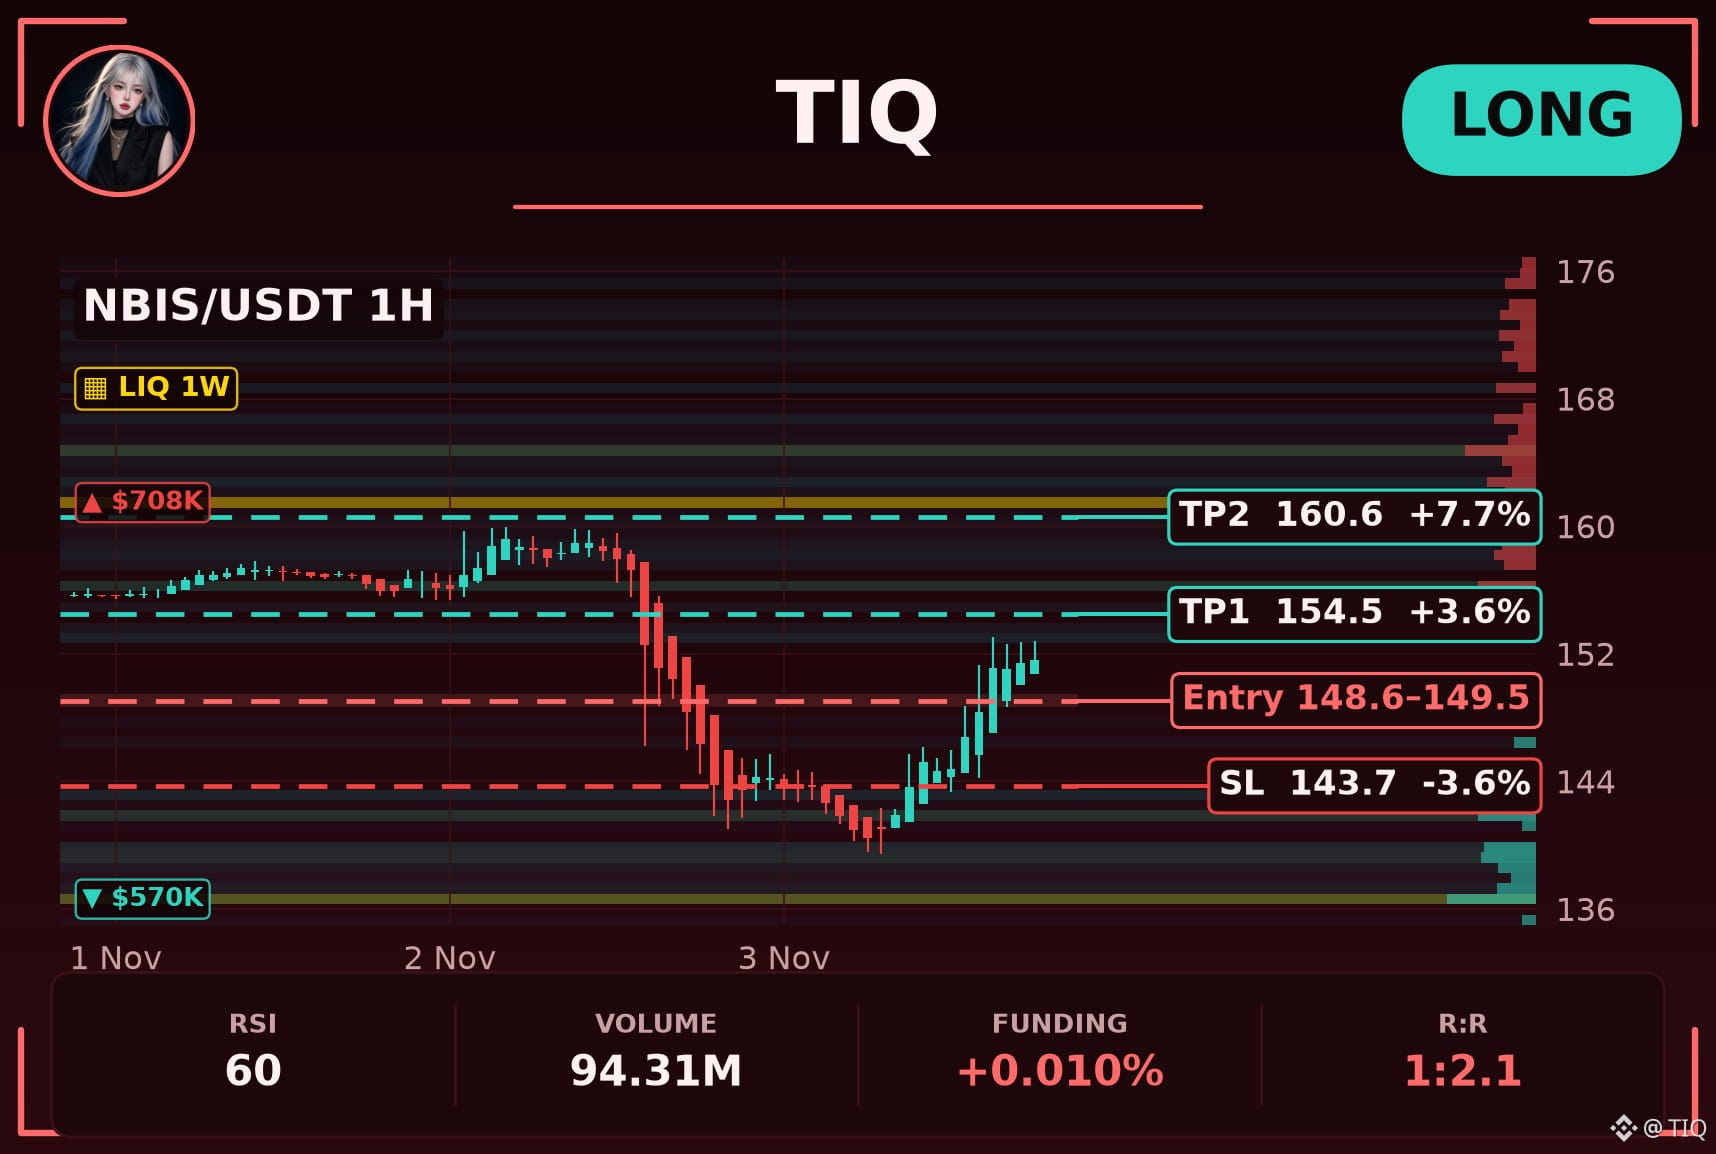
Chapter 1: $NBIS Long (1H) 📗
Entry 148.6 - 149.5, TP 154.5, SL 143.7
Plot so far: RSI 60 still has room to move. MACD is above its signal line, momentum leaning up.
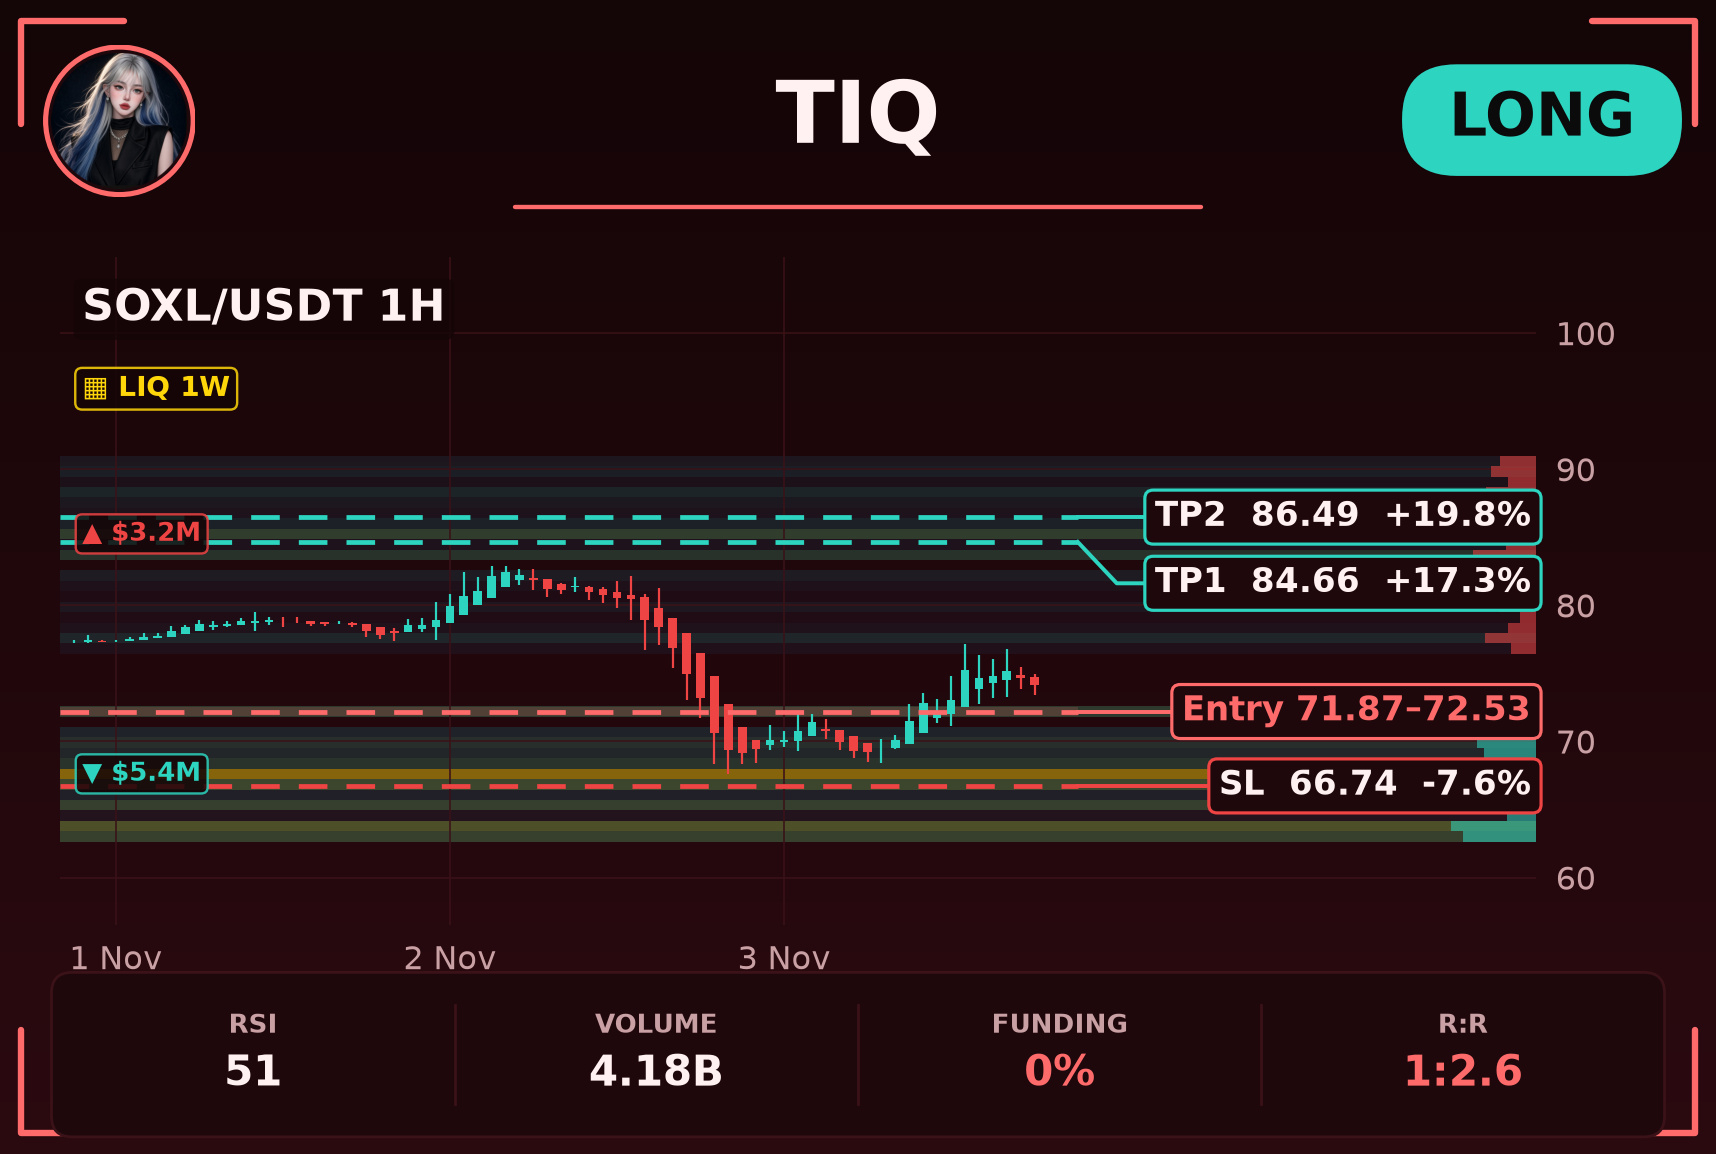
📈 $SOXL 1H Long
MACD is above its signal line, momentum leaning up. RSI 51 still has room to move.
Entry 71.87 - 72.53
Targets 84.66 and 86.49
Stop 66.74
Turn the volume down on FOMO 🔉
#NBIS #SOXL
⚠️ This signal is based on technical indicators and is not investment advice. Always set a stop-loss and manage your own risk.
Satellite scan finished 🛰️ 2 signals beamed down
Chapter 1: $NBIS Long (1H) 📗
Entry 148.6 - 149.5, TP 154.5, SL 143.7
Plot so far: RSI 60 still has room to move. MACD is above its signal line, momentum leaning up.
📈 $SOXL 1H Long
MACD is above its signal line, momentum leaning up. RSI 51 still has room to move.
Entry 71.87 - 72.53
Targets 84.66 and 86.49
Stop 66.74
Turn the volume down on FOMO 🔉
#NBIS #SOXL
⚠️ This signal is based on technical indicators and is not investment advice. Always set a stop-loss and manage your own risk.
Chapter 1: $NBIS Long (1H) 📗
Entry 148.6 - 149.5, TP 154.5, SL 143.7
Plot so far: RSI 60 still has room to move. MACD is above its signal line, momentum leaning up.
📈 $SOXL 1H Long
MACD is above its signal line, momentum leaning up. RSI 51 still has room to move.
Entry 71.87 - 72.53
Targets 84.66 and 86.49
Stop 66.74
Turn the volume down on FOMO 🔉
#NBIS #SOXL
⚠️ This signal is based on technical indicators and is not investment advice. Always set a stop-loss and manage your own risk.
266

·
--
🚨 🦈 $NBIS COULD PLUNGE TWICE AS FAST AS $NVDA – BEWARE THE LIQUIDITY SWEEP!
📊 Smart money is already stripping premium from high‑quality tech, and the order‑block hierarchy shows $NBIS sitting in a weak liquidity basin. 🔍 Volume spikes on the 4H chart reveal aggressive sell pressure, while the recent price action failed to respect the higher‑timeframe demand zone, indicating a looming liquidity hunt.
⚡ The confluence of a broken bullish order block and a widening spread on a top‑tier exchange suggests the next leg could be a rapid descent, outpacing the broader tech sell‑off. 💬 Are you positioning short or waiting for the next institutional sweep? 👇
⚠️ Not financial advice. Always manage your risk. 🛡️
🏷️ #NBIS #ShortSetup #TechSelloff #LiquidityHunt #Crypto
🔥 🦈
🚨 🦈 $NBIS COULD PLUNGE TWICE AS FAST AS $NVDA – BEWARE THE LIQUIDITY SWEEP!
📊 Smart money is already stripping premium from high‑quality tech, and the order‑block hierarchy shows $NBIS sitting in a weak liquidity basin. 🔍 Volume spikes on the 4H chart reveal aggressive sell pressure, while the recent price action failed to respect the higher‑timeframe demand zone, indicating a looming liquidity hunt.
⚡ The confluence of a broken bullish order block and a widening spread on a top‑tier exchange suggests the next leg could be a rapid descent, outpacing the broader tech sell‑off. 💬 Are you positioning short or waiting for the next institutional sweep? 👇
⚠️ Not financial advice. Always manage your risk. 🛡️
🏷️ #NBIS #ShortSetup #TechSelloff #LiquidityHunt #Crypto
🔥 🦈
📊 Smart money is already stripping premium from high‑quality tech, and the order‑block hierarchy shows $NBIS sitting in a weak liquidity basin. 🔍 Volume spikes on the 4H chart reveal aggressive sell pressure, while the recent price action failed to respect the higher‑timeframe demand zone, indicating a looming liquidity hunt.
⚡ The confluence of a broken bullish order block and a widening spread on a top‑tier exchange suggests the next leg could be a rapid descent, outpacing the broader tech sell‑off. 💬 Are you positioning short or waiting for the next institutional sweep? 👇
⚠️ Not financial advice. Always manage your risk. 🛡️
🏷️ #NBIS #ShortSetup #TechSelloff #LiquidityHunt #Crypto
🔥 🦈


2

·
--
🦈 $NBIS & $CRWV SKYROCKET POTENTIAL AS AI DEMAND SURGES 🚀
Target: 355 🚀
Target: 165 🚀
📊 The recent collapse in valuation has cleared a massive liquidity bucket, exposing a pristine order block that smart money is eye‑ing. 🔍 AI compute demand continues to outpace supply, turning neoclouds into a near‑irresistible institutional magnet. 🌊 With rates spiking, the sell‑off is a classic liquidity hunt, leaving a clean entry corridor for long positions.
💡 Risk‑to‑reward ratios sit comfortably above 1:3, making the upside compelling while the downside is capped by the current panic floor. 💬 Are you positioning for the next AI‑driven rally or waiting for the panic to burn out? 👇
⚠️ Not financial advice. Always manage your risk. 🛡️
🏷️ #NBIS #CRWV #LongSetup #AIStocks #BuyOpportunity
🔥 💎
🦈 $NBIS & $CRWV SKYROCKET POTENTIAL AS AI DEMAND SURGES 🚀
Target: 355 🚀
Target: 165 🚀
📊 The recent collapse in valuation has cleared a massive liquidity bucket, exposing a pristine order block that smart money is eye‑ing. 🔍 AI compute demand continues to outpace supply, turning neoclouds into a near‑irresistible institutional magnet. 🌊 With rates spiking, the sell‑off is a classic liquidity hunt, leaving a clean entry corridor for long positions.
💡 Risk‑to‑reward ratios sit comfortably above 1:3, making the upside compelling while the downside is capped by the current panic floor. 💬 Are you positioning for the next AI‑driven rally or waiting for the panic to burn out? 👇
⚠️ Not financial advice. Always manage your risk. 🛡️
🏷️ #NBIS #CRWV #LongSetup #AIStocks #BuyOpportunity
🔥 💎
Target: 355 🚀
Target: 165 🚀
📊 The recent collapse in valuation has cleared a massive liquidity bucket, exposing a pristine order block that smart money is eye‑ing. 🔍 AI compute demand continues to outpace supply, turning neoclouds into a near‑irresistible institutional magnet. 🌊 With rates spiking, the sell‑off is a classic liquidity hunt, leaving a clean entry corridor for long positions.
💡 Risk‑to‑reward ratios sit comfortably above 1:3, making the upside compelling while the downside is capped by the current panic floor. 💬 Are you positioning for the next AI‑driven rally or waiting for the panic to burn out? 👇
⚠️ Not financial advice. Always manage your risk. 🛡️
🏷️ #NBIS #CRWV #LongSetup #AIStocks #BuyOpportunity
🔥 💎

1

·
--
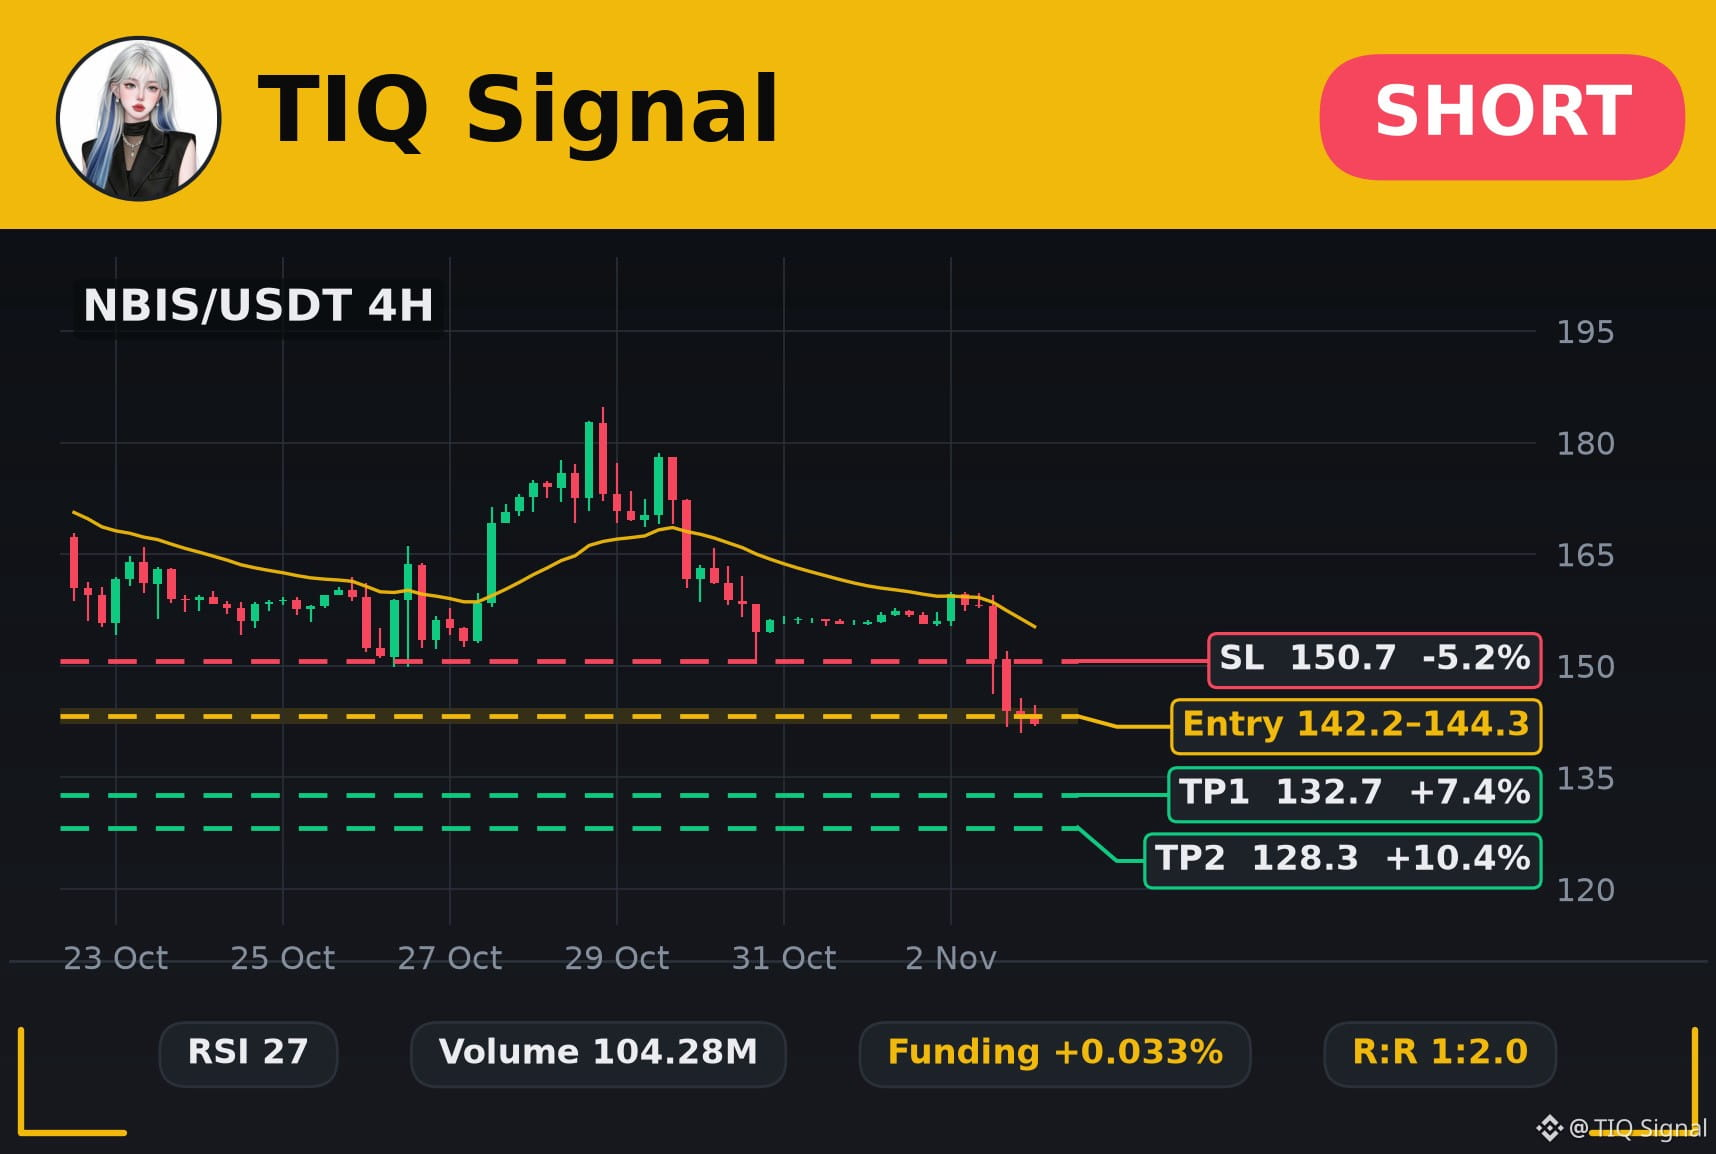
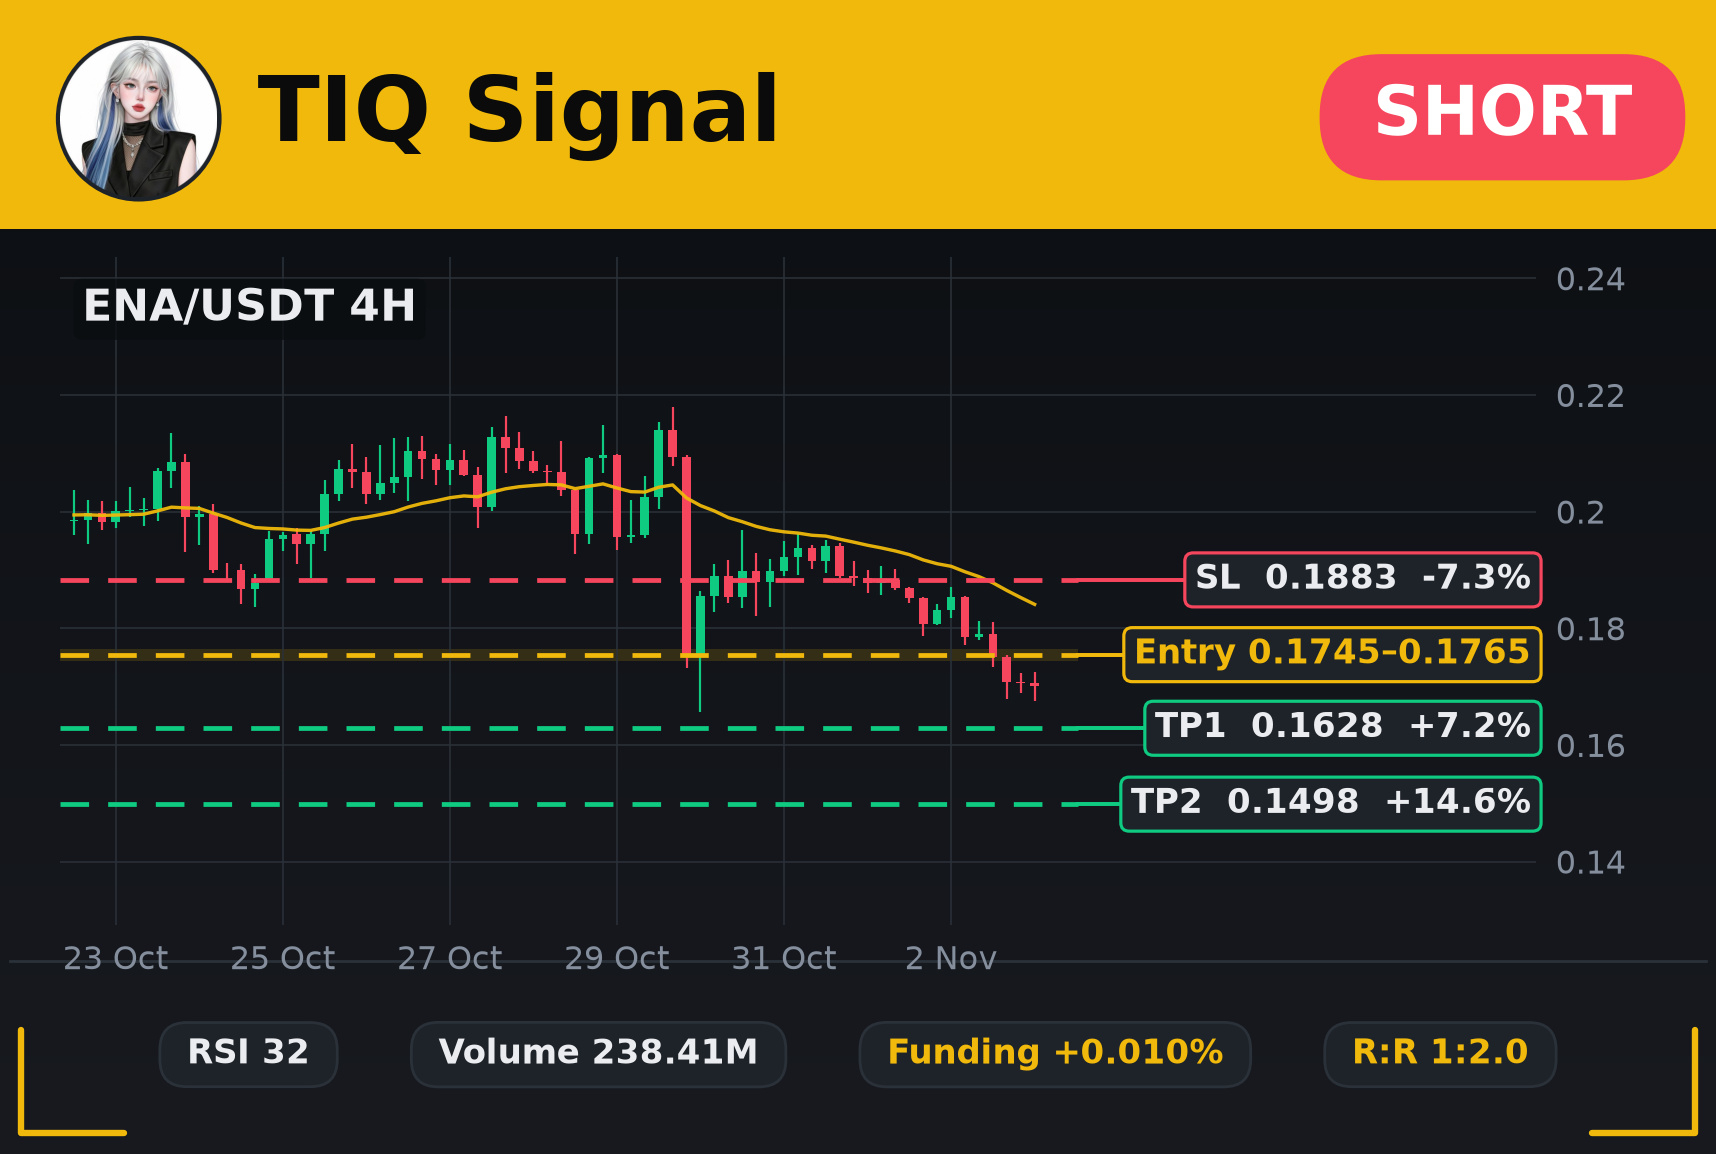
Quick multi coin check in 👀 2 setups worth a look
🍋 $NBIS 4H Short, fresh squeezed
Entry 144.3 - 142.2
TP 132.7
SL 150.7
Ingredients: RSI 27 sits in oversold land. Funding +0.033%, 73% of accounts long (L/S 2.74), OI -19.5% (1d).
🔒 $ENA 4H Short
Unlock at 0.1765 - 0.1745, treasure at 0.1628 and 0.1498, trap below 0.1883
Map says: MACD is below its signal line, momentum leaning down. Price is on the right side of EMA200, trend agrees.
Fast post, slow decisions 🐢
#NBIS #ENA
⚠️ This signal is based on technical indicators and is not investment advice. Always set a stop-loss and manage your own risk.
Quick multi coin check in 👀 2 setups worth a look
🍋 $NBIS 4H Short, fresh squeezed
Entry 144.3 - 142.2
TP 132.7
SL 150.7
Ingredients: RSI 27 sits in oversold land. Funding +0.033%, 73% of accounts long (L/S 2.74), OI -19.5% (1d).
🔒 $ENA 4H Short
Unlock at 0.1765 - 0.1745, treasure at 0.1628 and 0.1498, trap below 0.1883
Map says: MACD is below its signal line, momentum leaning down. Price is on the right side of EMA200, trend agrees.
Fast post, slow decisions 🐢
#NBIS #ENA
⚠️ This signal is based on technical indicators and is not investment advice. Always set a stop-loss and manage your own risk.
🍋 $NBIS 4H Short, fresh squeezed
Entry 144.3 - 142.2
TP 132.7
SL 150.7
Ingredients: RSI 27 sits in oversold land. Funding +0.033%, 73% of accounts long (L/S 2.74), OI -19.5% (1d).
🔒 $ENA 4H Short
Unlock at 0.1765 - 0.1745, treasure at 0.1628 and 0.1498, trap below 0.1883
Map says: MACD is below its signal line, momentum leaning down. Price is on the right side of EMA200, trend agrees.
Fast post, slow decisions 🐢
#NBIS #ENA
⚠️ This signal is based on technical indicators and is not investment advice. Always set a stop-loss and manage your own risk.
34

·
--
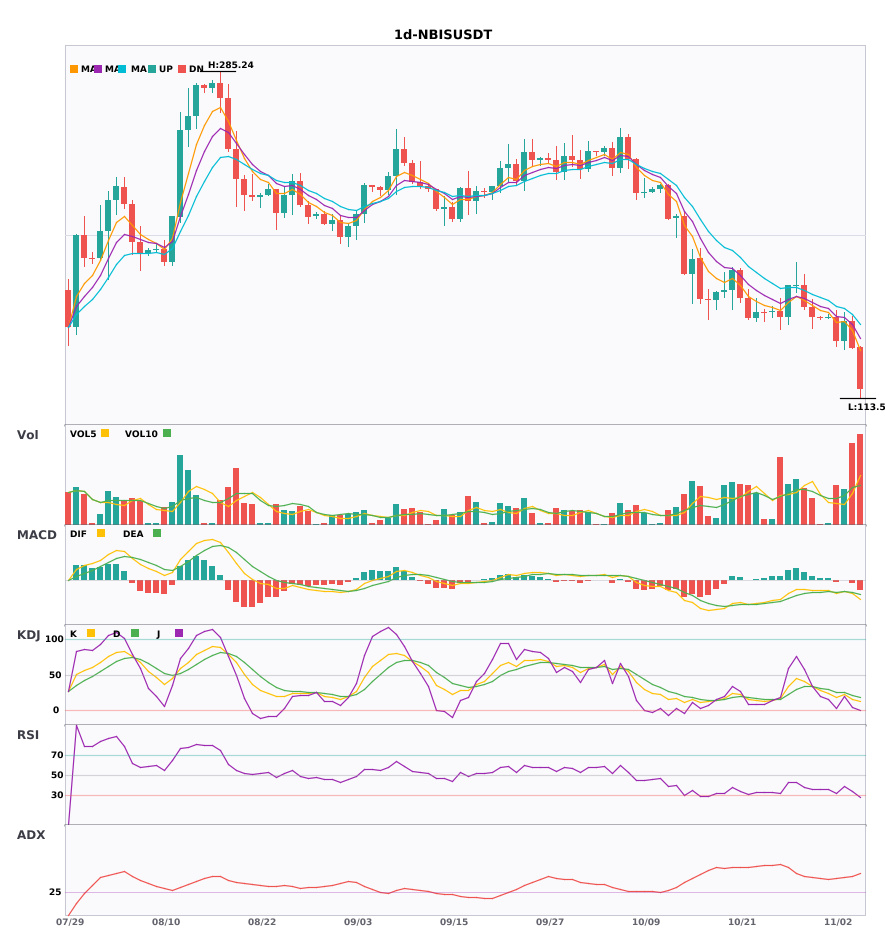
$NBIS daily-chart multi-timeframe confluence, weekly bearish trend confirmed 🔥
════════════════════
🟢 $NBIS daily-chart bearish signal
⚠️Technical analysis: Weekly bearish confluence confirmed | Daily entry: MACD death cross below zero, bearish momentum accelerating | EMA5 < EMA8 < EMA13, bearish alignment | KDJ trending weakly, bears in control (K: 15.9, D: 21.9) | Trading volume increased (2.2x)
════════════════════
🔔 Follow for first-hand market updates 🔔
#多周期共振 #NBIS
📌 When trading, check whether the candlestick pattern matches
$NBIS daily-chart multi-timeframe confluence, weekly bearish trend confirmed 🔥
════════════════════
🟢 $NBIS daily-chart bearish signal
⚠️Technical analysis: Weekly bearish confluence confirmed | Daily entry: MACD death cross below zero, bearish momentum accelerating | EMA5 < EMA8 < EMA13, bearish alignment | KDJ trending weakly, bears in control (K: 15.9, D: 21.9) | Trading volume increased (2.2x)
════════════════════
🔔 Follow for first-hand market updates 🔔
#多周期共振 #NBIS
📌 When trading, check whether the candlestick pattern matches
════════════════════
🟢 $NBIS daily-chart bearish signal
⚠️Technical analysis: Weekly bearish confluence confirmed | Daily entry: MACD death cross below zero, bearish momentum accelerating | EMA5 < EMA8 < EMA13, bearish alignment | KDJ trending weakly, bears in control (K: 15.9, D: 21.9) | Trading volume increased (2.2x)
════════════════════
🔔 Follow for first-hand market updates 🔔
#多周期共振 #NBIS
📌 When trading, check whether the candlestick pattern matches
2

·
--
NBIS has two answers; first, let selling pressure set the order.
Binance TradFi perpetuals (traditional finance assets, with elevated gap risk outside trading hours) | NBIS is down 17.01% over the past 24 hours, and weakness persists. For a recovery, first watch whether selling pressure eases. Current price is around 119.41, with 24-hour trading volume around 205 million; the 30-minute volume ratio is 19.1x, indicating rising participation. Positioning: 67% of accounts are long; the taker buy/sell ratio is 1.05 (aggressive trading is close to balanced); 30-minute open interest is up 2.6%; funding rate is +0.0094%.
Reference indicators: The 30-minute MACD histogram is -1.8752, indicating short-term bearish momentum is dominant; the 30-minute ATR trend-band reference level is 129.040381. The price is below this level, suggesting the trend support level is coming under pressure.
For now, watch only two confirmation points. First, can the taker buy/sell ratio of 1.05 move out of the balanced zone around 1? Second, will the MACD histogram at -1.8752 continue to widen, or start to contract?
#NBIS #Abnormal Move Alert
NBIS has two answers; first, let selling pressure set the order.
Binance TradFi perpetuals (traditional finance assets, with elevated gap risk outside trading hours) | NBIS is down 17.01% over the past 24 hours, and weakness persists. For a recovery, first watch whether selling pressure eases. Current price is around 119.41, with 24-hour trading volume around 205 million; the 30-minute volume ratio is 19.1x, indicating rising participation. Positioning: 67% of accounts are long; the taker buy/sell ratio is 1.05 (aggressive trading is close to balanced); 30-minute open interest is up 2.6%; funding rate is +0.0094%.
Reference indicators: The 30-minute MACD histogram is -1.8752, indicating short-term bearish momentum is dominant; the 30-minute ATR trend-band reference level is 129.040381. The price is below this level, suggesting the trend support level is coming under pressure.
For now, watch only two confirmation points. First, can the taker buy/sell ratio of 1.05 move out of the balanced zone around 1? Second, will the MACD histogram at -1.8752 continue to widen, or start to contract?
#NBIS #Abnormal Move Alert
Binance TradFi perpetuals (traditional finance assets, with elevated gap risk outside trading hours) | NBIS is down 17.01% over the past 24 hours, and weakness persists. For a recovery, first watch whether selling pressure eases. Current price is around 119.41, with 24-hour trading volume around 205 million; the 30-minute volume ratio is 19.1x, indicating rising participation. Positioning: 67% of accounts are long; the taker buy/sell ratio is 1.05 (aggressive trading is close to balanced); 30-minute open interest is up 2.6%; funding rate is +0.0094%.
Reference indicators: The 30-minute MACD histogram is -1.8752, indicating short-term bearish momentum is dominant; the 30-minute ATR trend-band reference level is 129.040381. The price is below this level, suggesting the trend support level is coming under pressure.
For now, watch only two confirmation points. First, can the taker buy/sell ratio of 1.05 move out of the balanced zone around 1? Second, will the MACD histogram at -1.8752 continue to widen, or start to contract?
#NBIS #Abnormal Move Alert
1
1
·
--
🦈 $NBIS PREPARES FOR REBOUND AFTER PRE‑MARKET REJECTION 💥
The pre‑market bounce looks like a classic liquidity hunt – smart money is draining the last pool of sellers at the $NBIS demand block. 🦈📊
Expect a swift rejection, then a clean break to the upside as institutional buying re‑engages on Thursday. The volume profile shows a narrow supply pocket, setting the stage for a high‑R:R swing. 📈⚡
💬 Are you positioning now or waiting for the next liquidity sweep? 👇
⚠️ Not financial advice. Always manage your risk. 🛡️
🏷️ #NBIS #ShortSetup #LiquiditySweep #Crypto
🔥 💎
🦈 $NBIS PREPARES FOR REBOUND AFTER PRE‑MARKET REJECTION 💥
The pre‑market bounce looks like a classic liquidity hunt – smart money is draining the last pool of sellers at the $NBIS demand block. 🦈📊
Expect a swift rejection, then a clean break to the upside as institutional buying re‑engages on Thursday. The volume profile shows a narrow supply pocket, setting the stage for a high‑R:R swing. 📈⚡
💬 Are you positioning now or waiting for the next liquidity sweep? 👇
⚠️ Not financial advice. Always manage your risk. 🛡️
🏷️ #NBIS #ShortSetup #LiquiditySweep #Crypto
🔥 💎
The pre‑market bounce looks like a classic liquidity hunt – smart money is draining the last pool of sellers at the $NBIS demand block. 🦈📊
Expect a swift rejection, then a clean break to the upside as institutional buying re‑engages on Thursday. The volume profile shows a narrow supply pocket, setting the stage for a high‑R:R swing. 📈⚡
💬 Are you positioning now or waiting for the next liquidity sweep? 👇
⚠️ Not financial advice. Always manage your risk. 🛡️
🏷️ #NBIS #ShortSetup #LiquiditySweep #Crypto
🔥 💎

4

🚨 $NBIS PRE-MARKET BOUNCE WILL FAIL, SETTING STAGE FOR THURSDAY REBOUND! 🦈
🦈 Smart money is probing the pre‑market dip, slicing through thin liquidity and forcing a quick rejection. 📊 Volume spikes on the 5‑minute chart signal a classic sweep, leaving sellers exposed. ⚡ The price is likely to tumble before the real play unfolds.
📈 Once the sell‑off burns out, Thursday could unleash a clean recovery, making today and tomorrow prime entry windows for those willing to add depth. 💎 Position early, but keep eyes on the next liquidity grab.
💬 Will you add to $NBIS before the Thursday rally? 👇
⚠️ Not financial advice. Always manage your risk. 🛡️
🏷️ #NBIS #LongSetup #Recovery #Crypto
🔥 💎
🚨 $NBIS PRE-MARKET BOUNCE WILL FAIL, SETTING STAGE FOR THURSDAY REBOUND! 🦈
🦈 Smart money is probing the pre‑market dip, slicing through thin liquidity and forcing a quick rejection. 📊 Volume spikes on the 5‑minute chart signal a classic sweep, leaving sellers exposed. ⚡ The price is likely to tumble before the real play unfolds.
📈 Once the sell‑off burns out, Thursday could unleash a clean recovery, making today and tomorrow prime entry windows for those willing to add depth. 💎 Position early, but keep eyes on the next liquidity grab.
💬 Will you add to $NBIS before the Thursday rally? 👇
⚠️ Not financial advice. Always manage your risk. 🛡️
🏷️ #NBIS #LongSetup #Recovery #Crypto
🔥 💎
🦈 Smart money is probing the pre‑market dip, slicing through thin liquidity and forcing a quick rejection. 📊 Volume spikes on the 5‑minute chart signal a classic sweep, leaving sellers exposed. ⚡ The price is likely to tumble before the real play unfolds.
📈 Once the sell‑off burns out, Thursday could unleash a clean recovery, making today and tomorrow prime entry windows for those willing to add depth. 💎 Position early, but keep eyes on the next liquidity grab.
💬 Will you add to $NBIS before the Thursday rally? 👇
⚠️ Not financial advice. Always manage your risk. 🛡️
🏷️ #NBIS #LongSetup #Recovery #Crypto
🔥 💎

2
·
--
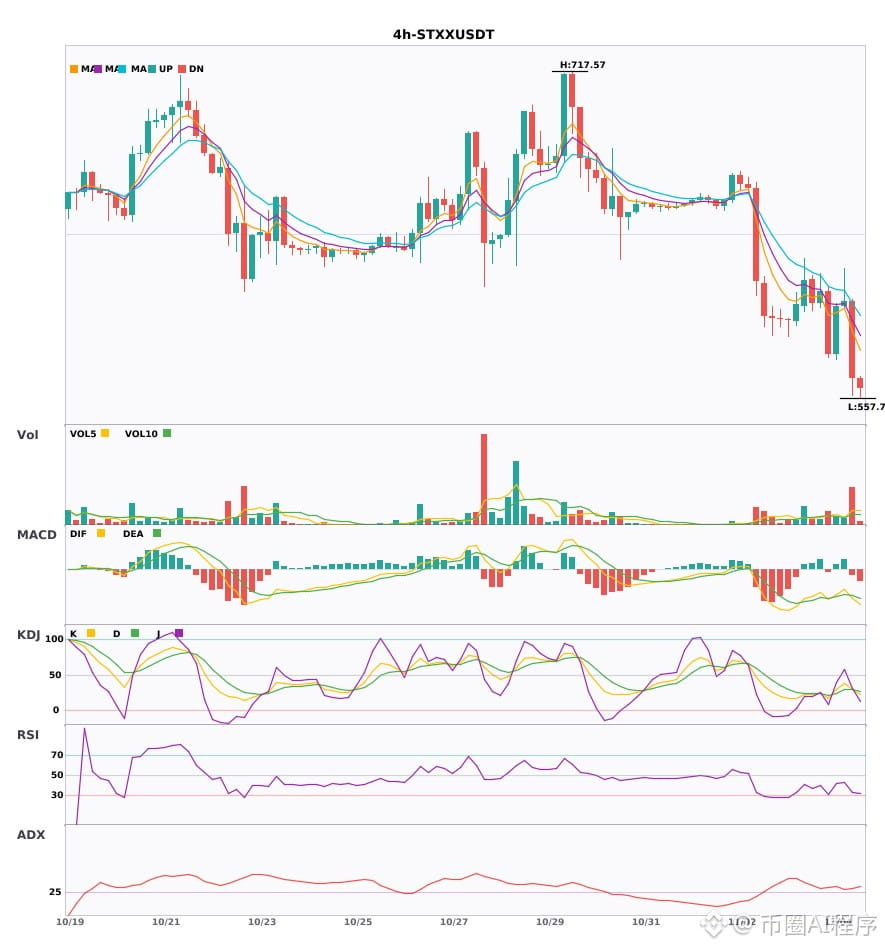
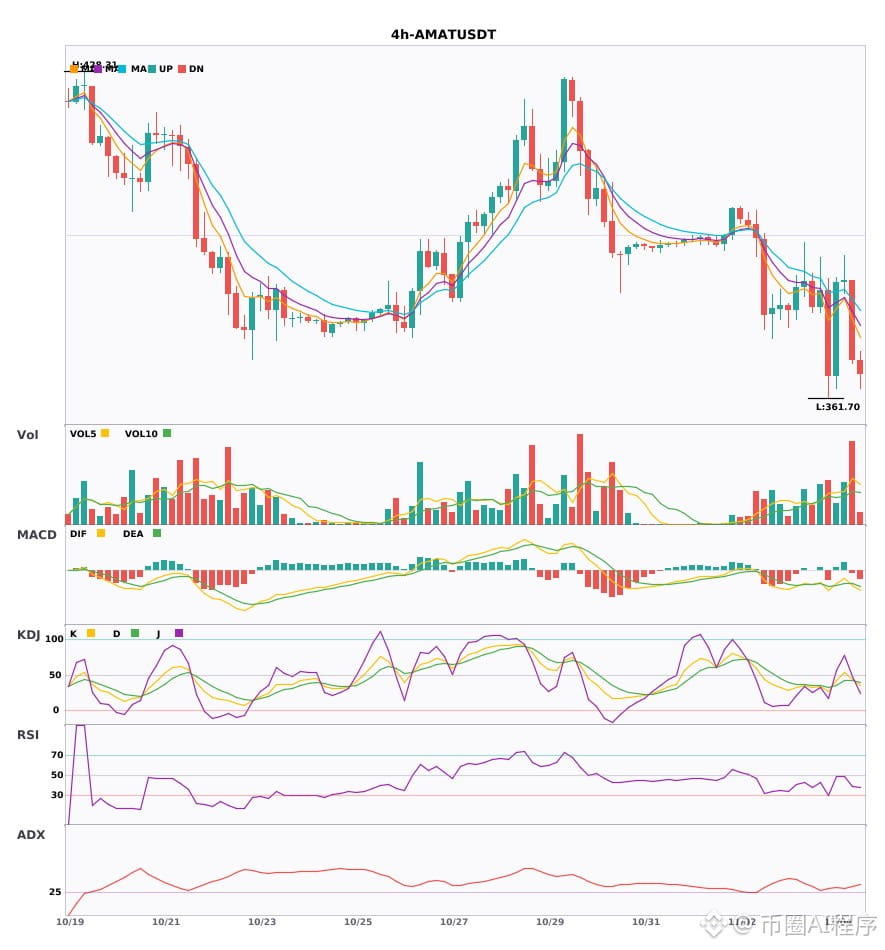
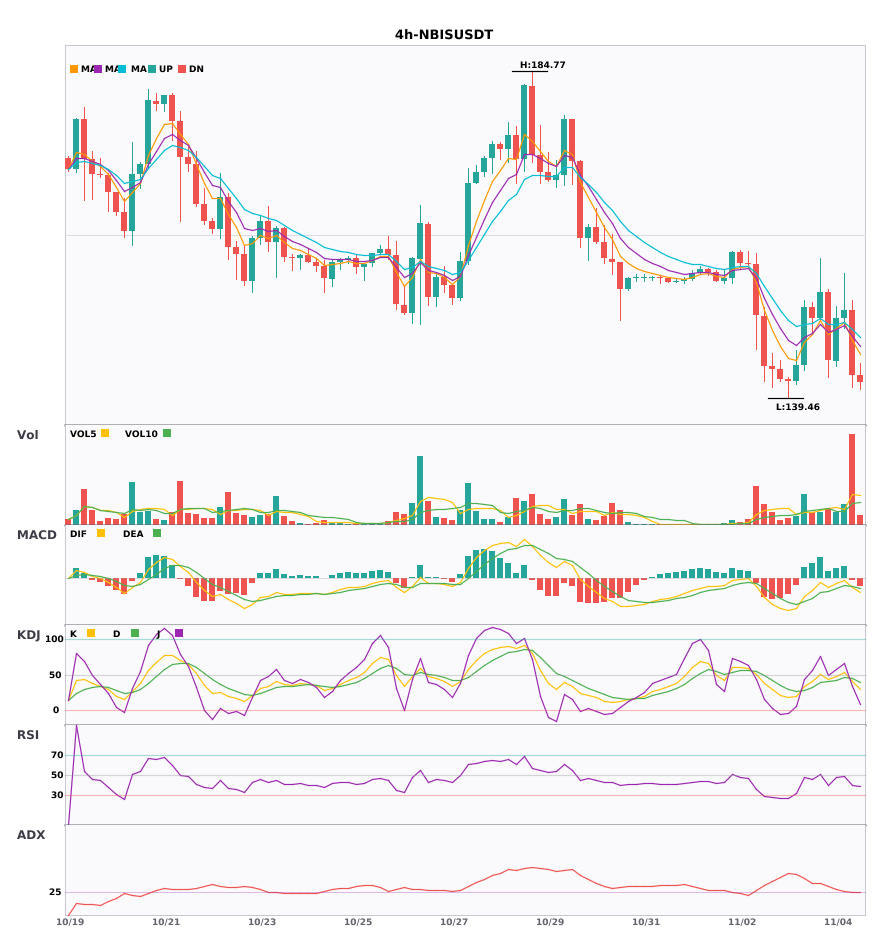
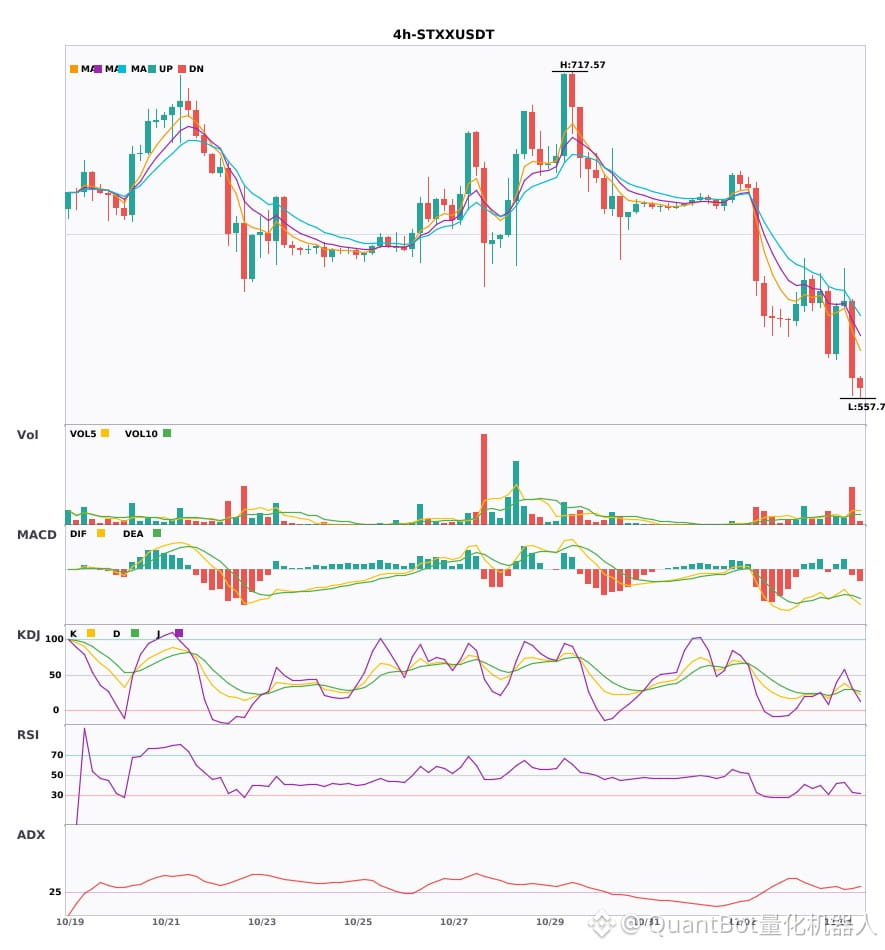
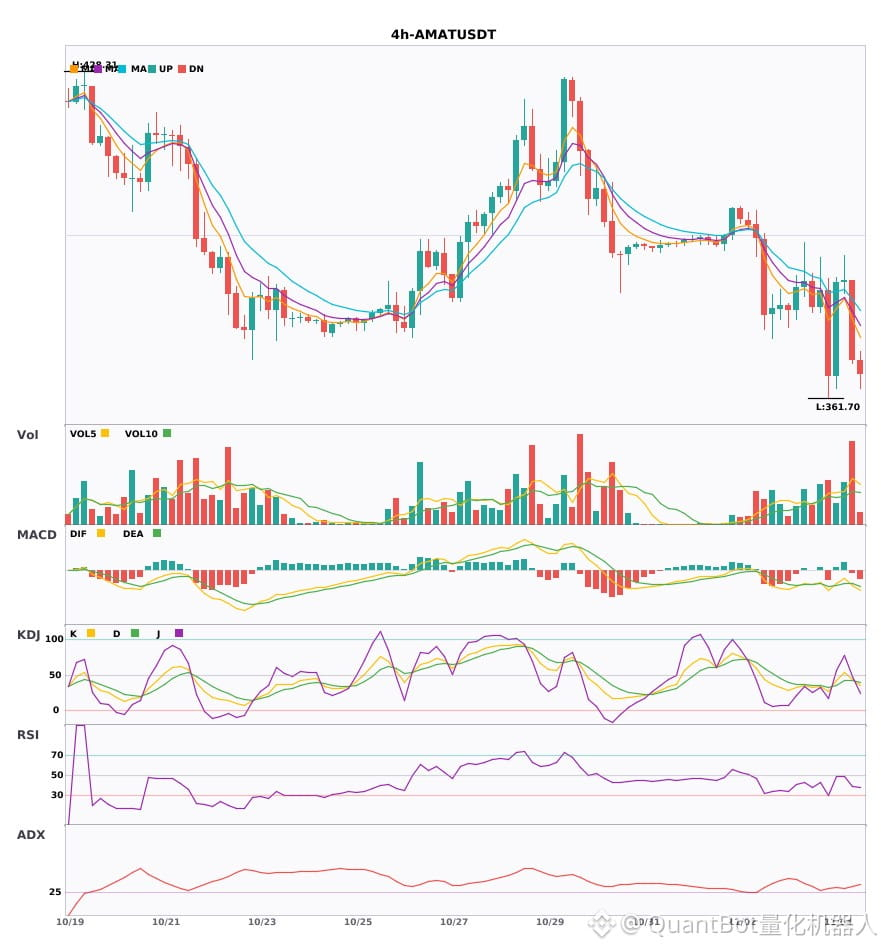
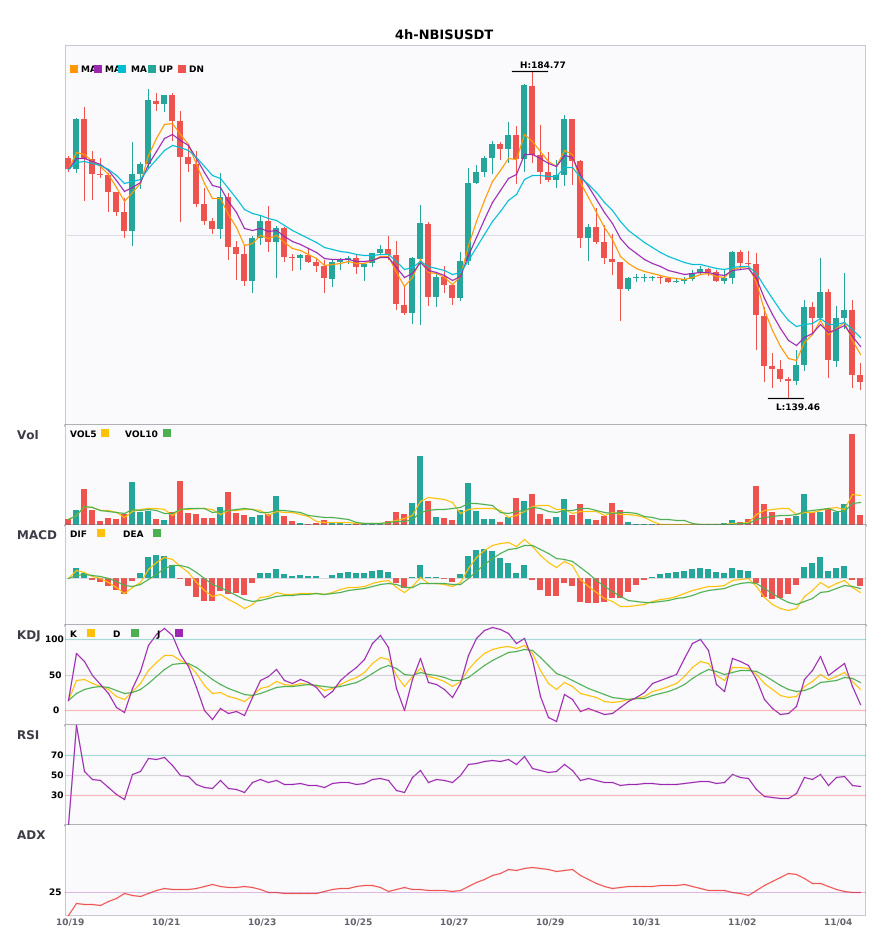
Multi-timeframe confluence: $STXX / $AMAT / $NBIS 4-hour weakness, daily bearish trend confirmed🔥
════════════════════
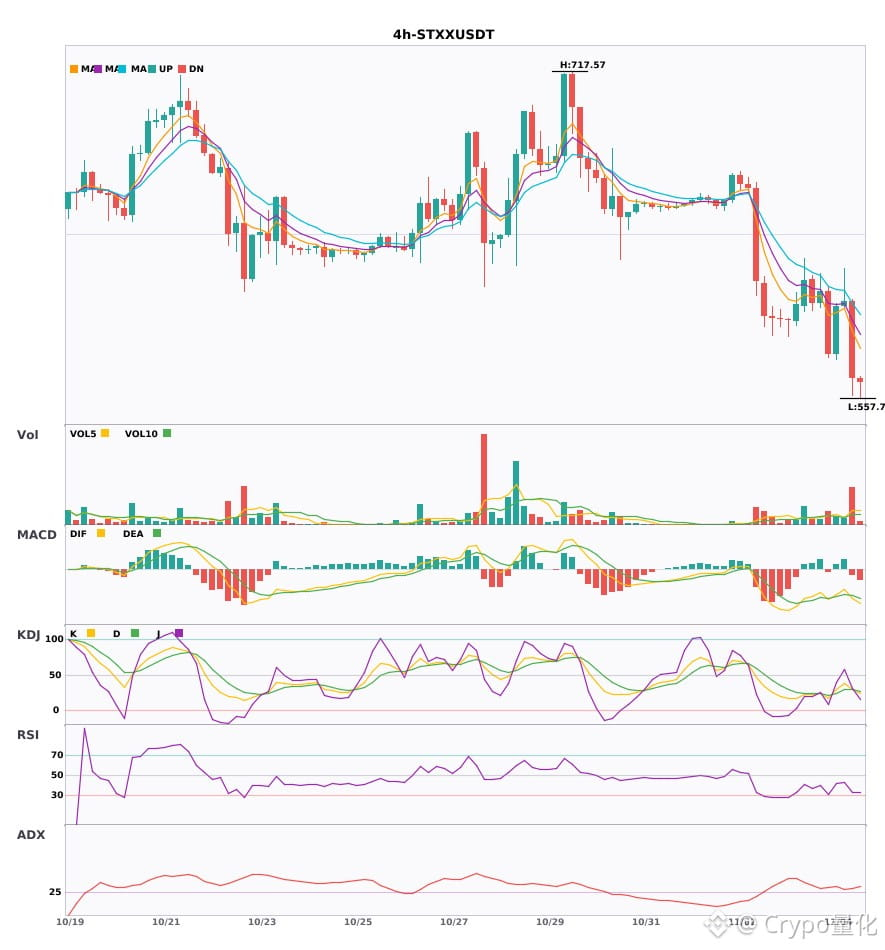
🟢 $STXX 4-hour bearish signal
⚠️Technical analysis: Daily bearish confluence confirmed | 4-hour entry: MACD bearish crossover below zero, bearish momentum accelerating | EMA5 < EMA8 < EMA13, bearish alignment | KDJ trending weakly, bears in control (K=29.9, D=29.4) | Volume surge (3.5x)
════════════════════
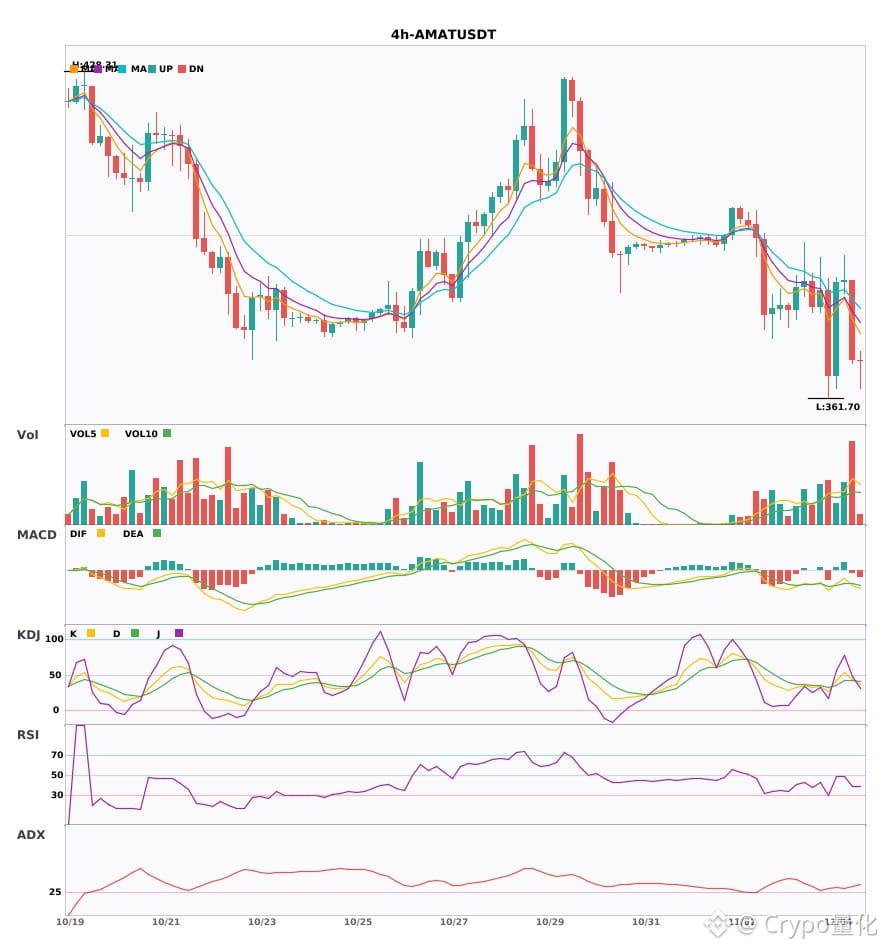
🟢 $AMAT 4-hour bearish signal
⚠️Technical analysis: Daily bearish confluence confirmed | 4-hour entry: MACD bearish crossover below zero, bearish momentum accelerating | EMA5 < EMA8 < EMA13, bearish alignment | KDJ trending weakly, bears in control (K=44.1, D=42.5) | Volume increased (2.5x)
════════════════════
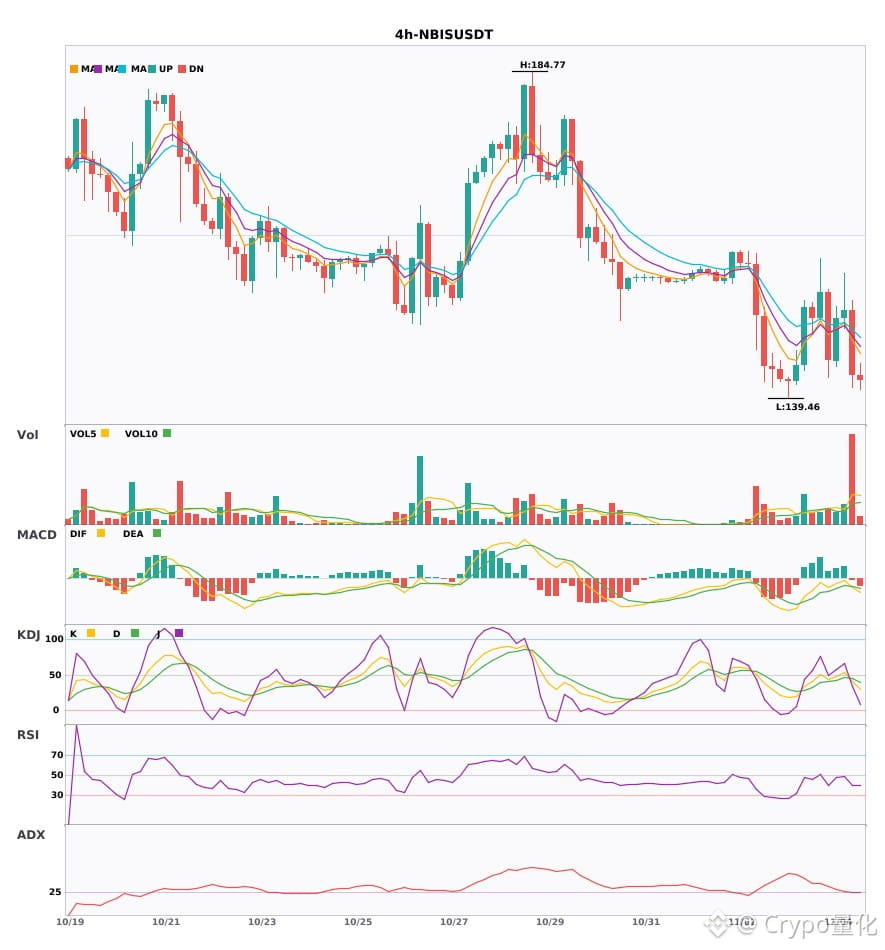
🟢 $NBIS 4-hour bearish signal
⚠️Technical analysis: Daily bearish confluence confirmed | 4-hour entry: MACD bearish crossover below zero, bearish momentum accelerating | EMA5 crossed below EMA8, short-term bearish shift | KDJ bearish crossover, short-term outlook bearish (K=41.0, D=44.5) | Volume surge (4.2x)
════════════════════
🔔 Follow for real-time market alerts 🔔
#多周期共振 #STXX #AMAT #NBIS
📌 When trading, watch for confirmation from the candlestick pattern
Multi-timeframe confluence: $STXX / $AMAT / $NBIS 4-hour weakness, daily bearish trend confirmed🔥
════════════════════
🟢 $STXX 4-hour bearish signal
⚠️Technical analysis: Daily bearish confluence confirmed | 4-hour entry: MACD bearish crossover below zero, bearish momentum accelerating | EMA5 < EMA8 < EMA13, bearish alignment | KDJ trending weakly, bears in control (K=29.9, D=29.4) | Volume surge (3.5x)
════════════════════
🟢 $AMAT 4-hour bearish signal
⚠️Technical analysis: Daily bearish confluence confirmed | 4-hour entry: MACD bearish crossover below zero, bearish momentum accelerating | EMA5 < EMA8 < EMA13, bearish alignment | KDJ trending weakly, bears in control (K=44.1, D=42.5) | Volume increased (2.5x)
════════════════════
🟢 $NBIS 4-hour bearish signal
⚠️Technical analysis: Daily bearish confluence confirmed | 4-hour entry: MACD bearish crossover below zero, bearish momentum accelerating | EMA5 crossed below EMA8, short-term bearish shift | KDJ bearish crossover, short-term outlook bearish (K=41.0, D=44.5) | Volume surge (4.2x)
════════════════════
🔔 Follow for real-time market alerts 🔔
#多周期共振 #STXX #AMAT #NBIS
📌 When trading, watch for confirmation from the candlestick pattern
════════════════════
🟢 $STXX 4-hour bearish signal
⚠️Technical analysis: Daily bearish confluence confirmed | 4-hour entry: MACD bearish crossover below zero, bearish momentum accelerating | EMA5 < EMA8 < EMA13, bearish alignment | KDJ trending weakly, bears in control (K=29.9, D=29.4) | Volume surge (3.5x)
════════════════════
🟢 $AMAT 4-hour bearish signal
⚠️Technical analysis: Daily bearish confluence confirmed | 4-hour entry: MACD bearish crossover below zero, bearish momentum accelerating | EMA5 < EMA8 < EMA13, bearish alignment | KDJ trending weakly, bears in control (K=44.1, D=42.5) | Volume increased (2.5x)
════════════════════
🟢 $NBIS 4-hour bearish signal
⚠️Technical analysis: Daily bearish confluence confirmed | 4-hour entry: MACD bearish crossover below zero, bearish momentum accelerating | EMA5 crossed below EMA8, short-term bearish shift | KDJ bearish crossover, short-term outlook bearish (K=41.0, D=44.5) | Volume surge (4.2x)
════════════════════
🔔 Follow for real-time market alerts 🔔
#多周期共振 #STXX #AMAT #NBIS
📌 When trading, watch for confirmation from the candlestick pattern
2

$STXX / $AMAT / $NBIS 4-hour technical indicators are weakening simultaneously; beware of risk
📉 $STXX | 4-hour bearish signal
━━━━━━━━━━━━━━━━━━
Technical analysis: ADX(30) Trend is forming; entry is possible | MACD bearish crossover below zero; bearish momentum accelerating | EMA5 < EMA8 < EMA13, bearish alignment | KDJ moving weakly, bears in control (K: 29.9, D: 29.4) | Volume surge (3.5x)
Price change: -6.2300%
📉 $AMAT | 4-hour bearish signal
━━━━━━━━━━━━━━━━━━
Technical analysis: ADX(33) Clear trending market | MACD bearish crossover below zero; bearish momentum accelerating | EMA5 < EMA8 < EMA13, bearish alignment | KDJ moving weakly, bears in control (K: 44.1, D: 42.5) | Volume increased (2.5x)
Price change: -4.2100%
📉 $NBIS | 4-hour bearish signal
━━━━━━━━━━━━━━━━━━
Technical analysis: ADX(26) Trend is forming; entry is possible | MACD bearish crossover below zero; bearish momentum accelerating | EMA5 crossed below EMA8, short-term outlook has turned bearish | KDJ bearish crossover; bearish short-term outlook (K: 41.0, D: 44.5) | Volume surge (4.2x)
Price change: -5.8800%
━━━━━━━━━━━━━━━━━━
#技术分析 #STXX #AMAT #NBIS
📌 The above is for reference only and does not constitute investment advice
$STXX / $AMAT / $NBIS 4-hour technical indicators are weakening simultaneously; beware of risk
📉 $STXX | 4-hour bearish signal
━━━━━━━━━━━━━━━━━━
Technical analysis: ADX(30) Trend is forming; entry is possible | MACD bearish crossover below zero; bearish momentum accelerating | EMA5 < EMA8 < EMA13, bearish alignment | KDJ moving weakly, bears in control (K: 29.9, D: 29.4) | Volume surge (3.5x)
Price change: -6.2300%
📉 $AMAT | 4-hour bearish signal
━━━━━━━━━━━━━━━━━━
Technical analysis: ADX(33) Clear trending market | MACD bearish crossover below zero; bearish momentum accelerating | EMA5 < EMA8 < EMA13, bearish alignment | KDJ moving weakly, bears in control (K: 44.1, D: 42.5) | Volume increased (2.5x)
Price change: -4.2100%
📉 $NBIS | 4-hour bearish signal
━━━━━━━━━━━━━━━━━━
Technical analysis: ADX(26) Trend is forming; entry is possible | MACD bearish crossover below zero; bearish momentum accelerating | EMA5 crossed below EMA8, short-term outlook has turned bearish | KDJ bearish crossover; bearish short-term outlook (K: 41.0, D: 44.5) | Volume surge (4.2x)
Price change: -5.8800%
━━━━━━━━━━━━━━━━━━
#技术分析 #STXX #AMAT #NBIS
📌 The above is for reference only and does not constitute investment advice
📉 $STXX | 4-hour bearish signal
━━━━━━━━━━━━━━━━━━
Technical analysis: ADX(30) Trend is forming; entry is possible | MACD bearish crossover below zero; bearish momentum accelerating | EMA5 < EMA8 < EMA13, bearish alignment | KDJ moving weakly, bears in control (K: 29.9, D: 29.4) | Volume surge (3.5x)
Price change: -6.2300%
📉 $AMAT | 4-hour bearish signal
━━━━━━━━━━━━━━━━━━
Technical analysis: ADX(33) Clear trending market | MACD bearish crossover below zero; bearish momentum accelerating | EMA5 < EMA8 < EMA13, bearish alignment | KDJ moving weakly, bears in control (K: 44.1, D: 42.5) | Volume increased (2.5x)
Price change: -4.2100%
📉 $NBIS | 4-hour bearish signal
━━━━━━━━━━━━━━━━━━
Technical analysis: ADX(26) Trend is forming; entry is possible | MACD bearish crossover below zero; bearish momentum accelerating | EMA5 crossed below EMA8, short-term outlook has turned bearish | KDJ bearish crossover; bearish short-term outlook (K: 41.0, D: 44.5) | Volume surge (4.2x)
Price change: -5.8800%
━━━━━━━━━━━━━━━━━━
#技术分析 #STXX #AMAT #NBIS
📌 The above is for reference only and does not constitute investment advice
8

·
--
$STXX / $AMAT / $NBIS 4-hour confluence turns bearish; bearish signals appear simultaneously 🔥
════════════════════
🟢 $STXX 4-hour bearish signal
⚠️Technical analysis: ADX(30) Trend is forming; opportunity to participate | MACD bearish cross below zero, bearish momentum accelerating | EMA5 < EMA8 < EMA13, bearish alignment | KDJ weak, bears in control (K: 29.9, D: 29.4) | Volume surge (3.5x)
════════════════════
🟢 $AMAT 4-hour bearish signal
⚠️Technical analysis: ADX(33) Clear trending market | MACD bearish cross below zero, bearish momentum accelerating | EMA5 < EMA8 < EMA13, bearish alignment | KDJ weak, bears in control (K: 44.1, D: 42.5) | Volume increase (2.5x)
════════════════════
🟢 $NBIS 4-hour bearish signal
⚠️Technical analysis: ADX(26) Trend is forming; opportunity to participate | MACD bearish cross below zero, bearish momentum accelerating | EMA5 crosses below EMA8, short-term outlook turns bearish | KDJ bearish cross, short-term outlook bearish (K: 41.0, D: 44.5) | Volume surge (4.2x)
════════════════════
🔔 Follow for first-hand market updates 🔔
#技术分析 #STXX #AMAT #NBIS
📌 When trading, pay attention to whether the candlestick pattern confirms the signal
$STXX / $AMAT / $NBIS 4-hour confluence turns bearish; bearish signals appear simultaneously 🔥
════════════════════
🟢 $STXX 4-hour bearish signal
⚠️Technical analysis: ADX(30) Trend is forming; opportunity to participate | MACD bearish cross below zero, bearish momentum accelerating | EMA5 < EMA8 < EMA13, bearish alignment | KDJ weak, bears in control (K: 29.9, D: 29.4) | Volume surge (3.5x)
════════════════════
🟢 $AMAT 4-hour bearish signal
⚠️Technical analysis: ADX(33) Clear trending market | MACD bearish cross below zero, bearish momentum accelerating | EMA5 < EMA8 < EMA13, bearish alignment | KDJ weak, bears in control (K: 44.1, D: 42.5) | Volume increase (2.5x)
════════════════════
🟢 $NBIS 4-hour bearish signal
⚠️Technical analysis: ADX(26) Trend is forming; opportunity to participate | MACD bearish cross below zero, bearish momentum accelerating | EMA5 crosses below EMA8, short-term outlook turns bearish | KDJ bearish cross, short-term outlook bearish (K: 41.0, D: 44.5) | Volume surge (4.2x)
════════════════════
🔔 Follow for first-hand market updates 🔔
#技术分析 #STXX #AMAT #NBIS
📌 When trading, pay attention to whether the candlestick pattern confirms the signal
════════════════════
🟢 $STXX 4-hour bearish signal
⚠️Technical analysis: ADX(30) Trend is forming; opportunity to participate | MACD bearish cross below zero, bearish momentum accelerating | EMA5 < EMA8 < EMA13, bearish alignment | KDJ weak, bears in control (K: 29.9, D: 29.4) | Volume surge (3.5x)
════════════════════
🟢 $AMAT 4-hour bearish signal
⚠️Technical analysis: ADX(33) Clear trending market | MACD bearish cross below zero, bearish momentum accelerating | EMA5 < EMA8 < EMA13, bearish alignment | KDJ weak, bears in control (K: 44.1, D: 42.5) | Volume increase (2.5x)
════════════════════
🟢 $NBIS 4-hour bearish signal
⚠️Technical analysis: ADX(26) Trend is forming; opportunity to participate | MACD bearish cross below zero, bearish momentum accelerating | EMA5 crosses below EMA8, short-term outlook turns bearish | KDJ bearish cross, short-term outlook bearish (K: 41.0, D: 44.5) | Volume surge (4.2x)
════════════════════
🔔 Follow for first-hand market updates 🔔
#技术分析 #STXX #AMAT #NBIS
📌 When trading, pay attention to whether the candlestick pattern confirms the signal
5
·
--
NBIS is no longer a one-sided story; the real interest lies in the divergence between bulls and bears.
Binance TradFi Perpetuals (traditional finance assets; high gap risk outside trading hours) | NBIS is up 7.90% over the past 24 hours, and momentum remains strong. For a follow-through, first watch for a pullback. Current price is around 156, with 24h trading volume of about 129 million; the 30m volume ratio is 2.1x, indicating rising participation. Positioning: 70% of accounts are long; taker buy/sell ratio is 1.22 (taker buying dominates); 30m open interest is down 1.4%; funding rate is +0.0545%.
Reference indicators: the 30m RSI at 86.58 is overheated, suggesting chasing sentiment is stretched; the 30m ATR trend band reference level is 147.650569. Price is above it, indicating a trend-continuation bias.
Watch just two levels: can the taker buy/sell ratio hold above 1, currently at 1.22; and can the 30m RSI at 86.6 first fall back below 70? Two paths lie ahead: either buying flows support further strength, or sentiment takes profit after volume contracts.
#NBIS #UnusualMoveAlert
NBIS is no longer a one-sided story; the real interest lies in the divergence between bulls and bears.
Binance TradFi Perpetuals (traditional finance assets; high gap risk outside trading hours) | NBIS is up 7.90% over the past 24 hours, and momentum remains strong. For a follow-through, first watch for a pullback. Current price is around 156, with 24h trading volume of about 129 million; the 30m volume ratio is 2.1x, indicating rising participation. Positioning: 70% of accounts are long; taker buy/sell ratio is 1.22 (taker buying dominates); 30m open interest is down 1.4%; funding rate is +0.0545%.
Reference indicators: the 30m RSI at 86.58 is overheated, suggesting chasing sentiment is stretched; the 30m ATR trend band reference level is 147.650569. Price is above it, indicating a trend-continuation bias.
Watch just two levels: can the taker buy/sell ratio hold above 1, currently at 1.22; and can the 30m RSI at 86.6 first fall back below 70? Two paths lie ahead: either buying flows support further strength, or sentiment takes profit after volume contracts.
#NBIS #UnusualMoveAlert
Binance TradFi Perpetuals (traditional finance assets; high gap risk outside trading hours) | NBIS is up 7.90% over the past 24 hours, and momentum remains strong. For a follow-through, first watch for a pullback. Current price is around 156, with 24h trading volume of about 129 million; the 30m volume ratio is 2.1x, indicating rising participation. Positioning: 70% of accounts are long; taker buy/sell ratio is 1.22 (taker buying dominates); 30m open interest is down 1.4%; funding rate is +0.0545%.
Reference indicators: the 30m RSI at 86.58 is overheated, suggesting chasing sentiment is stretched; the 30m ATR trend band reference level is 147.650569. Price is above it, indicating a trend-continuation bias.
Watch just two levels: can the taker buy/sell ratio hold above 1, currently at 1.22; and can the 30m RSI at 86.6 first fall back below 70? Two paths lie ahead: either buying flows support further strength, or sentiment takes profit after volume contracts.
#NBIS #UnusualMoveAlert
·
--
🚨 $NBIS POISED FOR MAJOR UPSIDE AS SMART MONEY ACCUMULATES 🦈
📊 The recent dip toward $150 has cleared a dense liquidity pocket, allowing institutional buyers to step in with minimal resistance. 🧭 A lingering order block sits just above $150, and the price action is now testing the next bullish thrust. 🌊 Volume on the 4‑hour chart is expanding, signaling that the smart money is loading positions before a multi‑month rally.
💡 With the market still under‑priced, the next leg could target the historic resistance zone near $200, offering a compelling risk‑reward profile. 🤔 How are you positioning for the upcoming liquidity sweep? 👇
⚠️ Not financial advice. Always manage your risk. 🛡️
🏷️ #NBIS #LongSetup #SmartMoney #Bullish #Crypto
🔥 💎
🚨 $NBIS POISED FOR MAJOR UPSIDE AS SMART MONEY ACCUMULATES 🦈
📊 The recent dip toward $150 has cleared a dense liquidity pocket, allowing institutional buyers to step in with minimal resistance. 🧭 A lingering order block sits just above $150, and the price action is now testing the next bullish thrust. 🌊 Volume on the 4‑hour chart is expanding, signaling that the smart money is loading positions before a multi‑month rally.
💡 With the market still under‑priced, the next leg could target the historic resistance zone near $200, offering a compelling risk‑reward profile. 🤔 How are you positioning for the upcoming liquidity sweep? 👇
⚠️ Not financial advice. Always manage your risk. 🛡️
🏷️ #NBIS #LongSetup #SmartMoney #Bullish #Crypto
🔥 💎
📊 The recent dip toward $150 has cleared a dense liquidity pocket, allowing institutional buyers to step in with minimal resistance. 🧭 A lingering order block sits just above $150, and the price action is now testing the next bullish thrust. 🌊 Volume on the 4‑hour chart is expanding, signaling that the smart money is loading positions before a multi‑month rally.
💡 With the market still under‑priced, the next leg could target the historic resistance zone near $200, offering a compelling risk‑reward profile. 🤔 How are you positioning for the upcoming liquidity sweep? 👇
⚠️ Not financial advice. Always manage your risk. 🛡️
🏷️ #NBIS #LongSetup #SmartMoney #Bullish #Crypto
🔥 💎

7

🚀 $NBIS ON THE CUSP OF A MAJOR SURGE! 🟢
Smart money has been quietly stacking $NBIS around the $150 zone, swallowing every sell‑off like a shark in a feeding frenzy. 📊 The order flow shows a clear absorption pattern, and the next liquidity sweep could force the price to test the $100 floor before the bulls reclaim the narrative. 🦈
Once that floor holds, the upside bias is brutal – the next swing could catapult $NBIS well beyond current levels, giving early buyers a massive upside years down the line. ⚡ Keep an eye on volume spikes and the breakout momentum as the market rewrites the story. 📈
💬 Are you positioning now for the long‑term surge or waiting for the next dip? 👇
⚠️ Not financial advice. Always manage your risk. 🛡️
🏷️ #NBIS #LongSetup #Bullish #Momentum #Crypto
🔥 💎
🚀 $NBIS ON THE CUSP OF A MAJOR SURGE! 🟢
Smart money has been quietly stacking $NBIS around the $150 zone, swallowing every sell‑off like a shark in a feeding frenzy. 📊 The order flow shows a clear absorption pattern, and the next liquidity sweep could force the price to test the $100 floor before the bulls reclaim the narrative. 🦈
Once that floor holds, the upside bias is brutal – the next swing could catapult $NBIS well beyond current levels, giving early buyers a massive upside years down the line. ⚡ Keep an eye on volume spikes and the breakout momentum as the market rewrites the story. 📈
💬 Are you positioning now for the long‑term surge or waiting for the next dip? 👇
⚠️ Not financial advice. Always manage your risk. 🛡️
🏷️ #NBIS #LongSetup #Bullish #Momentum #Crypto
🔥 💎
Smart money has been quietly stacking $NBIS around the $150 zone, swallowing every sell‑off like a shark in a feeding frenzy. 📊 The order flow shows a clear absorption pattern, and the next liquidity sweep could force the price to test the $100 floor before the bulls reclaim the narrative. 🦈
Once that floor holds, the upside bias is brutal – the next swing could catapult $NBIS well beyond current levels, giving early buyers a massive upside years down the line. ⚡ Keep an eye on volume spikes and the breakout momentum as the market rewrites the story. 📈
💬 Are you positioning now for the long‑term surge or waiting for the next dip? 👇
⚠️ Not financial advice. Always manage your risk. 🛡️
🏷️ #NBIS #LongSetup #Bullish #Momentum #Crypto
🔥 💎

11
🚨 $NBIS CHARGING FOR BREAKOUT AFTER 200% HOURLY VOLUME SPIKE! ⚡
Entry: 230.5 - 231.5 ⚡
Target: 231.65 - 235.00 🚀
Aggressive market orders are devouring sell liquidity as $NBIS prints a sharp expansion candle on the 1-hour chart. 📊 A massive 200% volume surge just confirmed heavy buyer conviction pushing directly into key overhead resistance.
Clearing the 231.65 ceiling opens up a rapid liquidity vacuum straight toward the 235 magnet. ⚡ Order flow dynamics clearly signal that sellers are running out of inventory to defend this zone. 💡
Are you front-running this velocity or waiting for the clean confirmation close above resistance? 👇
⚠️ Not financial advice. Always manage your risk. 🛡️
🏷️ #NBIS #Breakout #Momentum #Crypto
🔥 💎
🚨 $NBIS CHARGING FOR BREAKOUT AFTER 200% HOURLY VOLUME SPIKE! ⚡
Entry: 230.5 - 231.5 ⚡
Target: 231.65 - 235.00 🚀
Aggressive market orders are devouring sell liquidity as $NBIS prints a sharp expansion candle on the 1-hour chart. 📊 A massive 200% volume surge just confirmed heavy buyer conviction pushing directly into key overhead resistance.
Clearing the 231.65 ceiling opens up a rapid liquidity vacuum straight toward the 235 magnet. ⚡ Order flow dynamics clearly signal that sellers are running out of inventory to defend this zone. 💡
Are you front-running this velocity or waiting for the clean confirmation close above resistance? 👇
⚠️ Not financial advice. Always manage your risk. 🛡️
🏷️ #NBIS #Breakout #Momentum #Crypto
🔥 💎
Entry: 230.5 - 231.5 ⚡
Target: 231.65 - 235.00 🚀
Aggressive market orders are devouring sell liquidity as $NBIS prints a sharp expansion candle on the 1-hour chart. 📊 A massive 200% volume surge just confirmed heavy buyer conviction pushing directly into key overhead resistance.
Clearing the 231.65 ceiling opens up a rapid liquidity vacuum straight toward the 235 magnet. ⚡ Order flow dynamics clearly signal that sellers are running out of inventory to defend this zone. 💡
Are you front-running this velocity or waiting for the clean confirmation close above resistance? 👇
⚠️ Not financial advice. Always manage your risk. 🛡️
🏷️ #NBIS #Breakout #Momentum #Crypto
🔥 💎
12
·
--
NBIS is down 10.62% over 24 hours, yet aggressive buying still outweighs selling—that’s the divergence right now.
Binance TradFi Perpetuals (traditional finance assets; high risk of price gaps outside trading hours) | NBIS remains weak intraday. Any recovery will first depend on whether selling pressure eases. Current price is around 141.82, with 24-hour trading volume of about 108 million; the 30-minute volume ratio is just 0.5x, indicating weak participation. Positioning: 72% of accounts are long; the taker buy/sell ratio is 1.16 (price is falling, but aggressive buying outweighs selling); 30-minute open interest is up 0.2%; funding rate is +0.0281%.
Reference indicators: 30-minute KDJ is 52/32.28/91.45, suggesting short-term enthusiasm for chasing prices is elevated. Support and resistance: watch the 139.46 / 145.72 levels first. Near resistance, pay closer attention to whether a breakout comes with rising volume or the price pulls back after a spike.
The order book needs to provide two answers: can the taker buy/sell ratio stay above 1 and help stabilize the price, and can the KDJ J value fall back from its high of 91.5? If both hold, it may signal a recovery; if only one does, the market is still in a weak, choppy state.
#NBIS #UnusualMovementAlert
NBIS is down 10.62% over 24 hours, yet aggressive buying still outweighs selling—that’s the divergence right now.
Binance TradFi Perpetuals (traditional finance assets; high risk of price gaps outside trading hours) | NBIS remains weak intraday. Any recovery will first depend on whether selling pressure eases. Current price is around 141.82, with 24-hour trading volume of about 108 million; the 30-minute volume ratio is just 0.5x, indicating weak participation. Positioning: 72% of accounts are long; the taker buy/sell ratio is 1.16 (price is falling, but aggressive buying outweighs selling); 30-minute open interest is up 0.2%; funding rate is +0.0281%.
Reference indicators: 30-minute KDJ is 52/32.28/91.45, suggesting short-term enthusiasm for chasing prices is elevated. Support and resistance: watch the 139.46 / 145.72 levels first. Near resistance, pay closer attention to whether a breakout comes with rising volume or the price pulls back after a spike.
The order book needs to provide two answers: can the taker buy/sell ratio stay above 1 and help stabilize the price, and can the KDJ J value fall back from its high of 91.5? If both hold, it may signal a recovery; if only one does, the market is still in a weak, choppy state.
#NBIS #UnusualMovementAlert
Binance TradFi Perpetuals (traditional finance assets; high risk of price gaps outside trading hours) | NBIS remains weak intraday. Any recovery will first depend on whether selling pressure eases. Current price is around 141.82, with 24-hour trading volume of about 108 million; the 30-minute volume ratio is just 0.5x, indicating weak participation. Positioning: 72% of accounts are long; the taker buy/sell ratio is 1.16 (price is falling, but aggressive buying outweighs selling); 30-minute open interest is up 0.2%; funding rate is +0.0281%.
Reference indicators: 30-minute KDJ is 52/32.28/91.45, suggesting short-term enthusiasm for chasing prices is elevated. Support and resistance: watch the 139.46 / 145.72 levels first. Near resistance, pay closer attention to whether a breakout comes with rising volume or the price pulls back after a spike.
The order book needs to provide two answers: can the taker buy/sell ratio stay above 1 and help stabilize the price, and can the KDJ J value fall back from its high of 91.5? If both hold, it may signal a recovery; if only one does, the market is still in a weak, choppy state.
#NBIS #UnusualMovementAlert
·
--
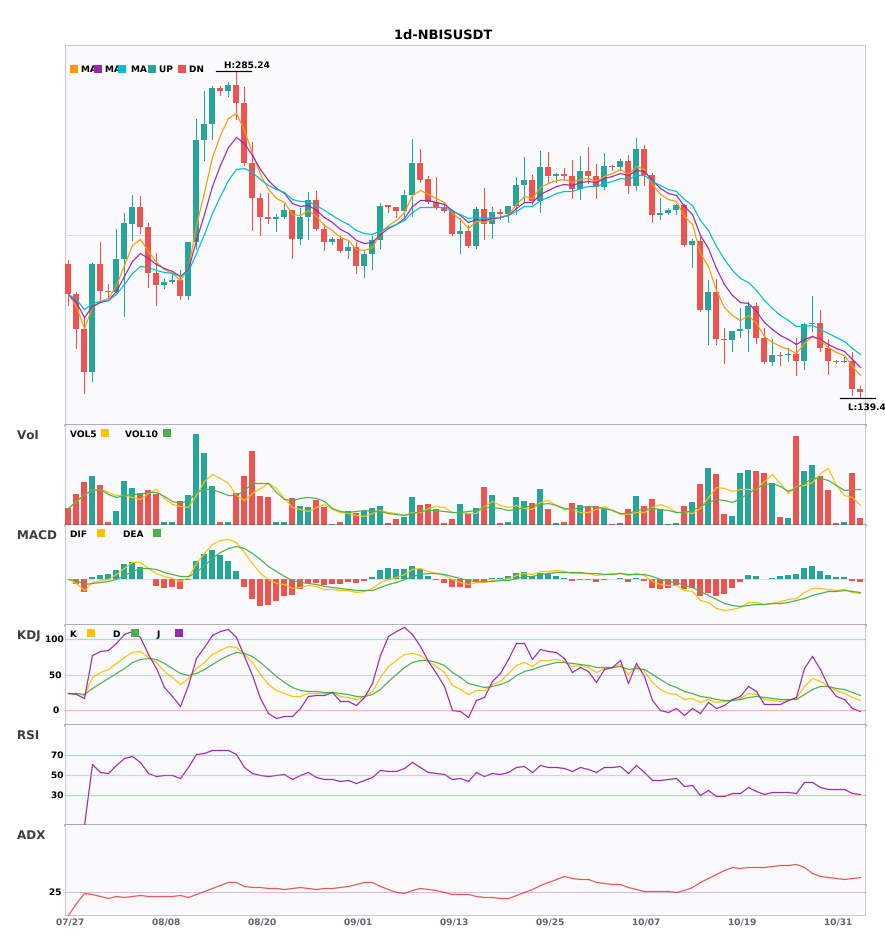
$NBIS Daily bearish + weekly bearish in the same direction—multi-timeframe confluence, trade with the trend 🔥
════════════════════
🟢 $NBIS Daily bearish signal
⚠️Technical analysis: Weekly bearish confluence confirmed | Daily entry: MACD death cross below zero, bearish momentum accelerating | EMA5 < EMA8 < EMA13, bearish alignment | KDJ trending weakly, bears in control (K: 18.4, D: 25.8) | Volume normal (1.5x)
════════════════════
🔔 Follow for first-hand market updates 🔔
#多周期共振 #NBIS
📌 When trading, pay attention to whether the candlestick patterns align
$NBIS Daily bearish + weekly bearish in the same direction—multi-timeframe confluence, trade with the trend 🔥
════════════════════
🟢 $NBIS Daily bearish signal
⚠️Technical analysis: Weekly bearish confluence confirmed | Daily entry: MACD death cross below zero, bearish momentum accelerating | EMA5 < EMA8 < EMA13, bearish alignment | KDJ trending weakly, bears in control (K: 18.4, D: 25.8) | Volume normal (1.5x)
════════════════════
🔔 Follow for first-hand market updates 🔔
#多周期共振 #NBIS
📌 When trading, pay attention to whether the candlestick patterns align
════════════════════
🟢 $NBIS Daily bearish signal
⚠️Technical analysis: Weekly bearish confluence confirmed | Daily entry: MACD death cross below zero, bearish momentum accelerating | EMA5 < EMA8 < EMA13, bearish alignment | KDJ trending weakly, bears in control (K: 18.4, D: 25.8) | Volume normal (1.5x)
════════════════════
🔔 Follow for first-hand market updates 🔔
#多周期共振 #NBIS
📌 When trading, pay attention to whether the candlestick patterns align
4

·
--
$NBIS #NBIS
Unusual Move Alert: Short Signal | NBIS
NBIS on the 15m chart shows a 1h bearish anomaly to watch, with 1h volume starting to rise.
Key signals: 1h trading value 30.5x / 4h trading value 6.8x / weak 1h candle body and lower close / breaks below 1h low (20) / breaks below 1h low (55) / 1h breaks below VWAP
1h trading value: 30.5x
24h trading value: 88.7M USDT
Funding rate: +0.0184% (longs pay, shorts receive)
Score: 12/12
Key short-term level: Breakdown level 144.59
Invalidation level: 161.35
Levels to watch below: 130.13 / 115.67
Once triggered, trade in the indicated direction; the invalidation level is the stop-loss level.
$NBIS #NBIS
Unusual Move Alert: Short Signal | NBIS
NBIS on the 15m chart shows a 1h bearish anomaly to watch, with 1h volume starting to rise.
Key signals: 1h trading value 30.5x / 4h trading value 6.8x / weak 1h candle body and lower close / breaks below 1h low (20) / breaks below 1h low (55) / 1h breaks below VWAP
1h trading value: 30.5x
24h trading value: 88.7M USDT
Funding rate: +0.0184% (longs pay, shorts receive)
Score: 12/12
Key short-term level: Breakdown level 144.59
Invalidation level: 161.35
Levels to watch below: 130.13 / 115.67
Once triggered, trade in the indicated direction; the invalidation level is the stop-loss level.
Unusual Move Alert: Short Signal | NBIS
NBIS on the 15m chart shows a 1h bearish anomaly to watch, with 1h volume starting to rise.
Key signals: 1h trading value 30.5x / 4h trading value 6.8x / weak 1h candle body and lower close / breaks below 1h low (20) / breaks below 1h low (55) / 1h breaks below VWAP
1h trading value: 30.5x
24h trading value: 88.7M USDT
Funding rate: +0.0184% (longs pay, shorts receive)
Score: 12/12
Key short-term level: Breakdown level 144.59
Invalidation level: 161.35
Levels to watch below: 130.13 / 115.67
Once triggered, trade in the indicated direction; the invalidation level is the stop-loss level.
419
Log in to explore more content
Join global crypto users on Binance Square
⚡️ Get latest and useful information about crypto.
💬 Trusted by the world’s largest crypto exchange.
👍 Discover real insights from verified creators.
Email / Phone number
Trending Topics
1
#BinanceReopensWithdrawalsForMoreAssets
816,683 views
4,503 Discussing
2
#Binance98PercentReplenished
169,506 views
1,799 Discussing
3
#USStocksSlipandCryptoMarketUnderBroadPressure
7,438 views
203 Discussing
4
#StrategySTRCResumesIssuanceAfterOver170Days
19,607 views
395 Discussing
5
#ADPUSPrivateEmployersAdd86000JobsInOctober
35,211 views
545 Discussing
6
#KazakhstanReportedlyInvests$100MInCryptoFunds
1,921 views
51 Discussing
7
#SouthKoreaSeeksCryptoTaxDelayUntil2029
21,104 views
248 Discussing
8
#USMidterms-WhatAreMarketsExpecting?
614,963 views
2,898 Discussing
9
#US10YearTreasuryYieldFallsTo4.845%
27,003 views
186 Discussing
10
#ZcashExpectsNU7ToMake$16MSproutZECInaccessible
1,555 views
23 Discussing