
#mstrb
mstrb
26,344 views
779 Discussing
Hot
Latest

·
--
$MSTRB MSTRB is showing bullish movement: 3.53% (Crypto).
Volume: 12.97M | Last: $136.72
Key signals: strong momentum, high trader activity.
Bias Daily: BULLISH 🟢 | Weekly: BULLISH 🟢
MSTRB rose 4.57% to $138.03 over 24 hours, driven by BTC treasury expansion despite heavy late-session outflows.
**Institutional Treasury Accumulation (High)**: Strategy added 811 BTC (~$65.5M) to expand reserves to 849,327 BTC → reinforces fundamental value backing bStocks.
- **Pension Fund Inflows (Medium)**: Ohio STRS boosted equity holdings by 83% to 110,011 shares → validates institutional demand.
- **Technical Bullish Rebound (Medium)**: Price bounced off $130.41 support with MACD flipping positive (+0.39 hist) and EMA-7 crossing above EMA-25/99.
#MSTRB #BinanceIncidentReport #TRUMP #USMidtermElections #Crypto
$MSTRB MSTRB is showing bullish movement: 3.53% (Crypto).
Volume: 12.97M | Last: $136.72
Key signals: strong momentum, high trader activity.
Bias Daily: BULLISH 🟢 | Weekly: BULLISH 🟢
MSTRB rose 4.57% to $138.03 over 24 hours, driven by BTC treasury expansion despite heavy late-session outflows.
**Institutional Treasury Accumulation (High)**: Strategy added 811 BTC (~$65.5M) to expand reserves to 849,327 BTC → reinforces fundamental value backing bStocks.
- **Pension Fund Inflows (Medium)**: Ohio STRS boosted equity holdings by 83% to 110,011 shares → validates institutional demand.
- **Technical Bullish Rebound (Medium)**: Price bounced off $130.41 support with MACD flipping positive (+0.39 hist) and EMA-7 crossing above EMA-25/99.
#MSTRB #BinanceIncidentReport #TRUMP #USMidtermElections #Crypto
Volume: 12.97M | Last: $136.72
Key signals: strong momentum, high trader activity.
Bias Daily: BULLISH 🟢 | Weekly: BULLISH 🟢
MSTRB rose 4.57% to $138.03 over 24 hours, driven by BTC treasury expansion despite heavy late-session outflows.
**Institutional Treasury Accumulation (High)**: Strategy added 811 BTC (~$65.5M) to expand reserves to 849,327 BTC → reinforces fundamental value backing bStocks.
- **Pension Fund Inflows (Medium)**: Ohio STRS boosted equity holdings by 83% to 110,011 shares → validates institutional demand.
- **Technical Bullish Rebound (Medium)**: Price bounced off $130.41 support with MACD flipping positive (+0.39 hist) and EMA-7 crossing above EMA-25/99.
#MSTRB #BinanceIncidentReport #TRUMP #USMidtermElections #Crypto
2

·
--
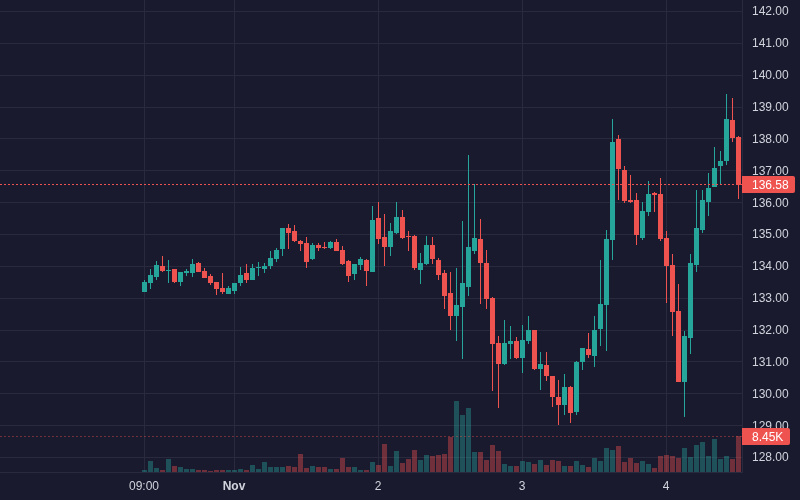
$MSTRB holds a 6.31% daily gain at $139.29 on $11.94M volume.
The latest hourly close at 137.3 follows a 23-hour high of 138.61, showing momentum above the prior range. However, hourly volume running at 0.82x the daily average signals caution against chasing moves without confirmation.
A sustained push above the recent high could validate continuation, while slipping back under the 129.3 low would invalidate the breakout structure.
Will you wait for a volume-backed breakout confirmation above 138.61, or do you view a dip toward 129.3 as a risk invalidation warning?
Tap $MSTRB for the live chart. #MSTRB #BinanceSquare
$MSTRB holds a 6.31% daily gain at $139.29 on $11.94M volume.
The latest hourly close at 137.3 follows a 23-hour high of 138.61, showing momentum above the prior range. However, hourly volume running at 0.82x the daily average signals caution against chasing moves without confirmation.
A sustained push above the recent high could validate continuation, while slipping back under the 129.3 low would invalidate the breakout structure.
Will you wait for a volume-backed breakout confirmation above 138.61, or do you view a dip toward 129.3 as a risk invalidation warning?
Tap $MSTRB for the live chart. #MSTRB #BinanceSquare
The latest hourly close at 137.3 follows a 23-hour high of 138.61, showing momentum above the prior range. However, hourly volume running at 0.82x the daily average signals caution against chasing moves without confirmation.
A sustained push above the recent high could validate continuation, while slipping back under the 129.3 low would invalidate the breakout structure.
Will you wait for a volume-backed breakout confirmation above 138.61, or do you view a dip toward 129.3 as a risk invalidation warning?
Tap $MSTRB for the live chart. #MSTRB #BinanceSquare
1

·
--
🟢 $MSTRB LONG Setup
Buyers are stepping in on $MSTRB.
📊 MSTRBUSDT is displaying strong bullish momentum, evidenced by a significant 4.797% price increase over the last 24 hours coupled with robust trading volume. This suggests a continuation of the uptrend, indicating sustained buying pressure. A long position is favored at the current price, aiming to capitalize on this established upward trajectory.
🎯 Trade Plan
Entry: 137.4
Stop Loss: 134.65
TP1: 140.15
TP2: 142.9
TP3: 145.65
⚖️ Risk:Reward (TP1) 1:1.00
⚡ Trigger: Price reaches entry
⚠️ Risk Note: Cryptocurrency markets are inherently volatile, and while this setup targets a continuation of current trends, price reversals can occur rapidly. Ensure proper risk management by strictly adhering to the stop-loss order and adjusting position size according to your risk tolerance.
Manage your risk and size positions wisely.
#MSTRB #mstrb
🟢 $MSTRB LONG Setup
Buyers are stepping in on $MSTRB .
📊 MSTRBUSDT is displaying strong bullish momentum, evidenced by a significant 4.797% price increase over the last 24 hours coupled with robust trading volume. This suggests a continuation of the uptrend, indicating sustained buying pressure. A long position is favored at the current price, aiming to capitalize on this established upward trajectory.
🎯 Trade Plan
Entry: 137.4
Stop Loss: 134.65
TP1: 140.15
TP2: 142.9
TP3: 145.65
⚖️ Risk:Reward (TP1) 1:1.00
⚡ Trigger: Price reaches entry
⚠️ Risk Note: Cryptocurrency markets are inherently volatile, and while this setup targets a continuation of current trends, price reversals can occur rapidly. Ensure proper risk management by strictly adhering to the stop-loss order and adjusting position size according to your risk tolerance.
Manage your risk and size positions wisely.
#MSTRB #mstrb
Buyers are stepping in on $MSTRB .
📊 MSTRBUSDT is displaying strong bullish momentum, evidenced by a significant 4.797% price increase over the last 24 hours coupled with robust trading volume. This suggests a continuation of the uptrend, indicating sustained buying pressure. A long position is favored at the current price, aiming to capitalize on this established upward trajectory.
🎯 Trade Plan
Entry: 137.4
Stop Loss: 134.65
TP1: 140.15
TP2: 142.9
TP3: 145.65
⚖️ Risk:Reward (TP1) 1:1.00
⚡ Trigger: Price reaches entry
⚠️ Risk Note: Cryptocurrency markets are inherently volatile, and while this setup targets a continuation of current trends, price reversals can occur rapidly. Ensure proper risk management by strictly adhering to the stop-loss order and adjusting position size according to your risk tolerance.
Manage your risk and size positions wisely.
#MSTRB #mstrb

·
--
$MSTRB 🚀 $MSTRB LONG SETUP 🟢 The bulls are showing significant momentum, pushing $MSTRB firmly toward recent highs with strong buying pressure. This 6.22% surge indicates a solid trend continuation as volume remains robust in the current session.
📊 24h: +6.22% | Vol: $11,657,775.34
📈 TRADE PLAN
🔹 Entry: 137.61
🛑 Stop Loss: 134.48
🎯 TP1: 142.31
🎯 TP2: 145.45
🎯 TP3: 148.59
⚖️ Risk:Reward (TP1): 1:1.50
🔔 Trigger: A sustained breakout and candle close above the 138.61 resistance level would confirm the bullish thesis.
⚠️ Risk Note: High volatility is expected following a 6.22% move; ensure strict position sizing to manage potential pullbacks.
Always wait for a clear breakout confirmation before committing capital to this trend.
Click below 👇🏻 to trade
$MSTRB
Follow @T4_TZX for more updates...
#MSTRB #CryptoTrading #MarketAnalysis #BinanceSquare
$MSTRB 🚀 $MSTRB LONG SETUP 🟢 The bulls are showing significant momentum, pushing $MSTRB firmly toward recent highs with strong buying pressure. This 6.22% surge indicates a solid trend continuation as volume remains robust in the current session.
📊 24h: +6.22% | Vol: $11,657,775.34
📈 TRADE PLAN
🔹 Entry: 137.61
🛑 Stop Loss: 134.48
🎯 TP1: 142.31
🎯 TP2: 145.45
🎯 TP3: 148.59
⚖️ Risk:Reward (TP1): 1:1.50
🔔 Trigger: A sustained breakout and candle close above the 138.61 resistance level would confirm the bullish thesis.
⚠️ Risk Note: High volatility is expected following a 6.22% move; ensure strict position sizing to manage potential pullbacks.
Always wait for a clear breakout confirmation before committing capital to this trend.
Click below 👇🏻 to trade
$MSTRB
Follow @T4_TZX for more updates...
#MSTRB #CryptoTrading #MarketAnalysis #BinanceSquare
📊 24h: +6.22% | Vol: $11,657,775.34
📈 TRADE PLAN
🔹 Entry: 137.61
🛑 Stop Loss: 134.48
🎯 TP1: 142.31
🎯 TP2: 145.45
🎯 TP3: 148.59
⚖️ Risk:Reward (TP1): 1:1.50
🔔 Trigger: A sustained breakout and candle close above the 138.61 resistance level would confirm the bullish thesis.
⚠️ Risk Note: High volatility is expected following a 6.22% move; ensure strict position sizing to manage potential pullbacks.
Always wait for a clear breakout confirmation before committing capital to this trend.
Click below 👇🏻 to trade
$MSTRB
Follow @T4_TZX for more updates...
#MSTRB #CryptoTrading #MarketAnalysis #BinanceSquare
·
--
Is $MSTRB finding firm footing after today’s cooling off?
The asset currently trades at $131.36, down 1.25% with $13.72M in volume. Notably, recent hourly volume is tracking at just 0.29x the daily average, signaling a temporary contraction in participation.
A reclaim of the $137.47 high would suggest shifting momentum back to the buyers. Conversely, sliding below the $129.04 range floor would invalidate the current stabilization phase.
Will the lack of volume confirm a bottom, or are we awaiting a deeper test of the range lows?
Tap $MSTRB for the live chart. #MSTRB #BinanceSquare
Is $MSTRB finding firm footing after today’s cooling off?
The asset currently trades at $131.36, down 1.25% with $13.72M in volume. Notably, recent hourly volume is tracking at just 0.29x the daily average, signaling a temporary contraction in participation.
A reclaim of the $137.47 high would suggest shifting momentum back to the buyers. Conversely, sliding below the $129.04 range floor would invalidate the current stabilization phase.
Will the lack of volume confirm a bottom, or are we awaiting a deeper test of the range lows?
Tap $MSTRB for the live chart. #MSTRB #BinanceSquare
The asset currently trades at $131.36, down 1.25% with $13.72M in volume. Notably, recent hourly volume is tracking at just 0.29x the daily average, signaling a temporary contraction in participation.
A reclaim of the $137.47 high would suggest shifting momentum back to the buyers. Conversely, sliding below the $129.04 range floor would invalidate the current stabilization phase.
Will the lack of volume confirm a bottom, or are we awaiting a deeper test of the range lows?
Tap $MSTRB for the live chart. #MSTRB #BinanceSquare
·
--
$MSTRB — Short Setup | Market Analysis
MSTRBUSDT is currently experiencing significant selling pressure, indicated by a notable -3.057% decline over the past 24 hours. This strong negative price movement, combined with robust trading volume, suggests a continuation of the downtrend. A short position is strategically favored to capture potential further downside.
Market Context
24h Change: -3.06%
24h Volume: 15.3M USDT
Trade Plan
Entry: 130.03
Stop Loss: 132.65
TP1: 127.45
TP2: 125
TP3: 122.5
⚖️ Risk:Reward (TP1) 1:0.98
Confirmation Trigger: Current bearish momentum persists below entry
Risk Note: Trading MSTRBUSDT carries inherent volatility risks; strict adherence to the stop loss is crucial to manage potential adverse movements.
Protect your capital first, profits follow.
#MSTRB #mstrb
$MSTRB — Short Setup | Market Analysis
MSTRBUSDT is currently experiencing significant selling pressure, indicated by a notable -3.057% decline over the past 24 hours. This strong negative price movement, combined with robust trading volume, suggests a continuation of the downtrend. A short position is strategically favored to capture potential further downside.
Market Context
24h Change: -3.06%
24h Volume: 15.3M USDT
Trade Plan
Entry: 130.03
Stop Loss: 132.65
TP1: 127.45
TP2: 125
TP3: 122.5
⚖️ Risk:Reward (TP1) 1:0.98
Confirmation Trigger: Current bearish momentum persists below entry
Risk Note: Trading MSTRBUSDT carries inherent volatility risks; strict adherence to the stop loss is crucial to manage potential adverse movements.
Protect your capital first, profits follow.
#MSTRB #mstrb
MSTRBUSDT is currently experiencing significant selling pressure, indicated by a notable -3.057% decline over the past 24 hours. This strong negative price movement, combined with robust trading volume, suggests a continuation of the downtrend. A short position is strategically favored to capture potential further downside.
Market Context
24h Change: -3.06%
24h Volume: 15.3M USDT
Trade Plan
Entry: 130.03
Stop Loss: 132.65
TP1: 127.45
TP2: 125
TP3: 122.5
⚖️ Risk:Reward (TP1) 1:0.98
Confirmation Trigger: Current bearish momentum persists below entry
Risk Note: Trading MSTRBUSDT carries inherent volatility risks; strict adherence to the stop loss is crucial to manage potential adverse movements.
Protect your capital first, profits follow.
#MSTRB #mstrb
2

·
--
Bearish
$MSTRB
1H — SHORT 🔻 plan
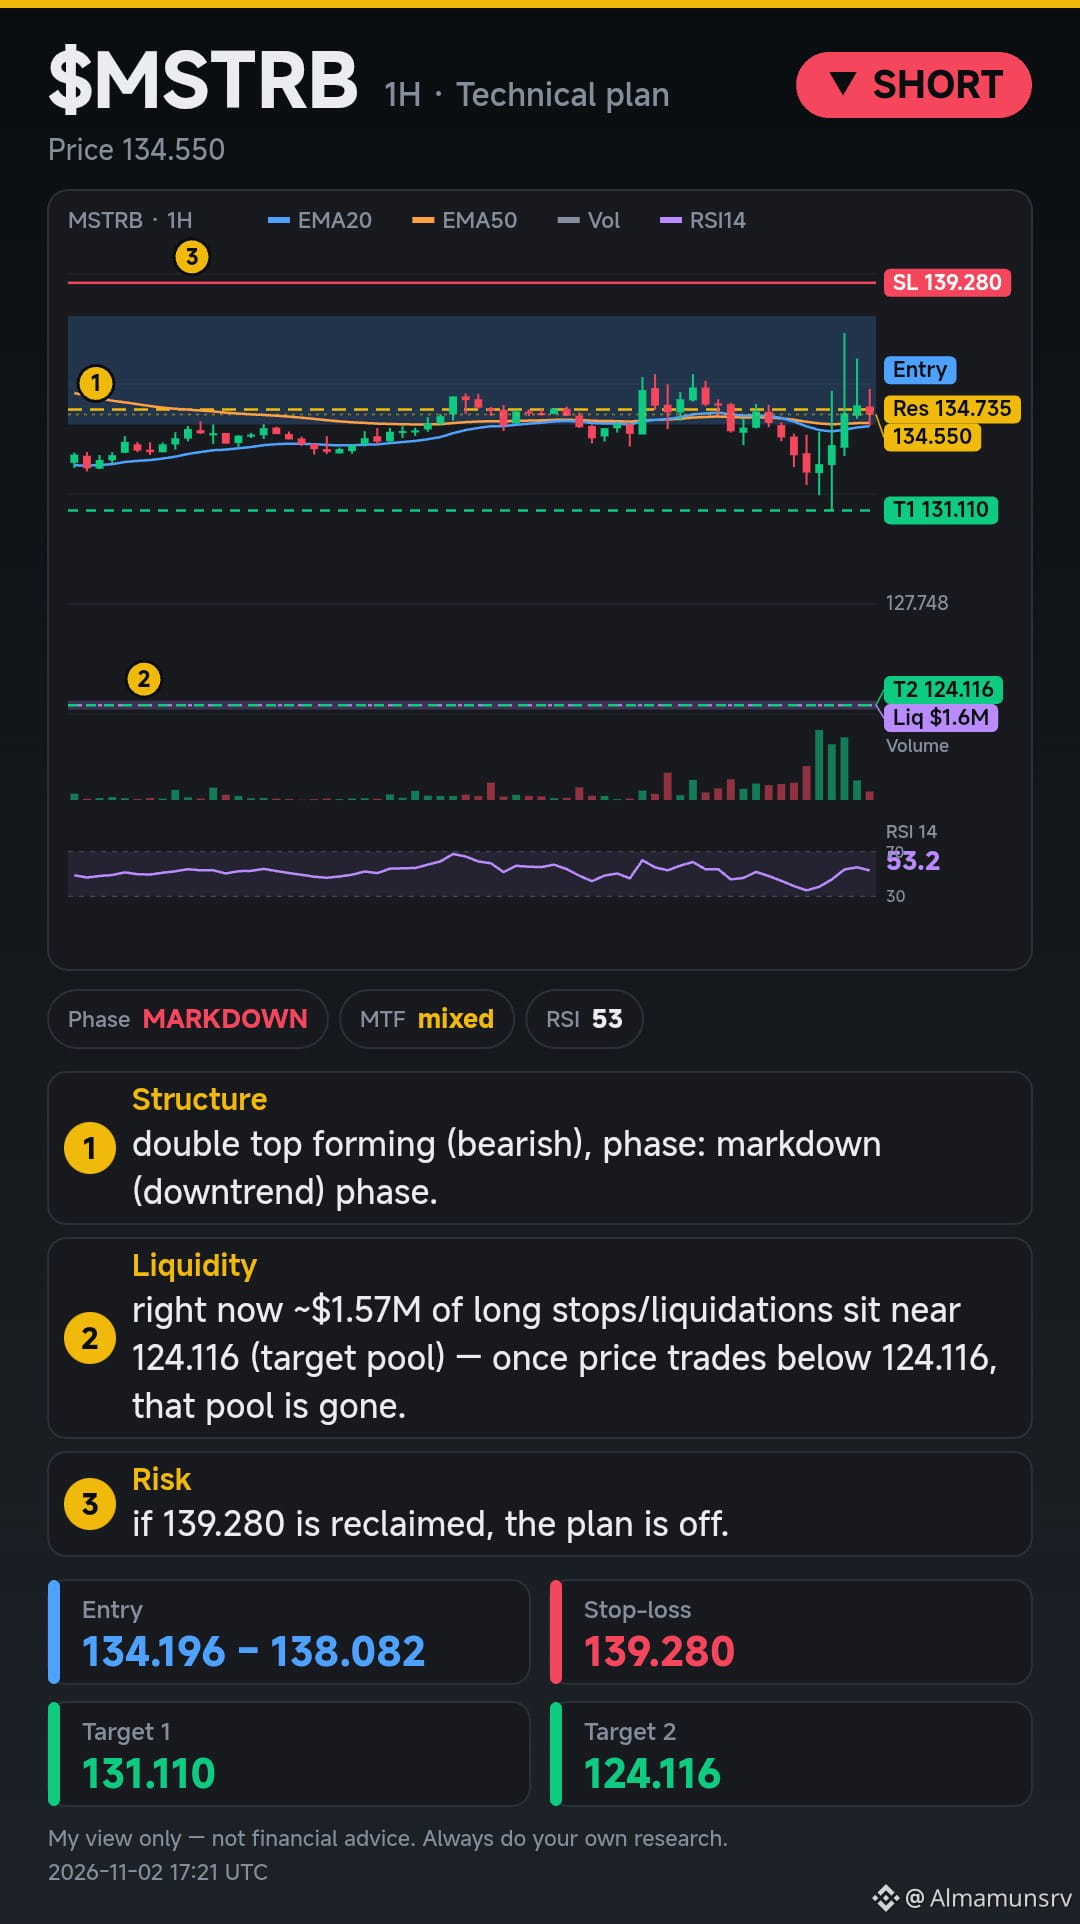
1) Structure: double top forming (bearish), phase: markdown (downtrend) phase.
2) Liquidity: right now ~$1.57M of long stops/liquidations sit near 124.116 (target pool) — once price trades below 124.116, that pool is gone.
3) Risk: if 139.280 is reclaimed, the plan is off.
📍 Entry: 134.196 – 138.082
🎯 Target 1: 131.110
🎯 Target 2: 124.116
🛑 Stop-loss: 139.280
Not financial advice — DYOR. #mstrb
{future}(MSTRUSDT)
$MSTRB
1H — SHORT 🔻 plan
1) Structure: double top forming (bearish), phase: markdown (downtrend) phase.
2) Liquidity: right now ~$1.57M of long stops/liquidations sit near 124.116 (target pool) — once price trades below 124.116, that pool is gone.
3) Risk: if 139.280 is reclaimed, the plan is off.
📍 Entry: 134.196 – 138.082
🎯 Target 1: 131.110
🎯 Target 2: 124.116
🛑 Stop-loss: 139.280
Not financial advice — DYOR. #mstrb
1H — SHORT 🔻 plan
1) Structure: double top forming (bearish), phase: markdown (downtrend) phase.
2) Liquidity: right now ~$1.57M of long stops/liquidations sit near 124.116 (target pool) — once price trades below 124.116, that pool is gone.
3) Risk: if 139.280 is reclaimed, the plan is off.
📍 Entry: 134.196 – 138.082
🎯 Target 1: 131.110
🎯 Target 2: 124.116
🛑 Stop-loss: 139.280
Not financial advice — DYOR. #mstrb
1
25


🔎 A short‑term pulse on MSTRB feels like a breezy tug‑of‑war 🌬️
Short $MSTRB
– Entry: 132.63 – 132.91
– Stop Loss: 135.00
– TP1: 130.27
– TP2: 127.90
– TP3: 125.53
– TP4: 123.17
– TP5: 120.80
The chart hints at a dip, yet the EMA lines whisper a possible bounce. With momentum wavering, the next move stays hazy – will the price find a lower floor or swing back? 🤔
Not financial advice.
#MSTRB #CryptoTalk #TradingInsights #Write2Earn
🔎 A short‑term pulse on MSTRB feels like a breezy tug‑of‑war 🌬️
Short $MSTRB
– Entry: 132.63 – 132.91
– Stop Loss: 135.00
– TP1: 130.27
– TP2: 127.90
– TP3: 125.53
– TP4: 123.17
– TP5: 120.80
The chart hints at a dip, yet the EMA lines whisper a possible bounce. With momentum wavering, the next move stays hazy – will the price find a lower floor or swing back? 🤔
Not financial advice.
#MSTRB #CryptoTalk #TradingInsights #Write2Earn
Short $MSTRB
– Entry: 132.63 – 132.91
– Stop Loss: 135.00
– TP1: 130.27
– TP2: 127.90
– TP3: 125.53
– TP4: 123.17
– TP5: 120.80
The chart hints at a dip, yet the EMA lines whisper a possible bounce. With momentum wavering, the next move stays hazy – will the price find a lower floor or swing back? 🤔
Not financial advice.
#MSTRB #CryptoTalk #TradingInsights #Write2Earn
114

·
--
Market Opportunity Is Building!
$MSTRB and $GOOGLB bring two different investment narratives into focus. With market attention shifting, both deserve a closer look from active traders.
Watch key price levels, catch potential breakouts, and trade with a clear strategy. Stay sharp, manage risk, and never miss the signal!
#MSTRB #GOOGLB #BinanceUpdatesProofofReservesAddresses
{spot}(MSTRBUSDT)
{spot}(GOOGLBUSDT)
Market Opportunity Is Building!
$MSTRB and $GOOGLB bring two different investment narratives into focus. With market attention shifting, both deserve a closer look from active traders.
Watch key price levels, catch potential breakouts, and trade with a clear strategy. Stay sharp, manage risk, and never miss the signal!
#MSTRB #GOOGLB #BinanceUpdatesProofofReservesAddresses
$MSTRB and $GOOGLB bring two different investment narratives into focus. With market attention shifting, both deserve a closer look from active traders.
Watch key price levels, catch potential breakouts, and trade with a clear strategy. Stay sharp, manage risk, and never miss the signal!
#MSTRB #GOOGLB #BinanceUpdatesProofofReservesAddresses
1
173

🚨 $MSTRB EXHAUSTION REJECTION FROM 142 CRACKING STRUCTURE FOR A VERTICAL DROPOFF 🔻
Entry: 135.50 - 136.20 ⚡
Target: 133.50 - 127.50 🎯
Stop Loss: 138.20 🛑
The aggressive rejection from 142.16 stamped out buyer momentum entirely, trapping late bulls into a textbook cascade of lower highs. 📉 Market structure has snapped cleanly, signaling a heavy shift as aggressive sell volume takes command of the tape.
A decisive crack under 135 strips away the final line of local defense, paving the way for a rapid slide toward the 127 liquidity pocket. 📊 Momentum belongs strictly to the bears right now as bid depth evaporates.
💬 Are you shorting this breakdown acceleration or waiting for the flush to complete below support? 👇
⚠️ Not financial advice. Always manage your risk. 🛡️
🏷️ #MSTRB #ShortSetup #Bearish #MarketUpdate #Crypto
📉 🔻
🚨 $MSTRB EXHAUSTION REJECTION FROM 142 CRACKING STRUCTURE FOR A VERTICAL DROPOFF 🔻
Entry: 135.50 - 136.20 ⚡
Target: 133.50 - 127.50 🎯
Stop Loss: 138.20 🛑
The aggressive rejection from 142.16 stamped out buyer momentum entirely, trapping late bulls into a textbook cascade of lower highs. 📉 Market structure has snapped cleanly, signaling a heavy shift as aggressive sell volume takes command of the tape.
A decisive crack under 135 strips away the final line of local defense, paving the way for a rapid slide toward the 127 liquidity pocket. 📊 Momentum belongs strictly to the bears right now as bid depth evaporates.
💬 Are you shorting this breakdown acceleration or waiting for the flush to complete below support? 👇
⚠️ Not financial advice. Always manage your risk. 🛡️
🏷️ #MSTRB #ShortSetup #Bearish #MarketUpdate #Crypto
📉 🔻
Entry: 135.50 - 136.20 ⚡
Target: 133.50 - 127.50 🎯
Stop Loss: 138.20 🛑
The aggressive rejection from 142.16 stamped out buyer momentum entirely, trapping late bulls into a textbook cascade of lower highs. 📉 Market structure has snapped cleanly, signaling a heavy shift as aggressive sell volume takes command of the tape.
A decisive crack under 135 strips away the final line of local defense, paving the way for a rapid slide toward the 127 liquidity pocket. 📊 Momentum belongs strictly to the bears right now as bid depth evaporates.
💬 Are you shorting this breakdown acceleration or waiting for the flush to complete below support? 👇
⚠️ Not financial advice. Always manage your risk. 🛡️
🏷️ #MSTRB #ShortSetup #Bearish #MarketUpdate #Crypto
📉 🔻

·
--
Strategy plans to issue up to $1.66 billion in Series A preferred stock
Have you seen this yet? There’s a lot of news today, but this one is definitely worth discussing!
Things seem calm on the surface, but what’s worth paying attention to is the direction behind it.
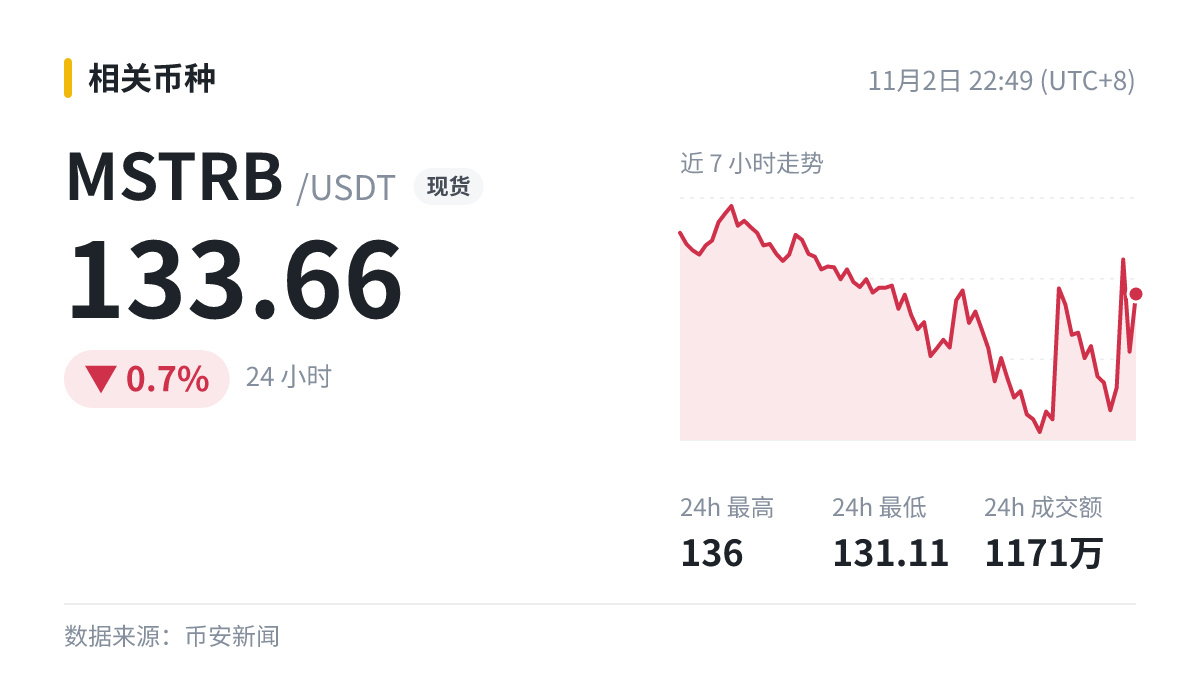
$MSTRB latest: 133.66, intraday: -0.7%
#MSTRB
These views are for discussion only. You are responsible for your own gains and losses.
Strategy plans to issue up to $1.66 billion in Series A preferred stock
Have you seen this yet? There’s a lot of news today, but this one is definitely worth discussing!
Things seem calm on the surface, but what’s worth paying attention to is the direction behind it.
$MSTRB latest: 133.66, intraday: -0.7%
#MSTRB
These views are for discussion only. You are responsible for your own gains and losses.
Have you seen this yet? There’s a lot of news today, but this one is definitely worth discussing!
Things seem calm on the surface, but what’s worth paying attention to is the direction behind it.
$MSTRB latest: 133.66, intraday: -0.7%
#MSTRB
These views are for discussion only. You are responsible for your own gains and losses.

Short-term bearish; the market seems to be tilting downward 🚀
Based on the current chart, the price has fallen below a key moving average, forming a clear downward channel 📉. If weakness continues, it may test the previous support zone; conversely, a short-term rebound that breaks above resistance would invalidate this bearish setup. The RSI is at a low level, suggesting selling pressure remains, but also indicating limited room for a short-term bounce. The MACD bearish crossover further confirms the downward momentum. What do you think are the chances of a breakout from this range? 🤔
Bearish $MSTRB
Entry: 132.57 – 132.97 • Stop Loss: 136.10 • TP1: 129.04 • TP2: 125.51 • TP3: 121.98 • TP4: 118.45 • TP5: 114.92
This is not investment advice.
#MSTRB #加密分析 #空头布局 #技术走势 #Write2Earn
Short-term bearish; the market seems to be tilting downward 🚀
Based on the current chart, the price has fallen below a key moving average, forming a clear downward channel 📉. If weakness continues, it may test the previous support zone; conversely, a short-term rebound that breaks above resistance would invalidate this bearish setup. The RSI is at a low level, suggesting selling pressure remains, but also indicating limited room for a short-term bounce. The MACD bearish crossover further confirms the downward momentum. What do you think are the chances of a breakout from this range? 🤔
Bearish $MSTRB
Entry: 132.57 – 132.97 • Stop Loss: 136.10 • TP1: 129.04 • TP2: 125.51 • TP3: 121.98 • TP4: 118.45 • TP5: 114.92
This is not investment advice.
#MSTRB #加密分析 #空头布局 #技术走势 #Write2Earn
Based on the current chart, the price has fallen below a key moving average, forming a clear downward channel 📉. If weakness continues, it may test the previous support zone; conversely, a short-term rebound that breaks above resistance would invalidate this bearish setup. The RSI is at a low level, suggesting selling pressure remains, but also indicating limited room for a short-term bounce. The MACD bearish crossover further confirms the downward momentum. What do you think are the chances of a breakout from this range? 🤔
Bearish $MSTRB
Entry: 132.57 – 132.97 • Stop Loss: 136.10 • TP1: 129.04 • TP2: 125.51 • TP3: 121.98 • TP4: 118.45 • TP5: 114.92
This is not investment advice.
#MSTRB #加密分析 #空头布局 #技术走势 #Write2Earn
4

810 BTC added to a stash of 849,327 increases it by just 0.095%. What this figure really means is not “Strategy bought again,” but “this purchase no longer provides any information.”
I. Marginal buying has exited price discovery
At its current holdings, 810 BTC is less than the amount the market can easily absorb through its ordinary daily fluctuations. In the past, the market treated Saylor’s accumulation announcements as directional signals because the base was smaller and the pace was faster; every purchase represented genuine new demand. Now, with a core holding of 849,000 BTC, the same action has almost no marginal impact on spot prices—it can’t even move a decent one-minute candle. Strategy’s buying pace has been downgraded from a price driver to a footnote on sentiment.
II. Pricing power has shifted back to the premium or discount
MSTRB’s share price has never been a mirror image of BTC. It is “the net asset value of its holdings × the multiple the market is willing to pay.” That multiple is the core of the entire model: when the premium is high, issuing shares to buy BTC creates value, because each share represents more coins; when the premium narrows toward net asset value, the same share issuance becomes dilutive. So what matters now is not how many posts Saylor has made, but whether MSTRB still trades at a premium to its net asset value. 810 BTC is not enough to support a premium or erase one; it is neutral to valuation itself.
III. The narrative is shifting from “how much can they buy?” to “can they still buy?”
With oil prices and inflation risks back in the spotlight, Strategy’s continued talk of buying carries weight as a narrative, but it is already outdated as a pricing signal. Early on, the market cared about “how much he bought”; now it cares about “on what terms can he still raise financing to buy?” The former depends on Bitcoin; the latter depends on MSTRB’s own share price. When a single purchase is as small as 0.095%, an announcement naturally shifts from signaling incremental demand to signaling financing capacity—and financing capacity is a function of the share price, not the coin price. This also means that each future buying headline of the same kind will have a weaker impact on the market.
IV. The risk lies on the discount side
If BTC moves sideways, net asset value stays flat, while preferred stock dividends and various financing costs still have to be paid. The support for the premium will gradually wear away. Once the premium turns into a discount, the logic of issuing shares to buy coins runs in reverse: the more shares issued, the fewer coins each share represents, and the harder it is to close the discount. This cycle doesn’t need a sharp Bitcoin sell-off to begin; a sideways market and time are enough. Another easily overlooked point is that as holdings approach 850,000 BTC, the marginal contribution of each additional purchase to the amount of BTC per share keeps diminishing, while the premium investors pay does not automatically diminish along with it.
So for MSTRB, 810 BTC should be read as one message: stop treating accumulation announcements as trading signals; look at its multiple relative to net asset value and at how loose or tight its financing terms are. What usually costs you money isn’t Saylor buying too little, but paying full price for a premium that is narrowing. In terms of positioning, when the premium expands, it behaves like leveraged BTC; when the premium contracts, it is a holding company that has to pay financing costs. The risk-reward is completely different in those two states, so don’t use the same position size to deal with both.
#MSTRB #MSTR #Crypto
810 BTC added to a stash of 849,327 increases it by just 0.095%. What this figure really means is not “Strategy bought again,” but “this purchase no longer provides any information.”
I. Marginal buying has exited price discovery
At its current holdings, 810 BTC is less than the amount the market can easily absorb through its ordinary daily fluctuations. In the past, the market treated Saylor’s accumulation announcements as directional signals because the base was smaller and the pace was faster; every purchase represented genuine new demand. Now, with a core holding of 849,000 BTC, the same action has almost no marginal impact on spot prices—it can’t even move a decent one-minute candle. Strategy’s buying pace has been downgraded from a price driver to a footnote on sentiment.
II. Pricing power has shifted back to the premium or discount
MSTRB’s share price has never been a mirror image of BTC. It is “the net asset value of its holdings × the multiple the market is willing to pay.” That multiple is the core of the entire model: when the premium is high, issuing shares to buy BTC creates value, because each share represents more coins; when the premium narrows toward net asset value, the same share issuance becomes dilutive. So what matters now is not how many posts Saylor has made, but whether MSTRB still trades at a premium to its net asset value. 810 BTC is not enough to support a premium or erase one; it is neutral to valuation itself.
III. The narrative is shifting from “how much can they buy?” to “can they still buy?”
With oil prices and inflation risks back in the spotlight, Strategy’s continued talk of buying carries weight as a narrative, but it is already outdated as a pricing signal. Early on, the market cared about “how much he bought”; now it cares about “on what terms can he still raise financing to buy?” The former depends on Bitcoin; the latter depends on MSTRB’s own share price. When a single purchase is as small as 0.095%, an announcement naturally shifts from signaling incremental demand to signaling financing capacity—and financing capacity is a function of the share price, not the coin price. This also means that each future buying headline of the same kind will have a weaker impact on the market.
IV. The risk lies on the discount side
If BTC moves sideways, net asset value stays flat, while preferred stock dividends and various financing costs still have to be paid. The support for the premium will gradually wear away. Once the premium turns into a discount, the logic of issuing shares to buy coins runs in reverse: the more shares issued, the fewer coins each share represents, and the harder it is to close the discount. This cycle doesn’t need a sharp Bitcoin sell-off to begin; a sideways market and time are enough. Another easily overlooked point is that as holdings approach 850,000 BTC, the marginal contribution of each additional purchase to the amount of BTC per share keeps diminishing, while the premium investors pay does not automatically diminish along with it.
So for MSTRB, 810 BTC should be read as one message: stop treating accumulation announcements as trading signals; look at its multiple relative to net asset value and at how loose or tight its financing terms are. What usually costs you money isn’t Saylor buying too little, but paying full price for a premium that is narrowing. In terms of positioning, when the premium expands, it behaves like leveraged BTC; when the premium contracts, it is a holding company that has to pay financing costs. The risk-reward is completely different in those two states, so don’t use the same position size to deal with both.
#MSTRB #MSTR #Crypto
I. Marginal buying has exited price discovery
At its current holdings, 810 BTC is less than the amount the market can easily absorb through its ordinary daily fluctuations. In the past, the market treated Saylor’s accumulation announcements as directional signals because the base was smaller and the pace was faster; every purchase represented genuine new demand. Now, with a core holding of 849,000 BTC, the same action has almost no marginal impact on spot prices—it can’t even move a decent one-minute candle. Strategy’s buying pace has been downgraded from a price driver to a footnote on sentiment.
II. Pricing power has shifted back to the premium or discount
MSTRB’s share price has never been a mirror image of BTC. It is “the net asset value of its holdings × the multiple the market is willing to pay.” That multiple is the core of the entire model: when the premium is high, issuing shares to buy BTC creates value, because each share represents more coins; when the premium narrows toward net asset value, the same share issuance becomes dilutive. So what matters now is not how many posts Saylor has made, but whether MSTRB still trades at a premium to its net asset value. 810 BTC is not enough to support a premium or erase one; it is neutral to valuation itself.
III. The narrative is shifting from “how much can they buy?” to “can they still buy?”
With oil prices and inflation risks back in the spotlight, Strategy’s continued talk of buying carries weight as a narrative, but it is already outdated as a pricing signal. Early on, the market cared about “how much he bought”; now it cares about “on what terms can he still raise financing to buy?” The former depends on Bitcoin; the latter depends on MSTRB’s own share price. When a single purchase is as small as 0.095%, an announcement naturally shifts from signaling incremental demand to signaling financing capacity—and financing capacity is a function of the share price, not the coin price. This also means that each future buying headline of the same kind will have a weaker impact on the market.
IV. The risk lies on the discount side
If BTC moves sideways, net asset value stays flat, while preferred stock dividends and various financing costs still have to be paid. The support for the premium will gradually wear away. Once the premium turns into a discount, the logic of issuing shares to buy coins runs in reverse: the more shares issued, the fewer coins each share represents, and the harder it is to close the discount. This cycle doesn’t need a sharp Bitcoin sell-off to begin; a sideways market and time are enough. Another easily overlooked point is that as holdings approach 850,000 BTC, the marginal contribution of each additional purchase to the amount of BTC per share keeps diminishing, while the premium investors pay does not automatically diminish along with it.
So for MSTRB, 810 BTC should be read as one message: stop treating accumulation announcements as trading signals; look at its multiple relative to net asset value and at how loose or tight its financing terms are. What usually costs you money isn’t Saylor buying too little, but paying full price for a premium that is narrowing. In terms of positioning, when the premium expands, it behaves like leveraged BTC; when the premium contracts, it is a holding company that has to pay financing costs. The risk-reward is completely different in those two states, so don’t use the same position size to deal with both.
#MSTRB #MSTR #Crypto
75

🌀 In the MSTRB market, suspense meets hesitation… Will downward pressure continue, or will an unexpected rebound emerge? 🧐
Tension is rising between traders watching weak momentum indicators and fluctuating support levels, and those who believe negative momentum may open the door to a rebalancing. On one hand, the Relative Strength Index is in a low zone, supporting the possibility of further declines, while the moving average indicates that the price is approaching a resistance level that may be difficult to break. On the other hand, the MACD shows a negative signal that could reinforce the downtrend, but the narrow gap between the averages suggests the market is still fluctuating, potentially allowing for a slight, unexpected rise. So the question remains: Will the price stabilize at support, or break through resistance and move temporarily upward? 🤔
The decision depends on monitoring order flow and traders’ reactions to support and resistance levels. If selling pressure continues, we may see a test of the target low, but any sign of a sudden rebound could quickly restore balance.
$MSTRB short
– Entry: 132.92 – 133.26
– Stop loss: 136.08
– TP1: 129.76
– TP2: 126.61
– TP3: 123.45
– TP4: 120.29
– TP5: 117.13
Not investment advice.
#MSTRB #تحليل_تقني #سوق_العملات #تداول_ذكي #Write2Earn
🌀 In the MSTRB market, suspense meets hesitation… Will downward pressure continue, or will an unexpected rebound emerge? 🧐
Tension is rising between traders watching weak momentum indicators and fluctuating support levels, and those who believe negative momentum may open the door to a rebalancing. On one hand, the Relative Strength Index is in a low zone, supporting the possibility of further declines, while the moving average indicates that the price is approaching a resistance level that may be difficult to break. On the other hand, the MACD shows a negative signal that could reinforce the downtrend, but the narrow gap between the averages suggests the market is still fluctuating, potentially allowing for a slight, unexpected rise. So the question remains: Will the price stabilize at support, or break through resistance and move temporarily upward? 🤔
The decision depends on monitoring order flow and traders’ reactions to support and resistance levels. If selling pressure continues, we may see a test of the target low, but any sign of a sudden rebound could quickly restore balance.
$MSTRB short
– Entry: 132.92 – 133.26
– Stop loss: 136.08
– TP1: 129.76
– TP2: 126.61
– TP3: 123.45
– TP4: 120.29
– TP5: 117.13
Not investment advice.
#MSTRB #تحليل_تقني #سوق_العملات #تداول_ذكي #Write2Earn
Tension is rising between traders watching weak momentum indicators and fluctuating support levels, and those who believe negative momentum may open the door to a rebalancing. On one hand, the Relative Strength Index is in a low zone, supporting the possibility of further declines, while the moving average indicates that the price is approaching a resistance level that may be difficult to break. On the other hand, the MACD shows a negative signal that could reinforce the downtrend, but the narrow gap between the averages suggests the market is still fluctuating, potentially allowing for a slight, unexpected rise. So the question remains: Will the price stabilize at support, or break through resistance and move temporarily upward? 🤔
The decision depends on monitoring order flow and traders’ reactions to support and resistance levels. If selling pressure continues, we may see a test of the target low, but any sign of a sudden rebound could quickly restore balance.
$MSTRB short
– Entry: 132.92 – 133.26
– Stop loss: 136.08
– TP1: 129.76
– TP2: 126.61
– TP3: 123.45
– TP4: 120.29
– TP5: 117.13
Not investment advice.
#MSTRB #تحليل_تقني #سوق_العملات #تداول_ذكي #Write2Earn
5
·
--
🚀 $MSTRB LONG SETUP 🟢
Buyers are stepping in on $MSTRB.
Trade Plan
Entry: 133.84
Stop Loss: 131.83
TP1: 136.52
TP2: 139.2
TP3: 141.87
⚖️ Risk:Reward (TP1) 1:1.33
Trigger: Immediate entry at current market price.
Risk Note: Trading involves substantial risk and is not suitable for all investors. Past performance is not indicative of future results.
Manage your risk and size positions wisely.
#MSTRB #mstrb
🚀 $MSTRB LONG SETUP 🟢
Buyers are stepping in on $MSTRB .
Trade Plan
Entry: 133.84
Stop Loss: 131.83
TP1: 136.52
TP2: 139.2
TP3: 141.87
⚖️ Risk:Reward (TP1) 1:1.33
Trigger: Immediate entry at current market price.
Risk Note: Trading involves substantial risk and is not suitable for all investors. Past performance is not indicative of future results.
Manage your risk and size positions wisely.
#MSTRB #mstrb
Buyers are stepping in on $MSTRB .
Trade Plan
Entry: 133.84
Stop Loss: 131.83
TP1: 136.52
TP2: 139.2
TP3: 141.87
⚖️ Risk:Reward (TP1) 1:1.33
Trigger: Immediate entry at current market price.
Risk Note: Trading involves substantial risk and is not suitable for all investors. Past performance is not indicative of future results.
Manage your risk and size positions wisely.
#MSTRB #mstrb

·
--
$MSTRB is sitting just 0.6 percent below $134.6400 today
An hourly close above that high would open up continuation
A rejection puts the $124.6600 swing low back in play
Do not take my word for it, tap $MSTRB and look at the candles
Break or reject?
#MSTRB #PriceAction
$MSTRB is sitting just 0.6 percent below $134.6400 today
An hourly close above that high would open up continuation
A rejection puts the $124.6600 swing low back in play
Do not take my word for it, tap $MSTRB and look at the candles
Break or reject?
#MSTRB #PriceAction
An hourly close above that high would open up continuation
A rejection puts the $124.6600 swing low back in play
Do not take my word for it, tap $MSTRB and look at the candles
Break or reject?
#MSTRB #PriceAction

$MSTRB: Anchoring Pains in MSTRB
Anchoring bias shifts focus to a single famous level. Think of the initial entry or target remembered during last week’s rally. A buyer who missed the first part may fixate on that old high, ignoring current price action. The market often ignores past glory, marching forward with its own rhythm. A trader staring at that remembered level might feel urgent, then hesitate because the move already occurred. They worry about entry regret and chase high numbers without checking the present order flow.
This mental shortcut alters how daily data is interpreted. Instead of judging strength from today’s movement, the anchored observer compares live action to an obsolete benchmark. The tool becomes a reference to the past rather than a measure of current sentiment. It creates a rigid mental frame that distorts probability and encourages passive waiting while the gap widens. To counter this, adopt a strict rule based only on today’s price behavior. Remove all references to past months or historical targets. Focus exclusively on current relative strength and movement speed. This is a thought experiment, not a personal suggestion, but it reveals that context changes how people act. If you miss a move, that gap does not mandate a change in risk tolerance. You simply execute the original plan. Keep your discipline uniform. Did you abandon your system because of regret? If yes, what principle did you sacrifice to chase comfort?
Probabilistic market research, not a recommendation or guaranteed return.
Would you keep the same rule after missing a move?
#MSTRB #TradingPsychology #CryptoLearning
$MSTRB : Anchoring Pains in MSTRB
Anchoring bias shifts focus to a single famous level. Think of the initial entry or target remembered during last week’s rally. A buyer who missed the first part may fixate on that old high, ignoring current price action. The market often ignores past glory, marching forward with its own rhythm. A trader staring at that remembered level might feel urgent, then hesitate because the move already occurred. They worry about entry regret and chase high numbers without checking the present order flow.
This mental shortcut alters how daily data is interpreted. Instead of judging strength from today’s movement, the anchored observer compares live action to an obsolete benchmark. The tool becomes a reference to the past rather than a measure of current sentiment. It creates a rigid mental frame that distorts probability and encourages passive waiting while the gap widens. To counter this, adopt a strict rule based only on today’s price behavior. Remove all references to past months or historical targets. Focus exclusively on current relative strength and movement speed. This is a thought experiment, not a personal suggestion, but it reveals that context changes how people act. If you miss a move, that gap does not mandate a change in risk tolerance. You simply execute the original plan. Keep your discipline uniform. Did you abandon your system because of regret? If yes, what principle did you sacrifice to chase comfort?
Probabilistic market research, not a recommendation or guaranteed return.
Would you keep the same rule after missing a move?
#MSTRB #TradingPsychology #CryptoLearning
Anchoring bias shifts focus to a single famous level. Think of the initial entry or target remembered during last week’s rally. A buyer who missed the first part may fixate on that old high, ignoring current price action. The market often ignores past glory, marching forward with its own rhythm. A trader staring at that remembered level might feel urgent, then hesitate because the move already occurred. They worry about entry regret and chase high numbers without checking the present order flow.
This mental shortcut alters how daily data is interpreted. Instead of judging strength from today’s movement, the anchored observer compares live action to an obsolete benchmark. The tool becomes a reference to the past rather than a measure of current sentiment. It creates a rigid mental frame that distorts probability and encourages passive waiting while the gap widens. To counter this, adopt a strict rule based only on today’s price behavior. Remove all references to past months or historical targets. Focus exclusively on current relative strength and movement speed. This is a thought experiment, not a personal suggestion, but it reveals that context changes how people act. If you miss a move, that gap does not mandate a change in risk tolerance. You simply execute the original plan. Keep your discipline uniform. Did you abandon your system because of regret? If yes, what principle did you sacrifice to chase comfort?
Probabilistic market research, not a recommendation or guaranteed return.
Would you keep the same rule after missing a move?
#MSTRB #TradingPsychology #CryptoLearning
28

·
--
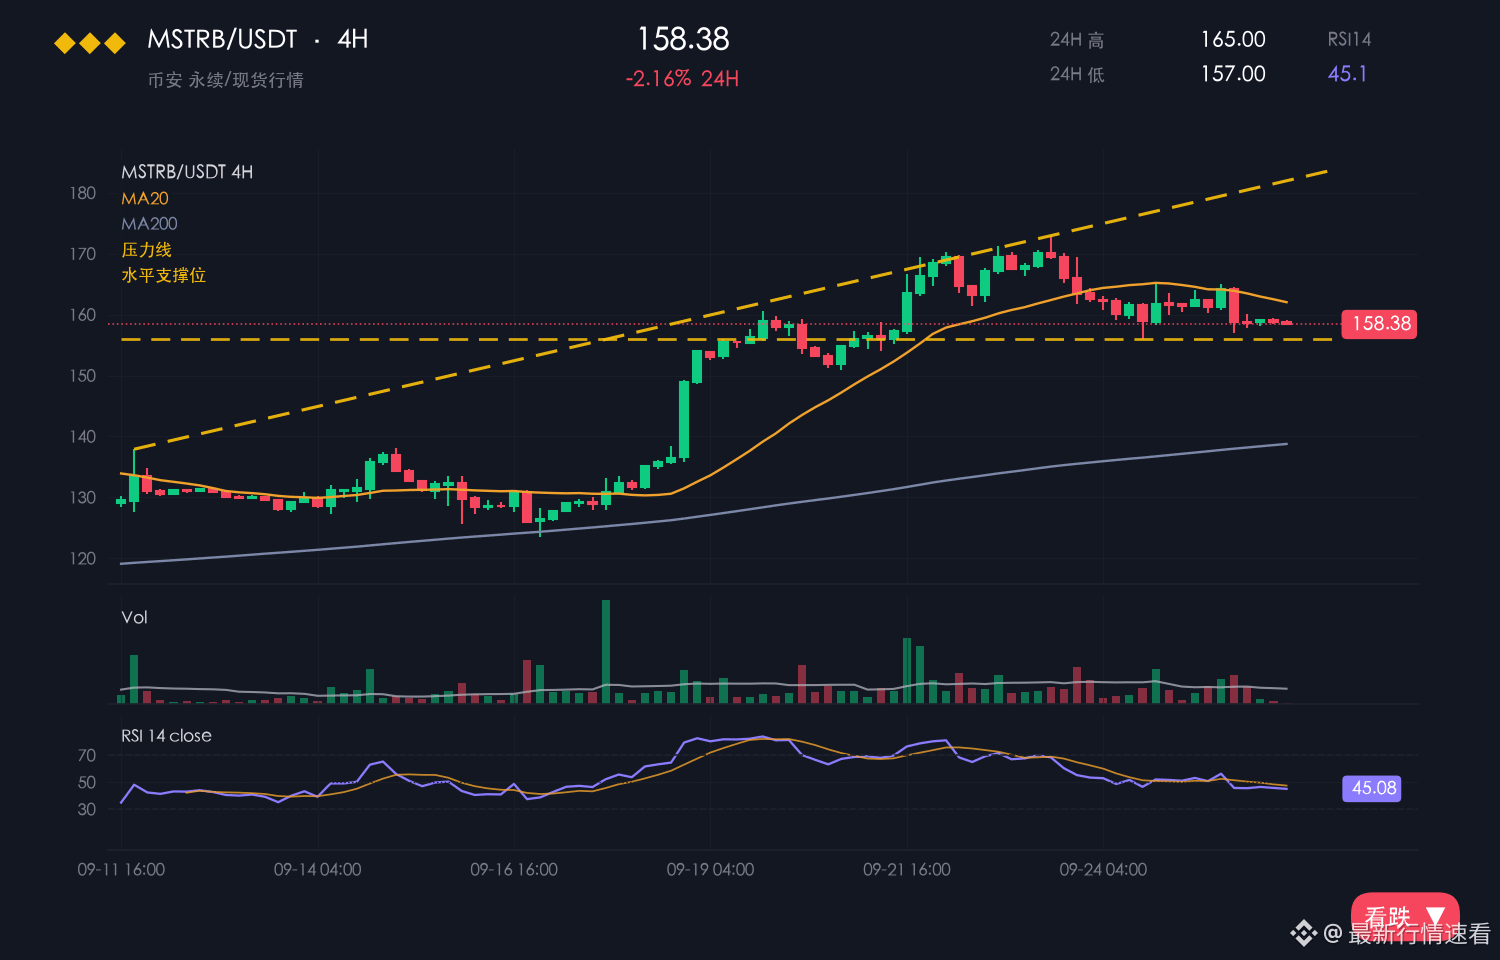
MSTRB is currently at 139.62, down 0.49% over 24 hours and still down 9.00% over 7 days. Its intraday range is 138.86–144.73, with a 4.2% amplitude.
【Market】
GM, the overall market is weak today, and the focus remains on key levels.
MSTRB’s 0.49% decline puts it among the weaker major coins.
This pullback in MSTRB has been limited, with its center of gravity edging lower below 144.73.
The 138.86 support level has not been tested with real money, so confidence is low.
Compared with BTC’s +0.18%, MSTRB is slightly behind, underperforming the broader market by a limited margin.
【Macroeconomics】 U.S. stocks overnight: Nasdaq +0.82%, S&P 500 +0.70% (close on 2026-10-27). BTC ETFs have seen net outflows of about $45.2 billion this month. U.S. CPI came in at 3.7% year over year, above expectations. The probability of an interest rate hike at the 2026-10-27/28 meeting is about 47%. Spot BTC ETFs have seen net outflows of about $45.2 billion this month, as institutional buying dries up.
The short-term outlook leans bearish.
【Bearish Reasons】
Only if 138.86 is accepted as support will weakness be confirmed; 144.73 is the key level in the opposite direction.
Trend-following stocks are the most painful when they catch down, and MSTRB’s 9.00% decline over 7 days may not be enough yet.
Don’t chase or panic; keep a close eye on key levels.
The risk is that a technical rebound could come at any time after the oversold decline, so keep some flexibility in reserve, not just a directional view.
$MSTRB #MSTRB
MSTRB is currently at 139.62, down 0.49% over 24 hours and still down 9.00% over 7 days. Its intraday range is 138.86–144.73, with a 4.2% amplitude.
【Market】
GM, the overall market is weak today, and the focus remains on key levels.
MSTRB’s 0.49% decline puts it among the weaker major coins.
This pullback in MSTRB has been limited, with its center of gravity edging lower below 144.73.
The 138.86 support level has not been tested with real money, so confidence is low.
Compared with BTC’s +0.18%, MSTRB is slightly behind, underperforming the broader market by a limited margin.
【Macroeconomics】 U.S. stocks overnight: Nasdaq +0.82%, S&P 500 +0.70% (close on 2026-10-27). BTC ETFs have seen net outflows of about $45.2 billion this month. U.S. CPI came in at 3.7% year over year, above expectations. The probability of an interest rate hike at the 2026-10-27/28 meeting is about 47%. Spot BTC ETFs have seen net outflows of about $45.2 billion this month, as institutional buying dries up.
The short-term outlook leans bearish.
【Bearish Reasons】
Only if 138.86 is accepted as support will weakness be confirmed; 144.73 is the key level in the opposite direction.
Trend-following stocks are the most painful when they catch down, and MSTRB’s 9.00% decline over 7 days may not be enough yet.
Don’t chase or panic; keep a close eye on key levels.
The risk is that a technical rebound could come at any time after the oversold decline, so keep some flexibility in reserve, not just a directional view.
$MSTRB #MSTRB
【Market】
GM, the overall market is weak today, and the focus remains on key levels.
MSTRB’s 0.49% decline puts it among the weaker major coins.
This pullback in MSTRB has been limited, with its center of gravity edging lower below 144.73.
The 138.86 support level has not been tested with real money, so confidence is low.
Compared with BTC’s +0.18%, MSTRB is slightly behind, underperforming the broader market by a limited margin.
【Macroeconomics】 U.S. stocks overnight: Nasdaq +0.82%, S&P 500 +0.70% (close on 2026-10-27). BTC ETFs have seen net outflows of about $45.2 billion this month. U.S. CPI came in at 3.7% year over year, above expectations. The probability of an interest rate hike at the 2026-10-27/28 meeting is about 47%. Spot BTC ETFs have seen net outflows of about $45.2 billion this month, as institutional buying dries up.
The short-term outlook leans bearish.
【Bearish Reasons】
Only if 138.86 is accepted as support will weakness be confirmed; 144.73 is the key level in the opposite direction.
Trend-following stocks are the most painful when they catch down, and MSTRB’s 9.00% decline over 7 days may not be enough yet.
Don’t chase or panic; keep a close eye on key levels.
The risk is that a technical rebound could come at any time after the oversold decline, so keep some flexibility in reserve, not just a directional view.
$MSTRB #MSTRB
7
·
--
Volume slows dramatically as $MSTRB pulls back to $132.70.
Trading at $132.70 down 2.25% over 24 hours on $25.66M volume, the latest hourly close printed at $132.81. Hourly volume sits at just 0.19x of the recent 23-hour average, signaling compressed participation after touching a session high of $137.32.
If momentum returns above that $137.32 high, buyers could retest upper range bounds. However, failure to hold above the $124.66 low risks opening deeper downside pressure.
Will buyers step in on this low volume, or does a drop below the 124.66 low invalidate the setup?
Tap $MSTRB for the live chart. #MSTRB #BinanceSquare
Volume slows dramatically as $MSTRB pulls back to $132.70.
Trading at $132.70 down 2.25% over 24 hours on $25.66M volume, the latest hourly close printed at $132.81. Hourly volume sits at just 0.19x of the recent 23-hour average, signaling compressed participation after touching a session high of $137.32.
If momentum returns above that $137.32 high, buyers could retest upper range bounds. However, failure to hold above the $124.66 low risks opening deeper downside pressure.
Will buyers step in on this low volume, or does a drop below the 124.66 low invalidate the setup?
Tap $MSTRB for the live chart. #MSTRB #BinanceSquare
Trading at $132.70 down 2.25% over 24 hours on $25.66M volume, the latest hourly close printed at $132.81. Hourly volume sits at just 0.19x of the recent 23-hour average, signaling compressed participation after touching a session high of $137.32.
If momentum returns above that $137.32 high, buyers could retest upper range bounds. However, failure to hold above the $124.66 low risks opening deeper downside pressure.
Will buyers step in on this low volume, or does a drop below the 124.66 low invalidate the setup?
Tap $MSTRB for the live chart. #MSTRB #BinanceSquare
32
·
--
Can $MSTRB defend its recent range after a minor pullback?
At $132.65 down 0.87% with $32.65M volume, price action is pausing.
The latest hourly close ticked up 0.75% to 132.28, though hourly volume sits well below the daily average at 0.28x.
A move back toward the session high near 137.32 could signal bullish continuation, while slipping below the 124.66 range low risks invalidating the setup.
Will buyers step up near current levels, or will volume dry up further before the next major test?
Tap $MSTRB for the live chart. #MSTRB #BinanceSquare
Can $MSTRB defend its recent range after a minor pullback?
At $132.65 down 0.87% with $32.65M volume, price action is pausing.
The latest hourly close ticked up 0.75% to 132.28, though hourly volume sits well below the daily average at 0.28x.
A move back toward the session high near 137.32 could signal bullish continuation, while slipping below the 124.66 range low risks invalidating the setup.
Will buyers step up near current levels, or will volume dry up further before the next major test?
Tap $MSTRB for the live chart. #MSTRB #BinanceSquare
At $132.65 down 0.87% with $32.65M volume, price action is pausing.
The latest hourly close ticked up 0.75% to 132.28, though hourly volume sits well below the daily average at 0.28x.
A move back toward the session high near 137.32 could signal bullish continuation, while slipping below the 124.66 range low risks invalidating the setup.
Will buyers step up near current levels, or will volume dry up further before the next major test?
Tap $MSTRB for the live chart. #MSTRB #BinanceSquare
71
Log in to explore more content
Join global crypto users on Binance Square
⚡️ Get latest and useful information about crypto.
💬 Trusted by the world’s largest crypto exchange.
👍 Discover real insights from verified creators.
Email / Phone number
Trending Topics
1
#USMidterms-WhatAreMarketsExpecting?
155,944 views
1,175 Discussing
2
#USOctoberNFP-AreRateCutsStillPossible
286,000 views
2,214 Discussing
3
#CircleQ3Revenue865M
2,492 views
136 Discussing
4
#AMDBeatsExpectations-AINarrativeContinues
38,122 views
436 Discussing
5
#BinanceIncidentReport
318,483 views
1,625 Discussing
6
#AnthropicIPOPricedDownasInvestorsEye$1.5T
23,049 views
117 Discussing
7
#BoundlessToLaunchTokenizedAIInferencePlan
0 views
15 Discussing
8
#HongKongPassesCryptoAssetReportingFrameworkAmendment
118 views
8 Discussing
9
#37thQuarterlyBNBBurnRemoves1.64MillionBNB
4,214 views
99 Discussing
10
#BinanceReopensWithdrawalsForMoreAssets
408,548 views
2,501 Discussing