

#intw
intw
29,901 views
660 Discussing
Hot
Latest

·
--
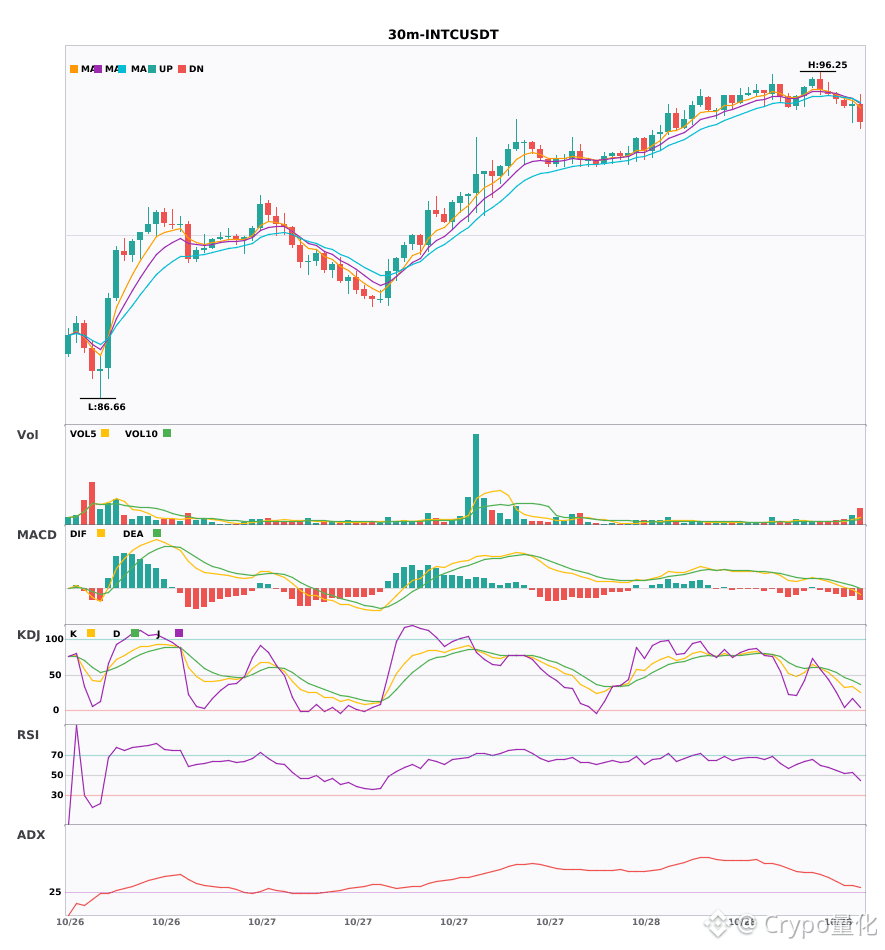
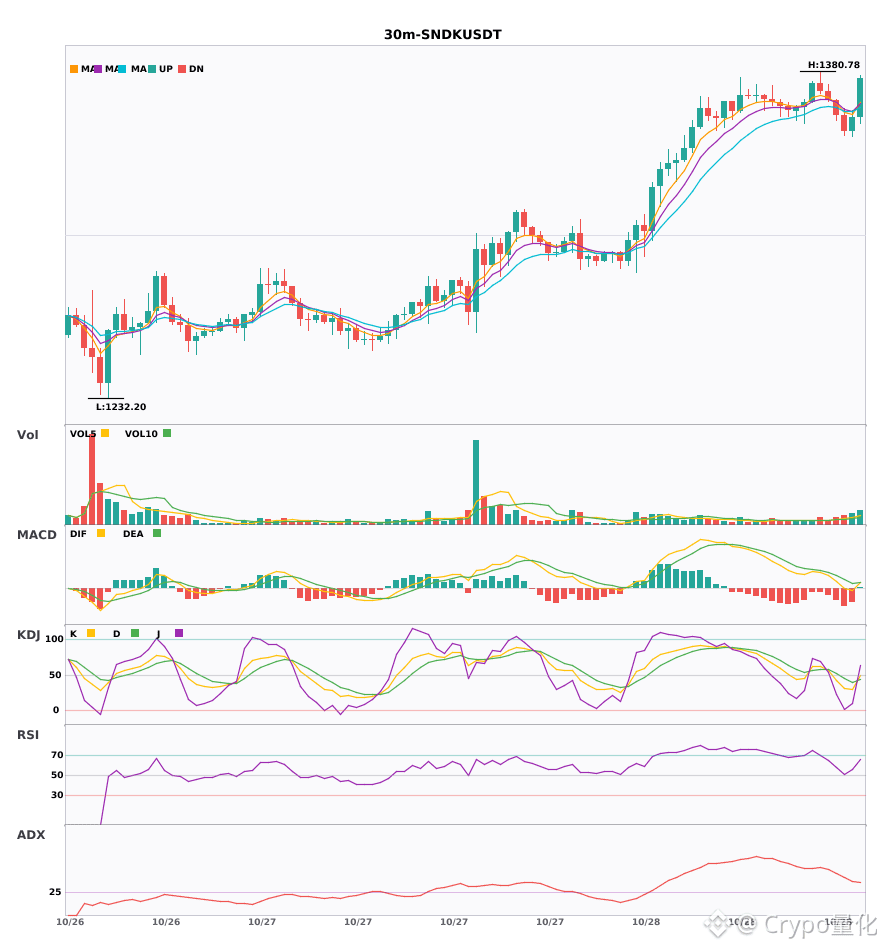
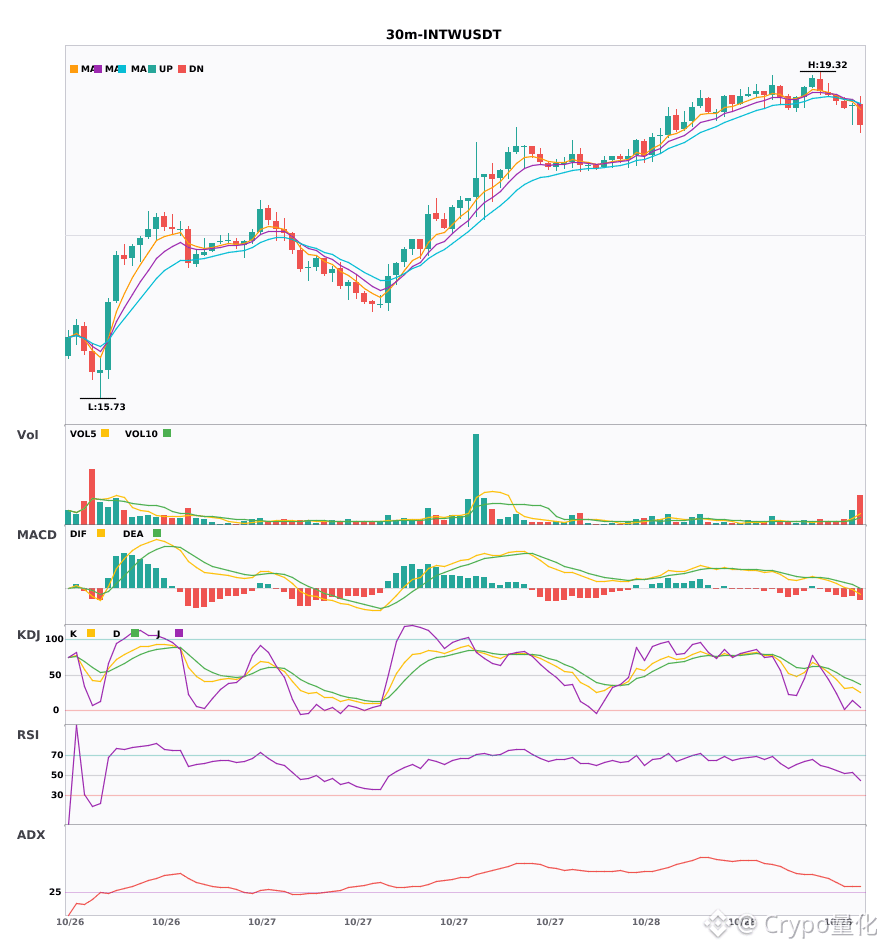
$INTC / $SNDK / $INTW 30-minute chart is bearish, with short-term pressure 🔥
════════════════════
🟢 $INTC 30-minute bearish signal
⚠️Technical analysis: ADX(30) Trend is forming; potential opportunity | MACD DIF fell below zero, signaling a bearish trend | Moving averages are converging, building momentum and about to choose a direction | KDJ is weak, with bears in control (K: 33.6, D: 42.1) | Volume increased (2.2x)
════════════════════
🟢 $SNDK 30-minute bearish signal
⚠️Technical analysis: ADX(35) A clear trending market | MACD DIF fell below zero, signaling a bearish trend | Moving averages are converging, building momentum and about to choose a direction | KDJ is weak, with bears in control (K: 30.1, D: 40.1) | Volume increased (1.9x)
════════════════════
🟢 $INTW 30-minute bearish signal
⚠️Technical analysis: ADX(29) Trend is forming; potential opportunity | MACD DIF fell below zero, signaling a bearish trend | Moving averages are converging, building momentum and about to choose a direction | KDJ is weak, with bears in control (K: 32.6, D: 41.9) | Volume surged (3.2x)
════════════════════
🔔 Follow for first-hand market alerts 🔔
#技术分析 #INTC #SNDK #INTW
📌 When trading, pay attention to whether the candlestick pattern confirms the setup
════════════════════
🟢 $INTC 30-minute bearish signal
⚠️Technical analysis: ADX(30) Trend is forming; potential opportunity | MACD DIF fell below zero, signaling a bearish trend | Moving averages are converging, building momentum and about to choose a direction | KDJ is weak, with bears in control (K: 33.6, D: 42.1) | Volume increased (2.2x)
════════════════════
🟢 $SNDK 30-minute bearish signal
⚠️Technical analysis: ADX(35) A clear trending market | MACD DIF fell below zero, signaling a bearish trend | Moving averages are converging, building momentum and about to choose a direction | KDJ is weak, with bears in control (K: 30.1, D: 40.1) | Volume increased (1.9x)
════════════════════
🟢 $INTW 30-minute bearish signal
⚠️Technical analysis: ADX(29) Trend is forming; potential opportunity | MACD DIF fell below zero, signaling a bearish trend | Moving averages are converging, building momentum and about to choose a direction | KDJ is weak, with bears in control (K: 32.6, D: 41.9) | Volume surged (3.2x)
════════════════════
🔔 Follow for first-hand market alerts 🔔
#技术分析 #INTC #SNDK #INTW
📌 When trading, pay attention to whether the candlestick pattern confirms the setup
12

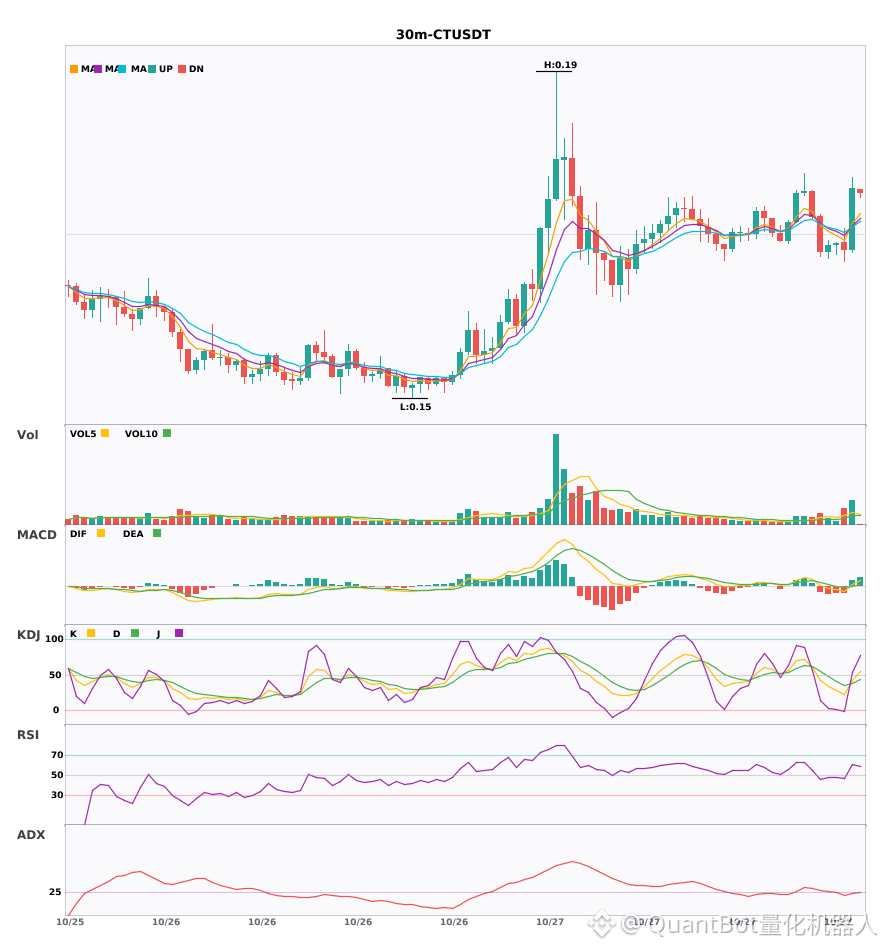
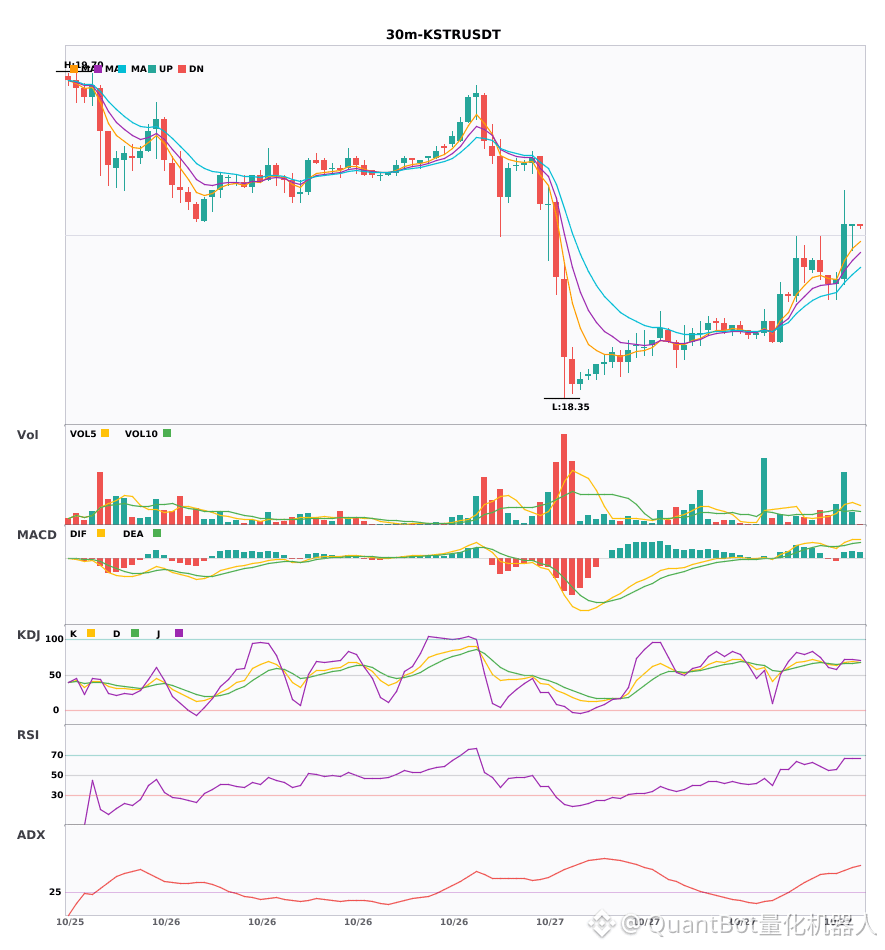
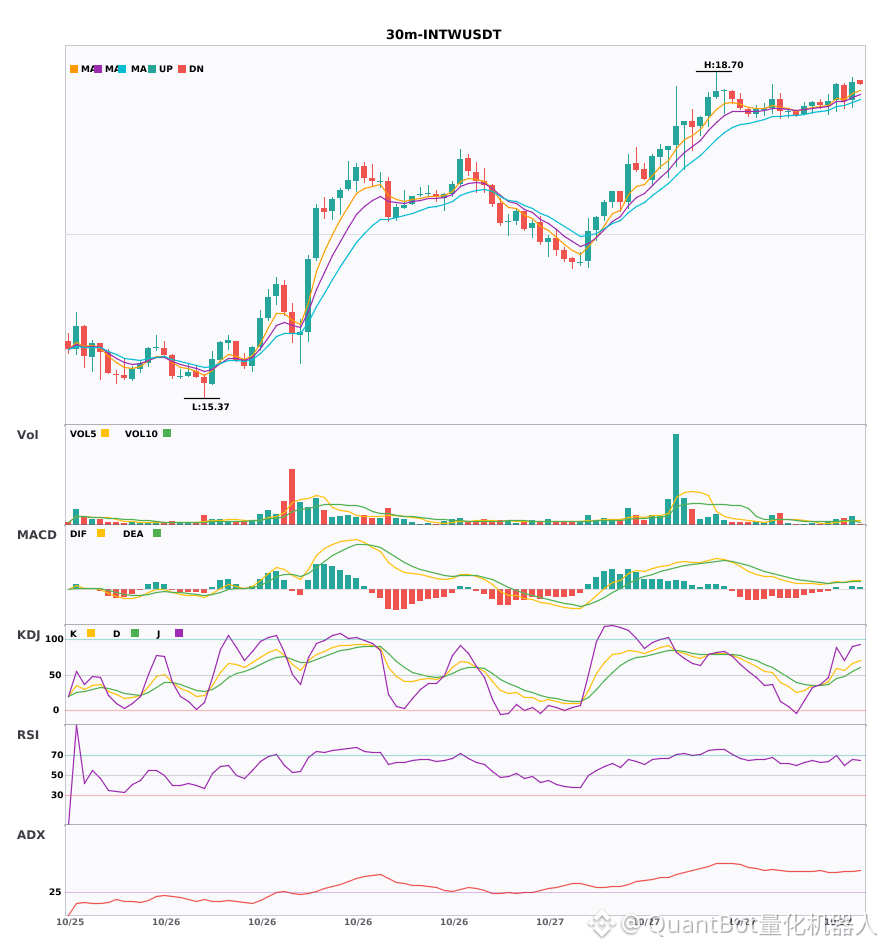
3 simultaneous 30-minute bullish signals: $CT / $KSTR / $INTW
📈 $CT | 30-minute bullish signal
━━━━━━━━━━━━━━━━━━
Technical analysis: ADX(25): Trend is forming; potential entry | MACD bullish crossover above zero, releasing bullish momentum | EMA5 crossed above EMA8, short-term trend turns bullish | KDJ bullish crossover, short-term outlook bullish (K: 43.0, D: 37.8) | Volume surge (2.7x)
Price change: 4.0900%
📈 $KSTR | 30-minute bullish signal
━━━━━━━━━━━━━━━━━━
Technical analysis: ADX(54): Very strong trend (watch for an overheated pullback) | MACD bullish crossover above zero, releasing bullish momentum | EMA5 > EMA8 > EMA13, bullish alignment | KDJ bullish crossover, short-term outlook bullish (K: 67.7, D: 66.0) | Volume surge (3.8x)
Price change: 1.2200%
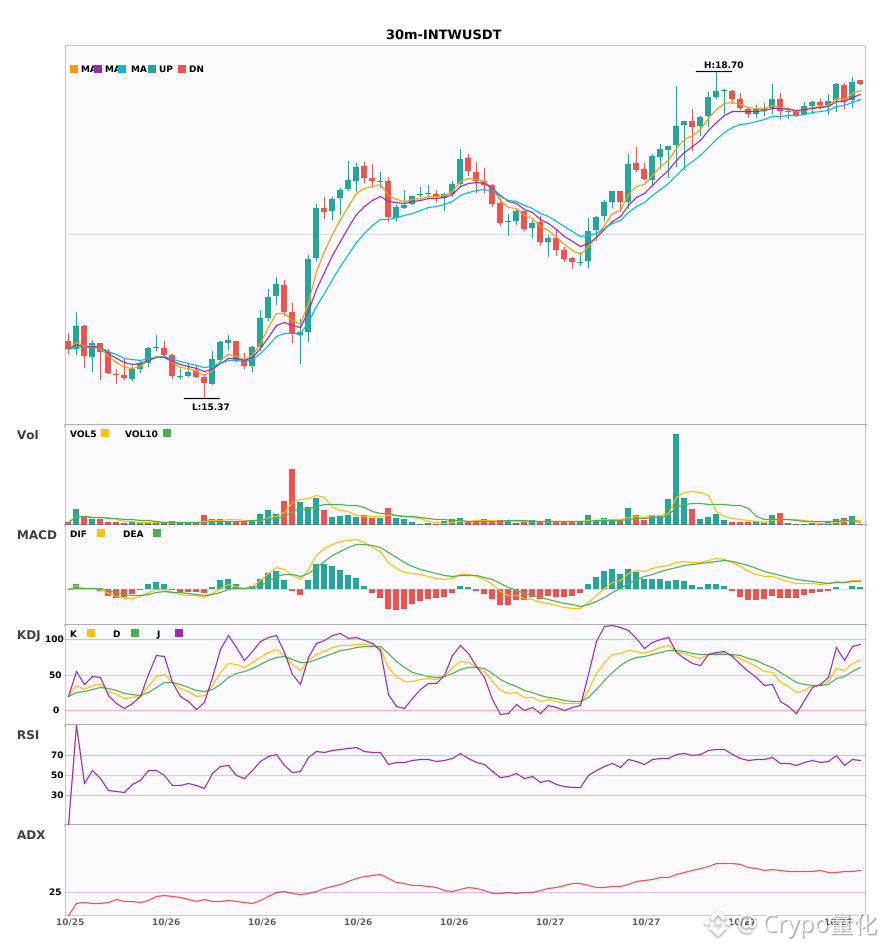
📈 $INTW | 30-minute bullish signal
━━━━━━━━━━━━━━━━━━
Technical analysis: ADX(48): Very strong trend (watch for an overheated pullback) | MACD bullish crossover above zero, releasing bullish momentum | EMA5 > EMA8 > EMA13, bullish alignment | KDJ running strongly, bulls in control (K: 66.5, D: 54.5) | Increased volume (2.1x)
Price change: 1.0900%
━━━━━━━━━━━━━━━━━━
#技术分析 #CT #KSTR #INTW
📌 The above is for reference only and does not constitute investment advice
44
·
--
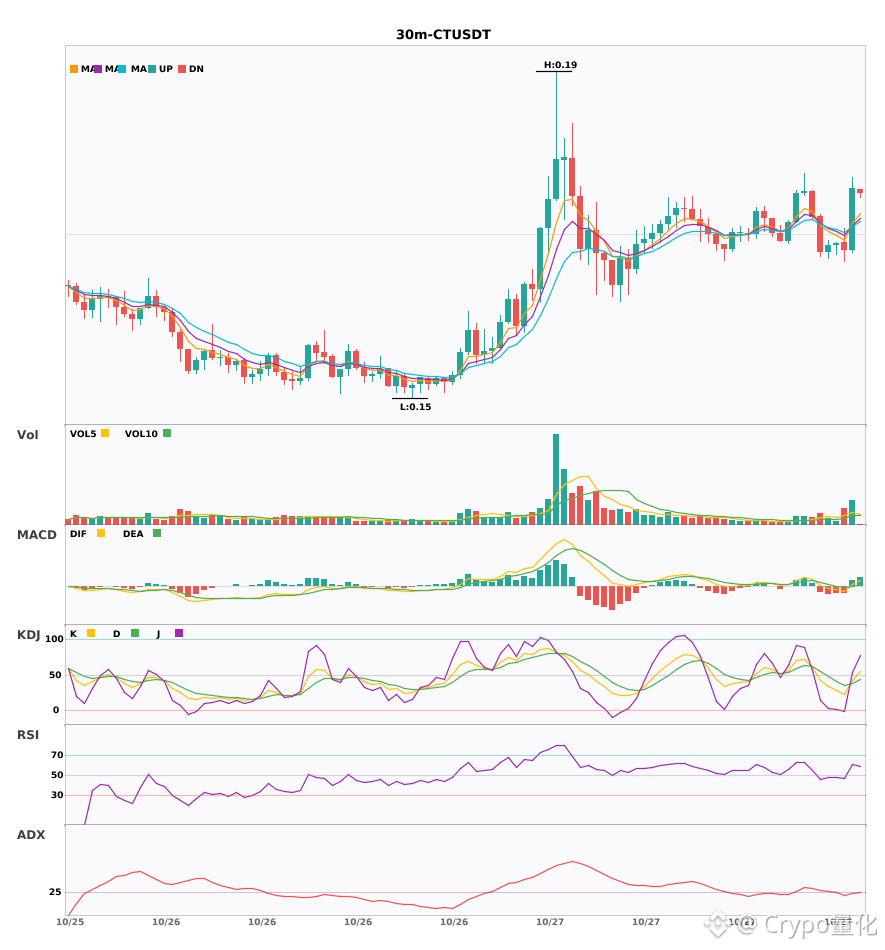
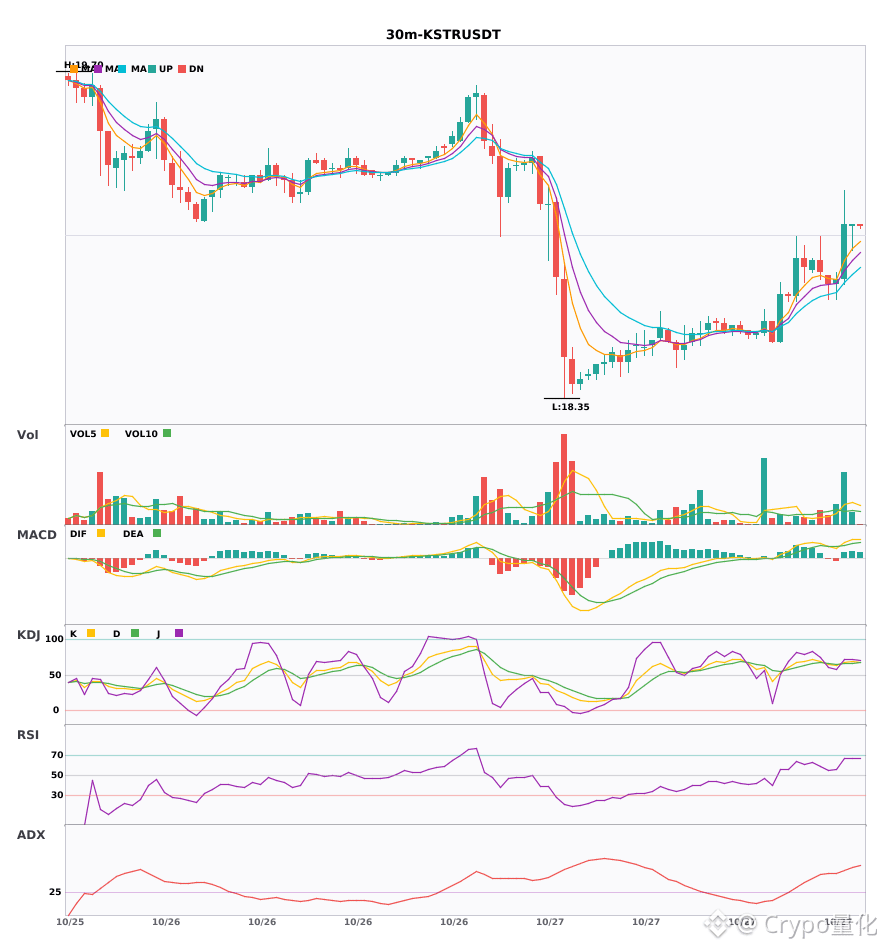
$CT / $KSTR / $INTW 30-minute bullish signals, with short-term confluence opportunities 🔥
════════════════════
🔴 $CT 30-minute bullish signal
⚠️Technical analysis: ADX(25): Trend is forming; opportunity to participate | MACD golden cross above zero, bullish momentum released | EMA5 crossed above EMA8, short-term trend turned bullish | KDJ golden cross, short-term outlook bullish (K: 43.0, D: 37.8) | Volume surge (2.7x)
════════════════════
🔴 $KSTR 30-minute bullish signal
⚠️Technical analysis: ADX(54): Very strong trend (watch for an overheated pullback) | MACD golden cross above zero, bullish momentum released | EMA5 > EMA8 > EMA13, bullish alignment | KDJ golden cross, short-term outlook bullish (K: 67.7, D: 66.0) | Volume surge (3.8x)
════════════════════
🔴 $INTW 30-minute bullish signal
⚠️Technical analysis: ADX(48): Very strong trend (watch for an overheated pullback) | MACD golden cross above zero, bullish momentum released | EMA5 > EMA8 > EMA13, bullish alignment | KDJ showing strong momentum, bulls in control (K: 66.5, D: 54.5) | Increased volume (2.1x)
════════════════════
🔔 Follow for the latest market-moving developments 🔔
#技术分析 #CT #KSTR #INTW
📌 When trading, pay attention to whether the candlestick patterns confirm the signal
════════════════════
🔴 $CT 30-minute bullish signal
⚠️Technical analysis: ADX(25): Trend is forming; opportunity to participate | MACD golden cross above zero, bullish momentum released | EMA5 crossed above EMA8, short-term trend turned bullish | KDJ golden cross, short-term outlook bullish (K: 43.0, D: 37.8) | Volume surge (2.7x)
════════════════════
🔴 $KSTR 30-minute bullish signal
⚠️Technical analysis: ADX(54): Very strong trend (watch for an overheated pullback) | MACD golden cross above zero, bullish momentum released | EMA5 > EMA8 > EMA13, bullish alignment | KDJ golden cross, short-term outlook bullish (K: 67.7, D: 66.0) | Volume surge (3.8x)
════════════════════
🔴 $INTW 30-minute bullish signal
⚠️Technical analysis: ADX(48): Very strong trend (watch for an overheated pullback) | MACD golden cross above zero, bullish momentum released | EMA5 > EMA8 > EMA13, bullish alignment | KDJ showing strong momentum, bulls in control (K: 66.5, D: 54.5) | Increased volume (2.1x)
════════════════════
🔔 Follow for the latest market-moving developments 🔔
#技术分析 #CT #KSTR #INTW
📌 When trading, pay attention to whether the candlestick patterns confirm the signal
68
·
--
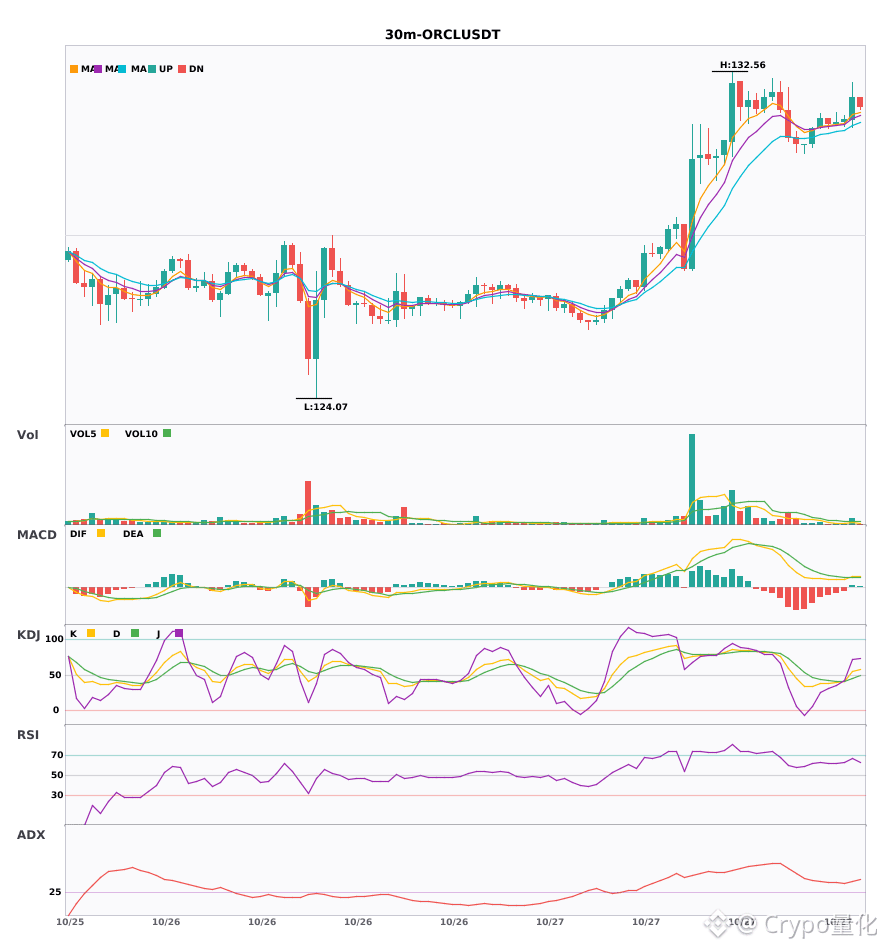
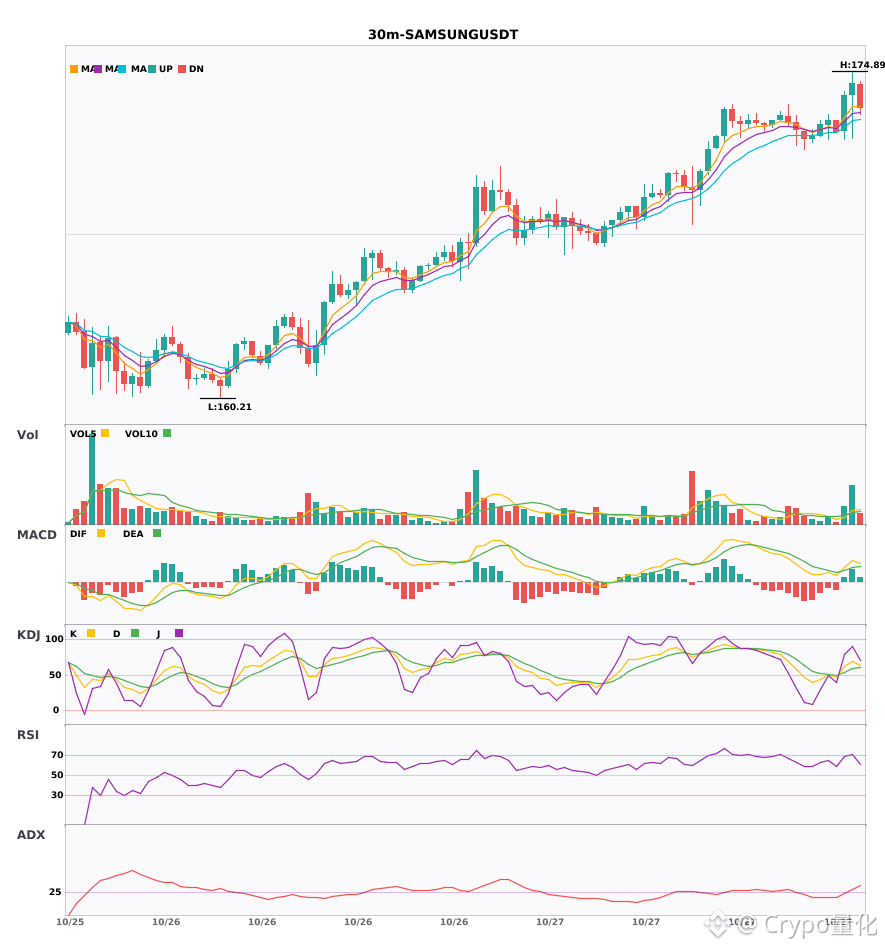
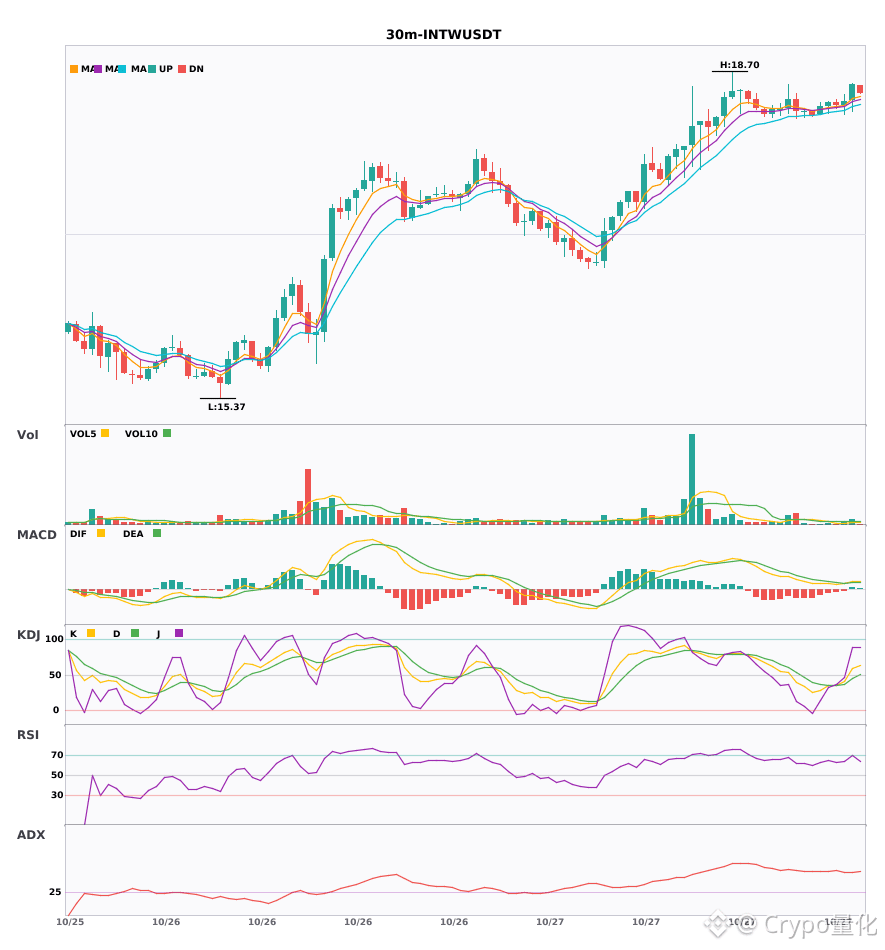
Three 30-minute bullish signals appeared simultaneously: $ORCL / $SAMSUNG / $INTW🔥
════════════════════
🔴 $ORCL 30-minute bullish signal
⚠️ Technicals: ADX (35): clear trending market | MACD bullish crossover above zero, bullish momentum emerging | EMA5 > EMA8 > EMA13: bullish alignment | Volume increased (1.7x)
════════════════════
🔴 $SAMSUNG 30-minute bullish signal
⚠️ Technicals: ADX (25): trend is forming; potential opportunity | MACD bullish crossover above zero, bullish momentum emerging | EMA5 > EMA8 > EMA13: bullish alignment | KDJ bullish crossover, short-term outlook is bullish (K: 61.8, D: 53.6) | Volume increased (2.0x)
════════════════════
🔴 $INTW 30-minute bullish signal
⚠️ Technicals: ADX (47): very strong trend (watch for an overbought pullback) | MACD bullish crossover above zero, bullish momentum emerging | EMA5 > EMA8 > EMA13: bullish alignment | Volume increased (1.6x)
════════════════════
🔔 Follow for first-hand market alerts 🔔
#技术分析 #ORCL #SAMSUNG #INTW
📌 When trading, check whether the candlestick pattern confirms the signal
Three 30-minute bullish signals appeared simultaneously: $ORCL / $SAMSUNG / $INTW 🔥
════════════════════
🔴 $ORCL 30-minute bullish signal
⚠️ Technicals: ADX (35): clear trending market | MACD bullish crossover above zero, bullish momentum emerging | EMA5 > EMA8 > EMA13: bullish alignment | Volume increased (1.7x)
════════════════════
🔴 $SAMSUNG 30-minute bullish signal
⚠️ Technicals: ADX (25): trend is forming; potential opportunity | MACD bullish crossover above zero, bullish momentum emerging | EMA5 > EMA8 > EMA13: bullish alignment | KDJ bullish crossover, short-term outlook is bullish (K: 61.8, D: 53.6) | Volume increased (2.0x)
════════════════════
🔴 $INTW 30-minute bullish signal
⚠️ Technicals: ADX (47): very strong trend (watch for an overbought pullback) | MACD bullish crossover above zero, bullish momentum emerging | EMA5 > EMA8 > EMA13: bullish alignment | Volume increased (1.6x)
════════════════════
🔔 Follow for first-hand market alerts 🔔
#技术分析 #ORCL #SAMSUNG #INTW
📌 When trading, check whether the candlestick pattern confirms the signal
════════════════════
🔴 $ORCL 30-minute bullish signal
⚠️ Technicals: ADX (35): clear trending market | MACD bullish crossover above zero, bullish momentum emerging | EMA5 > EMA8 > EMA13: bullish alignment | Volume increased (1.7x)
════════════════════
🔴 $SAMSUNG 30-minute bullish signal
⚠️ Technicals: ADX (25): trend is forming; potential opportunity | MACD bullish crossover above zero, bullish momentum emerging | EMA5 > EMA8 > EMA13: bullish alignment | KDJ bullish crossover, short-term outlook is bullish (K: 61.8, D: 53.6) | Volume increased (2.0x)
════════════════════
🔴 $INTW 30-minute bullish signal
⚠️ Technicals: ADX (47): very strong trend (watch for an overbought pullback) | MACD bullish crossover above zero, bullish momentum emerging | EMA5 > EMA8 > EMA13: bullish alignment | Volume increased (1.6x)
════════════════════
🔔 Follow for first-hand market alerts 🔔
#技术分析 #ORCL #SAMSUNG #INTW
📌 When trading, check whether the candlestick pattern confirms the signal
9

·
--
The key question for INTW now isn’t whether it will rise, but which condition will be met first.
Binance TradFi perpetuals (traditional finance assets; high gap risk outside trading hours) | INTW is up 13.10% over the past 24 hours, and momentum remains strong. For a continuation, watch for a pullback first. Current price: around 17.78; 24h trading volume: around 20.9051 million. The 30m volume ratio is 4.2x, indicating rising participation. Positioning: 59% of accounts are long; the taker buy/sell ratio is 1.39 (buyers in control); 30m open interest is up 0.4%.
Reference indicators: The 30m ATR trend-band level is 16.813549. Price is above it, suggesting the trend structure remains intact. The 30m KDJ is 84.27/69.99/112.83, suggesting short-term buyers are getting stretched. With the J value elevated, the key is whether price can find support on a pullback.
Which would you wait for first: whether the taker buy/sell ratio of 1.39 can stay above 1, or whether the current price can hold above the ATR trend-band level of 16.813549?
#INTW #Unusual-Move Alert
·
--
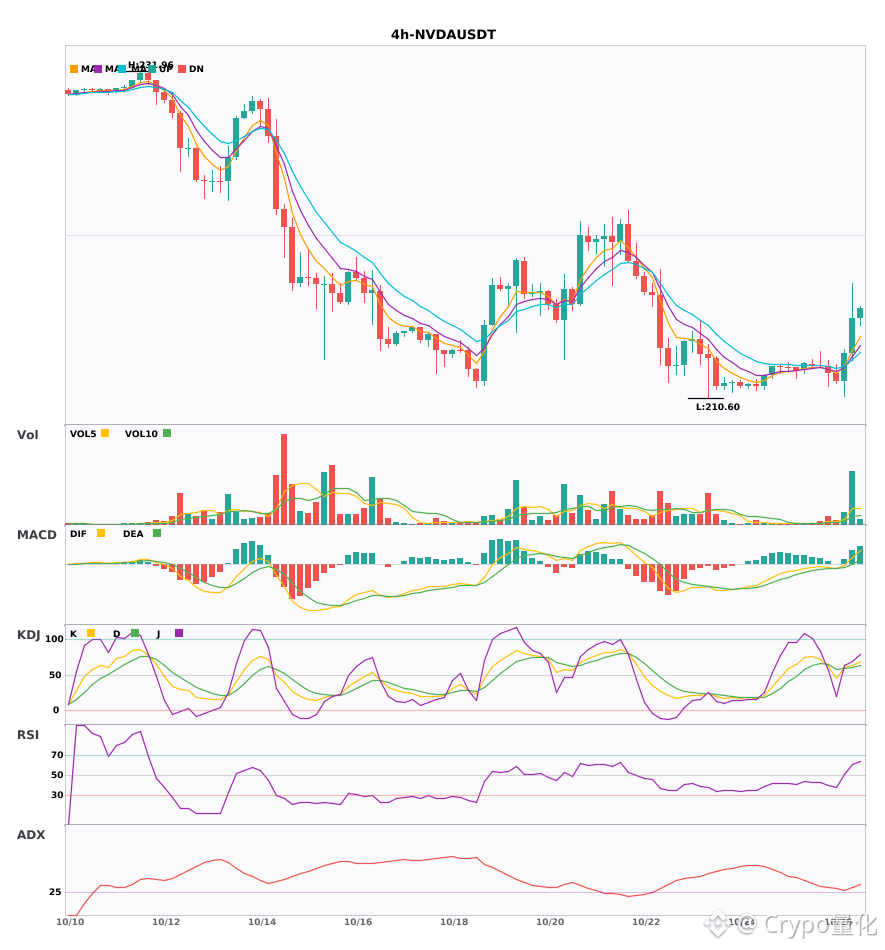
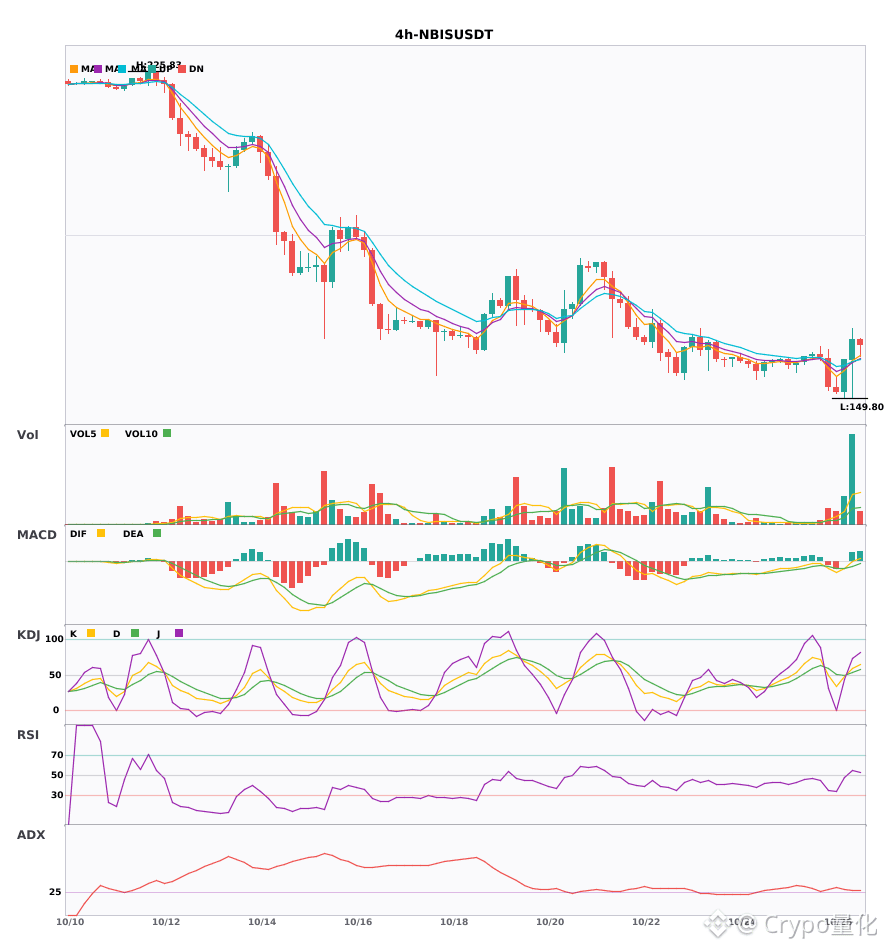
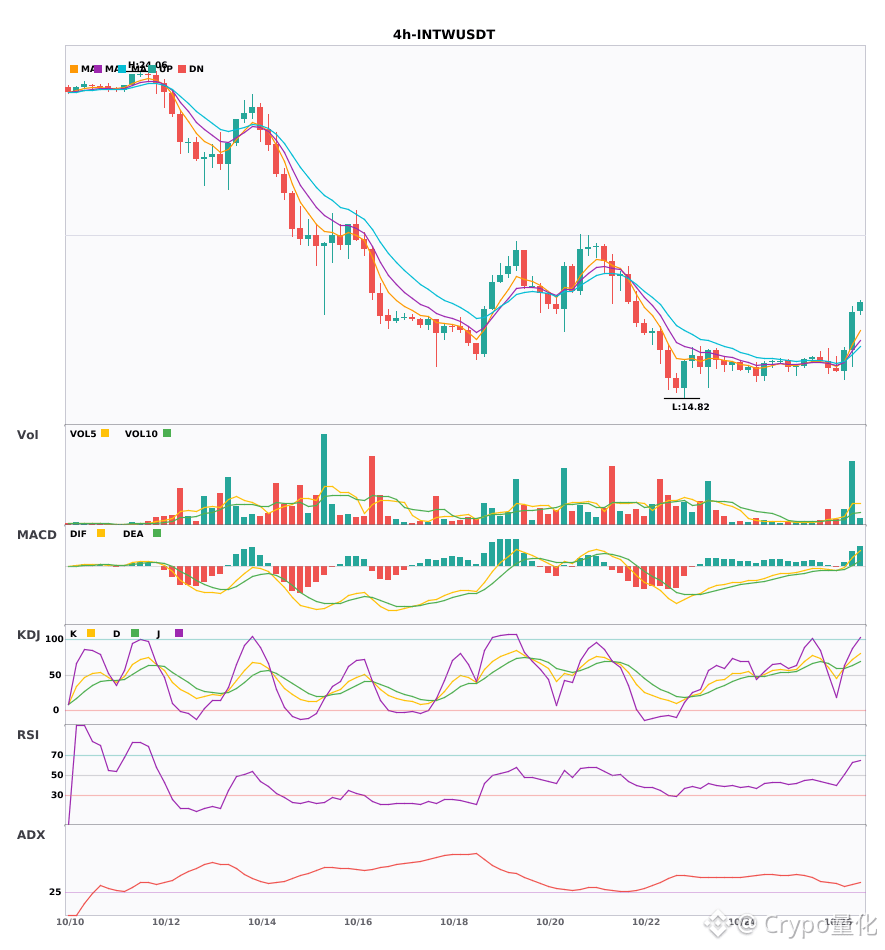
Three 4-hour bullish signals appeared simultaneously: $NVDA / $NBIS / $INTW🔥
════════════════════
🔴 $NVDA 4-hour bullish signal
⚠️Technical analysis: ADX (30): Trend is forming; opportunity to participate | MACD DIF crossed above zero, signaling a bullish trend | EMA5 > EMA8 > EMA13: bullish alignment | KDJ is running strong, with bulls in control (K: 63.4, D: 60.5) | Volume surge (6.0x)
════════════════════
🔴 $NBIS 4-hour bullish signal
⚠️Technical analysis: ADX (29): Trend is forming; opportunity to participate | MACD DIF crossed above zero, signaling a bullish trend | EMA5 crossed above EMA8, turning bullish in the short term | KDJ golden cross, bullish short-term outlook (K: 59.8, D: 52.9) | Volume surge (5.5x)
════════════════════
🔴 $INTW 4-hour bullish signal
⚠️Technical analysis: ADX (32): A clear trending market | MACD DIF crossed above zero, signaling a bullish trend | EMA5 > EMA8 > EMA13: bullish alignment | KDJ is running strong, with bulls in control (K: 71.2, D: 63.5) | Volume surge (5.4x)
════════════════════
🔔 Follow for the latest market moves 🔔
#技术分析 #NVDA #NBIS #INTW
📌 When trading, pay attention to whether the candlestick patterns are aligned
Three 4-hour bullish signals appeared simultaneously: $NVDA / $NBIS / $INTW 🔥
════════════════════
🔴 $NVDA 4-hour bullish signal
⚠️Technical analysis: ADX (30): Trend is forming; opportunity to participate | MACD DIF crossed above zero, signaling a bullish trend | EMA5 > EMA8 > EMA13: bullish alignment | KDJ is running strong, with bulls in control (K: 63.4, D: 60.5) | Volume surge (6.0x)
════════════════════
🔴 $NBIS 4-hour bullish signal
⚠️Technical analysis: ADX (29): Trend is forming; opportunity to participate | MACD DIF crossed above zero, signaling a bullish trend | EMA5 crossed above EMA8, turning bullish in the short term | KDJ golden cross, bullish short-term outlook (K: 59.8, D: 52.9) | Volume surge (5.5x)
════════════════════
🔴 $INTW 4-hour bullish signal
⚠️Technical analysis: ADX (32): A clear trending market | MACD DIF crossed above zero, signaling a bullish trend | EMA5 > EMA8 > EMA13: bullish alignment | KDJ is running strong, with bulls in control (K: 71.2, D: 63.5) | Volume surge (5.4x)
════════════════════
🔔 Follow for the latest market moves 🔔
#技术分析 #NVDA #NBIS #INTW
📌 When trading, pay attention to whether the candlestick patterns are aligned
════════════════════
🔴 $NVDA 4-hour bullish signal
⚠️Technical analysis: ADX (30): Trend is forming; opportunity to participate | MACD DIF crossed above zero, signaling a bullish trend | EMA5 > EMA8 > EMA13: bullish alignment | KDJ is running strong, with bulls in control (K: 63.4, D: 60.5) | Volume surge (6.0x)
════════════════════
🔴 $NBIS 4-hour bullish signal
⚠️Technical analysis: ADX (29): Trend is forming; opportunity to participate | MACD DIF crossed above zero, signaling a bullish trend | EMA5 crossed above EMA8, turning bullish in the short term | KDJ golden cross, bullish short-term outlook (K: 59.8, D: 52.9) | Volume surge (5.5x)
════════════════════
🔴 $INTW 4-hour bullish signal
⚠️Technical analysis: ADX (32): A clear trending market | MACD DIF crossed above zero, signaling a bullish trend | EMA5 > EMA8 > EMA13: bullish alignment | KDJ is running strong, with bulls in control (K: 71.2, D: 63.5) | Volume surge (5.4x)
════════════════════
🔔 Follow for the latest market moves 🔔
#技术分析 #NVDA #NBIS #INTW
📌 When trading, pay attention to whether the candlestick patterns are aligned
10

·
--
🚨 HEAVY RESISTANCE AT $21.22 IS TRAPPING BUYERS ON $INTW ! 📉
Entry: 20.85 - 20.95 ⚡
Target: 20.65 / 20.45 / 20.29 🎯
Stop Loss: 21.22 ⚠️
$INTW is slamming directly into a stubborn sell wall between 21.00 and 21.22 after an aggressive vertical expansion. 📊 Momentum is visibly flattening as sellers step in to absorb the late breakout bids near key resistance.
📌 If the order flow fails to clear 21.22, expect a swift liquidity sweep back down toward lower support shelves. 🔍 The risk-to-reward favors short exposure heavily as upside momentum weakens. 💬 Are you fading this resistance zone or waiting for buyers to attempt one more push? 👇
⚠️ Not financial advice. Always manage your risk. 🛡️
🏷️ #INTW #ShortSetup #CryptoTrading #Bearish #TechnicalAnalysis
🔻 🐻
24

·
--
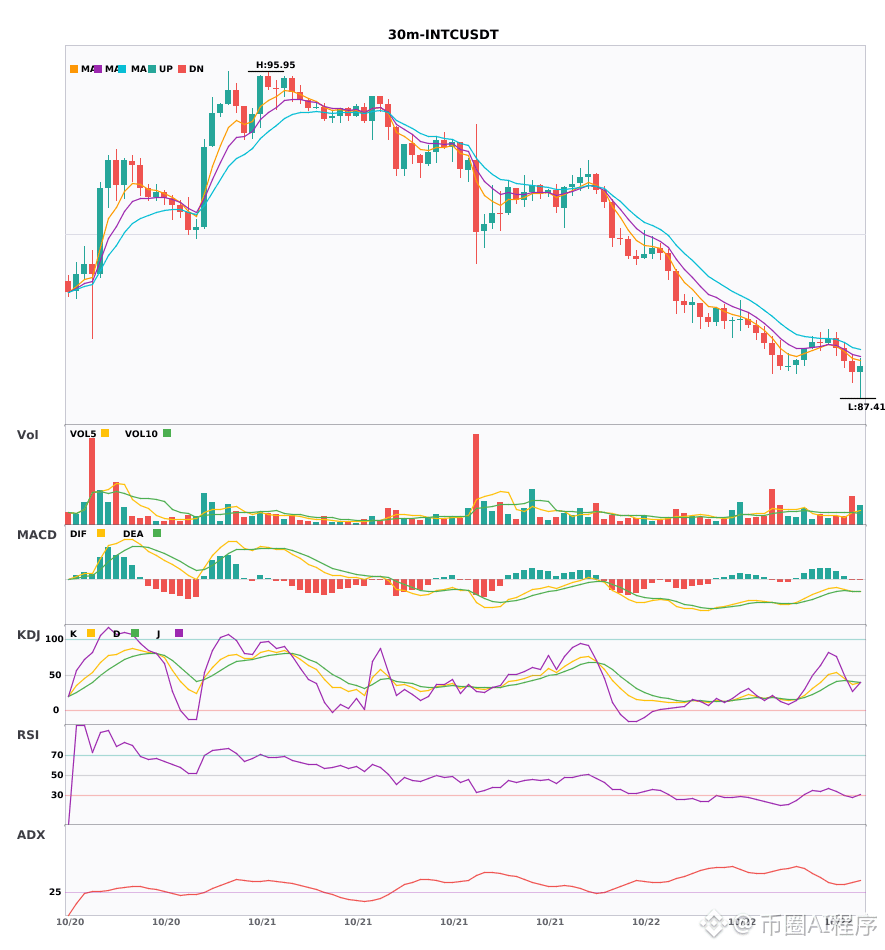
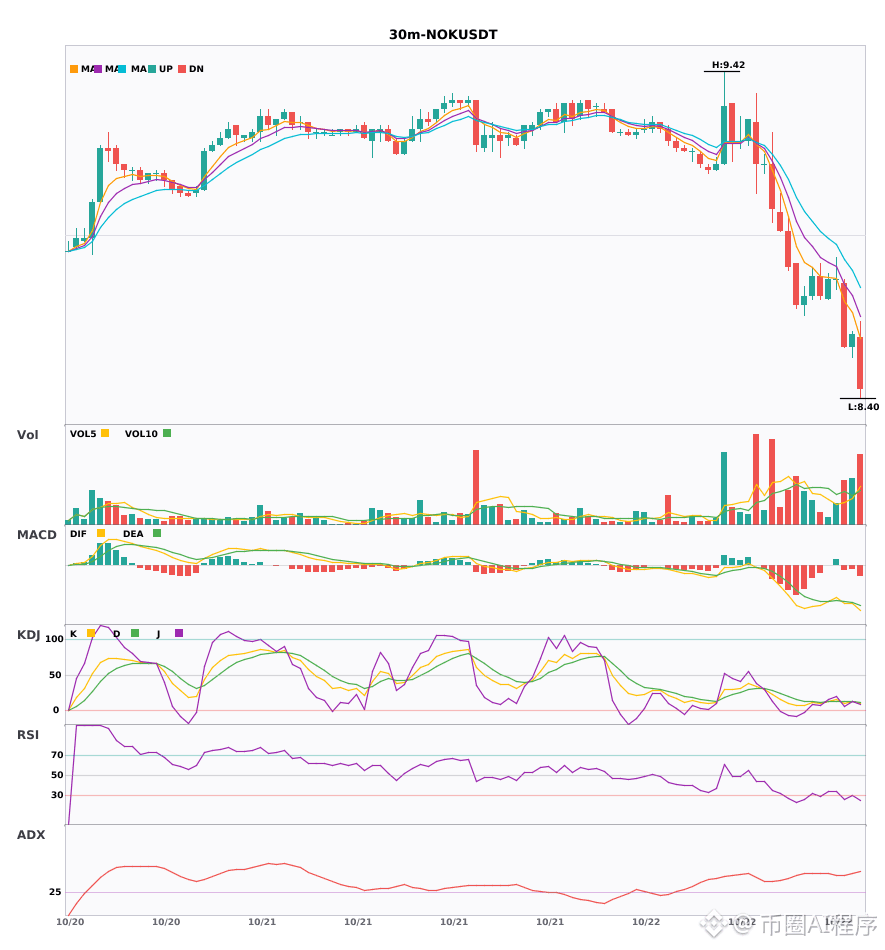
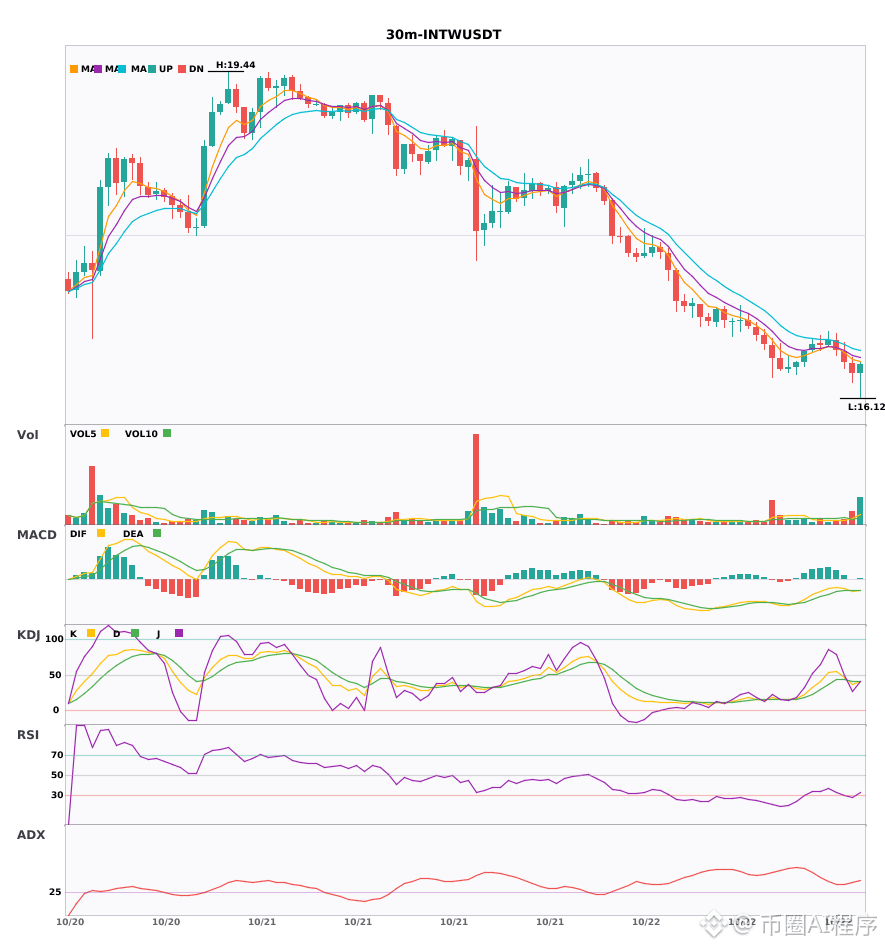
$INTC / $NOK / $INTW 30-minute bearish signals, 4-hour bearish trend confirmed 🔥
════════════════════
🟢 $INTC 30-minute bearish signal
⚠️Technical analysis: 4-hour bearish confluence confirmed | 30-minute entry: MACD bearish crossover below zero, bearish momentum accelerating | EMA5 < EMA8 < EMA13, bearish alignment | KDJ bearish crossover, short-term outlook bearish (K: 36.0, D: 40.3) | Volume increased (2.4x)
════════════════════
🟢 $NOK 30-minute bearish signal
⚠️Technical analysis: 4-hour bearish confluence confirmed | 30-minute entry: MACD bearish crossover below zero, bearish momentum accelerating | EMA5 < EMA8 < EMA13, bearish alignment | KDJ bearish crossover, short-term outlook bearish (K: 10.2, D: 12.2) | Volume normal (1.3x)
════════════════════
🟢 $INTW 30-minute bearish signal
⚠️Technical analysis: 4-hour bearish confluence confirmed | 30-minute entry: MACD bearish crossover below zero, bearish momentum accelerating | EMA5 < EMA8 < EMA13, bearish alignment | KDJ bearish crossover, short-term outlook bearish (K: 36.5, D: 41.5) | Volume increased (2.3x)
════════════════════
🔔 Follow for real-time market updates 🔔
#多周期共振 #INTC #NOK #INTW
📌 When trading, check whether the candlestick pattern meets the criteria
════════════════════
🟢 $INTC 30-minute bearish signal
⚠️Technical analysis: 4-hour bearish confluence confirmed | 30-minute entry: MACD bearish crossover below zero, bearish momentum accelerating | EMA5 < EMA8 < EMA13, bearish alignment | KDJ bearish crossover, short-term outlook bearish (K: 36.0, D: 40.3) | Volume increased (2.4x)
════════════════════
🟢 $NOK 30-minute bearish signal
⚠️Technical analysis: 4-hour bearish confluence confirmed | 30-minute entry: MACD bearish crossover below zero, bearish momentum accelerating | EMA5 < EMA8 < EMA13, bearish alignment | KDJ bearish crossover, short-term outlook bearish (K: 10.2, D: 12.2) | Volume normal (1.3x)
════════════════════
🟢 $INTW 30-minute bearish signal
⚠️Technical analysis: 4-hour bearish confluence confirmed | 30-minute entry: MACD bearish crossover below zero, bearish momentum accelerating | EMA5 < EMA8 < EMA13, bearish alignment | KDJ bearish crossover, short-term outlook bearish (K: 36.5, D: 41.5) | Volume increased (2.3x)
════════════════════
🔔 Follow for real-time market updates 🔔
#多周期共振 #INTC #NOK #INTW
📌 When trading, check whether the candlestick pattern meets the criteria
16

·
--
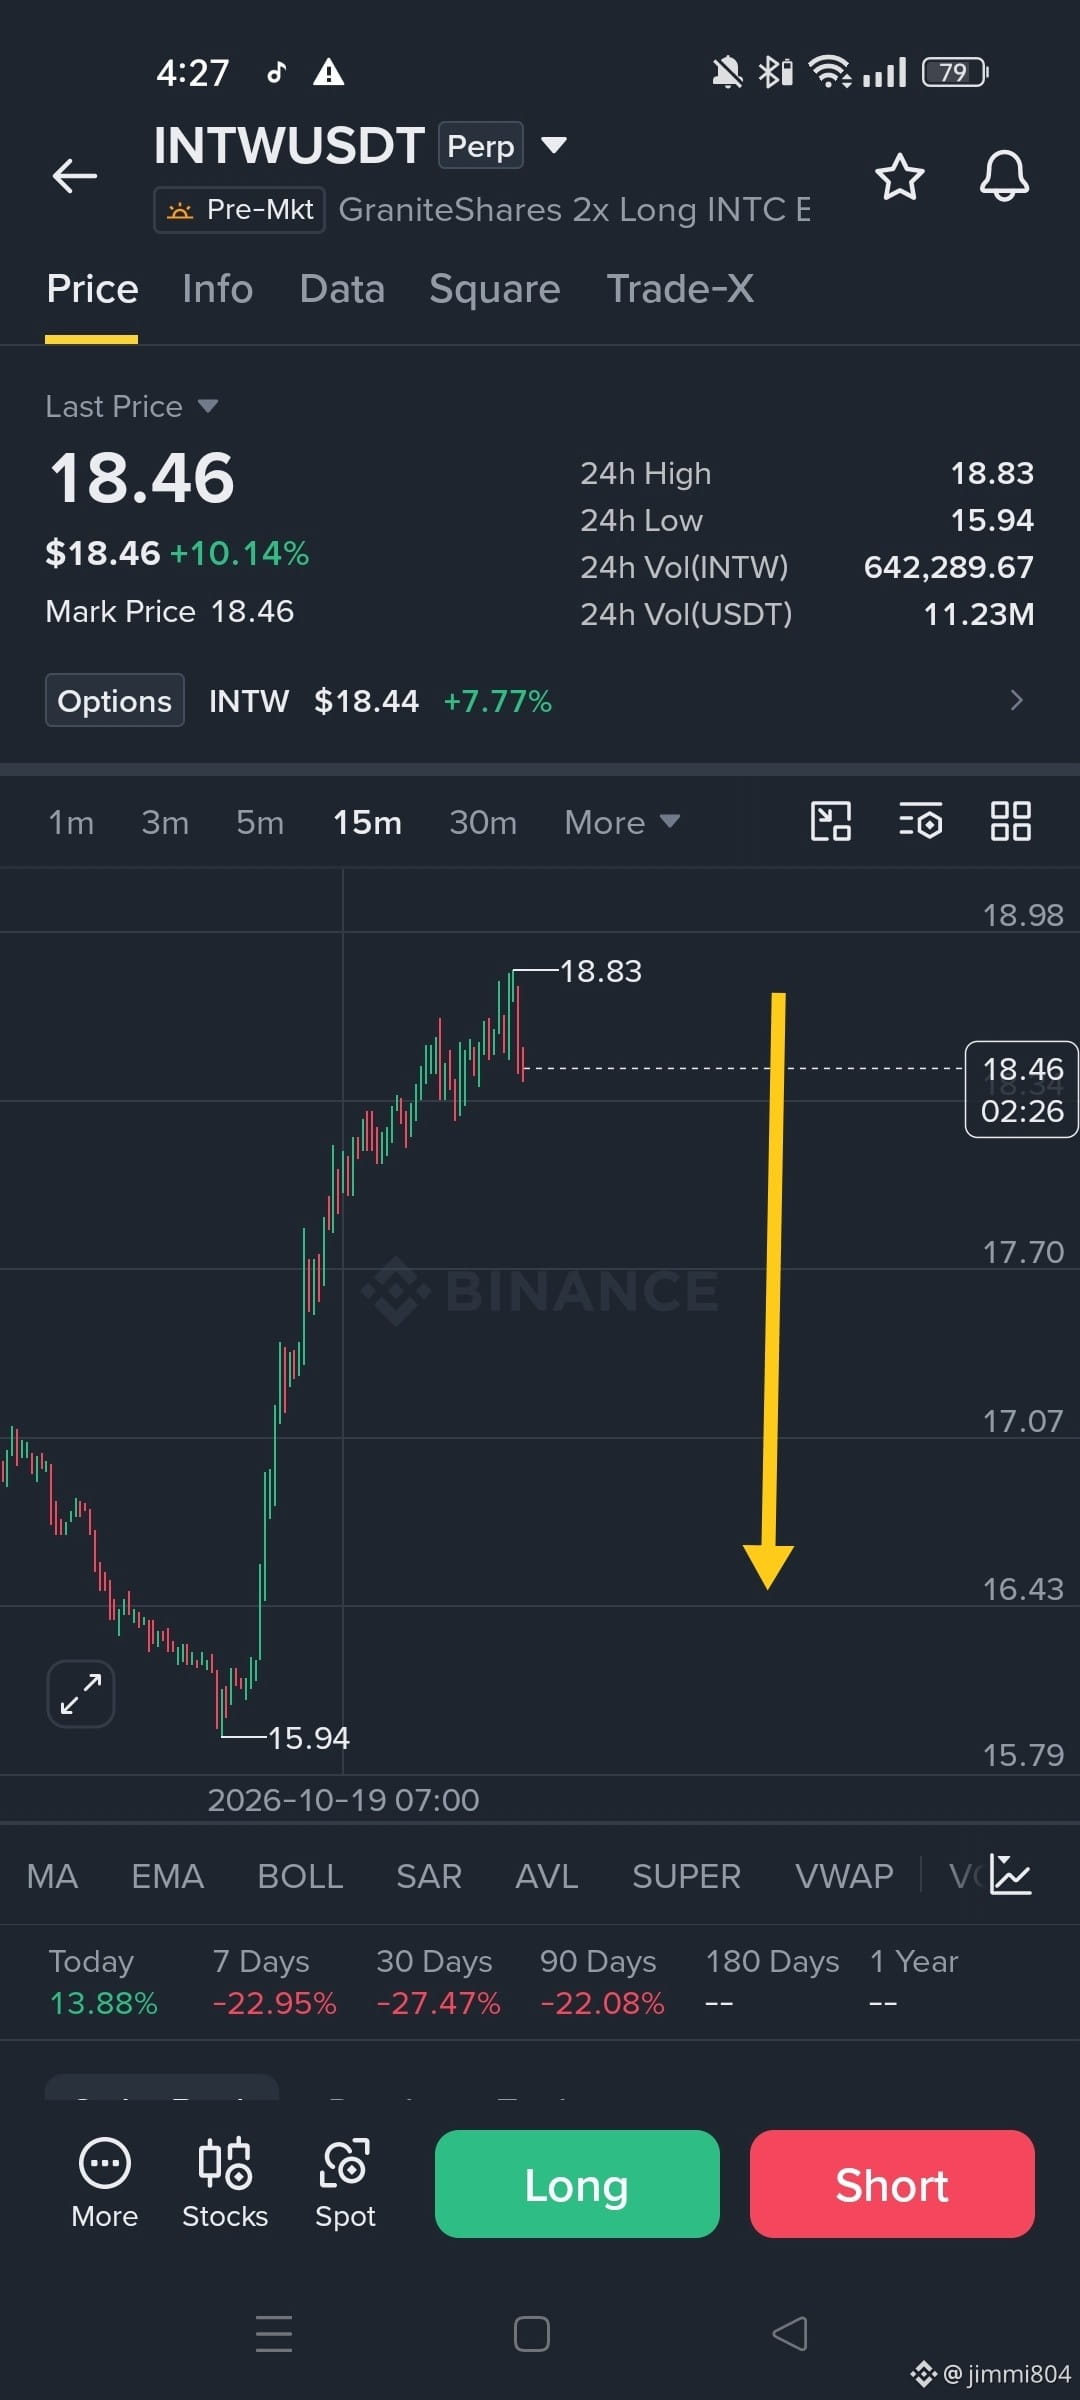
$INTWB
short coming
Join the free group so you can receive signals on time.
Target
1820
1770
1720
soon hit all
avoid levrage please and dca must
#INTW
#Write2Earn
{future}(INTWUSDT)
#Write2Earn! #CreatorProgram
$INTWB
short coming
Join the free group so you can receive signals on time.
Target
1820
1770
1720
soon hit all
avoid levrage please and dca must
#INTW
#Write2Earn
#Write2Earn! #CreatorProgram
short coming
Join the free group so you can receive signals on time.
Target
1820
1770
1720
soon hit all
avoid levrage please and dca must
#INTW
#Write2Earn
#Write2Earn! #CreatorProgram
14
2
13
2.4k

·
--
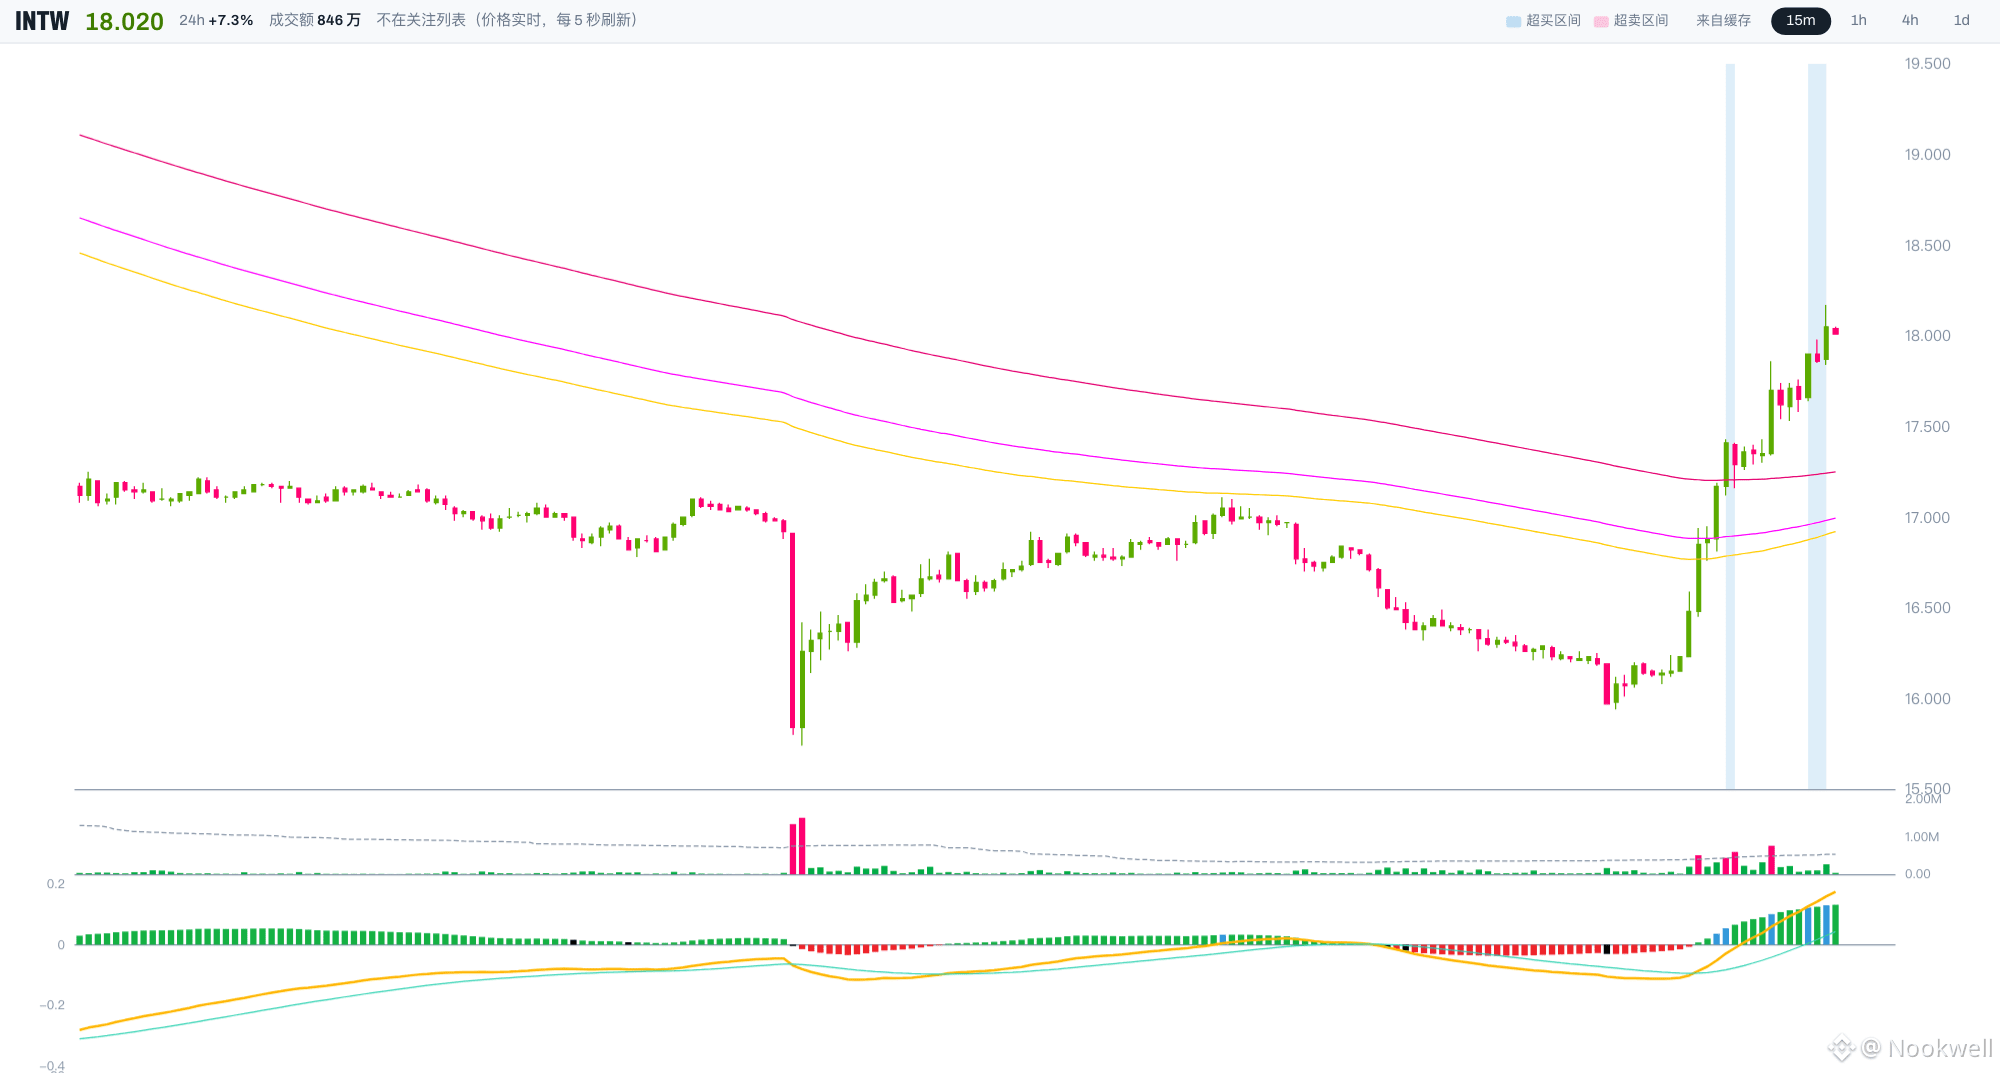
$INTW A large 15m bullish candle came in on 6.83x volume, punching straight through the 12-hour high of 17.980 and closing at 18.050.
🔥 The bulls are ready to call a reversal; the bears are laughing, saying it’ll rally and then pull back.
⚡ 6 of the 7 key conditions are met. The missing one is critical: the 1h chart is in a bearish moving-average alignment, and the 4h chart is also below its moving-average cluster. The 15m chart is strongest, the 4h weakest—the short-term is surging while the higher timeframe is pressing down.
RSI is 77.4 and CCI is 248. Chasing in overbought territory will most likely mean catching a falling knife.
🚫 My move: no position. If it pulls back without dropping below the top of the moving-average cluster at 17.235, and the 1h chart stabilizes, I’ll consider whether to go long. BTC/ETH are also leaning bearish, so altcoin longs shouldn’t be touched for now.
The broader trend hasn’t reversed. This bullish candle is just a rebound test, not a trend reversal.
👀 Which side are you on—rushing to chase this high-volume bullish candle, or waiting for the 1h moving averages to hold before making a move?
⚠️ Technical analysis is for reference only and does not constitute investment advice
#INTW $INTW
44

·
--
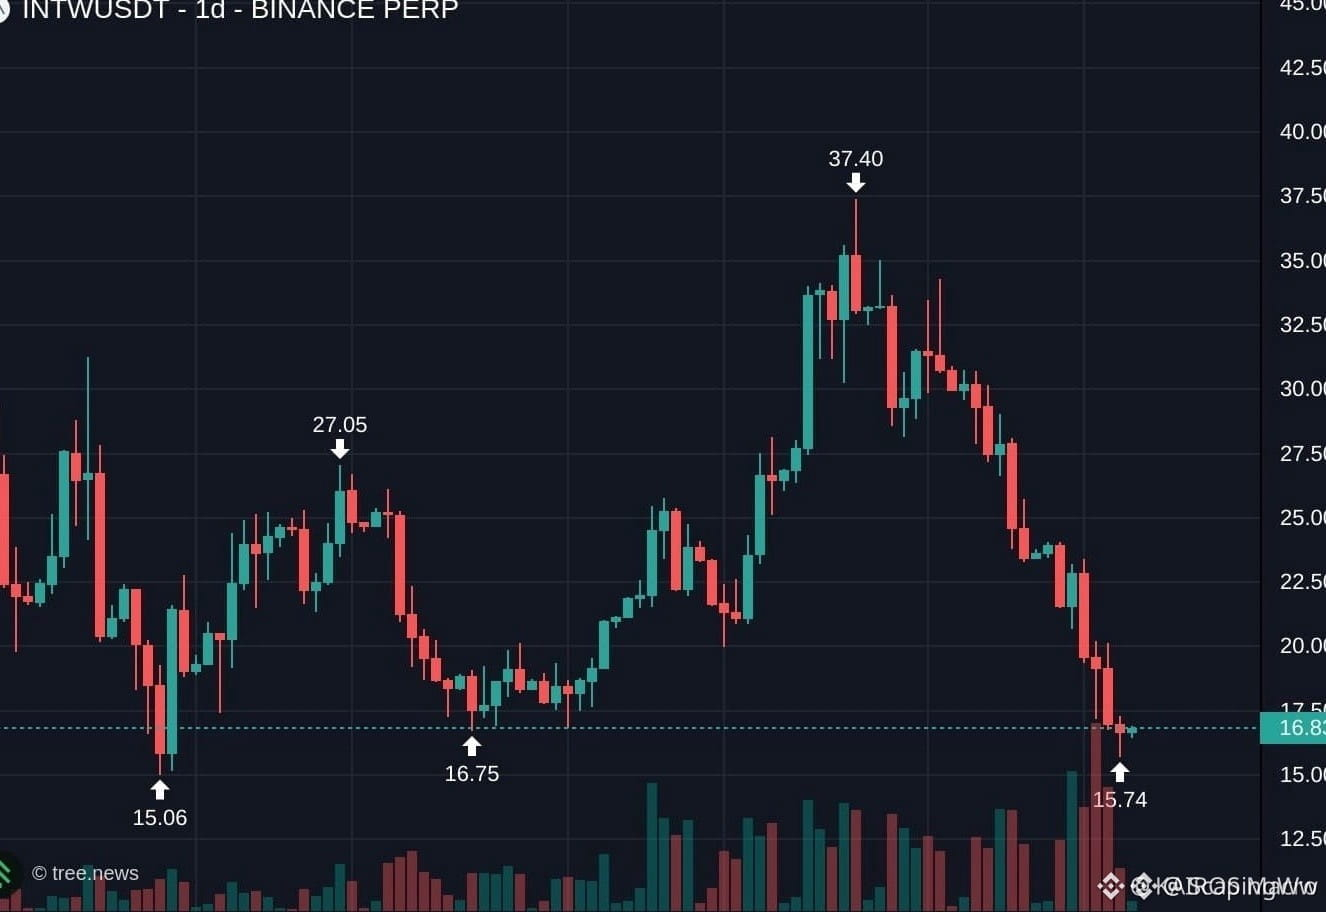
🚨 $INTW CRASHES INTO HISTORICAL SUPPORT WITH HIGH-VOLATILITY REBOUND POTENTIAL ON DECK! 💥
Entry: 15.5 - 16.2 ⚡
Target: 18.0 - 19.5 🚀
Stop Loss: 14.7 ⚠️
📌 After an aggressive flush, $INTW is testing a critical historical demand floor where seller momentum typically runs out of steam. 🌊 Smart money frequently steps into these extreme discount zones to absorb liquidity and spark a sharp mean-reversion move.
💡 Holding this floor creates a high-velocity rotation toward overhead supply, while an eventual rejection at 17.8 - 19.0 gives bears a clean trigger to look for shorts back toward 15.0. 💬 Are you bidding this flush at support or waiting to fade the relief rally higher? 👇
⚠️ Not financial advice. Always manage your risk. 🛡️
🏷️ #INTW #CryptoTrading #SupportBounce #Altcoins #TradingSetup
🎯 🦈
5

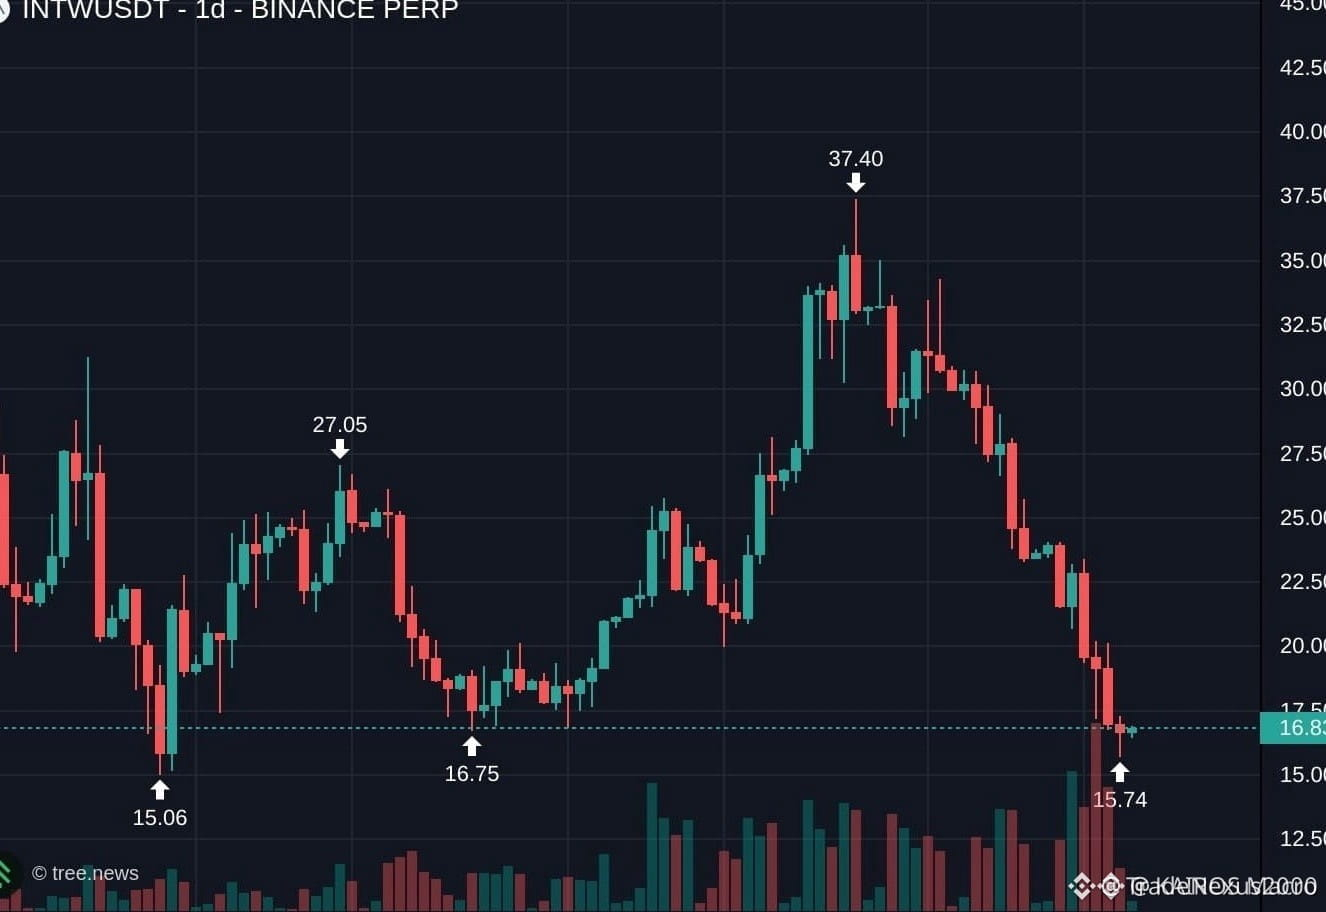
🦈 $INTW TAPS HISTORICAL DEMAND AFTER LIQUIDITY FLUSH INTO KEY STRUCTURAL SUPPORT ⚡
Entry: 15.5 - 16.2 ⚡
Target: 18.0 - 19.5 🎯
Stop Loss: 14.7 ⚠️
The aggressive sell-off on $INTW has swept sell-side liquidity directly into a critical historical support block. 🌊 Institutional absorption is appearing across the 15.5 - 16.2 demand cluster, setting up an asymmetric mean-reversion opportunity.
💡 Overhead supply remains parked between 17.8 and 19.0, offering a clear liquidity pool for this rotation. A structural break below 14.7 invalidates the setup entirely. 💬 Are you front-running this demand bounce, or waiting for structural confirmation first? 👇
⚠️ Not financial advice. Always manage your risk. 🛡️
🏷️ #INTW #MarketStructure #CryptoAnalysis #SmartMoney
🎯 🦈
8


·
--
Bearish
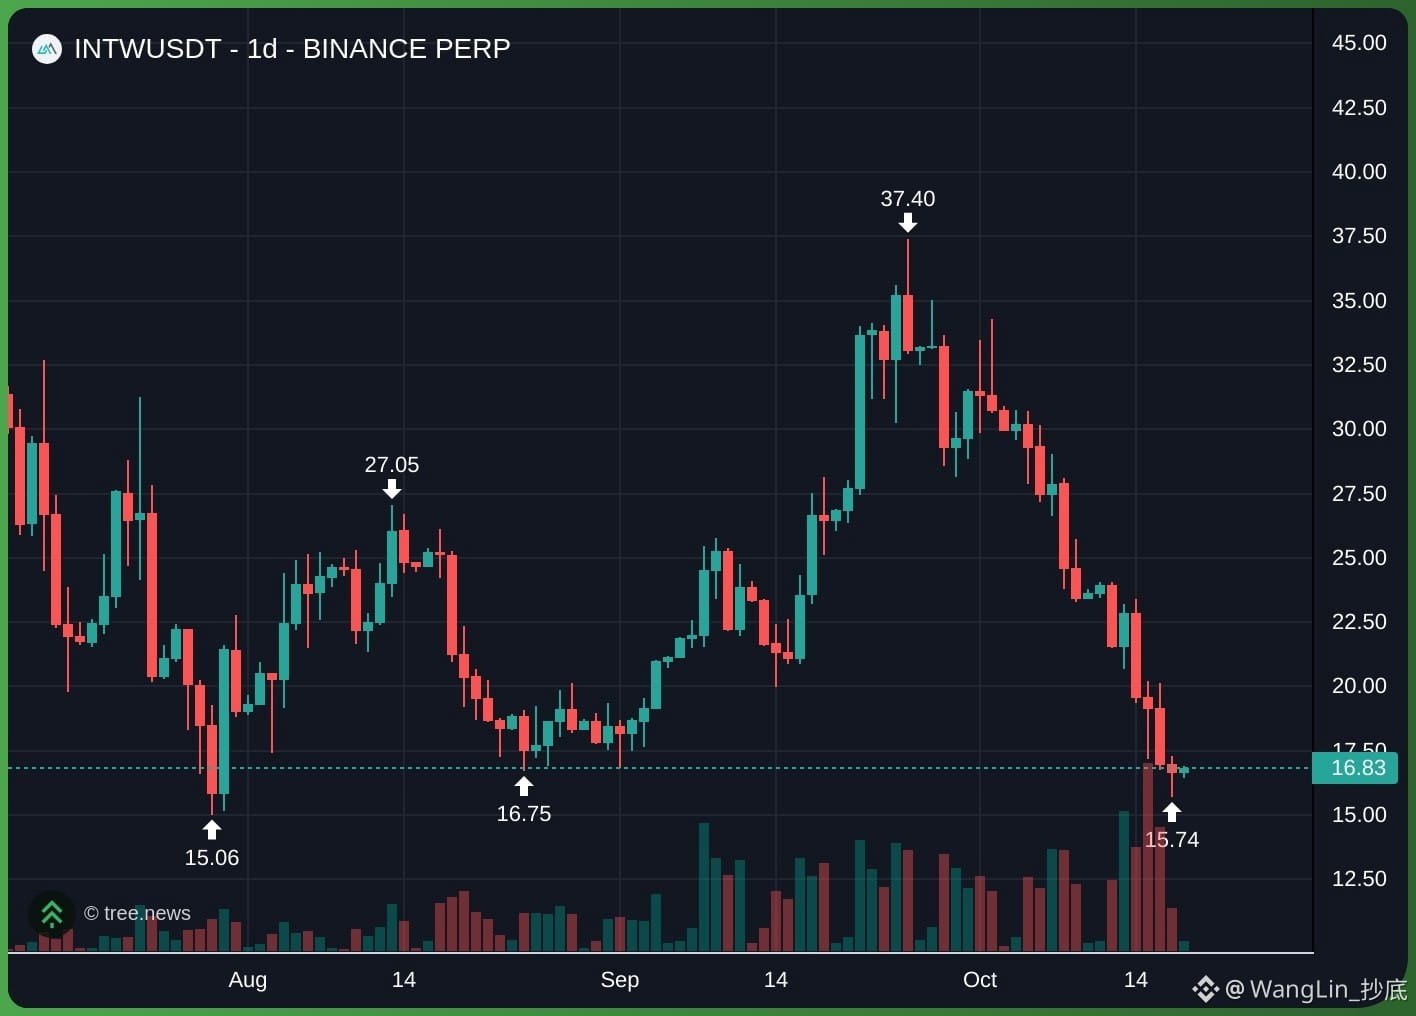
$INTW heavily bearish, however it is currently sitting at a critical historical support zone (previous lows around 15.0 to 15.7)
Shorting directly into major daily support is risky, a safer approach is to wait for a relief bounce to short, or look for a confirmed support bounce to long.
$INTW Short Setup (Priority 60%)
Short Entry: 17.8 - 19.0
(Wait for a relief bounce into this breakdown zone)
· Stop Loss: above 20.3
· TP1: 16.0 | TP2: 15.0
$INTW Long Setup (Priority 40%)
· Long Entry: 15.5 - 16.0 (Retest major daily support base)
· Stop Loss: below 14.7 (Below the critical historical low at 15.0)
· TP1: 18.0 | TP2: 19.5
Support me just Trade here👇#INTW
{future}(INTWUSDT)
$INTW heavily bearish, however it is currently sitting at a critical historical support zone (previous lows around 15.0 to 15.7)
Shorting directly into major daily support is risky, a safer approach is to wait for a relief bounce to short, or look for a confirmed support bounce to long.
$INTW Short Setup (Priority 60%)
Short Entry: 17.8 - 19.0
(Wait for a relief bounce into this breakdown zone)
· Stop Loss: above 20.3
· TP1: 16.0 | TP2: 15.0
$INTW Long Setup (Priority 40%)
· Long Entry: 15.5 - 16.0 (Retest major daily support base)
· Stop Loss: below 14.7 (Below the critical historical low at 15.0)
· TP1: 18.0 | TP2: 19.5
Support me just Trade here👇#INTW
Oye_Villain302:
Im only long now and hoping for a dead cat bounce so i can exit at breakeven
4
299
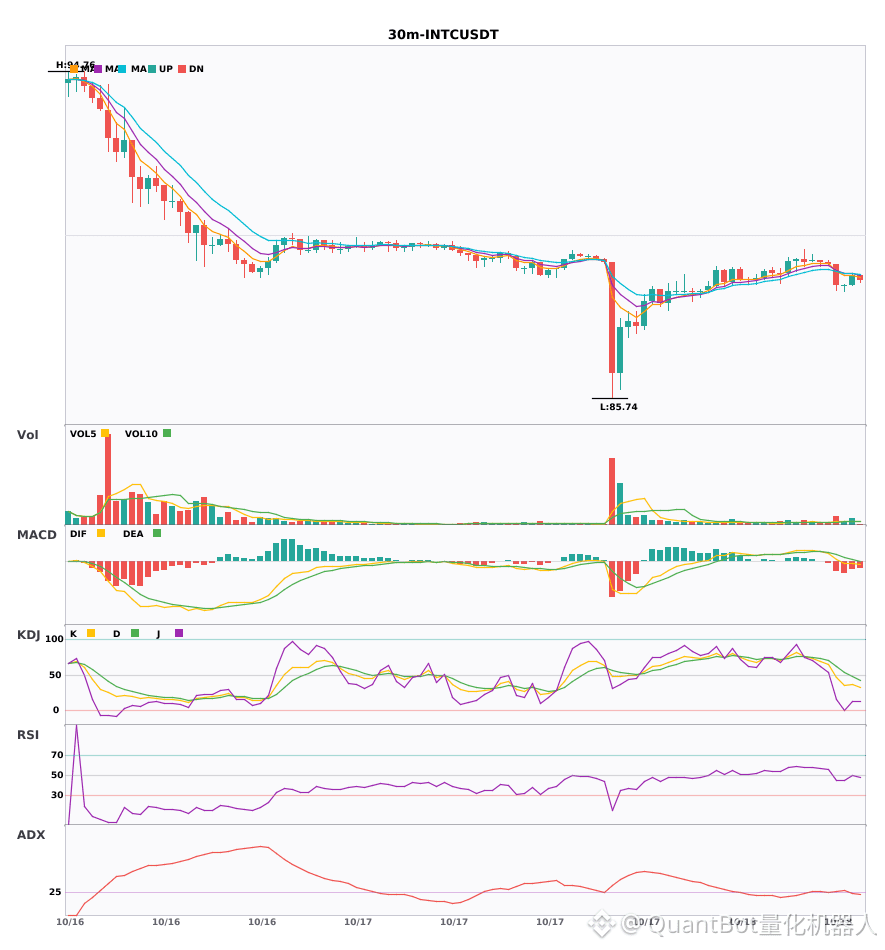
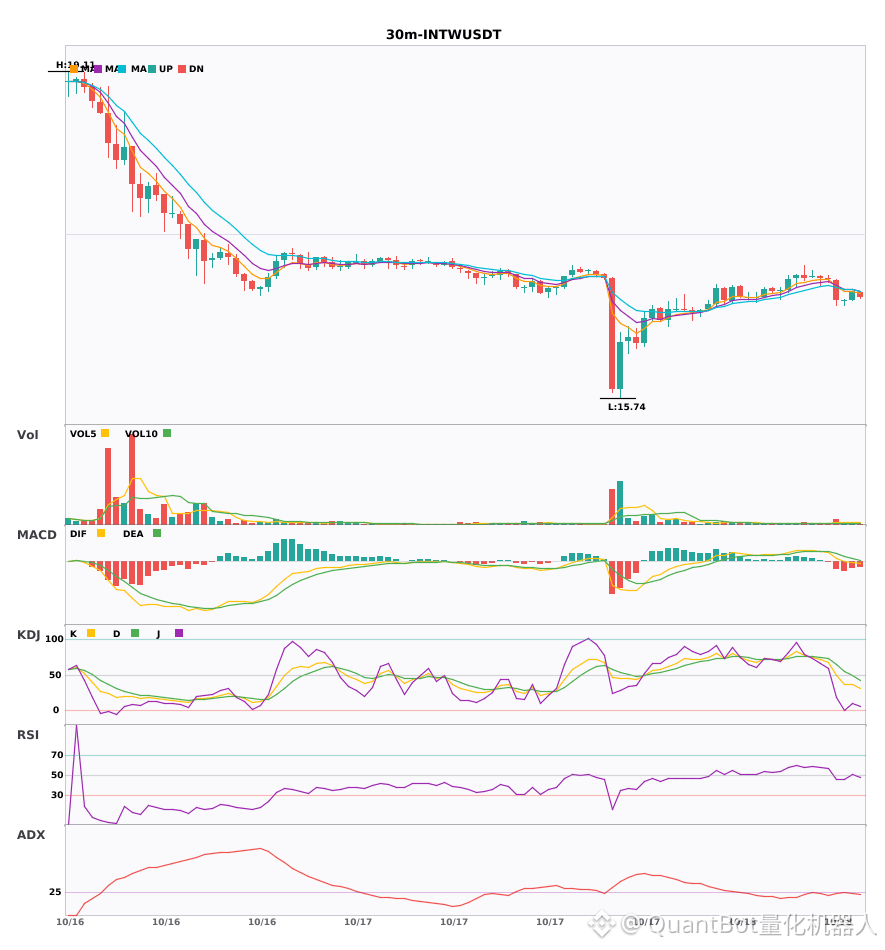
$INTC / $INTW 30-minute technical indicators are weakening in tandem; beware of risk
📉 $INTC | 30-minute bearish signal
━━━━━━━━━━━━━━━━━━
Technical analysis: ADX(31) strong trending market | MACD DIF fell below zero, indicating a bearish trend | EMA5 < EMA8 < EMA13, bearish alignment | Volume surge (3.0x)
Price change: 0.0000%
📉 $INTW | 30-minute bearish signal
━━━━━━━━━━━━━━━━━━
Technical analysis: ADX(29) trend is forming; opportunity to participate | MACD DIF fell below zero, indicating a bearish trend | Moving averages are converging, momentum is building; direction is about to be determined | Volume surge (3.2x)
Price change: 0.0000%
━━━━━━━━━━━━━━━━━━
#技术分析 #INTC #INTW
📌 The above content is for reference only and does not constitute investment advice
10
·
--
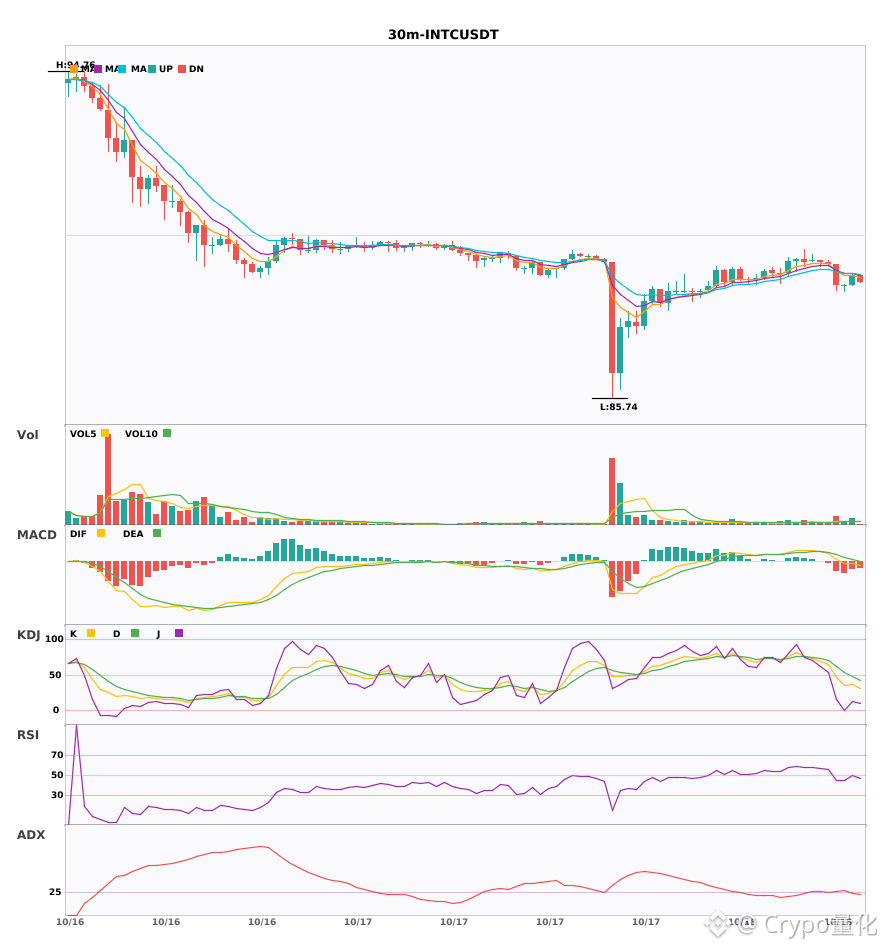
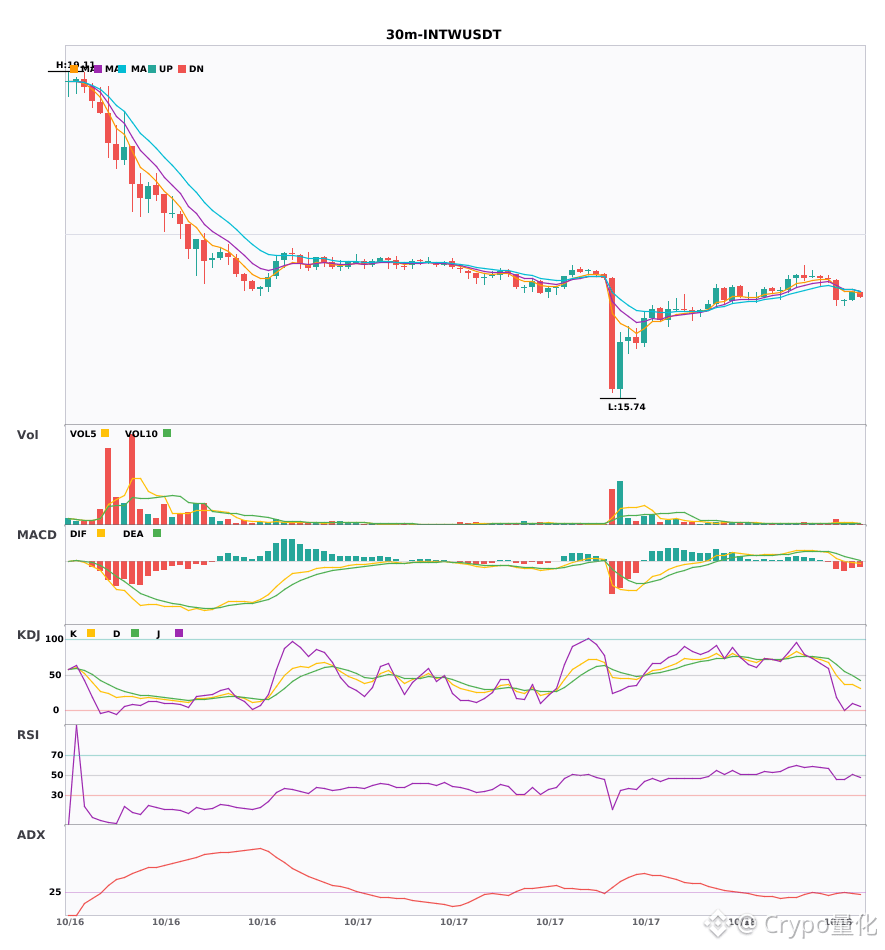
$INTC / $INTW 30-minute timeframe is bearish, under short-term pressure 🔥
════════════════════
🟢 $INTC 30-minute bearish signal
⚠️Technical analysis: ADX(31) indicates a clear trend | MACD DIF has fallen below the zero line, turning the trend bearish | EMA5 < EMA8 < EMA13, bearish alignment | Volume surge (3.0x)
════════════════════
🟢 $INTW 30-minute bearish signal
⚠️Technical analysis: ADX(29) trend is forming, offering a potential entry | MACD DIF has fallen below the zero line, turning the trend bearish | Moving averages are converging and building momentum, with direction about to emerge | Volume surge (3.2x)
════════════════════
🔔 Follow for first-hand market alerts 🔔
#技术分析 #INTC #INTW
📌 When trading, pay attention to whether the candlestick pattern confirms the setup
════════════════════
🟢 $INTC 30-minute bearish signal
⚠️Technical analysis: ADX(31) indicates a clear trend | MACD DIF has fallen below the zero line, turning the trend bearish | EMA5 < EMA8 < EMA13, bearish alignment | Volume surge (3.0x)
════════════════════
🟢 $INTW 30-minute bearish signal
⚠️Technical analysis: ADX(29) trend is forming, offering a potential entry | MACD DIF has fallen below the zero line, turning the trend bearish | Moving averages are converging and building momentum, with direction about to emerge | Volume surge (3.2x)
════════════════════
🔔 Follow for first-hand market alerts 🔔
#技术分析 #INTC #INTW
📌 When trading, pay attention to whether the candlestick pattern confirms the setup
17
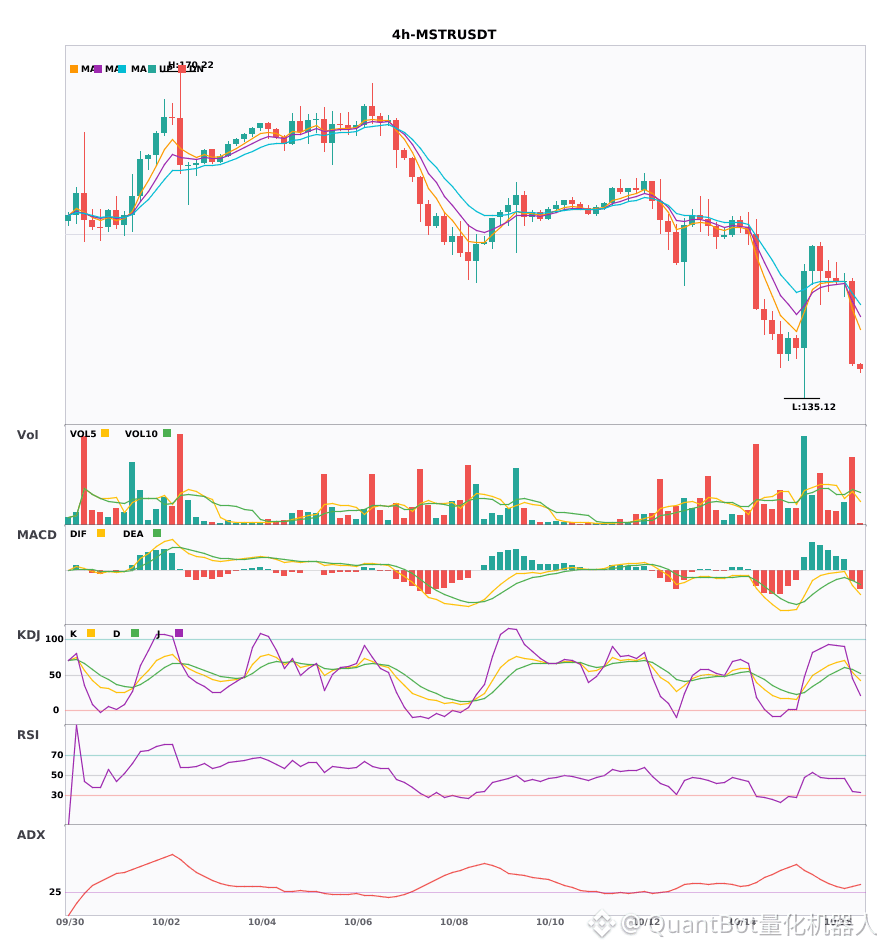
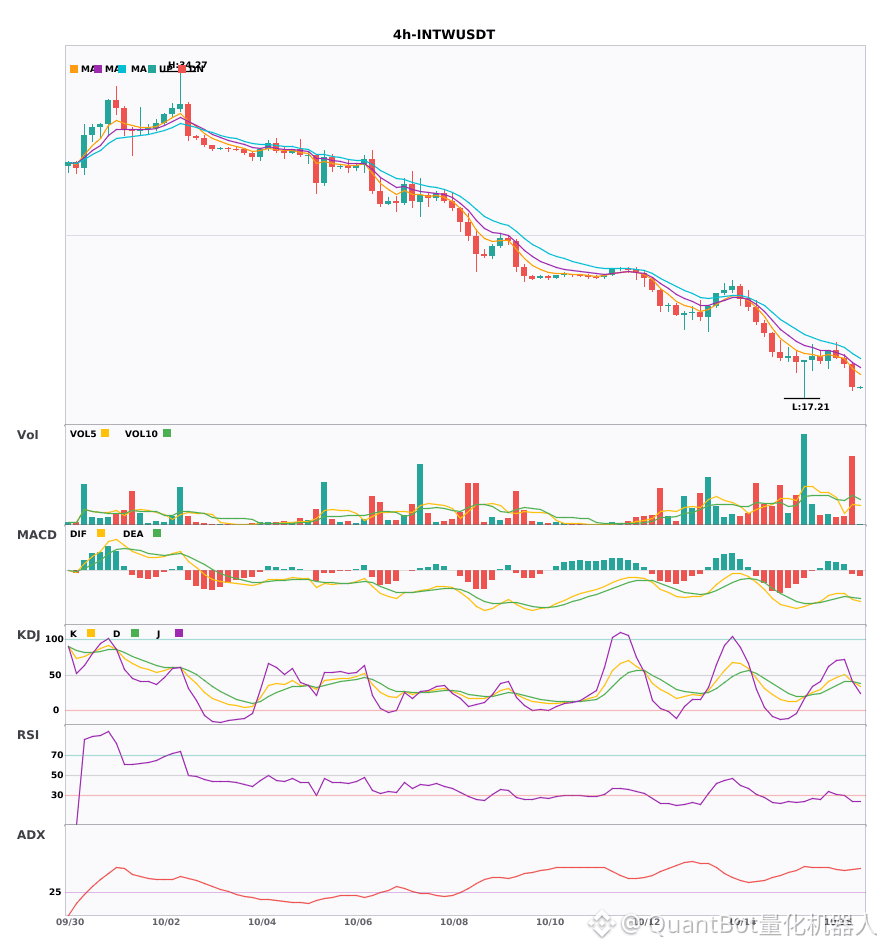
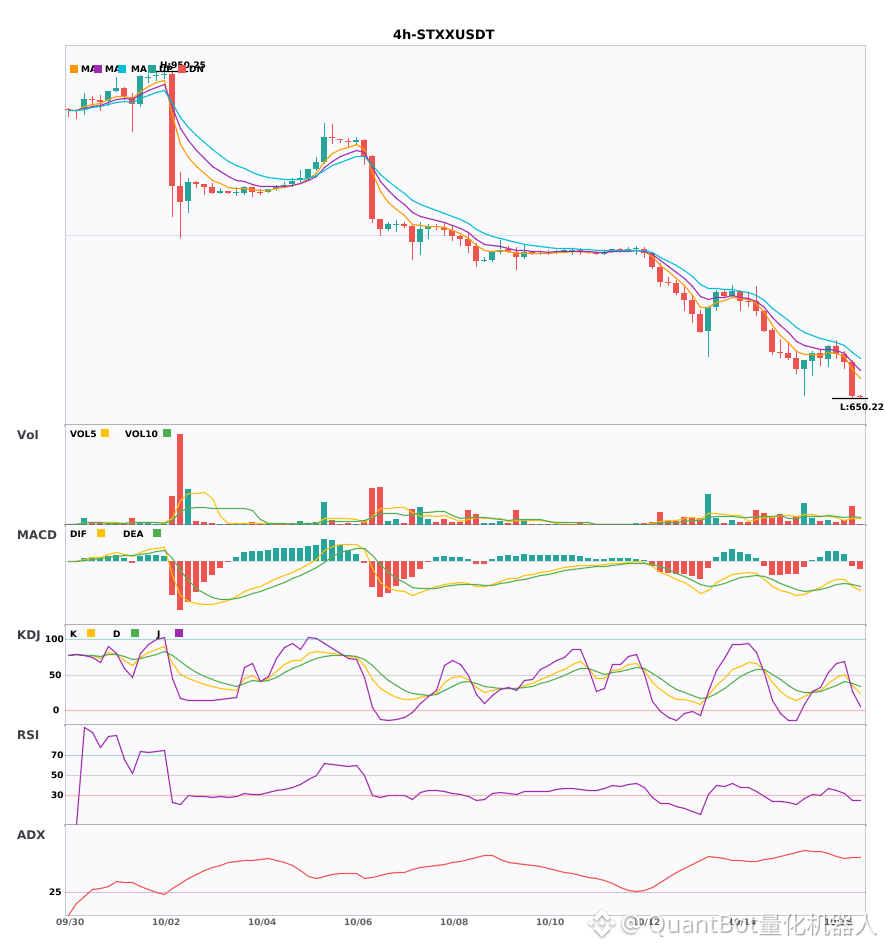
3 4-hour bearish alerts: $MSTR / $INTW / $STXX
📉 $MSTR | 4-hour bearish signal
━━━━━━━━━━━━━━━━━━
Technical analysis: ADX(30): Trend is forming; potential entry | MACD bearish cross below zero; bearish momentum accelerating | EMA5 crossed below EMA8; short-term trend turns bearish | KDJ bearish cross; short-term outlook is bearish (K: 53.8, D: 57.8) | Volume increased (1.9x)
Price change: -6.0600%
📉 $INTW | 4-hour bearish signal
━━━━━━━━━━━━━━━━━━
Technical analysis: ADX(51): Very strong trend (beware of an overheated pullback) | MACD bearish cross below zero; bearish momentum accelerating | EMA5 < EMA8 < EMA13; bearish alignment | KDJ in a weak trend, with bears in control (K: 41.0, D: 40.9) | Volume increased (2.3x)
Price change: -6.4100%
📉 $STXX | 4-hour bearish signal
━━━━━━━━━━━━━━━━━━
Technical analysis: ADX(62): Very strong trend (beware of an overheated pullback) | MACD bearish cross below zero; bearish momentum accelerating | EMA5 < EMA8 < EMA13; bearish alignment | KDJ bearish cross; short-term outlook is bearish (K: 34.9, D: 38.6) | Volume increased (2.2x)
Price change: -4.5000%
━━━━━━━━━━━━━━━━━━
#技术分析 #MSTR #INTW #STXX
📌 The above content is for reference only and does not constitute investment advice
13

⚡ $INTW IS ABSORBING SELLER PRESSURE AND SETTING UP A HIGH-CONVICTION CONTINUATION! 💥
Entry: 35.916 - 35.952 ⚡
Target: 36.704 🚀
Stop Loss: 35.663 ⚠️
Price action on $INTW is defending the key 35.970 support shelf with notable absorption, giving us a far cleaner risk-reward window than chasing higher. 📌 Buyers are consistently stepping in across this demand block, signaling steady accumulation before the next leg up. 📊
The structure remains cleanly bullish as long as support holds, positioning this setup for a swift expansion toward the upper liquidity target. ⚡ Tight execution here keeps capital protected while maintaining strong upside momentum. 💬 Are you bidding this retest zone or waiting for full breakout confirmation? 👇
⚠️ Not financial advice. Always manage your risk. 🛡️
🏷️ #INTW #LongSetup #Crypto #Breakout
🔥 💎
53

⚡ $INTW RECLAIMS HIGH-CONVICTION DEMAND FOR AN EXPLOSIVE CONTINUATION EXPANSION! 📈
Entry: 33.100 - 33.133 ⚡
Target: 33.409 🚀
Stop Loss: 33.027 ⚠️
📌 Heavy bid defense around the 33.100 pocket has halted seller pressure, opening a clean window for $INTW momentum. Volume expansion signals smart money absorbing remaining supply before driving price toward higher liquidity zones. 📊
💡 Risk parameters stay exceptionally sharp with order flow favoring aggressive buyers as long as support holds firm. 🌊 Capturing this continuation demands disciplined execution and total clarity on structural targets.
💬 Are you locking in your bid at support or waiting for the breakout confirmation? 👇
⚠️ Not financial advice. Always manage your risk. 🛡️
🏷️ #INTW #LongSetup #Crypto #Breakout #Altcoins
🔥 🚀
·
--
⚡ $INTW PREPARES FOR MOMENTUM EXPANSION AS BUYERS RECLAIM THE INTRADAY DEMAND ZONE 🚀
Entry: 33.100 - 33.133 ⚡
Target: 33.409 🚀
Stop Loss: 33.027 ⚠️
Buyers stepped up precisely at the 33.100 demand block, soaking up float and keeping market structure firmly intact. 📊 Order flow is shifting decisively back toward the bid, paving the way for a clean push higher toward overhead liquidity targets.
💡 Tight invalidation keeps risk strictly defined while leaving upside velocity wide open for disciplined execution. 💬 Are you filling your bids inside this order block or waiting for confirmation above local highs? 👇
⚠️ Not financial advice. Always manage your risk. 🛡️
🏷️ #INTW #LongSetup #Altcoins #Crypto
🔥 💎

Log in to explore more content
Join global crypto users on Binance Square
⚡️ Get latest and useful information about crypto.
💬 Trusted by the world’s largest crypto exchange.
👍 Discover real insights from verified creators.
Email / Phone number
Trending Topics
1
#CanMicrosoftDeliverOnAI
375,378 views
2,965 Discussing
2
#CanGoogleDefindItsCore
225,691 views
2,111 Discussing
3
#EarningsSeason
5.9M views
29,027 Discussing
4
#$10.9BBitcoinOptionsExpireFriday
788 views
51 Discussing
5
#ThailandSupremeCourtRulesBitcoinIsProperty
3,156 views
188 Discussing
6
#BitcoinSurpasses$81K
22,522 views
89 Discussing
7
#RobinhoodFalls8.4%AfterItsResults
14,585 views
302 Discussing
8
#KOSPISurges6.63%BackAbove6000
14,087 views
305 Discussing
9
#DatavaultAICantWithdrawBitcoinFromBiconomy
16,300 views
277 Discussing
10
#FOMCWatch
9.3M views
29,614 Discussing