
#etc
etc
1.8M views
7,534 Discussing
Hot
Latest

·
--
Bullish
$ETC
{spot}(ETCUSDT)
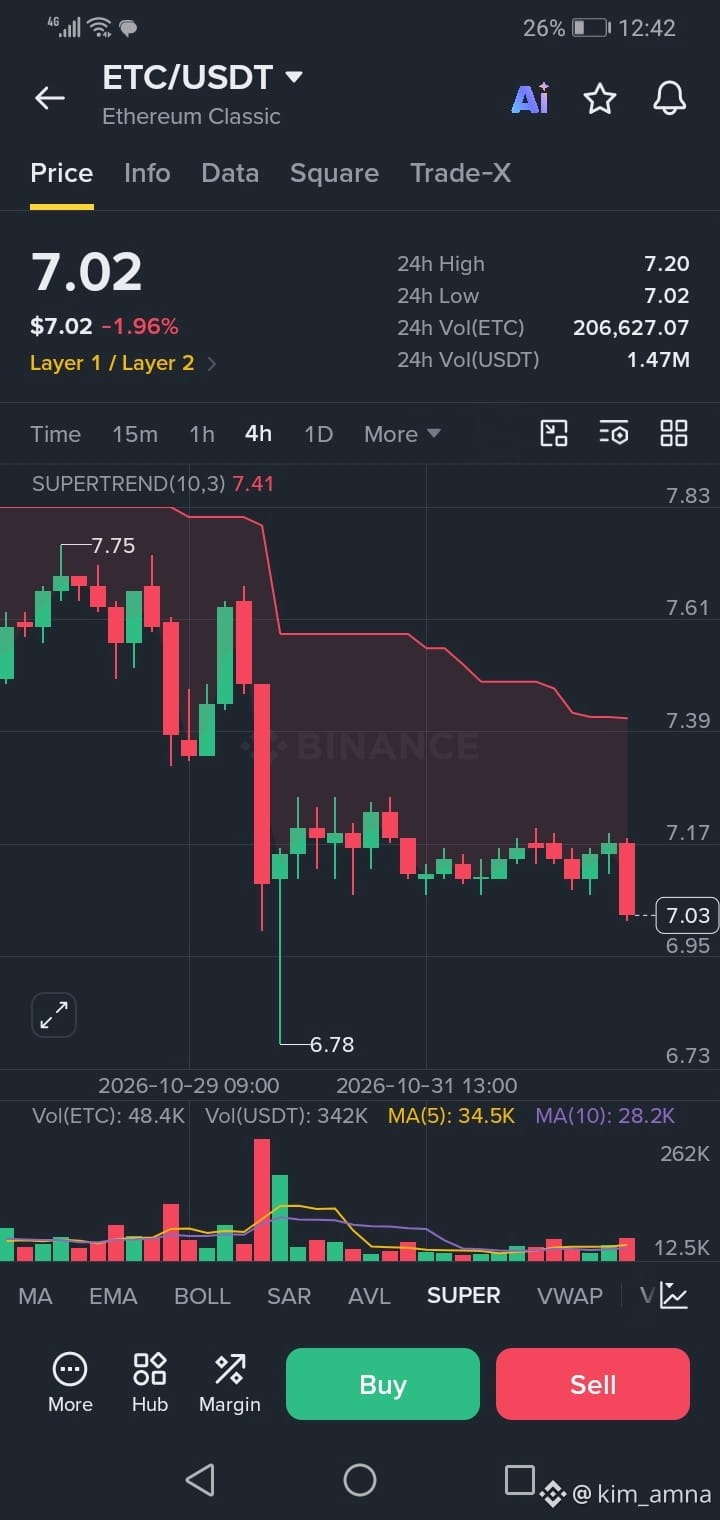
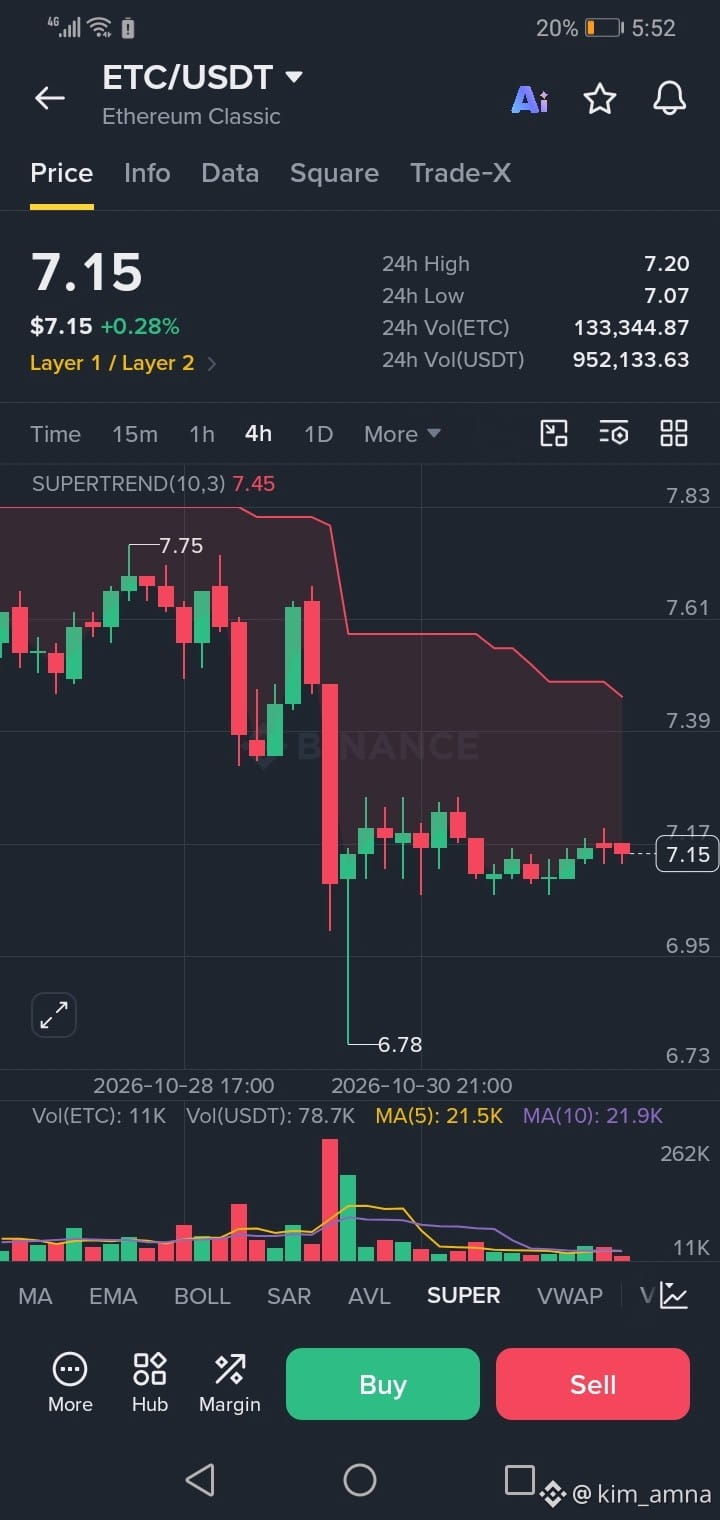
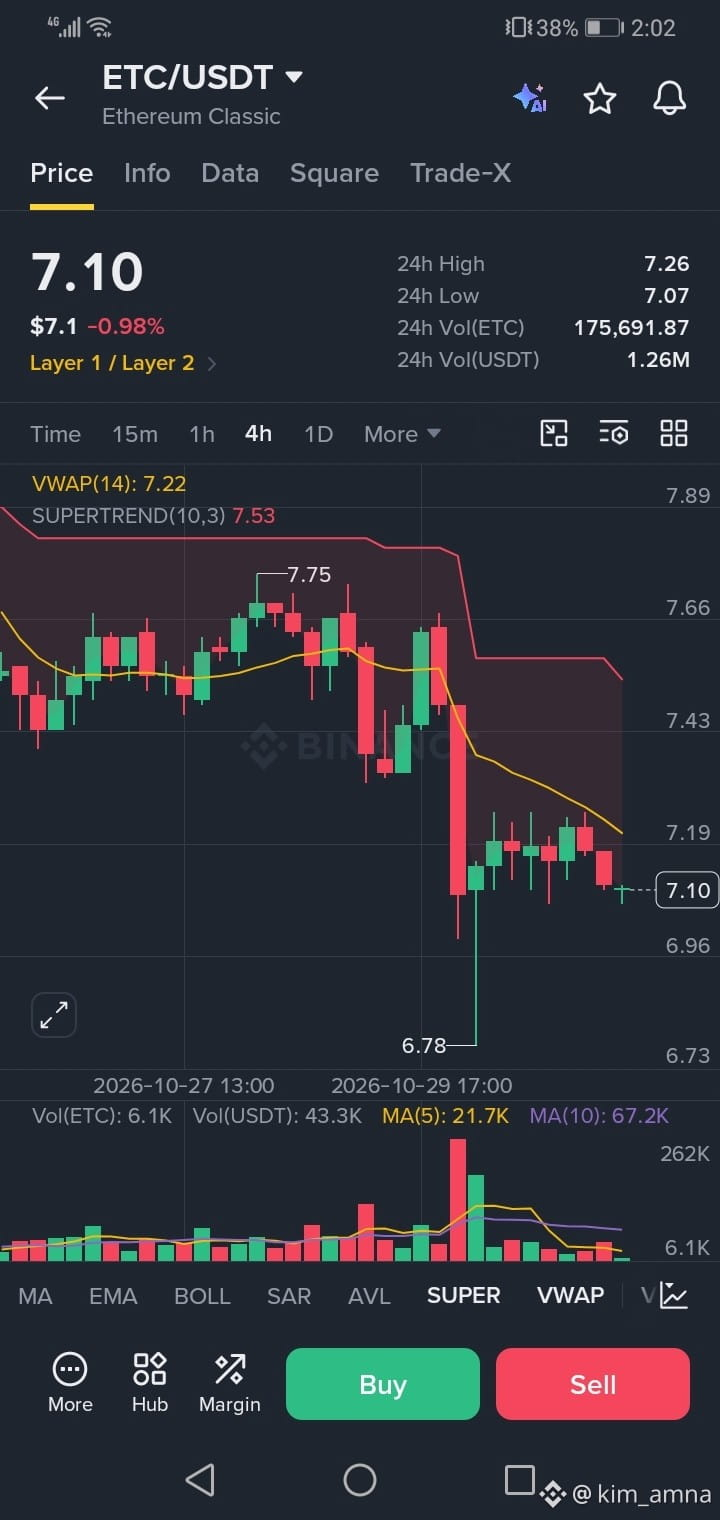
$ETC is playing textbook.
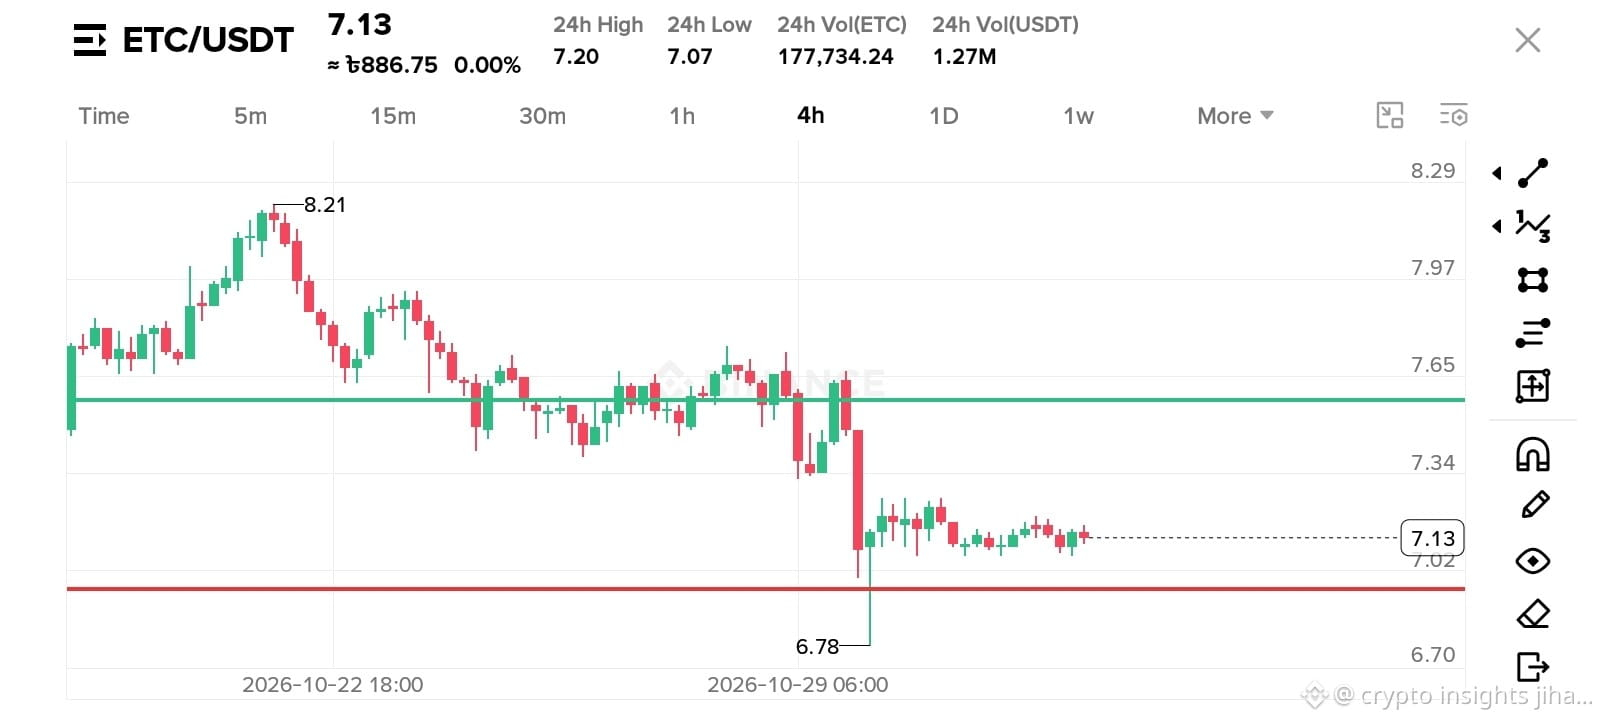
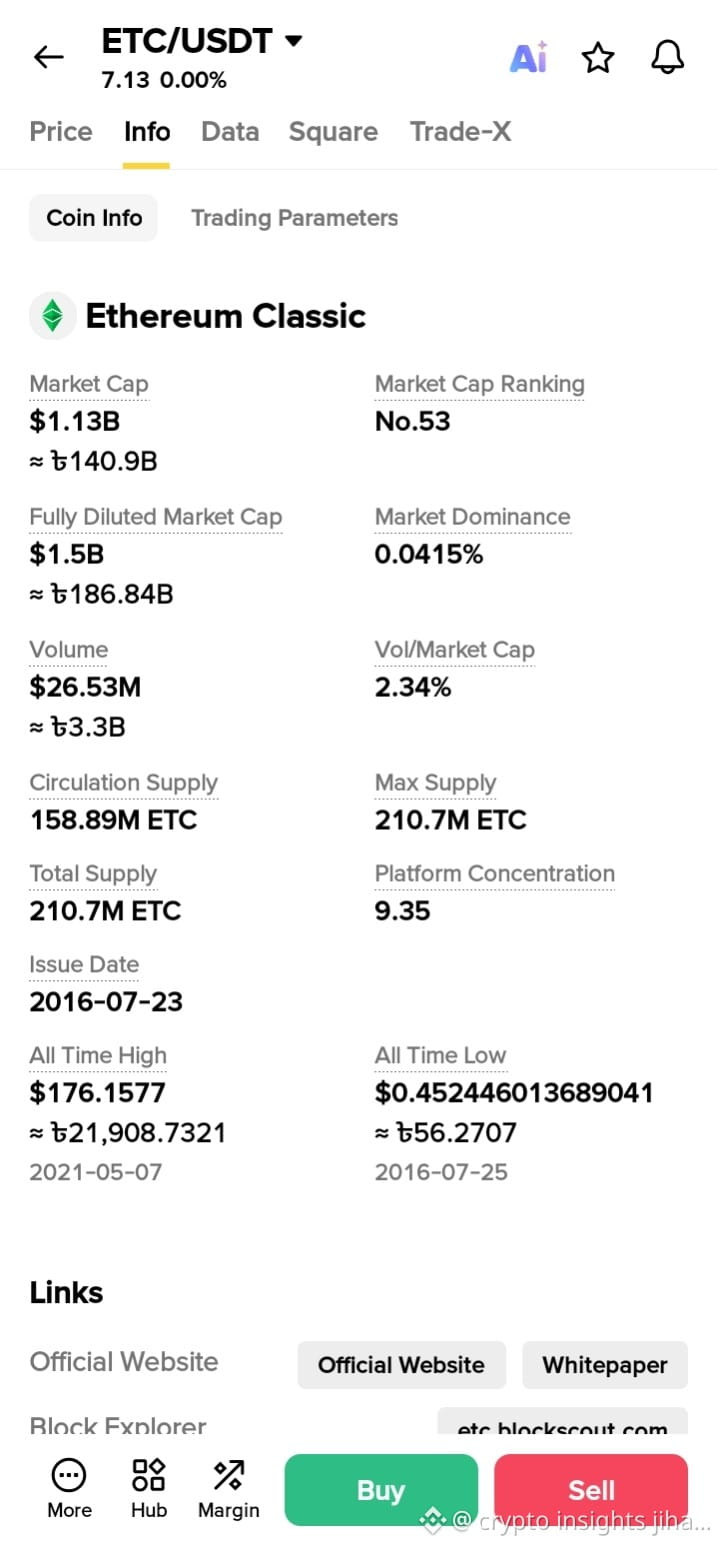
Look at 4H chart - clear rejection from 8.21 then slow bleed to 6.78. That long wick down to 6.78 was pure liquidity sweep, stopped out everyone. Red line held like a rock.
Now price stuck at 7.13 and building base. Volume drying up means sellers tired.
My target is green line - 7.55 area. That's the previous support turned resistance. If we break that, 7.55 will be easy.
Invalidation if we close below red line. But for now, long bias.
Not financial advice, just what I see.
#ETC #ETCUSDT
$ETC
$ETC is playing textbook.
Look at 4H chart - clear rejection from 8.21 then slow bleed to 6.78. That long wick down to 6.78 was pure liquidity sweep, stopped out everyone. Red line held like a rock.
Now price stuck at 7.13 and building base. Volume drying up means sellers tired.
My target is green line - 7.55 area. That's the previous support turned resistance. If we break that, 7.55 will be easy.
Invalidation if we close below red line. But for now, long bias.
Not financial advice, just what I see.
#ETC #ETCUSDT
$ETC is playing textbook.
Look at 4H chart - clear rejection from 8.21 then slow bleed to 6.78. That long wick down to 6.78 was pure liquidity sweep, stopped out everyone. Red line held like a rock.
Now price stuck at 7.13 and building base. Volume drying up means sellers tired.
My target is green line - 7.55 area. That's the previous support turned resistance. If we break that, 7.55 will be easy.
Invalidation if we close below red line. But for now, long bias.
Not financial advice, just what I see.
#ETC #ETCUSDT
2
362



·
--
$ETC is trending up with real conviction, buyers defending every dip along the way.
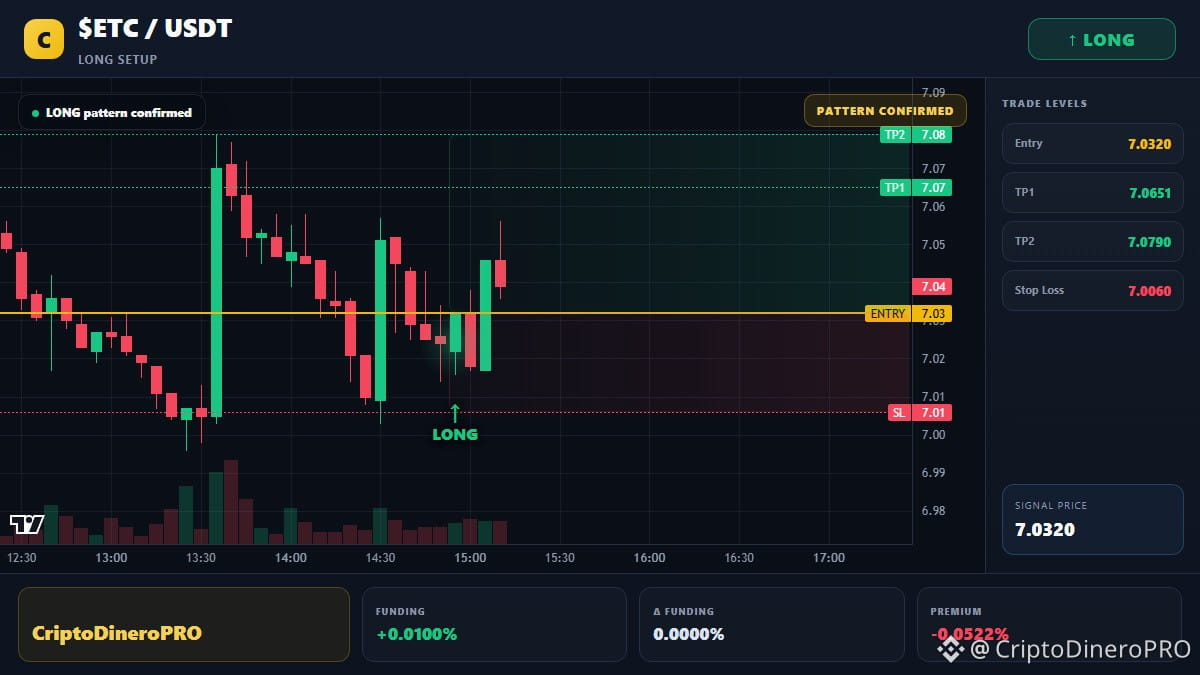
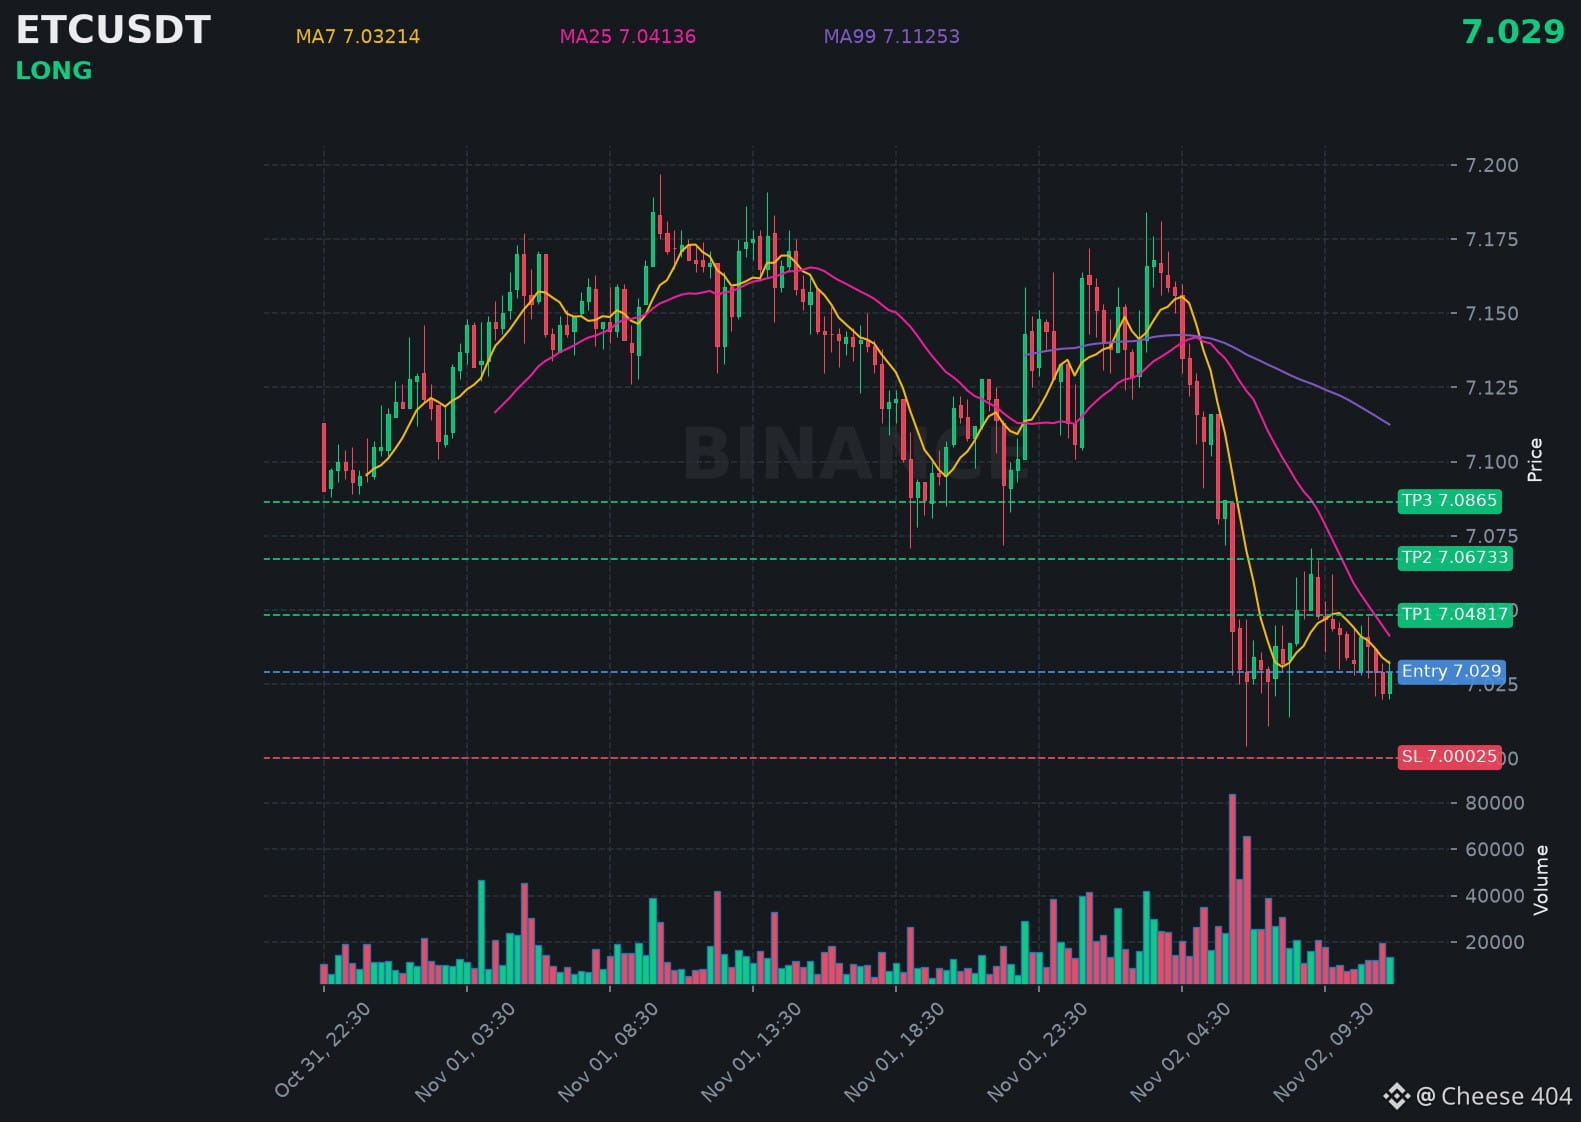
📍 @ 7.029 | Volume: 0.09M USD
RSI 38 | EMA20: 7.04534 USD
📈 Trade Plan:
📈 Entry: 7.02325 – 7.03475
🛑 Stop Loss: 7.00025
🎯 TP1: 7.04817
🎯 TP2: 7.06733
🎯 TP3: 7.0865
Waiting for a retest, then riding the uptrend.
👉 $ETC 👈 Catch it
#ETC
$ETC is trending up with real conviction, buyers defending every dip along the way.
📍 @ 7.029 | Volume: 0.09M USD
RSI 38 | EMA20: 7.04534 USD
📈 Trade Plan:
📈 Entry: 7.02325 – 7.03475
🛑 Stop Loss: 7.00025
🎯 TP1: 7.04817
🎯 TP2: 7.06733
🎯 TP3: 7.0865
Waiting for a retest, then riding the uptrend.
👉 $ETC 👈 Catch it
#ETC
📍 @ 7.029 | Volume: 0.09M USD
RSI 38 | EMA20: 7.04534 USD
📈 Trade Plan:
📈 Entry: 7.02325 – 7.03475
🛑 Stop Loss: 7.00025
🎯 TP1: 7.04817
🎯 TP2: 7.06733
🎯 TP3: 7.0865
Waiting for a retest, then riding the uptrend.
👉 $ETC 👈 Catch it
#ETC
111

·
--
ETC + DOGE | Market Outlook & Trading Strategy
$ETC is trading around $7.15, with a market cap of $1.1B and 24H volume near $27.3M. Despite a slight 0.34% recovery, bearish momentum remains dominant, with RSI around 34.5. Persistent selling pressure keeps the recovery uncertain.
Support: $7.046 / $6.756 / $6.466
Resistance: $7.224 / $7.416 / $7.644
A breakout above $7.224 could open a move toward $7.644, while losing $7.046 may trigger further downside.
$DOGE is trading near $0.0759, with a market cap around $11.82B and 24H volume of $240.36M. A modest recovery is emerging alongside broader market stabilization, but RSI near 36.4 signals weak momentum.
Support: $0.0742 / $0.0717 / $0.0685
Resistance: $0.0763 / $0.0791 / $0.0813
A sustained break above $0.0763 could push DOGE toward $0.0791, while a drop below $0.0742 risks another correction.
Strategy: ETC needs stronger buying volume to confirm a reversal, while DOGE requires a breakout above $0.0763 for bullish confirmation. Watch BTC direction, volume and daily candle closes before entering positions.
#ETC #DOGE #BrazilVirtualAssetLicenseDeadlineDrawsAbout40Firms #BTCPayServerUrgesOperatorsToShutDownInstances #BinanceSquareTalks
{spot}(ETCUSDT)
{spot}(DOGEUSDT)
ETC + DOGE | Market Outlook & Trading Strategy
$ETC is trading around $7.15, with a market cap of $1.1B and 24H volume near $27.3M. Despite a slight 0.34% recovery, bearish momentum remains dominant, with RSI around 34.5. Persistent selling pressure keeps the recovery uncertain.
Support: $7.046 / $6.756 / $6.466
Resistance: $7.224 / $7.416 / $7.644
A breakout above $7.224 could open a move toward $7.644, while losing $7.046 may trigger further downside.
$DOGE is trading near $0.0759, with a market cap around $11.82B and 24H volume of $240.36M. A modest recovery is emerging alongside broader market stabilization, but RSI near 36.4 signals weak momentum.
Support: $0.0742 / $0.0717 / $0.0685
Resistance: $0.0763 / $0.0791 / $0.0813
A sustained break above $0.0763 could push DOGE toward $0.0791, while a drop below $0.0742 risks another correction.
Strategy: ETC needs stronger buying volume to confirm a reversal, while DOGE requires a breakout above $0.0763 for bullish confirmation. Watch BTC direction, volume and daily candle closes before entering positions.
#ETC #DOGE #BrazilVirtualAssetLicenseDeadlineDrawsAbout40Firms #BTCPayServerUrgesOperatorsToShutDownInstances #BinanceSquareTalks
$ETC is trading around $7.15, with a market cap of $1.1B and 24H volume near $27.3M. Despite a slight 0.34% recovery, bearish momentum remains dominant, with RSI around 34.5. Persistent selling pressure keeps the recovery uncertain.
Support: $7.046 / $6.756 / $6.466
Resistance: $7.224 / $7.416 / $7.644
A breakout above $7.224 could open a move toward $7.644, while losing $7.046 may trigger further downside.
$DOGE is trading near $0.0759, with a market cap around $11.82B and 24H volume of $240.36M. A modest recovery is emerging alongside broader market stabilization, but RSI near 36.4 signals weak momentum.
Support: $0.0742 / $0.0717 / $0.0685
Resistance: $0.0763 / $0.0791 / $0.0813
A sustained break above $0.0763 could push DOGE toward $0.0791, while a drop below $0.0742 risks another correction.
Strategy: ETC needs stronger buying volume to confirm a reversal, while DOGE requires a breakout above $0.0763 for bullish confirmation. Watch BTC direction, volume and daily candle closes before entering positions.
#ETC #DOGE #BrazilVirtualAssetLicenseDeadlineDrawsAbout40Firms #BTCPayServerUrgesOperatorsToShutDownInstances #BinanceSquareTalks
3
65

·
--
ETC & BTC — Two Crypto Giants to Watch!
The crypto market is showing signs of recovery, but buyers still need to prove their strength! BTC is leading the market sentiment, while ETC is struggling to regain bullish momentum. Both coins are at important price levels.
$ETC : Trading around $7.14
Support: $7.05 | $6.76
Resistance: $7.22 | $7.42
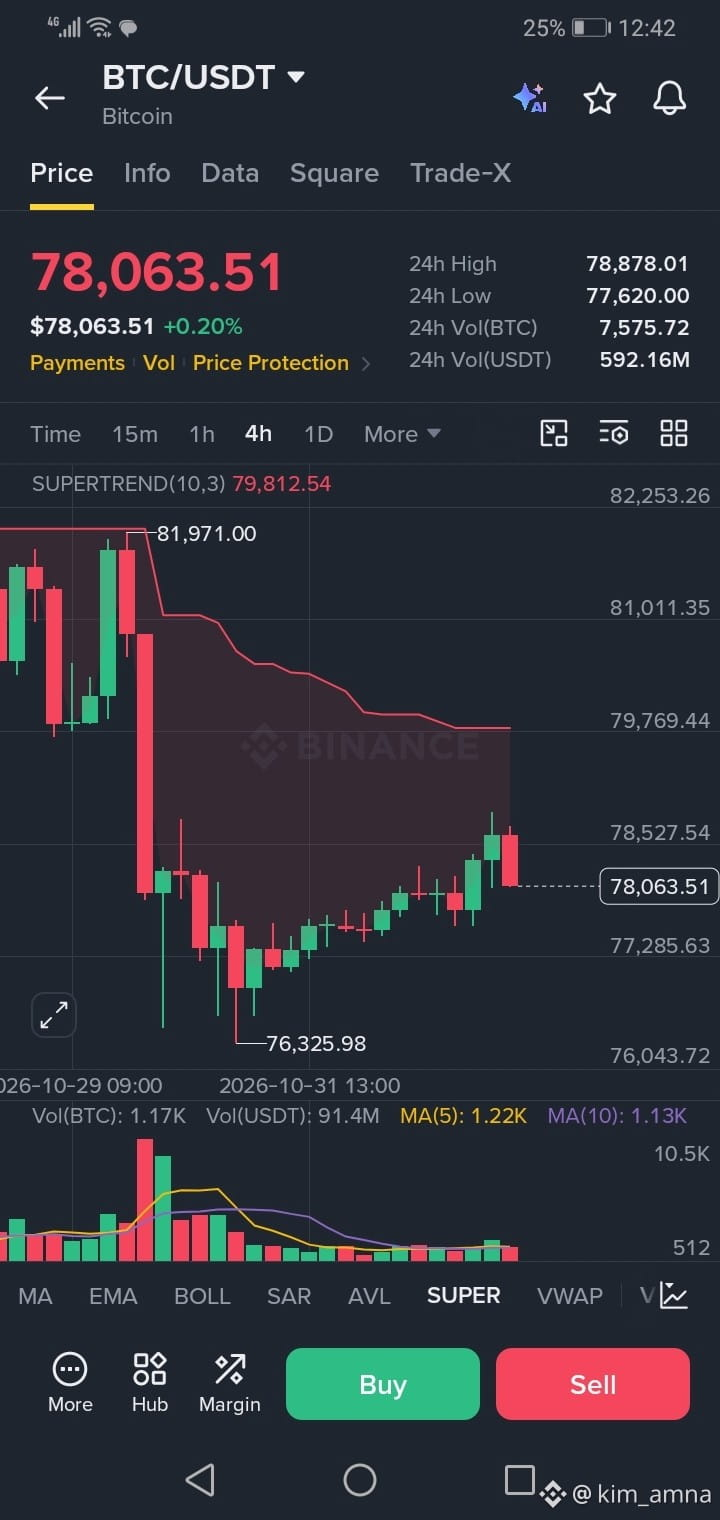
$BTC : Trading around $78,350
Support: $76,141 | $75,000
Resistance: $79,107 | $80,000
Market Outlook: BTC holding above $76K could support a broader market recovery, while a break above $80K may strengthen bullish sentiment. ETC needs to reclaim $7.22 to show signs of a stronger recovery.
👀 Which one has more potential to surprise the market — ETC or BTC?
#ETC #BTC #BrazilVirtualAssetLicenseDeadlineDrawsAbout40Firms #BinanceSquare #Write2Earn
{spot}(BTCUSDT)
{spot}(ETCUSDT)
ETC & BTC — Two Crypto Giants to Watch!
The crypto market is showing signs of recovery, but buyers still need to prove their strength! BTC is leading the market sentiment, while ETC is struggling to regain bullish momentum. Both coins are at important price levels.
$ETC : Trading around $7.14
Support: $7.05 | $6.76
Resistance: $7.22 | $7.42
$BTC : Trading around $78,350
Support: $76,141 | $75,000
Resistance: $79,107 | $80,000
Market Outlook: BTC holding above $76K could support a broader market recovery, while a break above $80K may strengthen bullish sentiment. ETC needs to reclaim $7.22 to show signs of a stronger recovery.
👀 Which one has more potential to surprise the market — ETC or BTC?
#ETC #BTC #BrazilVirtualAssetLicenseDeadlineDrawsAbout40Firms #BinanceSquare #Write2Earn
The crypto market is showing signs of recovery, but buyers still need to prove their strength! BTC is leading the market sentiment, while ETC is struggling to regain bullish momentum. Both coins are at important price levels.
$ETC : Trading around $7.14
Support: $7.05 | $6.76
Resistance: $7.22 | $7.42
$BTC : Trading around $78,350
Support: $76,141 | $75,000
Resistance: $79,107 | $80,000
Market Outlook: BTC holding above $76K could support a broader market recovery, while a break above $80K may strengthen bullish sentiment. ETC needs to reclaim $7.22 to show signs of a stronger recovery.
👀 Which one has more potential to surprise the market — ETC or BTC?
#ETC #BTC #BrazilVirtualAssetLicenseDeadlineDrawsAbout40Firms #BinanceSquare #Write2Earn
2
60

·
--
$ETC #ETC 🚀
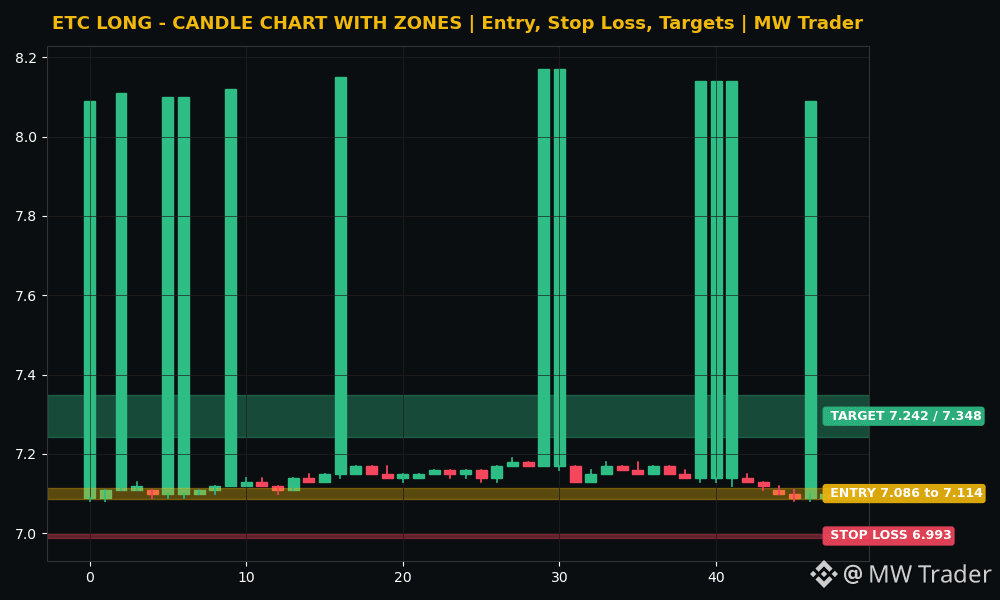
Direction: LONG 🚀
Entry zone: 7.086 to 7.114
Stop loss: 6.993
Target 1: 7.242
Target 2: 7.348
Ethereum Classic is trading near 7.10 dollars, up 0.36 percent in 24 hours, inside a tight range of 7.08 to 7.19. My reading is that sellers pushed it to the low and ran out of room, not that the trend broke. 📈 The recent closes were flat and firm, 7.10, then 7.09, then 7.09, then 7.10, which is a base forming at the low, not a cascade lower. A long from the current zone, with a stop below 6.993, targets 7.242 first and then 7.348 if buyers reclaim the range. A fall back under 6.993 kills the idea without debate.
Futures trading is risky. Trade small, use a stop loss, and do your own research. This is my reading, not a guaranteed signal.
Does Ethereum Classic bounce to 7.242 first, or break down below 6.993? 🤔
Follow for more trades.
#EthereumClassic #Crypto #FuturesTrading #TradingSignals
$ETC #ETC 🚀
Direction: LONG 🚀
Entry zone: 7.086 to 7.114
Stop loss: 6.993
Target 1: 7.242
Target 2: 7.348
Ethereum Classic is trading near 7.10 dollars, up 0.36 percent in 24 hours, inside a tight range of 7.08 to 7.19. My reading is that sellers pushed it to the low and ran out of room, not that the trend broke. 📈 The recent closes were flat and firm, 7.10, then 7.09, then 7.09, then 7.10, which is a base forming at the low, not a cascade lower. A long from the current zone, with a stop below 6.993, targets 7.242 first and then 7.348 if buyers reclaim the range. A fall back under 6.993 kills the idea without debate.
Futures trading is risky. Trade small, use a stop loss, and do your own research. This is my reading, not a guaranteed signal.
Does Ethereum Classic bounce to 7.242 first, or break down below 6.993? 🤔
Follow for more trades.
#EthereumClassic #Crypto #FuturesTrading #TradingSignals
Direction: LONG 🚀
Entry zone: 7.086 to 7.114
Stop loss: 6.993
Target 1: 7.242
Target 2: 7.348
Ethereum Classic is trading near 7.10 dollars, up 0.36 percent in 24 hours, inside a tight range of 7.08 to 7.19. My reading is that sellers pushed it to the low and ran out of room, not that the trend broke. 📈 The recent closes were flat and firm, 7.10, then 7.09, then 7.09, then 7.10, which is a base forming at the low, not a cascade lower. A long from the current zone, with a stop below 6.993, targets 7.242 first and then 7.348 if buyers reclaim the range. A fall back under 6.993 kills the idea without debate.
Futures trading is risky. Trade small, use a stop loss, and do your own research. This is my reading, not a guaranteed signal.
Does Ethereum Classic bounce to 7.242 first, or break down below 6.993? 🤔
Follow for more trades.
#EthereumClassic #Crypto #FuturesTrading #TradingSignals
11

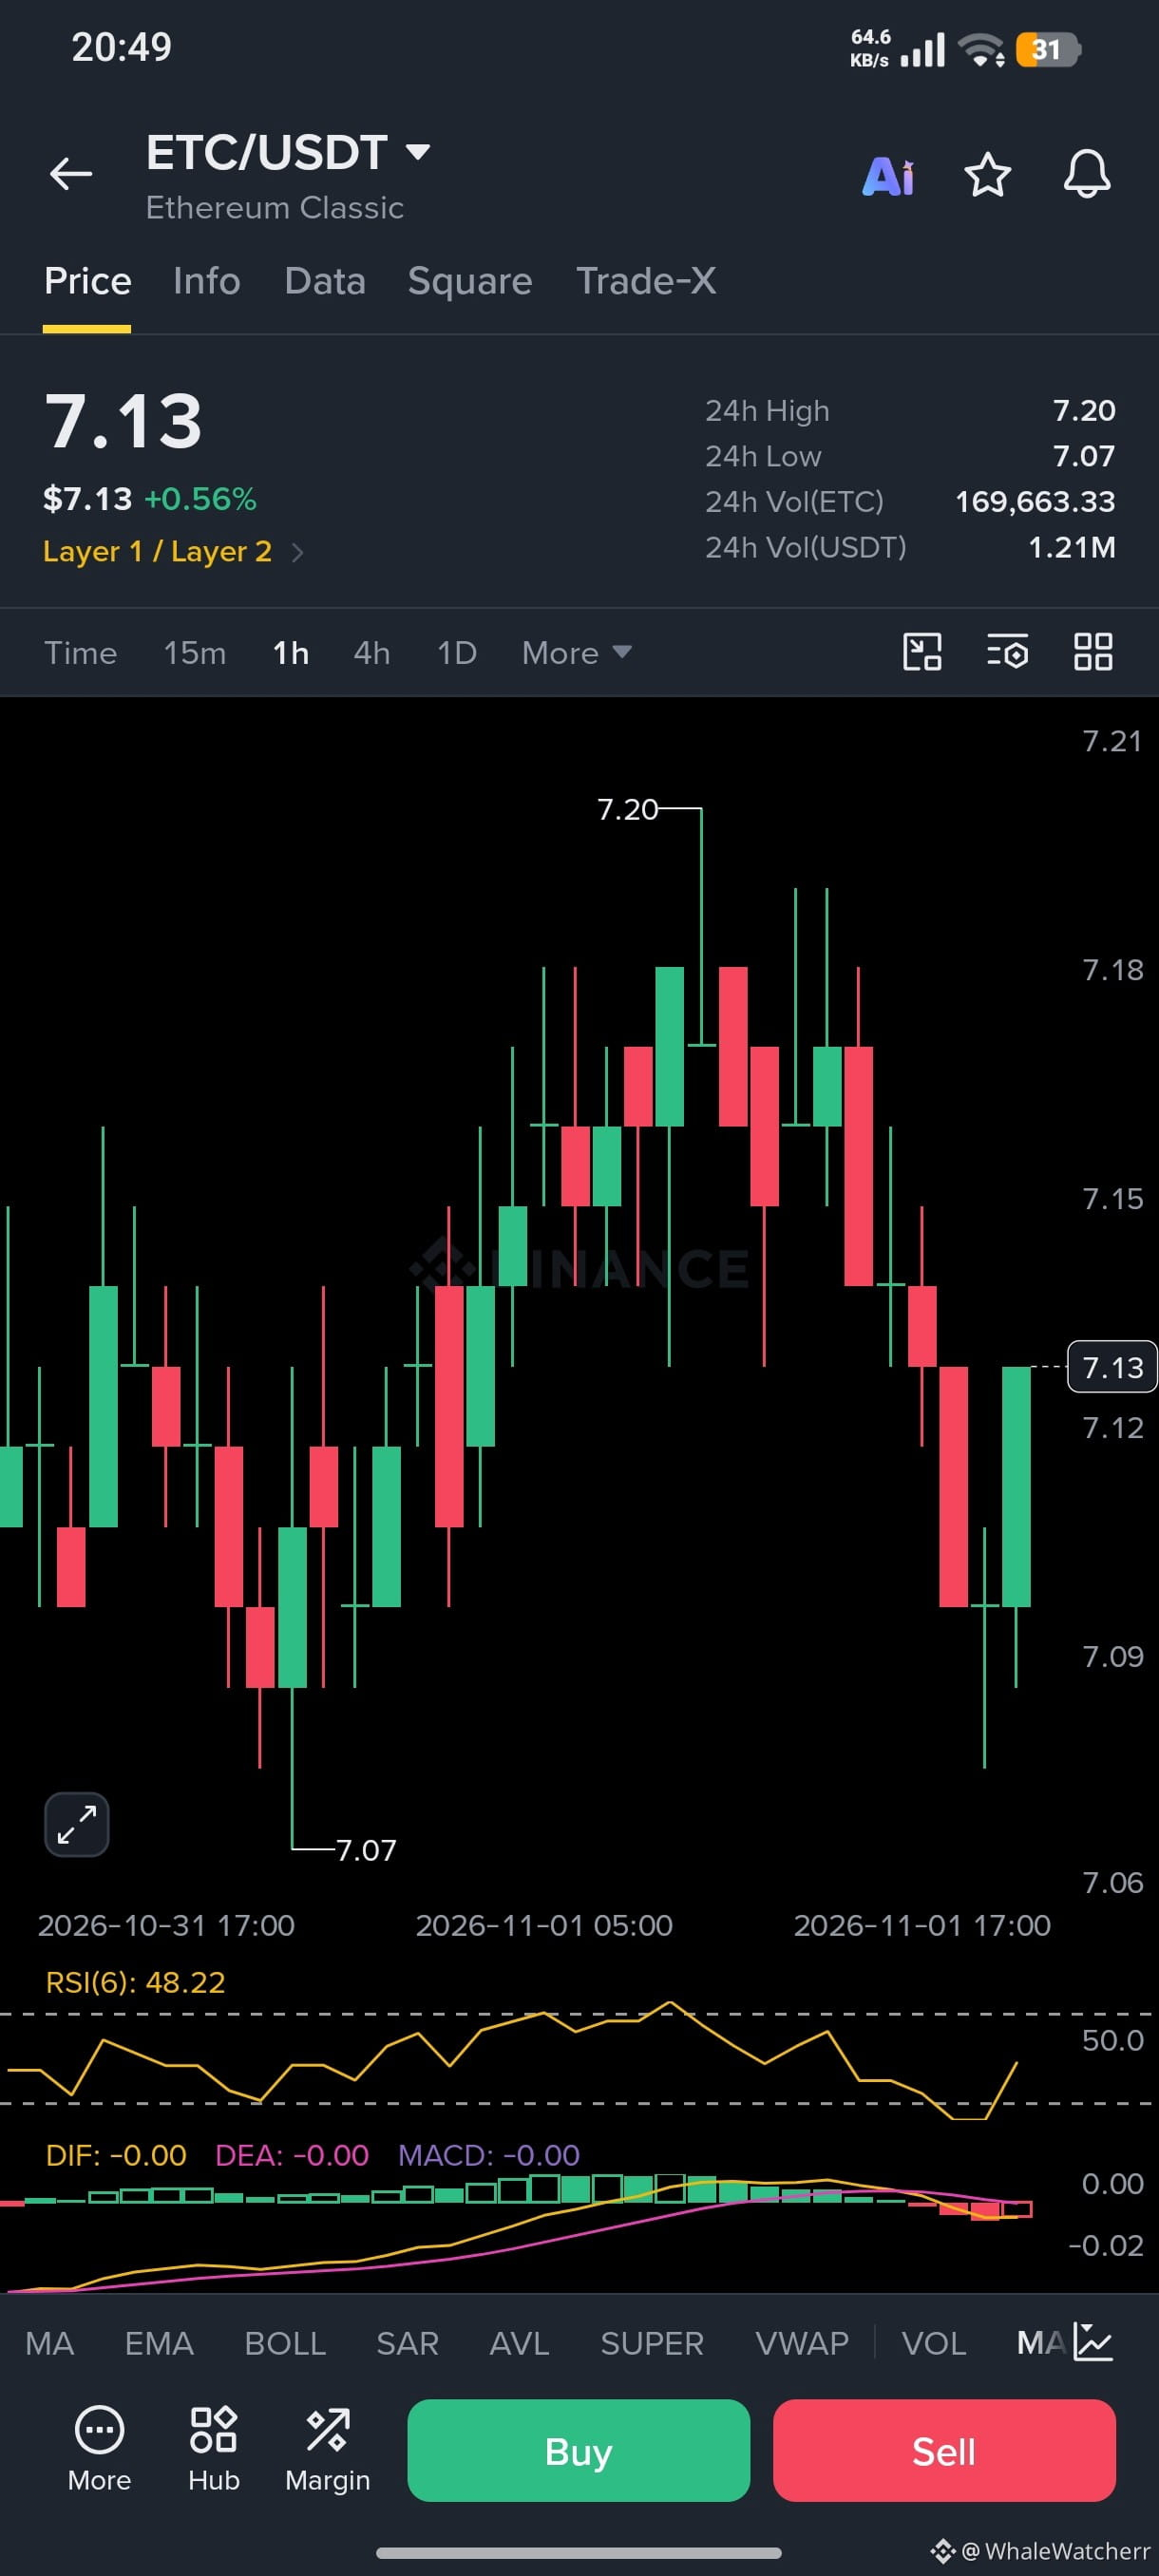
🚨 $ETC +0.56% | Holding $7.13 after a rough week!
ETC is trying to stabilize after weeks of selling pressure, with the price still capped below its 200-day moving average.
$ETC
1H chart: $7.20 high → $7.07 low, now $7.13 with RSI(6) at 48 and MACD flat.
Buy the dip? 🤔 Share your move 👇
$ETC
{spot}(ETCUSDT)
#ETC #EthereumClassic #Binance #BuyTheDip
🚨 $ETC +0.56% | Holding $7.13 after a rough week!
ETC is trying to stabilize after weeks of selling pressure, with the price still capped below its 200-day moving average.
$ETC
1H chart: $7.20 high → $7.07 low, now $7.13 with RSI(6) at 48 and MACD flat.
Buy the dip? 🤔 Share your move 👇
$ETC
#ETC #EthereumClassic #Binance #BuyTheDip
ETC is trying to stabilize after weeks of selling pressure, with the price still capped below its 200-day moving average.
$ETC
1H chart: $7.20 high → $7.07 low, now $7.13 with RSI(6) at 48 and MACD flat.
Buy the dip? 🤔 Share your move 👇
$ETC
#ETC #EthereumClassic #Binance #BuyTheDip
1
30

·
--
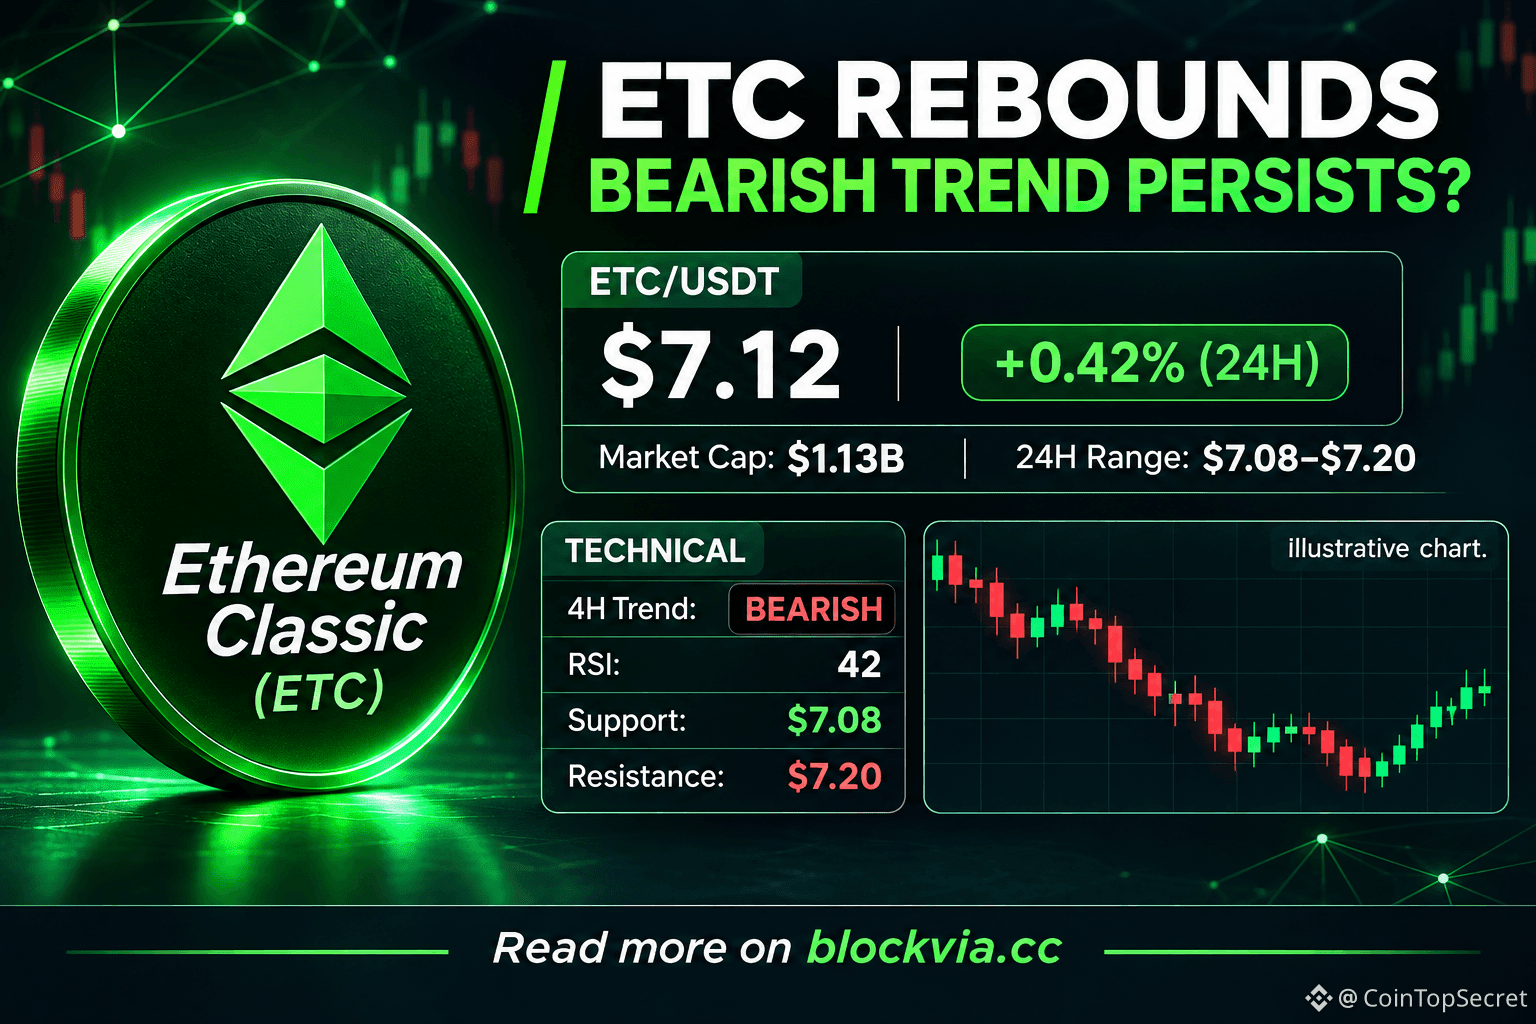
$ETC Update 🔎 Can Ethereum Classic turn its rebound into a recovery?
ETC is trading slightly higher, but the 4H trend remains bearish. RSI sits at 42, while MACD shows a bullish crossover. Volume confirmation remains weak.
👀 Next step to watch:
🔴 Bearish case: Below $7.08, watch for further downside.
🟢 Bullish case: Reclaim $7.20, then monitor $7.26.
📝 My take:
A recovery needs stronger momentum and volume confirmation.
Visit blockvia.cc for Signal Analysis.
#ETC #EthereumClassic #CryptoNews #CryptoAnalysis #Altcoins
$ETC Update 🔎 Can Ethereum Classic turn its rebound into a recovery?
ETC is trading slightly higher, but the 4H trend remains bearish. RSI sits at 42, while MACD shows a bullish crossover. Volume confirmation remains weak.
👀 Next step to watch:
🔴 Bearish case: Below $7.08, watch for further downside.
🟢 Bullish case: Reclaim $7.20, then monitor $7.26.
📝 My take:
A recovery needs stronger momentum and volume confirmation.
Visit blockvia.cc for Signal Analysis.
#ETC #EthereumClassic #CryptoNews #CryptoAnalysis #Altcoins
ETC is trading slightly higher, but the 4H trend remains bearish. RSI sits at 42, while MACD shows a bullish crossover. Volume confirmation remains weak.
👀 Next step to watch:
🔴 Bearish case: Below $7.08, watch for further downside.
🟢 Bullish case: Reclaim $7.20, then monitor $7.26.
📝 My take:
A recovery needs stronger momentum and volume confirmation.
Visit blockvia.cc for Signal Analysis.
#ETC #EthereumClassic #CryptoNews #CryptoAnalysis #Altcoins
114
·
--
HYPE & ETC — Two Coins, Two Big Opportunities!
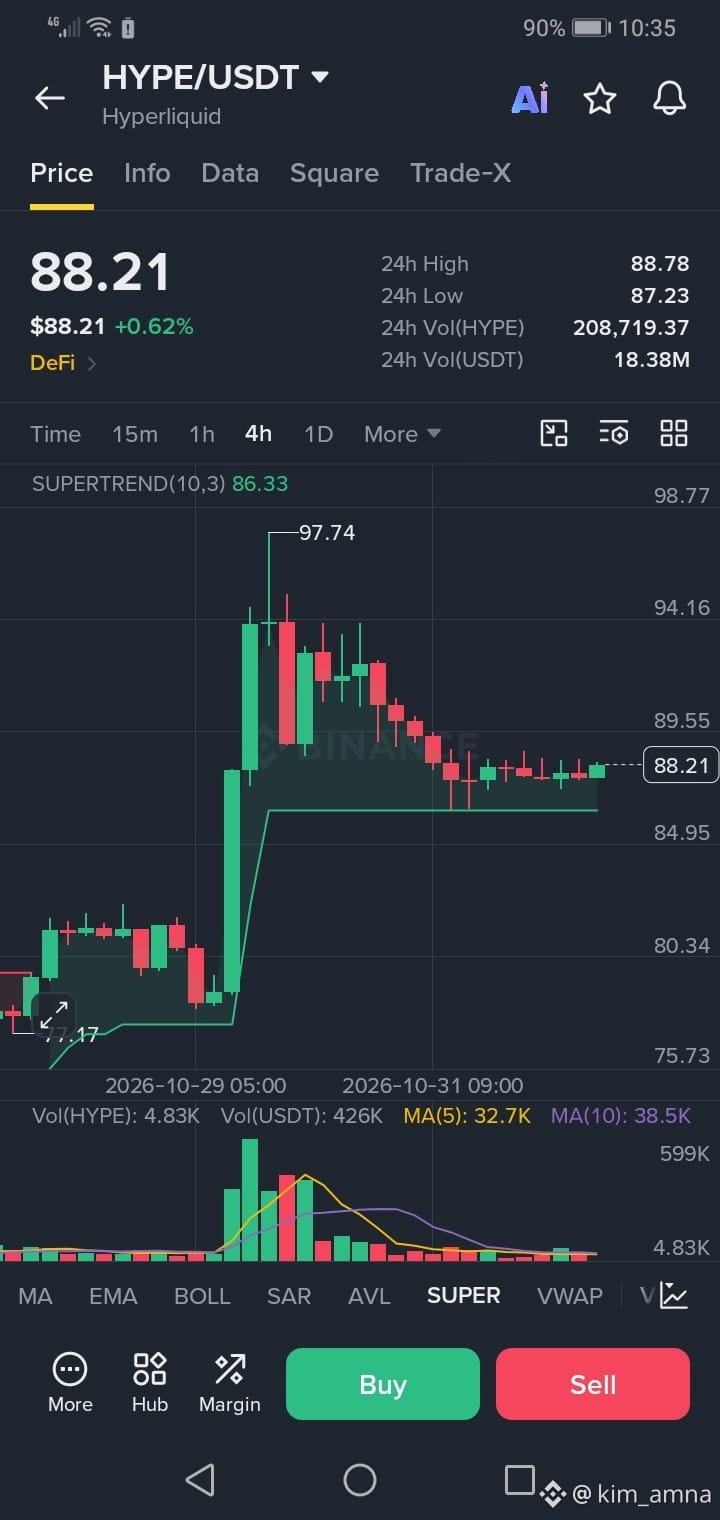
$HYPE trading around $88.08
Support: $86.17–$83.95
Resistance: $89.42–$91.52.
HYPE has a bullish technical bias, with ICE's reported plan for a regulated U.S. perpetual-futures venue adding fresh market attention. A breakout above $89.42 could target $91.52–$94.95.
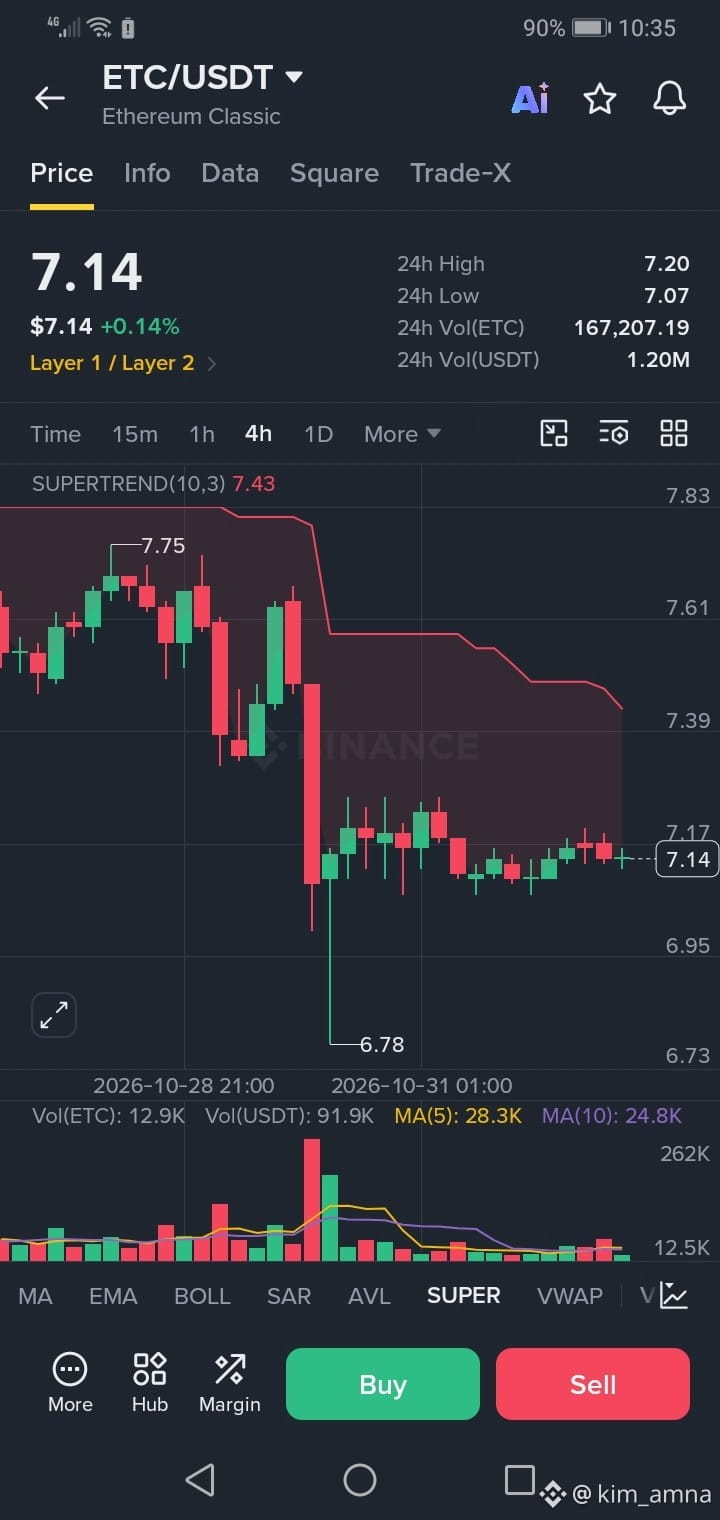
$ETC trading around $7.14
Support: $7.02–$6.85
Resistance: $7.27–$7.55.
ETC is facing bearish pressure, and buyers need to reclaim $7.27 to improve the outlook. A confirmed breakout could open a move toward $7.55.
STRONGER TRADING TAKEAWAY
- Bullish entry: Wait for HYPE to break $89.42 and hold the retest.
- ETC entry: Watch for a confirmed recovery above $7.27.
- Take Profit: HYPE $91.52–$94.95 | ETC $7.27–$7.55.
- Risk management: Set stop-losses and avoid chasing sudden pumps.
BOTTOM LINE: HYPE currently has the stronger bullish setup, while ETC needs confirmation from buyers. Trade the breakout, not the hype!
#ETC #hype #BinanceUpdatesProofofReservesAddresses #BinanceToResumePhaseOneOfWithdrawals #Write2Earn
{spot}(ETCUSDT)
{spot}(HYPEUSDT)
HYPE & ETC — Two Coins, Two Big Opportunities!
$HYPE trading around $88.08
Support: $86.17–$83.95
Resistance: $89.42–$91.52.
HYPE has a bullish technical bias, with ICE's reported plan for a regulated U.S. perpetual-futures venue adding fresh market attention. A breakout above $89.42 could target $91.52–$94.95.
$ETC trading around $7.14
Support: $7.02–$6.85
Resistance: $7.27–$7.55.
ETC is facing bearish pressure, and buyers need to reclaim $7.27 to improve the outlook. A confirmed breakout could open a move toward $7.55.
STRONGER TRADING TAKEAWAY
- Bullish entry: Wait for HYPE to break $89.42 and hold the retest.
- ETC entry: Watch for a confirmed recovery above $7.27.
- Take Profit: HYPE $91.52–$94.95 | ETC $7.27–$7.55.
- Risk management: Set stop-losses and avoid chasing sudden pumps.
BOTTOM LINE: HYPE currently has the stronger bullish setup, while ETC needs confirmation from buyers. Trade the breakout, not the hype!
#ETC #hype #BinanceUpdatesProofofReservesAddresses #BinanceToResumePhaseOneOfWithdrawals #Write2Earn
$HYPE trading around $88.08
Support: $86.17–$83.95
Resistance: $89.42–$91.52.
HYPE has a bullish technical bias, with ICE's reported plan for a regulated U.S. perpetual-futures venue adding fresh market attention. A breakout above $89.42 could target $91.52–$94.95.
$ETC trading around $7.14
Support: $7.02–$6.85
Resistance: $7.27–$7.55.
ETC is facing bearish pressure, and buyers need to reclaim $7.27 to improve the outlook. A confirmed breakout could open a move toward $7.55.
STRONGER TRADING TAKEAWAY
- Bullish entry: Wait for HYPE to break $89.42 and hold the retest.
- ETC entry: Watch for a confirmed recovery above $7.27.
- Take Profit: HYPE $91.52–$94.95 | ETC $7.27–$7.55.
- Risk management: Set stop-losses and avoid chasing sudden pumps.
BOTTOM LINE: HYPE currently has the stronger bullish setup, while ETC needs confirmation from buyers. Trade the breakout, not the hype!
#ETC #hype #BinanceUpdatesProofofReservesAddresses #BinanceToResumePhaseOneOfWithdrawals #Write2Earn
3
12
·
--
ETC & SYN — Two Altcoins Ready to Catch Market Attention!
The altcoin market is heating up, and these two deserve a closer look. ETC is holding its established blockchain narrative, while SYN is attracting attention through cross-chain DeFi.
$ETC
💰 Price: $7.16
🟢 Support: $7.02 – $6.85
🔴 Resistance: $7.27 – $7.55
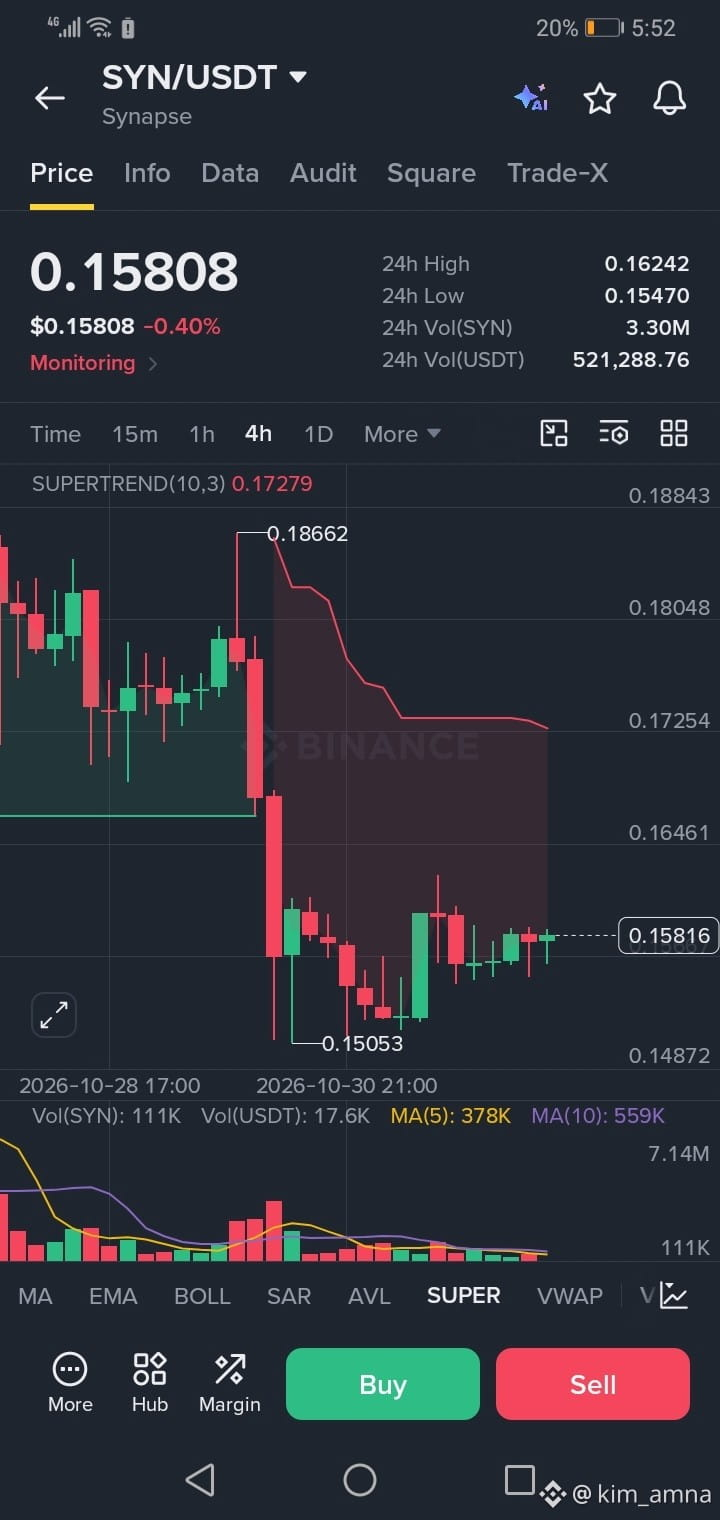
🔹 $SYN
💰 Price: $0.157
🟢 Support: $0.149 – $0.139
🔴 Resistance: $0.160 – $0.170
Market Watch:ETC needs to reclaim $7.55 to strengthen its bullish outlook. Meanwhile, SYN breaking above $0.170 could attract fresh buying interest.
Two different projects, two different opportunities. Which one are you watching for the next big move — ETC or SYN?
#ETC #SYN #YiHe:ProofOfReserves:10TokensAt100%Backing #BinanceSquare #Write2Earn
{spot}(ETCUSDT)
{spot}(SYNUSDT)
ETC & SYN — Two Altcoins Ready to Catch Market Attention!
The altcoin market is heating up, and these two deserve a closer look. ETC is holding its established blockchain narrative, while SYN is attracting attention through cross-chain DeFi.
$ETC
💰 Price: $7.16
🟢 Support: $7.02 – $6.85
🔴 Resistance: $7.27 – $7.55
🔹 $SYN
💰 Price: $0.157
🟢 Support: $0.149 – $0.139
🔴 Resistance: $0.160 – $0.170
Market Watch:ETC needs to reclaim $7.55 to strengthen its bullish outlook. Meanwhile, SYN breaking above $0.170 could attract fresh buying interest.
Two different projects, two different opportunities. Which one are you watching for the next big move — ETC or SYN?
#ETC #SYN #YiHe:ProofOfReserves:10TokensAt100%Backing #BinanceSquare #Write2Earn
The altcoin market is heating up, and these two deserve a closer look. ETC is holding its established blockchain narrative, while SYN is attracting attention through cross-chain DeFi.
$ETC
💰 Price: $7.16
🟢 Support: $7.02 – $6.85
🔴 Resistance: $7.27 – $7.55
🔹 $SYN
💰 Price: $0.157
🟢 Support: $0.149 – $0.139
🔴 Resistance: $0.160 – $0.170
Market Watch:ETC needs to reclaim $7.55 to strengthen its bullish outlook. Meanwhile, SYN breaking above $0.170 could attract fresh buying interest.
Two different projects, two different opportunities. Which one are you watching for the next big move — ETC or SYN?
#ETC #SYN #YiHe:ProofOfReserves:10TokensAt100%Backing #BinanceSquare #Write2Earn
3
12
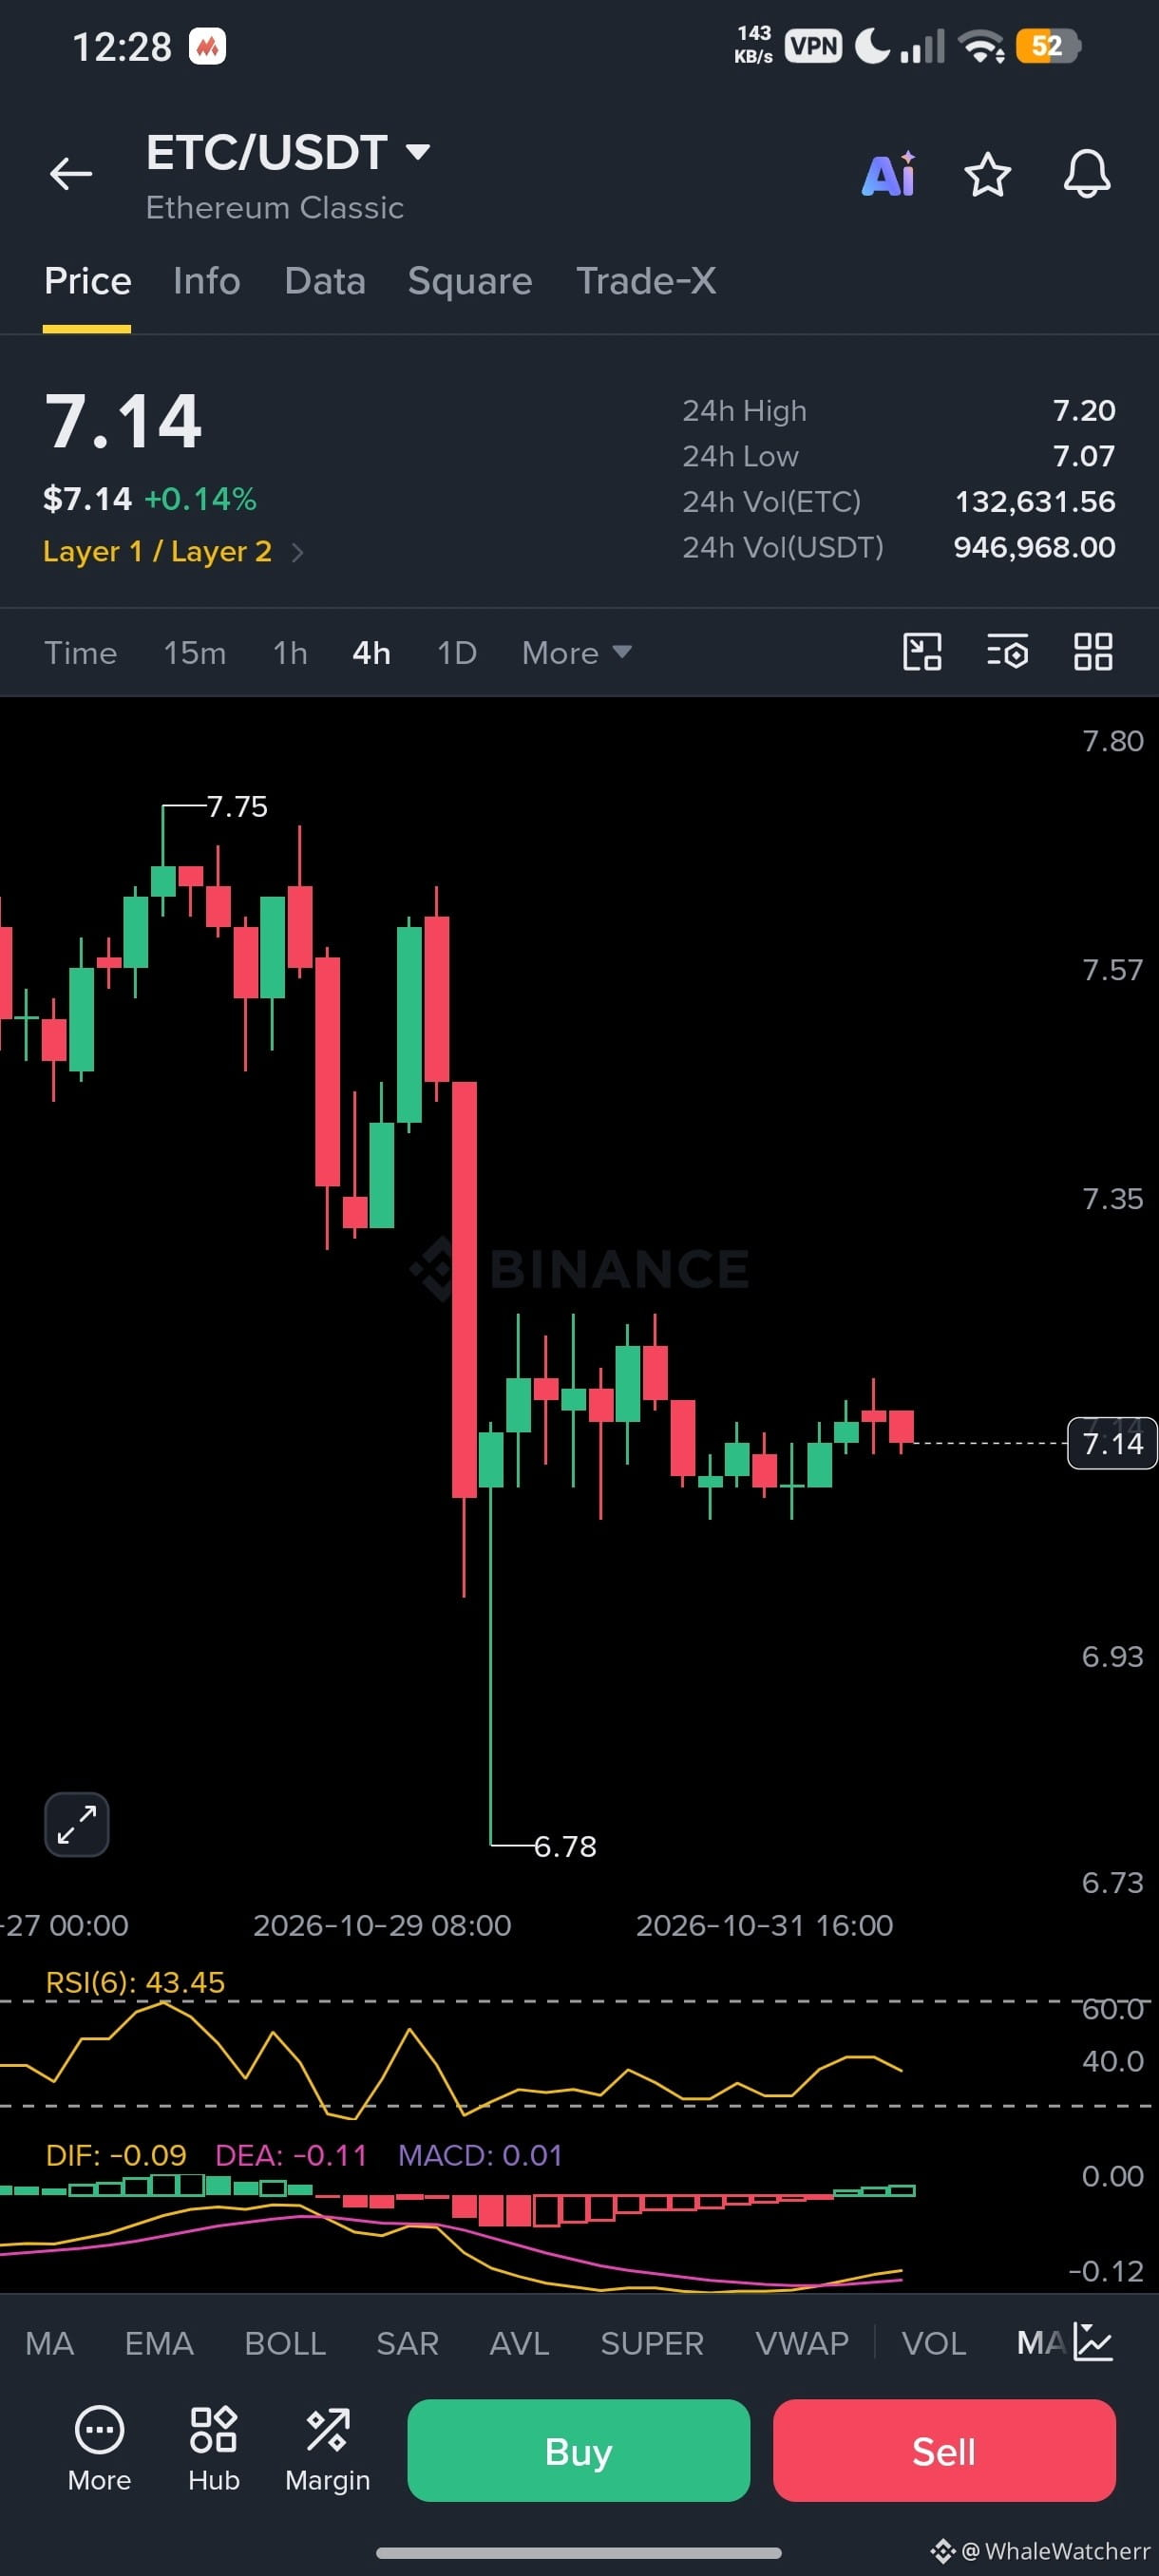
🚨 $ETC +0.14% | Can Ethereum Classic Reclaim $7.50?
No confirmed ETC-specific news in the past 24h. Crypto markets remain cautious after the reported Binance security breach.
$ETC
Chart: $7.75 → $6.78 → $7.14 | RSI(6): 43.45 | MACD: 🟢
Buy the dip? 🤔 Hold or wait? 👇
$ETC
{spot}(ETCUSDT)
#ETC #EthereumClassic #Binance #BuyTheDip .
🚨 $ETC +0.14% | Can Ethereum Classic Reclaim $7.50?
No confirmed ETC-specific news in the past 24h. Crypto markets remain cautious after the reported Binance security breach.
$ETC
Chart: $7.75 → $6.78 → $7.14 | RSI(6): 43.45 | MACD: 🟢
Buy the dip? 🤔 Hold or wait? 👇
$ETC
#ETC #EthereumClassic #Binance #BuyTheDip .
No confirmed ETC-specific news in the past 24h. Crypto markets remain cautious after the reported Binance security breach.
$ETC
Chart: $7.75 → $6.78 → $7.14 | RSI(6): 43.45 | MACD: 🟢
Buy the dip? 🤔 Hold or wait? 👇
$ETC
#ETC #EthereumClassic #Binance #BuyTheDip .
24

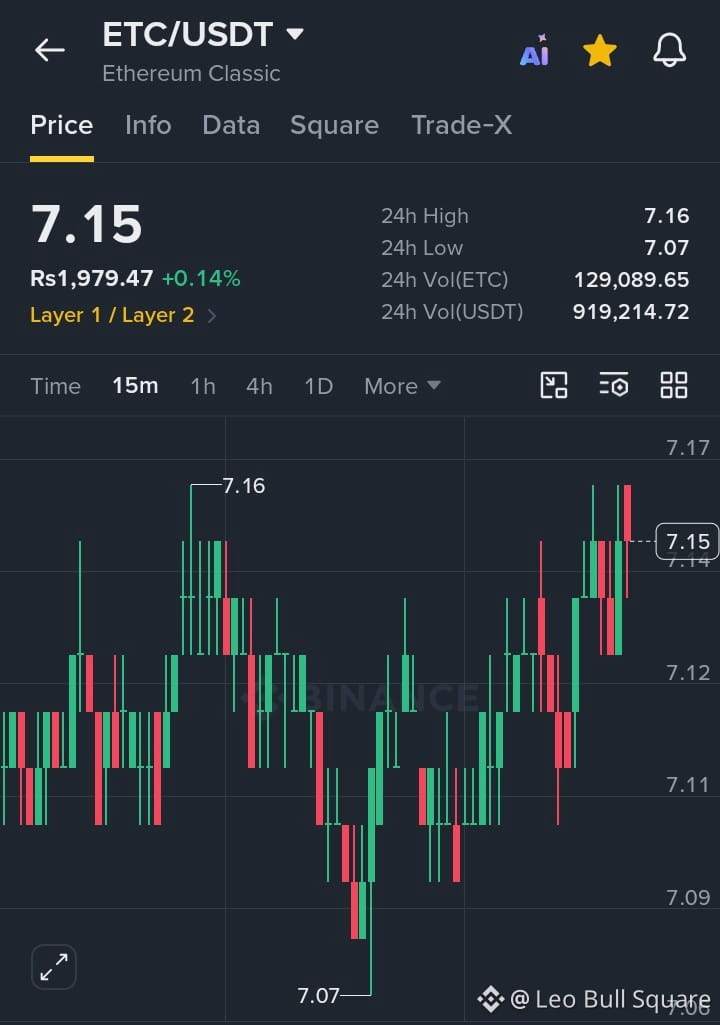
🚀 $ETC TESTING $7.16 RESISTANCE — BREAKOUT OR SHARP REVERSAL NEXT?
$ETC /USDT is showing fresh bullish momentum on the 15-minute chart, currently trading at $7.15 after bouncing strongly from the $7.07 support zone. Buyers are now testing a critical resistance at $7.16, where a confirmed breakout with strong volume could trigger bullish continuation toward TP1: $7.18 and TP2: $7.20. However, rejection from this resistance could bring a pullback toward $7.12 and $7.09. Watch for a clean candle close above $7.16 or a confirmed bearish rejection before entering. Stay patient, follow price action, and manage your risk carefully!
#ETC
{spot}(ETCUSDT)
🚀 $ETC TESTING $7.16 RESISTANCE — BREAKOUT OR SHARP REVERSAL NEXT?
$ETC /USDT is showing fresh bullish momentum on the 15-minute chart, currently trading at $7.15 after bouncing strongly from the $7.07 support zone. Buyers are now testing a critical resistance at $7.16, where a confirmed breakout with strong volume could trigger bullish continuation toward TP1: $7.18 and TP2: $7.20. However, rejection from this resistance could bring a pullback toward $7.12 and $7.09. Watch for a clean candle close above $7.16 or a confirmed bearish rejection before entering. Stay patient, follow price action, and manage your risk carefully!
#ETC
$ETC /USDT is showing fresh bullish momentum on the 15-minute chart, currently trading at $7.15 after bouncing strongly from the $7.07 support zone. Buyers are now testing a critical resistance at $7.16, where a confirmed breakout with strong volume could trigger bullish continuation toward TP1: $7.18 and TP2: $7.20. However, rejection from this resistance could bring a pullback toward $7.12 and $7.09. Watch for a clean candle close above $7.16 or a confirmed bearish rejection before entering. Stay patient, follow price action, and manage your risk carefully!
#ETC
1
74

·
--
Bullish
📊 $ETC
Relief Bounce in Play?
After printing a local base around the 7.06–7.07 zone, $ETC is showing signs of life on the 1-hour chart, printing consecutive green candles and pushing back toward 7.13.
Support: 7.12 – 7.13 USDT
Immediate Resistance: 7.137 – 7.141 USDT order book wall
Target Zone: Eyes on a potential run back to 7.20 – 7.25 $USDT if buyers chew through current overhead supply.
Are you catching this bounce or waiting for a cleaner breakout? Let me know your levels below! 👇
#ETC #CryptoTrading #BinanceSquare #TechnicalAnalysise
{spot}(ETCUSDT)
📊 $ETC
Relief Bounce in Play?
After printing a local base around the 7.06–7.07 zone, $ETC is showing signs of life on the 1-hour chart, printing consecutive green candles and pushing back toward 7.13.
Support: 7.12 – 7.13 USDT
Immediate Resistance: 7.137 – 7.141 USDT order book wall
Target Zone: Eyes on a potential run back to 7.20 – 7.25 $USDT if buyers chew through current overhead supply.
Are you catching this bounce or waiting for a cleaner breakout? Let me know your levels below! 👇
#ETC #CryptoTrading #BinanceSquare #TechnicalAnalysise
Relief Bounce in Play?
After printing a local base around the 7.06–7.07 zone, $ETC is showing signs of life on the 1-hour chart, printing consecutive green candles and pushing back toward 7.13.
Support: 7.12 – 7.13 USDT
Immediate Resistance: 7.137 – 7.141 USDT order book wall
Target Zone: Eyes on a potential run back to 7.20 – 7.25 $USDT if buyers chew through current overhead supply.
Are you catching this bounce or waiting for a cleaner breakout? Let me know your levels below! 👇
#ETC #CryptoTrading #BinanceSquare #TechnicalAnalysise
147

$ETC
{spot}(ETCUSDT)
: The Original Ethereum, Still Proof-of-Work
While most of the market moved to proof-of-stake, Ethereum Classic (ETC) stayed true to its roots.
✨ Why ETC stands out:
⛏️ Secured by Proof-of-Work mining
📉 Fixed supply cap of about 210.7 million coins, no endless inflation
📜 Born from the “code is law” philosophy after the 2016 DAO incident
🔗 Smart contract support, just like Ethereum
🛡️ A long-running network with a loyal community
Think about it: a hard-capped, PoW smart contract chain is rare in today’s market.
📌 Do you see ETC as an undervalued OG or a relic of the past? Tell me below 👇
#ETC #EthereumClassic #proofofwork #Crypto #BinanceSquare
$ETC
: The Original Ethereum, Still Proof-of-Work
While most of the market moved to proof-of-stake, Ethereum Classic (ETC) stayed true to its roots.
✨ Why ETC stands out:
⛏️ Secured by Proof-of-Work mining
📉 Fixed supply cap of about 210.7 million coins, no endless inflation
📜 Born from the “code is law” philosophy after the 2016 DAO incident
🔗 Smart contract support, just like Ethereum
🛡️ A long-running network with a loyal community
Think about it: a hard-capped, PoW smart contract chain is rare in today’s market.
📌 Do you see ETC as an undervalued OG or a relic of the past? Tell me below 👇
#ETC #EthereumClassic #proofofwork #Crypto #BinanceSquare
: The Original Ethereum, Still Proof-of-Work
While most of the market moved to proof-of-stake, Ethereum Classic (ETC) stayed true to its roots.
✨ Why ETC stands out:
⛏️ Secured by Proof-of-Work mining
📉 Fixed supply cap of about 210.7 million coins, no endless inflation
📜 Born from the “code is law” philosophy after the 2016 DAO incident
🔗 Smart contract support, just like Ethereum
🛡️ A long-running network with a loyal community
Think about it: a hard-capped, PoW smart contract chain is rare in today’s market.
📌 Do you see ETC as an undervalued OG or a relic of the past? Tell me below 👇
#ETC #EthereumClassic #proofofwork #Crypto #BinanceSquare

100
·
--
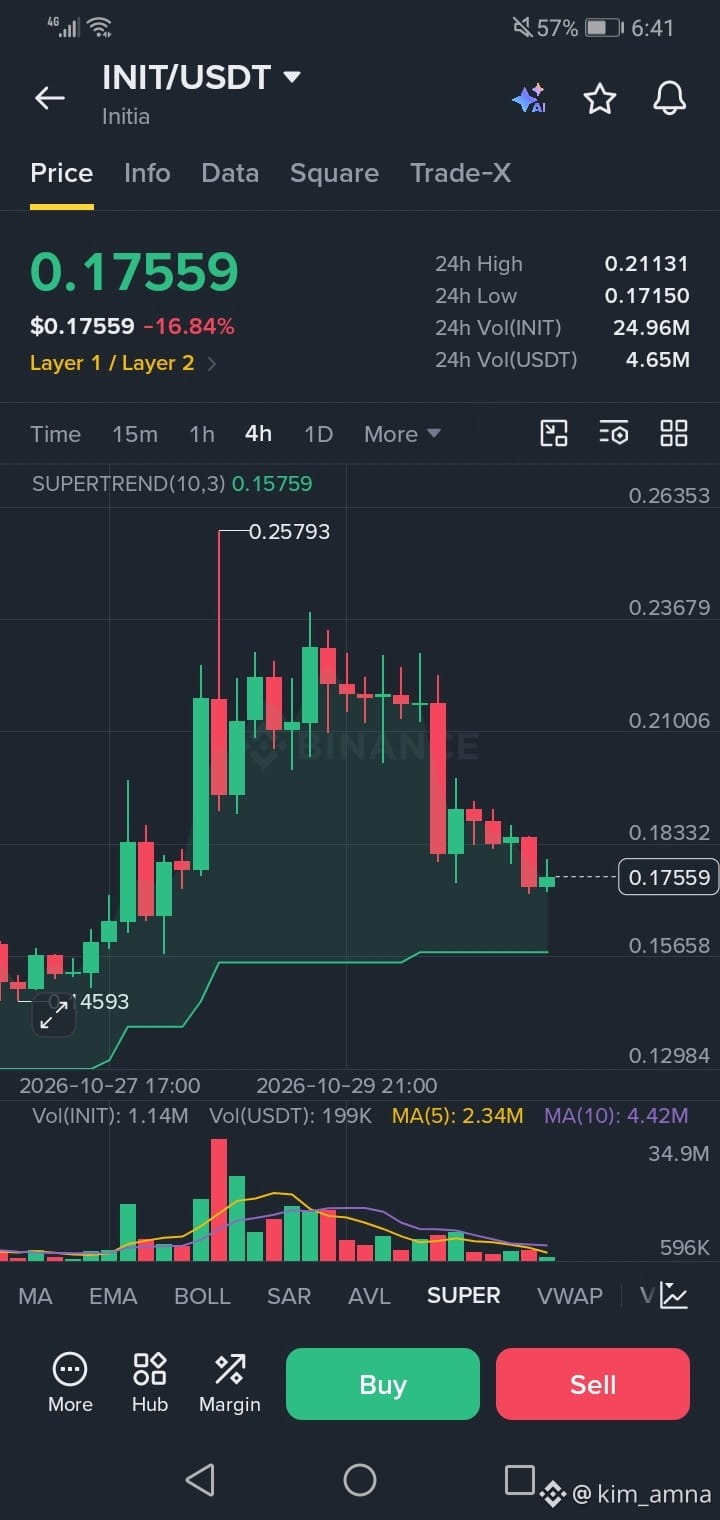
ETC & INIT — Two Coins to Watch!
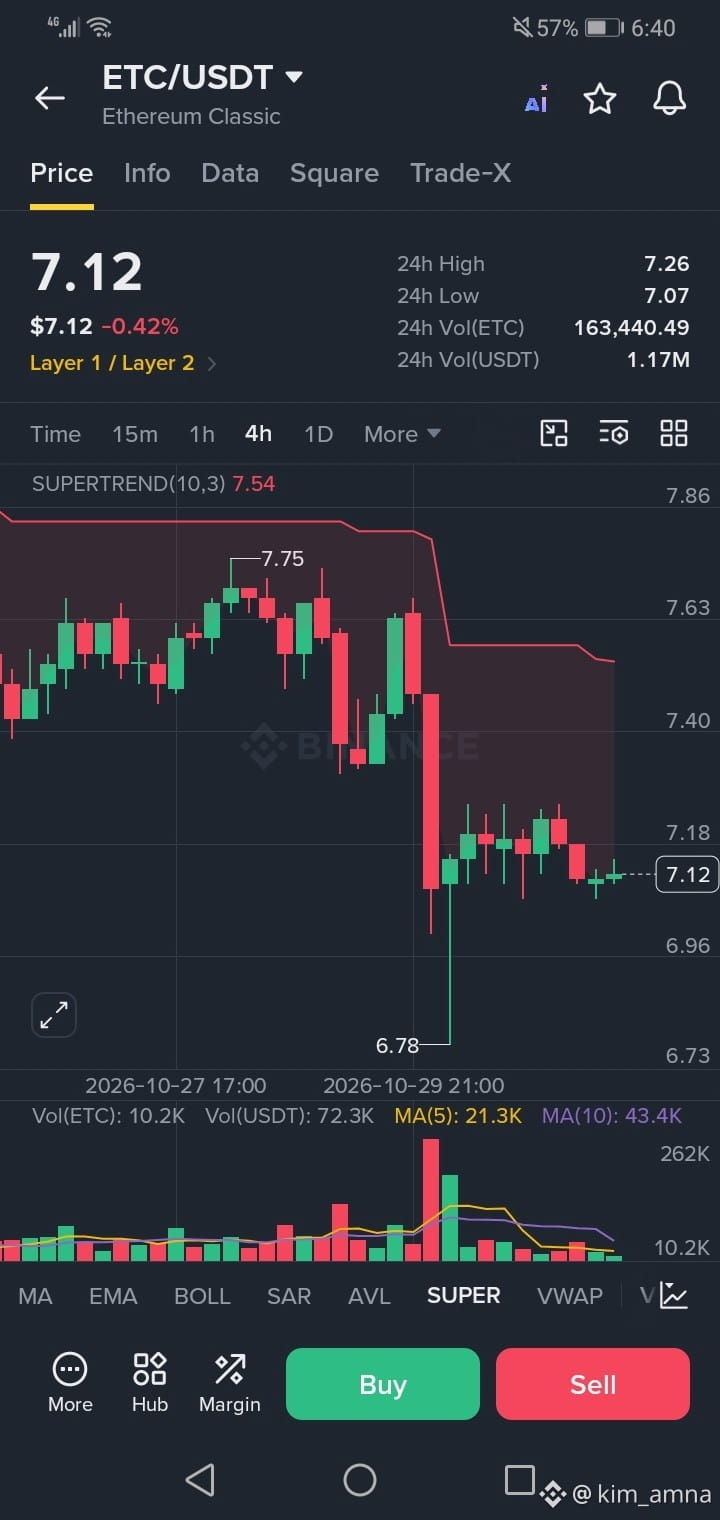
$ETC :Around $7.10, ETC is showing signs of recovery.
Support: $7.08 – $6.86
Resistance: $7.37 – $7.75.
A move above $7.37 could attract fresh buying momentum.
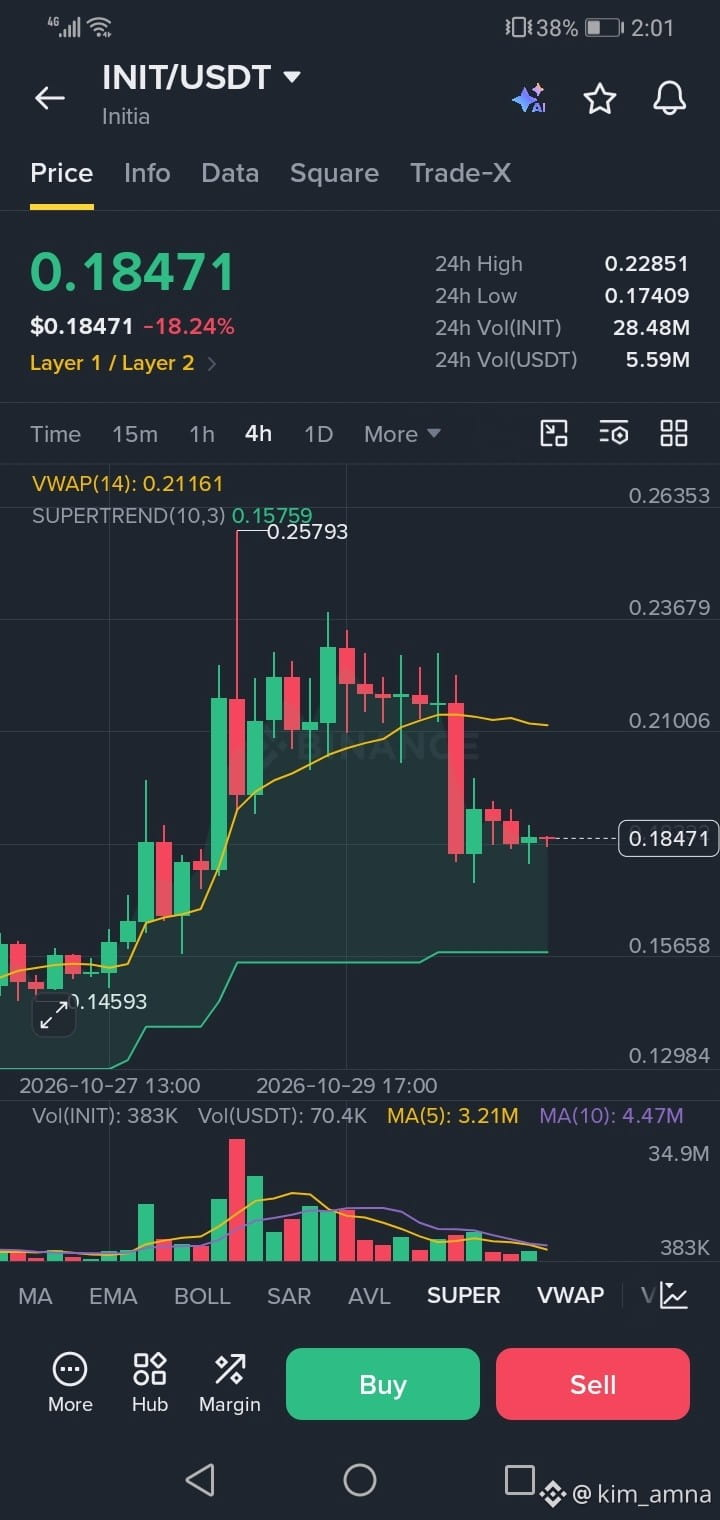
$INIT : Around $0.1786, INIT is facing heavy selling pressure.
Support: $0.1777 – $0.1512
Resistance: $0.1959 – $0.2148.
Network updates and renewed investor confidence could be key catalysts.
Market Outlook: ETC is trying to build a recovery, while INIT is looking for stability after its sharp decline. Both deserve attention as volatility creates opportunities.
👀 Which one has stronger recovery potential —ETC or INIT?
#ETC #INIT #HeYiSaysWithdrawalsExpectedtoResumeWithin42Hours #ASICHasReceivedNoPredictionMarketApplications #Write2Earn!
{spot}(ETCUSDT)
{spot}(INITUSDT)
ETC & INIT — Two Coins to Watch!
$ETC :Around $7.10, ETC is showing signs of recovery.
Support: $7.08 – $6.86
Resistance: $7.37 – $7.75.
A move above $7.37 could attract fresh buying momentum.
$INIT : Around $0.1786, INIT is facing heavy selling pressure.
Support: $0.1777 – $0.1512
Resistance: $0.1959 – $0.2148.
Network updates and renewed investor confidence could be key catalysts.
Market Outlook: ETC is trying to build a recovery, while INIT is looking for stability after its sharp decline. Both deserve attention as volatility creates opportunities.
👀 Which one has stronger recovery potential —ETC or INIT?
#ETC #INIT #HeYiSaysWithdrawalsExpectedtoResumeWithin42Hours #ASICHasReceivedNoPredictionMarketApplications #Write2Earn!
$ETC :Around $7.10, ETC is showing signs of recovery.
Support: $7.08 – $6.86
Resistance: $7.37 – $7.75.
A move above $7.37 could attract fresh buying momentum.
$INIT : Around $0.1786, INIT is facing heavy selling pressure.
Support: $0.1777 – $0.1512
Resistance: $0.1959 – $0.2148.
Network updates and renewed investor confidence could be key catalysts.
Market Outlook: ETC is trying to build a recovery, while INIT is looking for stability after its sharp decline. Both deserve attention as volatility creates opportunities.
👀 Which one has stronger recovery potential —ETC or INIT?
#ETC #INIT #HeYiSaysWithdrawalsExpectedtoResumeWithin42Hours #ASICHasReceivedNoPredictionMarketApplications #Write2Earn!
3
18
·
--
ETC & INIT | Market Outlook & Strategy
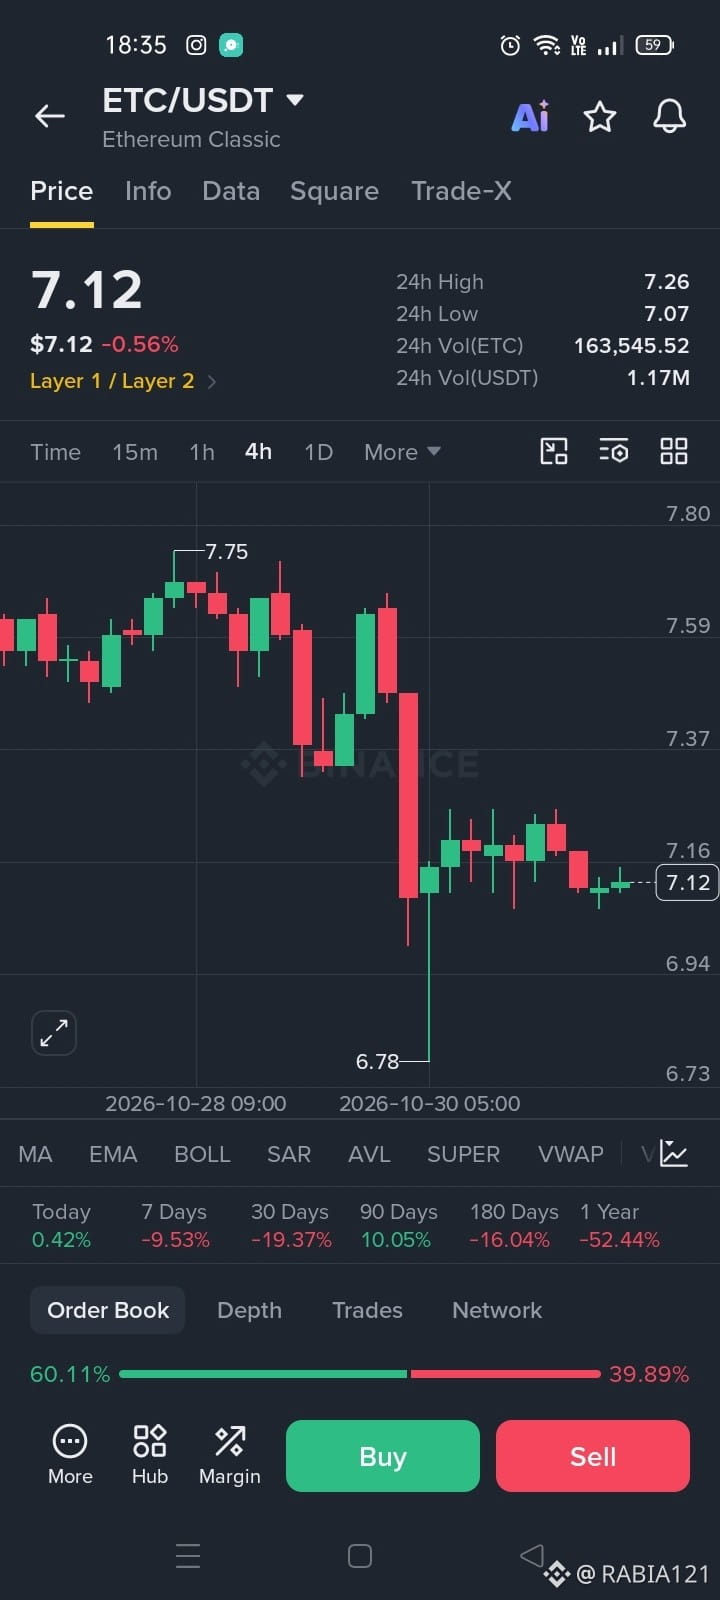
$ETC $7.19 | 24H: +1.83%
Support: $6.84 / $6.70
Resistance: $7.24 / $7.35
Outlook: Neutral to bearish. ETC is stabilizing after a 7.52% weekly decline. A breakout above $7.24 could open a move toward $7.35, while losing $6.84 risks further downside.
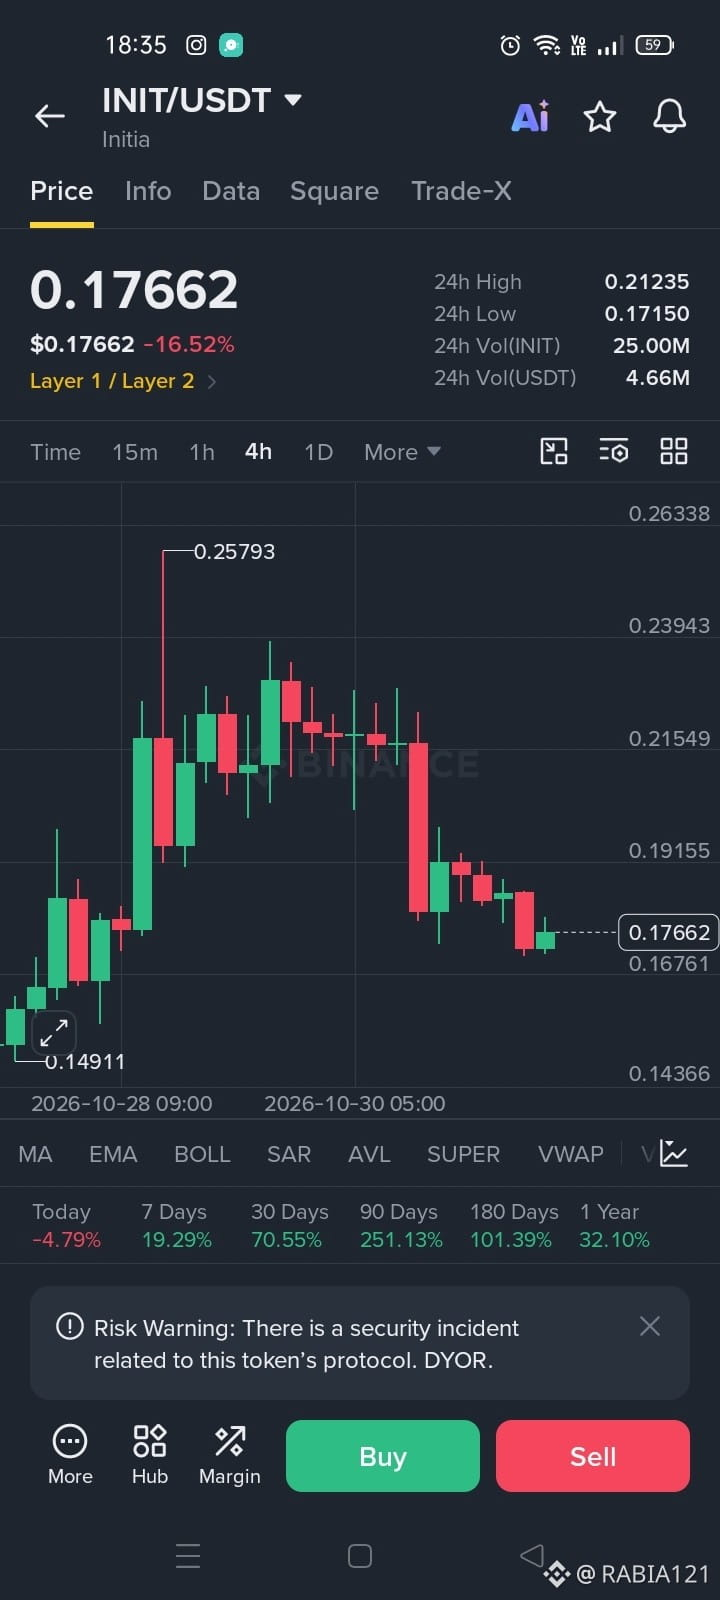
$INIT $0.1853 | 24H: -13.01%
Support: $0.175 / $0.170
Resistance: $0.200 / $0.227
Outlook: Strongly bearish. A reported $2.6M–$2.7M security exploit triggered heavy selling and network disruption. Recovery above $0.200 is needed to improve momentum, while losing $0.175 could extend downside pressure.
Strategy: Watch ETC's $7.24 breakout and INIT's $0.175 support. Avoid chasing volatile moves; wait for confirmation and manage risk around key levels.
#ETC #INIT #HeYiSaysWithdrawalsExpectedtoResumeWithin42Hours #CZSaysCompensationIsinPlaceUsersAreProtected #IntelHasItsWorstDaySince1974
{spot}(ETCUSDT)
{spot}(INITUSDT)
ETC & INIT | Market Outlook & Strategy
$ETC $7.19 | 24H: +1.83%
Support: $6.84 / $6.70
Resistance: $7.24 / $7.35
Outlook: Neutral to bearish. ETC is stabilizing after a 7.52% weekly decline. A breakout above $7.24 could open a move toward $7.35, while losing $6.84 risks further downside.
$INIT $0.1853 | 24H: -13.01%
Support: $0.175 / $0.170
Resistance: $0.200 / $0.227
Outlook: Strongly bearish. A reported $2.6M–$2.7M security exploit triggered heavy selling and network disruption. Recovery above $0.200 is needed to improve momentum, while losing $0.175 could extend downside pressure.
Strategy: Watch ETC's $7.24 breakout and INIT's $0.175 support. Avoid chasing volatile moves; wait for confirmation and manage risk around key levels.
#ETC #INIT #HeYiSaysWithdrawalsExpectedtoResumeWithin42Hours #CZSaysCompensationIsinPlaceUsersAreProtected #IntelHasItsWorstDaySince1974
$ETC $7.19 | 24H: +1.83%
Support: $6.84 / $6.70
Resistance: $7.24 / $7.35
Outlook: Neutral to bearish. ETC is stabilizing after a 7.52% weekly decline. A breakout above $7.24 could open a move toward $7.35, while losing $6.84 risks further downside.
$INIT $0.1853 | 24H: -13.01%
Support: $0.175 / $0.170
Resistance: $0.200 / $0.227
Outlook: Strongly bearish. A reported $2.6M–$2.7M security exploit triggered heavy selling and network disruption. Recovery above $0.200 is needed to improve momentum, while losing $0.175 could extend downside pressure.
Strategy: Watch ETC's $7.24 breakout and INIT's $0.175 support. Avoid chasing volatile moves; wait for confirmation and manage risk around key levels.
#ETC #INIT #HeYiSaysWithdrawalsExpectedtoResumeWithin42Hours #CZSaysCompensationIsinPlaceUsersAreProtected #IntelHasItsWorstDaySince1974
1
37

·
--
Bullish
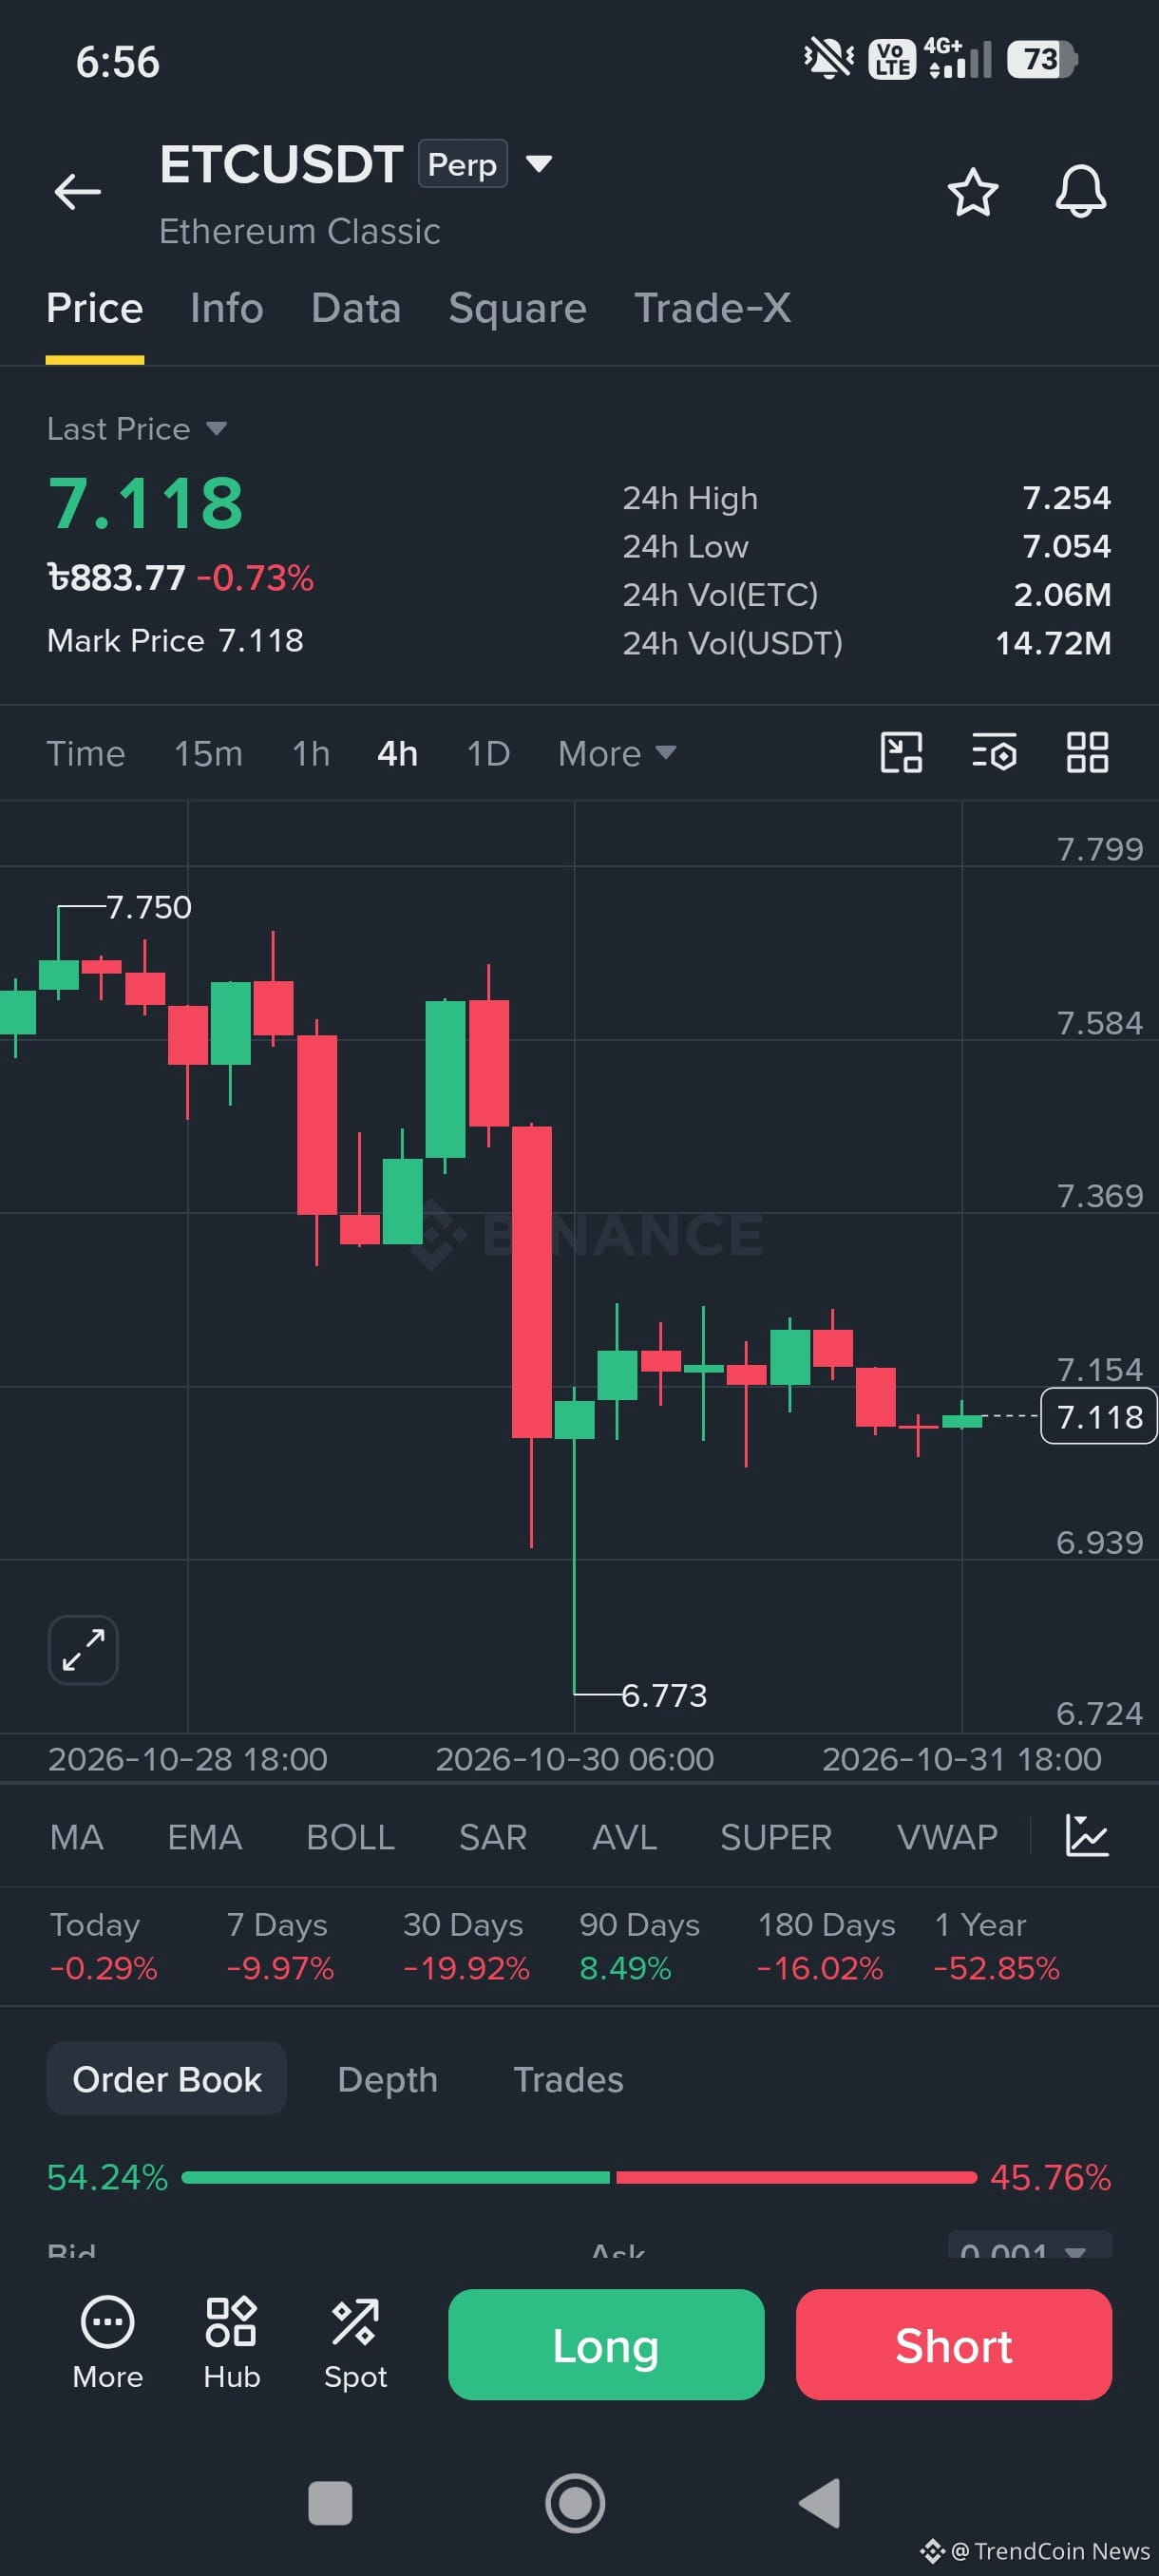
🚩 I AM TELLING YOU GUYS, $ETC WILL REACH $7.254 SOON 💪🚀
Current Price: $7.118 (-0.73%)
Watch $7.154 → $7.200 → $7.254
TRADE HERE 👇
{future}(ETCUSDT)
#ETC #ETCUSDT #HeYiSaysWithdrawalsExpectedtoResumeWithin42Hours #CZSaysCompensationIsinPlaceUsersAreProtected #IntelHasItsWorstDaySince1974
🚩 I AM TELLING YOU GUYS, $ETC WILL REACH $7.254 SOON 💪🚀
Current Price: $7.118 (-0.73%)
Watch $7.154 → $7.200 → $7.254
TRADE HERE 👇
#ETC #ETCUSDT #HeYiSaysWithdrawalsExpectedtoResumeWithin42Hours #CZSaysCompensationIsinPlaceUsersAreProtected #IntelHasItsWorstDaySince1974
Current Price: $7.118 (-0.73%)
Watch $7.154 → $7.200 → $7.254
TRADE HERE 👇
#ETC #ETCUSDT #HeYiSaysWithdrawalsExpectedtoResumeWithin42Hours #CZSaysCompensationIsinPlaceUsersAreProtected #IntelHasItsWorstDaySince1974
1
12
·
--
ETC & INIT — Market Update
$ETC Price: $7.13
Support: $7.08 – $6.86
Resistance: $7.37 – $7.75.
ETC remains bearish, but a breakout above $7.75 could signal a recovery.
$INIT : Price: $0.1818
Support: $0.1777 – $0.1700
Resistance: $0.1959 – $0.2050.
INIT is volatile, with recovery potential depending on network security progress.
Market Outlook: ETC needs stronger buying pressure, while INIT needs to reclaim resistance to improve its outlook.
Which one looks stronger to you — ETC or $INIT?
#ETC #INIT #HeYiSaysWithdrawalsExpectedtoResumeWithin42Hours #USDCCirculationFallsAbout800MInSevenDays #Write2Earn
{spot}(ETCUSDT)
{spot}(INITUSDT)
ETC & INIT — Market Update
$ETC Price: $7.13
Support: $7.08 – $6.86
Resistance: $7.37 – $7.75.
ETC remains bearish, but a breakout above $7.75 could signal a recovery.
$INIT : Price: $0.1818
Support: $0.1777 – $0.1700
Resistance: $0.1959 – $0.2050.
INIT is volatile, with recovery potential depending on network security progress.
Market Outlook: ETC needs stronger buying pressure, while INIT needs to reclaim resistance to improve its outlook.
Which one looks stronger to you — ETC or $INIT ?
#ETC #INIT #HeYiSaysWithdrawalsExpectedtoResumeWithin42Hours #USDCCirculationFallsAbout800MInSevenDays #Write2Earn
$ETC Price: $7.13
Support: $7.08 – $6.86
Resistance: $7.37 – $7.75.
ETC remains bearish, but a breakout above $7.75 could signal a recovery.
$INIT : Price: $0.1818
Support: $0.1777 – $0.1700
Resistance: $0.1959 – $0.2050.
INIT is volatile, with recovery potential depending on network security progress.
Market Outlook: ETC needs stronger buying pressure, while INIT needs to reclaim resistance to improve its outlook.
Which one looks stronger to you — ETC or $INIT ?
#ETC #INIT #HeYiSaysWithdrawalsExpectedtoResumeWithin42Hours #USDCCirculationFallsAbout800MInSevenDays #Write2Earn
3
47

·
--
Bullish
$ETC looking stubbornly bullish, buyers are defending every dip.
I’m watching this long setup:
Entry: 7.155 - 7.191
TP1: 7.515
TP2: 7.791
SL: 6.936
The main trigger is 7.258. Flip that resistance into support and #ETC could accelerate toward 7.50+ and beyond.
Main risk: overheated 15m RSI creating a sharp rejection first.
Lets use a size that fits our own account here👇 please.
{future}(ETCUSDT)
$ETC looking stubbornly bullish, buyers are defending every dip.
I’m watching this long setup:
Entry: 7.155 - 7.191
TP1: 7.515
TP2: 7.791
SL: 6.936
The main trigger is 7.258. Flip that resistance into support and #ETC could accelerate toward 7.50+ and beyond.
Main risk: overheated 15m RSI creating a sharp rejection first.
Lets use a size that fits our own account here👇 please.
I’m watching this long setup:
Entry: 7.155 - 7.191
TP1: 7.515
TP2: 7.791
SL: 6.936
The main trigger is 7.258. Flip that resistance into support and #ETC could accelerate toward 7.50+ and beyond.
Main risk: overheated 15m RSI creating a sharp rejection first.
Lets use a size that fits our own account here👇 please.
1
447

·
--
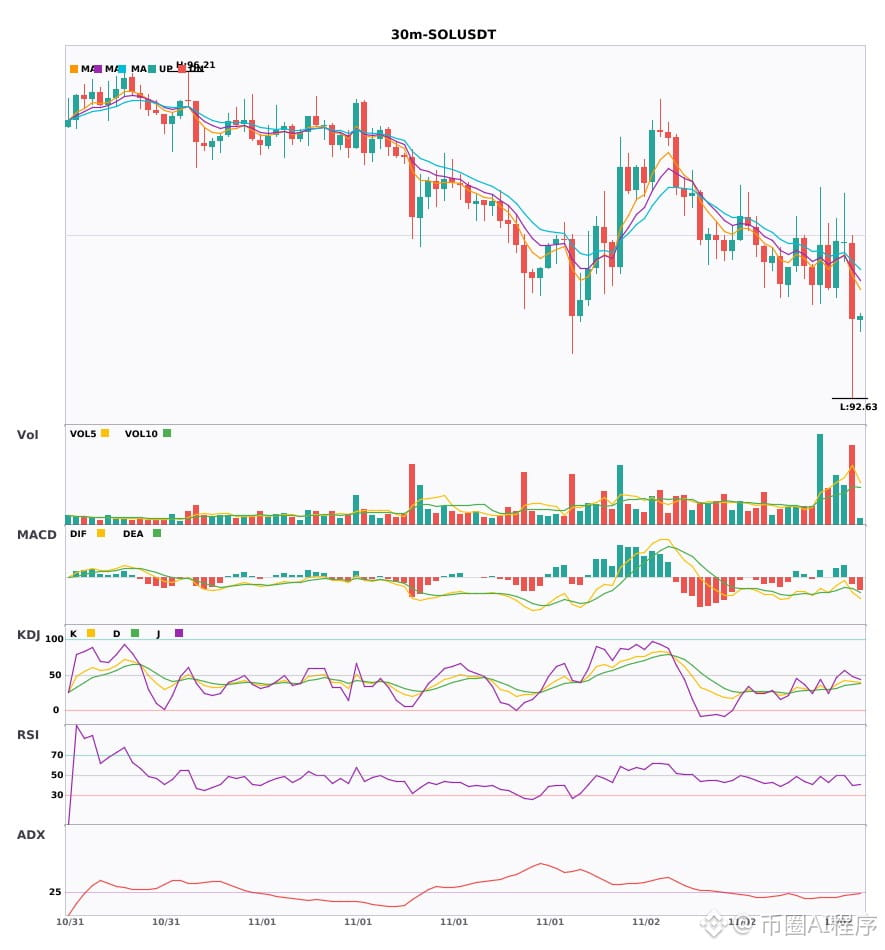
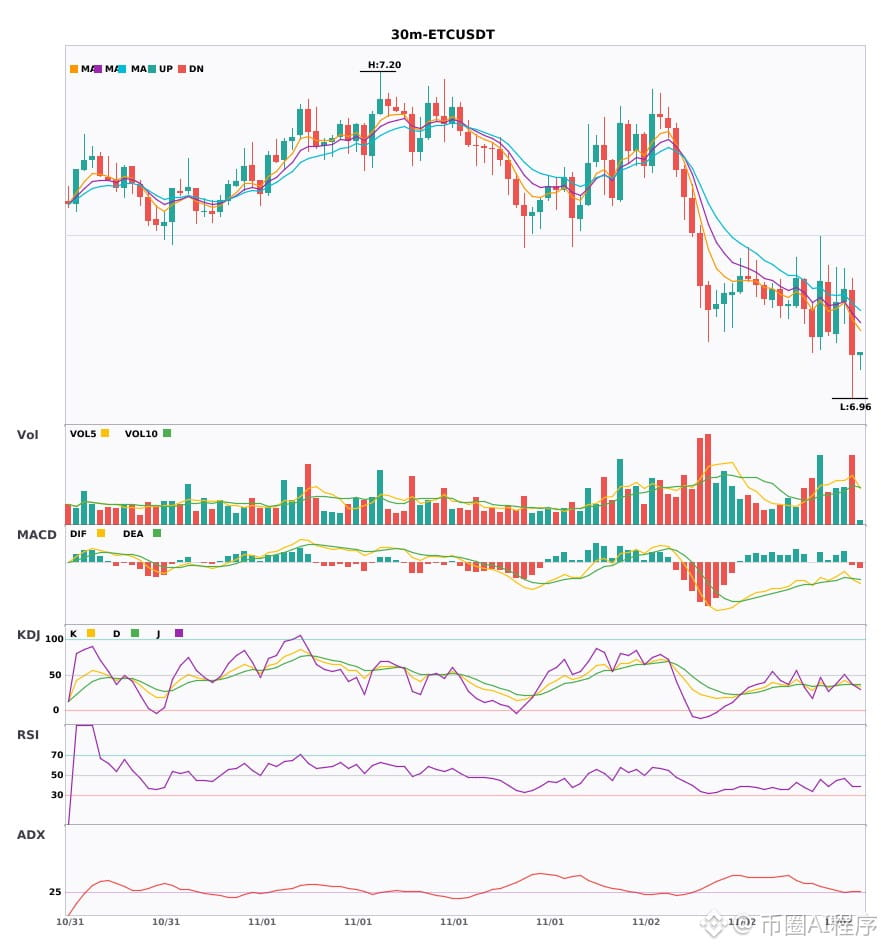
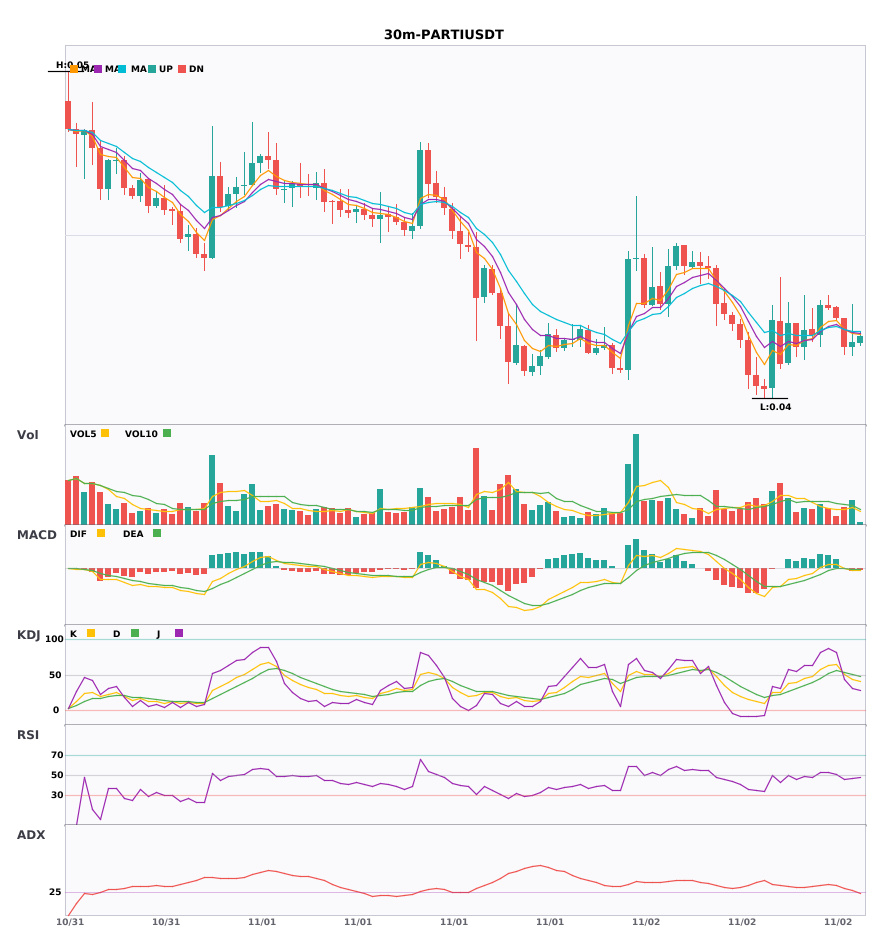
$SOL / $ETC / $PARTI 30-minute bearish signals, 4-hour bearish trend confirmed 🔥
════════════════════
🟢 $SOL 30-minute bearish signal
⚠️ Technical analysis: 4-hour bearish confluence confirmed | 30-minute entry: MACD bearish crossover below zero, bearish momentum accelerating | EMA5 crossed below EMA8, short-term outlook turns bearish | KDJ trending weakly, bears in control (K: 40.6, D: 37.0) | Volume increased (2.1x)
════════════════════
🟢 $ETC 30-minute bearish signal
⚠️ Technical analysis: 4-hour bearish confluence confirmed | 30-minute entry: MACD bearish crossover below zero, bearish momentum accelerating | EMA5 < EMA8 < EMA13, bearish alignment | KDJ bearish crossover, short-term outlook bearish (K: 36.8, D: 37.1) | Volume increased (1.8x)
════════════════════
🟢 $PARTI 30-minute bearish signal
⚠️ Technical analysis: 4-hour bearish confluence confirmed | 30-minute entry: MACD bearish crossover below zero, bearish momentum accelerating | EMA5 crossed below EMA8, short-term outlook turns bearish | Volume normal (1.2x)
════════════════════
🔔 Follow for first-hand market alerts 🔔
#多周期共振 #SOL #ETC #PARTI
📌 When trading, pay attention to whether the candlestick patterns align
$SOL / $ETC / $PARTI 30-minute bearish signals, 4-hour bearish trend confirmed 🔥
════════════════════
🟢 $SOL 30-minute bearish signal
⚠️ Technical analysis: 4-hour bearish confluence confirmed | 30-minute entry: MACD bearish crossover below zero, bearish momentum accelerating | EMA5 crossed below EMA8, short-term outlook turns bearish | KDJ trending weakly, bears in control (K: 40.6, D: 37.0) | Volume increased (2.1x)
════════════════════
🟢 $ETC 30-minute bearish signal
⚠️ Technical analysis: 4-hour bearish confluence confirmed | 30-minute entry: MACD bearish crossover below zero, bearish momentum accelerating | EMA5 < EMA8 < EMA13, bearish alignment | KDJ bearish crossover, short-term outlook bearish (K: 36.8, D: 37.1) | Volume increased (1.8x)
════════════════════
🟢 $PARTI 30-minute bearish signal
⚠️ Technical analysis: 4-hour bearish confluence confirmed | 30-minute entry: MACD bearish crossover below zero, bearish momentum accelerating | EMA5 crossed below EMA8, short-term outlook turns bearish | Volume normal (1.2x)
════════════════════
🔔 Follow for first-hand market alerts 🔔
#多周期共振 #SOL #ETC #PARTI
📌 When trading, pay attention to whether the candlestick patterns align
════════════════════
🟢 $SOL 30-minute bearish signal
⚠️ Technical analysis: 4-hour bearish confluence confirmed | 30-minute entry: MACD bearish crossover below zero, bearish momentum accelerating | EMA5 crossed below EMA8, short-term outlook turns bearish | KDJ trending weakly, bears in control (K: 40.6, D: 37.0) | Volume increased (2.1x)
════════════════════
🟢 $ETC 30-minute bearish signal
⚠️ Technical analysis: 4-hour bearish confluence confirmed | 30-minute entry: MACD bearish crossover below zero, bearish momentum accelerating | EMA5 < EMA8 < EMA13, bearish alignment | KDJ bearish crossover, short-term outlook bearish (K: 36.8, D: 37.1) | Volume increased (1.8x)
════════════════════
🟢 $PARTI 30-minute bearish signal
⚠️ Technical analysis: 4-hour bearish confluence confirmed | 30-minute entry: MACD bearish crossover below zero, bearish momentum accelerating | EMA5 crossed below EMA8, short-term outlook turns bearish | Volume normal (1.2x)
════════════════════
🔔 Follow for first-hand market alerts 🔔
#多周期共振 #SOL #ETC #PARTI
📌 When trading, pay attention to whether the candlestick patterns align
10
Log in to explore more content
Join global crypto users on Binance Square
⚡️ Get latest and useful information about crypto.
💬 Trusted by the world’s largest crypto exchange.
👍 Discover real insights from verified creators.
Email / Phone number
Trending Topics
1
#BinanceWithdrawalScamWarning
31,953 views
593 Discussing
2
#USMidtermElections
591,744 views
3,165 Discussing
3
#USOctoberNFP-AreRateCutsStillPossible
39,954 views
496 Discussing
4
#AppleEarningsAhead-CanStockHitNewHigh
15,583 views
361 Discussing
5
#Verify1to1BinanceReserves
33,887 views
391 Discussing
6
#BinanceRestores28FiatWithdrawals
142,673 views
1,022 Discussing
7
#StrategyRepurchases$208MSTRCAdds811Bitcoin
6,634 views
17 Discussing
8
#FATFLaunchesReviewOfCryptoHubsMoneyLaunderingControls
629 views
14 Discussing
9
#BinanceProcesses$4.65BWithdrawals
112,718 views
367 Discussing
10
#HKMALaunchesSAGEAgenticFinanceProject
3,820 views
177 Discussing