cryptoanalysis"

1.5M views
4,735 Discussing
Crypto_Insights786
·
--
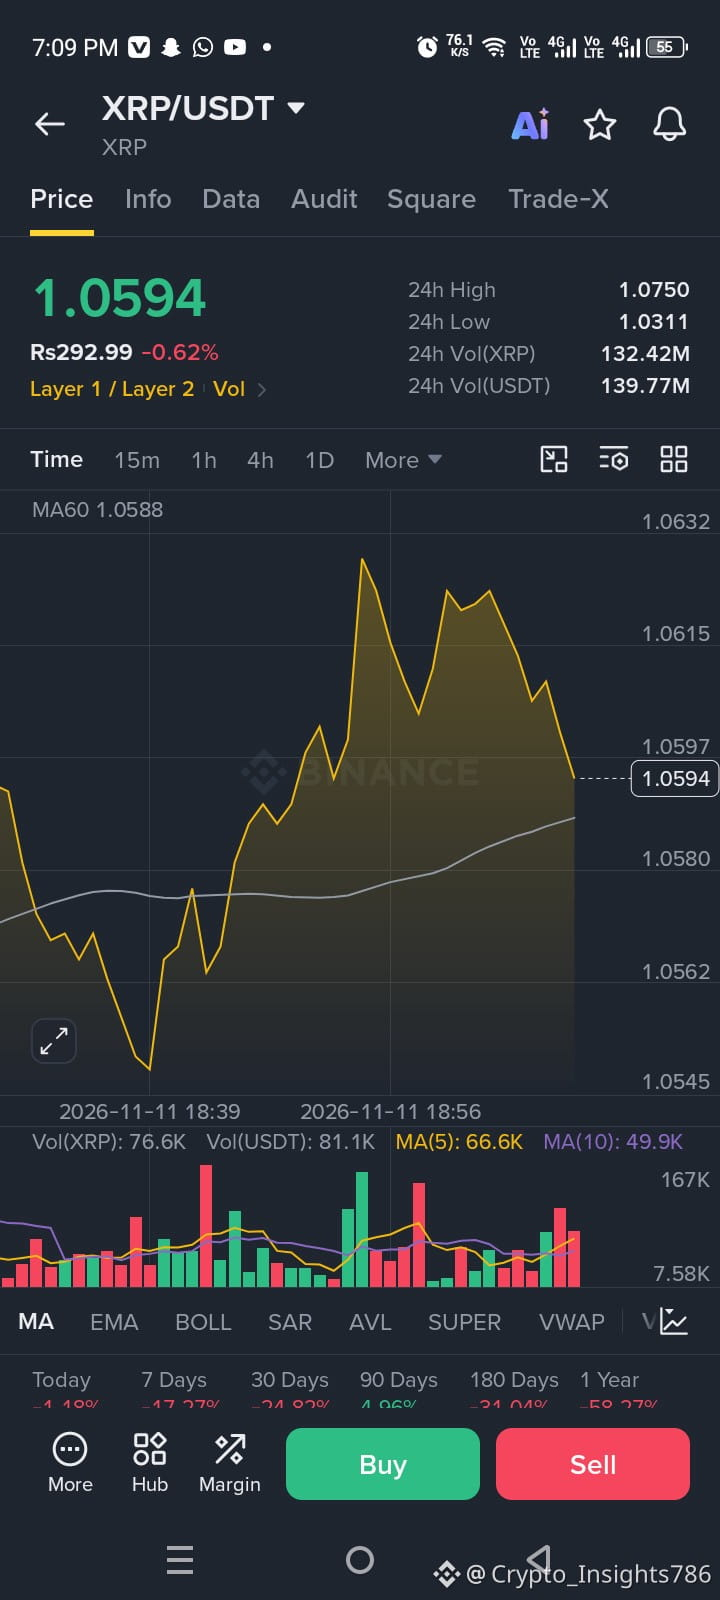
$XRP Current Price: $1.0594 🔴 Market Trend: Bearish $XRP remains under selling pressure, with weak momentum across the market. Key support is near $1.00, while resistance stands at $1.10. 🚀 A breakout above $1.10 could signal a recovery, while losing $1.00 may trigger further downside. #xrp #RİPPLE #CryptoAnalysis" #BİNANCE #CryptoMarket {spot}(XRPUSDT)
$XRP Current Price: $1.0594

🔴 Market Trend: Bearish

$XRP remains under selling pressure, with weak momentum across the market. Key support is near $1.00, while resistance stands at $1.10.

🚀 A breakout above $1.10 could signal a recovery, while losing $1.00 may trigger further downside.

#xrp #RİPPLE #CryptoAnalysis" #BİNANCE #CryptoMarket
🔥 $LUNC — THE QUIET BEFORE THE NEXT BIG MOVE? 🚀 While everyone is watching Bitcoin, Terra Classic $LUNC deserves attention too! 📊 Market Analysis: - LUNC is worth watching for a possible trend reversal. - Buyers may be waiting for the right entry point. - Trading volume could provide clues about the next move. 🐂 Bullish Outlook: A strong breakout with increasing volume could bring fresh buying interest. 🐻 Bearish Risk: If support breaks, further downside is possible. 🎯 My Question: Is LUNC preparing for a big comeback, or is another dip coming? 🔥 Stay alert and do your own research! #LUNC #TerraClassic #Crypto #BinanceSquare #Altcoins #CryptoAnalysis" #AnthropicRejectsIPODelayValuationinQuestion #AnthropicRejectsIPODelayValuationinQuestion #HotCPIDecemberHikePriced #AnthropicRejectsIPODelayValuationinQuestion
🔥 $LUNC — THE QUIET BEFORE THE NEXT BIG MOVE? 🚀

While everyone is watching Bitcoin, Terra Classic $LUNC deserves attention too!

📊 Market Analysis:

- LUNC is worth watching for a possible trend reversal.
- Buyers may be waiting for the right entry point.
- Trading volume could provide clues about the next move.

🐂 Bullish Outlook:
A strong breakout with increasing volume could bring fresh buying interest.

🐻 Bearish Risk:
If support breaks, further downside is possible.

🎯 My Question:
Is LUNC preparing for a big comeback, or is another dip coming?

🔥 Stay alert and do your own research!

#LUNC #TerraClassic #Crypto #BinanceSquare #Altcoins #CryptoAnalysis" #AnthropicRejectsIPODelayValuationinQuestion #AnthropicRejectsIPODelayValuationinQuestion #HotCPIDecemberHikePriced #AnthropicRejectsIPODelayValuationinQuestion
Feed-Creator-72ddf6390:
Sebelum menambah kan 0? 😂
·
--
Bullish
🚨 $ZEC — THE NEXT BIG MOVE IS COMING! 🐋⚡ Everyone is watching $1,000, but the REAL battle is happening between buyers and sellers right now! Zcash is attempting to recover, but will bulls have enough strength to take control again? 👀 📊 KEY LEVELS TO WATCH - Current Price: ~$997 - Resistance: $1,000 – $1,068 - Major Support: $963 - Trading Volume: ~$988M 🐂 BULLISH TARGETS If buyers reclaim $1,000 and break $1,068 with strong volume, ZEC could target: 🎯 $1,100 🎯 $1,150 🎯 $1,200 🐻 BEARISH WARNING If $963 fails to hold, sellers could push price toward: ⚠️ $933 ⚠️ $900 🔥 MY STRATEGY I'm not chasing green candles or panicking over red ones. I want confirmation. A strong breakout above $1,068 could change the short-term trend, while another rejection may bring sellers back into control. Remember: The best trade is often the one you wait for. 👇 LET'S SETTLE THIS! Which level will ZEC hit first? 🚀 $1,100 — BULLISH 💀 $900 — BEARISH Drop your prediction below! 👇 #ZEC #Zcash #BinanceSquare #CryptoAnalysis" #bitcoin $ZEC {future}(ZECUSDT)
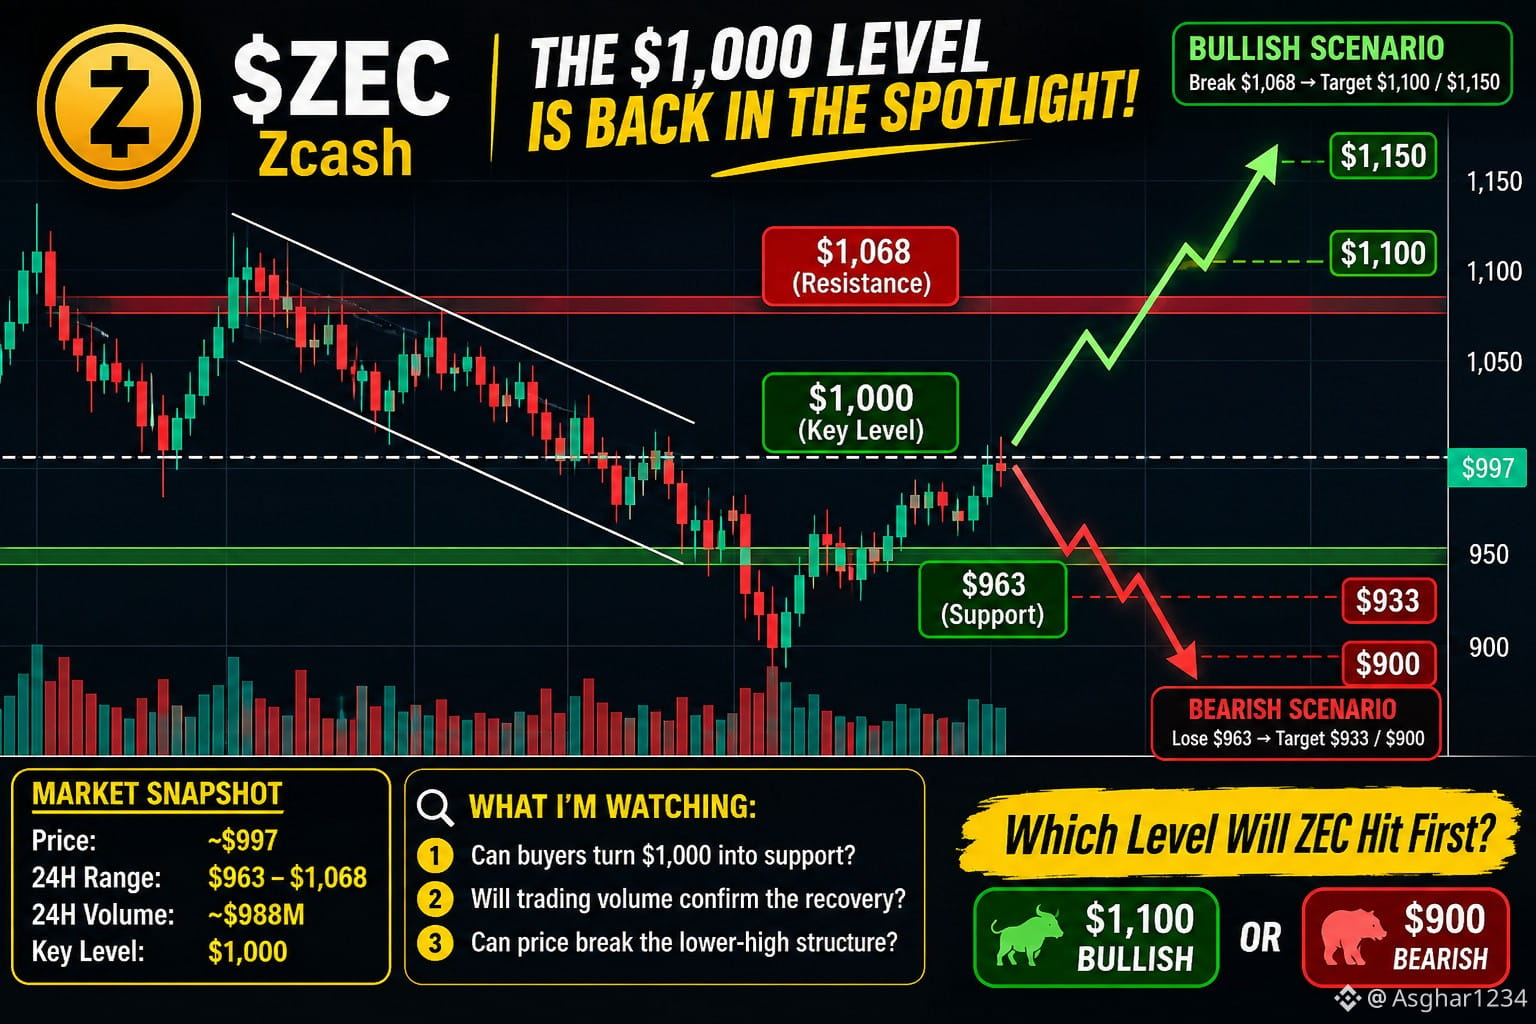
🚨 $ZEC — THE NEXT BIG MOVE IS COMING! 🐋⚡

Everyone is watching $1,000, but the REAL battle is happening between buyers and sellers right now!

Zcash is attempting to recover, but will bulls have enough strength to take control again? 👀

📊 KEY LEVELS TO WATCH

- Current Price: ~$997
- Resistance: $1,000 – $1,068
- Major Support: $963
- Trading Volume: ~$988M

🐂 BULLISH TARGETS
If buyers reclaim $1,000 and break $1,068 with strong volume, ZEC could target:
🎯 $1,100
🎯 $1,150
🎯 $1,200

🐻 BEARISH WARNING
If $963 fails to hold, sellers could push price toward:
⚠️ $933
⚠️ $900

🔥 MY STRATEGY

I'm not chasing green candles or panicking over red ones. I want confirmation.

A strong breakout above $1,068 could change the short-term trend, while another rejection may bring sellers back into control.

Remember: The best trade is often the one you wait for.

👇 LET'S SETTLE THIS!

Which level will ZEC hit first?

🚀 $1,100 — BULLISH
💀 $900 — BEARISH

Drop your prediction below! 👇

#ZEC #Zcash #BinanceSquare #CryptoAnalysis" #bitcoin
$ZEC
·
--
Bullish
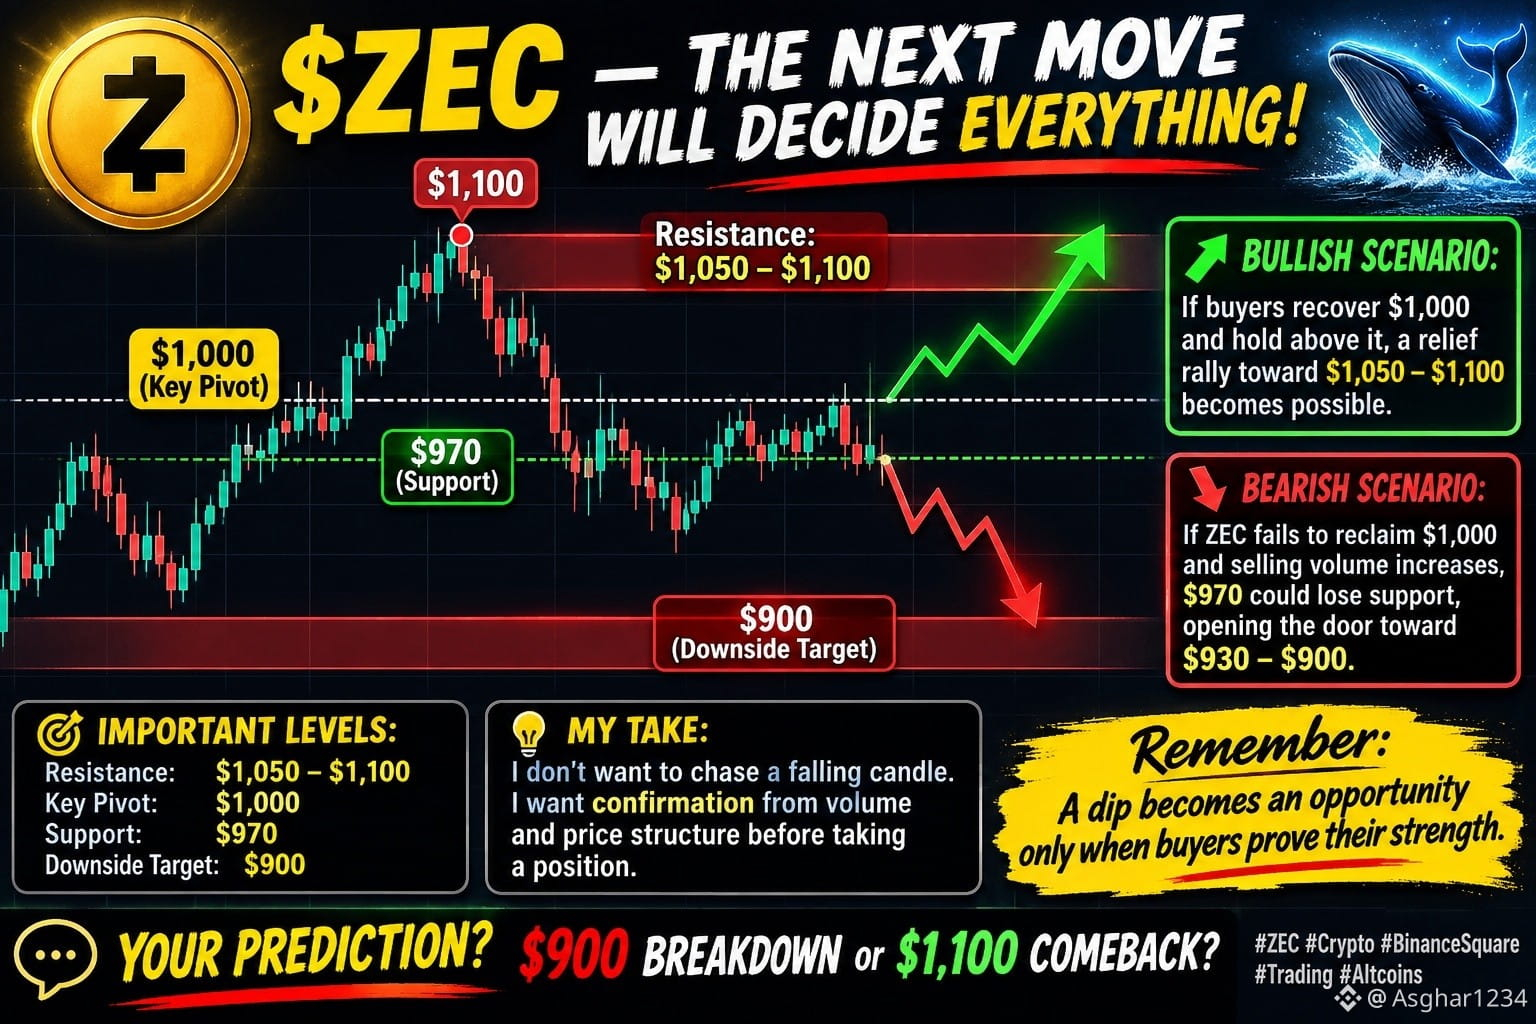
🚨 $ZEC — THE $1,000 BATTLE IS ON! 🐋🔥 Don't make a decision too early! The next move in Zcash could catch both bulls and bears off guard. After facing heavy rejection near $1,100, ZEC is now approaching a critical decision zone. 📊 HERE'S WHAT I'M WATCHING: 🟢 BULLISH SETUP: If buyers reclaim $1,000 with strong volume, the next targets could be: 🎯 $1,050 → $1,100 🔴 BEARISH SETUP: If $1,000 remains resistance and $970 breaks, sellers could push price toward: 🎯 $930 → $900 💡 MY STRATEGY: I'm watching volume, momentum, and confirmation before making any move. No blind entries, no emotional trading! Remember: The best opportunities often come when the market is confusing everyone. 🐂 BULLS OR BEARS — WHO WILL WIN THIS BATTLE? 👇 Drop your prediction: $900 BREAKDOWN or $1,100 COMEBACK? #ZEC #Zcash #cryptotradingpro #BinanceSquare #CryptoAnalysis" $ZEC {future}(ZECUSDT)
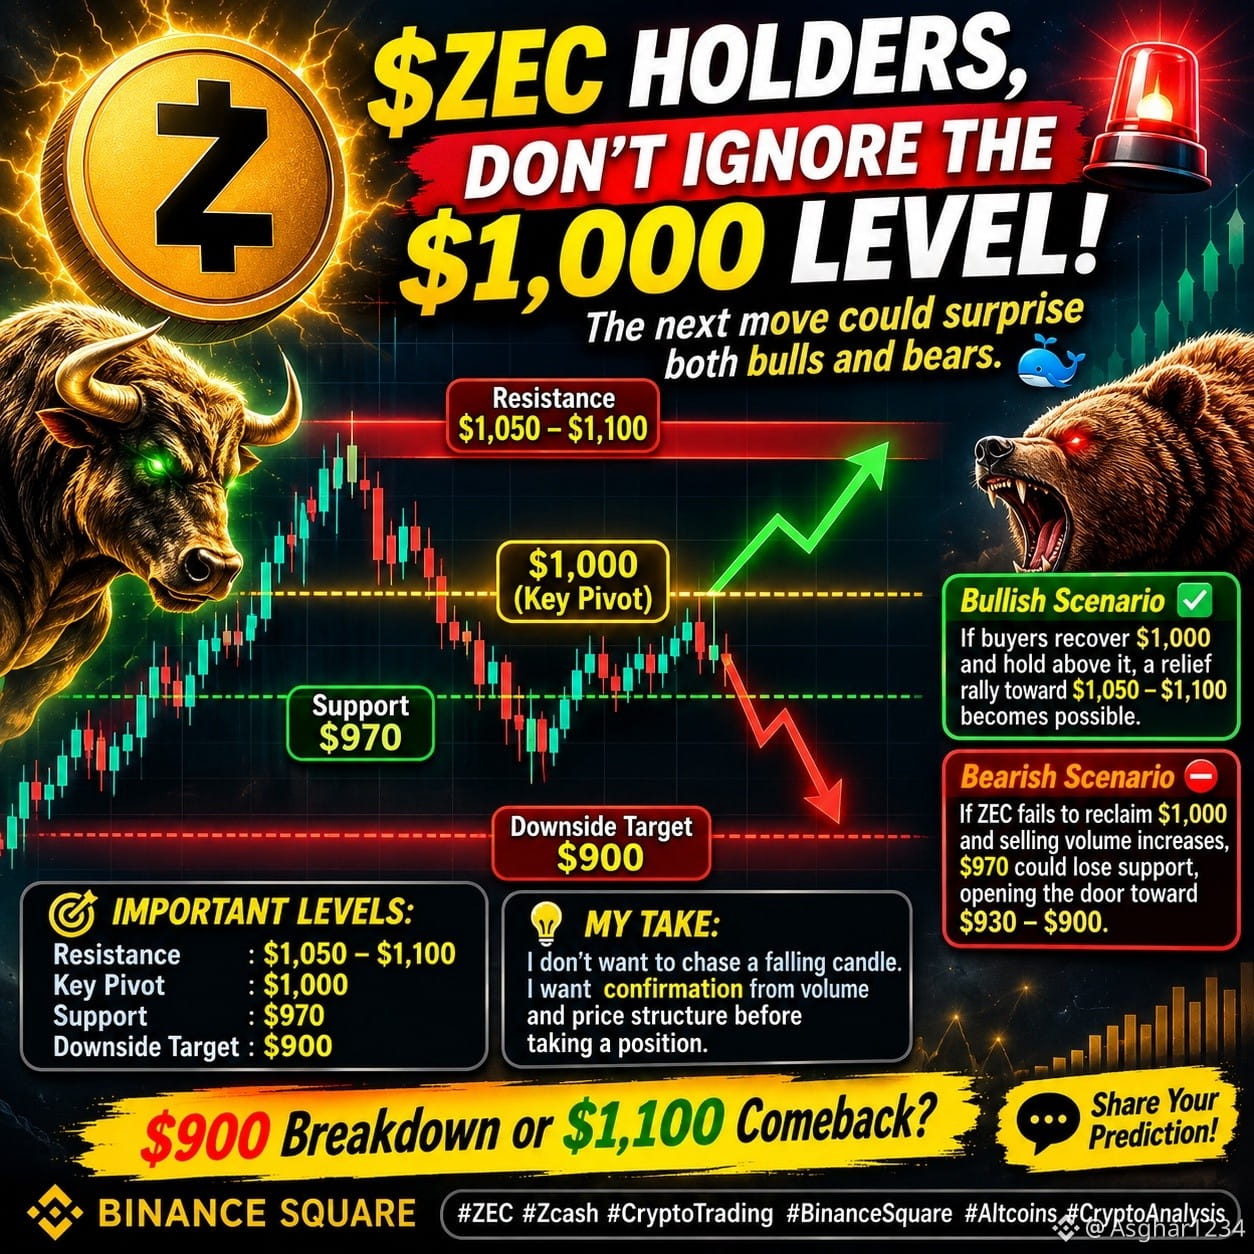
🚨 $ZEC — THE $1,000 BATTLE IS ON! 🐋🔥

Don't make a decision too early! The next move in Zcash could catch both bulls and bears off guard.

After facing heavy rejection near $1,100, ZEC is now approaching a critical decision zone.

📊 HERE'S WHAT I'M WATCHING:

🟢 BULLISH SETUP:
If buyers reclaim $1,000 with strong volume, the next targets could be:
🎯 $1,050 → $1,100

🔴 BEARISH SETUP:
If $1,000 remains resistance and $970 breaks, sellers could push price toward:
🎯 $930 → $900

💡 MY STRATEGY:
I'm watching volume, momentum, and confirmation before making any move. No blind entries, no emotional trading!

Remember: The best opportunities often come when the market is confusing everyone.

🐂 BULLS OR BEARS — WHO WILL WIN THIS BATTLE?

👇 Drop your prediction:
$900 BREAKDOWN or $1,100 COMEBACK?

#ZEC #Zcash #cryptotradingpro #BinanceSquare #CryptoAnalysis"
$ZEC
Article
₿ BITCOIN MARKET ANALYSIS | NOVEMBER 11, 2026 Is Bitcoin Preparing for. 🚨🚨₿ BITCOIN MARKET ANALYSIS | NOVEMBER 11, 2026 Is Bitcoin Preparing for a Recovery or Another Major Correction? Bitcoin is facing renewed selling pressure, currently trading around $73,578. Higher-than-expected US inflation, institutional ETF outflows and market uncertainty are creating challenges for buyers. 📊 Current Market Situation - BTC Price: Approximately $73,578 - Market Sentiment: Bearish / Fear - Immediate Support: $72,689 - Major Support: $72,000 - Immediate Resistance: $74,000–$74,316 - Major Resistance: $75,500 🧠 Market Psychology Investors are becoming cautious as institutional money flows remain weak. However, some long-term buyers continue accumulating Bitcoin. The market is currently testing investor confidence. Panic selling could create additional downside pressure, while renewed institutional demand could support recovery. 🟢 Bullish Scenario If BTC holds above $72,689 and successfully breaks $74,316, buyers could target: - $75,000 - $76,000 - $77,700 A stronger recovery above $77,700 would improve the market outlook. 🔴 Bearish Scenario If Bitcoin loses $72,689 with strong selling volume, further downside could follow. Important downside levels: - $72,000 - $70,000 - $68,000 🎯 My Future Trading Strategy 1. Avoid buying during emotional market movements. 2. Consider gradual spot entries instead of investing everything at once. 3. Watch ETF inflows and institutional activity. 4. Wait for confirmation before entering breakout trades. 5. Keep USDT available for unexpected opportunities. 6. Always protect your capital with proper risk management. 🔮 Final Outlook My short-term outlook remains cautious until Bitcoin regains important resistance levels. A recovery is possible, but another correction cannot be ruled out. Remember: The biggest opportunity is not always buying at the lowest price. It is entering with a clear strategy and controlled risk. ₿ Think smart. Stay patient. Trade with discipline. #Bitcoin #BTC #CryptoAnalysis" s#BTCUSDT #BitcoinPrediction {spot}(BTCUSDT) $BTC #CryptoMarket #BinanceSquare

₿ BITCOIN MARKET ANALYSIS | NOVEMBER 11, 2026 Is Bitcoin Preparing for. 🚨🚨

₿ BITCOIN MARKET ANALYSIS | NOVEMBER 11, 2026
Is Bitcoin Preparing for a Recovery or Another Major Correction?
Bitcoin is facing renewed selling pressure, currently trading around $73,578. Higher-than-expected US inflation, institutional ETF outflows and market uncertainty are creating challenges for buyers.
📊 Current Market Situation
- BTC Price: Approximately $73,578
- Market Sentiment: Bearish / Fear
- Immediate Support: $72,689
- Major Support: $72,000
- Immediate Resistance: $74,000–$74,316
- Major Resistance: $75,500
🧠 Market Psychology
Investors are becoming cautious as institutional money flows remain weak. However, some long-term buyers continue accumulating Bitcoin.
The market is currently testing investor confidence. Panic selling could create additional downside pressure, while renewed institutional demand could support recovery.
🟢 Bullish Scenario
If BTC holds above $72,689 and successfully breaks $74,316, buyers could target:
- $75,000
- $76,000
- $77,700
A stronger recovery above $77,700 would improve the market outlook.
🔴 Bearish Scenario
If Bitcoin loses $72,689 with strong selling volume, further downside could follow.
Important downside levels:
- $72,000
- $70,000
- $68,000
🎯 My Future Trading Strategy
1. Avoid buying during emotional market movements.
2. Consider gradual spot entries instead of investing everything at once.
3. Watch ETF inflows and institutional activity.
4. Wait for confirmation before entering breakout trades.
5. Keep USDT available for unexpected opportunities.
6. Always protect your capital with proper risk management.
🔮 Final Outlook
My short-term outlook remains cautious until Bitcoin regains important resistance levels.
A recovery is possible, but another correction cannot be ruled out.
Remember: The biggest opportunity is not always buying at the lowest price. It is entering with a clear strategy and controlled risk.
₿ Think smart. Stay patient. Trade with discipline.
#Bitcoin #BTC #CryptoAnalysis" s#BTCUSDT #BitcoinPrediction
$BTC #CryptoMarket #BinanceSquare
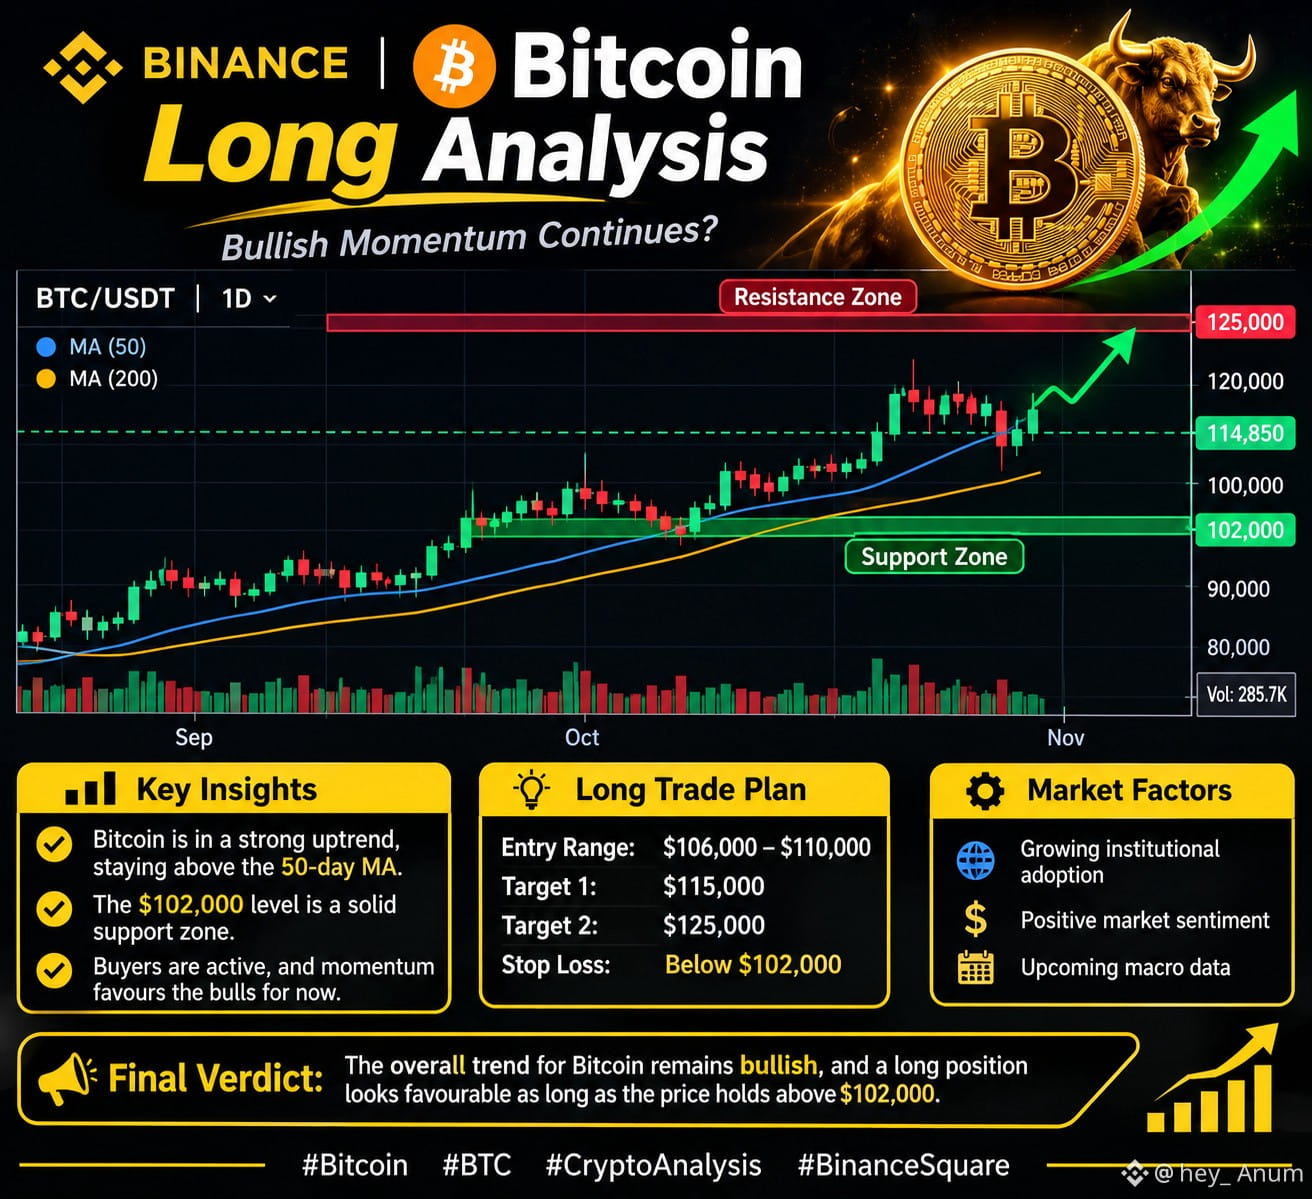
$BTC Bitcoin (BTC): Long-Term Analysis 📊 Bitcoin’s long-term outlook depends on more than short-term price movements. Its fundamentals, adoption, market demand, and global economic conditions all play important roles. 1. Fundamental Strength - Limited Supply: Bitcoin has a maximum supply of 21 million BTC under its current protocol rules. - Decentralization: Bitcoin operates without a central bank or single controlling authority. - Halving: Approximately every four years, the mining reward is reduced, slowing the rate at which new BTC enters circulation. - Network Security: Bitcoin uses Proof of Work to secure its blockchain. 2. Long-Term Bullish Factors - Increasing institutional interest and adoption. - Growing awareness of Bitcoin as a digital asset. - Its limited supply. - Continued development of the Bitcoin ecosystem. 3. Important Risks - High price volatility. - Changes in government regulations. - Global economic uncertainty. - Sudden changes in market demand and investor sentiment. 4. Technical Analysis For a long-term view, weekly and monthly charts are more useful than focusing only on short-term movements. Analysts commonly monitor: - Support: Areas where buying interest may increase. - Resistance: Areas where selling pressure may appear. - Moving Averages: Tools used to study the broader market trend. - Trading Volume: Helps assess the strength of price movements. 5. Long-Term Outlook Bitcoin has strong underlying features, but its future performance is uncertain. Continued adoption and demand could support its long-term growth, while economic and regulatory challenges may create significant corrections. Final Thoughts: Bitcoin remains one of the most closely followed digital assets. Understanding its fundamentals and risks is essential before forming a market opinion. #BTC #CryptoAnalysis" #cryptoeducation #AnthropicRejectsIPODelayValuationinQuestion #HotCPIDecemberHikePriced {spot}(BTCUSDT)
$BTC
Bitcoin (BTC): Long-Term Analysis 📊
Bitcoin’s long-term outlook depends on more than short-term price movements. Its fundamentals, adoption, market demand, and global economic conditions all play important roles.

1. Fundamental Strength

- Limited Supply: Bitcoin has a maximum supply of 21 million BTC under its current protocol rules.
- Decentralization: Bitcoin operates without a central bank or single controlling authority.
- Halving: Approximately every four years, the mining reward is reduced, slowing the rate at which new BTC enters circulation.
- Network Security: Bitcoin uses Proof of Work to secure its blockchain.

2. Long-Term Bullish Factors

- Increasing institutional interest and adoption.
- Growing awareness of Bitcoin as a digital asset.
- Its limited supply.
- Continued development of the Bitcoin ecosystem.

3. Important Risks

- High price volatility.
- Changes in government regulations.
- Global economic uncertainty.
- Sudden changes in market demand and investor sentiment.

4. Technical Analysis

For a long-term view, weekly and monthly charts are more useful than focusing only on short-term movements.

Analysts commonly monitor:

- Support: Areas where buying interest may increase.
- Resistance: Areas where selling pressure may appear.
- Moving Averages: Tools used to study the broader market trend.
- Trading Volume: Helps assess the strength of price movements.

5. Long-Term Outlook

Bitcoin has strong underlying features, but its future performance is uncertain. Continued adoption and demand could support its long-term growth, while economic and regulatory challenges may create significant corrections.

Final Thoughts: Bitcoin remains one of the most closely followed digital assets. Understanding its fundamentals and risks is essential before forming a market opinion.

#BTC #CryptoAnalysis" #cryptoeducation
#AnthropicRejectsIPODelayValuationinQuestion #HotCPIDecemberHikePriced
$BTC {spot}(BTCUSDT) $BTC — I think the next move could be sideways. After such a significant decline, I'm not convinced Bitcoin will immediately start another strong move in either direction. The recent inflation data, uncertainty around the Fed and ETF outflows are still putting pressure on the market. But after heavy selling, a period of consolidation would make sense to me. My base case is sideways trading while the market absorbs the recent news and looks for a clearer direction. That doesn't mean the bottom is in. Another negative catalyst could easily change the picture. For now, I'd rather watch how BTC behaves around its recent lows than rush into a position. Are we entering a consolidation phase, or is this just a pause before another drop? ANALYZOR | Data over hype. #BTC #bitcoin #CryptoAnalysis"
$BTC

$BTC — I think the next move could be sideways.

After such a significant decline, I'm not convinced Bitcoin will immediately start another strong move in either direction.

The recent inflation data, uncertainty around the Fed and ETF outflows are still putting pressure on the market.

But after heavy selling, a period of consolidation would make sense to me.

My base case is sideways trading while the market absorbs the recent news and looks for a clearer direction.

That doesn't mean the bottom is in. Another negative catalyst could easily change the picture.

For now, I'd rather watch how BTC behaves around its recent lows than rush into a position.

Are we entering a consolidation phase, or is this just a pause before another drop?

ANALYZOR | Data over hype.

#BTC #bitcoin #CryptoAnalysis"
🚀 Bitcoin Next Move: What to Expect This Week? ​Hey Binance Square Family! 👋 Let's talk about the current market situation. Bitcoin is showing some interesting movements around the key support levels. ​Here is my quick breakdown: ​1. Bullish Scenario: If BTC successfully breaks and holds the resistance zone, we might see a quick push towards the next target. ​2. Bearish Scenario: If it fails to hold, retesting the lower support is still on the table. Always manage your risk! ⚠️ ​What are your thoughts? Are you holding or buying the dip? Let me know in the comments below! 👇 #BTC走势分析 #CryptoAnalysis" #Write2Earn
🚀 Bitcoin Next Move: What to Expect This Week?

​Hey Binance Square Family! 👋 Let's talk about the current market situation. Bitcoin is showing some interesting movements around the key support levels.

​Here is my quick breakdown:

​1. Bullish Scenario: If BTC successfully breaks and holds the resistance zone, we might see a quick push towards the next target.
​2. Bearish Scenario: If it fails to hold, retesting the lower support is still on the table. Always manage your risk! ⚠️

​What are your thoughts? Are you holding or buying the dip? Let me know in the comments below! 👇

#BTC走势分析 #CryptoAnalysis" #Write2Earn
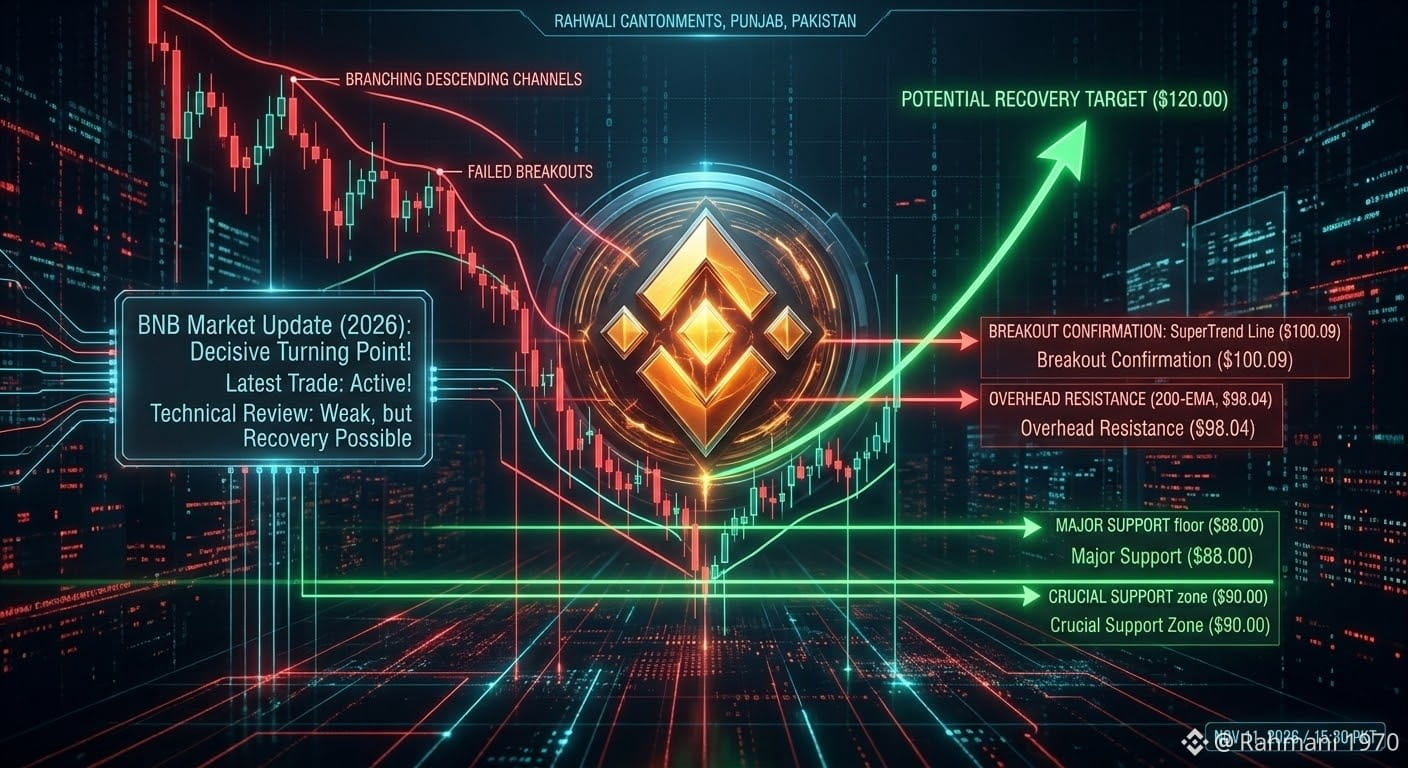
Market Situation & Active Trade Status (November 11, 2026) ​Is the latest trade active or not? Yes, the latest trade for $BNB is completely active and live in the cryptocurrency market. $BNB is a 24/7 traded asset and currently stands at a decisive turning point in the market. ​Brief Analysis of Current Situation: ​Decisive Price: BNB is currently trading around the key support level of $690. This level is extremely crucial for its long-term trend (200-day EMA). ​Weak Momentum: Technical indicators, such as the RSI (approximately 39), indicate that selling pressure currently outweighs buying momentum in the market. ​Key Levels: If BNB drops below $690, the price could pull back toward $650. On the other hand, if it clears the $705 resistance, a fresh recovery could be triggered. ​2. BNB Technical Map & Visual Analysis ​The market situation for BNB is summarized in the visual technical map below: ​Header: BNB MARKET UPDATE (2026): DECISIVE TURNING POINT! ​Status Callout: LATEST TRADE: ACTIVE! | TECHNICAL REVIEW: WEAK, BUT RECOVERY POSSIBLE. ​Potential Recovery Target: ($120.00) ​Breakout Confirmation: SuperTrend Line ($100.09) ​Overhead Resistance: (200-EMA, $98.04) ​Major Support Floor: ($88.00) ​Crucial Support Zone: ($90.00) #bnb #Binance #CryptoAnalysis" #BTC {spot}(BNBUSDT)
Market Situation & Active Trade Status (November 11, 2026)
​Is the latest trade active or not?
Yes, the latest trade for $BNB is completely active and live in the cryptocurrency market. $BNB is a 24/7 traded asset and currently stands at a decisive turning point in the market.
​Brief Analysis of Current Situation:
​Decisive Price: BNB is currently trading around the key support level of $690. This level is extremely crucial for its long-term trend (200-day EMA).
​Weak Momentum: Technical indicators, such as the RSI (approximately 39), indicate that selling pressure currently outweighs buying momentum in the market.
​Key Levels: If BNB drops below $690, the price could pull back toward $650. On the other hand, if it clears the $705 resistance, a fresh recovery could be triggered.
​2. BNB Technical Map & Visual Analysis
​The market situation for BNB is summarized in the visual technical map below:
​Header: BNB MARKET UPDATE (2026): DECISIVE TURNING POINT!
​Status Callout: LATEST TRADE: ACTIVE! | TECHNICAL REVIEW: WEAK, BUT RECOVERY POSSIBLE.
​Potential Recovery Target: ($120.00)
​Breakout Confirmation: SuperTrend Line ($100.09)
​Overhead Resistance: (200-EMA, $98.04)
​Major Support Floor: ($88.00)
​Crucial Support Zone: ($90.00)
#bnb #Binance #CryptoAnalysis" #BTC
$SEI is showing a standard downtrend. While recent selling momentum is decreasing, suggesting potential exhaustion, the price is not yet confirmed to reverse. Keep SEI on a watchlist for a potential entry, but wait for a strong bullish signal or reversal pattern near the liquidity zone before executing. Strict risk management is essential #SEİ #CryptoTrending #CryptoAnalysis" #aicoins #TechnicalAnalysiss {spot}(SEIUSDT)
$SEI is showing a standard downtrend. While recent selling momentum is decreasing, suggesting potential exhaustion, the price is not yet confirmed to reverse. Keep SEI on a watchlist for a potential entry, but wait for a strong bullish signal or reversal pattern near the liquidity zone before executing. Strict risk management is essential
#SEİ #CryptoTrending #CryptoAnalysis"
#aicoins #TechnicalAnalysiss
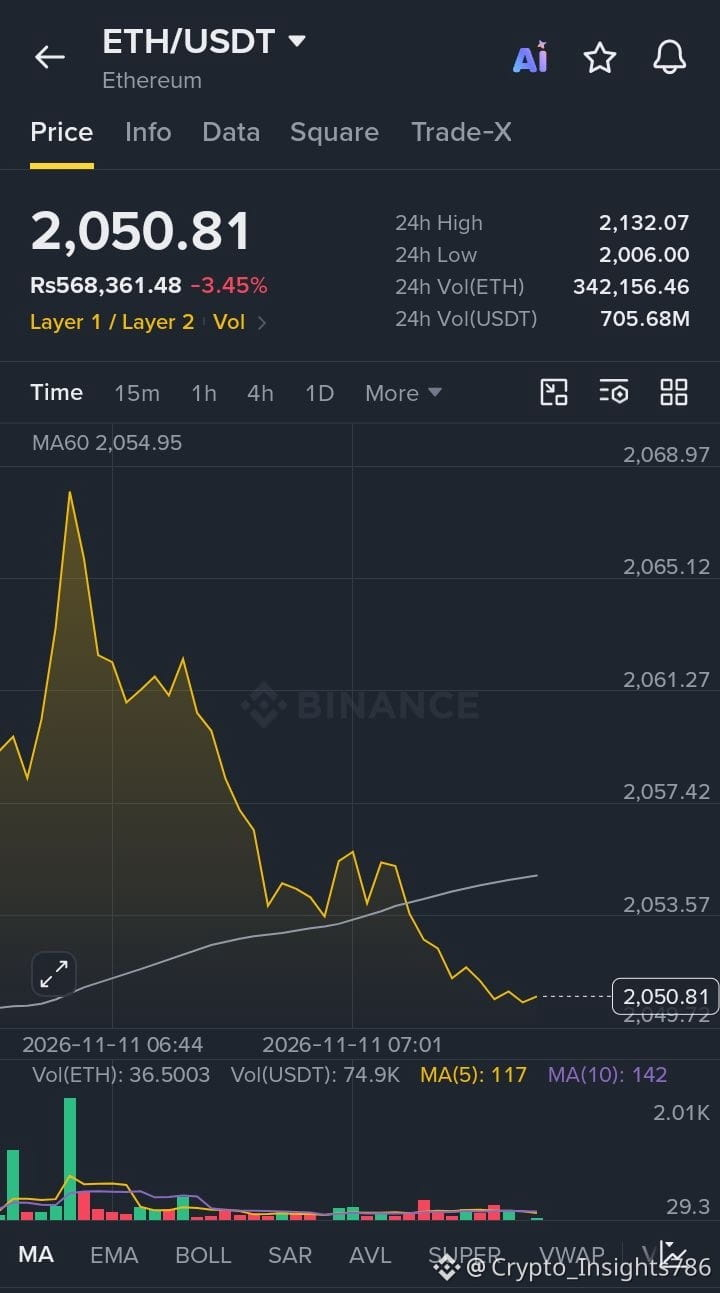
$ETH Current Price: $2,050 Market Trend: Bearish 📉 $ETH is facing selling pressure and struggling below the $2,090 resistance level. Support is near $1,959. A breakout above resistance could trigger a recovery, while losing support may lead to further downside. Stay alert and manage risk wisely! #Ethereum #ETH #CryptoAnalysis" #BİNANCESQUARE {spot}(ETHUSDT)
$ETH Current Price: $2,050
Market Trend: Bearish 📉
$ETH is facing selling pressure and struggling below the $2,090 resistance level. Support is near $1,959. A breakout above resistance could trigger a recovery, while losing support may lead to further downside.
Stay alert and manage risk wisely!
#Ethereum #ETH #CryptoAnalysis" #BİNANCESQUARE
🚀 Bitcoin (BTC) Next Move: Bullish Rally or A Sudden Correction? 📈📉 The crypto market is showing extreme strength, and Bitcoin is holding its crucial support levels like a boss! As we navigate through the current market cycle, everyone is asking one question: Is BTC ready to smash new all-time highs, or are we heading towards a short-term correction? Let's break down the data. 👇 🔍 Technical Insights & Key Levels • Major Support: $88,000 – $92,000 (Strong buyer interest zone) • Immediate Resistance: $98,000 – $100,000 (The psychological barrier) • RSI Indicator: Currently in the overbought territory on daily frames, suggesting a healthy consolidation might happen before the next massive leg up. 📊 Market Sentiment & On-Chain Data Institutional inflows via Spot ETFs are continuously creating massive buying pressure. However, retail funding rates are slightly high, which means leverage traders need to be cautious of sudden liquidations. 💡 My Trading Strategy: I am personally looking to accumulate more on major dips. Dollar-Cost Averaging (DCA) remains the safest strategy in this highly volatile environment. Never chase the green candles! 💬 What is your prediction? Will BTC touch $100,000 this week, or will the bears take control? Drop your targets in the comments below! 👇👇👇 #Bitcoin#CryptoAnalysis" #BinanceSquareWritingContest #TradingTips" #WriteToEarn #BinancePick
🚀 Bitcoin (BTC) Next Move: Bullish Rally or A Sudden Correction? 📈📉

The crypto market is showing extreme strength, and Bitcoin is holding its crucial support levels like a boss! As we navigate through the current market cycle, everyone is asking one question: Is BTC ready to smash new all-time highs, or are we heading towards a short-term correction? Let's break down the data. 👇

🔍 Technical Insights & Key Levels

• Major Support: $88,000 – $92,000 (Strong buyer interest zone)
• Immediate Resistance: $98,000 – $100,000 (The psychological barrier)
• RSI Indicator: Currently in the overbought territory on daily frames, suggesting a healthy consolidation might happen before the next massive leg up.

📊 Market Sentiment & On-Chain Data

Institutional inflows via Spot ETFs are continuously creating massive buying pressure. However, retail funding rates are slightly high, which means leverage traders need to be cautious of sudden liquidations.
💡 My Trading Strategy:
I am personally looking to accumulate more on major dips. Dollar-Cost Averaging (DCA) remains the safest strategy in this highly volatile environment. Never chase the green candles!
💬 What is your prediction? Will BTC touch $100,000 this week, or will the bears take control? Drop your targets in the comments below! 👇👇👇
#Bitcoin#CryptoAnalysis" #BinanceSquareWritingContest #TradingTips" #WriteToEarn #BinancePick
·
--
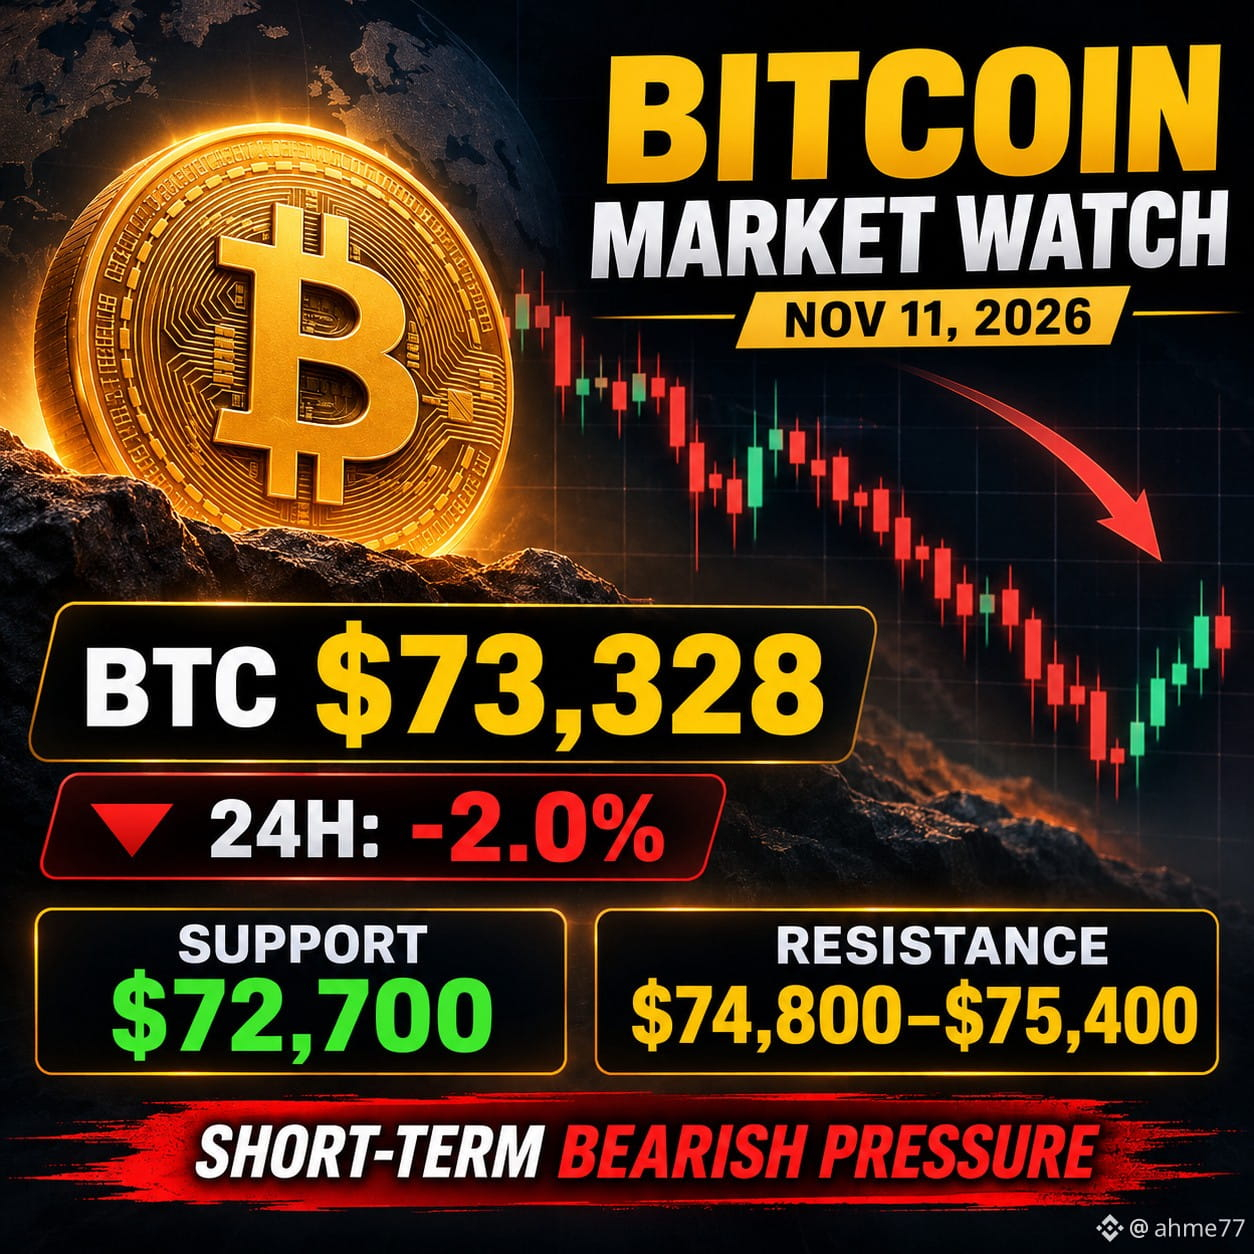
🚨 BITCOIN (BTC) MARKET UPDATE – NOVEMBER 11, 2026 Bitcoin is facing bearish pressure, trading around $73,328, down approximately 2% in the last 24 hours. 📉 Key Levels: Support: $72,700 Resistance: $74,800–$75,400 Market Outlook: $BTC remains under short-term selling pressure. A bounce above $75,400 could signal recovery, while a breakdown below $72,700 may trigger further downside. 👀 Watch these key levels before making your next move. Stay patient. Trade smart. Manage risk. #BTC #CryptoAnalysis" #BitcoinStrategy #CryptoMarketTrends #ADBJobsSurge {spot}(BTCUSDT)
🚨 BITCOIN (BTC) MARKET UPDATE – NOVEMBER 11, 2026

Bitcoin is facing bearish pressure, trading around $73,328, down approximately 2% in the last 24 hours.

📉 Key Levels:

Support: $72,700

Resistance: $74,800–$75,400

Market Outlook: $BTC remains under short-term selling pressure. A bounce above $75,400 could signal recovery, while a breakdown below $72,700 may trigger further downside.

👀 Watch these key levels before making your next move.

Stay patient. Trade smart. Manage risk.

#BTC #CryptoAnalysis" #BitcoinStrategy #CryptoMarketTrends #ADBJobsSurge
·
--
$INIT sitting right at a critical inflection point for INIT/USDT around $0.207. Momentum is building, and the charts are dropping heavy clues: {spot}(INITUSDT) 🔹 RSI (14) at 51.5: Clean, balanced slate—zero overbought drag, leaving plenty of runway for a breakout expansion. 🔹 Trendline Defense: Holding comfortably above the 200-period SMA. The macro structure remains intact. 🔹 Key Levels to Watch: • $0.2360 (R1): Immediate resistance. Clear this, and $0.2600 (R2) opens up fast. • $0.2050 (S1): Strong local demand zone keeping the floor firm. 💡 The Play: Watch for a volume-backed 4H close above $0.2360 for continuation, or accumulate steadily near support dips.#BinanceSquareFamily #altcoins #CryptoAnalysis"
$INIT sitting right at a critical inflection point for INIT/USDT around $0.207. Momentum is building, and the charts are dropping heavy clues:
🔹 RSI (14) at 51.5: Clean, balanced slate—zero overbought drag, leaving plenty of runway for a breakout expansion.
🔹 Trendline Defense: Holding comfortably above the 200-period SMA. The macro structure remains intact.
🔹 Key Levels to Watch: • $0.2360 (R1): Immediate resistance. Clear this, and $0.2600 (R2) opens up fast.
• $0.2050 (S1): Strong local demand zone keeping the floor firm.
💡 The Play: Watch for a volume-backed 4H close above $0.2360 for continuation, or accumulate steadily near support dips.#BinanceSquareFamily
#altcoins
#CryptoAnalysis"
$PIEVERSE Current price: Around $2.10 24H trend: Strong bullish movement Resistance: $2.20–$2.23 Support: $1.95–$2.00 Strategy: Wait for a confirmed breakout above $2.23 or a healthy pullback before entry. Risk: Avoid FOMO buying after a sharp pump. Market data changes rapidly. Check the live chart before trading. Suggested hashtags: #PIEVERSE #CryptoAnalysis" #BinanceSquare #CryptoMarket #BTC {alpha}(560x0e63b9c287e32a05e6b9ab8ee8df88a2760225a9)
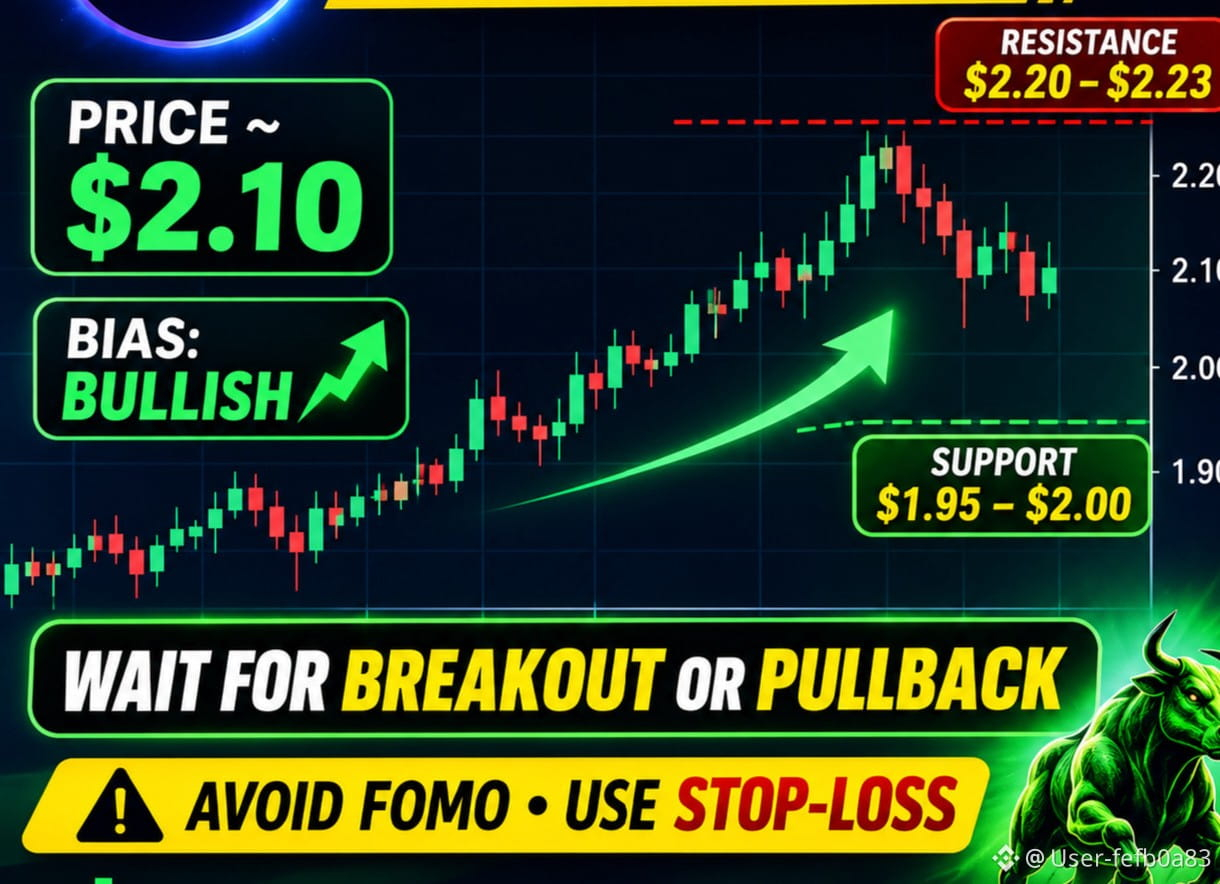
$PIEVERSE

Current price: Around $2.10
24H trend: Strong bullish movement
Resistance: $2.20–$2.23
Support: $1.95–$2.00
Strategy: Wait for a confirmed breakout above $2.23 or a healthy pullback before entry.
Risk: Avoid FOMO buying after a sharp pump.
Market data changes rapidly. Check the live chart before trading.
Suggested hashtags:
#PIEVERSE #CryptoAnalysis" #BinanceSquare #CryptoMarket #BTC

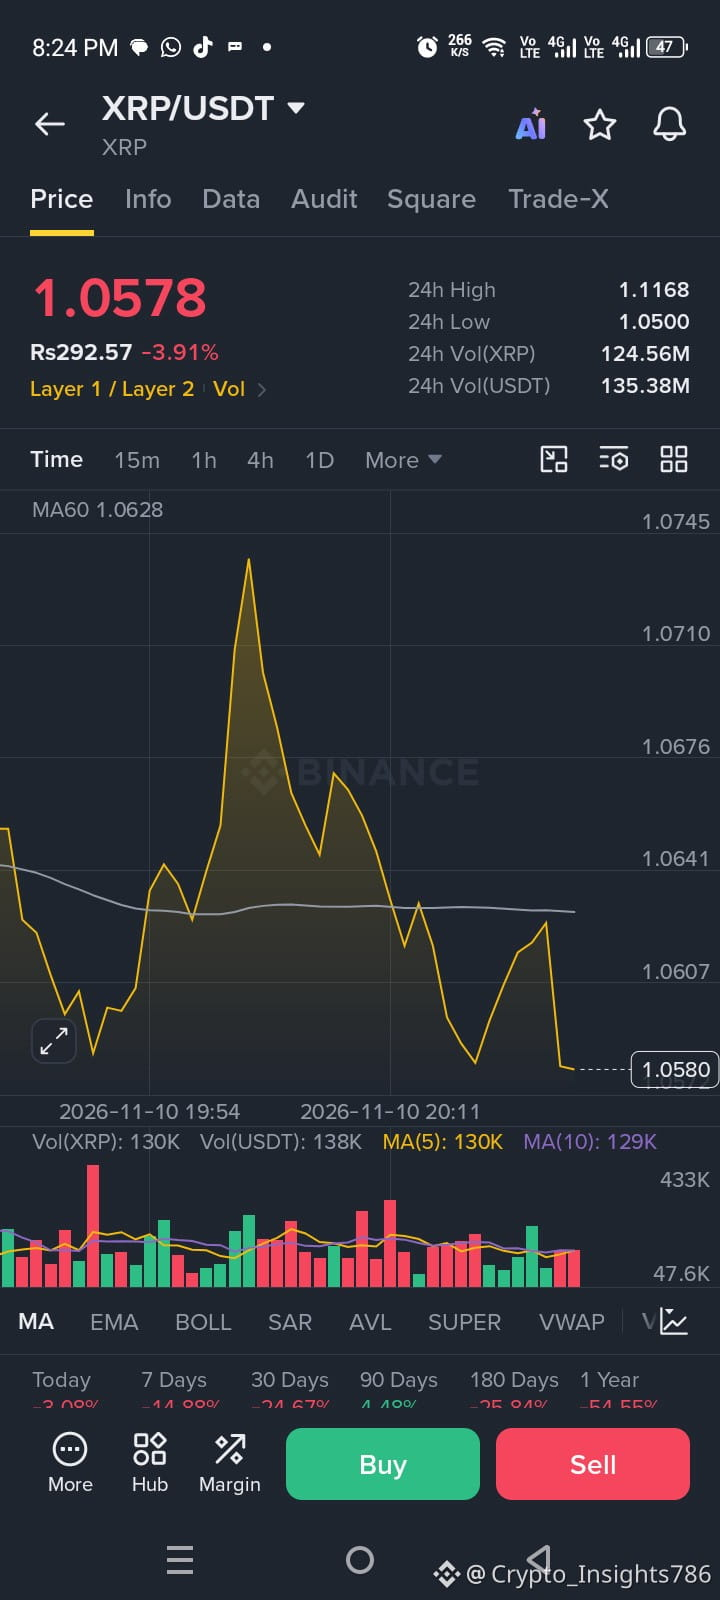
$XRP Current Price: $1.0578 $XRP is facing strong bearish pressure, trading below key resistance levels. Support is around $1.07–$1.00, while resistance stands near $1.12–$1.20. A breakout above resistance could trigger a recovery, while losing support may lead to further downside. Traders should watch volume and market momentum closely. #Xrp🔥🔥 #RİPPLE #CryptoAnalysis" #BinanceSquare {spot}(XRPUSDT)

$XRP Current Price: $1.0578

$XRP is facing strong bearish pressure, trading below key resistance levels. Support is around $1.07–$1.00, while resistance stands near $1.12–$1.20.

A breakout above resistance could trigger a recovery, while losing support may lead to further downside. Traders should watch volume and market momentum closely.

#Xrp🔥🔥 #RİPPLE #CryptoAnalysis" #BinanceSquare
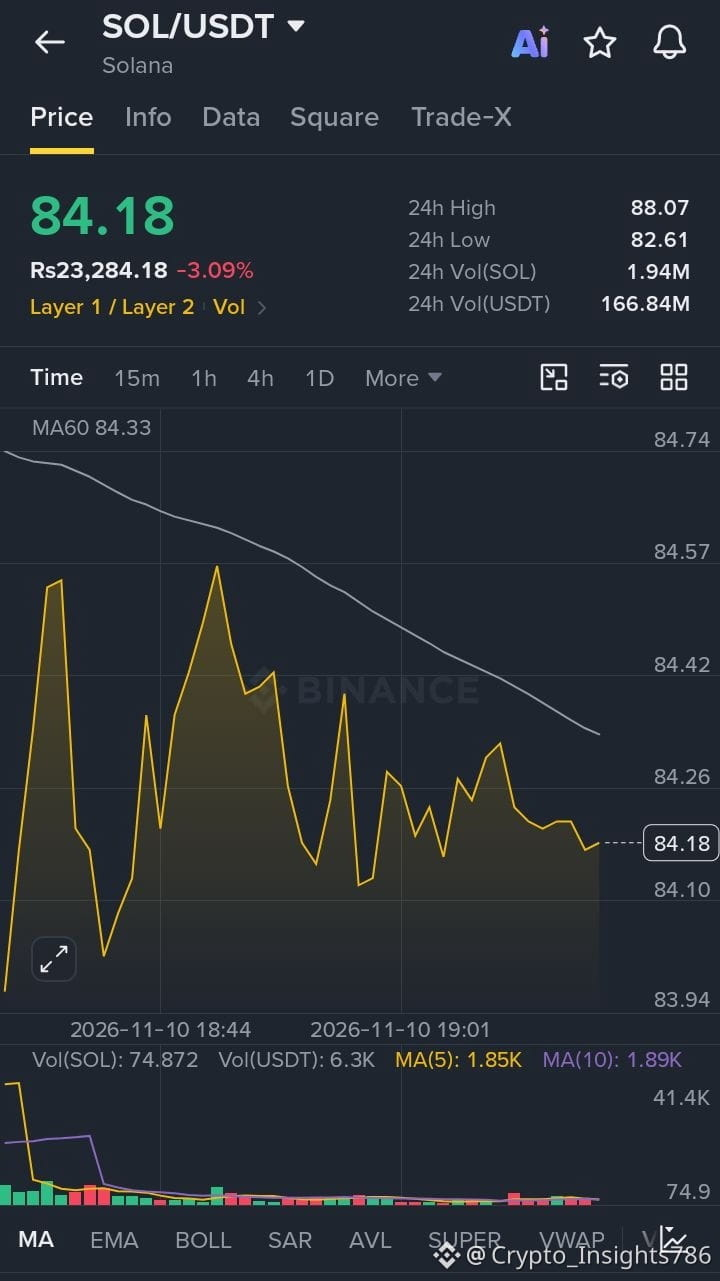
$SOL Current Price: $84.18 📉 Market Trend: Bearish 🔹 Support: $85 – $83 🔹 Resistance: $88 – $90 $SOL is facing selling pressure as the broader crypto market remains weak. A breakout above $90 could signal a recovery, while a drop below $85 may lead to further downside. 📊 Outlook: Cautiously bearish. Watch support and resistance levels closely. #solana #SOL #CryptoAnalysis" #BinanceSquare {spot}(SOLUSDT)
$SOL Current Price: $84.18
📉 Market Trend: Bearish
🔹 Support: $85 – $83
🔹 Resistance: $88 – $90
$SOL is facing selling pressure as the broader crypto market remains weak. A breakout above $90 could signal a recovery, while a drop below $85 may lead to further downside.
📊 Outlook: Cautiously bearish. Watch support and resistance levels closely.
#solana #SOL #CryptoAnalysis" #BinanceSquare
An$ETH pre-mine wallet has suddenly awakened after 11.3 years, moving 0.05 $ETH while still holding approximately 2,154.95 $ETH . This unusual activity has caught the market’s attention. 👀 Is this the beginning of a bigger move in Ethereum, or just a test transaction? Keep an eye on the next move. ETH could have an interesting story ahead! 📈 #Ethereum #CryptoAnalysis" #BinanceSquareTalks #FollowYourBrotherForMore {spot}(ETHUSDT)
An$ETH pre-mine wallet has suddenly awakened after 11.3 years, moving 0.05 $ETH while still holding approximately 2,154.95 $ETH .

This unusual activity has caught the market’s attention. 👀

Is this the beginning of a bigger move in Ethereum, or just a test transaction?

Keep an eye on the next move. ETH could have an interesting story ahead! 📈
#Ethereum #CryptoAnalysis" #BinanceSquareTalks #FollowYourBrotherForMore
Ethereum Up or Down - November 10, 7AM ET

Ethereum Up or Down - November 10, 7AM ET

99%Up1%Down
Volume $53,195.54
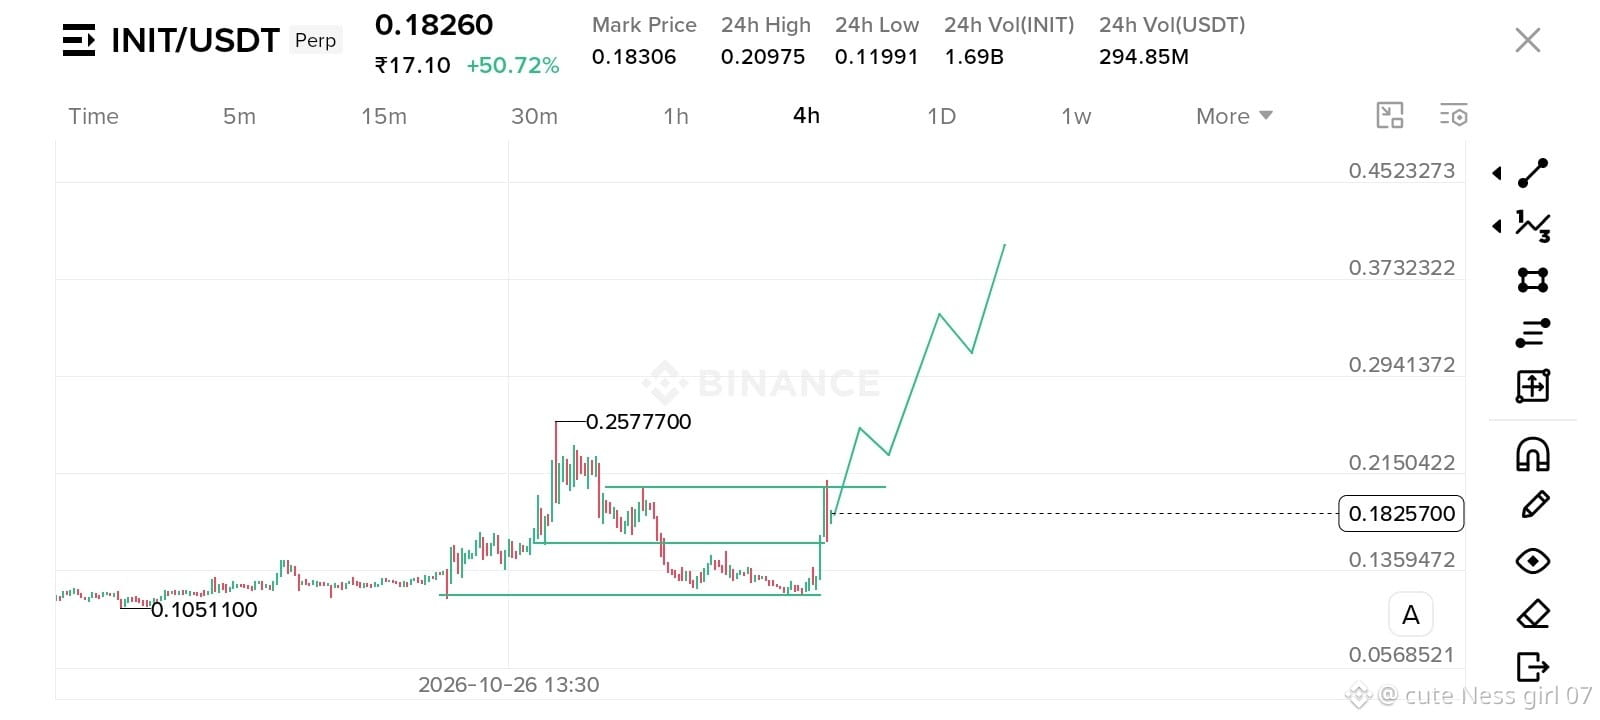
$INIT – Strong Bullish Momentum! Current Price: $0.1826 24H Change: +50.72% Timeframe: 4H 📊 Market Analysis: INIT has shown a strong bullish breakout after a long consolidation phase. Buyers have stepped in aggressively, pushing the price above its previous resistance zone. The current structure suggests the possibility of further upside if buyers maintain momentum. 🎯 Upside Targets (TP): - TP1: $0.215 - TP2: $0.257 - TP3: $0.294 - TP4: $0.373 - TP5: $0.400 🟢 Important Support Zones: - $0.160 – $0.150 - $0.135 – $0.120 🛑 Stop Loss: Below $0.150 (for a breakout-retest setup). My View: The overall 4H structure looks bullish. A successful breakout and hold above $0.20–$0.21 could open the door for another strong upward move. #INIT #INITUSDT #CryptoAnalysis" #Binance #BullishBreakout {future}(INITUSDT)
$INIT – Strong Bullish Momentum!

Current Price: $0.1826
24H Change: +50.72%
Timeframe: 4H

📊 Market Analysis:

INIT has shown a strong bullish breakout after a long consolidation phase. Buyers have stepped in aggressively, pushing the price above its previous resistance zone.

The current structure suggests the possibility of further upside if buyers maintain momentum.

🎯 Upside Targets (TP):

- TP1: $0.215
- TP2: $0.257
- TP3: $0.294
- TP4: $0.373
- TP5: $0.400

🟢 Important Support Zones:

- $0.160 – $0.150
- $0.135 – $0.120

🛑 Stop Loss: Below $0.150 (for a breakout-retest setup).

My View:
The overall 4H structure looks bullish. A successful breakout and hold above $0.20–$0.21 could open the door for another strong upward move.
#INIT #INITUSDT #CryptoAnalysis" #Binance #BullishBreakout
Log in to explore more content
Join global crypto users on Binance Square
⚡️ Get latest and useful information about crypto.
💬 Trusted by the world’s largest crypto exchange.
👍 Discover real insights from verified creators.
Email / Phone number