
#bnbusdt
bnbusdt
2.2M views
12,287 Discussing
Hot
Latest

·
--
#BNBUSDT Signal Update: Buyers in Control 🚀
Current BNB price is at $641.22 (Signal: BUY, Score: 2.91, 2/3 timeframes agree).
Timeframe Breakdown:
* 1H: Neutral / Bearish (-1.27)
* 15M & 5M: Bullish (momentum favoring buyers on lower timeframes)
📊 Key Levels:
* Resistance: $646.33 (Immediate), $649.80, $654.56
* Support / Invalidation: $641.22 (Immediate), $640.03, $622.41
📈 Strategy:
Watch for a clean break and continuation past $646.33. The bullish setup is invalid if price closes below support at $641.22.
Disclaimer: Spot long-only analysis. Not financial advice—signals can fail.
#BinanceSquareTalks #CryptoTrading #BNBUSDT
#BNBUSDT Signal Update: Buyers in Control 🚀
Current BNB price is at $641.22 (Signal: BUY, Score: 2.91, 2/3 timeframes agree).
Timeframe Breakdown:
* 1H: Neutral / Bearish (-1.27)
* 15M & 5M: Bullish (momentum favoring buyers on lower timeframes)
📊 Key Levels:
* Resistance: $646.33 (Immediate), $649.80, $654.56
* Support / Invalidation: $641.22 (Immediate), $640.03, $622.41
📈 Strategy:
Watch for a clean break and continuation past $646.33. The bullish setup is invalid if price closes below support at $641.22.
Disclaimer: Spot long-only analysis. Not financial advice—signals can fail.
#BinanceSquareTalks #CryptoTrading #BNBUSDT
Current BNB price is at $641.22 (Signal: BUY, Score: 2.91, 2/3 timeframes agree).
Timeframe Breakdown:
* 1H: Neutral / Bearish (-1.27)
* 15M & 5M: Bullish (momentum favoring buyers on lower timeframes)
📊 Key Levels:
* Resistance: $646.33 (Immediate), $649.80, $654.56
* Support / Invalidation: $641.22 (Immediate), $640.03, $622.41
📈 Strategy:
Watch for a clean break and continuation past $646.33. The bullish setup is invalid if price closes below support at $641.22.
Disclaimer: Spot long-only analysis. Not financial advice—signals can fail.
#BinanceSquareTalks #CryptoTrading #BNBUSDT
1
2
531

·
--
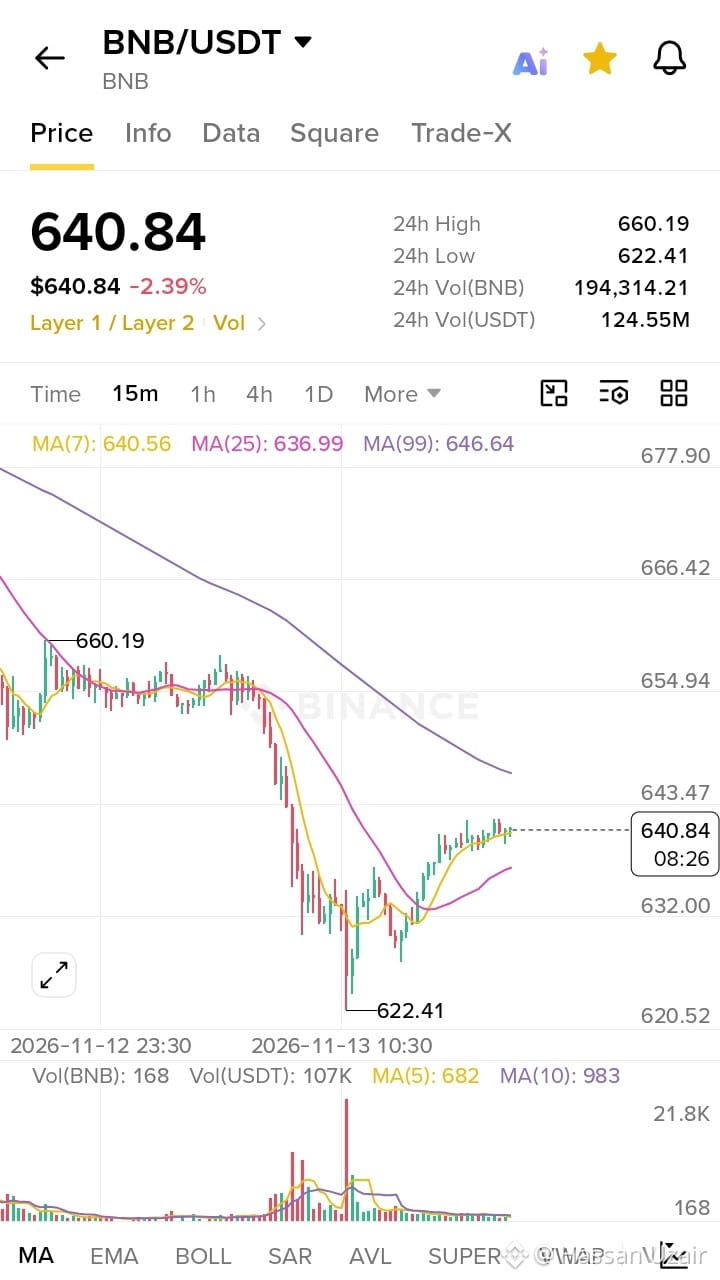
📊 $BNB /USDT | 15m Technical Analysis
BNB is trading at $640.84 (-2.39%) after bouncing from the 24h low of $622.41. 24h high: $660.19.
🔍 What the chart shows:
• Sharp sell-off to $622.41 with a volume spike, followed by a steady recovery
• Price is now above MA(7) $640.56 and MA(25) $636.99 → short-term momentum is recovering
• MA(99) at $646.64 is still sloping down and acting as the key resistance
• Volume is fading on the bounce, so buyers are not fully convinced yet
🟢 Support: $637 → $632 → $622.41
🔴 Resistance: $646.64 (MA99) → $655 → $660.19
📌 Scenarios:
• Bullish: a 15m close above $646.64 with rising volume could open a move toward $655–660
• Bearish: a break below $637 (MA25) may send price back to retest $632 and $622
⚠️ Wait for confirmation, always use a stop-loss, and avoid high leverage. Don't chase candles.
What's your view on $BNB , continuation of the bounce or another leg down? 👇
This is not financial advice. Always DYOR.
#BNB #BNBUSDT #BNBChain #CryptoAnalysis #TechnicalAnalysis #Altcoins #Binance #BinanceSquare #CryptoTrading #TradingSignals
📊 $BNB /USDT | 15m Technical Analysis
BNB is trading at $640.84 (-2.39%) after bouncing from the 24h low of $622.41. 24h high: $660.19.
🔍 What the chart shows:
• Sharp sell-off to $622.41 with a volume spike, followed by a steady recovery
• Price is now above MA(7) $640.56 and MA(25) $636.99 → short-term momentum is recovering
• MA(99) at $646.64 is still sloping down and acting as the key resistance
• Volume is fading on the bounce, so buyers are not fully convinced yet
🟢 Support: $637 → $632 → $622.41
🔴 Resistance: $646.64 (MA99) → $655 → $660.19
📌 Scenarios:
• Bullish: a 15m close above $646.64 with rising volume could open a move toward $655–660
• Bearish: a break below $637 (MA25) may send price back to retest $632 and $622
⚠️ Wait for confirmation, always use a stop-loss, and avoid high leverage. Don't chase candles.
What's your view on $BNB , continuation of the bounce or another leg down? 👇
This is not financial advice. Always DYOR.
#BNB #BNBUSDT #BNBChain #CryptoAnalysis #TechnicalAnalysis #Altcoins #Binance #BinanceSquare #CryptoTrading #TradingSignals
BNB is trading at $640.84 (-2.39%) after bouncing from the 24h low of $622.41. 24h high: $660.19.
🔍 What the chart shows:
• Sharp sell-off to $622.41 with a volume spike, followed by a steady recovery
• Price is now above MA(7) $640.56 and MA(25) $636.99 → short-term momentum is recovering
• MA(99) at $646.64 is still sloping down and acting as the key resistance
• Volume is fading on the bounce, so buyers are not fully convinced yet
🟢 Support: $637 → $632 → $622.41
🔴 Resistance: $646.64 (MA99) → $655 → $660.19
📌 Scenarios:
• Bullish: a 15m close above $646.64 with rising volume could open a move toward $655–660
• Bearish: a break below $637 (MA25) may send price back to retest $632 and $622
⚠️ Wait for confirmation, always use a stop-loss, and avoid high leverage. Don't chase candles.
What's your view on $BNB , continuation of the bounce or another leg down? 👇
This is not financial advice. Always DYOR.
#BNB #BNBUSDT #BNBChain #CryptoAnalysis #TechnicalAnalysis #Altcoins #Binance #BinanceSquare #CryptoTrading #TradingSignals
94

·
--
Bullish
🚀 $BNB — THE SILENCE BEFORE THE STORM! 🔥
Something is brewing in the market! That silence before the storm feels different. 👀
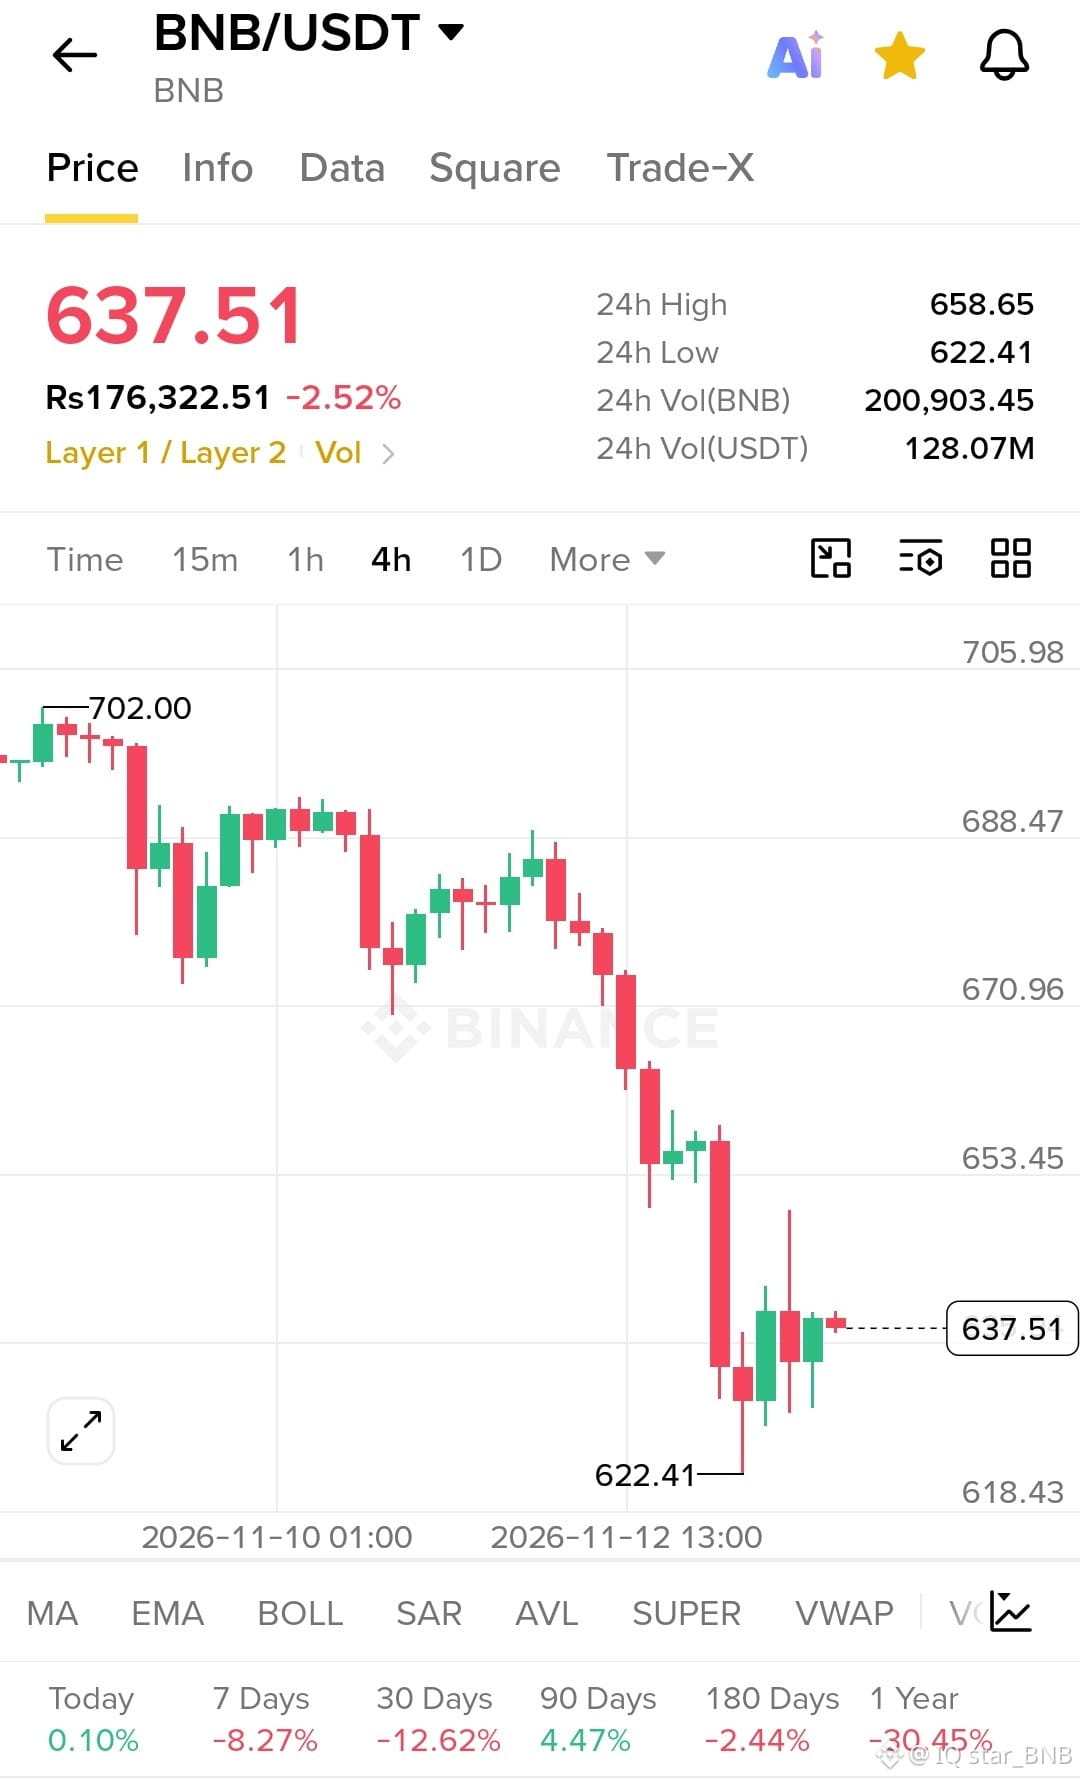
BNB is currently trading around $637.51, down 2.52% in 24 hours, but the next move could bring serious volatility!
📊 MARKET SNAPSHOT
- Current Price: $637.51
- 24H High: $658.65
- 24H Low: $622.41
- 24H Trading Volume: $128.07M USDT
- Key Support: $622–625
- Resistance: $653–658
🐋 WHAT I'M WATCHING
- Volume expansion for confirmation.
- BTC dominance and capital rotation.
- Whale activity and large transactions.
- A potential bullish recovery above $653.
🎯 TRADE WATCH LEVELS
- EP: $638–642 (after bullish confirmation)
- TP1: $653
- TP2: $658
- TP3: $670
- SL: $621
⚡ THE BIG PICTURE:
BNB is testing an important support region after a sharp decline. A confirmed recovery could open the door to a relief rally, while losing $622 could bring further downside.
No confirmation, no blind entry. Manage risk!
🔥 I'm ready for the move — the next chapter could be explosive!
#bnbusdtshort #BNBUSDT #BNBUSDT #ALTCOİNS #CryptoTrading
🚀 $BNB — THE SILENCE BEFORE THE STORM! 🔥
Something is brewing in the market! That silence before the storm feels different. 👀
BNB is currently trading around $637.51, down 2.52% in 24 hours, but the next move could bring serious volatility!
📊 MARKET SNAPSHOT
- Current Price: $637.51
- 24H High: $658.65
- 24H Low: $622.41
- 24H Trading Volume: $128.07M USDT
- Key Support: $622–625
- Resistance: $653–658
🐋 WHAT I'M WATCHING
- Volume expansion for confirmation.
- BTC dominance and capital rotation.
- Whale activity and large transactions.
- A potential bullish recovery above $653.
🎯 TRADE WATCH LEVELS
- EP: $638–642 (after bullish confirmation)
- TP1: $653
- TP2: $658
- TP3: $670
- SL: $621
⚡ THE BIG PICTURE:
BNB is testing an important support region after a sharp decline. A confirmed recovery could open the door to a relief rally, while losing $622 could bring further downside.
No confirmation, no blind entry. Manage risk!
🔥 I'm ready for the move — the next chapter could be explosive!
#bnbusdtshort #BNBUSDT #BNBUSDT #ALTCOİNS #CryptoTrading
Something is brewing in the market! That silence before the storm feels different. 👀
BNB is currently trading around $637.51, down 2.52% in 24 hours, but the next move could bring serious volatility!
📊 MARKET SNAPSHOT
- Current Price: $637.51
- 24H High: $658.65
- 24H Low: $622.41
- 24H Trading Volume: $128.07M USDT
- Key Support: $622–625
- Resistance: $653–658
🐋 WHAT I'M WATCHING
- Volume expansion for confirmation.
- BTC dominance and capital rotation.
- Whale activity and large transactions.
- A potential bullish recovery above $653.
🎯 TRADE WATCH LEVELS
- EP: $638–642 (after bullish confirmation)
- TP1: $653
- TP2: $658
- TP3: $670
- SL: $621
⚡ THE BIG PICTURE:
BNB is testing an important support region after a sharp decline. A confirmed recovery could open the door to a relief rally, while losing $622 could bring further downside.
No confirmation, no blind entry. Manage risk!
🔥 I'm ready for the move — the next chapter could be explosive!
#bnbusdtshort #BNBUSDT #BNBUSDT #ALTCOİNS #CryptoTrading
99

·
--
🚨 BNB just dipped to $631.97 – Discount Zone alert! 🚨
Bearish vibes on the 4H chart, but smart money loves buying low. Support at $622.12 is holding strong, and we're trading below the 20 SMA ($664.43). If this level breaks, next target is $603.53 for a juicy 1:1.5 R/R setup. 🔥
Are you ready to catch the bounce or ride the breakdown? Drop your thoughts below! 👇
#Crypto #Binance #BNBUSDT #TradingSignals
🔔 Don't forget to follow for more updates! & Your Mr Zero
⚠️ Not financial advice - always DYOR.
Click Here To Trade 👇
🚨 BNB just dipped to $631.97 – Discount Zone alert! 🚨
Bearish vibes on the 4H chart, but smart money loves buying low. Support at $622.12 is holding strong, and we're trading below the 20 SMA ($664.43). If this level breaks, next target is $603.53 for a juicy 1:1.5 R/R setup. 🔥
Are you ready to catch the bounce or ride the breakdown? Drop your thoughts below! 👇
#Crypto #Binance #BNBUSDT #TradingSignals
🔔 Don't forget to follow for more updates! & Your Mr Zero
⚠️ Not financial advice - always DYOR.
Click Here To Trade 👇
Bearish vibes on the 4H chart, but smart money loves buying low. Support at $622.12 is holding strong, and we're trading below the 20 SMA ($664.43). If this level breaks, next target is $603.53 for a juicy 1:1.5 R/R setup. 🔥
Are you ready to catch the bounce or ride the breakdown? Drop your thoughts below! 👇
#Crypto #Binance #BNBUSDT #TradingSignals
🔔 Don't forget to follow for more updates! & Your Mr Zero
⚠️ Not financial advice - always DYOR.
Click Here To Trade 👇
37

·
--
🚀$ BNB SHORT SQUEEZE ALERT — BEARS ARE UNDER PRESSURE!
🟢 $62.6K in BNB short positions liquidated at $646.29!
The market just delivered a painful blow to bearish traders. This liquidation event suggests that buyers are applying pressure, forcing short sellers out of their positions and potentially adding fuel to upward momentum.
📊 Key Market Insight:
- Asset: $BNB
- Liquidation: Short Positions
- Amount: $62,600
- Liquidation Price: $646.29
- Market Signal: Potential bullish pressure
🎯 My Next-Move Outlook:
If BNB maintains strength above the $646 area and buying volume continues to build, another upward push could develop. However, failure to hold this region may trigger a pullback as the market searches for support.
⚡ Trader's Strategy: Watch volume, price structure, and confirmation before entering a position. Don't chase the move blindly.
Are the bears losing control of BNB? 👀
#BNBUSDT
#CryptoTrading
#LiquidationAlert
#BinanceSquare
{spot}(BNBUSDT)
🚀$ BNB SHORT SQUEEZE ALERT — BEARS ARE UNDER PRESSURE!
🟢 $62.6K in BNB short positions liquidated at $646.29!
The market just delivered a painful blow to bearish traders. This liquidation event suggests that buyers are applying pressure, forcing short sellers out of their positions and potentially adding fuel to upward momentum.
📊 Key Market Insight:
- Asset: $BNB
- Liquidation: Short Positions
- Amount: $62,600
- Liquidation Price: $646.29
- Market Signal: Potential bullish pressure
🎯 My Next-Move Outlook:
If BNB maintains strength above the $646 area and buying volume continues to build, another upward push could develop. However, failure to hold this region may trigger a pullback as the market searches for support.
⚡ Trader's Strategy: Watch volume, price structure, and confirmation before entering a position. Don't chase the move blindly.
Are the bears losing control of BNB? 👀
#BNBUSDT
#CryptoTrading
#LiquidationAlert
#BinanceSquare
🟢 $62.6K in BNB short positions liquidated at $646.29!
The market just delivered a painful blow to bearish traders. This liquidation event suggests that buyers are applying pressure, forcing short sellers out of their positions and potentially adding fuel to upward momentum.
📊 Key Market Insight:
- Asset: $BNB
- Liquidation: Short Positions
- Amount: $62,600
- Liquidation Price: $646.29
- Market Signal: Potential bullish pressure
🎯 My Next-Move Outlook:
If BNB maintains strength above the $646 area and buying volume continues to build, another upward push could develop. However, failure to hold this region may trigger a pullback as the market searches for support.
⚡ Trader's Strategy: Watch volume, price structure, and confirmation before entering a position. Don't chase the move blindly.
Are the bears losing control of BNB? 👀
#BNBUSDT
#CryptoTrading
#LiquidationAlert
#BinanceSquare
60

·
--
Bearish
🔴 $BNB BNB's 4h structure is a clean descending staircase from 723.99, and the relief bounce off 622.12 is running straight into the EMA(7) at 646 and the 648-652 broken shelf while Supertrend stays red at 662.73 with the EMA(25) and EMA(99) at 666.75/694.76 capping everything above. RSI(6) at 32.9 plus a StochRSI cross off 13.6 marks this as an oversold exhale, not a trend change — sell the 646-652 retest and let the lower-high sequence do the work.
Trade Setup
Entry: 646 - 650
Stop-Loss: 666
Targets: 615 - 598 - 580
Trade smart, protect your capital, and always manage your own risk. Personal analysis only not financial advice.
#BNB #BNBUSDT #BinanceSquare #USPPIMissMayEaseBTCPressure #WhatWillDriveCryptoandStocks’NextRebound?
{future}(BNBUSDT)
🔴 $BNB BNB's 4h structure is a clean descending staircase from 723.99, and the relief bounce off 622.12 is running straight into the EMA(7) at 646 and the 648-652 broken shelf while Supertrend stays red at 662.73 with the EMA(25) and EMA(99) at 666.75/694.76 capping everything above. RSI(6) at 32.9 plus a StochRSI cross off 13.6 marks this as an oversold exhale, not a trend change — sell the 646-652 retest and let the lower-high sequence do the work.
Trade Setup
Entry: 646 - 650
Stop-Loss: 666
Targets: 615 - 598 - 580
Trade smart, protect your capital, and always manage your own risk. Personal analysis only not financial advice.
#BNB #BNBUSDT #BinanceSquare #USPPIMissMayEaseBTCPressure #WhatWillDriveCryptoandStocks’NextRebound?
Trade Setup
Entry: 646 - 650
Stop-Loss: 666
Targets: 615 - 598 - 580
Trade smart, protect your capital, and always manage your own risk. Personal analysis only not financial advice.
#BNB #BNBUSDT #BinanceSquare #USPPIMissMayEaseBTCPressure #WhatWillDriveCryptoandStocks’NextRebound?
1
34

·
--
Bullish
📊 $BNB
{future}(BNBUSDT)
BNBUSDT | Bullish Recovery Outlook
BNB is down 1.09%, with trading volume at $527M.
Despite the decline, technical signals favor a potential bullish recovery, with 4 out of 5 bullish conditions aligned against just 1 bearish condition.
📈 Bullish Trade Outlook:
✅ Entry: Look for a pullback toward short-term support, followed by a confirmed bullish candle close.
✅ Confirmation: Buyers reclaim the recent resistance level with increasing volume and sustained upward momentum.
🎯 Target 1: Retest of the recent swing high.
🎯 Target 2: Extension toward the next resistance level if the breakout holds.
🛑 Risk: A breakdown below the recent swing low would weaken the bullish outlook.
⚠️ Current View: Bullish bias remains, but the entry is overextended. Waiting for a better risk-to-reward opportunity is preferable to chasing the move.
Can BNB regain bullish momentum?
#BNB #BNBUSDT #BinanceSquare #cryptotrading #BullishOutlook
📊 $BNB
BNBUSDT | Bullish Recovery Outlook
BNB is down 1.09%, with trading volume at $527M.
Despite the decline, technical signals favor a potential bullish recovery, with 4 out of 5 bullish conditions aligned against just 1 bearish condition.
📈 Bullish Trade Outlook:
✅ Entry: Look for a pullback toward short-term support, followed by a confirmed bullish candle close.
✅ Confirmation: Buyers reclaim the recent resistance level with increasing volume and sustained upward momentum.
🎯 Target 1: Retest of the recent swing high.
🎯 Target 2: Extension toward the next resistance level if the breakout holds.
🛑 Risk: A breakdown below the recent swing low would weaken the bullish outlook.
⚠️ Current View: Bullish bias remains, but the entry is overextended. Waiting for a better risk-to-reward opportunity is preferable to chasing the move.
Can BNB regain bullish momentum?
#BNB #BNBUSDT #BinanceSquare #cryptotrading #BullishOutlook
BNBUSDT | Bullish Recovery Outlook
BNB is down 1.09%, with trading volume at $527M.
Despite the decline, technical signals favor a potential bullish recovery, with 4 out of 5 bullish conditions aligned against just 1 bearish condition.
📈 Bullish Trade Outlook:
✅ Entry: Look for a pullback toward short-term support, followed by a confirmed bullish candle close.
✅ Confirmation: Buyers reclaim the recent resistance level with increasing volume and sustained upward momentum.
🎯 Target 1: Retest of the recent swing high.
🎯 Target 2: Extension toward the next resistance level if the breakout holds.
🛑 Risk: A breakdown below the recent swing low would weaken the bullish outlook.
⚠️ Current View: Bullish bias remains, but the entry is overextended. Waiting for a better risk-to-reward opportunity is preferable to chasing the move.
Can BNB regain bullish momentum?
#BNB #BNBUSDT #BinanceSquare #cryptotrading #BullishOutlook
13

Article
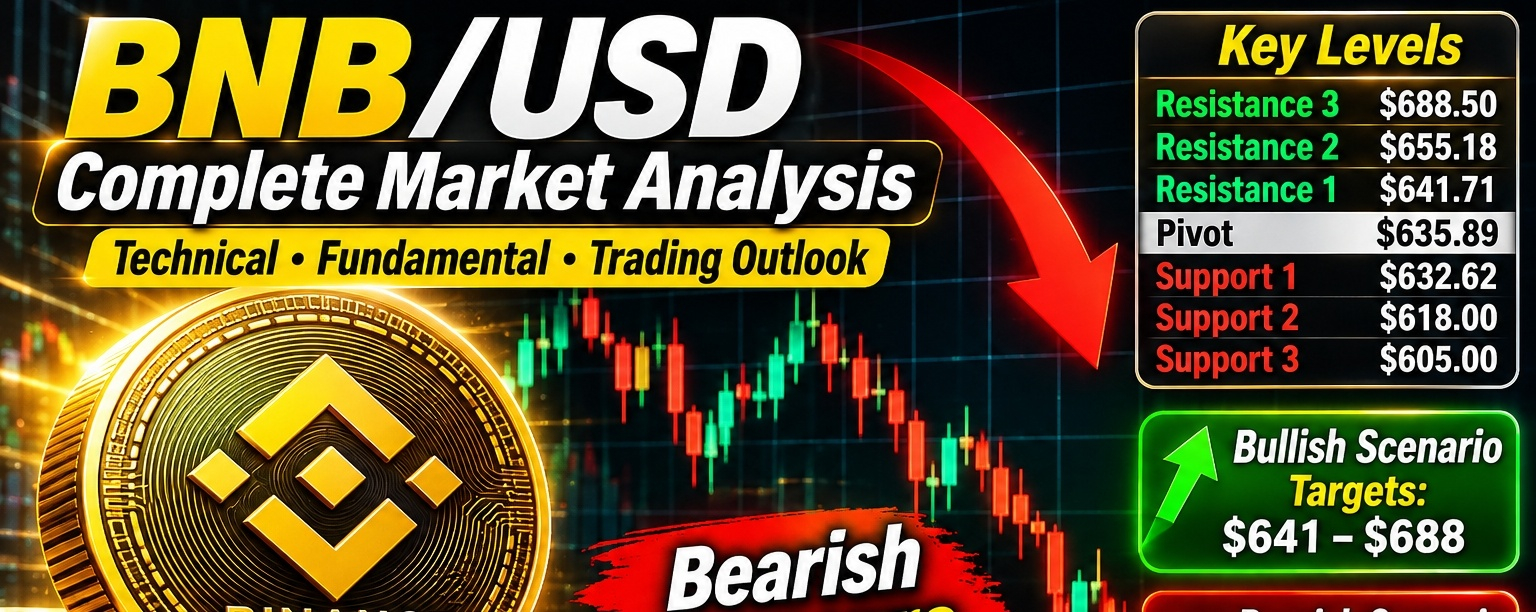
BNB/USD Complete Market Analysis 13 November 2026 · Technical, fundamental and trading analysis$BNB /USD Complete Market Analysis 13 November 2026 · Technical, fundamental and trading analysis
Short-term bearish pressure
BNB/USD is showing significant selling pressure. The important question is whether BNB can hold its current support zone and recover, or whether sellers will push the price toward lower levels.
{spot}(BNBUSDT)
### 1\. Current $BNB /USD market snapshot
BNB / USD
Bearish
### $626.20
-7.07% over 24 hours
Binance market snapshot, November 13, 2026.
Market capitalization
$82.4 billion
24-hour volume
$1.4 billion
24-hour high
$675.06
24-hour low
$625.31
Source: Binance. Live Chart
$BNB has experienced a substantial decline, and buyers need to regain control before a convincing recovery can develop.
### 2\. Technical analysis
Daily timeframe (1D)
* Overall trend: Bearish.
* RSI(14): 19.77, deeply oversold.
* MACD: -6.714, bearish.
* ADX: 42.75, indicating a strong directional trend.
* Moving averages: All 12 listed moving-average signals are bearish.
Source: Investing.com technical indicators, November 13. Investing.com India
4-hour timeframe (4H)
Watch these conditions:
* Price recovering above $641–$644.
* Four-hour candle closing above resistance.
* Increasing buying volume.
* RSI recovering above 30.
1-hour timeframe (1H)
A possible short-term reversal requires higher highs, higher lows and stronger buying volume. Otherwise, a bounce may be temporary.
### 3\. Important support and resistance levels
Based on the latest market and order-book information, these are the important areas to monitor.
| Level | Price (USD) | Importance |
| ----------------- | ----------- | --------------------- |
| Resistance 3 | $688.50 | Major resistance |
| Resistance 2 | $655.18 | Strong resistance |
| Resistance 1 | $641.71 | First recovery hurdle |
| Current reference | $635.89 | Market reference |
| Support 1 | $632.62 | Immediate support |
| Support 2 | $618.00 | Important support |
| Support 3 | $605.00 | Major support |
CoinGlass
Important: These are reference levels from market liquidity and order-book data, not guaranteed price turning points. The live market can change quickly.
### 4\. Bullish scenario
Potential recovery
BNB needs to recover the $641–$655 resistance region.
| Target | Price |
| ---------------- | --------- |
| First target | $641.71 |
| Second target | $655.18 |
| Third target | $675 |
| Extended target | $688.50 |
| Further recovery | $700–$720 |
Bullish confirmation:
* BNB holds above $632.
* Buyers reclaim $641.
* Four-hour candle closes above $655.
* Volume increases during the rally.
* Price forms higher highs.
If these conditions develop, a recovery toward $675–$688 becomes possible.
### 5\. Bearish scenario
Downside risk
If BNB loses its immediate support, watch these levels:
| Target | Price |
| --------------- | ----- |
| First target | $618 |
| Second target | $605 |
| Third target | $590 |
| Extended target | $570 |
A sustained break below $618 could increase downside pressure.
The bearish outlook would weaken if BNB quickly reclaims $655.
### 6\. Market sentiment and liquidation analysis
Current derivatives data show significant selling pressure.
* 24-hour long liquidations: approximately $12.84 million.
* Futures taker buy/sell ratio: 0.81.
* Spot net flows: approximately -$14.56 million.
* Funding rate: approximately 0.002%.
* Short positions are increasing as price falls.
These readings suggest sellers currently have the advantage. CoinGlass
### 7\. Fundamental analysis
BNB has several sources of long-term utility:
* Binance ecosystem: Trading fee discounts and exchange-related utility.
* BNB Chain: Gas fees and blockchain transactions.
* Token burns: Periodic supply reduction through BNB's burn mechanisms.
* DeFi ecosystem: Decentralized exchanges, lending and other applications.
* Market adoption: Demand from traders, developers and blockchain users.
However, regulatory developments, Binance exchange activity, competition from other blockchains and overall crypto market sentiment can influence BNB's valuation.
### 8\. Trading strategies
Three conditional trading setups to consider:
| Strategy | Entry condition | Target |
| --------------- | ------------------------------- | --------- |
| Support buy | Bullish reversal near $618–$633 | $641–$655 |
| Breakout buy | Confirmed 4H close above $655 | $675–$688 |
| Breakdown short | Confirmed break below $618 | $605–$590 |
Risk management
* Risk no more than 1% of capital per trade.
* Use a stop-loss.
* Avoid high leverage during volatile conditions.
* Wait for candle-close confirmation.
* Do not enter a long position just because RSI is oversold.
### 9\. BNB/USD price forecast
Short-term outlook: Next 24–48 hours
Bearish bias
### $605–$655
Illustrative scenario range, not a guaranteed prediction.
Medium-term outlook: Next 1–4 weeks
* Bearish below $655.
* Recovery possibility toward $675–$700.
* Further downside risk toward $590–$605 if support fails.
Long-term outlook: 3–12 months
Depends on:
* BNB Chain adoption.
* Token burn activity.
* Binance ecosystem growth.
* Bitcoin's broader market direction.
* Regulatory developments.
### 10\. Final BNB/USD trading verdict
BEARISH
My technical assessment
| Indicator | Signal |
| ----------------- | --------------- |
| Daily trend | Bearish |
| RSI | Deeply oversold |
| MACD | Bearish |
| Moving averages | Strong sell |
| Immediate support | $632 |
| Major support | $618 |
| First resistance | $642 |
| Strong resistance | $655 |
My conclusion: BNB is under significant selling pressure. I would avoid chasing a falling market. The $618–$632 zone is important for buyers. A recovery above $655 would provide stronger evidence of a bullish reversal.
This is educational analysis, not guaranteed financial advice. Market quotes and levels can change.
### 11\. What to watch on Binance
My three most important levels:
* $655 — bullish recovery confirmation.
* $632 — immediate support.
* $618 — important downside warning.
I can also prepare a detailed BNB/USD entry, take-profit and stop-loss trading chart.
#BNB_Market_Update #BNBUSDT #BNBAnalysis #TrendingTopic
BNB/USD Complete Market Analysis 13 November 2026 · Technical, fundamental and trading analysis
$BNB /USD Complete Market Analysis 13 November 2026 · Technical, fundamental and trading analysis
Short-term bearish pressure
BNB/USD is showing significant selling pressure. The important question is whether BNB can hold its current support zone and recover, or whether sellers will push the price toward lower levels.
### 1\. Current $BNB /USD market snapshot
BNB / USD
Bearish
### $626.20
-7.07% over 24 hours
Binance market snapshot, November 13, 2026.
Market capitalization
$82.4 billion
24-hour volume
$1.4 billion
24-hour high
$675.06
24-hour low
$625.31
Source: Binance. Live Chart
$BNB has experienced a substantial decline, and buyers need to regain control before a convincing recovery can develop.
### 2\. Technical analysis
Daily timeframe (1D)
* Overall trend: Bearish.
* RSI(14): 19.77, deeply oversold.
* MACD: -6.714, bearish.
* ADX: 42.75, indicating a strong directional trend.
* Moving averages: All 12 listed moving-average signals are bearish.
Source: Investing.com technical indicators, November 13. Investing.com India
4-hour timeframe (4H)
Watch these conditions:
* Price recovering above $641–$644.
* Four-hour candle closing above resistance.
* Increasing buying volume.
* RSI recovering above 30.
1-hour timeframe (1H)
A possible short-term reversal requires higher highs, higher lows and stronger buying volume. Otherwise, a bounce may be temporary.
### 3\. Important support and resistance levels
Based on the latest market and order-book information, these are the important areas to monitor.
| Level | Price (USD) | Importance |
| ----------------- | ----------- | --------------------- |
| Resistance 3 | $688.50 | Major resistance |
| Resistance 2 | $655.18 | Strong resistance |
| Resistance 1 | $641.71 | First recovery hurdle |
| Current reference | $635.89 | Market reference |
| Support 1 | $632.62 | Immediate support |
| Support 2 | $618.00 | Important support |
| Support 3 | $605.00 | Major support |
CoinGlass
Important: These are reference levels from market liquidity and order-book data, not guaranteed price turning points. The live market can change quickly.
### 4\. Bullish scenario
Potential recovery
BNB needs to recover the $641–$655 resistance region.
| Target | Price |
| ---------------- | --------- |
| First target | $641.71 |
| Second target | $655.18 |
| Third target | $675 |
| Extended target | $688.50 |
| Further recovery | $700–$720 |
Bullish confirmation:
* BNB holds above $632.
* Buyers reclaim $641.
* Four-hour candle closes above $655.
* Volume increases during the rally.
* Price forms higher highs.
If these conditions develop, a recovery toward $675–$688 becomes possible.
### 5\. Bearish scenario
Downside risk
If BNB loses its immediate support, watch these levels:
| Target | Price |
| --------------- | ----- |
| First target | $618 |
| Second target | $605 |
| Third target | $590 |
| Extended target | $570 |
A sustained break below $618 could increase downside pressure.
The bearish outlook would weaken if BNB quickly reclaims $655.
### 6\. Market sentiment and liquidation analysis
Current derivatives data show significant selling pressure.
* 24-hour long liquidations: approximately $12.84 million.
* Futures taker buy/sell ratio: 0.81.
* Spot net flows: approximately -$14.56 million.
* Funding rate: approximately 0.002%.
* Short positions are increasing as price falls.
These readings suggest sellers currently have the advantage. CoinGlass
### 7\. Fundamental analysis
BNB has several sources of long-term utility:
* Binance ecosystem: Trading fee discounts and exchange-related utility.
* BNB Chain: Gas fees and blockchain transactions.
* Token burns: Periodic supply reduction through BNB's burn mechanisms.
* DeFi ecosystem: Decentralized exchanges, lending and other applications.
* Market adoption: Demand from traders, developers and blockchain users.
However, regulatory developments, Binance exchange activity, competition from other blockchains and overall crypto market sentiment can influence BNB's valuation.
### 8\. Trading strategies
Three conditional trading setups to consider:
| Strategy | Entry condition | Target |
| --------------- | ------------------------------- | --------- |
| Support buy | Bullish reversal near $618–$633 | $641–$655 |
| Breakout buy | Confirmed 4H close above $655 | $675–$688 |
| Breakdown short | Confirmed break below $618 | $605–$590 |
Risk management
* Risk no more than 1% of capital per trade.
* Use a stop-loss.
* Avoid high leverage during volatile conditions.
* Wait for candle-close confirmation.
* Do not enter a long position just because RSI is oversold.
### 9\. BNB/USD price forecast
Short-term outlook: Next 24–48 hours
Bearish bias
### $605–$655
Illustrative scenario range, not a guaranteed prediction.
Medium-term outlook: Next 1–4 weeks
* Bearish below $655.
* Recovery possibility toward $675–$700.
* Further downside risk toward $590–$605 if support fails.
Long-term outlook: 3–12 months
Depends on:
* BNB Chain adoption.
* Token burn activity.
* Binance ecosystem growth.
* Bitcoin's broader market direction.
* Regulatory developments.
### 10\. Final BNB/USD trading verdict
BEARISH
My technical assessment
| Indicator | Signal |
| ----------------- | --------------- |
| Daily trend | Bearish |
| RSI | Deeply oversold |
| MACD | Bearish |
| Moving averages | Strong sell |
| Immediate support | $632 |
| Major support | $618 |
| First resistance | $642 |
| Strong resistance | $655 |
My conclusion: BNB is under significant selling pressure. I would avoid chasing a falling market. The $618–$632 zone is important for buyers. A recovery above $655 would provide stronger evidence of a bullish reversal.
This is educational analysis, not guaranteed financial advice. Market quotes and levels can change.
### 11\. What to watch on Binance
My three most important levels:
* $655 — bullish recovery confirmation.
* $632 — immediate support.
* $618 — important downside warning.
I can also prepare a detailed BNB/USD entry, take-profit and stop-loss trading chart.
#BNB_Market_Update #BNBUSDT #BNBAnalysis #TrendingTopic
Short-term bearish pressure
BNB/USD is showing significant selling pressure. The important question is whether BNB can hold its current support zone and recover, or whether sellers will push the price toward lower levels.
### 1\. Current $BNB /USD market snapshot
BNB / USD
Bearish
### $626.20
-7.07% over 24 hours
Binance market snapshot, November 13, 2026.
Market capitalization
$82.4 billion
24-hour volume
$1.4 billion
24-hour high
$675.06
24-hour low
$625.31
Source: Binance. Live Chart
$BNB has experienced a substantial decline, and buyers need to regain control before a convincing recovery can develop.
### 2\. Technical analysis
Daily timeframe (1D)
* Overall trend: Bearish.
* RSI(14): 19.77, deeply oversold.
* MACD: -6.714, bearish.
* ADX: 42.75, indicating a strong directional trend.
* Moving averages: All 12 listed moving-average signals are bearish.
Source: Investing.com technical indicators, November 13. Investing.com India
4-hour timeframe (4H)
Watch these conditions:
* Price recovering above $641–$644.
* Four-hour candle closing above resistance.
* Increasing buying volume.
* RSI recovering above 30.
1-hour timeframe (1H)
A possible short-term reversal requires higher highs, higher lows and stronger buying volume. Otherwise, a bounce may be temporary.
### 3\. Important support and resistance levels
Based on the latest market and order-book information, these are the important areas to monitor.
| Level | Price (USD) | Importance |
| ----------------- | ----------- | --------------------- |
| Resistance 3 | $688.50 | Major resistance |
| Resistance 2 | $655.18 | Strong resistance |
| Resistance 1 | $641.71 | First recovery hurdle |
| Current reference | $635.89 | Market reference |
| Support 1 | $632.62 | Immediate support |
| Support 2 | $618.00 | Important support |
| Support 3 | $605.00 | Major support |
CoinGlass
Important: These are reference levels from market liquidity and order-book data, not guaranteed price turning points. The live market can change quickly.
### 4\. Bullish scenario
Potential recovery
BNB needs to recover the $641–$655 resistance region.
| Target | Price |
| ---------------- | --------- |
| First target | $641.71 |
| Second target | $655.18 |
| Third target | $675 |
| Extended target | $688.50 |
| Further recovery | $700–$720 |
Bullish confirmation:
* BNB holds above $632.
* Buyers reclaim $641.
* Four-hour candle closes above $655.
* Volume increases during the rally.
* Price forms higher highs.
If these conditions develop, a recovery toward $675–$688 becomes possible.
### 5\. Bearish scenario
Downside risk
If BNB loses its immediate support, watch these levels:
| Target | Price |
| --------------- | ----- |
| First target | $618 |
| Second target | $605 |
| Third target | $590 |
| Extended target | $570 |
A sustained break below $618 could increase downside pressure.
The bearish outlook would weaken if BNB quickly reclaims $655.
### 6\. Market sentiment and liquidation analysis
Current derivatives data show significant selling pressure.
* 24-hour long liquidations: approximately $12.84 million.
* Futures taker buy/sell ratio: 0.81.
* Spot net flows: approximately -$14.56 million.
* Funding rate: approximately 0.002%.
* Short positions are increasing as price falls.
These readings suggest sellers currently have the advantage. CoinGlass
### 7\. Fundamental analysis
BNB has several sources of long-term utility:
* Binance ecosystem: Trading fee discounts and exchange-related utility.
* BNB Chain: Gas fees and blockchain transactions.
* Token burns: Periodic supply reduction through BNB's burn mechanisms.
* DeFi ecosystem: Decentralized exchanges, lending and other applications.
* Market adoption: Demand from traders, developers and blockchain users.
However, regulatory developments, Binance exchange activity, competition from other blockchains and overall crypto market sentiment can influence BNB's valuation.
### 8\. Trading strategies
Three conditional trading setups to consider:
| Strategy | Entry condition | Target |
| --------------- | ------------------------------- | --------- |
| Support buy | Bullish reversal near $618–$633 | $641–$655 |
| Breakout buy | Confirmed 4H close above $655 | $675–$688 |
| Breakdown short | Confirmed break below $618 | $605–$590 |
Risk management
* Risk no more than 1% of capital per trade.
* Use a stop-loss.
* Avoid high leverage during volatile conditions.
* Wait for candle-close confirmation.
* Do not enter a long position just because RSI is oversold.
### 9\. BNB/USD price forecast
Short-term outlook: Next 24–48 hours
Bearish bias
### $605–$655
Illustrative scenario range, not a guaranteed prediction.
Medium-term outlook: Next 1–4 weeks
* Bearish below $655.
* Recovery possibility toward $675–$700.
* Further downside risk toward $590–$605 if support fails.
Long-term outlook: 3–12 months
Depends on:
* BNB Chain adoption.
* Token burn activity.
* Binance ecosystem growth.
* Bitcoin's broader market direction.
* Regulatory developments.
### 10\. Final BNB/USD trading verdict
BEARISH
My technical assessment
| Indicator | Signal |
| ----------------- | --------------- |
| Daily trend | Bearish |
| RSI | Deeply oversold |
| MACD | Bearish |
| Moving averages | Strong sell |
| Immediate support | $632 |
| Major support | $618 |
| First resistance | $642 |
| Strong resistance | $655 |
My conclusion: BNB is under significant selling pressure. I would avoid chasing a falling market. The $618–$632 zone is important for buyers. A recovery above $655 would provide stronger evidence of a bullish reversal.
This is educational analysis, not guaranteed financial advice. Market quotes and levels can change.
### 11\. What to watch on Binance
My three most important levels:
* $655 — bullish recovery confirmation.
* $632 — immediate support.
* $618 — important downside warning.
I can also prepare a detailed BNB/USD entry, take-profit and stop-loss trading chart.
#BNB_Market_Update #BNBUSDT #BNBAnalysis #TrendingTopic
39

·
--
Bullish
$BNB vs. $QNT : The $88B Cash Machine vs. the $2B Institutional Sleeper💥🚀
One prints fees. The other prints bank rails. Your capital can only ride one horse—choose wisely.
BNB trades at $655.85, holding an $88.5 billion market cap with $11.2 billion in 24-hour volume. QNT sits at $161.78, a $2.01 billion cap on just $80 million volume—a 44x size gap that screams asymmetric risk.
BNB is the fortress. BSC TVL commands $5 billion, and the 2026 roadmap is a direct missile at AI-agent trading: a 100,000 TPS Layer-1 with sub-50ms pre-confirmation, testnet late 2026, mainnet early 2027. Add the quarterly auto-burn grinding supply toward 100 million, and BNB is a cash-flow-backed infrastructure monopoly. It survives on revenue, not narrative.
QNT is the wildcard. The September 2026 Clearing House mandate—building the interoperability layer for tokenized US bank deposits—sent QNT up nearly 300% in a week. But here is the kill shot: QNT’s role in that bank network remains “unclear,” and institutions can pay Quant in fiat, not QNT. Commercial success does not automatically equal token demand. QNT is a high-conviction bet on enterprise adoption and token capture—two separate hurdles.
The verdict: BNB is the institutional-grade compounder trading below its 200-day EMA ($658.86), offering a defined risk-reward for the patient. QNT is the $2 billion lottery ticket on the $300 trillion tokenized deposit market—but only if the token actually captures value.
What is Your move: Yield and certainty, or narrative and multiple?
“Or”
THE BIG QUESTION: If you had $1,000 today, would you allocate it to BNB or QNT? And WHY?
👇 Defend your choice. Let’s discuss fundamentals, not just hype.
Follow me for such interesting updates !
$BNB #QNT #QNT/USDT #BNBUSDT #bnb
$BNB vs. $QNT : The $88B Cash Machine vs. the $2B Institutional Sleeper💥🚀
One prints fees. The other prints bank rails. Your capital can only ride one horse—choose wisely.
BNB trades at $655.85, holding an $88.5 billion market cap with $11.2 billion in 24-hour volume. QNT sits at $161.78, a $2.01 billion cap on just $80 million volume—a 44x size gap that screams asymmetric risk.
BNB is the fortress. BSC TVL commands $5 billion, and the 2026 roadmap is a direct missile at AI-agent trading: a 100,000 TPS Layer-1 with sub-50ms pre-confirmation, testnet late 2026, mainnet early 2027. Add the quarterly auto-burn grinding supply toward 100 million, and BNB is a cash-flow-backed infrastructure monopoly. It survives on revenue, not narrative.
QNT is the wildcard. The September 2026 Clearing House mandate—building the interoperability layer for tokenized US bank deposits—sent QNT up nearly 300% in a week. But here is the kill shot: QNT’s role in that bank network remains “unclear,” and institutions can pay Quant in fiat, not QNT. Commercial success does not automatically equal token demand. QNT is a high-conviction bet on enterprise adoption and token capture—two separate hurdles.
The verdict: BNB is the institutional-grade compounder trading below its 200-day EMA ($658.86), offering a defined risk-reward for the patient. QNT is the $2 billion lottery ticket on the $300 trillion tokenized deposit market—but only if the token actually captures value.
What is Your move: Yield and certainty, or narrative and multiple?
“Or”
THE BIG QUESTION: If you had $1,000 today, would you allocate it to BNB or QNT? And WHY?
👇 Defend your choice. Let’s discuss fundamentals, not just hype.
Follow me for such interesting updates !
$BNB #QNT #QNT/USDT #BNBUSDT #bnb
One prints fees. The other prints bank rails. Your capital can only ride one horse—choose wisely.
BNB trades at $655.85, holding an $88.5 billion market cap with $11.2 billion in 24-hour volume. QNT sits at $161.78, a $2.01 billion cap on just $80 million volume—a 44x size gap that screams asymmetric risk.
BNB is the fortress. BSC TVL commands $5 billion, and the 2026 roadmap is a direct missile at AI-agent trading: a 100,000 TPS Layer-1 with sub-50ms pre-confirmation, testnet late 2026, mainnet early 2027. Add the quarterly auto-burn grinding supply toward 100 million, and BNB is a cash-flow-backed infrastructure monopoly. It survives on revenue, not narrative.
QNT is the wildcard. The September 2026 Clearing House mandate—building the interoperability layer for tokenized US bank deposits—sent QNT up nearly 300% in a week. But here is the kill shot: QNT’s role in that bank network remains “unclear,” and institutions can pay Quant in fiat, not QNT. Commercial success does not automatically equal token demand. QNT is a high-conviction bet on enterprise adoption and token capture—two separate hurdles.
The verdict: BNB is the institutional-grade compounder trading below its 200-day EMA ($658.86), offering a defined risk-reward for the patient. QNT is the $2 billion lottery ticket on the $300 trillion tokenized deposit market—but only if the token actually captures value.
What is Your move: Yield and certainty, or narrative and multiple?
“Or”
THE BIG QUESTION: If you had $1,000 today, would you allocate it to BNB or QNT? And WHY?
👇 Defend your choice. Let’s discuss fundamentals, not just hype.
Follow me for such interesting updates !
$BNB #QNT #QNT/USDT #BNBUSDT #bnb

1
4
987

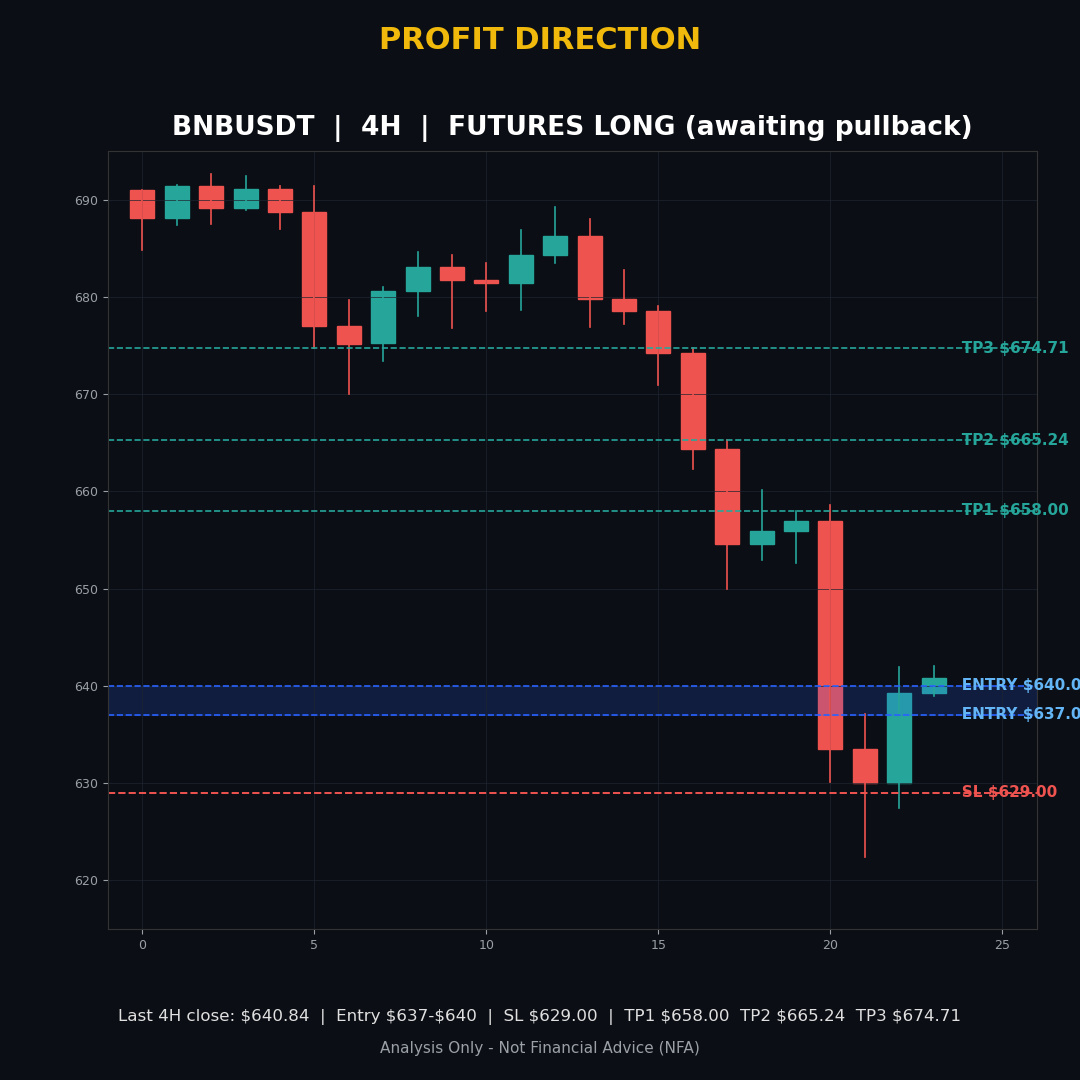
🟢 BNBUSDT — FUTURES LONG
$BNB
Entry Zone: $637.00 – $640.00 (awaiting pullback)
Stop Loss: $629.00
TP1: $658.00
TP2: $665.24
TP3: $674.71
R:R: 1:2.05 | 1:2.81 | 1:3.81
TF: 4H
Why I like this one: BNB flushed to $622.41 and buyers stepped in — since then the 1H chart has printed higher lows ($624 → $627 → $631 → $637 → $639) and higher closes, climbing back to $641. The 1H trend has turned up after the flush, and I am watching for a small pullback into $637–$640 to enter, not chasing here near $641.
Invalidation: a 4H close below $630 kills this idea — the recovery is gone then, no averaging down. Note: US PPI prints today at 13:30 UTC (18:30 PKT), and a hot number can move the whole market fast, so size small and respect the SL.
Analysis Only — Not Financial Advice (NFA). Trading involves risk.
Follow Profit Direction for more signals, best signals and market updates. Share your opinion in the comments.
Do you think BNB reclaims $665 first, or does it lose $629? Comment LONG or SHORT.
#BNB #BNBUSDT #CryptoTrading #Altcoins
🟢 BNBUSDT — FUTURES LONG
$BNB
Entry Zone: $637.00 – $640.00 (awaiting pullback)
Stop Loss: $629.00
TP1: $658.00
TP2: $665.24
TP3: $674.71
R:R: 1:2.05 | 1:2.81 | 1:3.81
TF: 4H
Why I like this one: BNB flushed to $622.41 and buyers stepped in — since then the 1H chart has printed higher lows ($624 → $627 → $631 → $637 → $639) and higher closes, climbing back to $641. The 1H trend has turned up after the flush, and I am watching for a small pullback into $637–$640 to enter, not chasing here near $641.
Invalidation: a 4H close below $630 kills this idea — the recovery is gone then, no averaging down. Note: US PPI prints today at 13:30 UTC (18:30 PKT), and a hot number can move the whole market fast, so size small and respect the SL.
Analysis Only — Not Financial Advice (NFA). Trading involves risk.
Follow Profit Direction for more signals, best signals and market updates. Share your opinion in the comments.
Do you think BNB reclaims $665 first, or does it lose $629? Comment LONG or SHORT.
#BNB #BNBUSDT #CryptoTrading #Altcoins
$BNB
Entry Zone: $637.00 – $640.00 (awaiting pullback)
Stop Loss: $629.00
TP1: $658.00
TP2: $665.24
TP3: $674.71
R:R: 1:2.05 | 1:2.81 | 1:3.81
TF: 4H
Why I like this one: BNB flushed to $622.41 and buyers stepped in — since then the 1H chart has printed higher lows ($624 → $627 → $631 → $637 → $639) and higher closes, climbing back to $641. The 1H trend has turned up after the flush, and I am watching for a small pullback into $637–$640 to enter, not chasing here near $641.
Invalidation: a 4H close below $630 kills this idea — the recovery is gone then, no averaging down. Note: US PPI prints today at 13:30 UTC (18:30 PKT), and a hot number can move the whole market fast, so size small and respect the SL.
Analysis Only — Not Financial Advice (NFA). Trading involves risk.
Follow Profit Direction for more signals, best signals and market updates. Share your opinion in the comments.
Do you think BNB reclaims $665 first, or does it lose $629? Comment LONG or SHORT.
#BNB #BNBUSDT #CryptoTrading #Altcoins
13

·
--
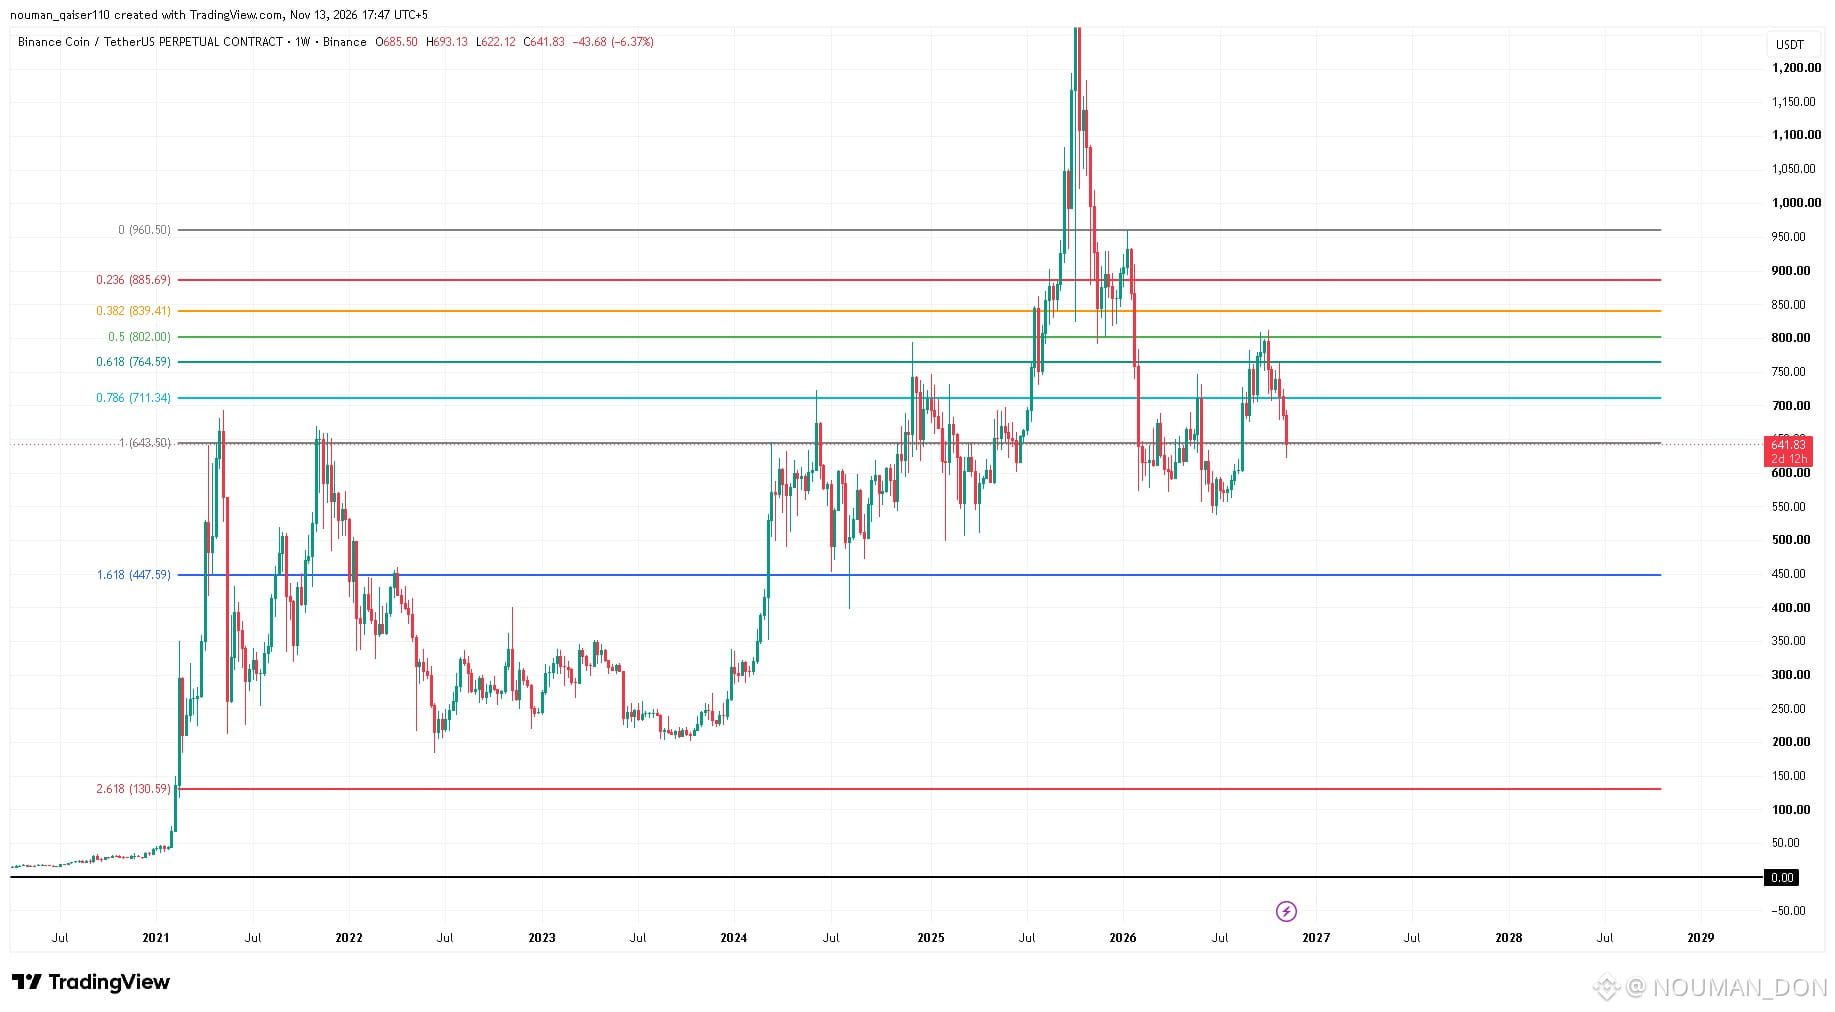
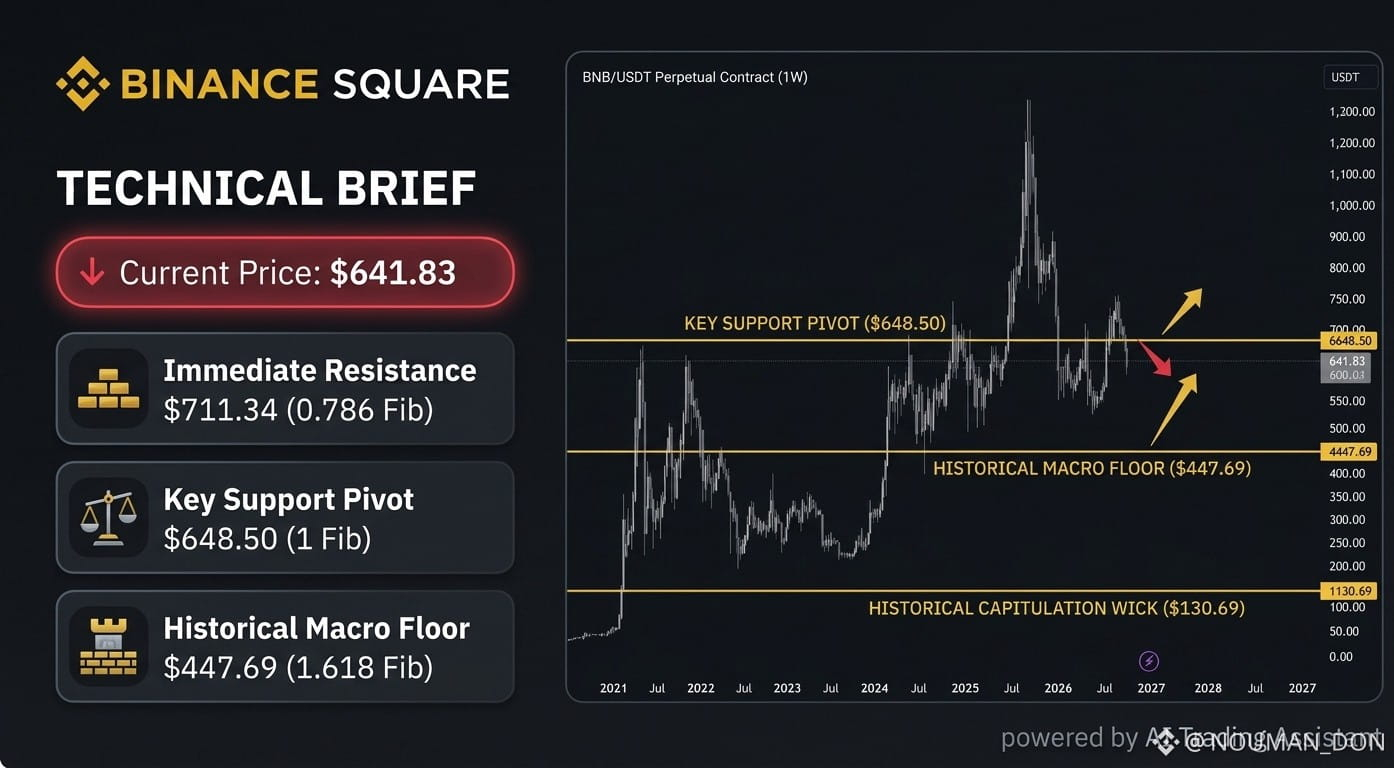
$BNB /USDT Perpetual Technical Analysis: Testing Historical Macro Support Floors 🚨
The weekly chart shows $BNB facing strong bearish pressure (-6.37%), breaking right into a multi-year horizontal pivot zone that has defined its macro market structure since 2021.
📉 Historical Strong Macro Supports:
• Current Price: $641.83
• Critical Pivot Test ($648.50): Price is currently battling directly at the 1 Fib range baseline at $648.50. This historical ceiling from 2021 and 2024 is now acting as a vital make-or-break support level.
• Historical Support 1 ($447.69): If $648.50 fails to hold on a weekly close, the next major macro demand floor rests at the 1.618 Fibonacci extension at $447.69.
• Historical Support 2 ($130.69): A deeper multi-year structural capitulation points down toward the 2.618 Fib extension at $130.69.
💡 Trading Strategy:
Reversal Watch: Look for strong weekly buyer defense and a reclaim above $648.50 before scaling into long positions, targeting $711.34 (0.786 Fib).Risk Note: Keep stops tight below $615.00 to protect against a breakdown toward $447.69.
#BNBUSDT #bnb #cryptotrading #TechnicalAnalysis #BinanceSquare
{spot}(BNBUSDT)
{future}(BNBUSDT)
$BNB /USDT Perpetual Technical Analysis: Testing Historical Macro Support Floors 🚨
The weekly chart shows $BNB facing strong bearish pressure (-6.37%), breaking right into a multi-year horizontal pivot zone that has defined its macro market structure since 2021.
📉 Historical Strong Macro Supports:
• Current Price: $641.83
• Critical Pivot Test ($648.50): Price is currently battling directly at the 1 Fib range baseline at $648.50. This historical ceiling from 2021 and 2024 is now acting as a vital make-or-break support level.
• Historical Support 1 ($447.69): If $648.50 fails to hold on a weekly close, the next major macro demand floor rests at the 1.618 Fibonacci extension at $447.69.
• Historical Support 2 ($130.69): A deeper multi-year structural capitulation points down toward the 2.618 Fib extension at $130.69.
💡 Trading Strategy:
Reversal Watch: Look for strong weekly buyer defense and a reclaim above $648.50 before scaling into long positions, targeting $711.34 (0.786 Fib).Risk Note: Keep stops tight below $615.00 to protect against a breakdown toward $447.69.
#BNBUSDT #bnb #cryptotrading #TechnicalAnalysis #BinanceSquare
The weekly chart shows $BNB facing strong bearish pressure (-6.37%), breaking right into a multi-year horizontal pivot zone that has defined its macro market structure since 2021.
📉 Historical Strong Macro Supports:
• Current Price: $641.83
• Critical Pivot Test ($648.50): Price is currently battling directly at the 1 Fib range baseline at $648.50. This historical ceiling from 2021 and 2024 is now acting as a vital make-or-break support level.
• Historical Support 1 ($447.69): If $648.50 fails to hold on a weekly close, the next major macro demand floor rests at the 1.618 Fibonacci extension at $447.69.
• Historical Support 2 ($130.69): A deeper multi-year structural capitulation points down toward the 2.618 Fib extension at $130.69.
💡 Trading Strategy:
Reversal Watch: Look for strong weekly buyer defense and a reclaim above $648.50 before scaling into long positions, targeting $711.34 (0.786 Fib).Risk Note: Keep stops tight below $615.00 to protect against a breakdown toward $447.69.
#BNBUSDT #bnb #cryptotrading #TechnicalAnalysis #BinanceSquare
1
13

·
--
Bullish
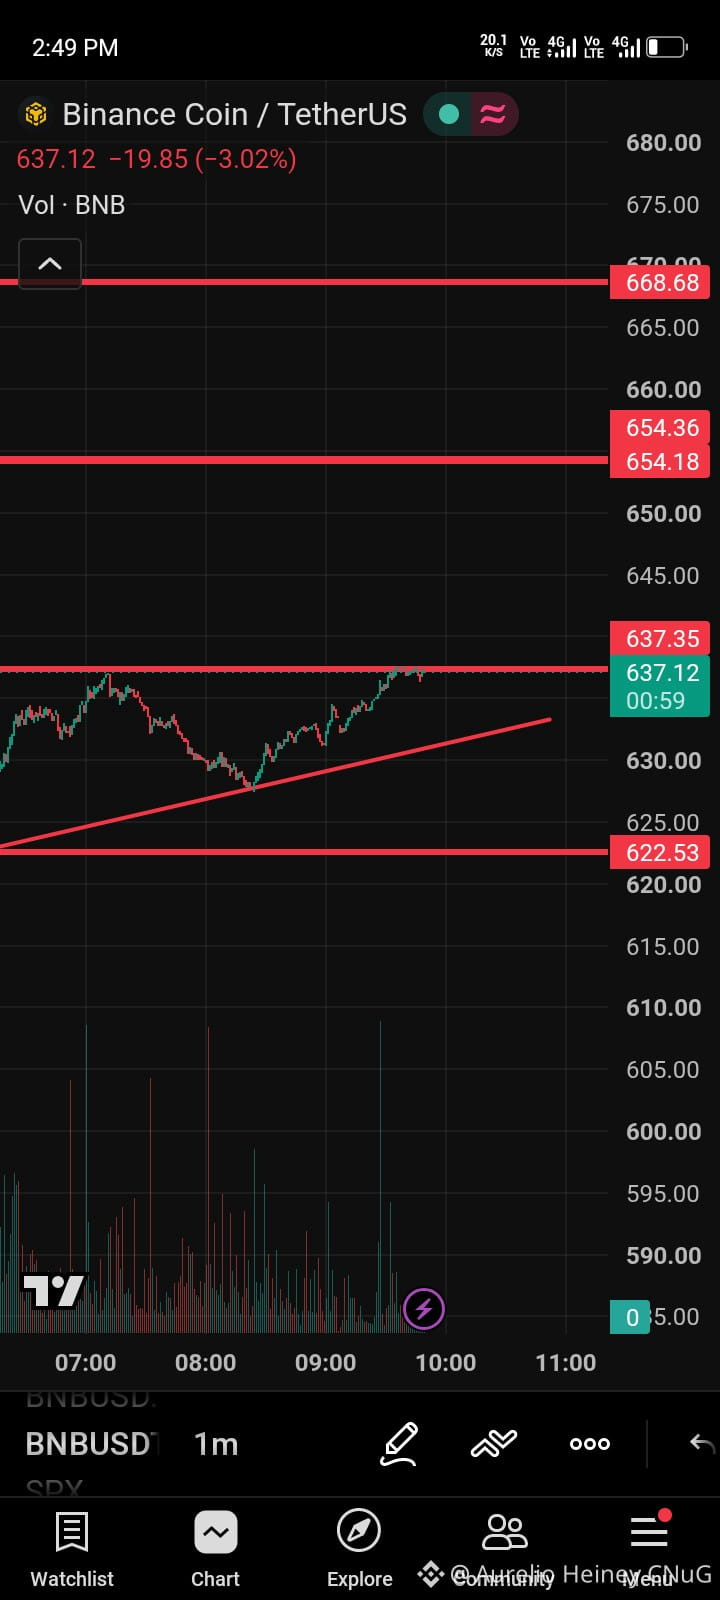
> I have completed my analysis on BNBUSDT. Price is expected to move straight from 625 to 649.654.
#BNB_Market_Update #BNBUSDT
> I have completed my analysis on BNBUSDT. Price is expected to move straight from 625 to 649.654.
#BNB_Market_Update #BNBUSDT
#BNB_Market_Update #BNBUSDT
53

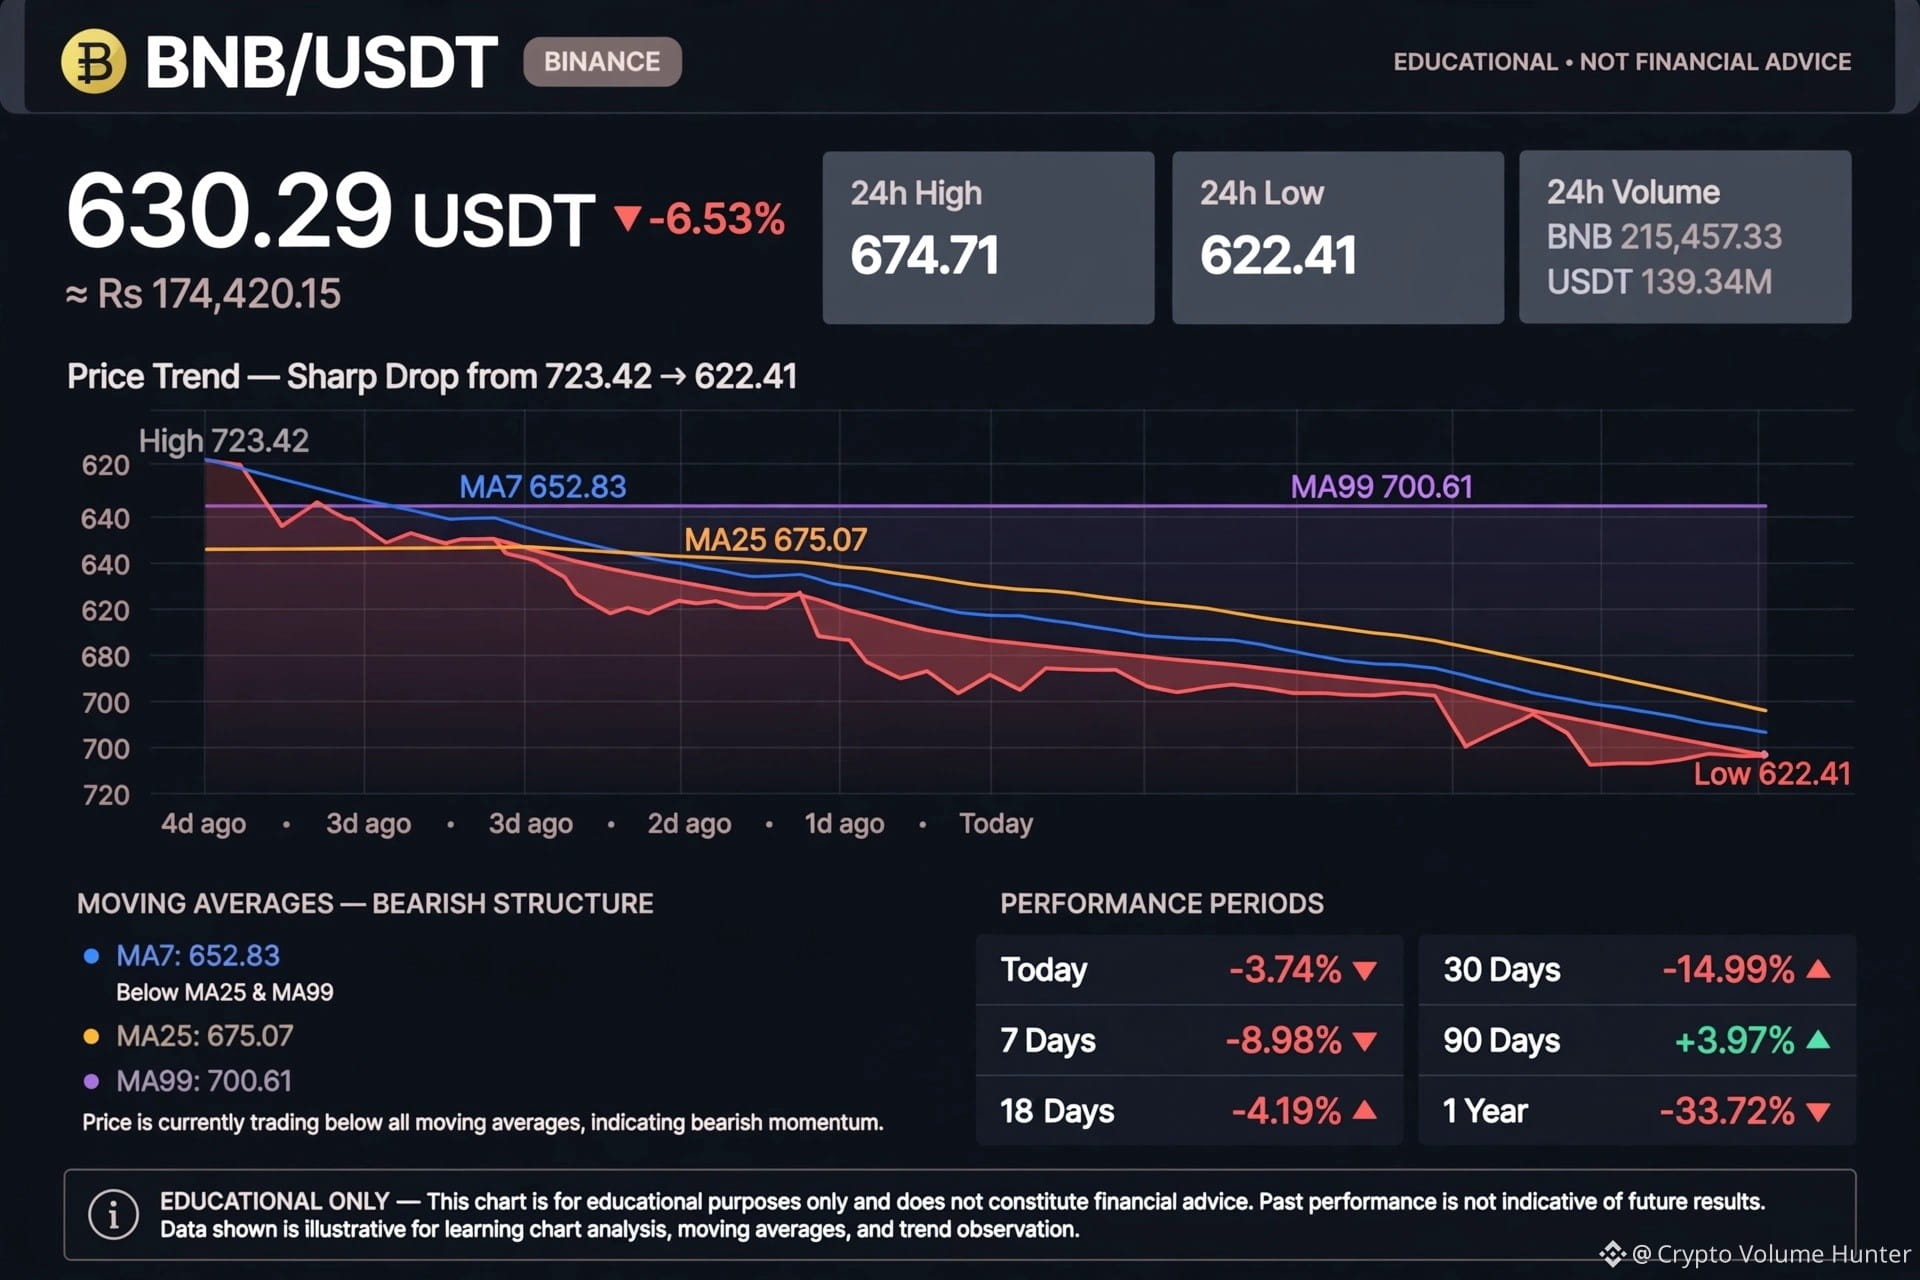
🚨 BNB/USDT 630.29 (-6.53%) - Sharp Selloff!
24h High 674.71 -> 24h Low 622.41 - Testing Low!
Vol BNB 215,457.33 / Vol USDT 139.34M - High Volume Drop
MA7 652.83 / MA25 675.07 / MA99 700.61 - Price Below All MAs = Bearish
Trend: High 723.42 -> Low 622.41 = -14% Drop in 4 Days!
Performance: Today -3.74% | 7D -8.98% | 30D -14.99% | 90D +3.97%
Support 622.41 / Resistance MA7 652.83
Will $622 hold or breakdown?
Educational only - Not financial advice. If helpful, a Tip ❤️
$BNB #BNB_Market_Update #BNBUSDT
🚨 BNB/USDT 630.29 (-6.53%) - Sharp Selloff!
24h High 674.71 -> 24h Low 622.41 - Testing Low!
Vol BNB 215,457.33 / Vol USDT 139.34M - High Volume Drop
MA7 652.83 / MA25 675.07 / MA99 700.61 - Price Below All MAs = Bearish
Trend: High 723.42 -> Low 622.41 = -14% Drop in 4 Days!
Performance: Today -3.74% | 7D -8.98% | 30D -14.99% | 90D +3.97%
Support 622.41 / Resistance MA7 652.83
Will $622 hold or breakdown?
Educational only - Not financial advice. If helpful, a Tip ❤️
$BNB #BNB_Market_Update #BNBUSDT
24h High 674.71 -> 24h Low 622.41 - Testing Low!
Vol BNB 215,457.33 / Vol USDT 139.34M - High Volume Drop
MA7 652.83 / MA25 675.07 / MA99 700.61 - Price Below All MAs = Bearish
Trend: High 723.42 -> Low 622.41 = -14% Drop in 4 Days!
Performance: Today -3.74% | 7D -8.98% | 30D -14.99% | 90D +3.97%
Support 622.41 / Resistance MA7 652.83
Will $622 hold or breakdown?
Educational only - Not financial advice. If helpful, a Tip ❤️
$BNB #BNB_Market_Update #BNBUSDT
1
1
167

·
--
🚨 HEAVY BID ABSORPTION FAILING: $BNB SHORT ALERT
AGGRESSIVE SELL PRESSURE DETECTED AT LOCAL HIGHS. CVD DUMPING HARD INTO ASKS AS LIMIT BUYERS GET STEAMROLLED.
Price swept the premium pool and hit a hard rejection block. Liquidity above 650 is cleared; institutional order flow is shifting net-negative. We front-run the cascade.
EXECUTION SETUP:
ENTRY: 645.0 $BNB
SL: 660.8
TP1: 630.0
TP2: 617.8
RR: 1:1.72
Bears in full control of the tap. Are we slicing straight through demand or waiting for a dead-cat retest before the plunge? Drop your charts below.
#BNBUSDT #BinanceSquare #SlowSclap #TradingAnalysis
🚨 HEAVY BID ABSORPTION FAILING: $BNB SHORT ALERT
AGGRESSIVE SELL PRESSURE DETECTED AT LOCAL HIGHS. CVD DUMPING HARD INTO ASKS AS LIMIT BUYERS GET STEAMROLLED.
Price swept the premium pool and hit a hard rejection block. Liquidity above 650 is cleared; institutional order flow is shifting net-negative. We front-run the cascade.
EXECUTION SETUP:
ENTRY: 645.0 $BNB
SL: 660.8
TP1: 630.0
TP2: 617.8
RR: 1:1.72
Bears in full control of the tap. Are we slicing straight through demand or waiting for a dead-cat retest before the plunge? Drop your charts below.
#BNBUSDT #BinanceSquare #SlowSclap #TradingAnalysis
AGGRESSIVE SELL PRESSURE DETECTED AT LOCAL HIGHS. CVD DUMPING HARD INTO ASKS AS LIMIT BUYERS GET STEAMROLLED.
Price swept the premium pool and hit a hard rejection block. Liquidity above 650 is cleared; institutional order flow is shifting net-negative. We front-run the cascade.
EXECUTION SETUP:
ENTRY: 645.0 $BNB
SL: 660.8
TP1: 630.0
TP2: 617.8
RR: 1:1.72
Bears in full control of the tap. Are we slicing straight through demand or waiting for a dead-cat retest before the plunge? Drop your charts below.
#BNBUSDT #BinanceSquare #SlowSclap #TradingAnalysis
4

·
--
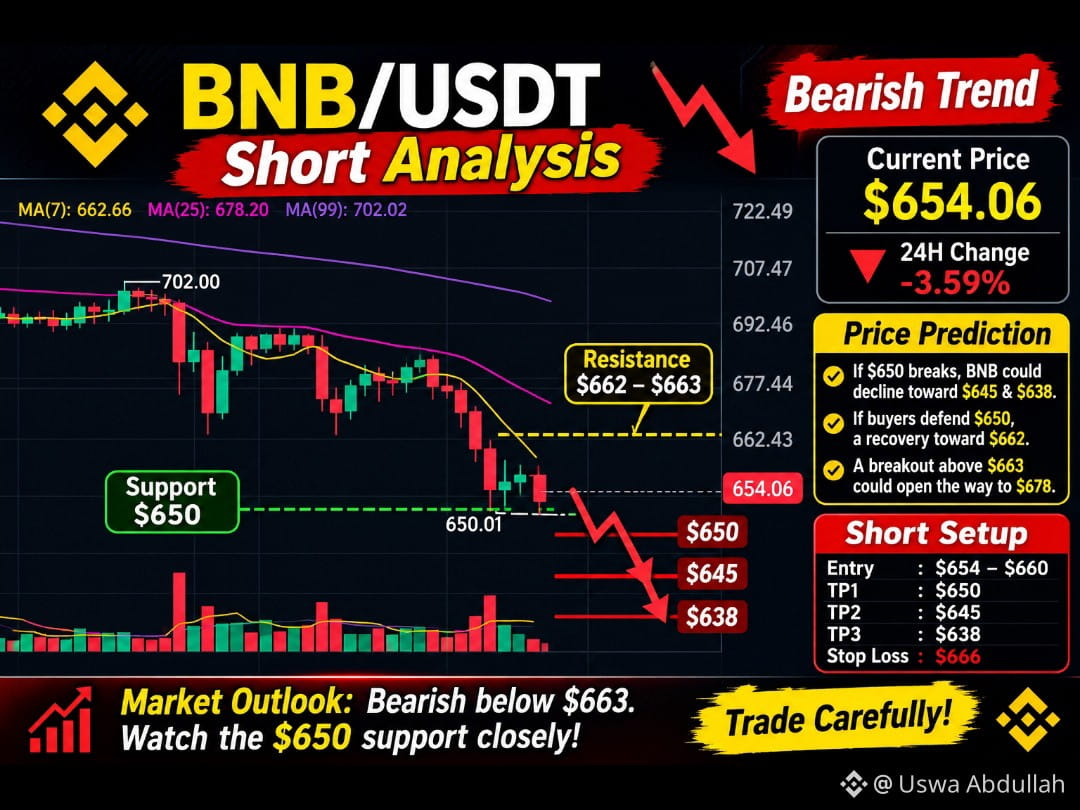
#BNBUSDT 🤔🤔🔥 – Short Market Analysis 📉👇👇
{spot}(BNBUSDT)
Current Price: $654.06 24H Change: -3.59%
$BNB is showing strong bearish momentum on the 4-hour chart. The price is trading below all three moving averages, indicating continued selling pressure.
Technical Analysis
* MA(7): $662.66
* MA(25): $678.20
* MA(99): $702.02
* Immediate support: $650
* Resistance: $662–$663
Price Prediction
* If $650 breaks, $BNB could decline toward $645 and $638.
* If buyers defend $650, a recovery toward $662 is possible.
* A breakout above $663 could open the way toward $678.
Trading Levels (Short Setup)
* Entry: $654–$660
* TP1: $650
* TP2: $645
* TP3: $638
* Stop Loss: $666
Market Outlook: Bearish below $663. Watch the $650 support closely for confirmation before entering a trade.
#BNB #BNBUSDT #CryptoAnalysis #PricePrediction #Binance #TradingSignals
#BNBUSDT 🤔🤔🔥 – Short Market Analysis 📉👇👇
Current Price: $654.06 24H Change: -3.59%
$BNB is showing strong bearish momentum on the 4-hour chart. The price is trading below all three moving averages, indicating continued selling pressure.
Technical Analysis
* MA(7): $662.66
* MA(25): $678.20
* MA(99): $702.02
* Immediate support: $650
* Resistance: $662–$663
Price Prediction
* If $650 breaks, $BNB could decline toward $645 and $638.
* If buyers defend $650, a recovery toward $662 is possible.
* A breakout above $663 could open the way toward $678.
Trading Levels (Short Setup)
* Entry: $654–$660
* TP1: $650
* TP2: $645
* TP3: $638
* Stop Loss: $666
Market Outlook: Bearish below $663. Watch the $650 support closely for confirmation before entering a trade.
#BNB #BNBUSDT #CryptoAnalysis #PricePrediction #Binance #TradingSignals
Current Price: $654.06 24H Change: -3.59%
$BNB is showing strong bearish momentum on the 4-hour chart. The price is trading below all three moving averages, indicating continued selling pressure.
Technical Analysis
* MA(7): $662.66
* MA(25): $678.20
* MA(99): $702.02
* Immediate support: $650
* Resistance: $662–$663
Price Prediction
* If $650 breaks, $BNB could decline toward $645 and $638.
* If buyers defend $650, a recovery toward $662 is possible.
* A breakout above $663 could open the way toward $678.
Trading Levels (Short Setup)
* Entry: $654–$660
* TP1: $650
* TP2: $645
* TP3: $638
* Stop Loss: $666
Market Outlook: Bearish below $663. Watch the $650 support closely for confirmation before entering a trade.
#BNB #BNBUSDT #CryptoAnalysis #PricePrediction #Binance #TradingSignals
72

·
--
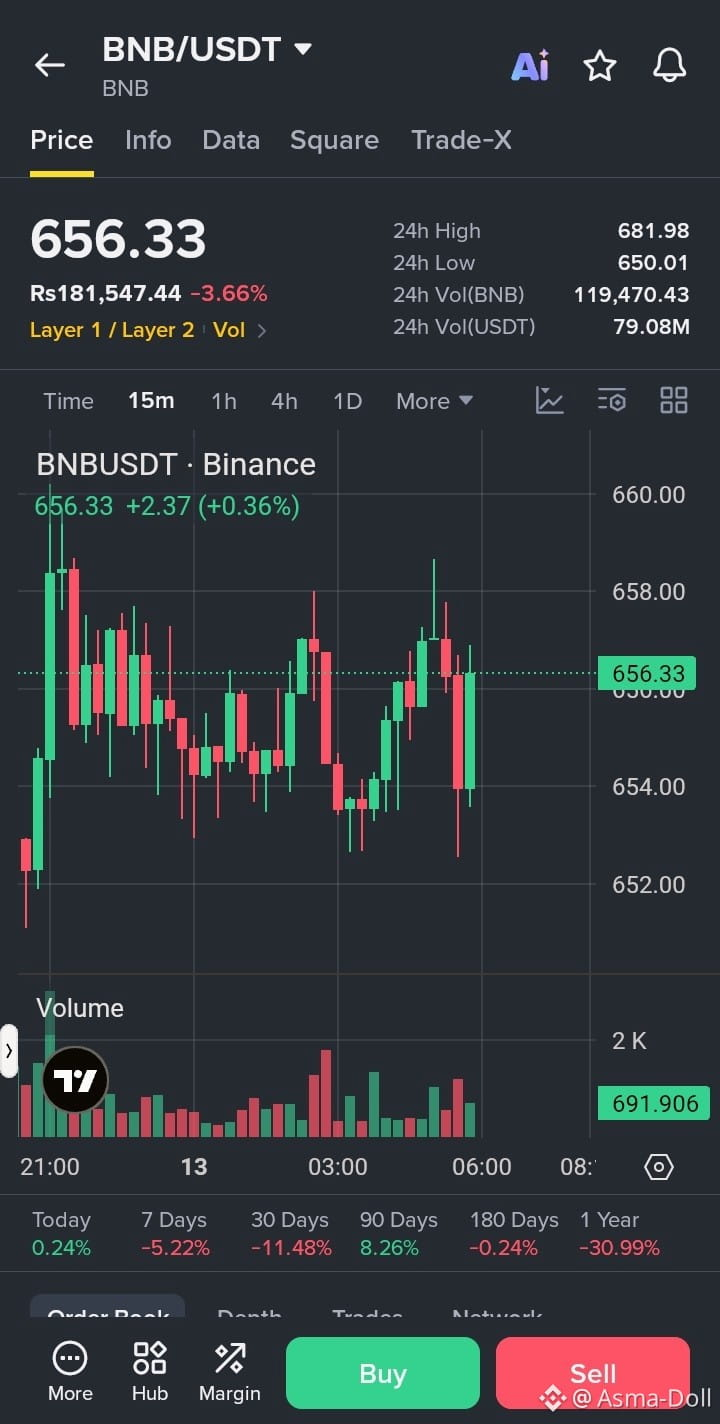
🚨 $BNB /USDT — SHORT SIGNAL
Current Price: $656.33
Trade Plan: SHORT
* Entry: $656 – $661
* Stop Loss (SL): $670
* TP1: $650
* TP2: $642
* TP3: $632
Trade here $BNB
{future}(BNBUSDT)
Technical Analysis:
* Strong rejection from the $681.98 resistance.
* Price down 3.66% over 24 hours.
* Trading close to the $650 support zone.
* 7-day performance: -5.22%.
* 30-day performance: -11.48%.
* Bearish momentum remains dominant.
Confirmation:
* 1H candle close below $650 confirms bearish continuation.
* Increased selling volume strengthens the short setup.
* If $650 holds strongly, avoid chasing the short.
Risk-to-Reward Summary:
| Target | Approx. reward from $656 |
| -------- | ------------------------ |
| TP1 $650 | 0.91% |
| TP2 $642 | 2.13% |
| TP3 $632 | 3.66% |
| SL $670 | 2.08% risk |
Trade carefully: Wait for confirmation below $650. These are indicative levels based on your supplied snapshot, not guaranteed targets. Use proper position sizing.
#BNB #BNBUSDT #CryptoShort #BinanceTrading #BearishSignal
🚨 $BNB /USDT — SHORT SIGNAL
Current Price: $656.33
Trade Plan: SHORT
* Entry: $656 – $661
* Stop Loss (SL): $670
* TP1: $650
* TP2: $642
* TP3: $632
Trade here $BNB
Technical Analysis:
* Strong rejection from the $681.98 resistance.
* Price down 3.66% over 24 hours.
* Trading close to the $650 support zone.
* 7-day performance: -5.22%.
* 30-day performance: -11.48%.
* Bearish momentum remains dominant.
Confirmation:
* 1H candle close below $650 confirms bearish continuation.
* Increased selling volume strengthens the short setup.
* If $650 holds strongly, avoid chasing the short.
Risk-to-Reward Summary:
| Target | Approx. reward from $656 |
| -------- | ------------------------ |
| TP1 $650 | 0.91% |
| TP2 $642 | 2.13% |
| TP3 $632 | 3.66% |
| SL $670 | 2.08% risk |
Trade carefully: Wait for confirmation below $650. These are indicative levels based on your supplied snapshot, not guaranteed targets. Use proper position sizing.
#BNB #BNBUSDT #CryptoShort #BinanceTrading #BearishSignal
Current Price: $656.33
Trade Plan: SHORT
* Entry: $656 – $661
* Stop Loss (SL): $670
* TP1: $650
* TP2: $642
* TP3: $632
Trade here $BNB
Technical Analysis:
* Strong rejection from the $681.98 resistance.
* Price down 3.66% over 24 hours.
* Trading close to the $650 support zone.
* 7-day performance: -5.22%.
* 30-day performance: -11.48%.
* Bearish momentum remains dominant.
Confirmation:
* 1H candle close below $650 confirms bearish continuation.
* Increased selling volume strengthens the short setup.
* If $650 holds strongly, avoid chasing the short.
Risk-to-Reward Summary:
| Target | Approx. reward from $656 |
| -------- | ------------------------ |
| TP1 $650 | 0.91% |
| TP2 $642 | 2.13% |
| TP3 $632 | 3.66% |
| SL $670 | 2.08% risk |
Trade carefully: Wait for confirmation below $650. These are indicative levels based on your supplied snapshot, not guaranteed targets. Use proper position sizing.
#BNB #BNBUSDT #CryptoShort #BinanceTrading #BearishSignal
81
·
--
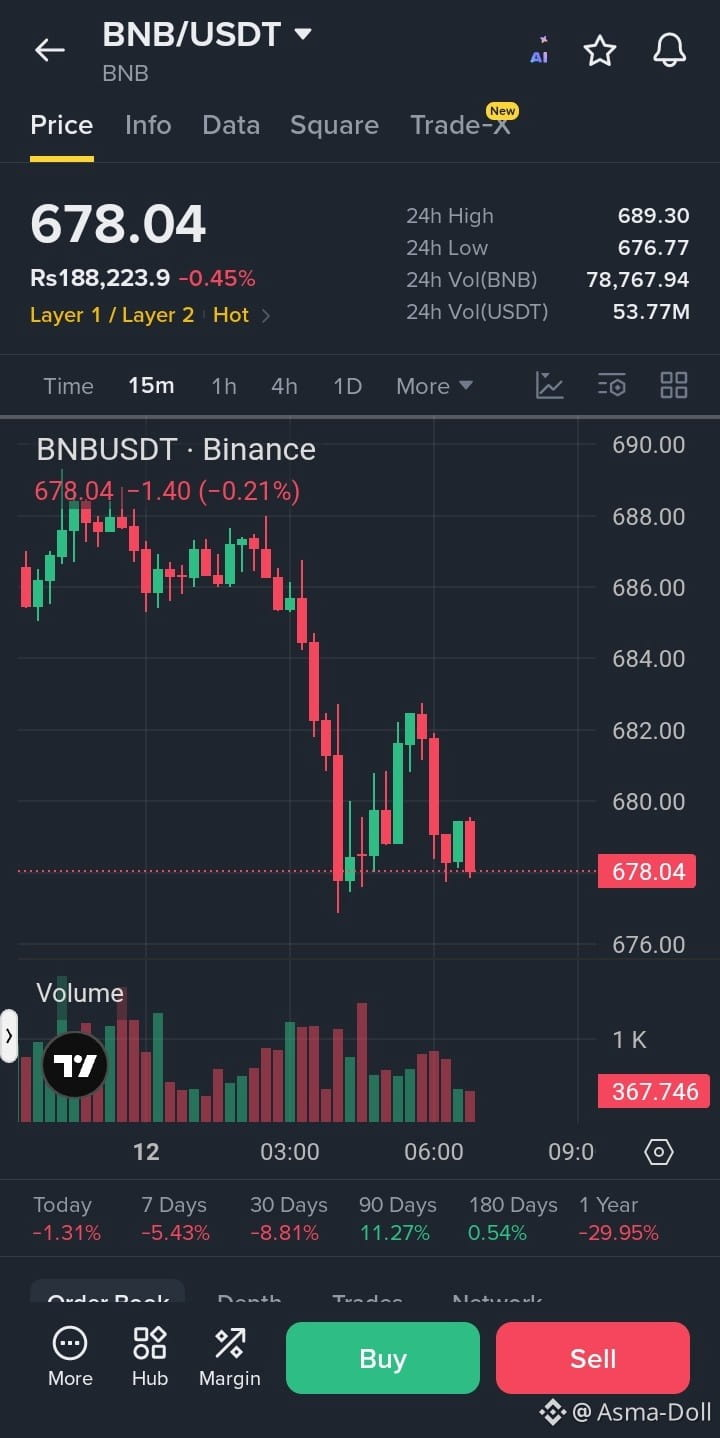
📉 $BNB /USDT – SHORT SIGNAL
Current Price: $678.04
🔴 Trade Plan: SHORT
Entry: $678.00 – $681.00
Stop Loss (SL): $689.50
🎯 Take Profit (TP):
TP1: $674.00
TP2: $668.00
TP3: $660.00
Trade here $BNB
{future}(BNBUSDT)
Analysis:
Price showing bearish momentum.
Rejected from the $689 resistance zone.
Trading close to the 24h low of $676.77.
7-day performance is down 5.43%.
Sellers currently have short-term control.
Confirmation: ⚠️ A clean breakdown below $676.70 with strong selling volume may trigger further downside.
Risk/Reward: Approximately 1:1.3 to 1:2.6, depending on entry and target.
⚡ Trade carefully! Wait for confirmation; avoid chasing the breakdown.
#BNB #BNBUSDT #CryptoSignals #ShortSignal #BinanceTrading
📉 $BNB /USDT – SHORT SIGNAL
Current Price: $678.04
🔴 Trade Plan: SHORT
Entry: $678.00 – $681.00
Stop Loss (SL): $689.50
🎯 Take Profit (TP):
TP1: $674.00
TP2: $668.00
TP3: $660.00
Trade here $BNB
Analysis:
Price showing bearish momentum.
Rejected from the $689 resistance zone.
Trading close to the 24h low of $676.77.
7-day performance is down 5.43%.
Sellers currently have short-term control.
Confirmation: ⚠️ A clean breakdown below $676.70 with strong selling volume may trigger further downside.
Risk/Reward: Approximately 1:1.3 to 1:2.6, depending on entry and target.
⚡ Trade carefully! Wait for confirmation; avoid chasing the breakdown.
#BNB #BNBUSDT #CryptoSignals #ShortSignal #BinanceTrading
Current Price: $678.04
🔴 Trade Plan: SHORT
Entry: $678.00 – $681.00
Stop Loss (SL): $689.50
🎯 Take Profit (TP):
TP1: $674.00
TP2: $668.00
TP3: $660.00
Trade here $BNB
Analysis:
Price showing bearish momentum.
Rejected from the $689 resistance zone.
Trading close to the 24h low of $676.77.
7-day performance is down 5.43%.
Sellers currently have short-term control.
Confirmation: ⚠️ A clean breakdown below $676.70 with strong selling volume may trigger further downside.
Risk/Reward: Approximately 1:1.3 to 1:2.6, depending on entry and target.
⚡ Trade carefully! Wait for confirmation; avoid chasing the breakdown.
#BNB #BNBUSDT #CryptoSignals #ShortSignal #BinanceTrading
17
·
--
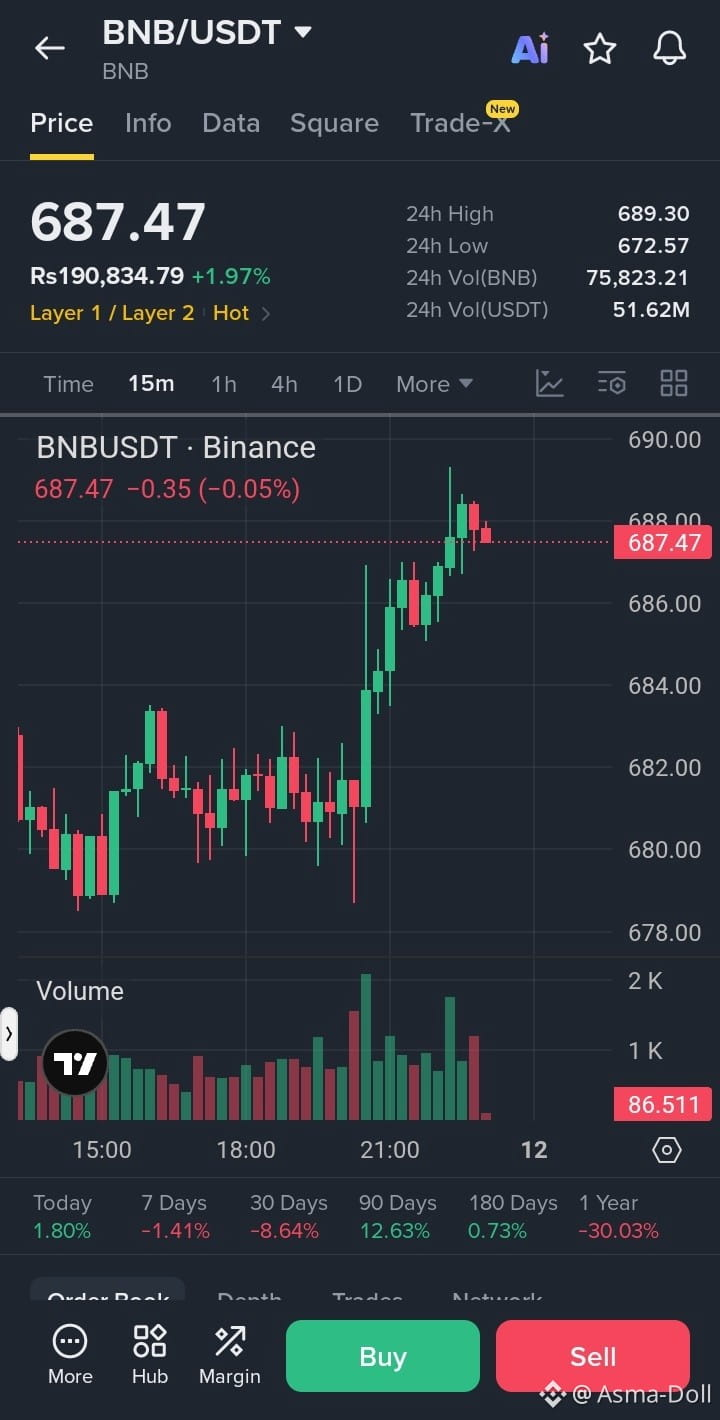
$BNB /USDT – LONG SIGNAL 🟢
Trade Plan:
Entry: $689.50 – $691.00 (after breakout confirmation)
Stop Loss (SL): $684.50
Take Profit Targets:
TP1: $696.00
TP2: $701.00
TP3: $707.00
Trade here $BNB
{future}(BNBUSDT)
Analysis:
Price showing positive intraday momentum (+1.97%).
Trading close to 24H resistance at $689.30.
Buyers attempting to push above resistance.
Weekly trend remains slightly weak (-1.41%).
A confirmed breakout could trigger further upside.
Confirmation: A strong 15-minute candle close above $689.30 with increasing volume.
Risk-to-Reward:
TP1: 1:1
TP2: 1:2
TP3: 1:3
⚠️ Avoid entering before breakout confirmation. If price gets rejected at $689.30, the long setup becomes invalid.
#BNB #BNBUSDT #BinanceTrading #CryptoSignals #AltcoinTrading
$BNB /USDT – LONG SIGNAL 🟢
Trade Plan:
Entry: $689.50 – $691.00 (after breakout confirmation)
Stop Loss (SL): $684.50
Take Profit Targets:
TP1: $696.00
TP2: $701.00
TP3: $707.00
Trade here $BNB
Analysis:
Price showing positive intraday momentum (+1.97%).
Trading close to 24H resistance at $689.30.
Buyers attempting to push above resistance.
Weekly trend remains slightly weak (-1.41%).
A confirmed breakout could trigger further upside.
Confirmation: A strong 15-minute candle close above $689.30 with increasing volume.
Risk-to-Reward:
TP1: 1:1
TP2: 1:2
TP3: 1:3
⚠️ Avoid entering before breakout confirmation. If price gets rejected at $689.30, the long setup becomes invalid.
#BNB #BNBUSDT #BinanceTrading #CryptoSignals #AltcoinTrading
Trade Plan:
Entry: $689.50 – $691.00 (after breakout confirmation)
Stop Loss (SL): $684.50
Take Profit Targets:
TP1: $696.00
TP2: $701.00
TP3: $707.00
Trade here $BNB
Analysis:
Price showing positive intraday momentum (+1.97%).
Trading close to 24H resistance at $689.30.
Buyers attempting to push above resistance.
Weekly trend remains slightly weak (-1.41%).
A confirmed breakout could trigger further upside.
Confirmation: A strong 15-minute candle close above $689.30 with increasing volume.
Risk-to-Reward:
TP1: 1:1
TP2: 1:2
TP3: 1:3
⚠️ Avoid entering before breakout confirmation. If price gets rejected at $689.30, the long setup becomes invalid.
#BNB #BNBUSDT #BinanceTrading #CryptoSignals #AltcoinTrading
1
44

·
--
Bullish
🚀 BNB Market Update
BNB is holding near the $688 area, with recent futures data showing positive funding and a long-heavy positioning mix. The market remains active, but price movements can change quickly.
📊 Keep an eye on volume, funding, and broader crypto sentiment before making any move.
#bnb #BNB #Binance #crypto #BNBUSDT
🚀 BNB Market Update
BNB is holding near the $688 area, with recent futures data showing positive funding and a long-heavy positioning mix. The market remains active, but price movements can change quickly.
📊 Keep an eye on volume, funding, and broader crypto sentiment before making any move.
#bnb #BNB #Binance #crypto #BNBUSDT
BNB is holding near the $688 area, with recent futures data showing positive funding and a long-heavy positioning mix. The market remains active, but price movements can change quickly.
📊 Keep an eye on volume, funding, and broader crypto sentiment before making any move.
#bnb #BNB #Binance #crypto #BNBUSDT
14

·
--
Bullish
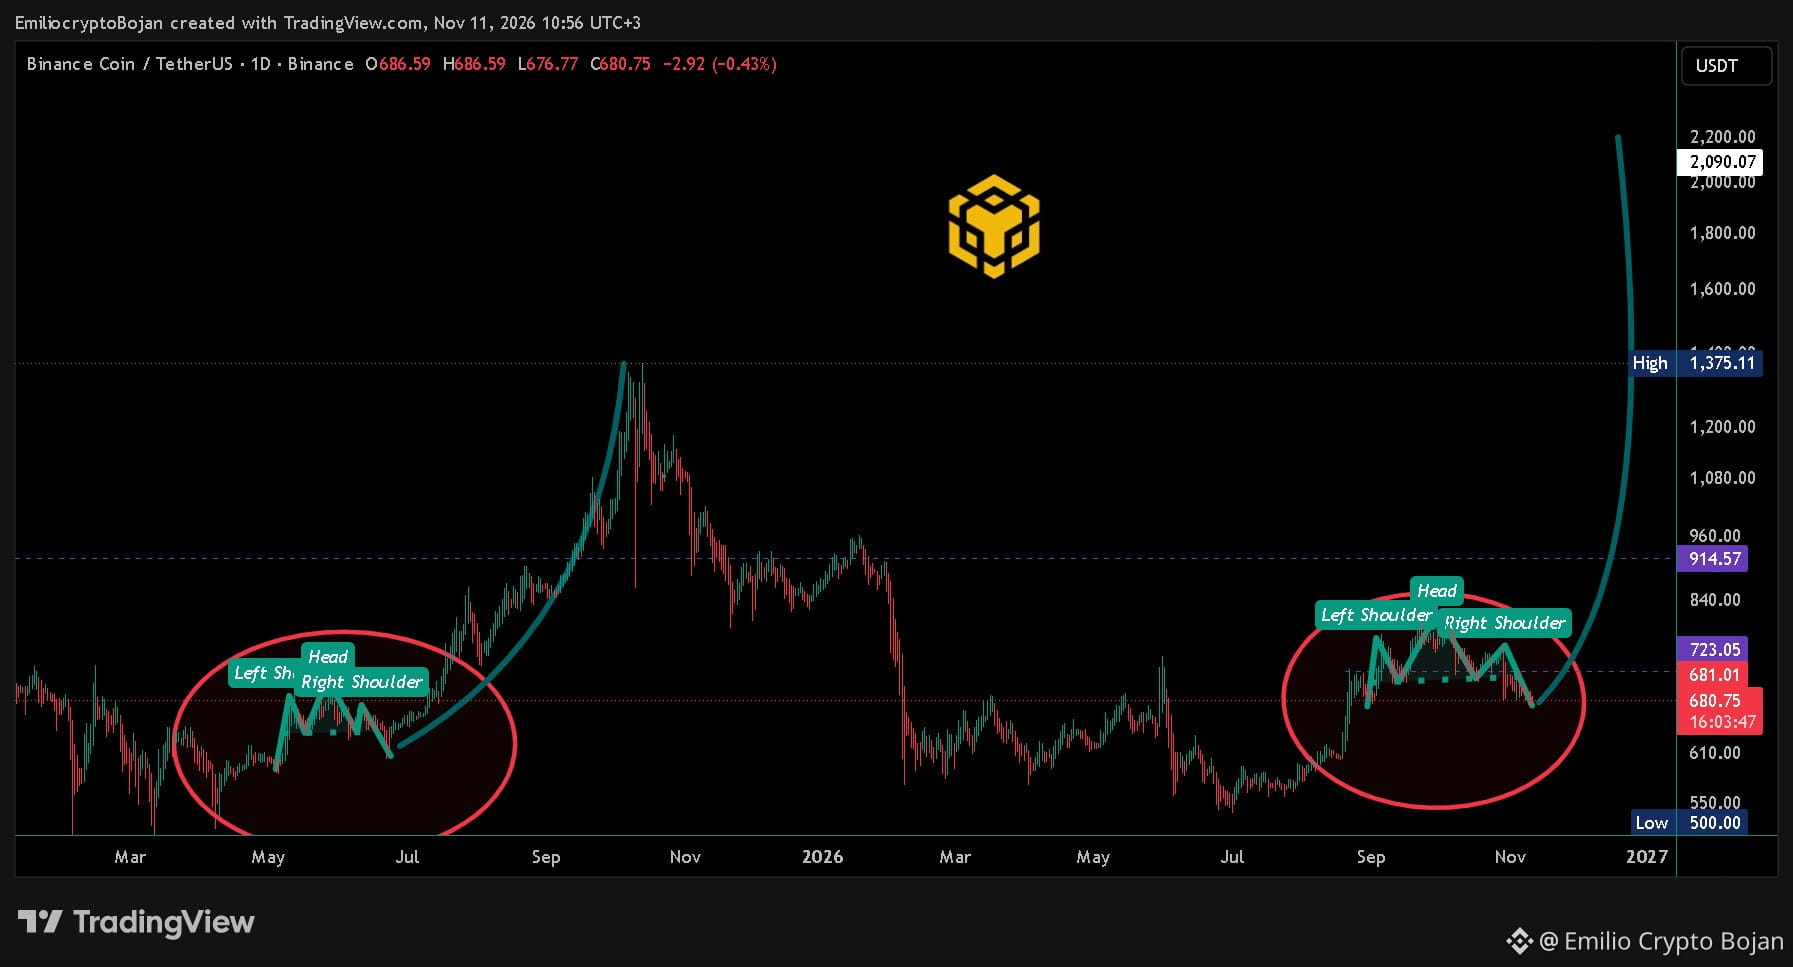
#BNBUSDT UPDATE 🚀
Look what happens when the bearish Head & Shoulders pattern on $BNB hits its target. 👀
Nothing much to talk about.
Hey Bulls, y'all know what to do!
Now give me $2,090. 🔥
NFA.
#HotCPIDecemberHikePriced #AnthropicRejectsIPODelayValuationinQuestion #CanNvidiaEarningsEaseMarketConcerns? #BitcoinFiveWeeklyLosses
#BNBUSDT UPDATE 🚀
Look what happens when the bearish Head & Shoulders pattern on $BNB hits its target. 👀
Nothing much to talk about.
Hey Bulls, y'all know what to do!
Now give me $2,090. 🔥
NFA.
#HotCPIDecemberHikePriced #AnthropicRejectsIPODelayValuationinQuestion #CanNvidiaEarningsEaseMarketConcerns? #BitcoinFiveWeeklyLosses
Look what happens when the bearish Head & Shoulders pattern on $BNB hits its target. 👀
Nothing much to talk about.
Hey Bulls, y'all know what to do!
Now give me $2,090. 🔥
NFA.
#HotCPIDecemberHikePriced #AnthropicRejectsIPODelayValuationinQuestion #CanNvidiaEarningsEaseMarketConcerns? #BitcoinFiveWeeklyLosses
85
Log in to explore more content
Join global crypto users on Binance Square
⚡️ Get latest and useful information about crypto.
💬 Trusted by the world’s largest crypto exchange.
👍 Discover real insights from verified creators.
Email / Phone number
Trending Topics
1
#USPPIMissMayEaseBTCPressure
64,402 views
908 Discussing
2
#BitcoinCoreDisclosesTorTrafficVulnerability
27,262 views
503 Discussing
3
#WhatWillDriveCryptoandStocks’NextRebound?
186,547 views
1,717 Discussing
4
#BitcoinBreaksBelow200WeekMovingAverage
67,662 views
603 Discussing
5
#SpaceXTeslaMergerTalksWouldCombine30220BTC
22,420 views
335 Discussing
6
#Anthropic’s6xIPODemandSignalsPotentialRecordRaise
67,366 views
783 Discussing
7
#USCryptoETFsLose$1.48BInFiveDays
3,217 views
54 Discussing
8
#KoreaDigitalAssetBasicActFinalDraftExpectedEarlyJanuary
4,184 views
26 Discussing
9
#RippleRLUSDMarketCapSurpassesPayPalPYUSD
14,617 views
173 Discussing
10
#JaneStreetNearlyOctuplesFidelityBitcoinETFHoldings
33,957 views
284 Discussing