
#axti
axti
89,107 views
1,278 Discussing
Hot
Latest

·
--
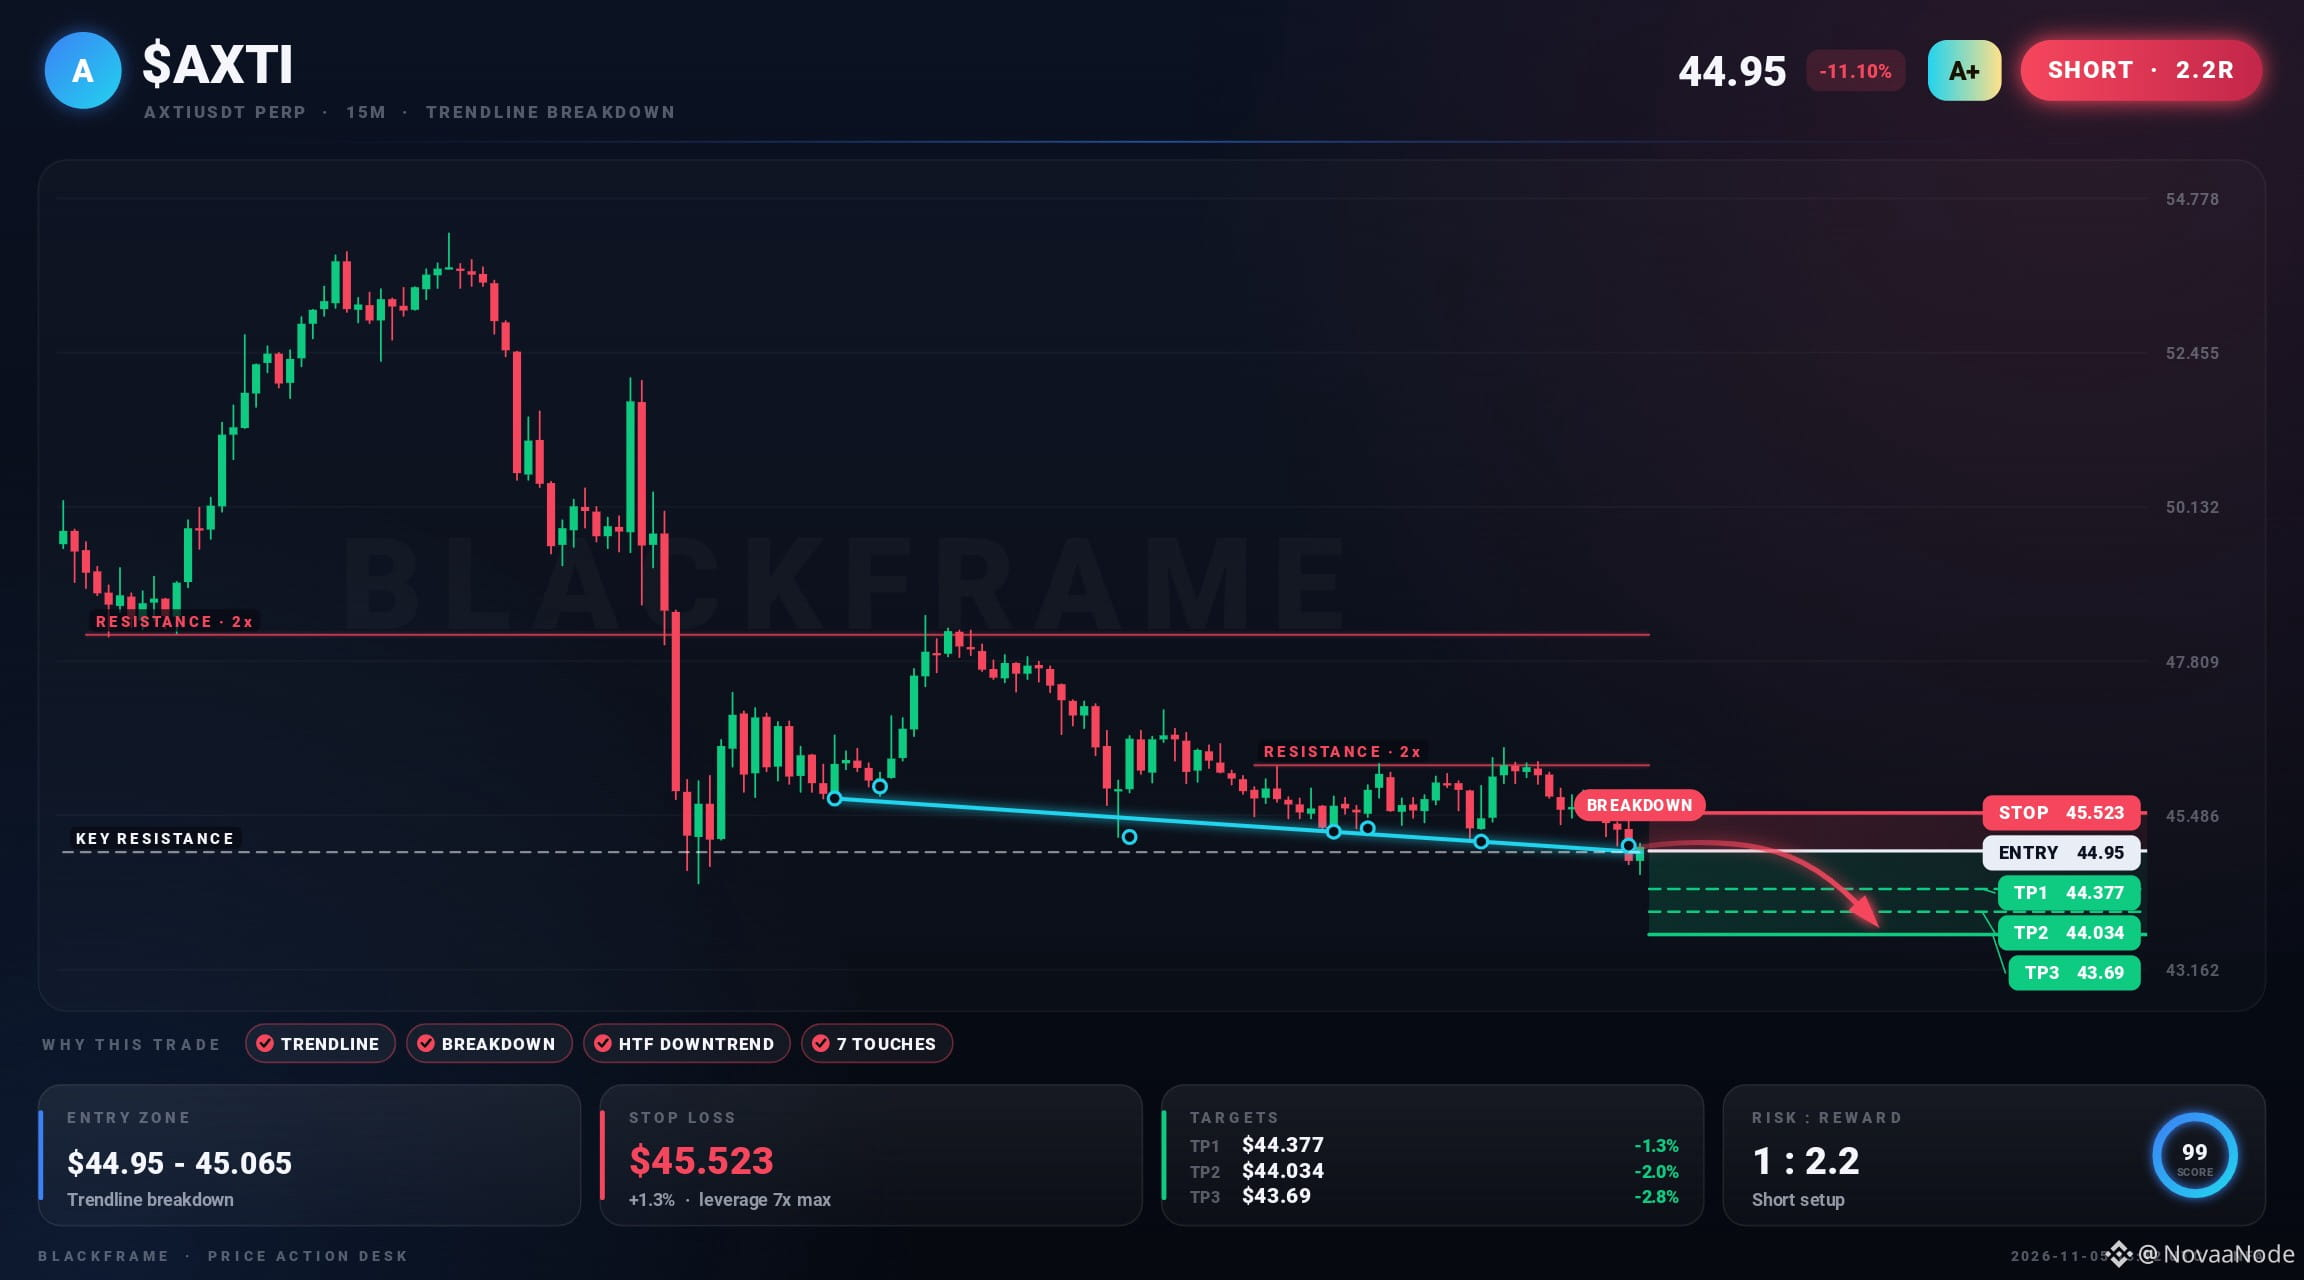
⏳ $AXTI breaks down the trendline
SHORT · 15M
Entry: $44.95 - $45.093
TP1: $44.377
TP2: $44.034
TP3: $43.69
SL: $45.523
The short‑term trendline gave way, aligning with higher‑timeframe downtrend. Entry at $45.523 with target $43.69 and stop at $44.93. Invalid if price rallies back above $44.93.
#AXTI #Futures #Binance · NFA
⏳ $AXTI breaks down the trendline
SHORT · 15M
Entry: $44.95 - $45.093
TP1: $44.377
TP2: $44.034
TP3: $43.69
SL: $45.523
The short‑term trendline gave way, aligning with higher‑timeframe downtrend. Entry at $45.523 with target $43.69 and stop at $44.93. Invalid if price rallies back above $44.93.
#AXTI #Futures #Binance · NFA
SHORT · 15M
Entry: $44.95 - $45.093
TP1: $44.377
TP2: $44.034
TP3: $43.69
SL: $45.523
The short‑term trendline gave way, aligning with higher‑timeframe downtrend. Entry at $45.523 with target $43.69 and stop at $44.93. Invalid if price rallies back above $44.93.
#AXTI #Futures #Binance · NFA
8

·
--
🚨 $AXTI BULLISH MOMENTUM BUILDING ON THE 1H BUT CONFIRMATION IS KEY ⚡
Entry: 68.92–69.28 ⚡
Target: 70.37 / 71.38 / 72.41 🚀
Stop Loss: 67.68 ⚠️
1H momentum on $AXTI remains steadily aligned with the broader trend as price coils right near the 68.92–69.28 demand zone. 📊 Order flow shows buyers keeping control, but smart capital waits for trigger confirmation before committing size.
💡 While the technical structure hints at potential upside toward 72.41, current edge metrics suggest keeping this strictly on the watchlist. 📌 Letting the market prove itself first separates high-probability executions from premature entries. 💬 Are you waiting for a clean break out of this range or setting limit bids early? 👇
⚠️ Not financial advice. Always manage your risk. 🛡️
🏷️ #AXTI #CryptoTrading #Watchlist #TechnicalAnalysis #PriceAction
🔥 💎
🚨 $AXTI BULLISH MOMENTUM BUILDING ON THE 1H BUT CONFIRMATION IS KEY ⚡
Entry: 68.92–69.28 ⚡
Target: 70.37 / 71.38 / 72.41 🚀
Stop Loss: 67.68 ⚠️
1H momentum on $AXTI remains steadily aligned with the broader trend as price coils right near the 68.92–69.28 demand zone. 📊 Order flow shows buyers keeping control, but smart capital waits for trigger confirmation before committing size.
💡 While the technical structure hints at potential upside toward 72.41, current edge metrics suggest keeping this strictly on the watchlist. 📌 Letting the market prove itself first separates high-probability executions from premature entries. 💬 Are you waiting for a clean break out of this range or setting limit bids early? 👇
⚠️ Not financial advice. Always manage your risk. 🛡️
🏷️ #AXTI #CryptoTrading #Watchlist #TechnicalAnalysis #PriceAction
🔥 💎
Entry: 68.92–69.28 ⚡
Target: 70.37 / 71.38 / 72.41 🚀
Stop Loss: 67.68 ⚠️
1H momentum on $AXTI remains steadily aligned with the broader trend as price coils right near the 68.92–69.28 demand zone. 📊 Order flow shows buyers keeping control, but smart capital waits for trigger confirmation before committing size.
💡 While the technical structure hints at potential upside toward 72.41, current edge metrics suggest keeping this strictly on the watchlist. 📌 Letting the market prove itself first separates high-probability executions from premature entries. 💬 Are you waiting for a clean break out of this range or setting limit bids early? 👇
⚠️ Not financial advice. Always manage your risk. 🛡️
🏷️ #AXTI #CryptoTrading #Watchlist #TechnicalAnalysis #PriceAction
🔥 💎
10
·
--
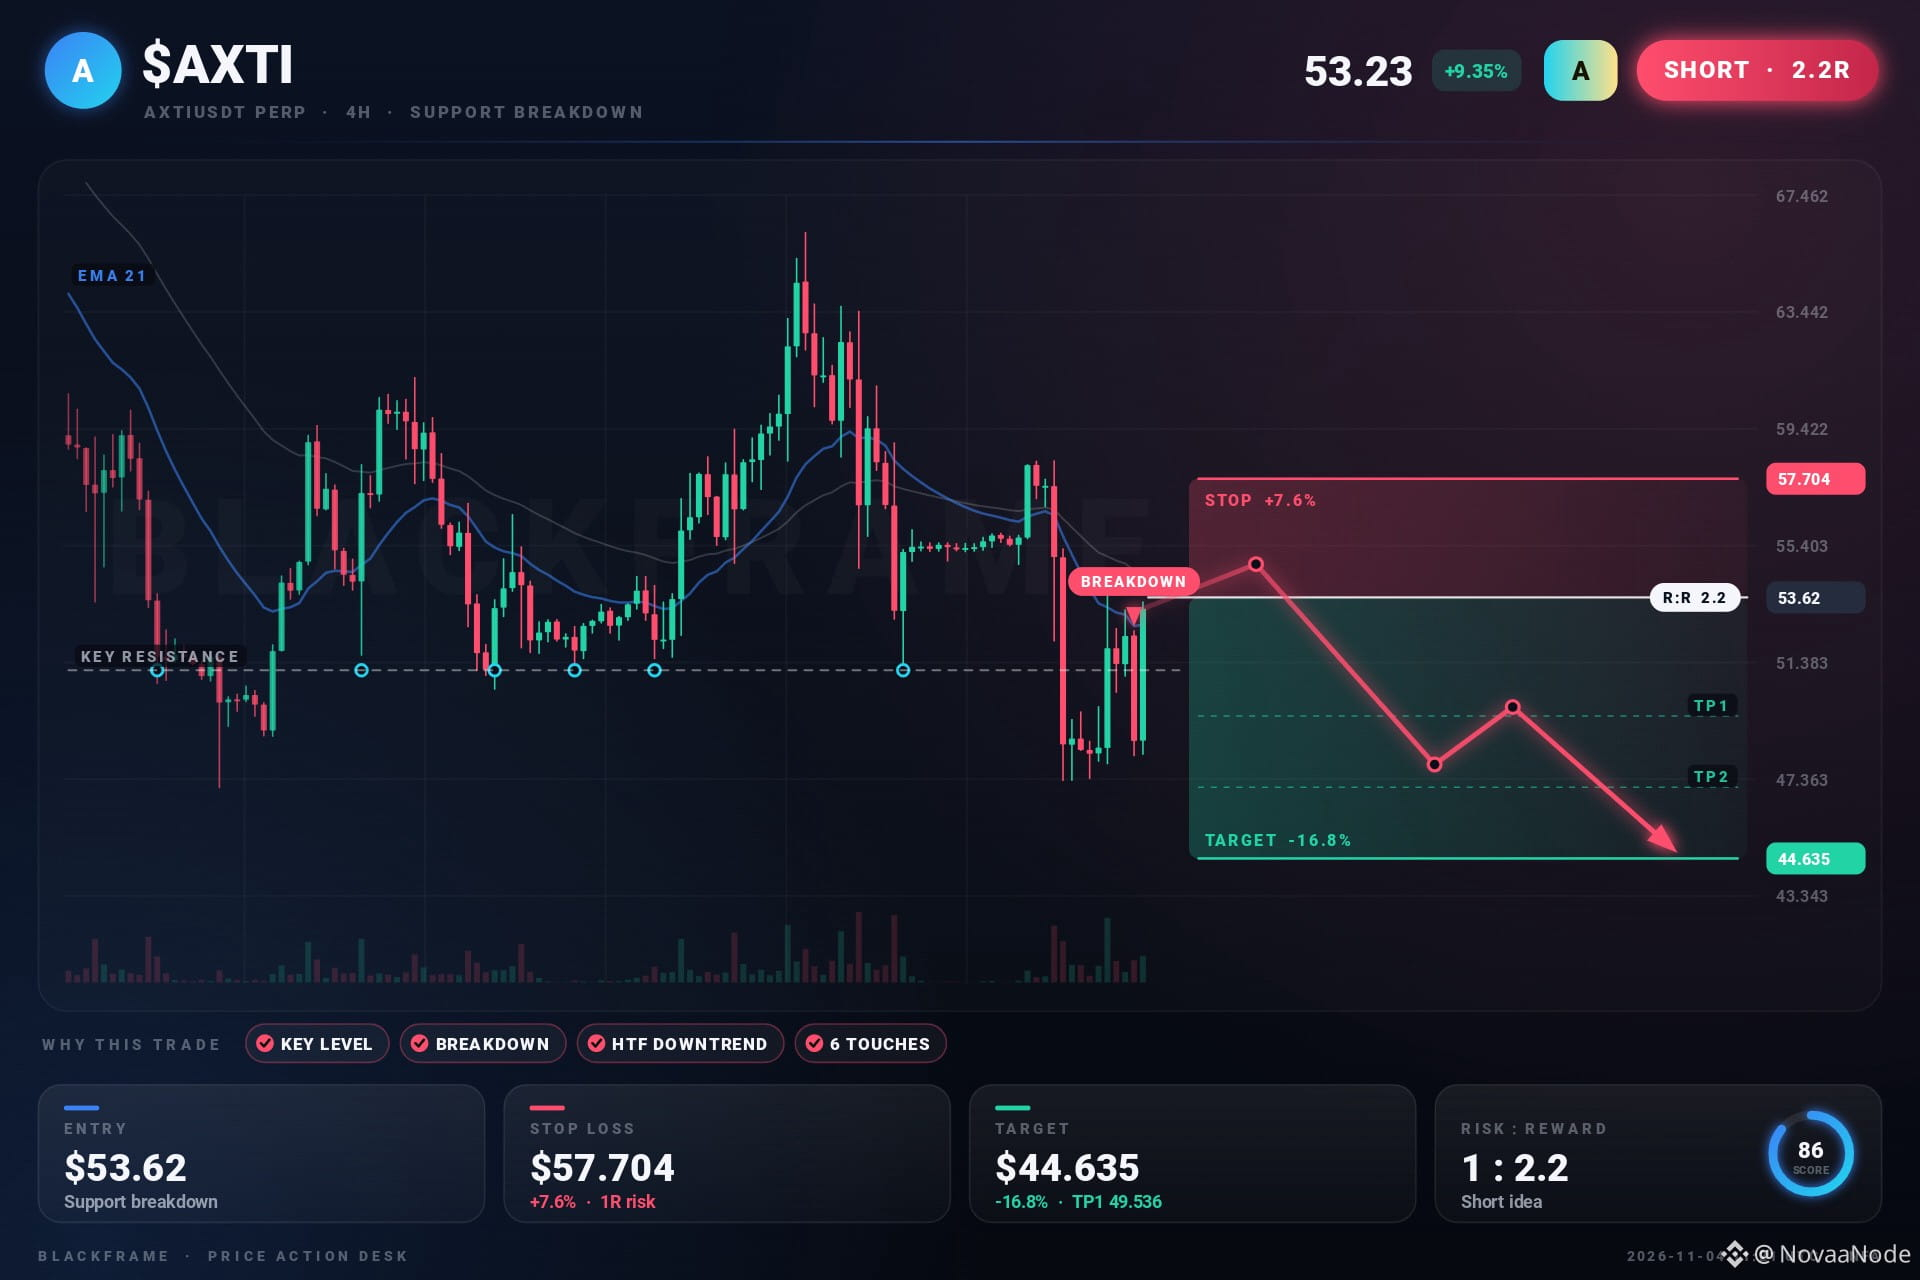
Everyone’s buzzing about $AXTI after that big rip, but the euphoria feels like a trap 😑
short idea on $AXTI
TP: $44.635
SL: $57.704
Liquidity pools are stacked around $50.623-51.113
$51.113 is holding firm as support
Each sell‑off fuels the next dive toward $44.635
Get ahead before the crowd flips
#AXTI #Crypto · NFA
Everyone’s buzzing about $AXTI after that big rip, but the euphoria feels like a trap 😑
short idea on $AXTI
TP: $44.635
SL: $57.704
Liquidity pools are stacked around $50.623-51.113
$51.113 is holding firm as support
Each sell‑off fuels the next dive toward $44.635
Get ahead before the crowd flips
#AXTI #Crypto · NFA
short idea on $AXTI
TP: $44.635
SL: $57.704
Liquidity pools are stacked around $50.623-51.113
$51.113 is holding firm as support
Each sell‑off fuels the next dive toward $44.635
Get ahead before the crowd flips
#AXTI #Crypto · NFA
325

·
--
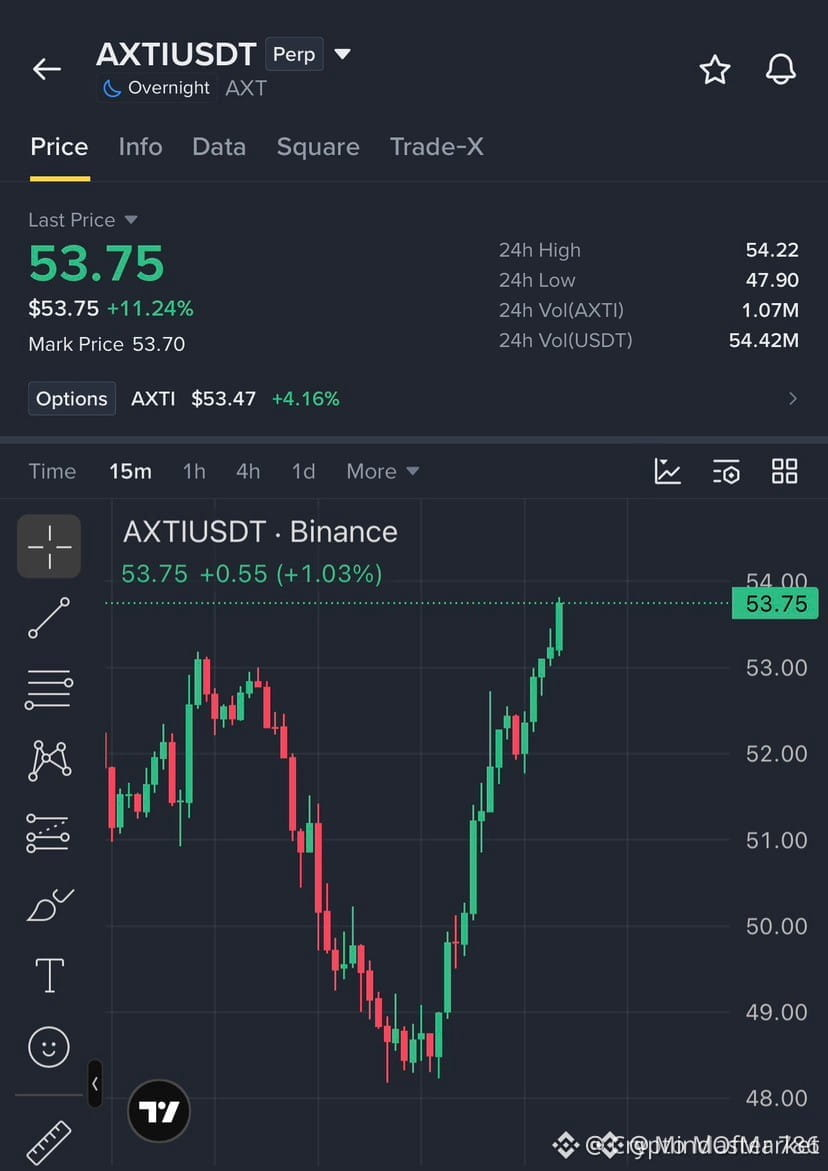
🚨 $AXTI PREPARES FOR BULLISH REJECTION AROUND 52.00 📈
Entry: 52.00 ⚡
Target: 53.00 🚀
Target: 54.00 🚀
Target: 54.22 🚀
Stop Loss: 51.00 ⚠️
📊 The order block at 52.00 is acting as a liquidity sink, where smart money has been absorbing sell pressure. A clean bullish rejection candle would confirm the imbalance and set the stage for a structured climb. 📌
⚡ With each retest, the market is pruning weak hands; a break above 52.00 opens the path to the next resistance cluster at 53‑54.22, a classic range‑reclaim pattern. The risk is tightly capped at 51.00, preserving capital while the upside potential triples the stake. 💬 Do you see the rejection forming, or are you waiting for a deeper pull? 👇
⚠️ Not financial advice. Always manage your risk. 🛡️
🏷️ #AXTI #LongSetup #BullishRejection #Crypto
🚀 ⚡
🚨 $AXTI PREPARES FOR BULLISH REJECTION AROUND 52.00 📈
Entry: 52.00 ⚡
Target: 53.00 🚀
Target: 54.00 🚀
Target: 54.22 🚀
Stop Loss: 51.00 ⚠️
📊 The order block at 52.00 is acting as a liquidity sink, where smart money has been absorbing sell pressure. A clean bullish rejection candle would confirm the imbalance and set the stage for a structured climb. 📌
⚡ With each retest, the market is pruning weak hands; a break above 52.00 opens the path to the next resistance cluster at 53‑54.22, a classic range‑reclaim pattern. The risk is tightly capped at 51.00, preserving capital while the upside potential triples the stake. 💬 Do you see the rejection forming, or are you waiting for a deeper pull? 👇
⚠️ Not financial advice. Always manage your risk. 🛡️
🏷️ #AXTI #LongSetup #BullishRejection #Crypto
🚀 ⚡
Entry: 52.00 ⚡
Target: 53.00 🚀
Target: 54.00 🚀
Target: 54.22 🚀
Stop Loss: 51.00 ⚠️
📊 The order block at 52.00 is acting as a liquidity sink, where smart money has been absorbing sell pressure. A clean bullish rejection candle would confirm the imbalance and set the stage for a structured climb. 📌
⚡ With each retest, the market is pruning weak hands; a break above 52.00 opens the path to the next resistance cluster at 53‑54.22, a classic range‑reclaim pattern. The risk is tightly capped at 51.00, preserving capital while the upside potential triples the stake. 💬 Do you see the rejection forming, or are you waiting for a deeper pull? 👇
⚠️ Not financial advice. Always manage your risk. 🛡️
🏷️ #AXTI #LongSetup #BullishRejection #Crypto
🚀 ⚡
2

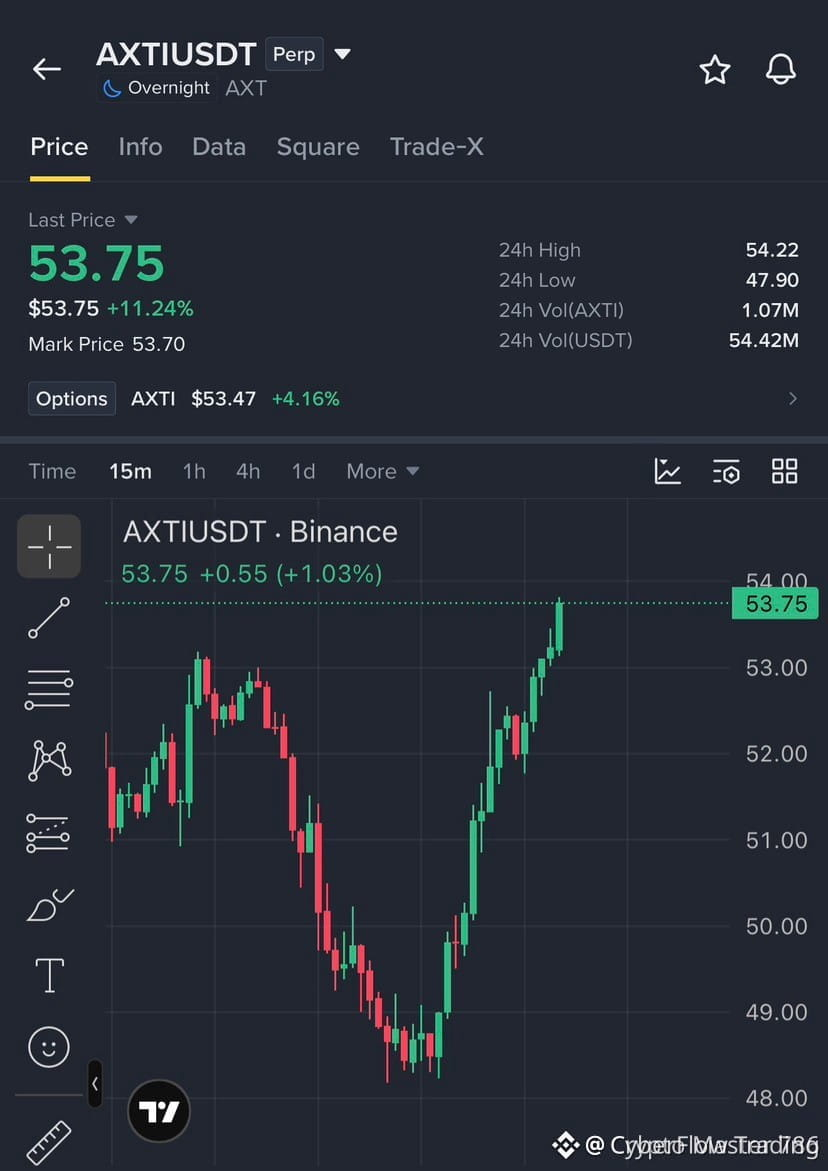
🚀 $AXTI EYES 52.00 BULLISH REJECTION—RALLY ON THE HORIZON! 💥
Entry: 52.00 ⚡
Target: 54.22 🚀
Stop Loss: 51.00 ⚠️
The order block at 52.00 is screaming for a bullish rejection, and smart money is already lining up the buy side. 📊 Volume spikes on the 4‑hour chart suggest fresh liquidity ready to flip the tide. 🌊
If price bites the 52.00 ceiling and flips, we’re eyeing a clean run to 54.22, with checkpoints at 53.00 and 54.00. Keep the stop tight at 51.00 to stay out of the chase. 💡
💬 Who’s ready to ride the next wave up? 👇
⚠️ Not financial advice. Always manage your risk. 🛡️
🏷️ #AXTI #LongSetup #BullishRejection #Crypto
🔥 💎
🚀 $AXTI EYES 52.00 BULLISH REJECTION—RALLY ON THE HORIZON! 💥
Entry: 52.00 ⚡
Target: 54.22 🚀
Stop Loss: 51.00 ⚠️
The order block at 52.00 is screaming for a bullish rejection, and smart money is already lining up the buy side. 📊 Volume spikes on the 4‑hour chart suggest fresh liquidity ready to flip the tide. 🌊
If price bites the 52.00 ceiling and flips, we’re eyeing a clean run to 54.22, with checkpoints at 53.00 and 54.00. Keep the stop tight at 51.00 to stay out of the chase. 💡
💬 Who’s ready to ride the next wave up? 👇
⚠️ Not financial advice. Always manage your risk. 🛡️
🏷️ #AXTI #LongSetup #BullishRejection #Crypto
🔥 💎
Entry: 52.00 ⚡
Target: 54.22 🚀
Stop Loss: 51.00 ⚠️
The order block at 52.00 is screaming for a bullish rejection, and smart money is already lining up the buy side. 📊 Volume spikes on the 4‑hour chart suggest fresh liquidity ready to flip the tide. 🌊
If price bites the 52.00 ceiling and flips, we’re eyeing a clean run to 54.22, with checkpoints at 53.00 and 54.00. Keep the stop tight at 51.00 to stay out of the chase. 💡
💬 Who’s ready to ride the next wave up? 👇
⚠️ Not financial advice. Always manage your risk. 🛡️
🏷️ #AXTI #LongSetup #BullishRejection #Crypto
🔥 💎
12


·
--
Bullish
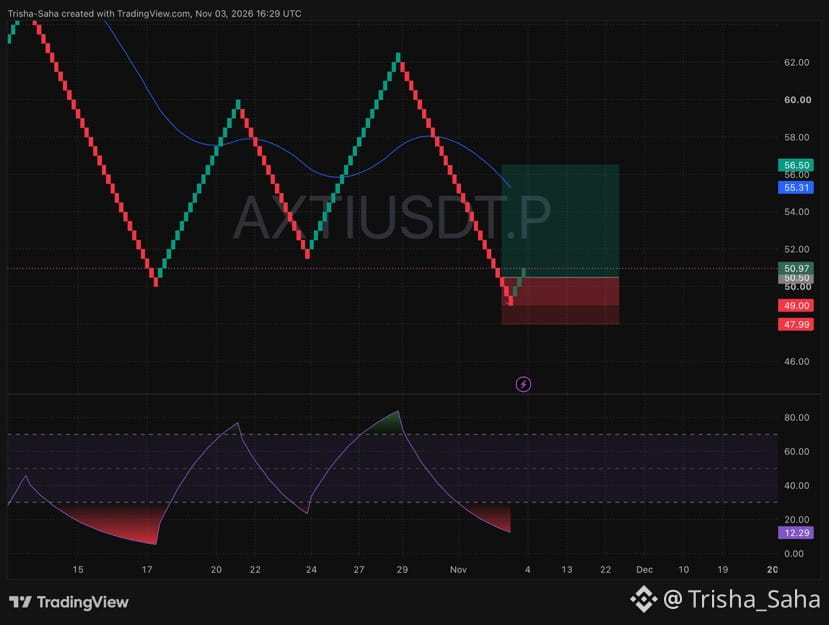
⚔️ $AXTI SELLERS HIT A BRICK WALL! MASSIVE REBOUND LOADING! 📈💥
📍 Trade Setup:
• Entry Zone: $50.00 – $50.97
• Stop Loss: $47.99
• Target: $56.50
📌 Chart Analysis:
• The steep drop slammed right into the $49.00 demand floor where big buyers launched the previous two rallies.
• Four straight green candles are stacking up off the bottom right now, proving sellers are completely out of steam and bulls are taking back control.
• The lower strength indicator is crushed deep in the red bargain zone at 12.29, setting up a violent snap-back rally toward the $55.31 blue line and beyond.
🛡️ Eliminate all risk by pushing your Stop Loss straight to your entry price the moment we lock in +3% to +4% profit!
My position is open and locked in. Who is riding this bounce to $56.50 with me? Drop a 🔥 in the comments! 👇
#AXTI #AXTIUSDT #CryptoTrading #BinanceSquare
{future}(AXTIUSDT)
⚔️ $AXTI SELLERS HIT A BRICK WALL! MASSIVE REBOUND LOADING! 📈💥
📍 Trade Setup:
• Entry Zone: $50.00 – $50.97
• Stop Loss: $47.99
• Target: $56.50
📌 Chart Analysis:
• The steep drop slammed right into the $49.00 demand floor where big buyers launched the previous two rallies.
• Four straight green candles are stacking up off the bottom right now, proving sellers are completely out of steam and bulls are taking back control.
• The lower strength indicator is crushed deep in the red bargain zone at 12.29, setting up a violent snap-back rally toward the $55.31 blue line and beyond.
🛡️ Eliminate all risk by pushing your Stop Loss straight to your entry price the moment we lock in +3% to +4% profit!
My position is open and locked in. Who is riding this bounce to $56.50 with me? Drop a 🔥 in the comments! 👇
#AXTI #AXTIUSDT #CryptoTrading #BinanceSquare
📍 Trade Setup:
• Entry Zone: $50.00 – $50.97
• Stop Loss: $47.99
• Target: $56.50
📌 Chart Analysis:
• The steep drop slammed right into the $49.00 demand floor where big buyers launched the previous two rallies.
• Four straight green candles are stacking up off the bottom right now, proving sellers are completely out of steam and bulls are taking back control.
• The lower strength indicator is crushed deep in the red bargain zone at 12.29, setting up a violent snap-back rally toward the $55.31 blue line and beyond.
🛡️ Eliminate all risk by pushing your Stop Loss straight to your entry price the moment we lock in +3% to +4% profit!
My position is open and locked in. Who is riding this bounce to $56.50 with me? Drop a 🔥 in the comments! 👇
#AXTI #AXTIUSDT #CryptoTrading #BinanceSquare
146

·
--
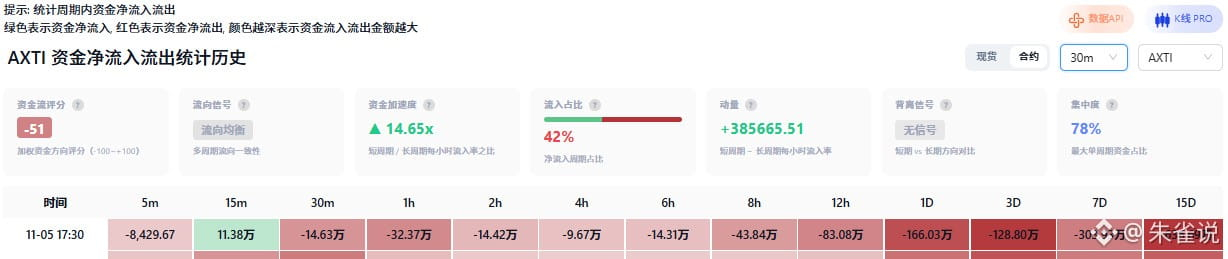
$AXTI The strongest earnings report ever, yet the stock price crashed. What should retail investors do?
Why did it fall?
First, let’s look at the latest news—it's all bad:
First, all the good news has already been priced in. The impressive earnings report is just liquidity for big players to dump their shares!
Second, the company turned around and announced a massive $545 million share offering, instantly increasing the number of shares and diluting your stake!
Third, the most dangerous risk: its core production capacity is in China. If export licenses get held up, even a mountain of orders will just become inventory!
The technical picture is brutally unforgiving:
The key support level at 47.53 has been decisively broken and is now overhead resistance. The current price is 45.8. If the price breaks below the 44 line in the sand on heavy volume, there’s nothing but a “vacuum zone” with no buyers below—and it could slide straight to 42–36!
Short near the current price of $47, or wait until the U.S. market opens tonight and enter a short position.
Don’t hesitate—hesitation means missing out. #中期选举 #AXTI
$AXTI The strongest earnings report ever, yet the stock price crashed. What should retail investors do?
Why did it fall?
First, let’s look at the latest news—it's all bad:
First, all the good news has already been priced in. The impressive earnings report is just liquidity for big players to dump their shares!
Second, the company turned around and announced a massive $545 million share offering, instantly increasing the number of shares and diluting your stake!
Third, the most dangerous risk: its core production capacity is in China. If export licenses get held up, even a mountain of orders will just become inventory!
The technical picture is brutally unforgiving:
The key support level at 47.53 has been decisively broken and is now overhead resistance. The current price is 45.8. If the price breaks below the 44 line in the sand on heavy volume, there’s nothing but a “vacuum zone” with no buyers below—and it could slide straight to 42–36!
Short near the current price of $47, or wait until the U.S. market opens tonight and enter a short position.
Don’t hesitate—hesitation means missing out. #中期选举 #AXTI
Why did it fall?
First, let’s look at the latest news—it's all bad:
First, all the good news has already been priced in. The impressive earnings report is just liquidity for big players to dump their shares!
Second, the company turned around and announced a massive $545 million share offering, instantly increasing the number of shares and diluting your stake!
Third, the most dangerous risk: its core production capacity is in China. If export licenses get held up, even a mountain of orders will just become inventory!
The technical picture is brutally unforgiving:
The key support level at 47.53 has been decisively broken and is now overhead resistance. The current price is 45.8. If the price breaks below the 44 line in the sand on heavy volume, there’s nothing but a “vacuum zone” with no buyers below—and it could slide straight to 42–36!
Short near the current price of $47, or wait until the U.S. market opens tonight and enter a short position.
Don’t hesitate—hesitation means missing out. #中期选举 #AXTI
2
492

·
--
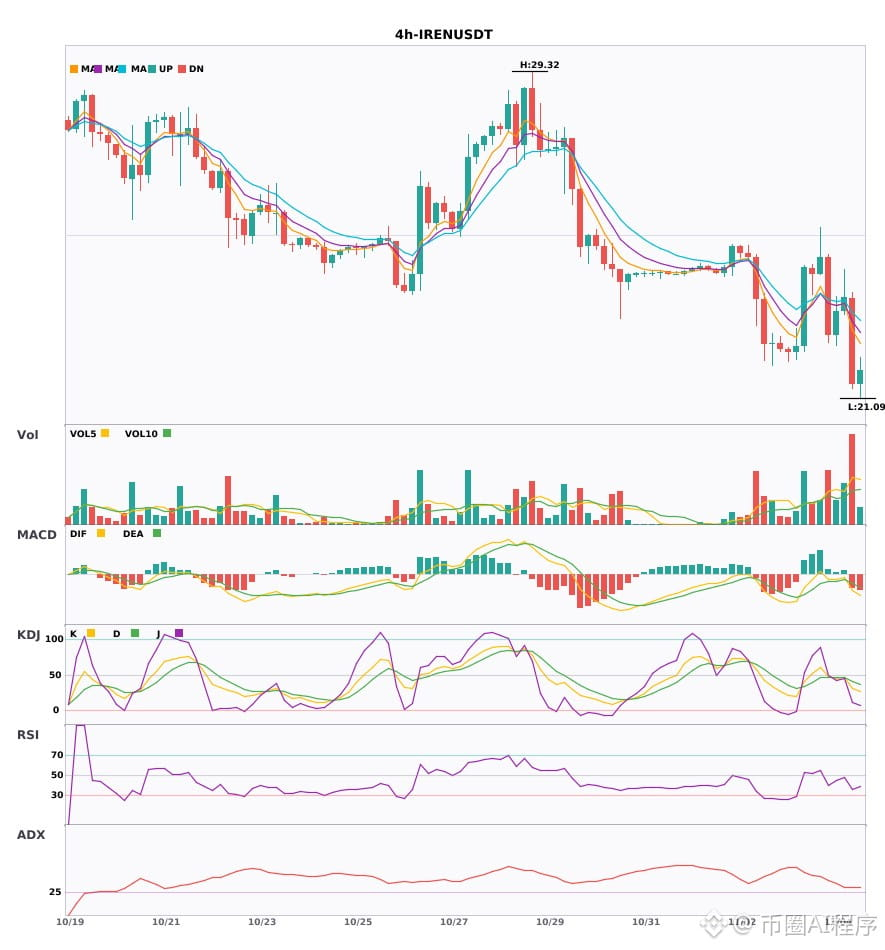
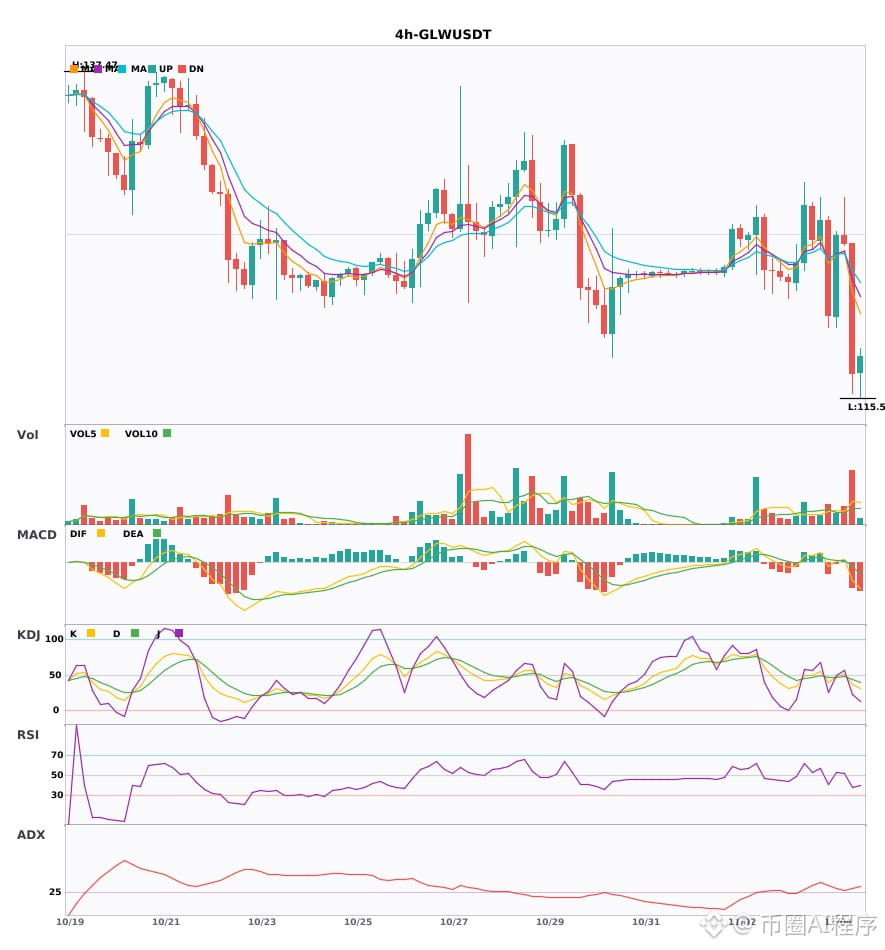
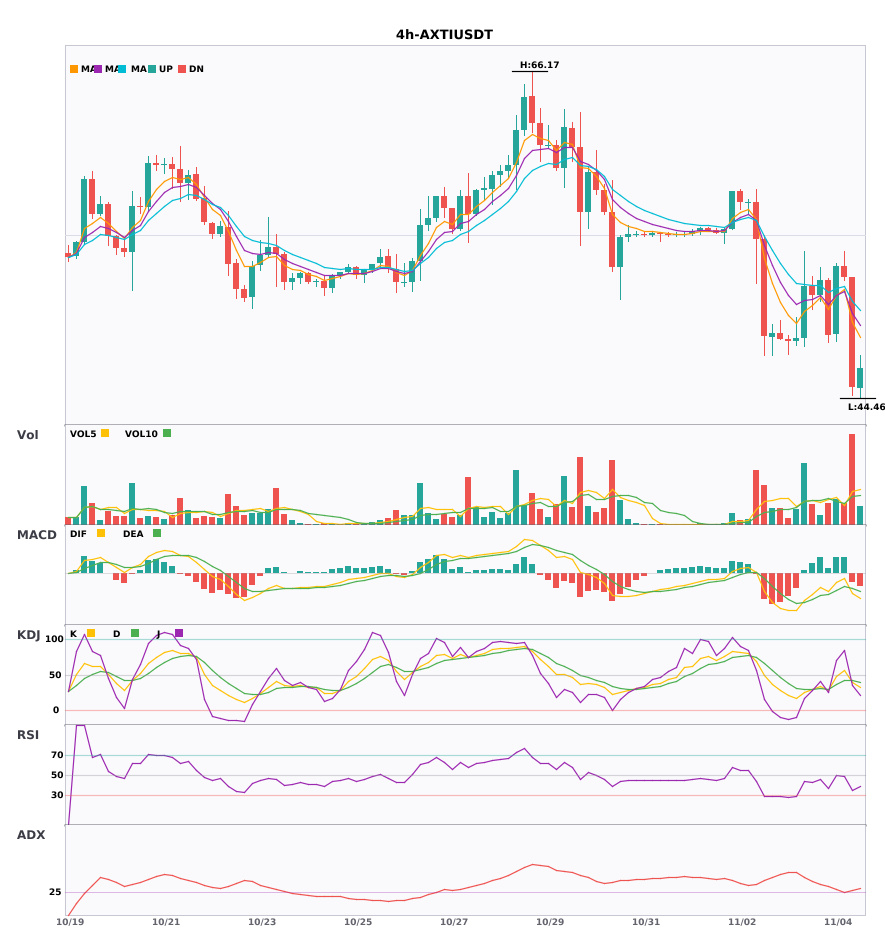
$IREN / $GLW / $AXTI 4-hour bearish signals, daily bearish trend confirmed 🔥
════════════════════
🟢 $IREN 4-hour bearish signal
⚠️ Technicals: Daily bearish confluence confirmed | 4-hour entry: MACD bearish crossover below zero, bearish momentum accelerating | EMA5 crossed below EMA8, turning bearish in the short term | KDJ weak, bears in control (K: 31.3, D: 41.2) | Volume surge (2.7x)
════════════════════
🟢 $GLW 4-hour bearish signal
⚠️ Technicals: Daily bearish confluence confirmed | 4-hour entry: MACD bearish crossover below zero, bearish momentum accelerating | EMA5 crossed below EMA8, turning bearish in the short term | KDJ bearish crossover, bearish outlook in the short term (K: 36.9, D: 44.3) | Volume surge (3.3x)
════════════════════
🟢 $AXTI 4-hour bearish signal
⚠️ Technicals: Daily bearish confluence confirmed | 4-hour entry: MACD bearish crossover below zero, bearish momentum accelerating | EMA5 crossed below EMA8, turning bearish in the short term | KDJ bearish crossover, bearish outlook in the short term (K: 39.5, D: 41.8) | Volume surge (3.2x)
════════════════════
🔔 Follow for first-hand market updates 🔔
#多周期共振 #IREN #GLW #AXTI
📌 When trading, watch for confirmation from the candlestick pattern
$IREN / $GLW / $AXTI 4-hour bearish signals, daily bearish trend confirmed 🔥
════════════════════
🟢 $IREN 4-hour bearish signal
⚠️ Technicals: Daily bearish confluence confirmed | 4-hour entry: MACD bearish crossover below zero, bearish momentum accelerating | EMA5 crossed below EMA8, turning bearish in the short term | KDJ weak, bears in control (K: 31.3, D: 41.2) | Volume surge (2.7x)
════════════════════
🟢 $GLW 4-hour bearish signal
⚠️ Technicals: Daily bearish confluence confirmed | 4-hour entry: MACD bearish crossover below zero, bearish momentum accelerating | EMA5 crossed below EMA8, turning bearish in the short term | KDJ bearish crossover, bearish outlook in the short term (K: 36.9, D: 44.3) | Volume surge (3.3x)
════════════════════
🟢 $AXTI 4-hour bearish signal
⚠️ Technicals: Daily bearish confluence confirmed | 4-hour entry: MACD bearish crossover below zero, bearish momentum accelerating | EMA5 crossed below EMA8, turning bearish in the short term | KDJ bearish crossover, bearish outlook in the short term (K: 39.5, D: 41.8) | Volume surge (3.2x)
════════════════════
🔔 Follow for first-hand market updates 🔔
#多周期共振 #IREN #GLW #AXTI
📌 When trading, watch for confirmation from the candlestick pattern
════════════════════
🟢 $IREN 4-hour bearish signal
⚠️ Technicals: Daily bearish confluence confirmed | 4-hour entry: MACD bearish crossover below zero, bearish momentum accelerating | EMA5 crossed below EMA8, turning bearish in the short term | KDJ weak, bears in control (K: 31.3, D: 41.2) | Volume surge (2.7x)
════════════════════
🟢 $GLW 4-hour bearish signal
⚠️ Technicals: Daily bearish confluence confirmed | 4-hour entry: MACD bearish crossover below zero, bearish momentum accelerating | EMA5 crossed below EMA8, turning bearish in the short term | KDJ bearish crossover, bearish outlook in the short term (K: 36.9, D: 44.3) | Volume surge (3.3x)
════════════════════
🟢 $AXTI 4-hour bearish signal
⚠️ Technicals: Daily bearish confluence confirmed | 4-hour entry: MACD bearish crossover below zero, bearish momentum accelerating | EMA5 crossed below EMA8, turning bearish in the short term | KDJ bearish crossover, bearish outlook in the short term (K: 39.5, D: 41.8) | Volume surge (3.2x)
════════════════════
🔔 Follow for first-hand market updates 🔔
#多周期共振 #IREN #GLW #AXTI
📌 When trading, watch for confirmation from the candlestick pattern
6

·
--
🔻 $AXTI SHORT 🔻
Entry: 51.0863 – 51.3937
SL: 53.4940
TP1: 49.3080
TP2: 48.0200
TP3: 46.4100
📈 Technical Outlook:
$AXTI is showing bearish pressure after losing strength near a key technical zone. The setup is supported by EMA trend is bearish, price is breaking below recent support, volume confirms stronger pressure. As long as price stays below the entry area, sellers may continue pushing toward the listed downside targets.
#AXTI #Crypto #BinanceSquare #Trading
🔻 $AXTI SHORT 🔻
Entry: 51.0863 – 51.3937
SL: 53.4940
TP1: 49.3080
TP2: 48.0200
TP3: 46.4100
📈 Technical Outlook:
$AXTI is showing bearish pressure after losing strength near a key technical zone. The setup is supported by EMA trend is bearish, price is breaking below recent support, volume confirms stronger pressure. As long as price stays below the entry area, sellers may continue pushing toward the listed downside targets.
#AXTI #Crypto #BinanceSquare #Trading
Entry: 51.0863 – 51.3937
SL: 53.4940
TP1: 49.3080
TP2: 48.0200
TP3: 46.4100
📈 Technical Outlook:
$AXTI is showing bearish pressure after losing strength near a key technical zone. The setup is supported by EMA trend is bearish, price is breaking below recent support, volume confirms stronger pressure. As long as price stays below the entry area, sellers may continue pushing toward the listed downside targets.
#AXTI #Crypto #BinanceSquare #Trading


·
--
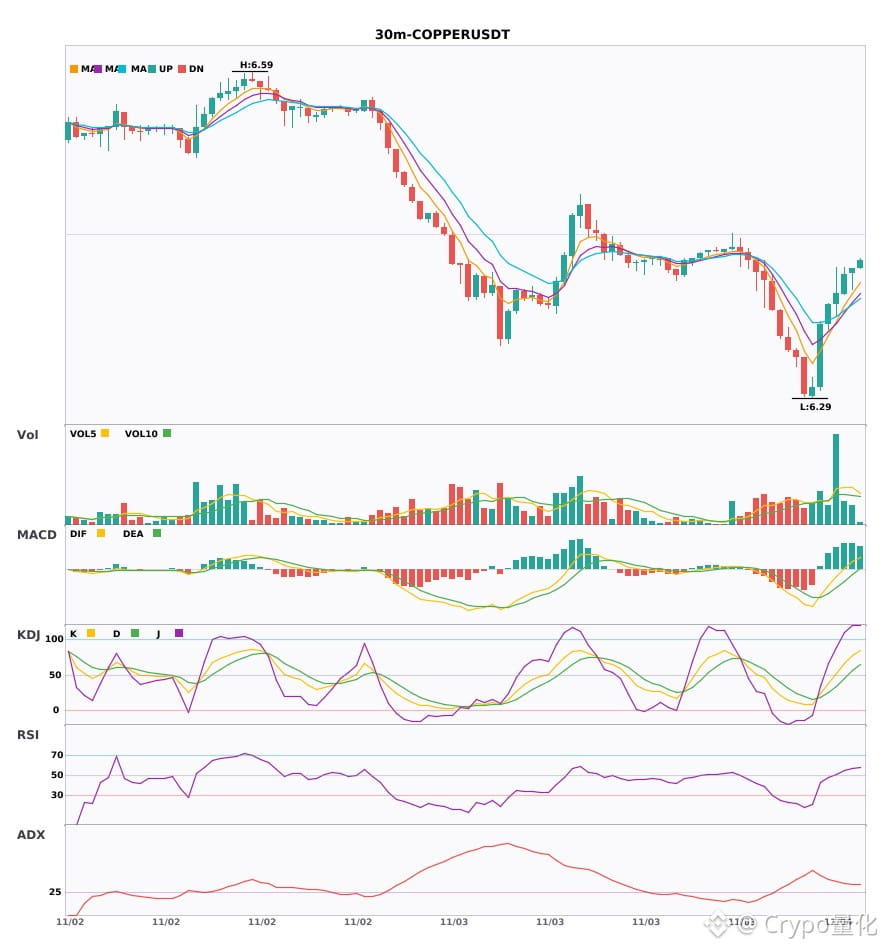
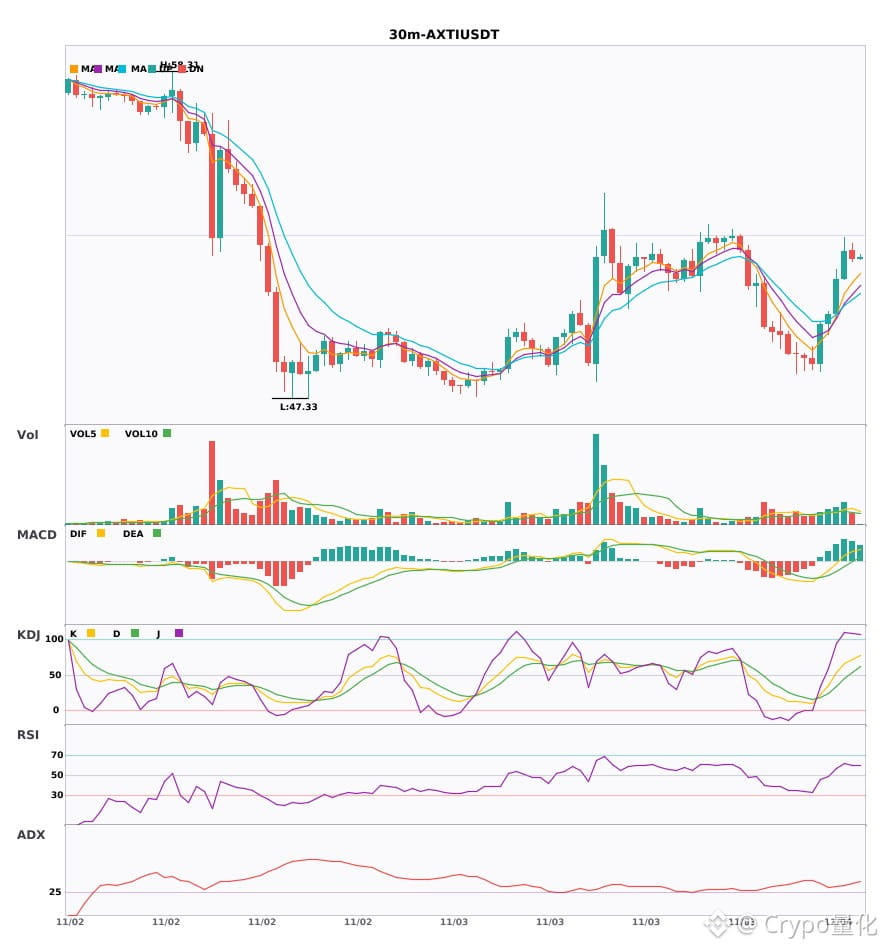
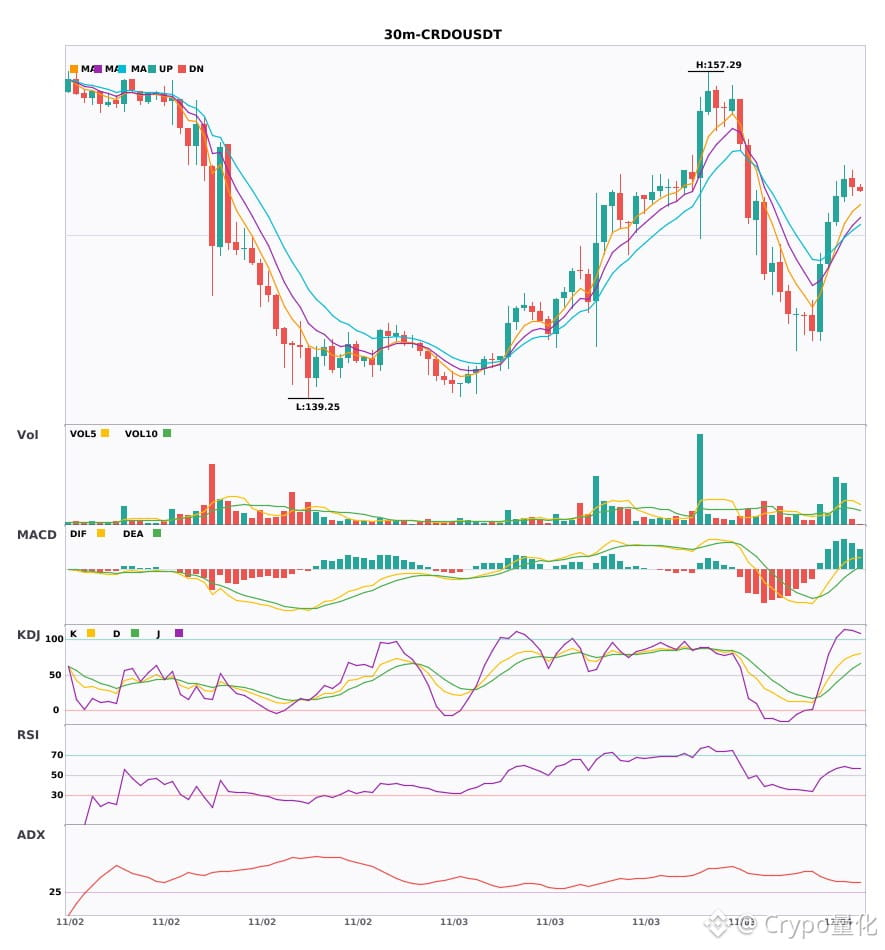
$COPPER / $AXTI / $CRDO 30-minute technicals are strengthening in sync—which has more explosive potential? 🔥
════════════════════
🔴 $COPPER 30-minute bullish signal
⚠️ Technicals: ADX(38): clear trending market | MACD DIF breaks above the zero line, signaling a bullish trend | Moving averages are converging and building momentum, with a directional move imminent | Volume surge (2.9x)
════════════════════
🔴 $AXTI 30-minute bullish signal
⚠️ Technicals: ADX(37): clear trending market | MACD DIF breaks above the zero line, signaling a bullish trend | EMA5 > EMA8 > EMA13, bullish alignment | Volume expands (1.7x)
════════════════════
🔴 $CRDO 30-minute bullish signal
⚠️ Technicals: ADX(40): clear trending market | MACD DIF breaks above the zero line, signaling a bullish trend | EMA5 > EMA8 > EMA13, bullish alignment | Volume surge (3.1x)
════════════════════
🔔 Follow for first-hand alerts on unusual market movements 🔔
#技术分析 #COPPER #AXTI #CRDO
📌 When trading, pay attention to whether the candlestick patterns align
$COPPER / $AXTI / $CRDO 30-minute technicals are strengthening in sync—which has more explosive potential? 🔥
════════════════════
🔴 $COPPER 30-minute bullish signal
⚠️ Technicals: ADX(38): clear trending market | MACD DIF breaks above the zero line, signaling a bullish trend | Moving averages are converging and building momentum, with a directional move imminent | Volume surge (2.9x)
════════════════════
🔴 $AXTI 30-minute bullish signal
⚠️ Technicals: ADX(37): clear trending market | MACD DIF breaks above the zero line, signaling a bullish trend | EMA5 > EMA8 > EMA13, bullish alignment | Volume expands (1.7x)
════════════════════
🔴 $CRDO 30-minute bullish signal
⚠️ Technicals: ADX(40): clear trending market | MACD DIF breaks above the zero line, signaling a bullish trend | EMA5 > EMA8 > EMA13, bullish alignment | Volume surge (3.1x)
════════════════════
🔔 Follow for first-hand alerts on unusual market movements 🔔
#技术分析 #COPPER #AXTI #CRDO
📌 When trading, pay attention to whether the candlestick patterns align
════════════════════
🔴 $COPPER 30-minute bullish signal
⚠️ Technicals: ADX(38): clear trending market | MACD DIF breaks above the zero line, signaling a bullish trend | Moving averages are converging and building momentum, with a directional move imminent | Volume surge (2.9x)
════════════════════
🔴 $AXTI 30-minute bullish signal
⚠️ Technicals: ADX(37): clear trending market | MACD DIF breaks above the zero line, signaling a bullish trend | EMA5 > EMA8 > EMA13, bullish alignment | Volume expands (1.7x)
════════════════════
🔴 $CRDO 30-minute bullish signal
⚠️ Technicals: ADX(40): clear trending market | MACD DIF breaks above the zero line, signaling a bullish trend | EMA5 > EMA8 > EMA13, bullish alignment | Volume surge (3.1x)
════════════════════
🔔 Follow for first-hand alerts on unusual market movements 🔔
#技术分析 #COPPER #AXTI #CRDO
📌 When trading, pay attention to whether the candlestick patterns align
7

·
--
🚀 📈 $AXTI SURGES THROUGH $58.20 BREAKOUT – BULLISH REBOUND!
Entry: 57.10-57.80 ⚡
Target: 58.50 🚀
Stop Loss: 56.90 ⚠️
Smart money is re‑entering the demand block around $57.4, snapping the last liquidity pool that held at $56.9. 📊 The price is testing the $58.20 ceiling with accelerating volume, a classic institutional push to clear the order block.
A clean break above $58.20 would unlock the next ladder of targets, starting at $58.50 and potentially extending to $59.50 as the market reclaims the previous swing high. ⚡ Keep eyes on the breakout candle and the order flow on the 4H chart. 💬 Are you positioning for the next leg or waiting for a retest? 👇
⚠️ Not financial advice. Always manage your risk. 🛡️
🏷️ #AXTI #LongSetup #Breakout #Crypto
🔥 💎
🚀 📈 $AXTI SURGES THROUGH $58.20 BREAKOUT – BULLISH REBOUND!
Entry: 57.10-57.80 ⚡
Target: 58.50 🚀
Stop Loss: 56.90 ⚠️
Smart money is re‑entering the demand block around $57.4, snapping the last liquidity pool that held at $56.9. 📊 The price is testing the $58.20 ceiling with accelerating volume, a classic institutional push to clear the order block.
A clean break above $58.20 would unlock the next ladder of targets, starting at $58.50 and potentially extending to $59.50 as the market reclaims the previous swing high. ⚡ Keep eyes on the breakout candle and the order flow on the 4H chart. 💬 Are you positioning for the next leg or waiting for a retest? 👇
⚠️ Not financial advice. Always manage your risk. 🛡️
🏷️ #AXTI #LongSetup #Breakout #Crypto
🔥 💎
Entry: 57.10-57.80 ⚡
Target: 58.50 🚀
Stop Loss: 56.90 ⚠️
Smart money is re‑entering the demand block around $57.4, snapping the last liquidity pool that held at $56.9. 📊 The price is testing the $58.20 ceiling with accelerating volume, a classic institutional push to clear the order block.
A clean break above $58.20 would unlock the next ladder of targets, starting at $58.50 and potentially extending to $59.50 as the market reclaims the previous swing high. ⚡ Keep eyes on the breakout candle and the order flow on the 4H chart. 💬 Are you positioning for the next leg or waiting for a retest? 👇
⚠️ Not financial advice. Always manage your risk. 🛡️
🏷️ #AXTI #LongSetup #Breakout #Crypto
🔥 💎
3

🚀 $AXTI BULLISH REBOUND TARGETING $59.5 BREAKOUT 📈
Entry: 57.10 ⚡
Target: 58.50 🚀
Stop Loss: 56.90 ⚠️
🦈 Smart money is carving a fresh demand zone between $57.10‑$57.80, swallowing sell pressure as volume spikes on the 4H chart. 📊 The $58.20 breakout line acts as a liquidity wall; a clean pierce could unleash a rapid climb toward the next resistance cluster.
⚡ Buyers are flashing bullish divergence on the RSI, and each retest tightens the order block, setting the stage for a potential swing to $59.50. 💡 Are you ready to ride this wave or waiting for the next liquidity sweep? 💬
⚠️ Not financial advice. Always manage your risk. 🛡️
🏷️ #AXTI #LongSetup #Bullish #Breakout #Crypto
🔥 💎
🚀 $AXTI BULLISH REBOUND TARGETING $59.5 BREAKOUT 📈
Entry: 57.10 ⚡
Target: 58.50 🚀
Stop Loss: 56.90 ⚠️
🦈 Smart money is carving a fresh demand zone between $57.10‑$57.80, swallowing sell pressure as volume spikes on the 4H chart. 📊 The $58.20 breakout line acts as a liquidity wall; a clean pierce could unleash a rapid climb toward the next resistance cluster.
⚡ Buyers are flashing bullish divergence on the RSI, and each retest tightens the order block, setting the stage for a potential swing to $59.50. 💡 Are you ready to ride this wave or waiting for the next liquidity sweep? 💬
⚠️ Not financial advice. Always manage your risk. 🛡️
🏷️ #AXTI #LongSetup #Bullish #Breakout #Crypto
🔥 💎
Entry: 57.10 ⚡
Target: 58.50 🚀
Stop Loss: 56.90 ⚠️
🦈 Smart money is carving a fresh demand zone between $57.10‑$57.80, swallowing sell pressure as volume spikes on the 4H chart. 📊 The $58.20 breakout line acts as a liquidity wall; a clean pierce could unleash a rapid climb toward the next resistance cluster.
⚡ Buyers are flashing bullish divergence on the RSI, and each retest tightens the order block, setting the stage for a potential swing to $59.50. 💡 Are you ready to ride this wave or waiting for the next liquidity sweep? 💬
⚠️ Not financial advice. Always manage your risk. 🛡️
🏷️ #AXTI #LongSetup #Bullish #Breakout #Crypto
🔥 💎
Yazdani 777:
Yr accuracy is 0 zeroo😂
2
6

⚡ $AXTI RECLAIMS $72 AFTER DEFENDING DEMAND — BREAKOUT EXPANSION IN PLAY! 🚀
Entry: 70.50 - 72.20 ⚡
Target: 75.00 / 78.00 / 82.00 🚀
Stop Loss: 68.00 ⚠️
After a sharp push off the 63 to 65 support block, $AXTI is flipping structure with higher lows and absorbing sell orders right at 72. 📊 Buyers are stepping in aggressively on the 4H timeframe, setting up a clean continuation sequence toward upper resistance.
📌 As long as price holds above the 70.50 pivot, momentum heavily favors the bulls pushing into fresh liquidity pools. 💡 Watching closely to see if volume surges on the confirmation above 72.20. 💬 Are you riding this reclaim or waiting for a retest before bidding? 👇
⚠️ Not financial advice. Always manage your risk. 🛡️
🏷️ #AXTI #LongSetup #Breakout #Crypto #Altcoins
🔥 💎
⚡ $AXTI RECLAIMS $72 AFTER DEFENDING DEMAND — BREAKOUT EXPANSION IN PLAY! 🚀
Entry: 70.50 - 72.20 ⚡
Target: 75.00 / 78.00 / 82.00 🚀
Stop Loss: 68.00 ⚠️
After a sharp push off the 63 to 65 support block, $AXTI is flipping structure with higher lows and absorbing sell orders right at 72. 📊 Buyers are stepping in aggressively on the 4H timeframe, setting up a clean continuation sequence toward upper resistance.
📌 As long as price holds above the 70.50 pivot, momentum heavily favors the bulls pushing into fresh liquidity pools. 💡 Watching closely to see if volume surges on the confirmation above 72.20. 💬 Are you riding this reclaim or waiting for a retest before bidding? 👇
⚠️ Not financial advice. Always manage your risk. 🛡️
🏷️ #AXTI #LongSetup #Breakout #Crypto #Altcoins
🔥 💎
Entry: 70.50 - 72.20 ⚡
Target: 75.00 / 78.00 / 82.00 🚀
Stop Loss: 68.00 ⚠️
After a sharp push off the 63 to 65 support block, $AXTI is flipping structure with higher lows and absorbing sell orders right at 72. 📊 Buyers are stepping in aggressively on the 4H timeframe, setting up a clean continuation sequence toward upper resistance.
📌 As long as price holds above the 70.50 pivot, momentum heavily favors the bulls pushing into fresh liquidity pools. 💡 Watching closely to see if volume surges on the confirmation above 72.20. 💬 Are you riding this reclaim or waiting for a retest before bidding? 👇
⚠️ Not financial advice. Always manage your risk. 🛡️
🏷️ #AXTI #LongSetup #Breakout #Crypto #Altcoins
🔥 💎
2
·
--
Bullish
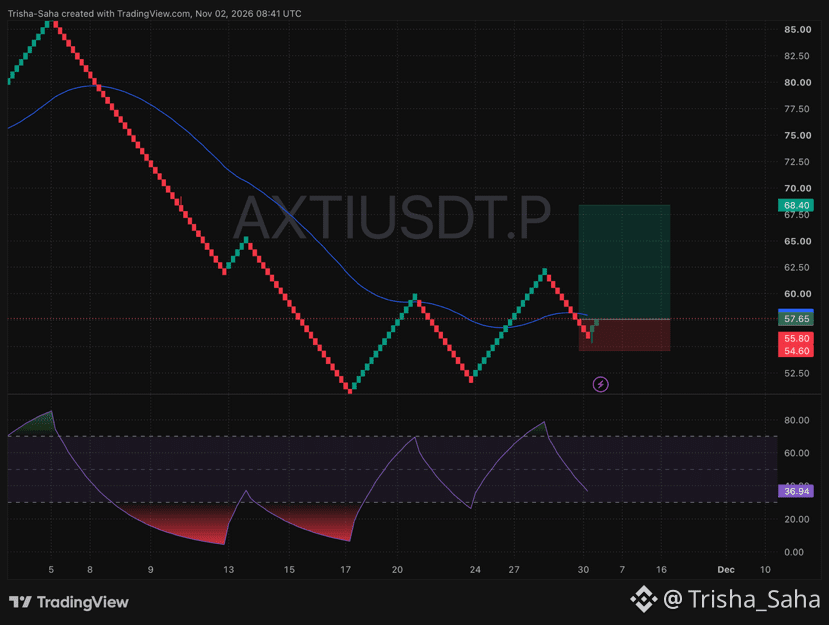
🦏 $AXTI JUST LOCKED IN A THIRD HIGHER LOW — EXPLOSIVE BREAKOUT READY TO RIP! 🎰
📍 Trade Setup:
• Entry Zone: $57.00 – $57.65
• Stop Loss: $54.60
• Target: $68.40
⚙️ Chart Analysis:
• Buyers have stepped in higher on three straight dips, building a rock-solid launchpad right at $55.80.
• Two fresh green candles just printed off the bottom and pushed price right up to test the blue trend line at $57.65.
• Breaking and holding above $57.65 opens a wide-open highway straight past the recent peak toward $68.40.
🛡️ Fortress Rule: The moment your trade climbs +3% to +4% in profit, move your Stop Loss straight to Break-Even so you are playing with zero risk!
My bags are loaded and I'm already in this play. Who is riding this breakout wave with me? Drop a "🚀" below! 👇
#AXTI #AXTIUSDT #CryptoBreakout #BinanceSquare
{future}(AXTIUSDT)
🦏 $AXTI JUST LOCKED IN A THIRD HIGHER LOW — EXPLOSIVE BREAKOUT READY TO RIP! 🎰
📍 Trade Setup:
• Entry Zone: $57.00 – $57.65
• Stop Loss: $54.60
• Target: $68.40
⚙️ Chart Analysis:
• Buyers have stepped in higher on three straight dips, building a rock-solid launchpad right at $55.80.
• Two fresh green candles just printed off the bottom and pushed price right up to test the blue trend line at $57.65.
• Breaking and holding above $57.65 opens a wide-open highway straight past the recent peak toward $68.40.
🛡️ Fortress Rule: The moment your trade climbs +3% to +4% in profit, move your Stop Loss straight to Break-Even so you are playing with zero risk!
My bags are loaded and I'm already in this play. Who is riding this breakout wave with me? Drop a "🚀" below! 👇
#AXTI #AXTIUSDT #CryptoBreakout #BinanceSquare
📍 Trade Setup:
• Entry Zone: $57.00 – $57.65
• Stop Loss: $54.60
• Target: $68.40
⚙️ Chart Analysis:
• Buyers have stepped in higher on three straight dips, building a rock-solid launchpad right at $55.80.
• Two fresh green candles just printed off the bottom and pushed price right up to test the blue trend line at $57.65.
• Breaking and holding above $57.65 opens a wide-open highway straight past the recent peak toward $68.40.
🛡️ Fortress Rule: The moment your trade climbs +3% to +4% in profit, move your Stop Loss straight to Break-Even so you are playing with zero risk!
My bags are loaded and I'm already in this play. Who is riding this breakout wave with me? Drop a "🚀" below! 👇
#AXTI #AXTIUSDT #CryptoBreakout #BinanceSquare
135
·
--
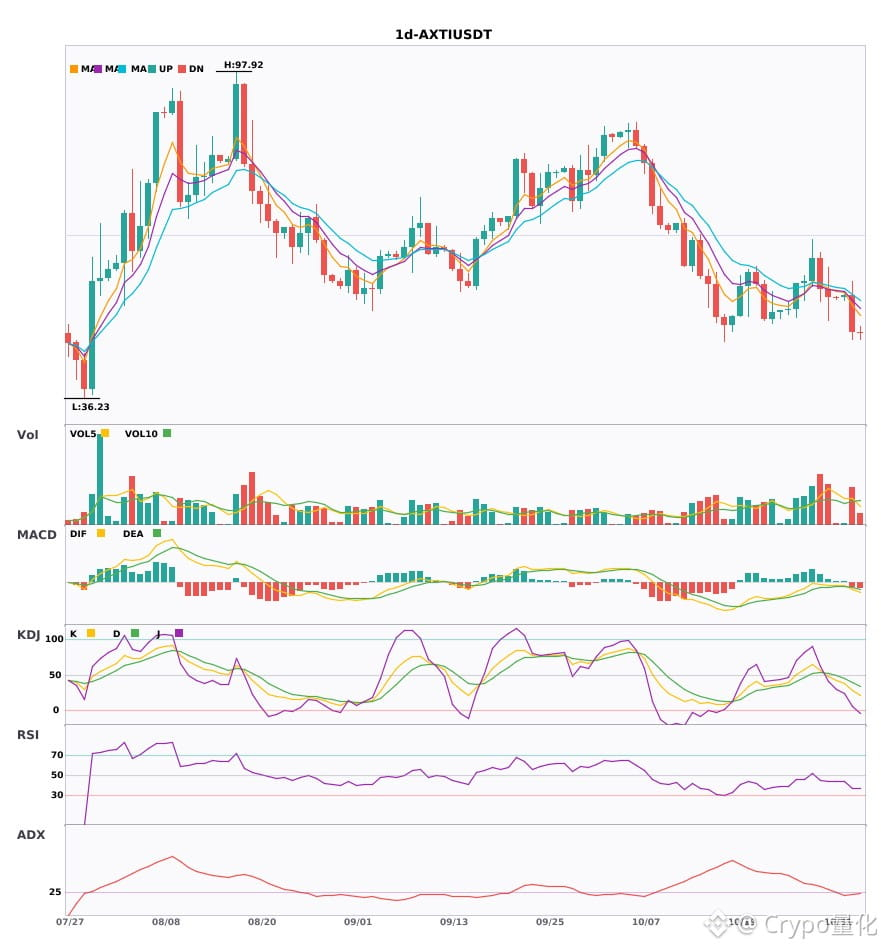
$AXTI Daily timeframe is leaning bearish, with short-term resistance 🔥
════════════════════
🟢 $AXTI Daily bearish signal
⚠️Technical analysis: ADX(22) Trend is forming, offering a potential entry | MACD bearish crossover below zero, bearish momentum accelerating | EMA5 < EMA8 < EMA13, bearish alignment | KDJ is trending weakly, favoring bears (K is 28.2, D is 39.6) | Volume increased (1.6x)
════════════════════
🔔 Follow for first-hand updates on unusual market movements 🔔
#技术分析 #AXTI
📌 When trading, watch whether the candlestick pattern confirms
$AXTI Daily timeframe is leaning bearish, with short-term resistance 🔥
════════════════════
🟢 $AXTI Daily bearish signal
⚠️Technical analysis: ADX(22) Trend is forming, offering a potential entry | MACD bearish crossover below zero, bearish momentum accelerating | EMA5 < EMA8 < EMA13, bearish alignment | KDJ is trending weakly, favoring bears (K is 28.2, D is 39.6) | Volume increased (1.6x)
════════════════════
🔔 Follow for first-hand updates on unusual market movements 🔔
#技术分析 #AXTI
📌 When trading, watch whether the candlestick pattern confirms
════════════════════
🟢 $AXTI Daily bearish signal
⚠️Technical analysis: ADX(22) Trend is forming, offering a potential entry | MACD bearish crossover below zero, bearish momentum accelerating | EMA5 < EMA8 < EMA13, bearish alignment | KDJ is trending weakly, favoring bears (K is 28.2, D is 39.6) | Volume increased (1.6x)
════════════════════
🔔 Follow for first-hand updates on unusual market movements 🔔
#技术分析 #AXTI
📌 When trading, watch whether the candlestick pattern confirms
13

·
--
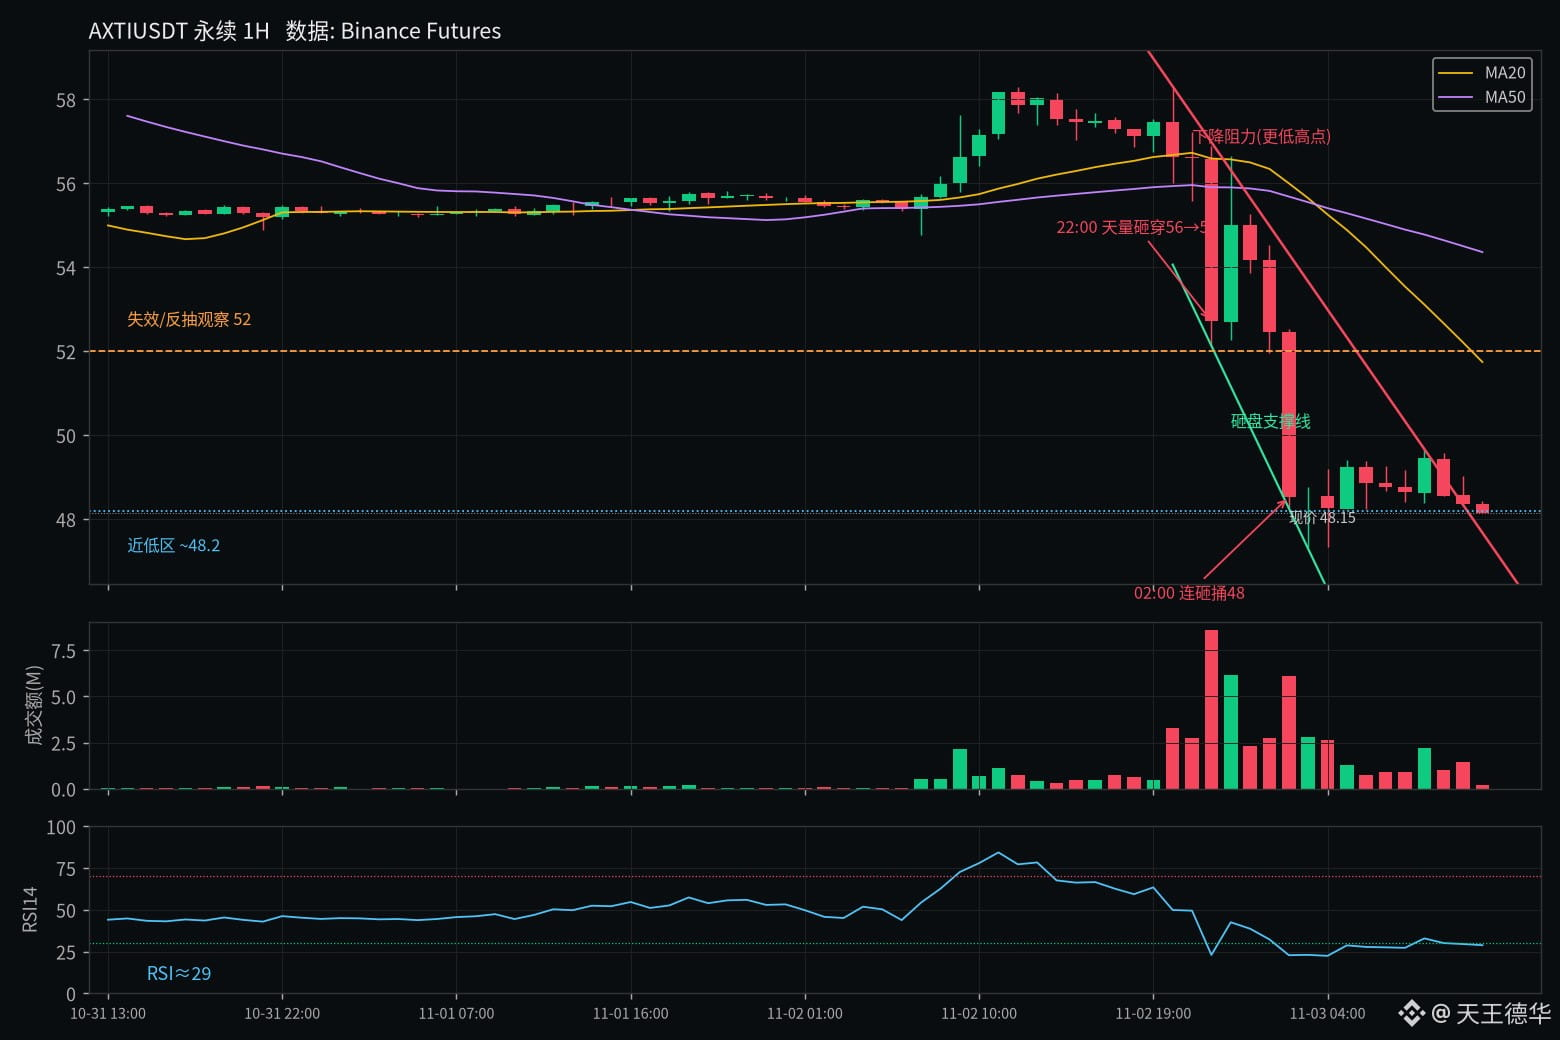
$AXTI Last night's sell-off was pretty clean. At 22:00, huge volume pushed the price straight from around 56 to 52; at 02:00, it was dumped further to 48, with RSI falling below 30 and still grinding lower.
OI value fell from around 6 million to 4.8 million. Price and open interest both declined, which looks more like distribution than a squeeze. The current price is still below MA20 (around 52), so don't rush to buy the dip unless a weak rebound can reclaim 52. A break below today's low of 48 would make things look even worse.
Not investment advice; do your own chart analysis.
#AXTI $AXTIUSDT
$AXTI Last night's sell-off was pretty clean. At 22:00, huge volume pushed the price straight from around 56 to 52; at 02:00, it was dumped further to 48, with RSI falling below 30 and still grinding lower.
OI value fell from around 6 million to 4.8 million. Price and open interest both declined, which looks more like distribution than a squeeze. The current price is still below MA20 (around 52), so don't rush to buy the dip unless a weak rebound can reclaim 52. A break below today's low of 48 would make things look even worse.
Not investment advice; do your own chart analysis.
#AXTI $AXTIUSDT
OI value fell from around 6 million to 4.8 million. Price and open interest both declined, which looks more like distribution than a squeeze. The current price is still below MA20 (around 52), so don't rush to buy the dip unless a weak rebound can reclaim 52. A break below today's low of 48 would make things look even worse.
Not investment advice; do your own chart analysis.
#AXTI $AXTIUSDT
381

·
--
AXTI fell 13.67% in 24 hours, yet aggressive buyers still have the upper hand—that’s where the disagreement lies right now.
Binance TradFi Perpetuals (traditional financial instruments, with high gap risk outside trading hours) | AXTI remains weak intraday; for a recovery, first watch whether selling pressure eases. Current price is around 48.44, with 24-hour trading volume of about 49.5795 million; the 30m volume ratio is only 0.2x, indicating subdued participation. Market positioning: 64% of accounts are long; the aggressive buy/sell ratio is 1.25 (aggressive buying leads despite the price decline); 30m open interest is down 1.0%; funding rate is +0.0141%.
Reference indicators: The 30m RSI is 23.45, in oversold territory, suggesting short-term panic is already elevated; the 30m ATR trend-band reference level is 51.995908. The current price is below this level, indicating that the trend support level is coming under pressure.
The disagreement here is quite specific: some expect a continued breakdown, while others expect a recovery from panic. I’m more interested in whether the aggressive buy/sell ratio of 1.25 can stay above 1 and help stabilize the price. Without that, even a sharp bounce could easily turn into a weak recovery.
#AXTI #AbnormalMoveAlert
AXTI fell 13.67% in 24 hours, yet aggressive buyers still have the upper hand—that’s where the disagreement lies right now.
Binance TradFi Perpetuals (traditional financial instruments, with high gap risk outside trading hours) | AXTI remains weak intraday; for a recovery, first watch whether selling pressure eases. Current price is around 48.44, with 24-hour trading volume of about 49.5795 million; the 30m volume ratio is only 0.2x, indicating subdued participation. Market positioning: 64% of accounts are long; the aggressive buy/sell ratio is 1.25 (aggressive buying leads despite the price decline); 30m open interest is down 1.0%; funding rate is +0.0141%.
Reference indicators: The 30m RSI is 23.45, in oversold territory, suggesting short-term panic is already elevated; the 30m ATR trend-band reference level is 51.995908. The current price is below this level, indicating that the trend support level is coming under pressure.
The disagreement here is quite specific: some expect a continued breakdown, while others expect a recovery from panic. I’m more interested in whether the aggressive buy/sell ratio of 1.25 can stay above 1 and help stabilize the price. Without that, even a sharp bounce could easily turn into a weak recovery.
#AXTI #AbnormalMoveAlert
Binance TradFi Perpetuals (traditional financial instruments, with high gap risk outside trading hours) | AXTI remains weak intraday; for a recovery, first watch whether selling pressure eases. Current price is around 48.44, with 24-hour trading volume of about 49.5795 million; the 30m volume ratio is only 0.2x, indicating subdued participation. Market positioning: 64% of accounts are long; the aggressive buy/sell ratio is 1.25 (aggressive buying leads despite the price decline); 30m open interest is down 1.0%; funding rate is +0.0141%.
Reference indicators: The 30m RSI is 23.45, in oversold territory, suggesting short-term panic is already elevated; the 30m ATR trend-band reference level is 51.995908. The current price is below this level, indicating that the trend support level is coming under pressure.
The disagreement here is quite specific: some expect a continued breakdown, while others expect a recovery from panic. I’m more interested in whether the aggressive buy/sell ratio of 1.25 can stay above 1 and help stabilize the price. Without that, even a sharp bounce could easily turn into a weak recovery.
#AXTI #AbnormalMoveAlert
62
·
--
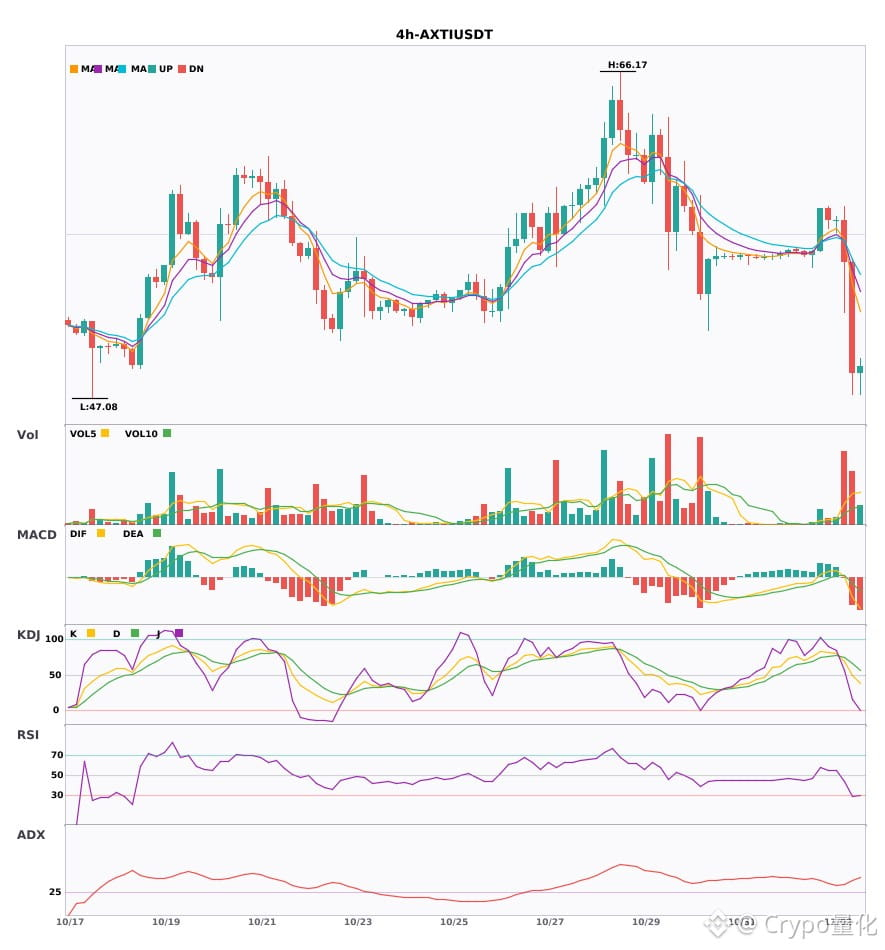
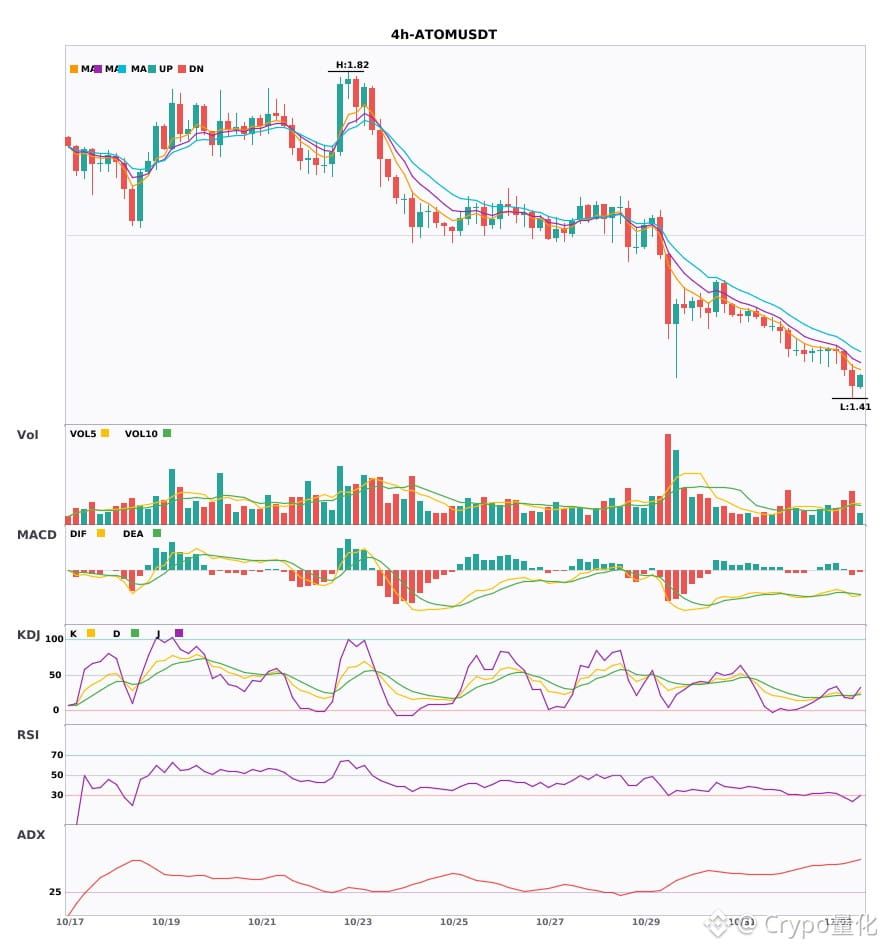
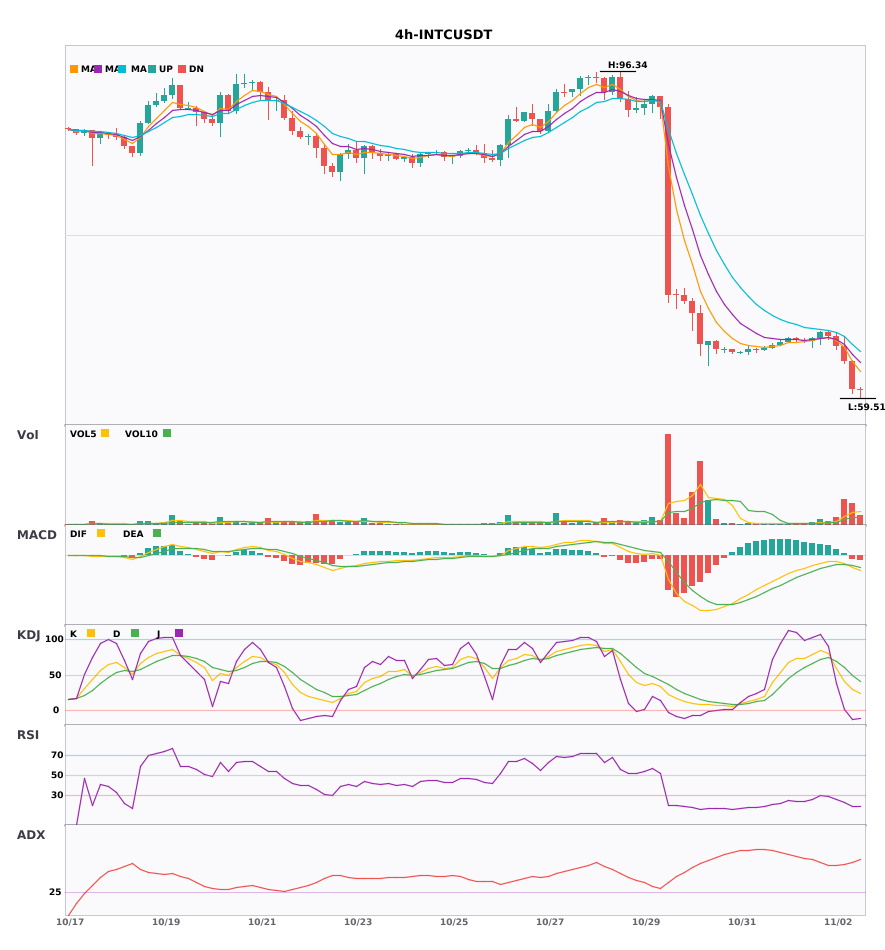
$AXTI / $ATOM / $INTC 4-hour bearish convergence, bearish signals appearing simultaneously🔥
════════════════════
🟢 $AXTI 4-hour bearish signal
⚠️Technical analysis: ADX(42) indicates a clear trending market | MACD DIF falls below the zero line, trend turns bearish | EMA5 crosses below EMA8, short-term trend turns bearish | Volume surge (6.7x)
════════════════════
🟢 $ATOM 4-hour bearish signal
⚠️Technical analysis: ADX(62) indicates a very strong trend (watch for an overheated pullback) | MACD bearish crossover below zero, bearish momentum accelerating | EMA5 < EMA8 < EMA13, bearish alignment | KDJ trending weakly, bears in control (K: 19.4, D: 20.7) | Volume increases (1.6x)
════════════════════
🟢 $INTC 4-hour bearish signal
⚠️Technical analysis: ADX(55) indicates a very strong trend (watch for an overheated pullback) | MACD bearish crossover below zero, bearish momentum accelerating | EMA5 < EMA8 < EMA13, bearish alignment | KDJ trending weakly, bears in control (K: 29.2, D: 49.6) | Volume surge (4.9x)
════════════════════
🔔 Follow for the latest market movements 🔔
#技术分析 #AXTI #ATOM #INTC
📌 When trading, check whether the candlestick patterns confirm
$AXTI / $ATOM / $INTC 4-hour bearish convergence, bearish signals appearing simultaneously🔥
════════════════════
🟢 $AXTI 4-hour bearish signal
⚠️Technical analysis: ADX(42) indicates a clear trending market | MACD DIF falls below the zero line, trend turns bearish | EMA5 crosses below EMA8, short-term trend turns bearish | Volume surge (6.7x)
════════════════════
🟢 $ATOM 4-hour bearish signal
⚠️Technical analysis: ADX(62) indicates a very strong trend (watch for an overheated pullback) | MACD bearish crossover below zero, bearish momentum accelerating | EMA5 < EMA8 < EMA13, bearish alignment | KDJ trending weakly, bears in control (K: 19.4, D: 20.7) | Volume increases (1.6x)
════════════════════
🟢 $INTC 4-hour bearish signal
⚠️Technical analysis: ADX(55) indicates a very strong trend (watch for an overheated pullback) | MACD bearish crossover below zero, bearish momentum accelerating | EMA5 < EMA8 < EMA13, bearish alignment | KDJ trending weakly, bears in control (K: 29.2, D: 49.6) | Volume surge (4.9x)
════════════════════
🔔 Follow for the latest market movements 🔔
#技术分析 #AXTI #ATOM #INTC
📌 When trading, check whether the candlestick patterns confirm
════════════════════
🟢 $AXTI 4-hour bearish signal
⚠️Technical analysis: ADX(42) indicates a clear trending market | MACD DIF falls below the zero line, trend turns bearish | EMA5 crosses below EMA8, short-term trend turns bearish | Volume surge (6.7x)
════════════════════
🟢 $ATOM 4-hour bearish signal
⚠️Technical analysis: ADX(62) indicates a very strong trend (watch for an overheated pullback) | MACD bearish crossover below zero, bearish momentum accelerating | EMA5 < EMA8 < EMA13, bearish alignment | KDJ trending weakly, bears in control (K: 19.4, D: 20.7) | Volume increases (1.6x)
════════════════════
🟢 $INTC 4-hour bearish signal
⚠️Technical analysis: ADX(55) indicates a very strong trend (watch for an overheated pullback) | MACD bearish crossover below zero, bearish momentum accelerating | EMA5 < EMA8 < EMA13, bearish alignment | KDJ trending weakly, bears in control (K: 29.2, D: 49.6) | Volume surge (4.9x)
════════════════════
🔔 Follow for the latest market movements 🔔
#技术分析 #AXTI #ATOM #INTC
📌 When trading, check whether the candlestick patterns confirm
16

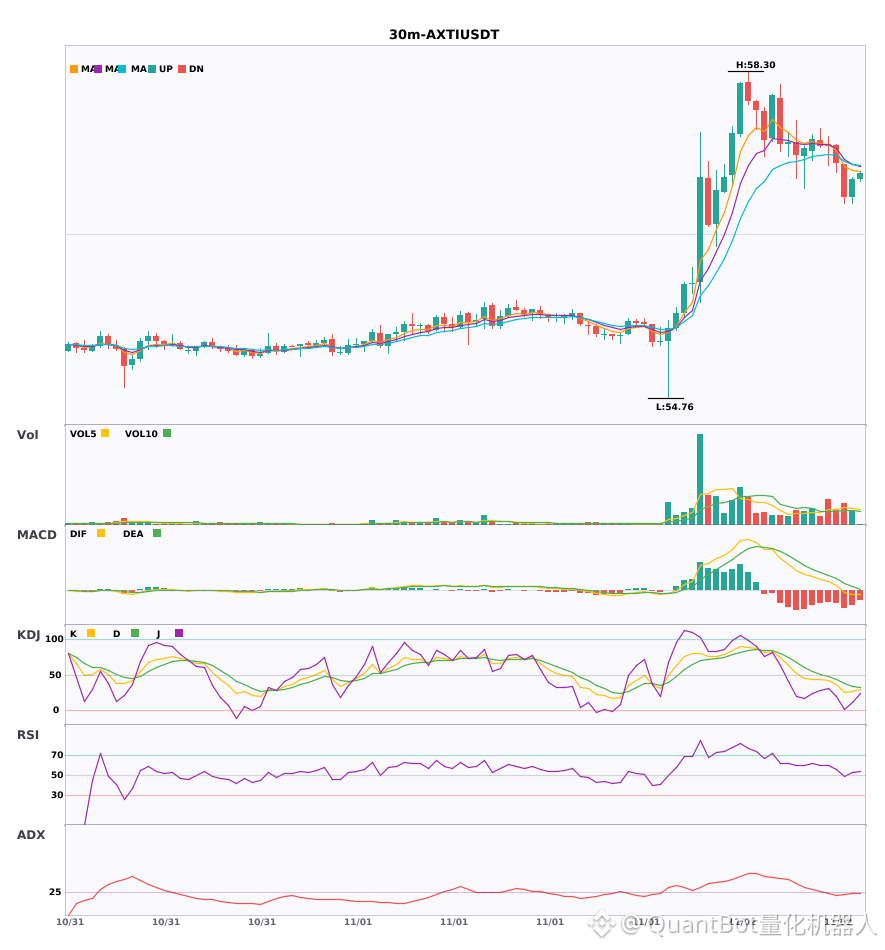
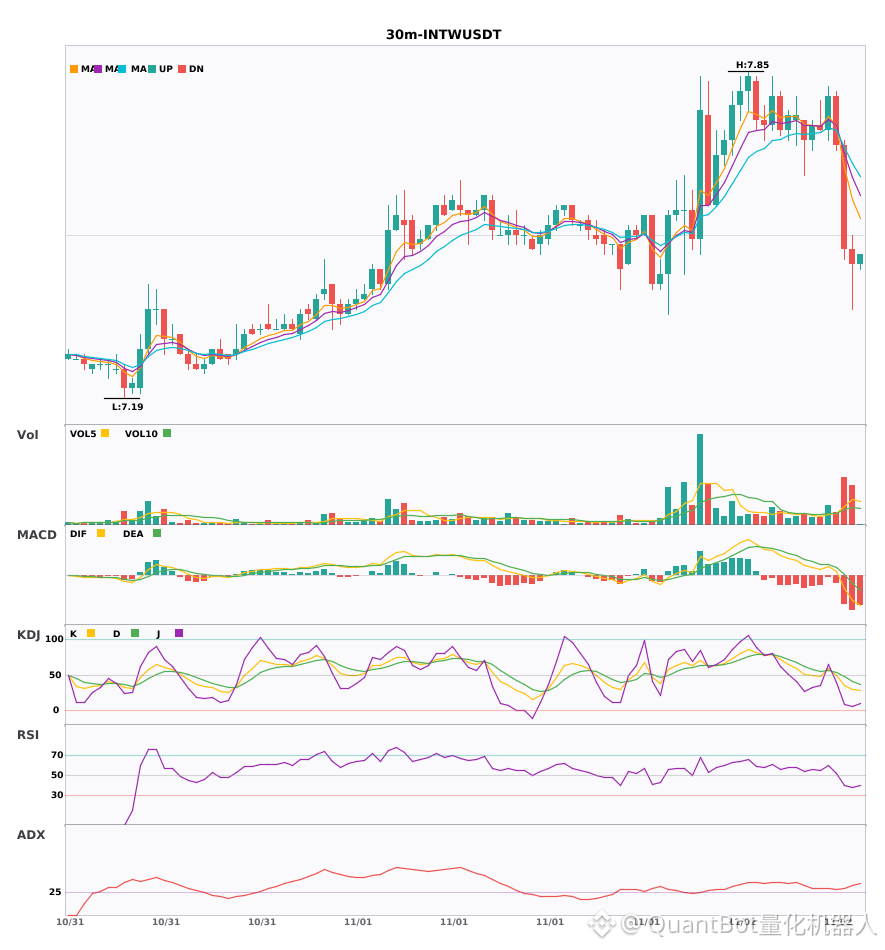
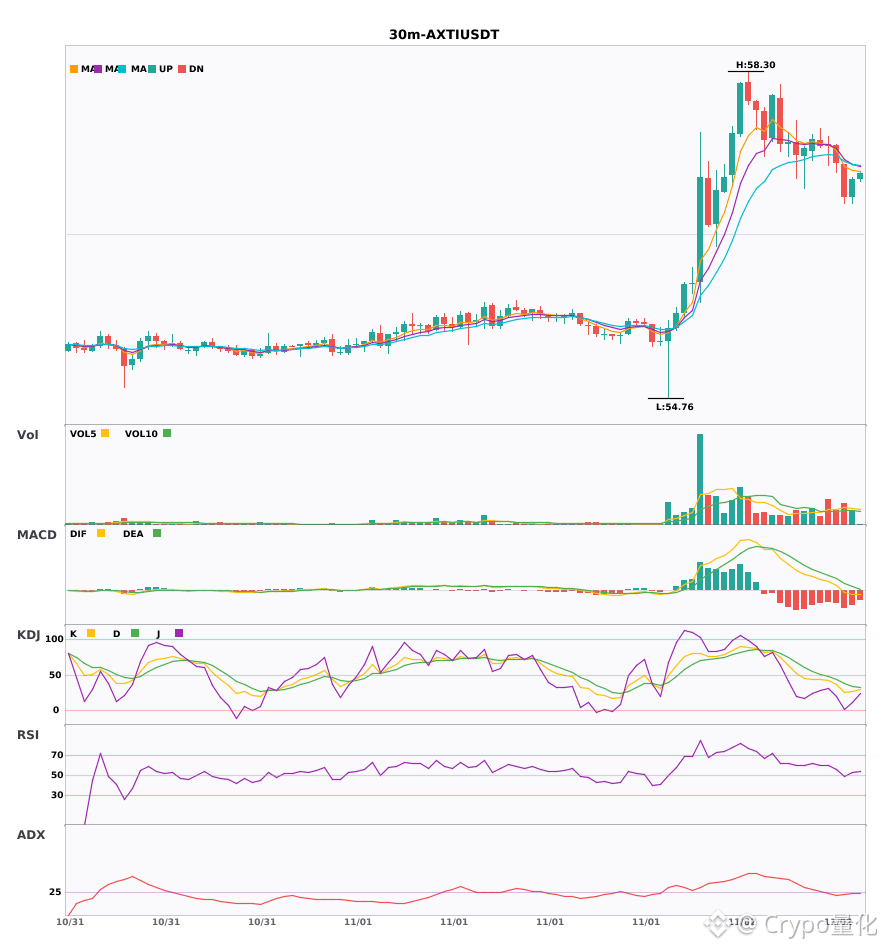
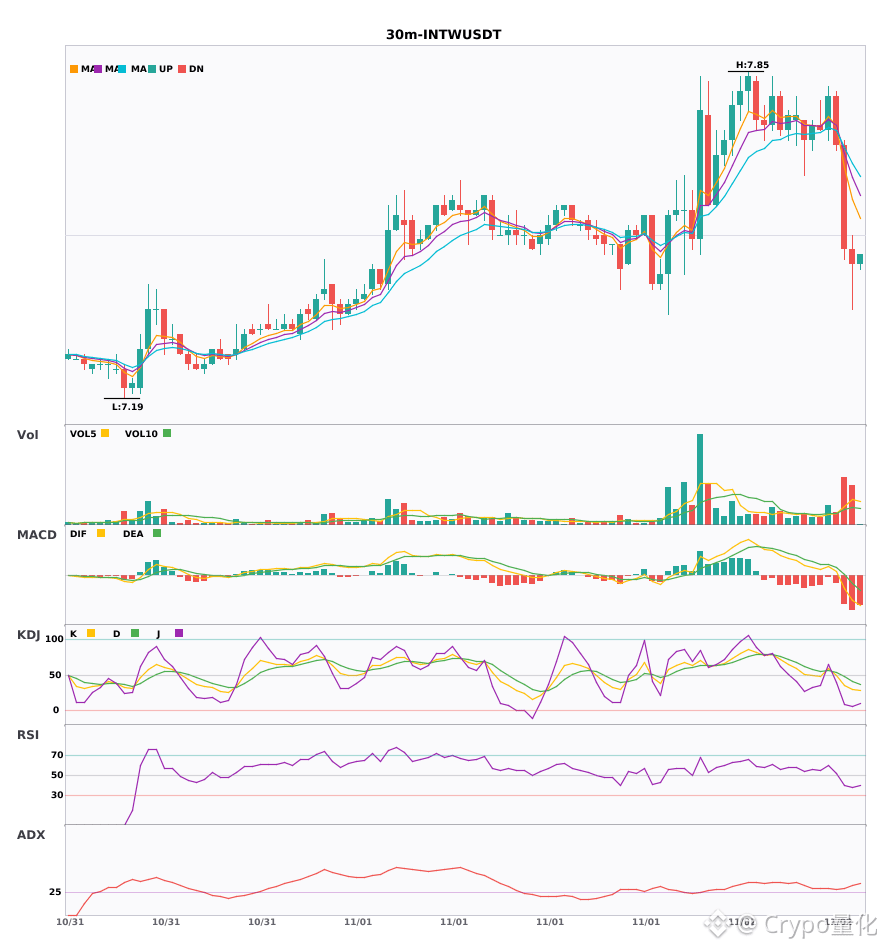
$AXTI / $INTW 30-minute resonance turns bearish, with bearish signals appearing simultaneously
📉 $AXTI | 30-minute bearish signal
━━━━━━━━━━━━━━━━━━
Technical analysis: ADX(25): Trend is forming; participation is possible | MACD is bearish; trend is weak and momentum is fading | EMA5 < EMA8 < EMA13: Bearish alignment | KDJ is weak, with bears in control (K: 26.7, D: 34.2) | Volume increased (1.5x)
Price change: 0.3500%
📉 $INTW | 30-minute bearish signal
━━━━━━━━━━━━━━━━━━
Technical analysis: ADX(30): Trend is forming; participation is possible | MACD DIF fell below the zero line; trend has turned bearish | EMA5 < EMA8 < EMA13: Bearish alignment | KDJ is weak, with bears in control (K: 34.6, D: 47.3) | Volume surged (3.1x)
Price change: -2.7300%
━━━━━━━━━━━━━━━━━━
#技术分析 #AXTI #INTW
📌 The above is for reference only and does not constitute investment advice
$AXTI / $INTW 30-minute resonance turns bearish, with bearish signals appearing simultaneously
📉 $AXTI | 30-minute bearish signal
━━━━━━━━━━━━━━━━━━
Technical analysis: ADX(25): Trend is forming; participation is possible | MACD is bearish; trend is weak and momentum is fading | EMA5 < EMA8 < EMA13: Bearish alignment | KDJ is weak, with bears in control (K: 26.7, D: 34.2) | Volume increased (1.5x)
Price change: 0.3500%
📉 $INTW | 30-minute bearish signal
━━━━━━━━━━━━━━━━━━
Technical analysis: ADX(30): Trend is forming; participation is possible | MACD DIF fell below the zero line; trend has turned bearish | EMA5 < EMA8 < EMA13: Bearish alignment | KDJ is weak, with bears in control (K: 34.6, D: 47.3) | Volume surged (3.1x)
Price change: -2.7300%
━━━━━━━━━━━━━━━━━━
#技术分析 #AXTI #INTW
📌 The above is for reference only and does not constitute investment advice
📉 $AXTI | 30-minute bearish signal
━━━━━━━━━━━━━━━━━━
Technical analysis: ADX(25): Trend is forming; participation is possible | MACD is bearish; trend is weak and momentum is fading | EMA5 < EMA8 < EMA13: Bearish alignment | KDJ is weak, with bears in control (K: 26.7, D: 34.2) | Volume increased (1.5x)
Price change: 0.3500%
📉 $INTW | 30-minute bearish signal
━━━━━━━━━━━━━━━━━━
Technical analysis: ADX(30): Trend is forming; participation is possible | MACD DIF fell below the zero line; trend has turned bearish | EMA5 < EMA8 < EMA13: Bearish alignment | KDJ is weak, with bears in control (K: 34.6, D: 47.3) | Volume surged (3.1x)
Price change: -2.7300%
━━━━━━━━━━━━━━━━━━
#技术分析 #AXTI #INTW
📌 The above is for reference only and does not constitute investment advice
13
·
--
2 30-minute bearish alerts: $AXTI / $INTW🔥
════════════════════
🟢 $AXTI 30-minute bearish signal
⚠️Technical analysis: ADX(25) Trend is forming; participation is possible | MACD is bearish, trend is weak, momentum is fading | EMA5 < EMA8 < EMA13, bearish alignment | KDJ is weak, bears are dominant (K: 26.7, D: 34.2) | Volume increased (1.5x)
════════════════════
🟢 $INTW 30-minute bearish signal
⚠️Technical analysis: ADX(30) Trend is forming; participation is possible | MACD DIF fell below the zero line; trend has turned bearish | EMA5 < EMA8 < EMA13, bearish alignment | KDJ is weak, bears are dominant (K: 34.6, D: 47.3) | Volume surged (3.1x)
════════════════════
🔔 Follow for the latest market movements 🔔
#技术分析 #AXTI #INTW
📌 When trading, pay attention to whether the candlestick pattern meets expectations
2 30-minute bearish alerts: $AXTI / $INTW 🔥
════════════════════
🟢 $AXTI 30-minute bearish signal
⚠️Technical analysis: ADX(25) Trend is forming; participation is possible | MACD is bearish, trend is weak, momentum is fading | EMA5 < EMA8 < EMA13, bearish alignment | KDJ is weak, bears are dominant (K: 26.7, D: 34.2) | Volume increased (1.5x)
════════════════════
🟢 $INTW 30-minute bearish signal
⚠️Technical analysis: ADX(30) Trend is forming; participation is possible | MACD DIF fell below the zero line; trend has turned bearish | EMA5 < EMA8 < EMA13, bearish alignment | KDJ is weak, bears are dominant (K: 34.6, D: 47.3) | Volume surged (3.1x)
════════════════════
🔔 Follow for the latest market movements 🔔
#技术分析 #AXTI #INTW
📌 When trading, pay attention to whether the candlestick pattern meets expectations
════════════════════
🟢 $AXTI 30-minute bearish signal
⚠️Technical analysis: ADX(25) Trend is forming; participation is possible | MACD is bearish, trend is weak, momentum is fading | EMA5 < EMA8 < EMA13, bearish alignment | KDJ is weak, bears are dominant (K: 26.7, D: 34.2) | Volume increased (1.5x)
════════════════════
🟢 $INTW 30-minute bearish signal
⚠️Technical analysis: ADX(30) Trend is forming; participation is possible | MACD DIF fell below the zero line; trend has turned bearish | EMA5 < EMA8 < EMA13, bearish alignment | KDJ is weak, bears are dominant (K: 34.6, D: 47.3) | Volume surged (3.1x)
════════════════════
🔔 Follow for the latest market movements 🔔
#技术分析 #AXTI #INTW
📌 When trading, pay attention to whether the candlestick pattern meets expectations
7
Log in to explore more content
Join global crypto users on Binance Square
⚡️ Get latest and useful information about crypto.
💬 Trusted by the world’s largest crypto exchange.
👍 Discover real insights from verified creators.
Email / Phone number
Trending Topics
1
#BinanceReopensWithdrawalsForMoreAssets
1M views
5,519 Discussing
2
#AnthropicIPOValuationDoubts
8,617 views
261 Discussing
3
#UkraineCentralBankOpposesCurrentCryptoAssetBill
0 views
4 Discussing
4
#CoreScientificExpectsToExitBitcoinMiningByYearEnd2026
0 views
0 Discussing
5
#USStocksSlipandCryptoMarketUnderBroadPressure
102,473 views
685 Discussing
6
#USStocksSufferSteepestRoutSince2020
18,083 views
137 Discussing
7
#StrategySTRCResumesIssuanceAfterOver170Days
50,249 views
677 Discussing
8
#Nasdaq100Tumbles6%
26,723 views
183 Discussing
9
#GreekParliamentPasses10%CryptoCapitalGainsTaxBill
2,147 views
83 Discussing
10
#KospiSlideTriggersCircuitBreaker
4,722 views
66 Discussing