
Key Summary
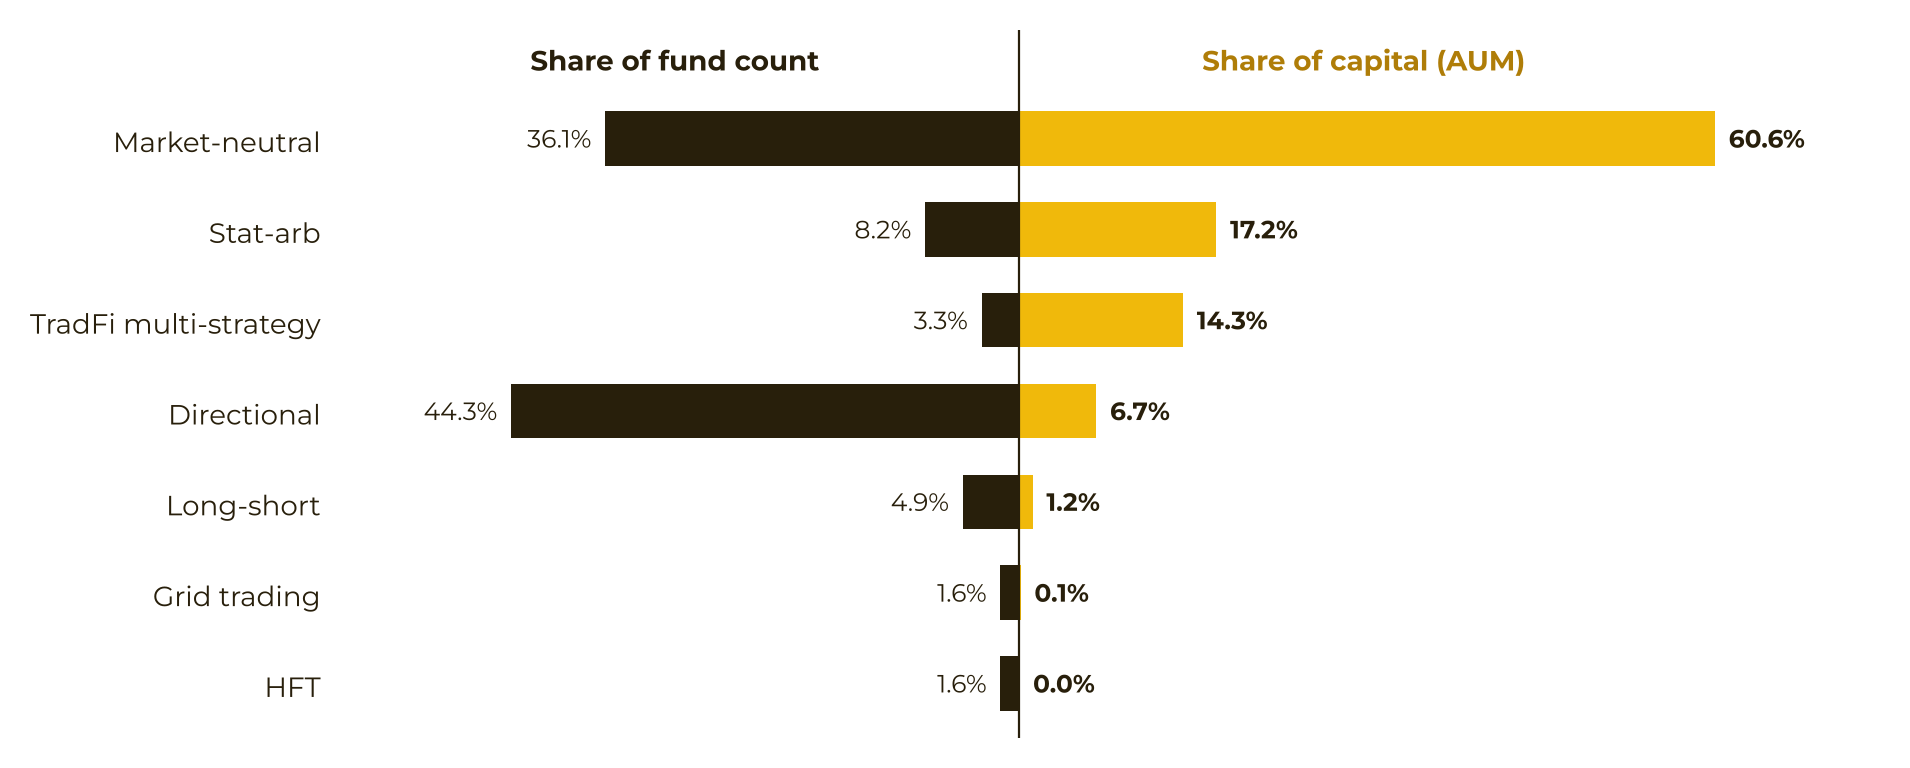
Neutral strategies are under half of Capital Connect funds but hold 92.1% of capital. Directional funds are 44.3% of funds, 6.7% of AUM.
The average neutral-strategy ticket on Capital Connect is roughly 11× the directional ticket, a sign of conviction sizing.
BTC fell 7.2% in October, yet directional funds averaged +1.9% and their investor count returned to May's level of 52.
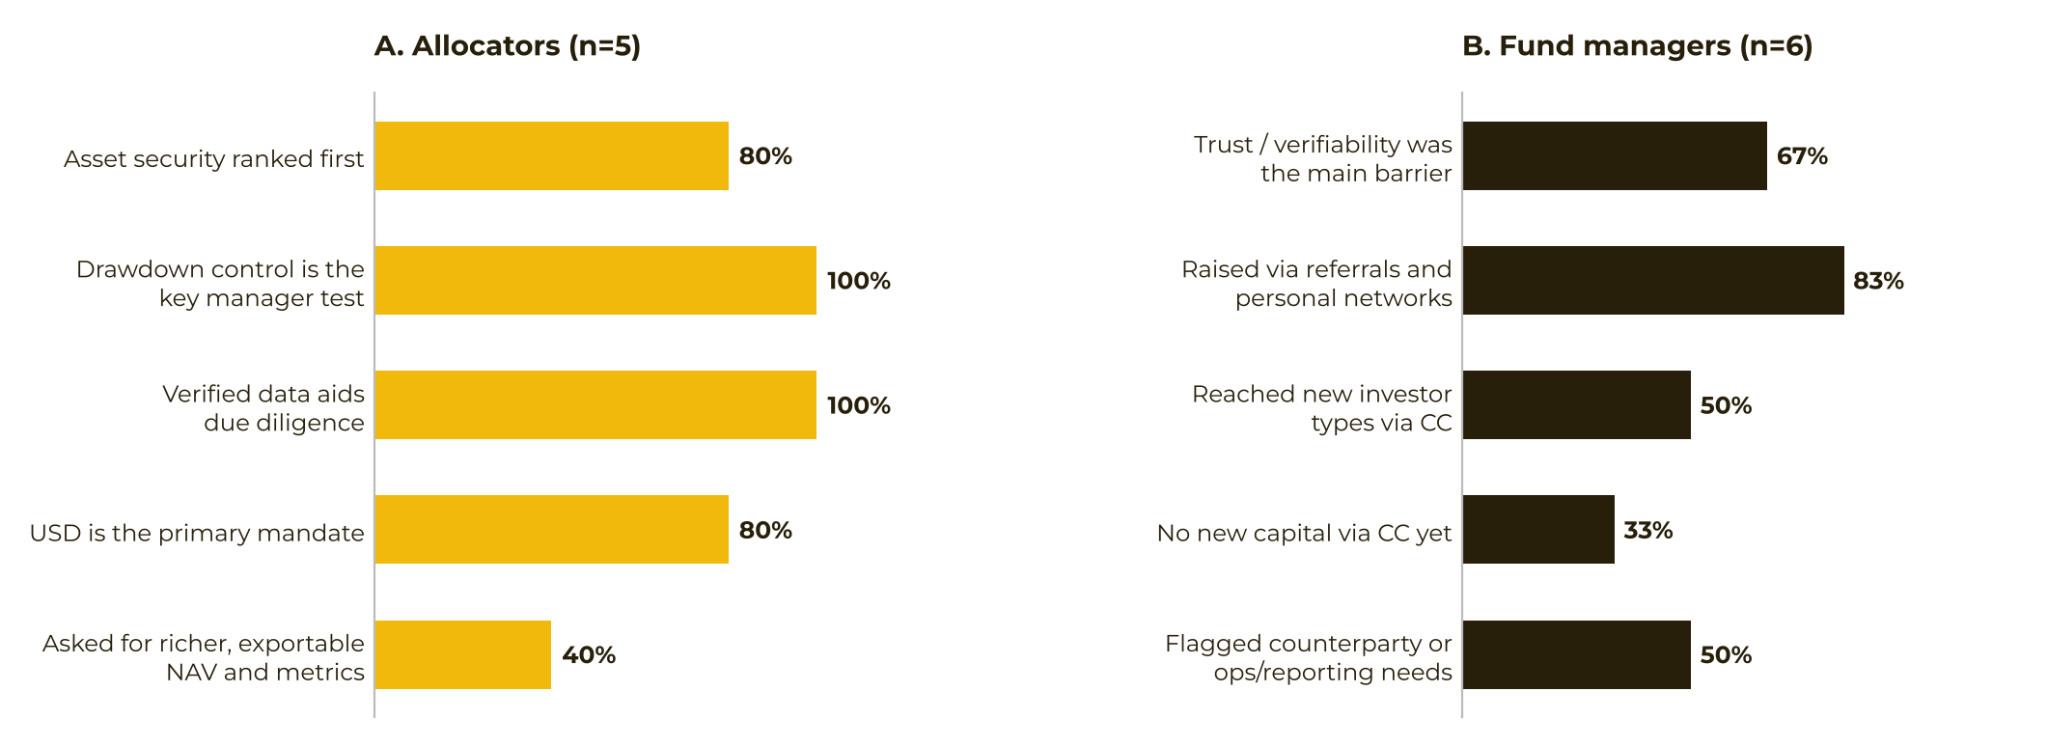
All allocators interviewed said verified, on-exchange data strengthens due diligence; 80% rank asset security first.
Institutional capital has arrived in crypto, but active management hasn't. The industry has built excellent rails for passive exposure and almost none for finding, verifying and benchmarking active managers. Institutional money sits in beta because there's no distribution layer, not by choice. Capital Connect, Binance's regulated platform for crypto fund discovery and allocation, was built to fill that gap. This update extends our analysis to the platform's October 31, 2026 snapshot and adds, for the first time, direct interviews with its allocators and fund managers. The core findings held through a month in which BTC fell 7%: hedged strategies still dominate, crypto-denominated mandates still write the largest tickets, and directional capital waits for a visible recovery. Allocators and managers agree that verification, not returns, is what unlocks allocation.
Crypto Has Scaled Beta, Not Active Management
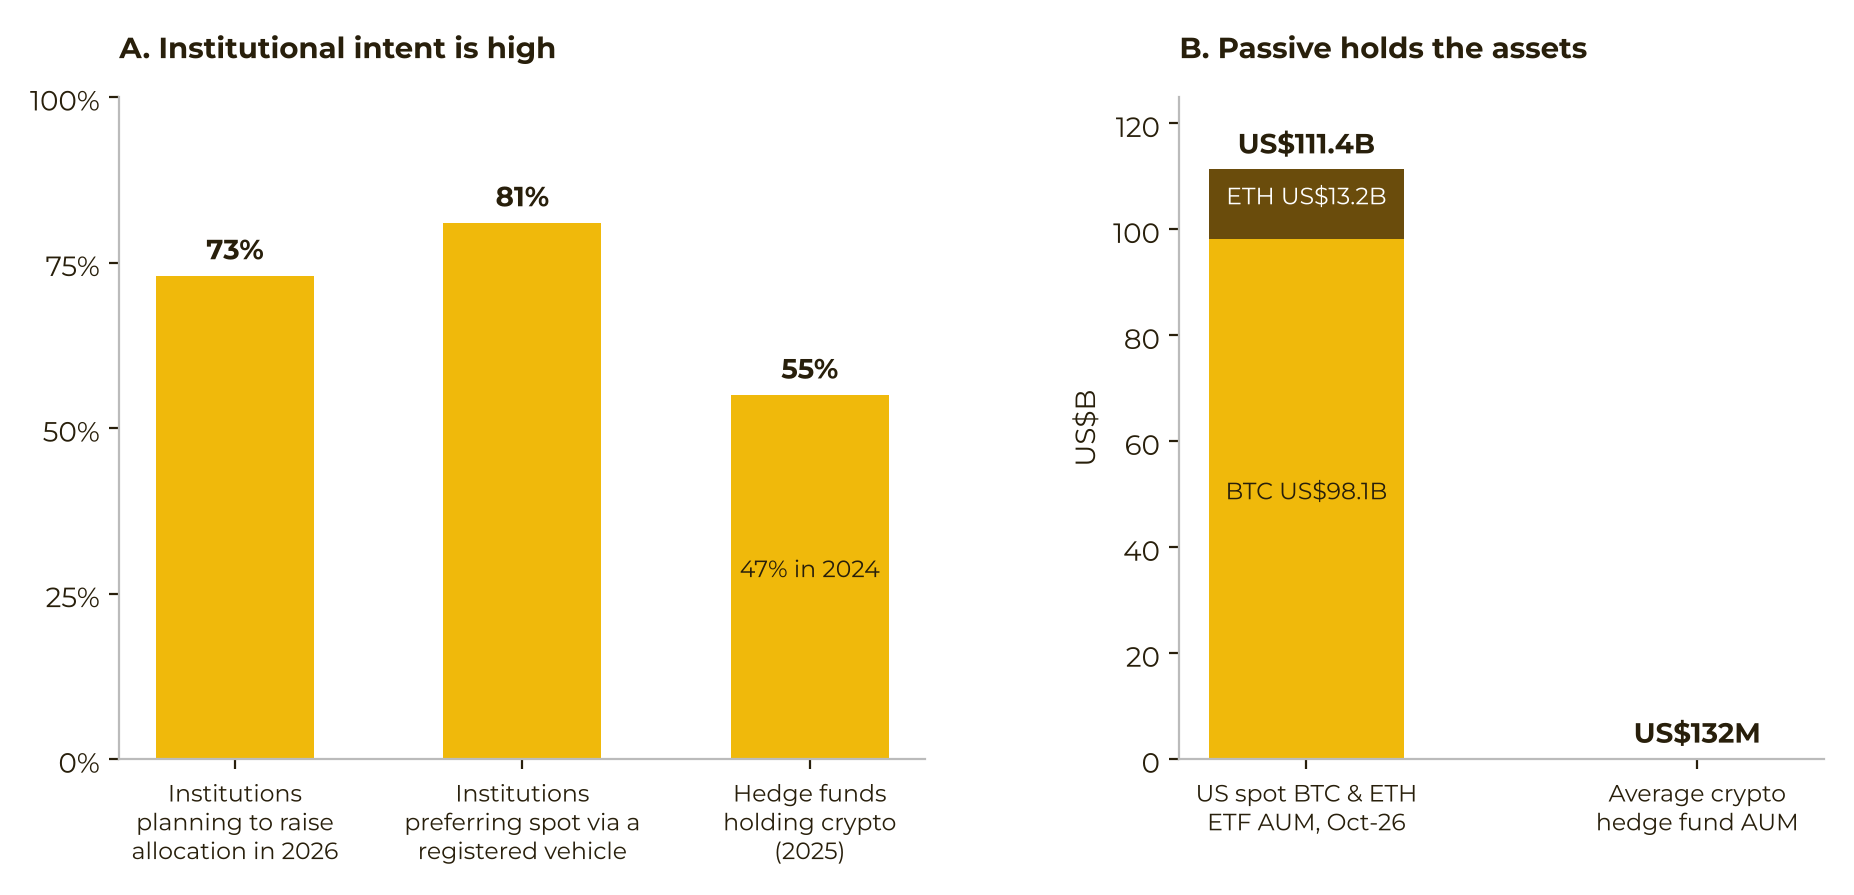
Institutional appetite for digital assets now appears firmly established. In the EY-Parthenon and Coinbase 2026 survey, 73% of institutions plan to raise digital asset allocations this year. AIMA and PwC find 55% of traditional hedge funds now hold crypto, up from 47% in 2024.
But that demand flows mostly into passive wrappers. Of those surveyed, 81% prefer spot exposure through a registered vehicle. US spot Bitcoin and Ethereum ETFs held about US$111B in assets at the end of October 2026. The average crypto hedge fund, by contrast, manages about US$132M, and 91% manage under US$1B.
We interpret this as a reflection of market infrastructure rather than manager selection. ETFs have gained traction because they offer a complete institutional wrapper: custody, audit, daily marks and familiar reporting. Active crypto strategies have yet to offer the same level of institutional integration.
The hesitation is also evident in position sizing Among traditional hedge funds that hold crypto, over half commit less than 2% of assets. Yet 60% of institutions plan to lift exposure above 2% within a year. This suggests that the constraint is not a lack of interest, but limitations in the available investment infrastructure.
Figure 1: Institutions want exposure, but passive vehicles accounted for most inflows
The Missing Middle: Strong Managers, Limited Discoverability
If the bottleneck were talent, it would resolve itself. It is not. The bottleneck is discovery and verification.
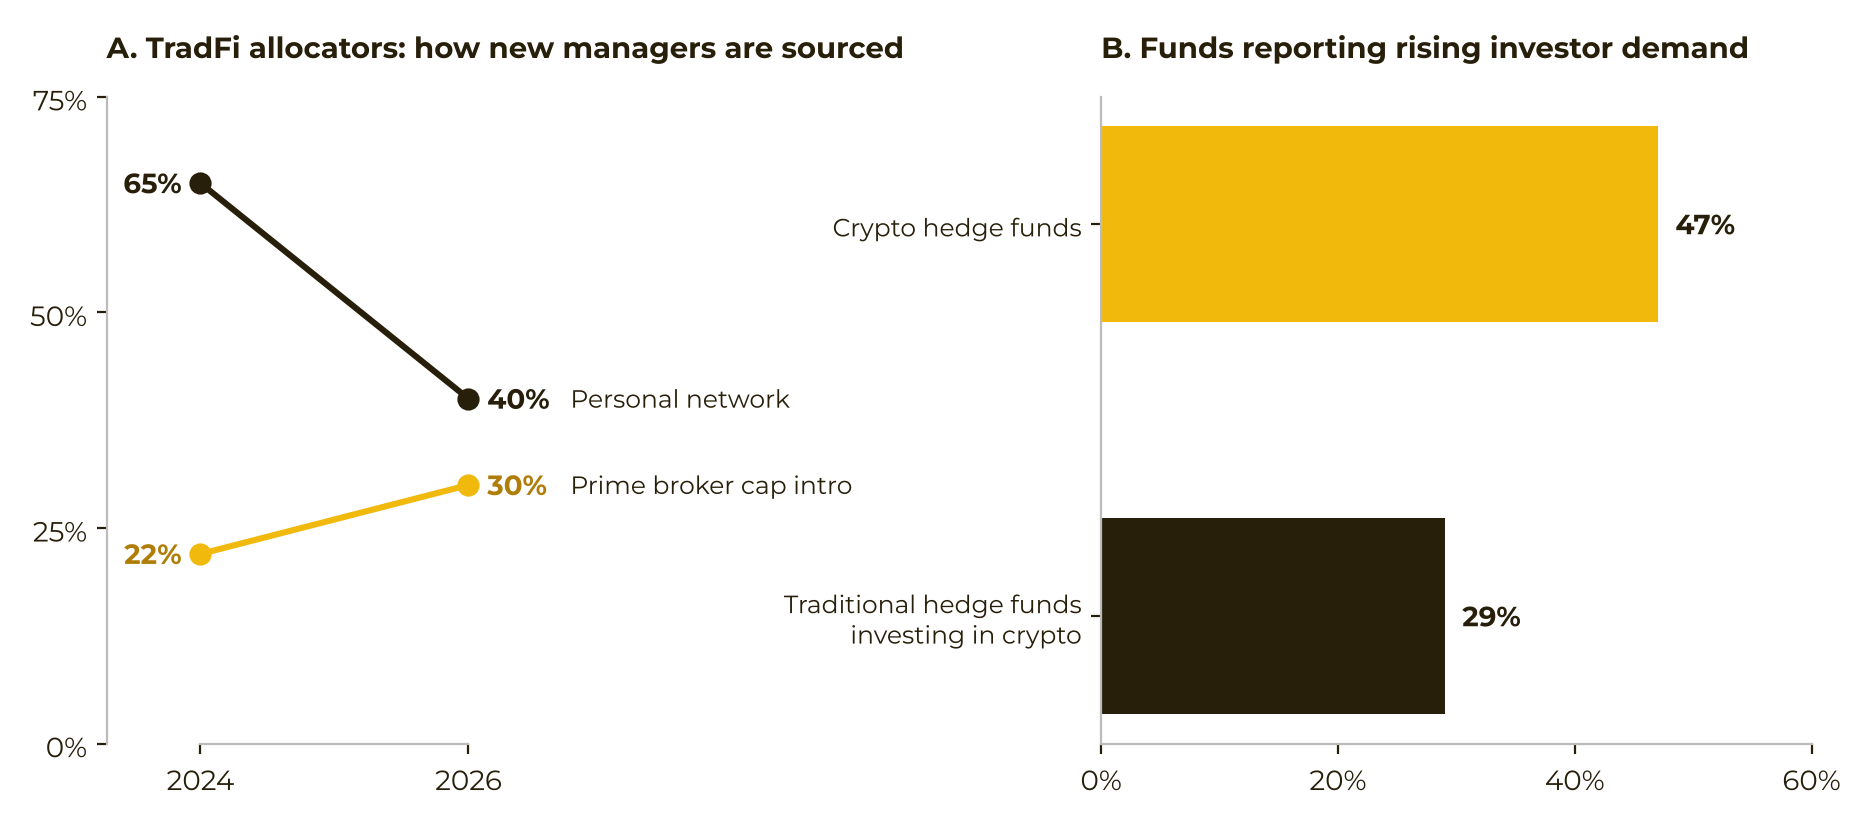
Traditional markets are formalizing how capital finds managers. AIMA and Marex find allocators' reliance on personal networks fell from 65% in 2024 to 40% in 2026. Prime broker capital introduction rose from 22% to 30% over the same period.
Crypto does not seem to have an equivalent channel. Allocation still runs through Telegram groups, conferences and warm introductions. There is no standard performance or benchmarking framework, so managers cannot be compared on equal terms. Institutions struggle to verify the audited financials, custody and service providers they now require.
These frictions affect both sides. Among crypto hedge funds, 47% report rising investor demand, against 29% of traditional hedge funds investing in crypto. Yet family offices and high-net-worth individuals remain their main investors. Only one in five crypto hedge funds reports pensions, foundations or sovereign wealth funds among its primary investor types, up from one in nine a year earlier.
Figure 2: Allocators are formalizing manager discovery; crypto demand is outpacing it
Directional Strategies Dominate by Count, but Neutral Strategies Dominate by Capital
Where a discovery layer exists, it becomes easier to observe allocator preferences. Capital Connect provides one such reference point, as strategies are disclosed and performance is measured on a common basis. The October data continued to show the same allocation pattern.
Directional strategies remain the largest group by fund count at 44.3%, yet hold only 6.7% of capital. Market-neutral and stat-arb funds, together with TradFi-style multi-strategy, hold 92.1% of AUM. Multi-strategy alone accounts for 14.3%.. The average neutral ticket is roughly 11× the directional ticket. This suggests that capital allocation reflects allocator preference rather than fund count alone.
The trend is consistent with this view. Market-neutral investor participation rose for a second straight month, up 30% since May. Stat-arb participation has more than doubled over the same period and held steady through October.
Manager supply and capital demand point in opposite directions. The long tail builds directional products; institutional money concentrates in hedged ones. A discovery layer does not create that preference,it makes it visible.
Figure 3: Directional leads by fund count; neutral strategies lead by capital
Two Mandates, Both Under Test
Two mandates continue to grow side by side, and October provided a useful indication of how each behaves under pressure.
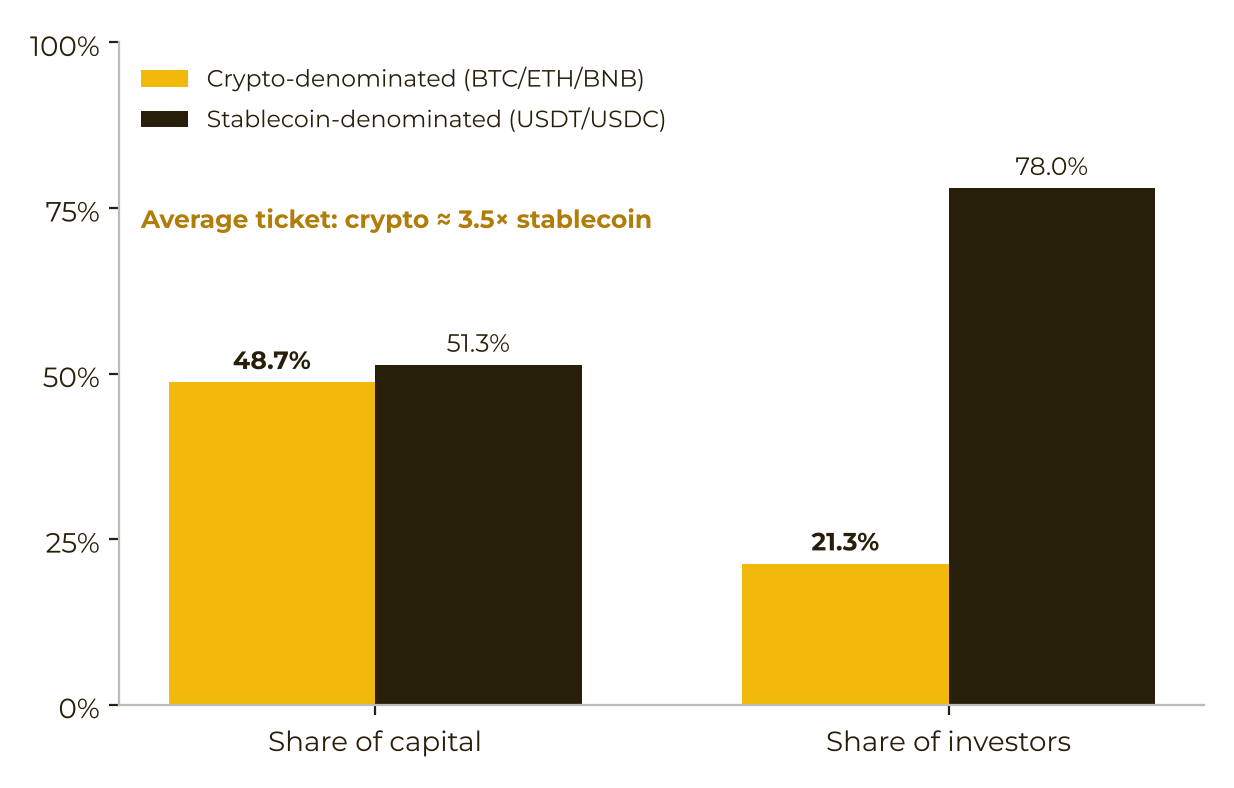
The first is crypto-native. Just under half of platform capital (48.7%) sits in funds denominated in BTC, ETH or BNB. These funds hold about a fifth of investors, with an average ticket roughly 3.5× that of stablecoin funds. Their allocators retain base-asset exposure while outsourcing the hedge In-kind positions were stable in October; the fall in USD-measured AUM closely tracked BTC's price movement.
The second is convergent. TradFi-style multi-strategy remains the third-largest strategy by capital at 14.3%. However, investor participation in the strategy eased by 14% in October, declining from 21 to 18.
Taken together, the picture is one of maturation rather than reversal.Traditional structures are adopted once offered. But allocators remain selective, and investors pulled back even as the strategy's returns held up.
Figure 4: Crypto-denominated funds carry the largest tickets
Risk Appetite Returned and Withstood October
Directional participation recovered gradually. Investor count in the selected samples fell sharply in June as returns reached their trough, bottoming at 36 in July. It then recovered to 52 by October, back to its May level. Average since-inception return improved from –11% in June to +3.7% in October.
October was the first real test of that recovery. BTC fell 7.2%, yet directional funds yet averaged +1.9% for the month and market-neutral +1.0%. Our interviews suggest a similar pattern: reduce directional exposure during a drawdown, then scale back once volatility and liquidity stabilize.
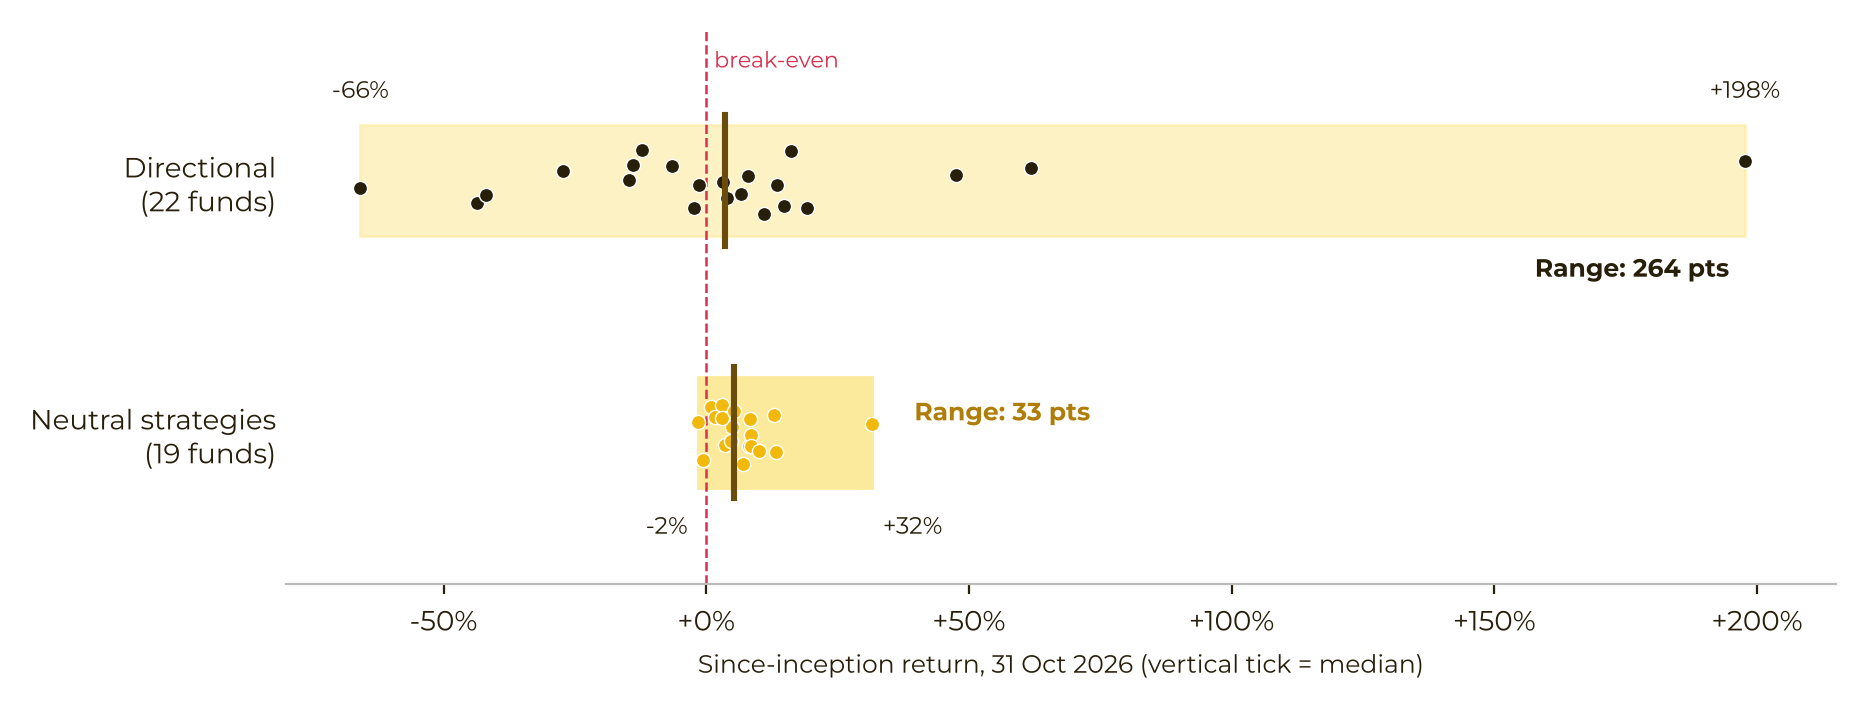
Directional investing remains challenging. Its best-to-worst spread is about 8× wider than that of neutral strategies. The median fund sits near +4%, and only 55% are positive. By contrast, nine in ten neutral funds are positive.
The top quartile of directional funds averaged +69% since inception. That is the alpha allocators say they will pay for, when delivered with controlled drawdowns.
Figure 5: Directional investors returned as performance recovered, and held through October
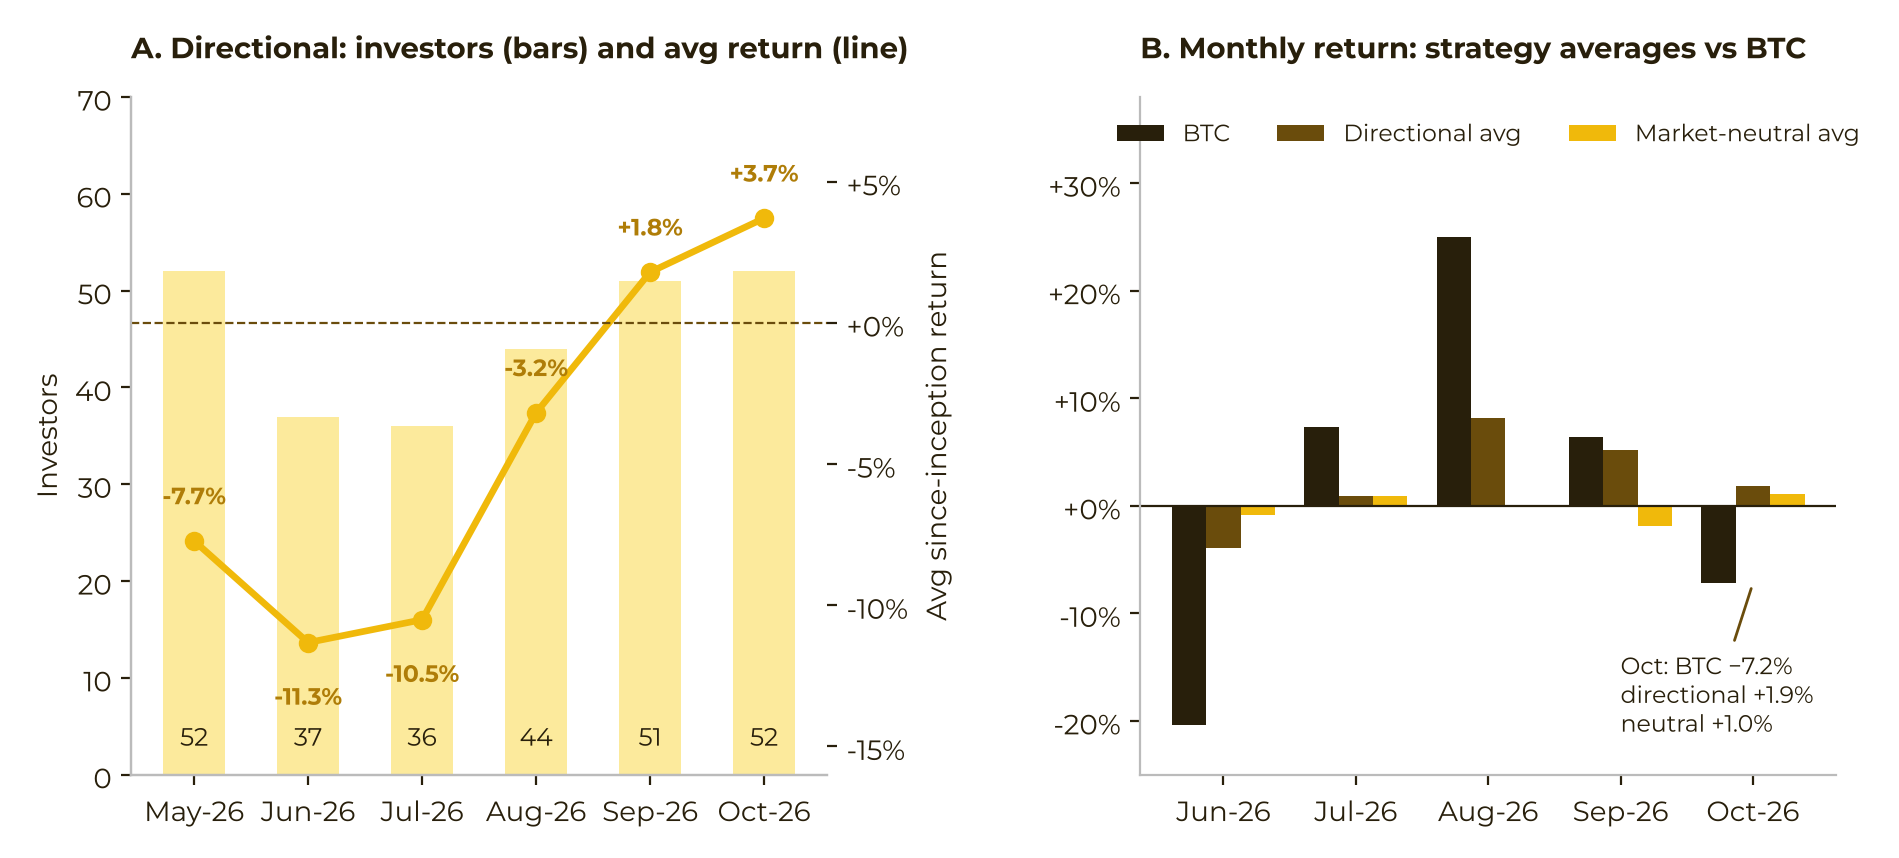
Figure 6: Directional outcomes span a far wider range than neutral strategies
What Allocators and Managers Told Us
To test what the data implies, we interviewed Capital Connect allocators and the trading teams running funds on the platform. Their answers explain the patterns above.
For allocators, asset security comes first with 80% ranking it above past performance and reputation. Interviewees noted that verified, on-exchange data strengthens due diligence and that managers are judged more on drawdown control rather than on headline returns.
For managers, the barrier was not returns, but trust. Track records were difficult to verify, while KYC, AML and counterparty questions slowed fundraising. As a result, most capital was raised through referrals. Since listing, some managers have been able to reach a broader investor base, compliant institutions and pooled smaller tickets.
The message from both sides is consistent. Verification opens the door; while operational infrastructure can widen it.
Figure 7: Allocators put security and verification ahead of past returns
GENERAL DISCLOSURE: This material is prepared by Binance Research and is not intended to be relied upon as a forecast or investment advice, and is not a recommendation, offer or solicitation to buy or sell any trading products, cryptocurrencies or to adopt any investment strategy. The use of terminology and the views expressed are intended to promote understanding and the responsible development of the sector and should not be interpreted as definitive legal views or those of Binance. The opinions expressed are as of the date shown above and are the opinions of the writer, they may change as subsequent conditions vary. The information and opinions contained in this material are derived from proprietary and non-proprietary sources deemed by Binance Research to be reliable, are not necessarily all-inclusive and are not guaranteed as to accuracy. As such, no warranty of accuracy or reliability is given and no responsibility arising in any other way for errors and omissions (including responsibility to any person by reason of negligence) is accepted by Binance. This material may contain ’forward looking’ information that is not purely historical in nature. Such information may include, among other things, projections and forecasts. There is no guarantee that any forecasts made will come to pass. Reliance upon information in this material is at the sole discretion of the reader. This material is intended for information purposes only and does not constitute investment advice or an offer or solicitation to purchase or sell in any securities, cryptocurrencies or any investment strategy nor shall any securities or cryptocurrency be offered or sold to any person in any jurisdiction in which an offer, solicitation, purchase or sale would be unlawful under the laws of such jurisdiction. Investment involves risks. For more information, see our Terms of Use and Risk Warning.