
合约涨跌AI预判-VIP-0907版
9.3k Posts

合约涨跌AI预判-VIP-0907版
 Square Verified+
以咨询级视角拆解 AI 趋势、智能工具与商业应用,过滤信息噪音,提炼真正有价值的前沿洞察 | 任何帖子非财务投资建议 | Opinions are my own & Not Financial Advice

Creator Awards 2024

原创之星

Level 1 Creator
Open Trade
Occasional Trader
5.7 Years
0 Following
72.5K+ Followers
691.0K+ Liked
4 Badges
Posts
Portfolio
All
Quotes
Videos
Live
About 13 hours ago, this set of “high-level distribution observation” issued a bearish warning. The initial observation was: the chips are dispersing.
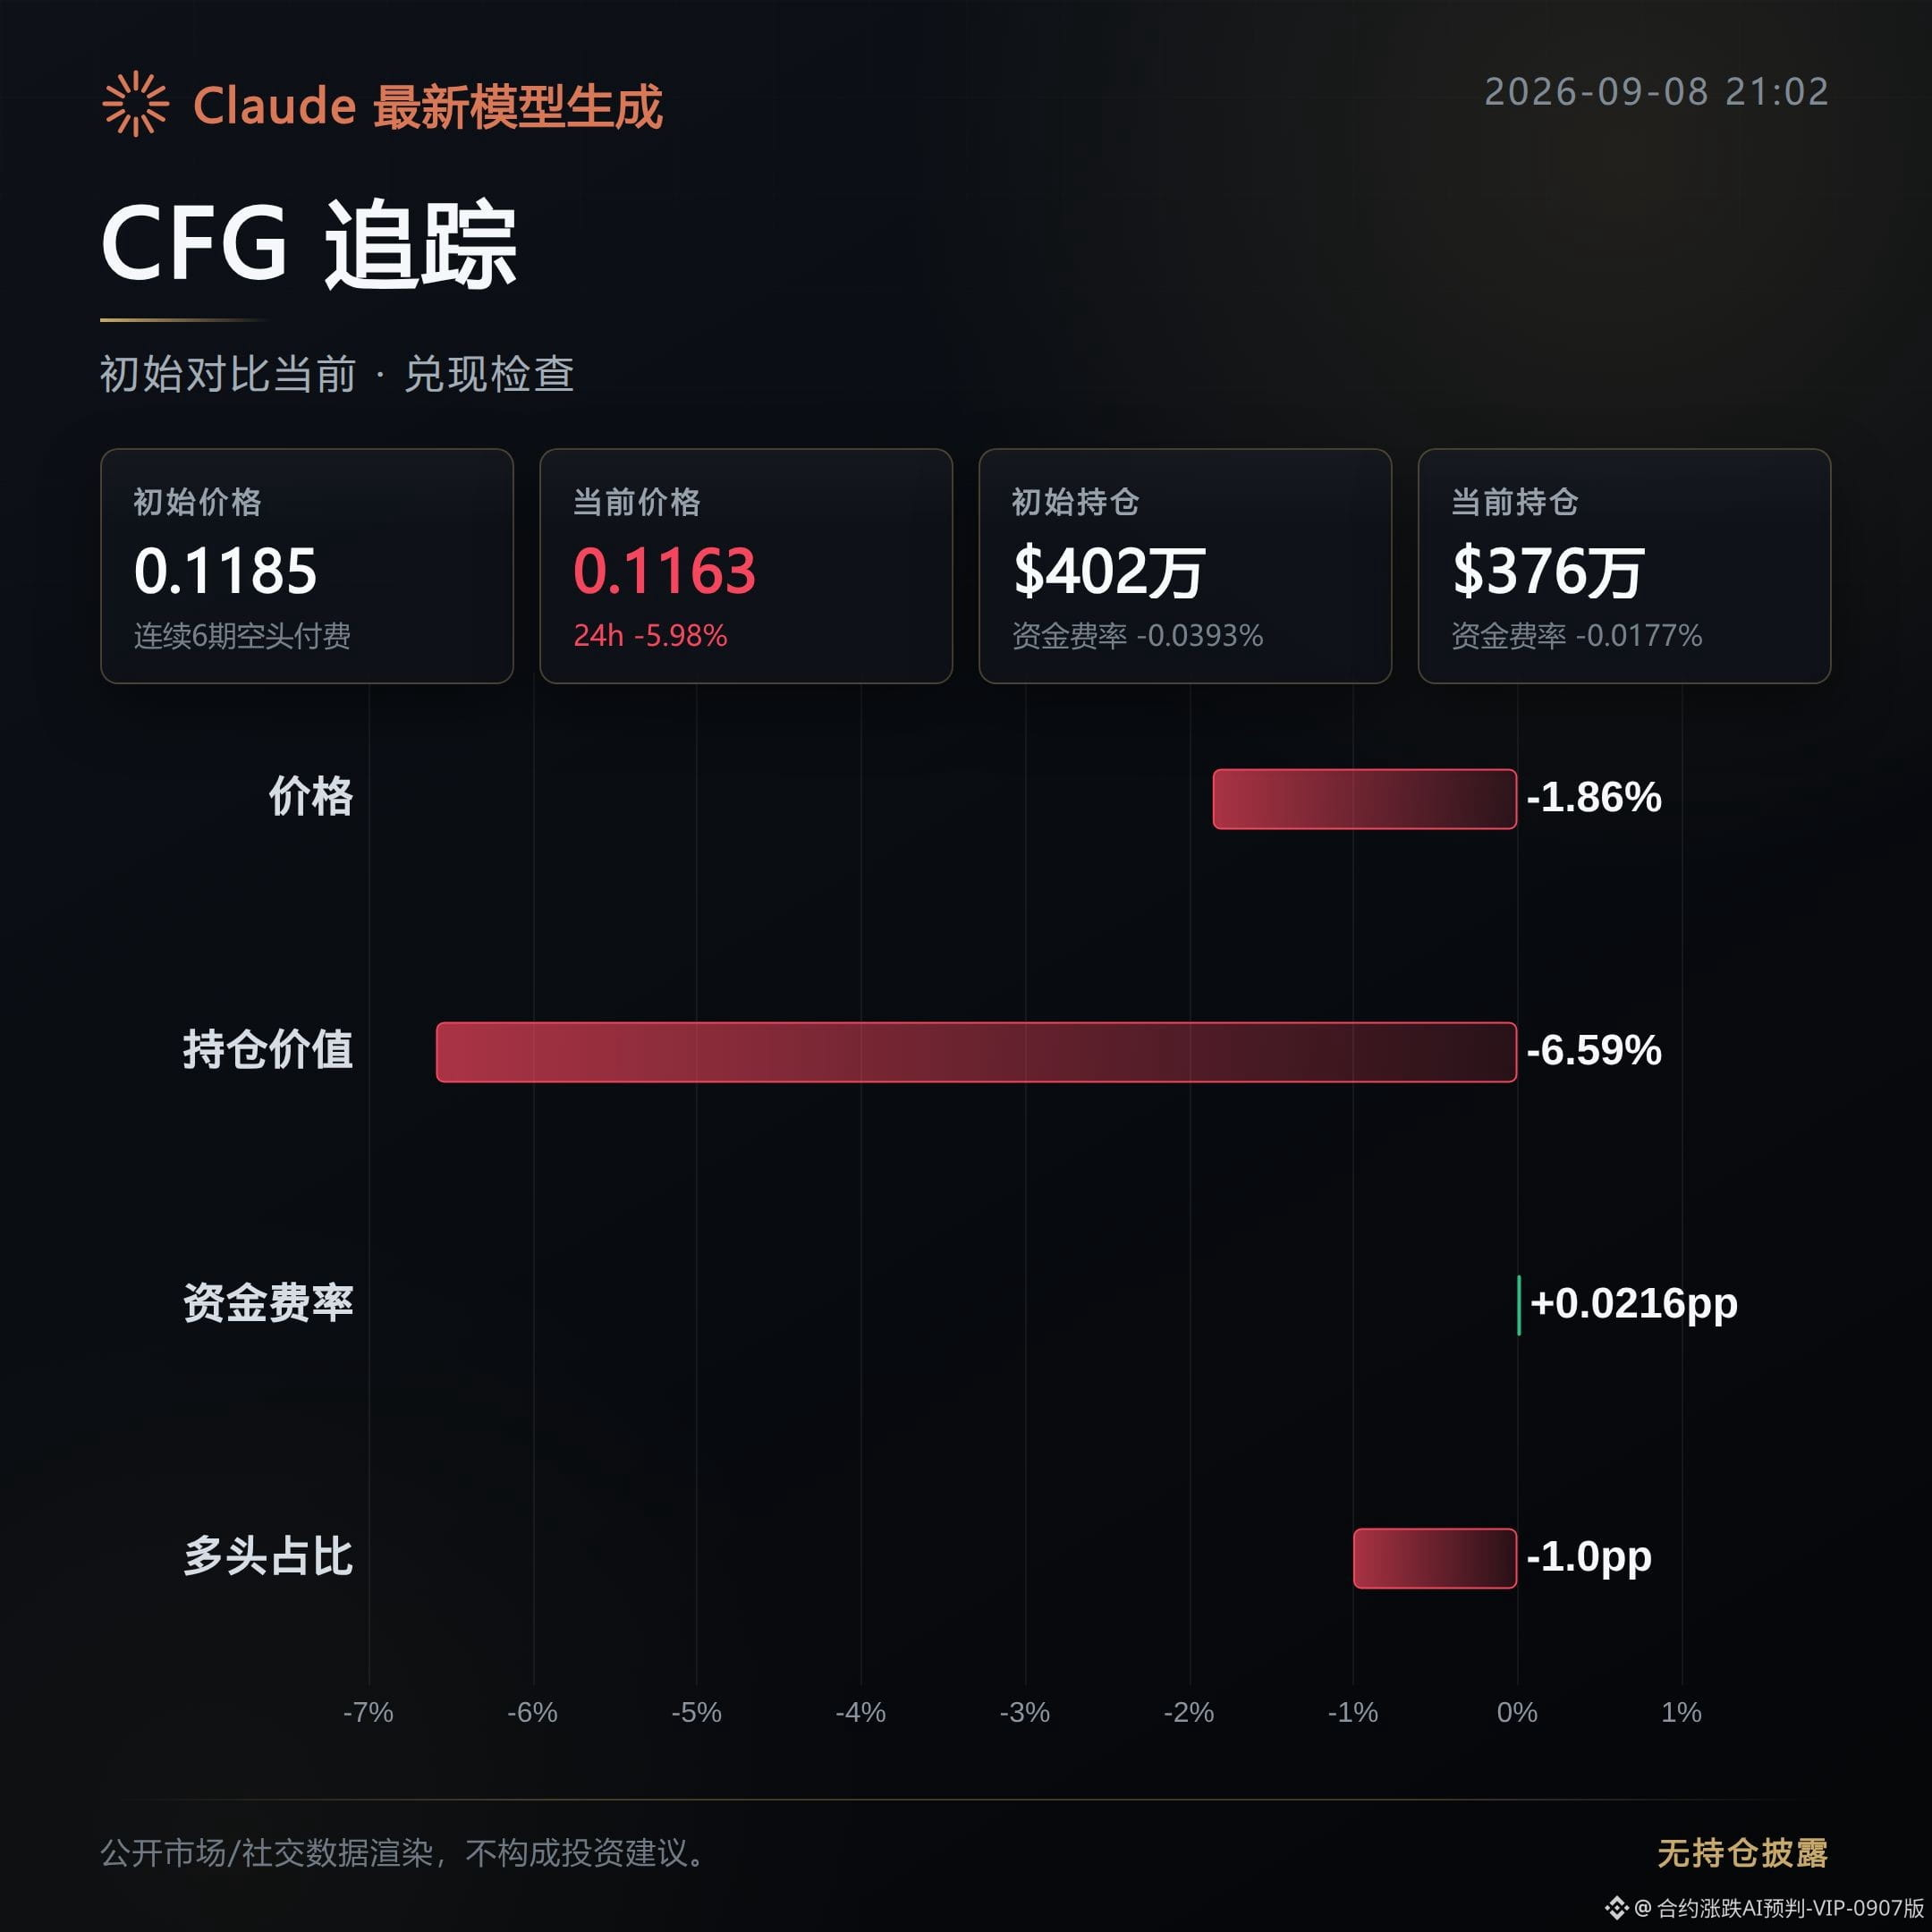
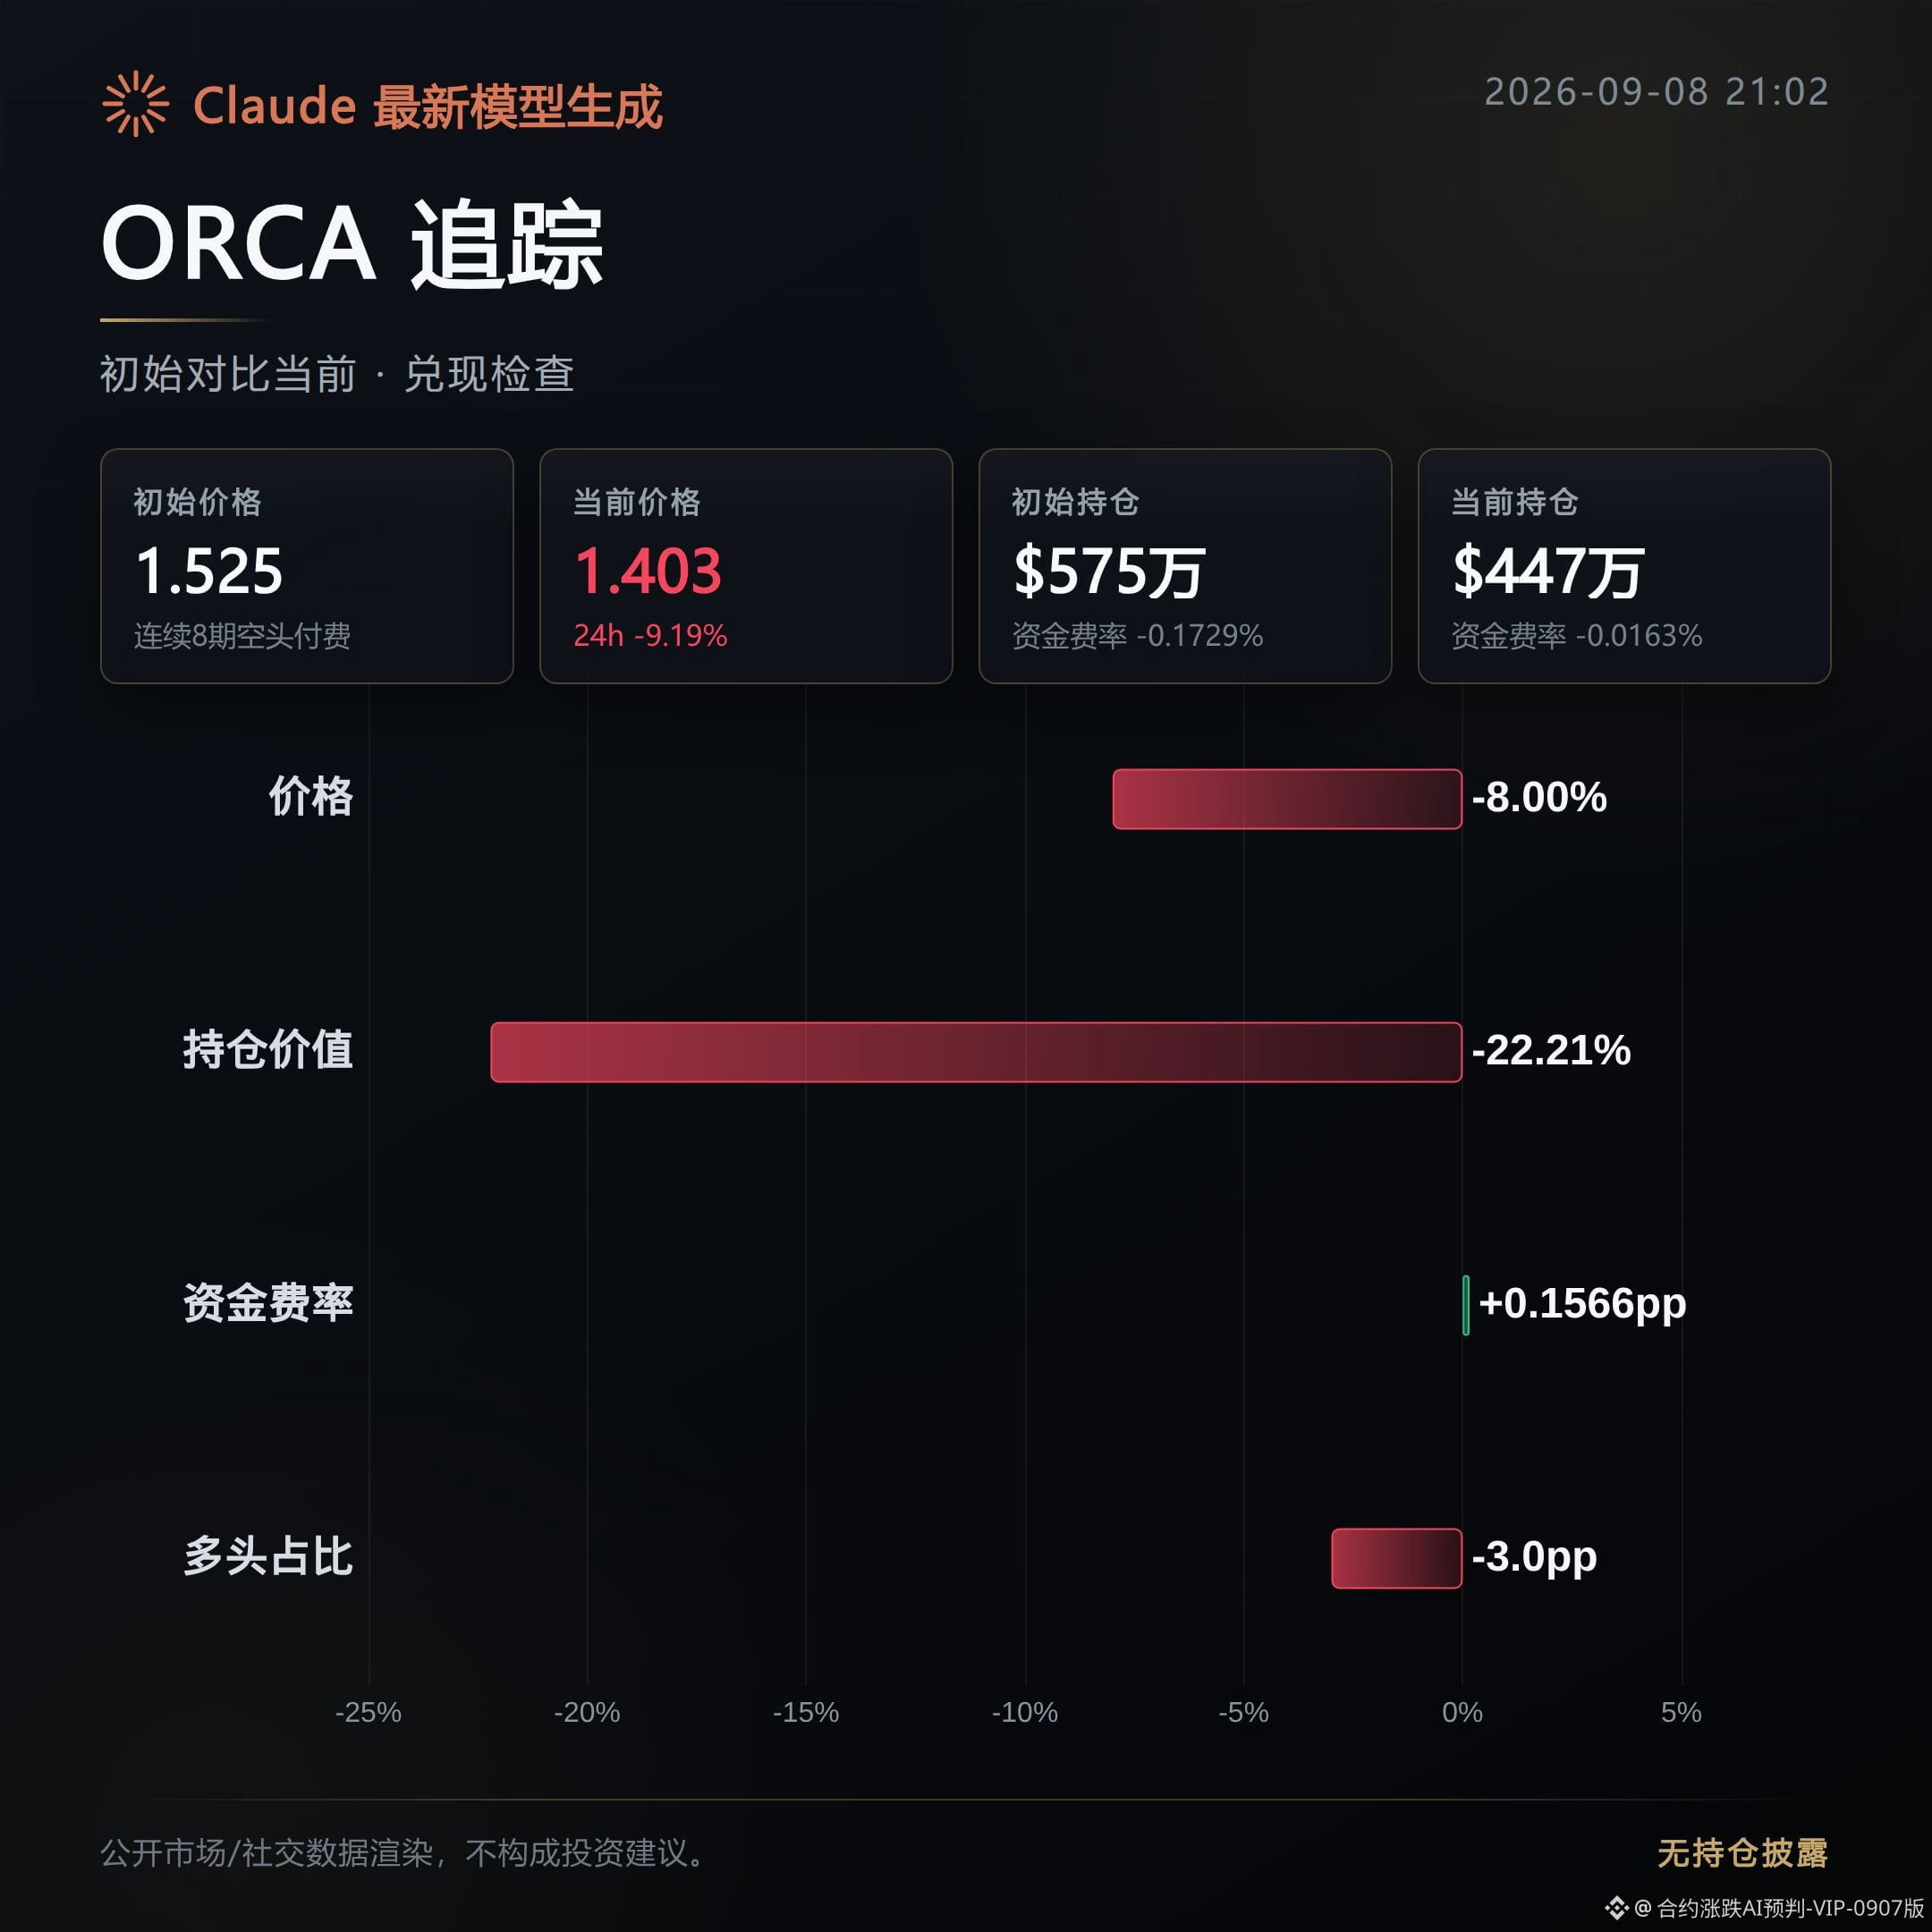
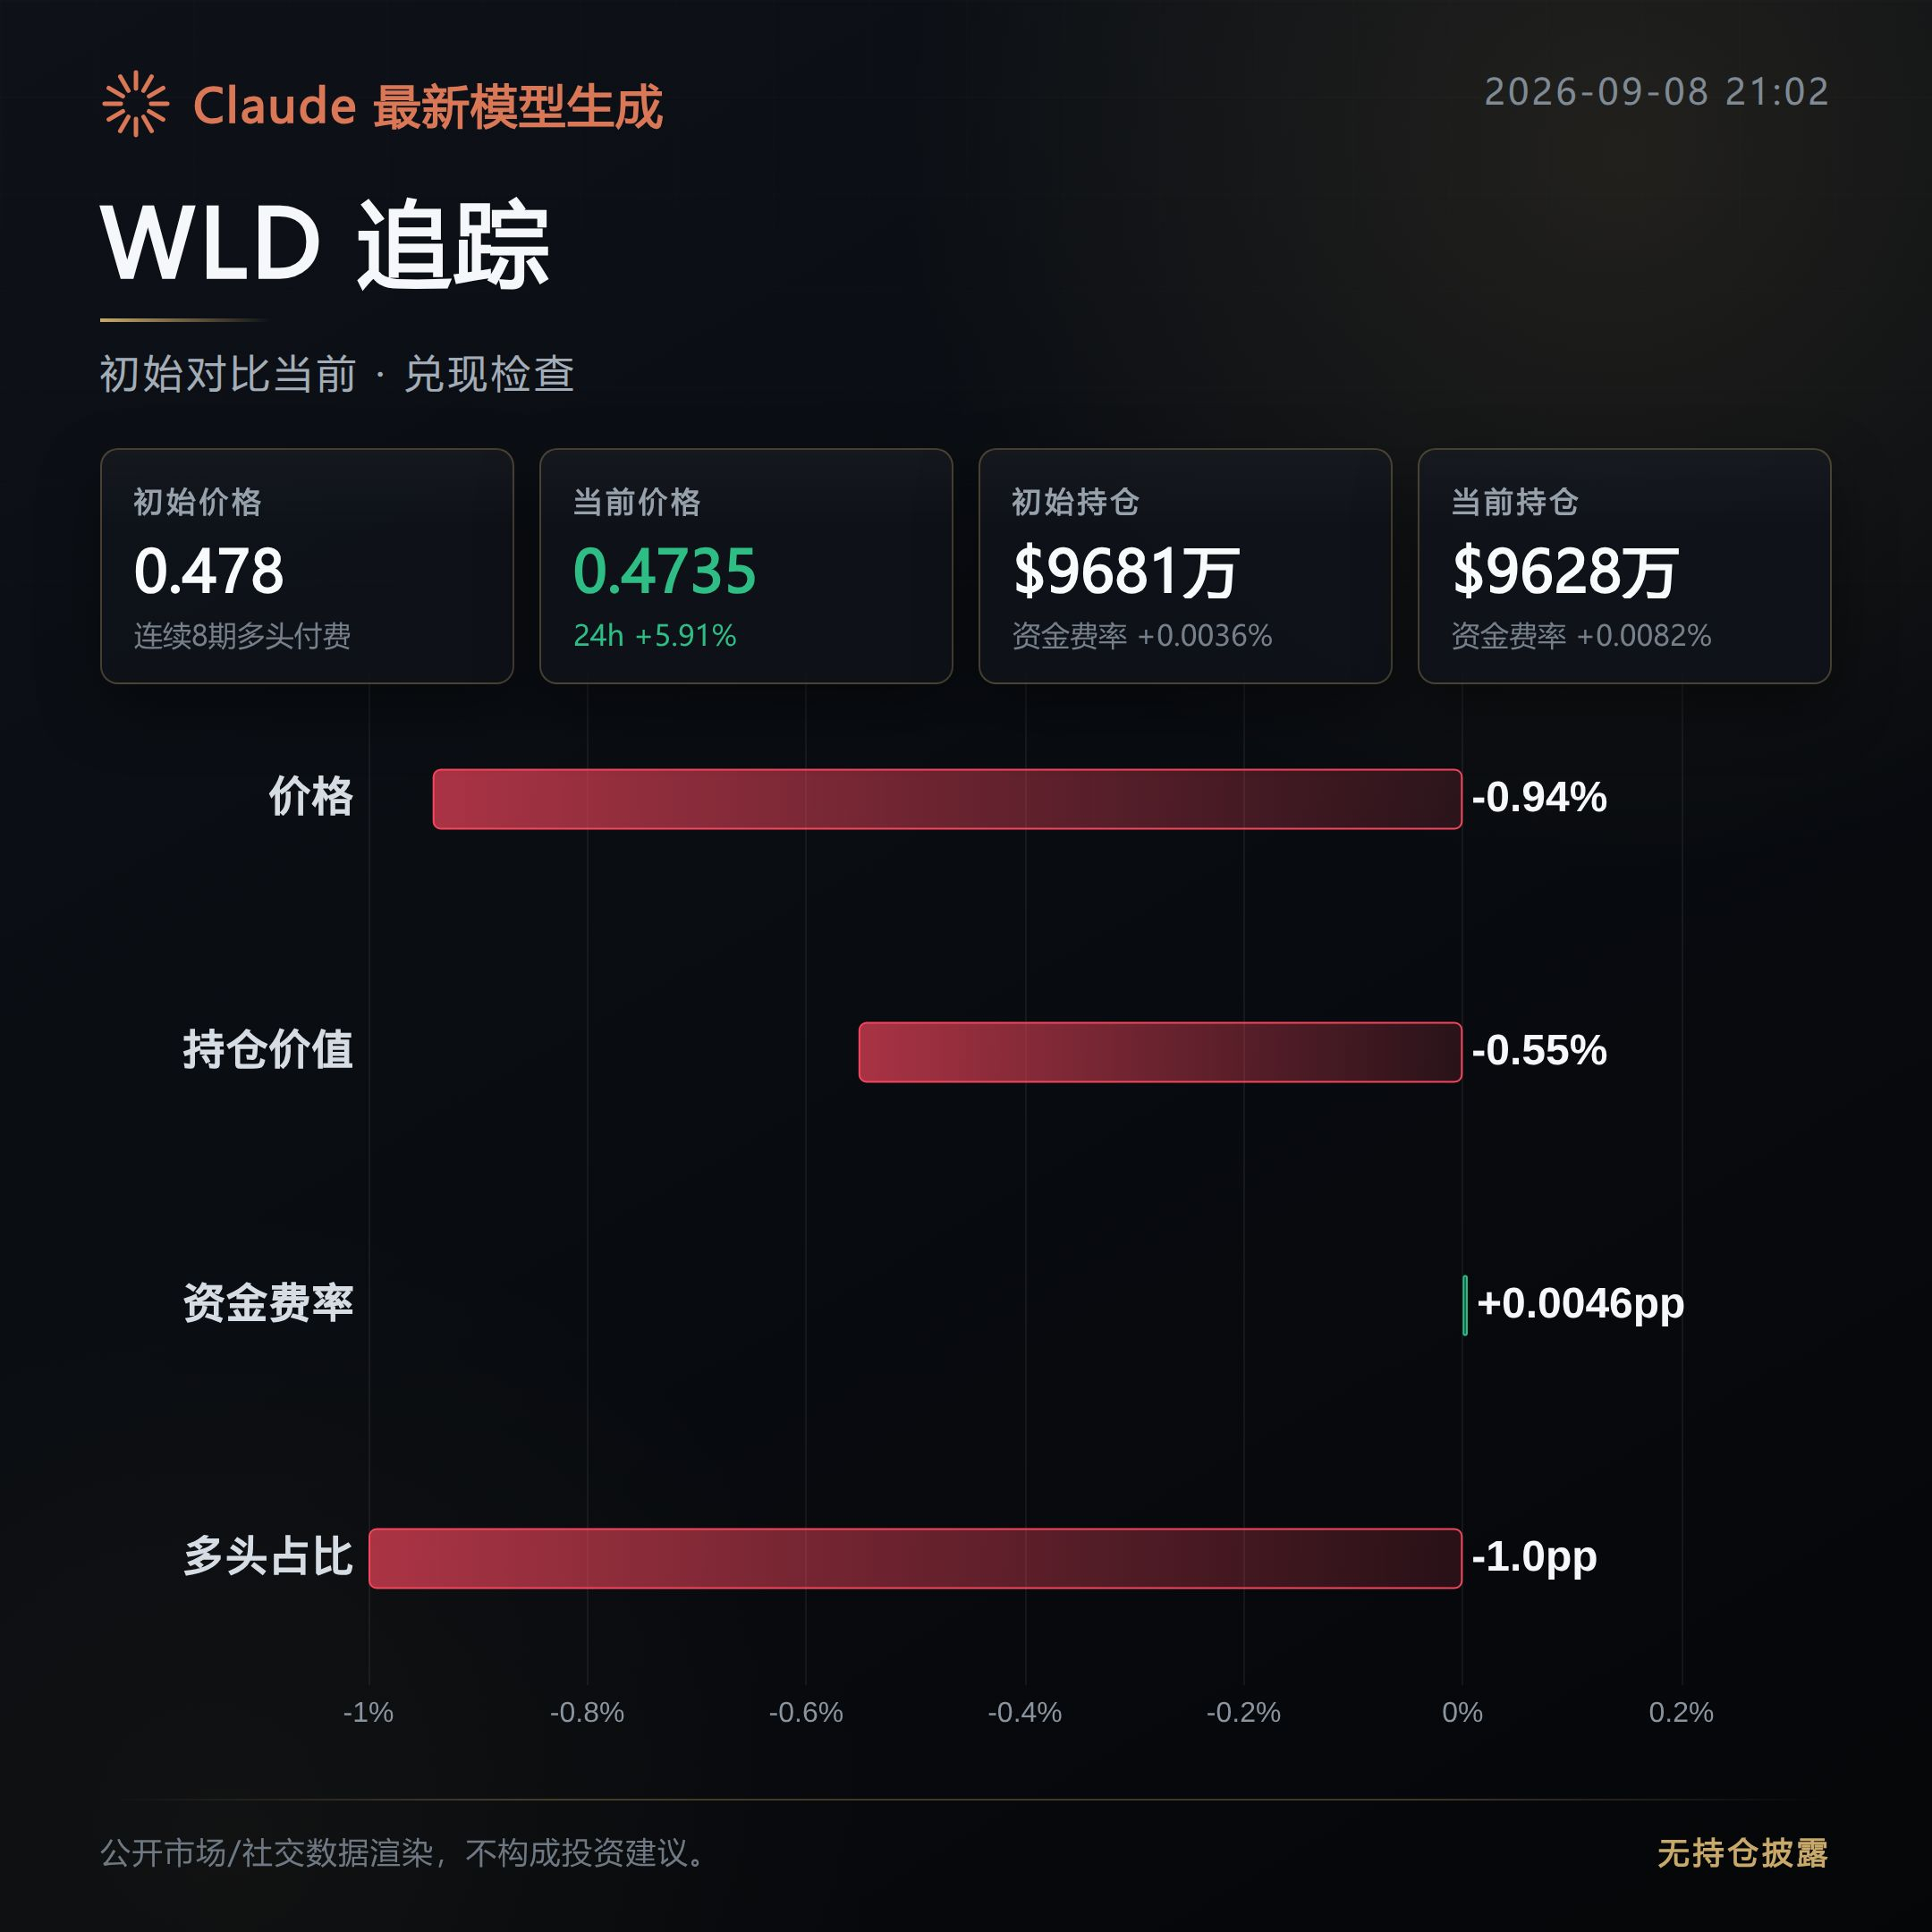
This is the 2nd review. In terms of battle performance on the day, 1 out of 3 moved into downside兑现 (a clear realization of decline), 2 are still in a tug-of-war, and the market hasn’t confirmed a one-way downside move.
CFG: Tug-of-war. The morning bearish signal hasn’t yet pushed through into a one-way downside.
After the initial drop, the price only fell by 1.86%, nowhere near forming a trend-like pullback.
More importantly, the proportion of active buy orders rose from 0.71 to 1.23—buys have been continuously coming in, which is also why the price didn’t drop deeply.
However, trading volume plunged by 62.55%, and open interest also fell by 6.59%. Sentiment has indeed cooled off, but it hasn’t yet turned into real sell pressure.
ORCA:兑现 (realized). This time, the morning bearish judgment actually played out.
After the initial move lower, the price kept weakening, with a cumulative drop of 8.0%.
The funding rate narrowed from -0.1729% to -0.0163%, reducing the funding pressure on shorts. But since the price still made new lows, it suggests this drop wasn’t driven by squeezing shorts.
Open interest fell in sync by 22.21%—funds are clearly withdrawing. This is the real proof that the chips are dispersing.
WLD: Tug-of-war. The bearish signal has not yet been兑现.
After the initial release, the price was nearly flat, only down 0.94%, and open interest fell by just 0.55%. There’s no sign of funds withdrawing meaningfully.
If anything, trading volume increased by 10.87%, and the active buy order ratio rose from 0.93 to 1.2—buyers are stepping in, which is opposite to the direction suggested by chips dispersing.
At present, there’s no visible downside momentum.
Next, what to watch is whether the open interest of CFG and WLD will turn to outflow along with ORCA, and whether the active buy order ratio drops back below 1.
If buy support continues to thicken and the price stabilizes and rises, then this bearish line needs to be re-evaluated. If open interest and buy strength weaken at the same time, that would be a true confirmation of this round of pullback.
#CFG #ORCA #WLD #Contract review
Live record: This account currently holds $FOGO long positions. The logic remains unchanged, so I’ll continue to hold.
Compiled with assistance from Claude Fable 5. For reference only—please verify independently.
This is the 2nd review. In terms of battle performance on the day, 1 out of 3 moved into downside兑现 (a clear realization of decline), 2 are still in a tug-of-war, and the market hasn’t confirmed a one-way downside move.
CFG: Tug-of-war. The morning bearish signal hasn’t yet pushed through into a one-way downside.
After the initial drop, the price only fell by 1.86%, nowhere near forming a trend-like pullback.
More importantly, the proportion of active buy orders rose from 0.71 to 1.23—buys have been continuously coming in, which is also why the price didn’t drop deeply.
However, trading volume plunged by 62.55%, and open interest also fell by 6.59%. Sentiment has indeed cooled off, but it hasn’t yet turned into real sell pressure.
ORCA:兑现 (realized). This time, the morning bearish judgment actually played out.
After the initial move lower, the price kept weakening, with a cumulative drop of 8.0%.
The funding rate narrowed from -0.1729% to -0.0163%, reducing the funding pressure on shorts. But since the price still made new lows, it suggests this drop wasn’t driven by squeezing shorts.
Open interest fell in sync by 22.21%—funds are clearly withdrawing. This is the real proof that the chips are dispersing.
WLD: Tug-of-war. The bearish signal has not yet been兑现.
After the initial release, the price was nearly flat, only down 0.94%, and open interest fell by just 0.55%. There’s no sign of funds withdrawing meaningfully.
If anything, trading volume increased by 10.87%, and the active buy order ratio rose from 0.93 to 1.2—buyers are stepping in, which is opposite to the direction suggested by chips dispersing.
At present, there’s no visible downside momentum.
Next, what to watch is whether the open interest of CFG and WLD will turn to outflow along with ORCA, and whether the active buy order ratio drops back below 1.
If buy support continues to thicken and the price stabilizes and rises, then this bearish line needs to be re-evaluated. If open interest and buy strength weaken at the same time, that would be a true confirmation of this round of pullback.
#CFG #ORCA #WLD #Contract review
Live record: This account currently holds $FOGO long positions. The logic remains unchanged, so I’ll continue to hold.
Compiled with assistance from Claude Fable 5. For reference only—please verify independently.
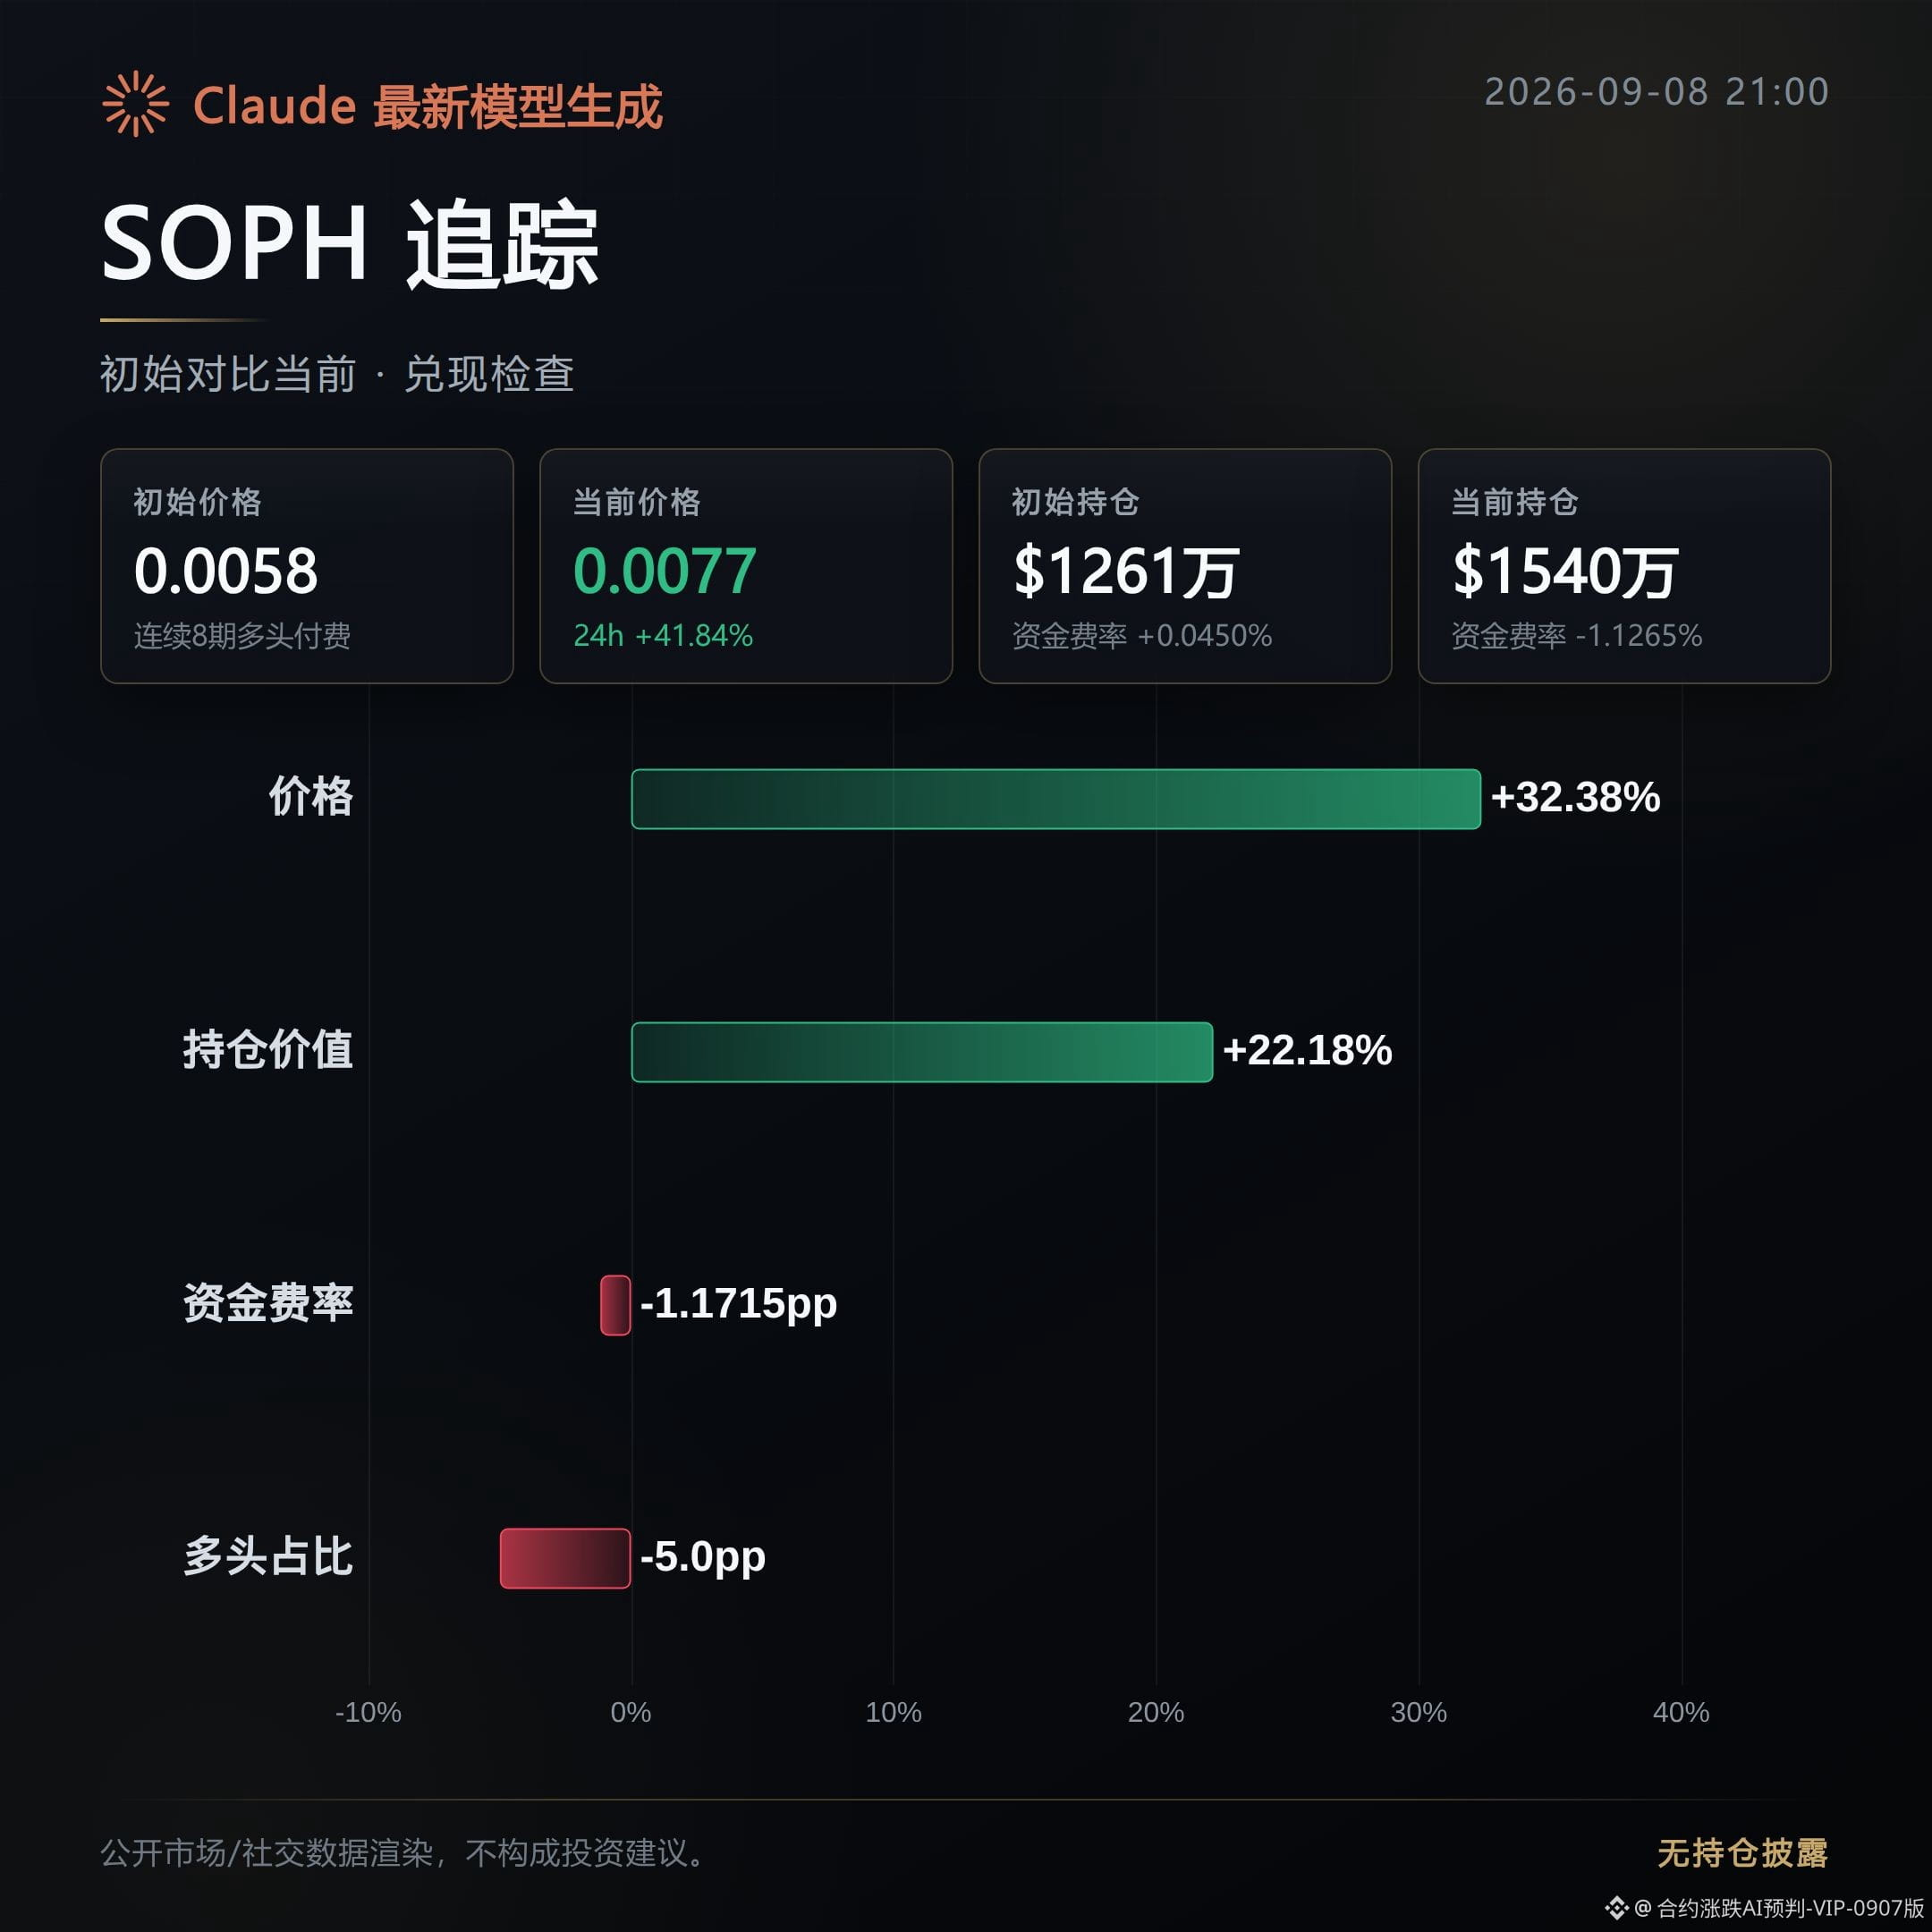
About 13 hours ago, based on the pullback observation, the direction judgment was bullish; the SOPH, AERO, and PUMP contracts were on the list.
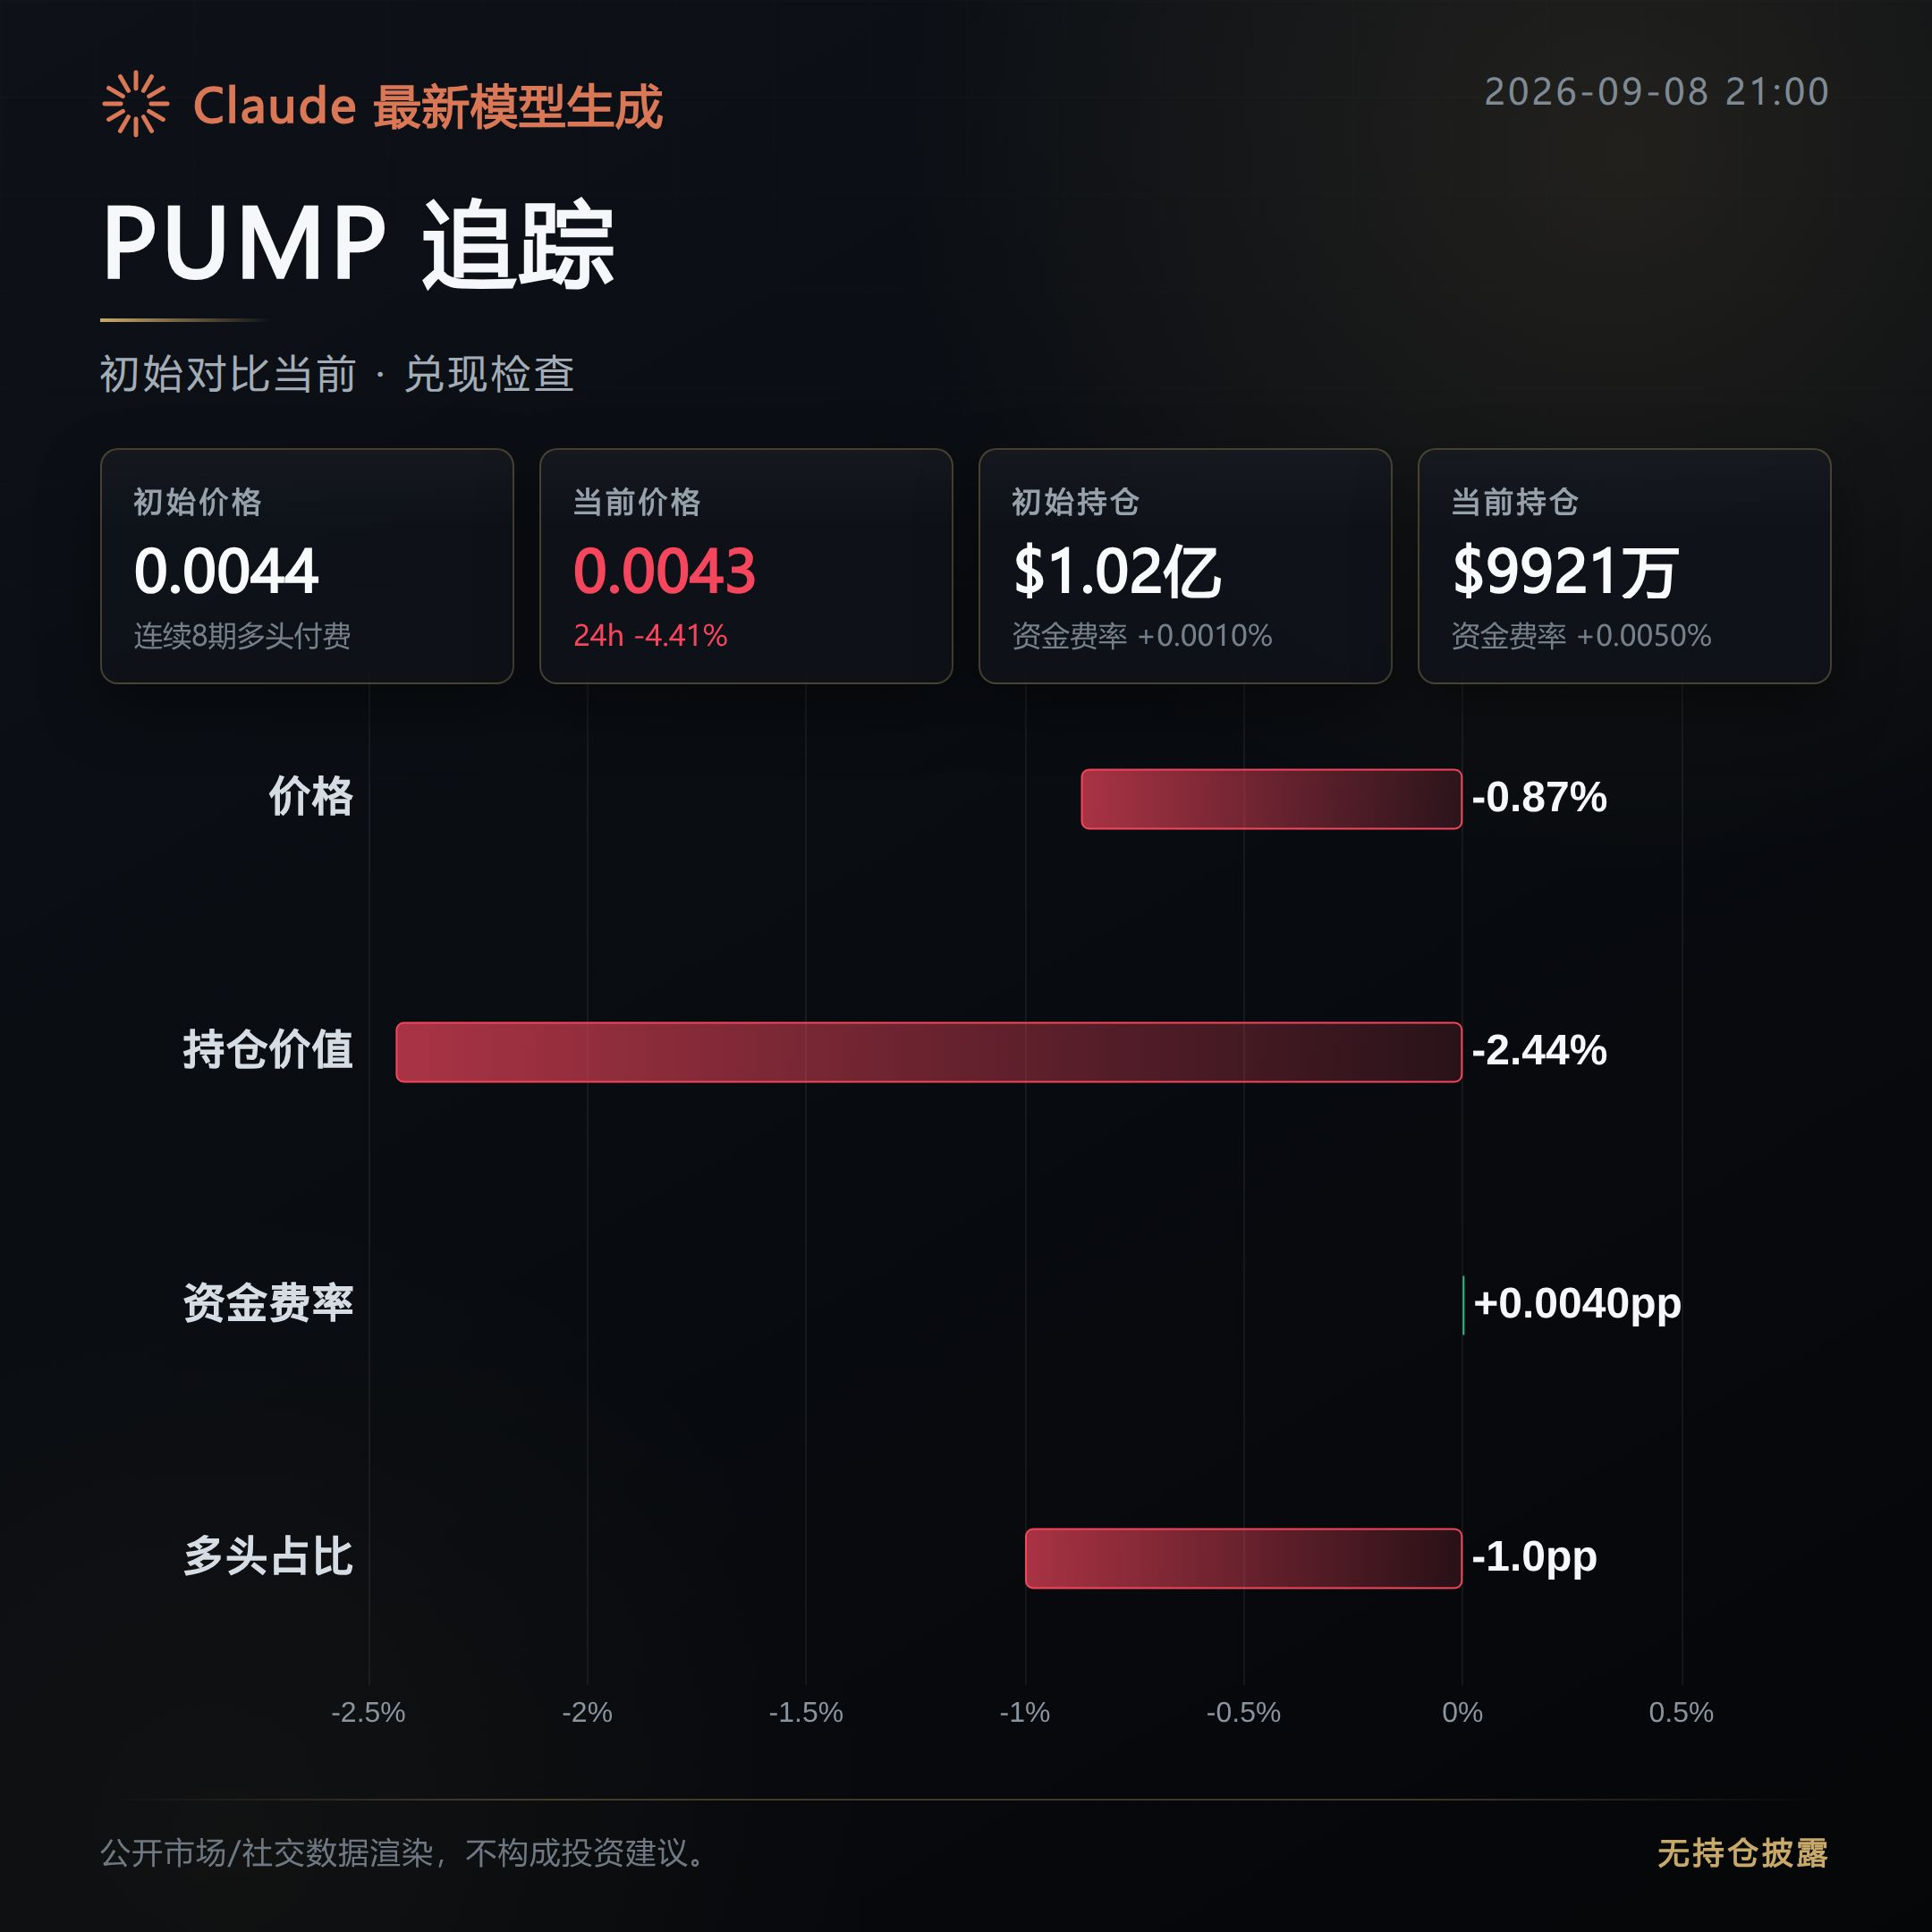
Now, let’s replay it based on the public order book: two of the three broke out; one is still being pulled and hasn’t confirmed a one-sided move yet.
The initial funding-flow observation was that the chips were being accumulated.
SOPH: realized profits; the bullish move seen in the morning broke out.
After the initial breakout, the price continued higher by 32.38%; the advance expanded from 37.93% to 41.84%, with no reversal in direction.
Open interest also increased by 22.18%, indicating the additional positions came in following the price rather than just circulating in place.
AERO: realized profits; the bullish move seen in the morning also broke out.
After the initial breakout, the price rose another 3.37%; the gain expanded from 11.5% to 17.74%, and the trend did not turn.
Open interest increased in sync by 4.08%; the long side share rose to 63%. The side willing to add positions with the trend has been increasing.
PUMP: indecisive/being pulled back; the bullish move from the morning hasn’t broken out yet.
After the initial breakout, it almost went flat, down only 0.87%. During the session, the intraday gain went from 8.49% and briefly flipped to -4.41%, with the direction swinging back and forth.
More importantly, the active buy orders clearly cooled off: the buy-sell power ratio dropped from 1.34 to 0.64, meaning the strength chasing longs is shrinking. Open interest also slipped slightly by 2.44%, and positions weren’t followed up further.
Next, you can keep watching this line: for SOPH and AERO, see whether open interest can continue rising along with the price, and whether the proportion of active buy orders can regain a strong-zone position; for PUMP, see whether the price can stabilize back above and bring open interest back up. If the buy-sell power ratio continues to weaken and the price breaks below the initial breakout level, that’s the counter-evidence that this bullish setup didn’t work.
#SOPH #AERO #PUMP
Live record: this account currently holds $FOGO long positions; as long as the logic doesn’t change, it will continue to be held.
Claude Fable 5 used for assistance in generating content; this is for market information reference only and does not constitute investment advice.
Now, let’s replay it based on the public order book: two of the three broke out; one is still being pulled and hasn’t confirmed a one-sided move yet.
The initial funding-flow observation was that the chips were being accumulated.
SOPH: realized profits; the bullish move seen in the morning broke out.
After the initial breakout, the price continued higher by 32.38%; the advance expanded from 37.93% to 41.84%, with no reversal in direction.
Open interest also increased by 22.18%, indicating the additional positions came in following the price rather than just circulating in place.
AERO: realized profits; the bullish move seen in the morning also broke out.
After the initial breakout, the price rose another 3.37%; the gain expanded from 11.5% to 17.74%, and the trend did not turn.
Open interest increased in sync by 4.08%; the long side share rose to 63%. The side willing to add positions with the trend has been increasing.
PUMP: indecisive/being pulled back; the bullish move from the morning hasn’t broken out yet.
After the initial breakout, it almost went flat, down only 0.87%. During the session, the intraday gain went from 8.49% and briefly flipped to -4.41%, with the direction swinging back and forth.
More importantly, the active buy orders clearly cooled off: the buy-sell power ratio dropped from 1.34 to 0.64, meaning the strength chasing longs is shrinking. Open interest also slipped slightly by 2.44%, and positions weren’t followed up further.
Next, you can keep watching this line: for SOPH and AERO, see whether open interest can continue rising along with the price, and whether the proportion of active buy orders can regain a strong-zone position; for PUMP, see whether the price can stabilize back above and bring open interest back up. If the buy-sell power ratio continues to weaken and the price breaks below the initial breakout level, that’s the counter-evidence that this bullish setup didn’t work.
#SOPH #AERO #PUMP
Live record: this account currently holds $FOGO long positions; as long as the logic doesn’t change, it will continue to be held.
Claude Fable 5 used for assistance in generating content; this is for market information reference only and does not constitute investment advice.
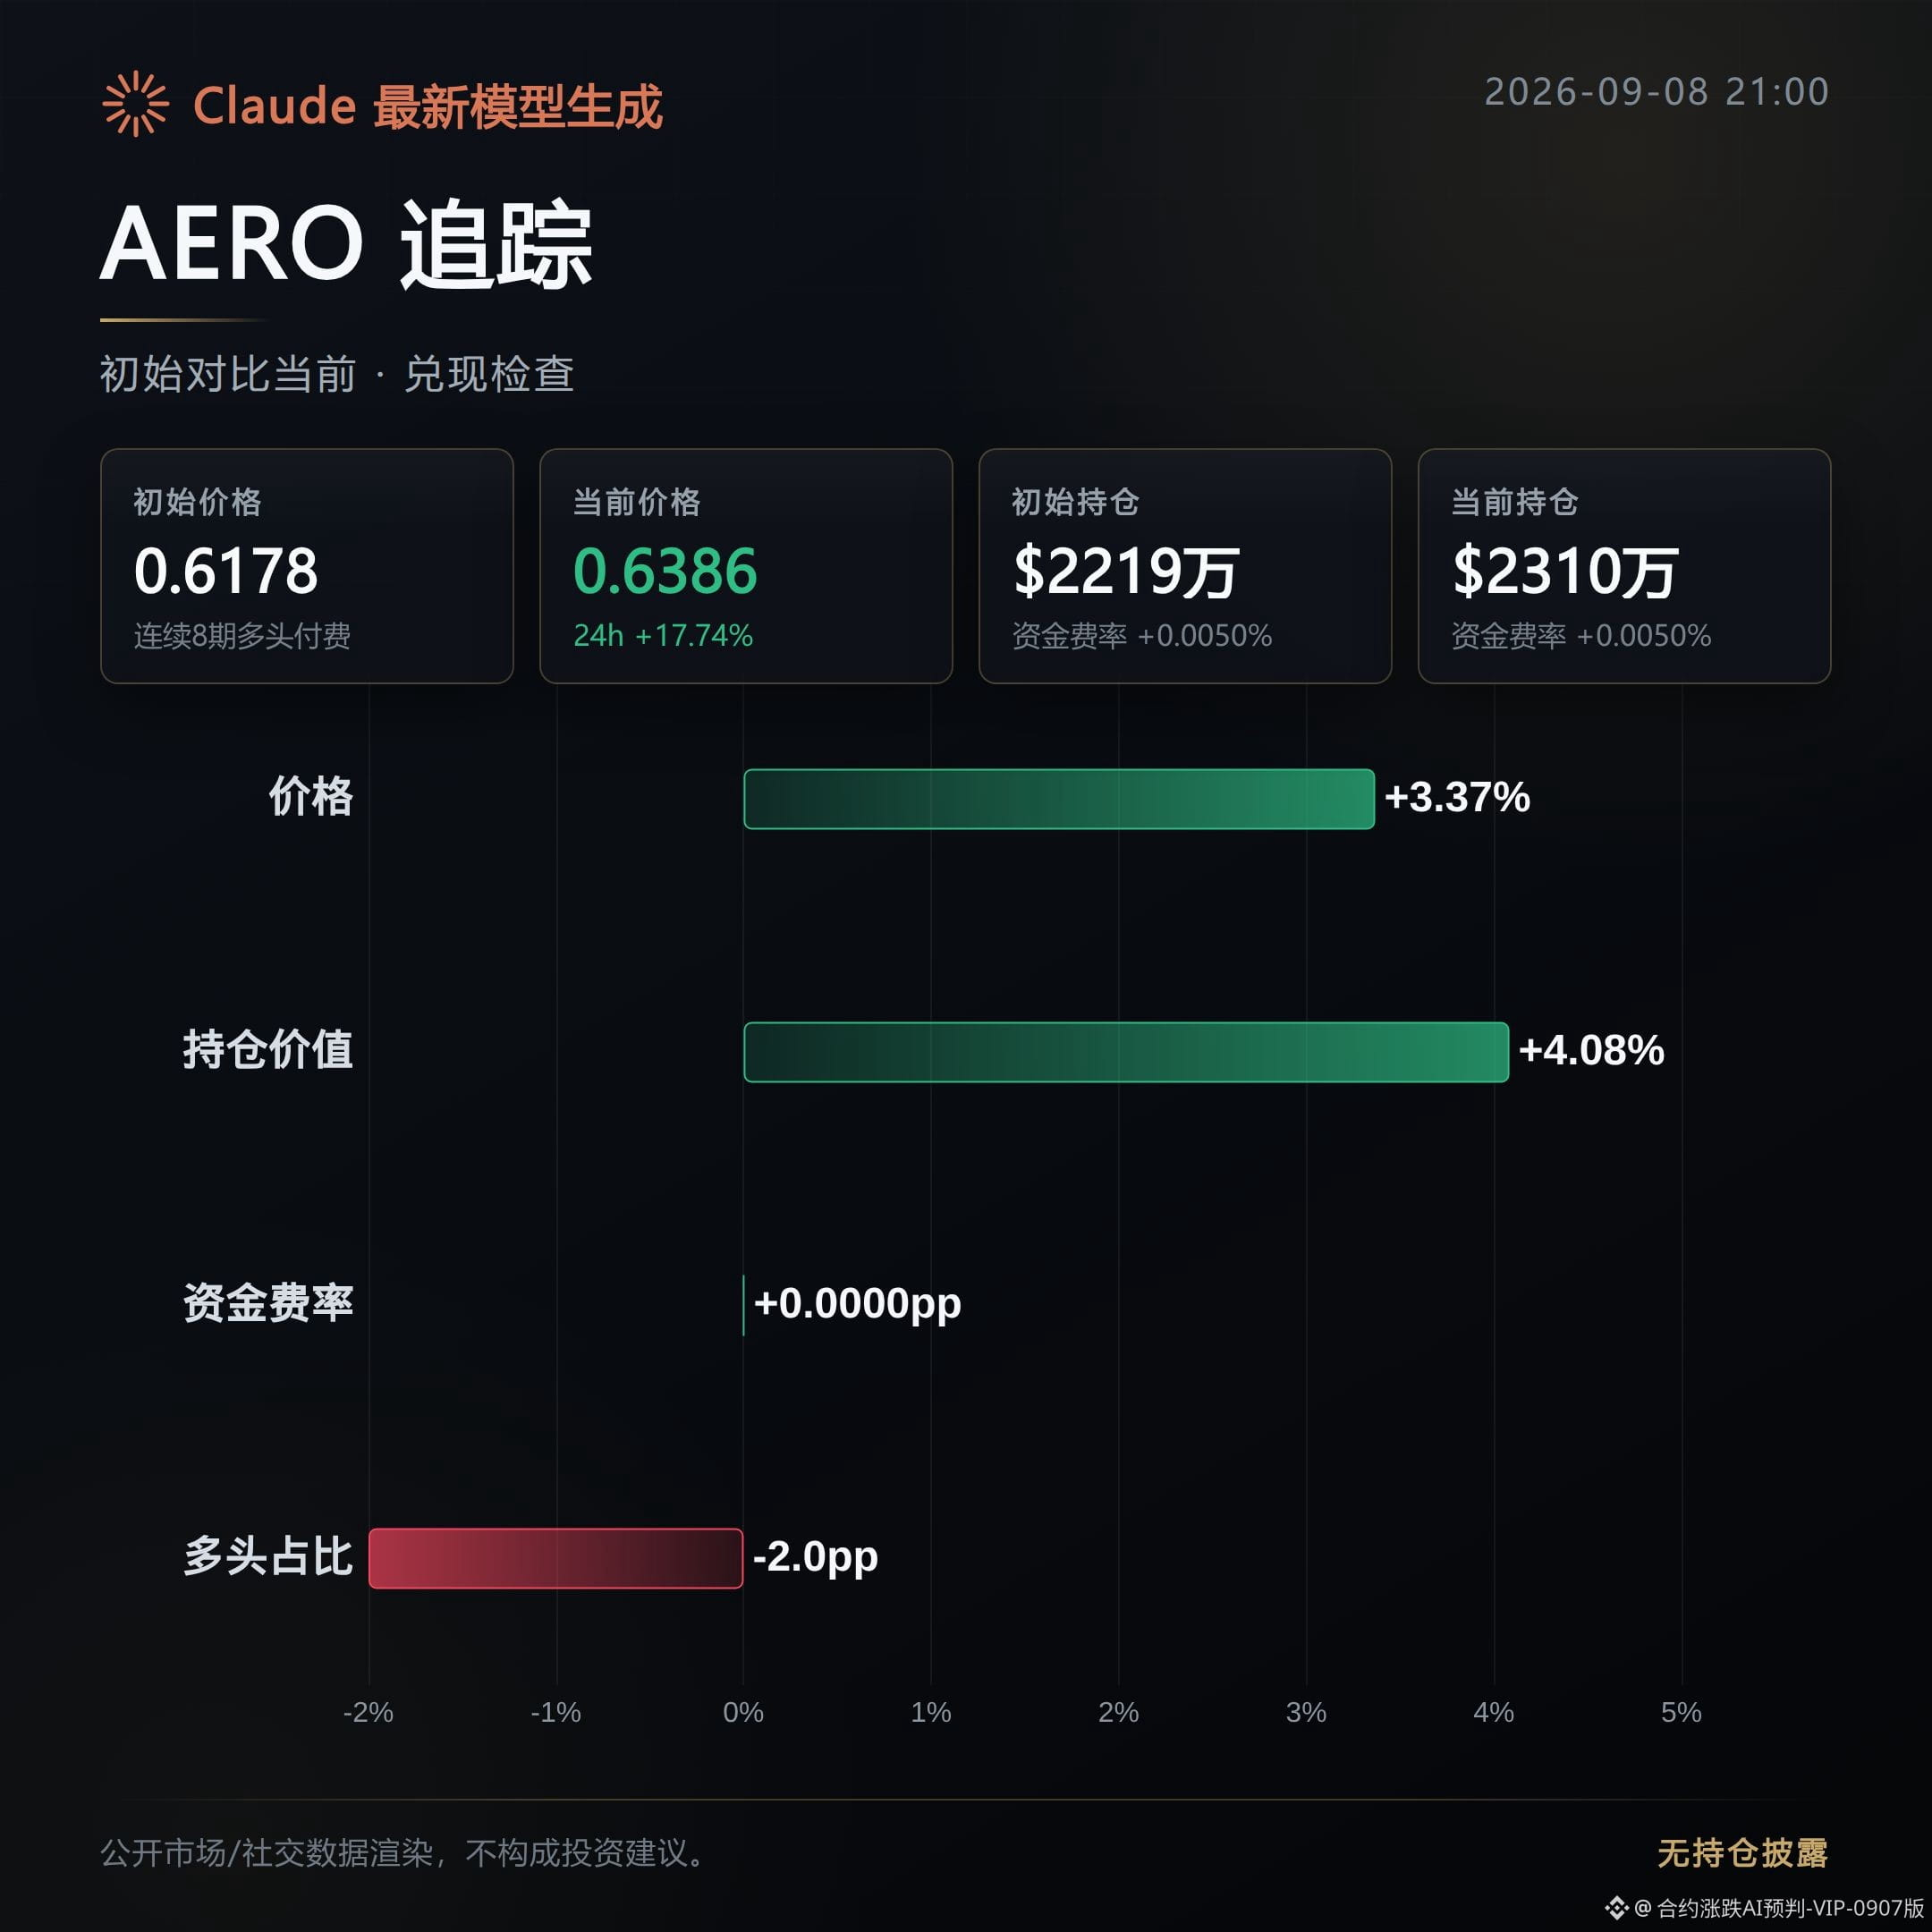
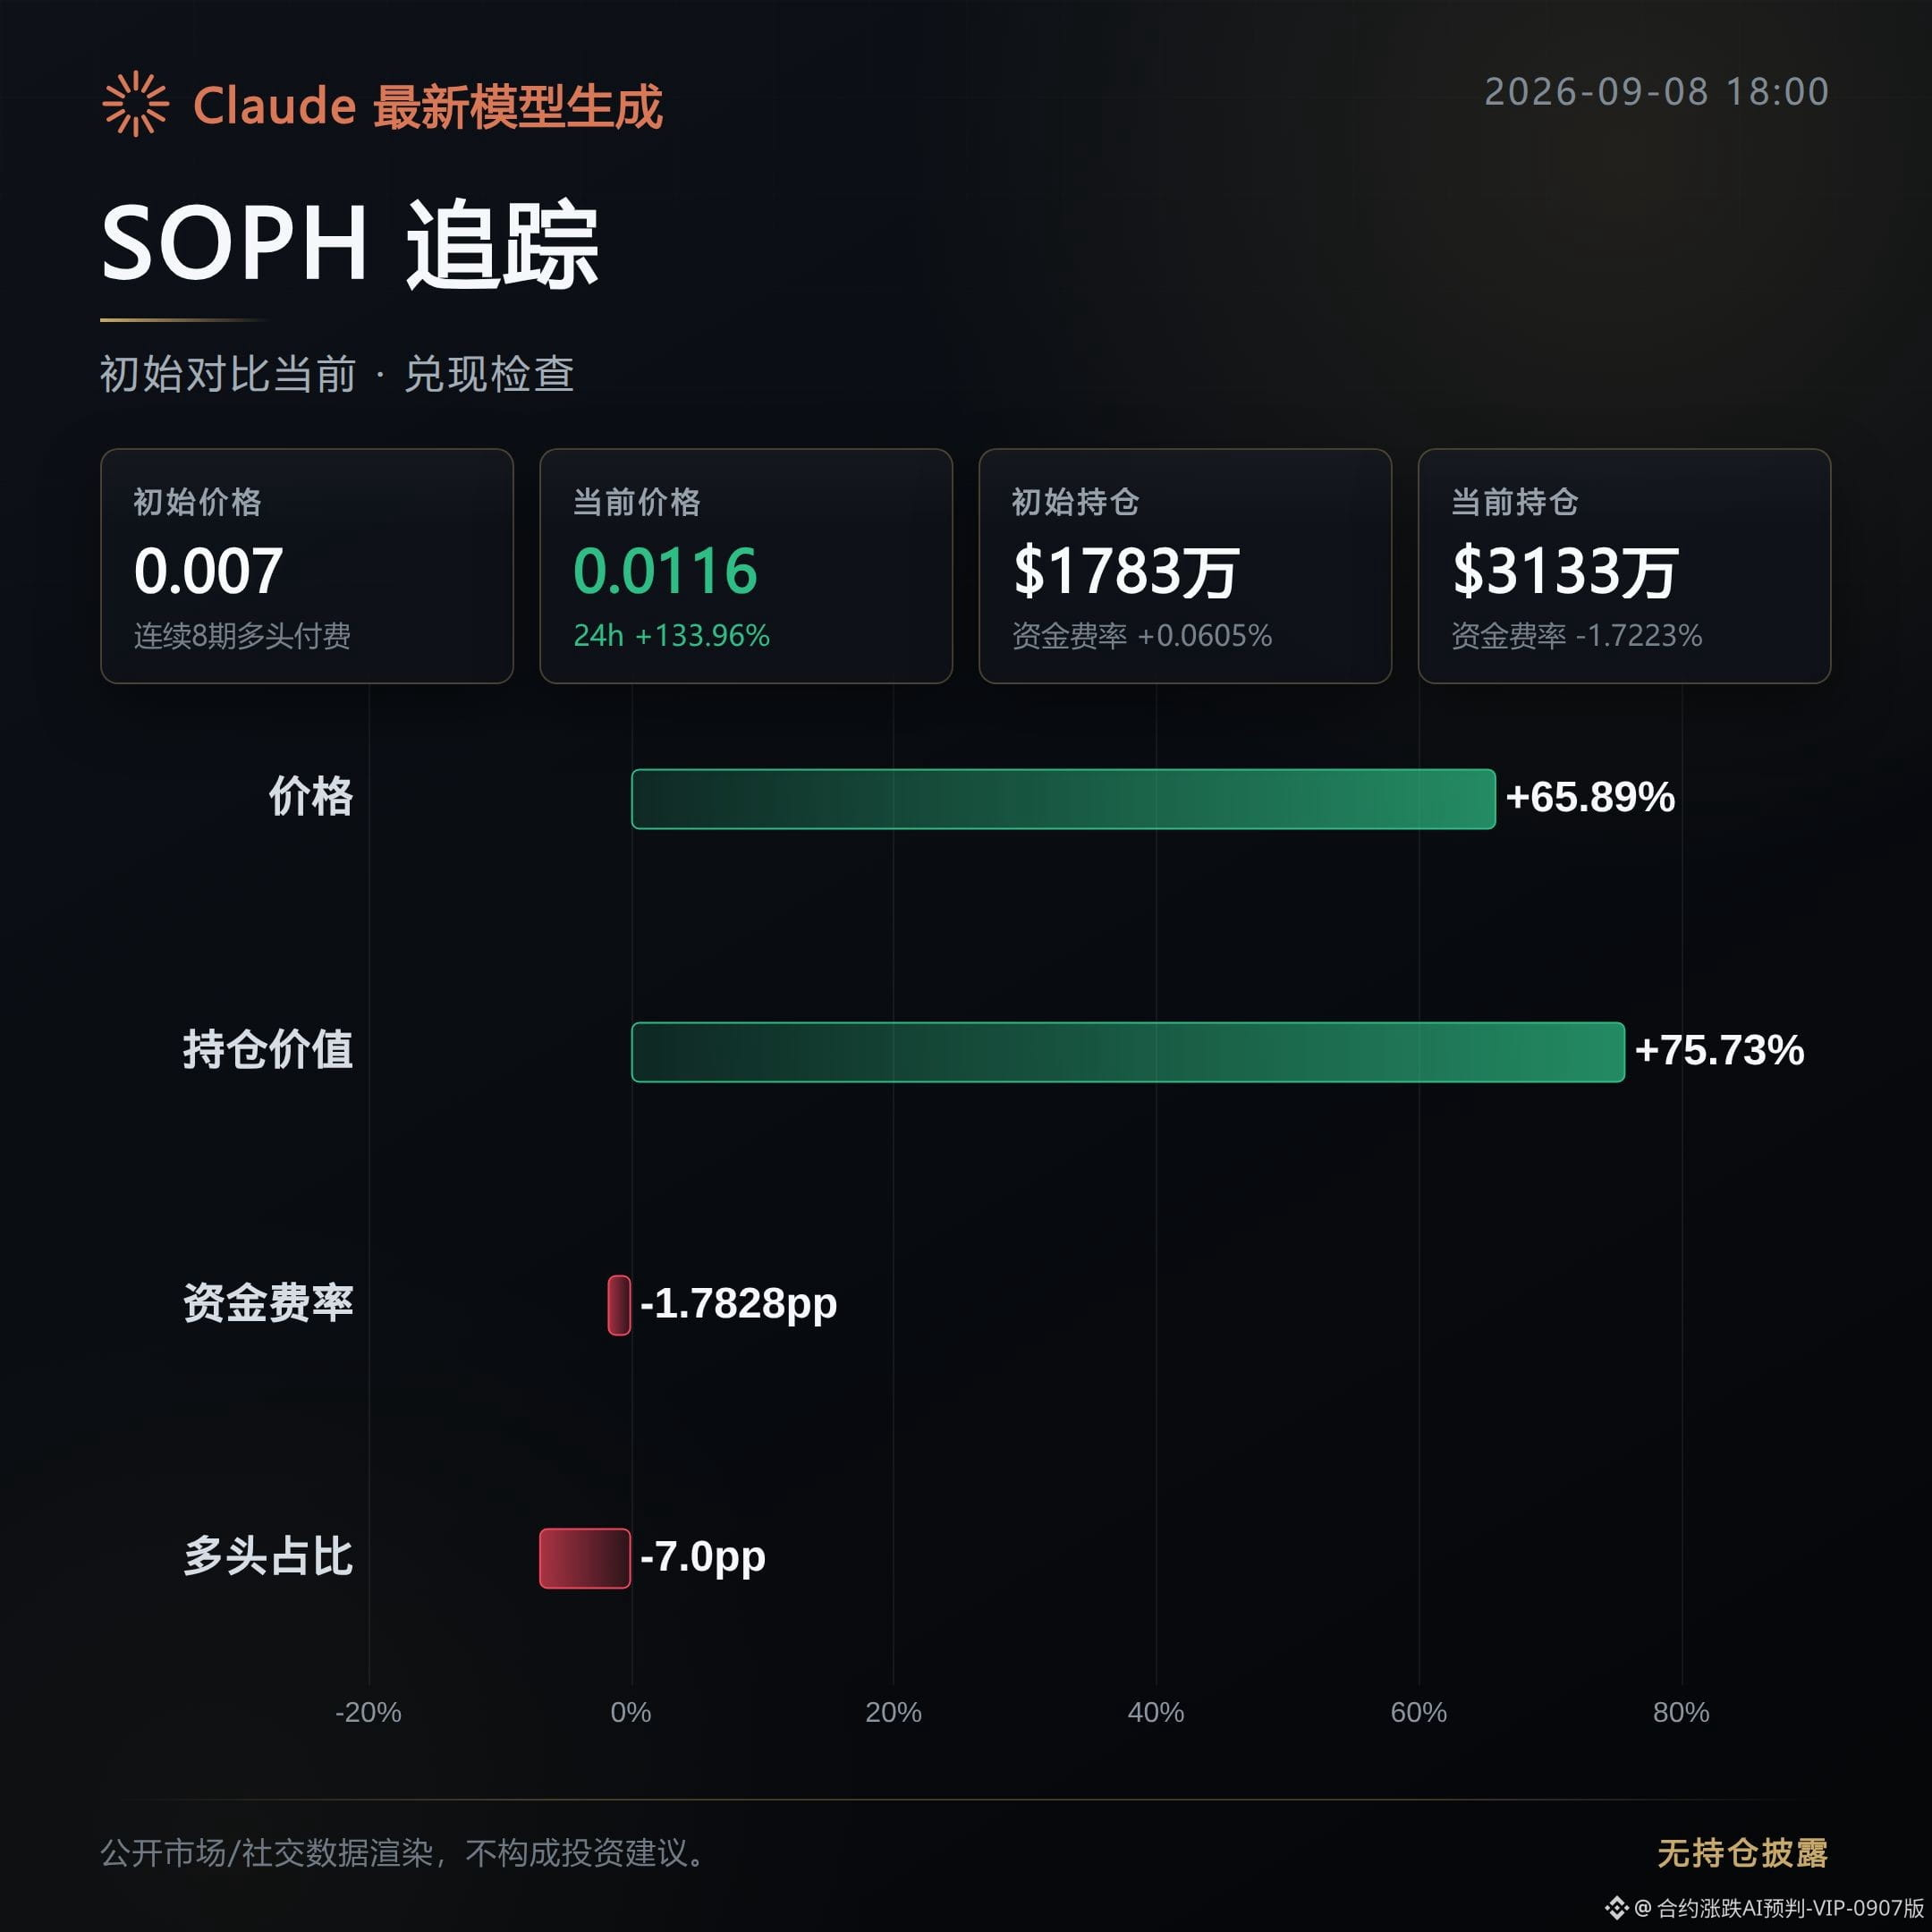
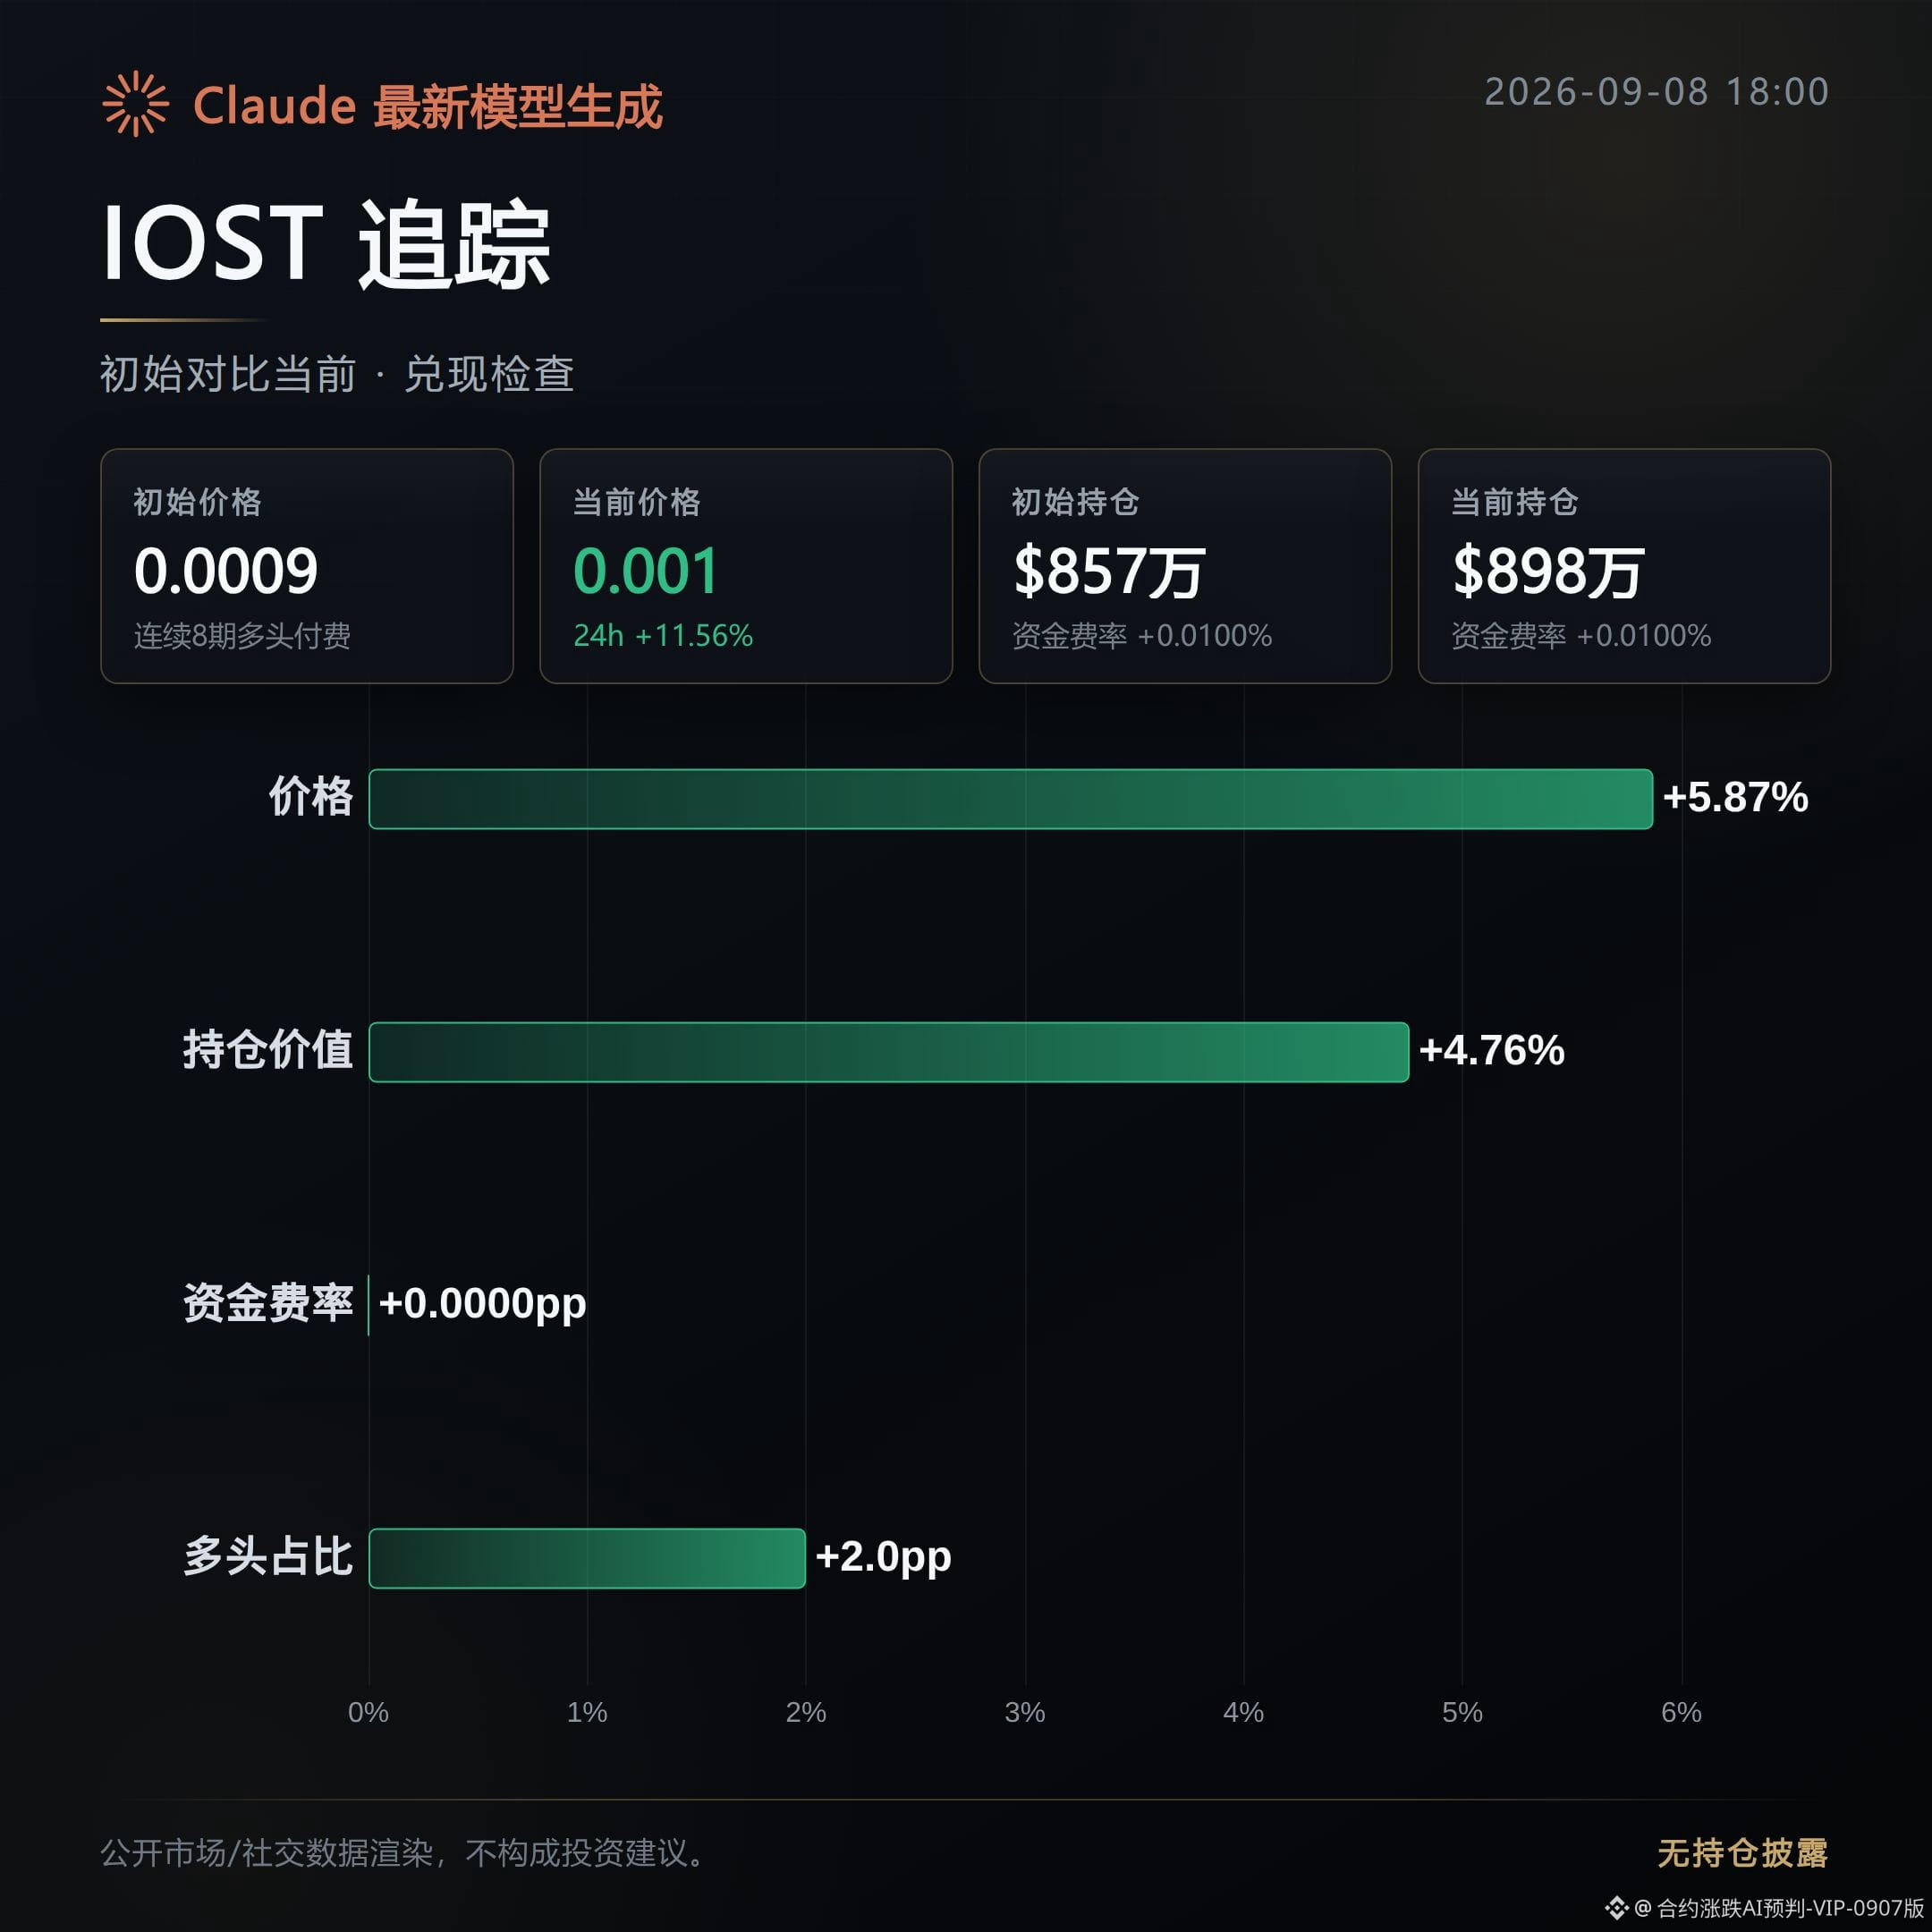
Top 3 gainers in the last 24 hours this morning—we’re pulling the data now to reconcile.
SOPH is being realized; keep pushing. The price is up 65.89% versus the first release. Open interest increased from $17.82M to $31.33M, up 75.73%. The funding rate flipped from 0.0605% to -1.7223%, changing from positive to negative—longs start paying. However, the proportion of aggressive buy orders is still 1.01, and the price hasn’t pulled back in line with the funding rate. RSI has reached 91.5 and is in the long upper-wick zone.
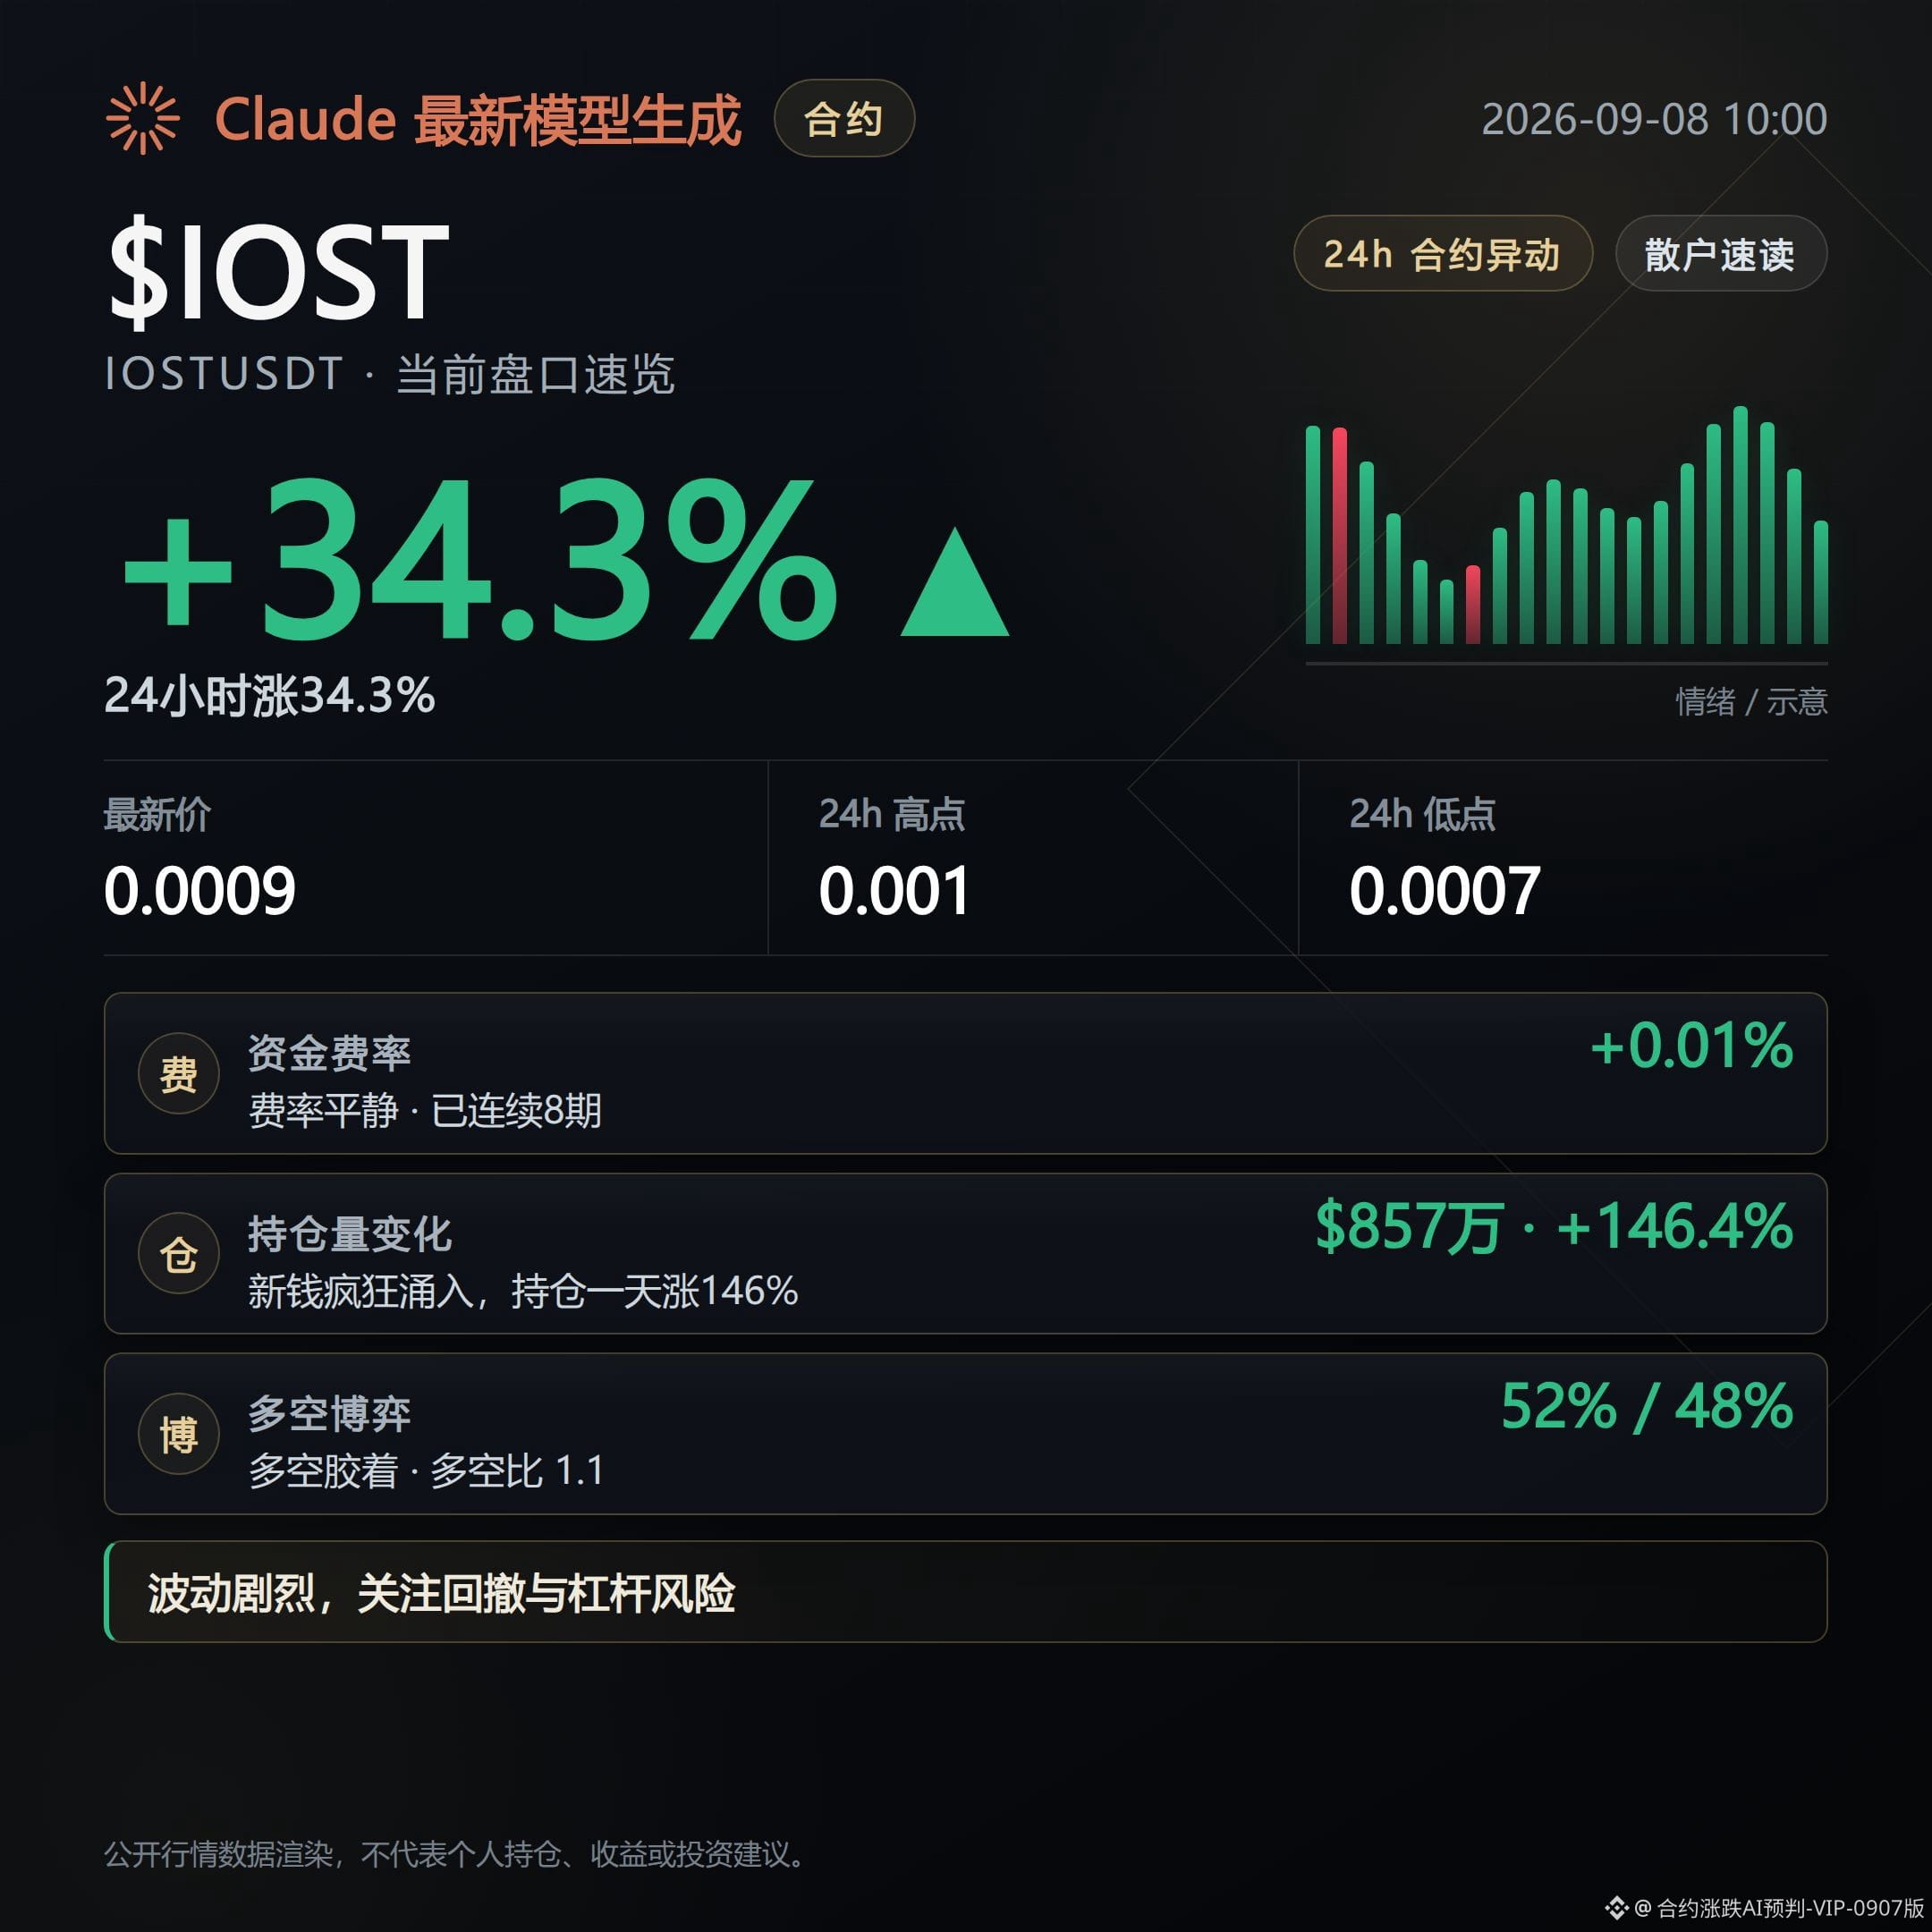
IOST is being realized, but momentum is weakening. The price is up 5.87% versus the first release, but open interest only increased by 4.76%. The funding rate stays flat at 0.01%. Aggressive buy order share is 0.96, basically unchanged from 0.95 at the first release. Volume is up 48.94%, but it didn’t turn into new positions—more like existing capital is still in a tug-of-war.
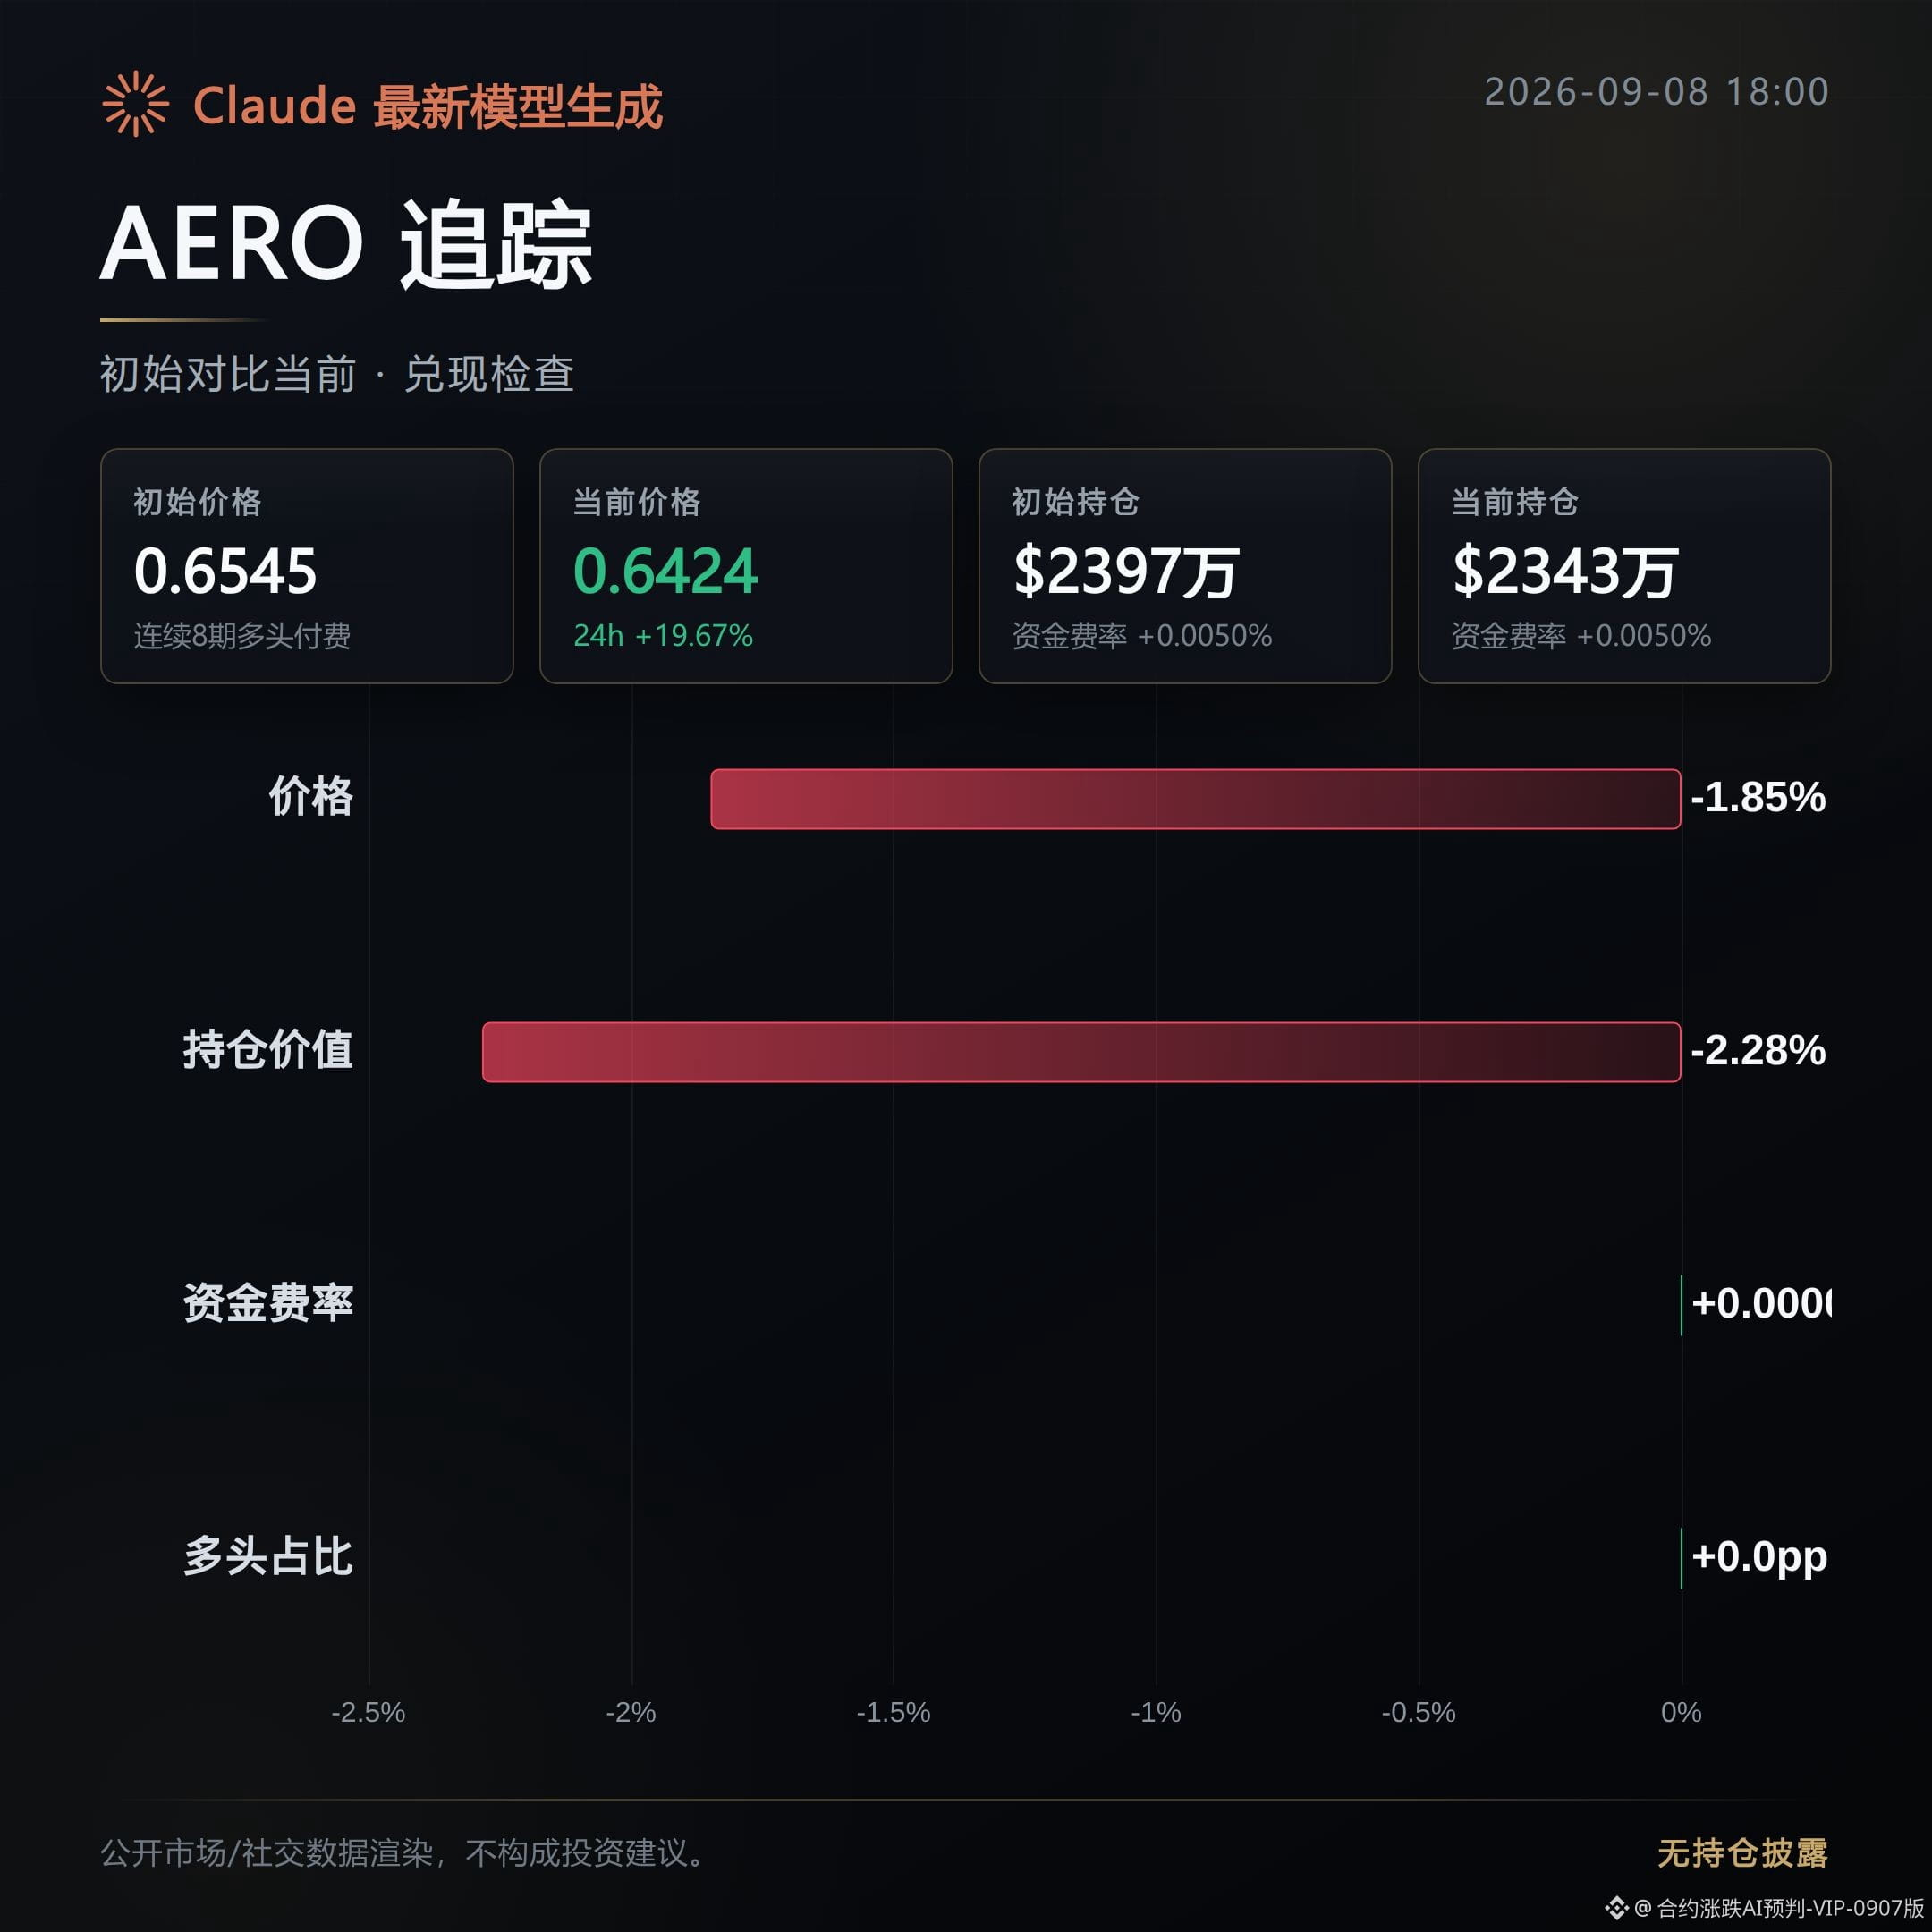
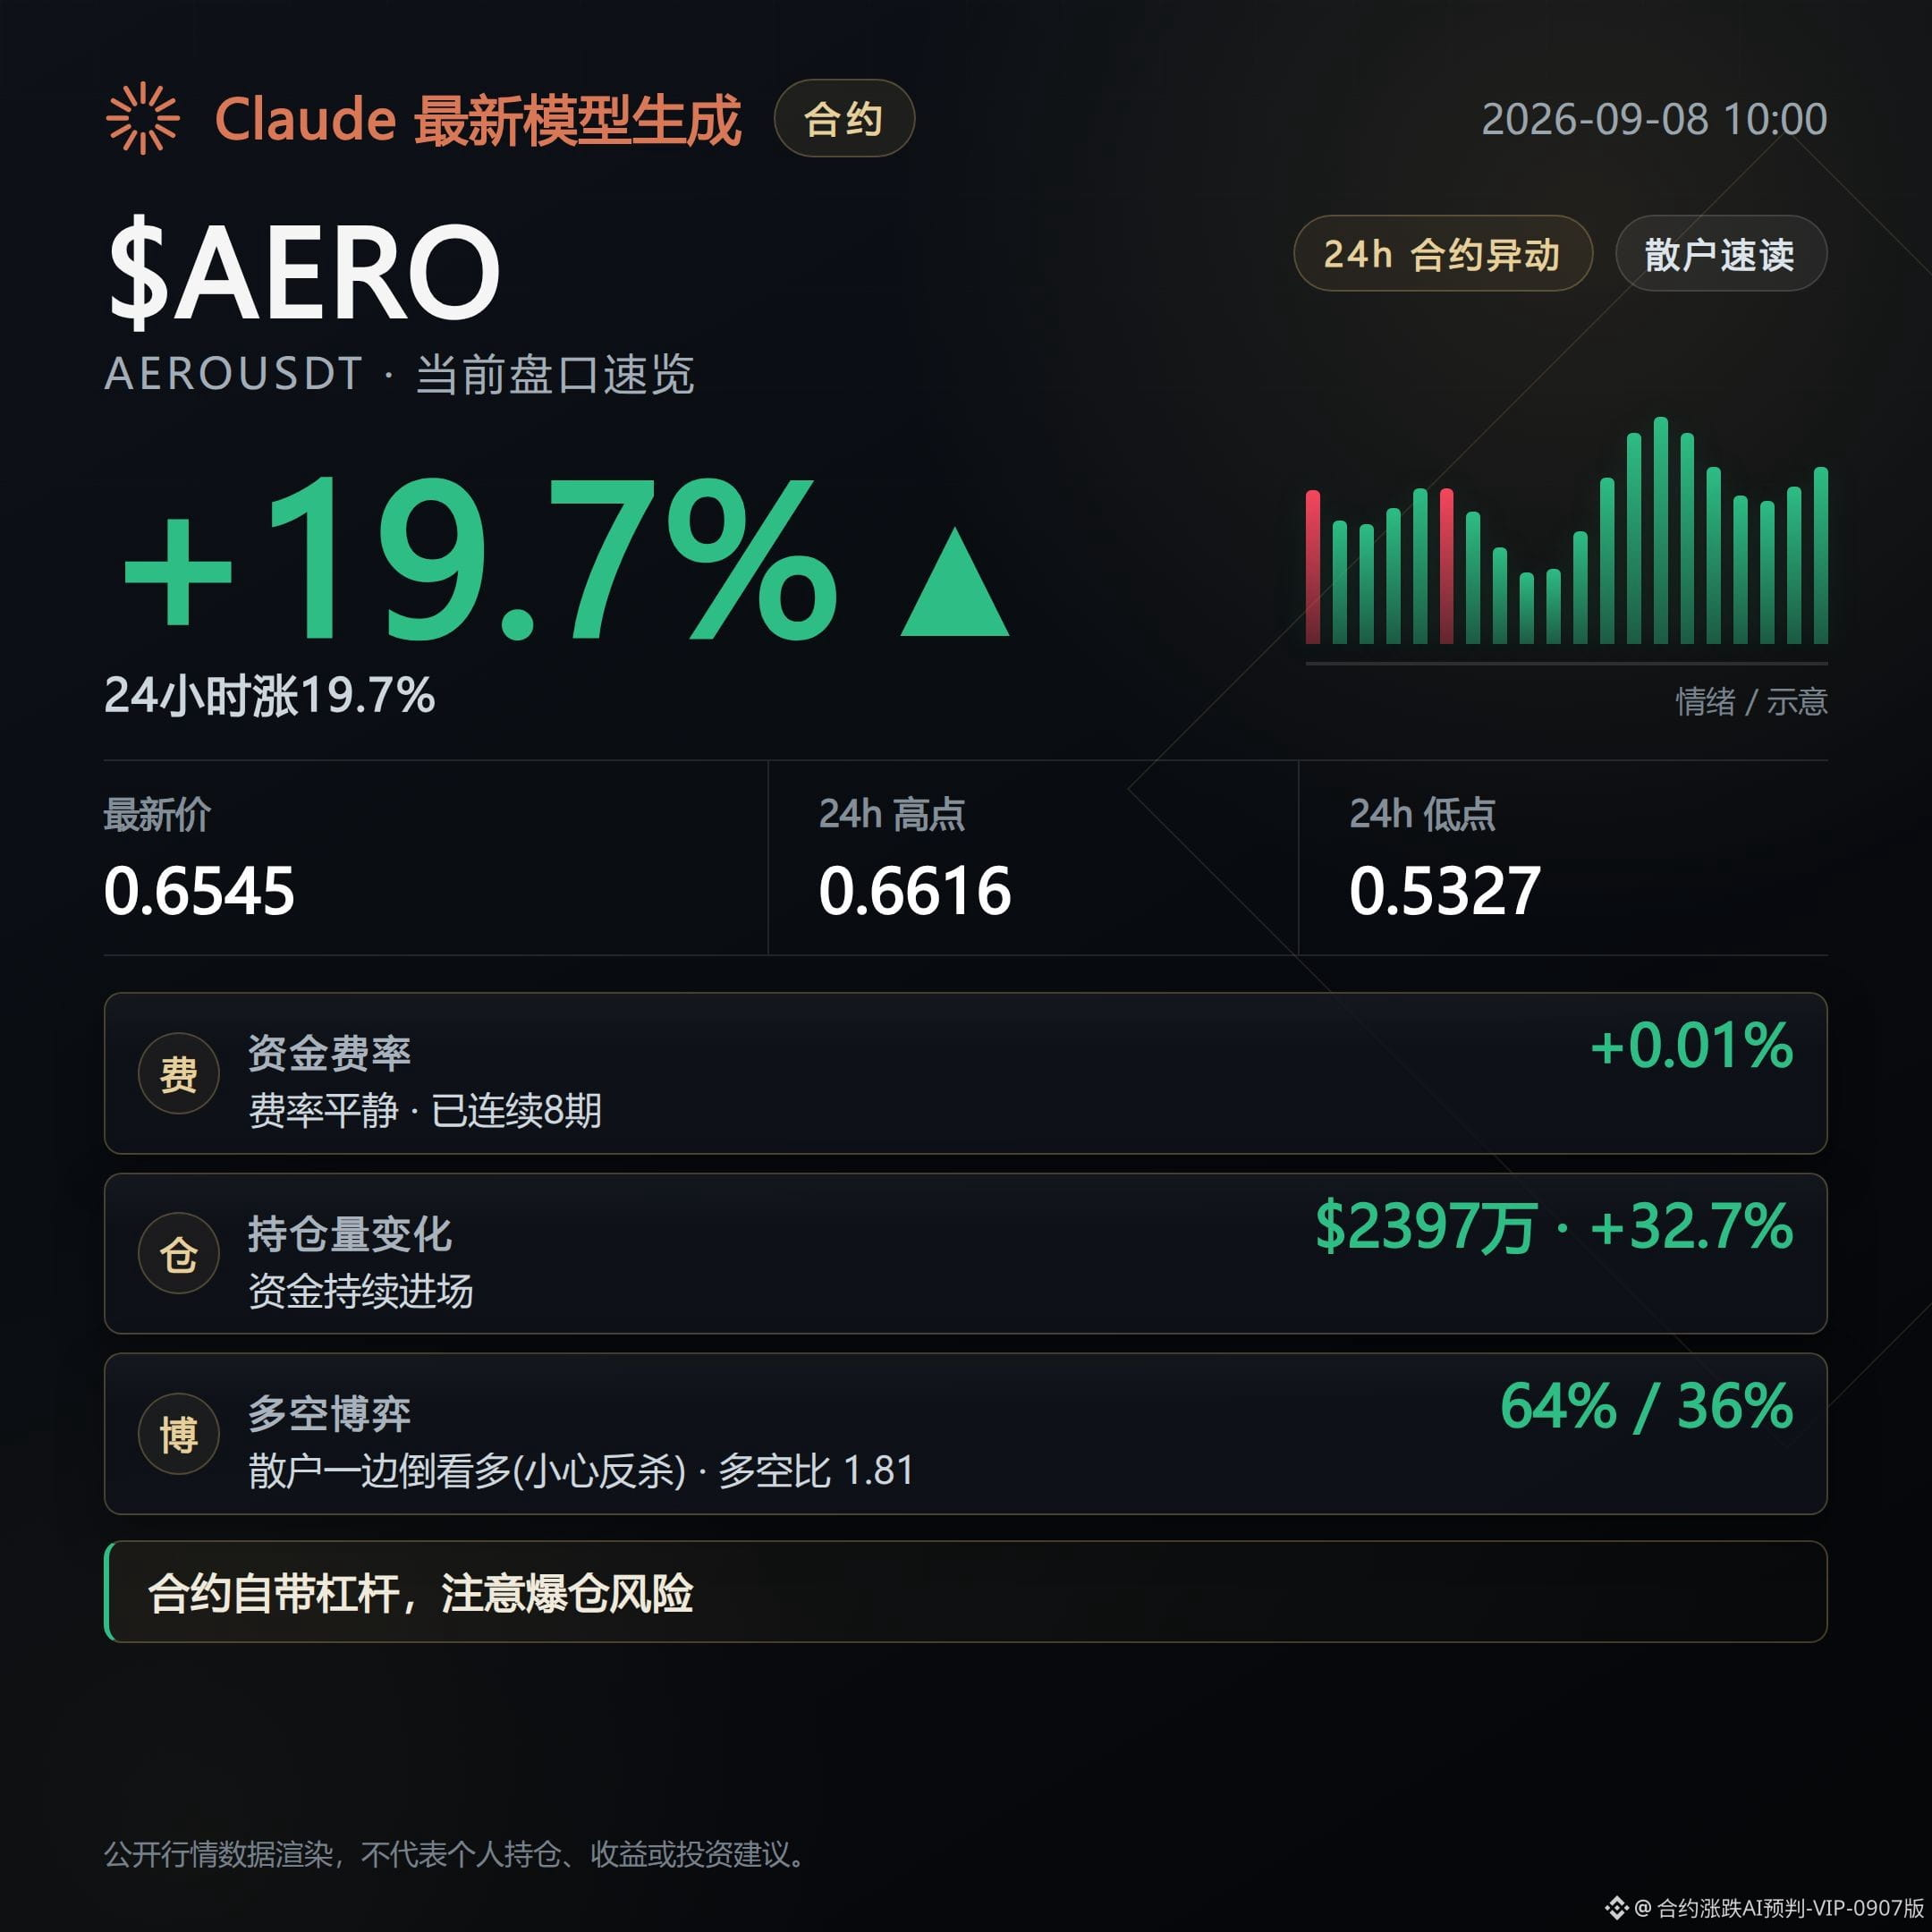
AERO is in a tug; there’s no one-direction confirmation. The price is down 1.85% versus the first release. Open interest shrank by 2.28%. The aggressive buy order share dropped from 1.05 to 0.88—buying strength clearly faded. The funding rate at 0.005% didn’t change. The long/short ratio is 64% longs, but it’s diverging from the weaker price.
Among the three coins: SOPH has a negative funding rate and RSI above 90—highest concentration of risk when chasing after a surge. IOST shows price-volume divergence, and new capital hasn’t kept up. AERO has crowded longs but the price isn’t rising—watch out for a slide from the highs.
Live trading record: This account currently holds $FOGO long positions; the logic is unchanged, so we’ll continue holding.
This content is generated with the assistance of Claude Fable 5 for reference only—please verify it yourself.
SOPH is being realized; keep pushing. The price is up 65.89% versus the first release. Open interest increased from $17.82M to $31.33M, up 75.73%. The funding rate flipped from 0.0605% to -1.7223%, changing from positive to negative—longs start paying. However, the proportion of aggressive buy orders is still 1.01, and the price hasn’t pulled back in line with the funding rate. RSI has reached 91.5 and is in the long upper-wick zone.
IOST is being realized, but momentum is weakening. The price is up 5.87% versus the first release, but open interest only increased by 4.76%. The funding rate stays flat at 0.01%. Aggressive buy order share is 0.96, basically unchanged from 0.95 at the first release. Volume is up 48.94%, but it didn’t turn into new positions—more like existing capital is still in a tug-of-war.
AERO is in a tug; there’s no one-direction confirmation. The price is down 1.85% versus the first release. Open interest shrank by 2.28%. The aggressive buy order share dropped from 1.05 to 0.88—buying strength clearly faded. The funding rate at 0.005% didn’t change. The long/short ratio is 64% longs, but it’s diverging from the weaker price.
Among the three coins: SOPH has a negative funding rate and RSI above 90—highest concentration of risk when chasing after a surge. IOST shows price-volume divergence, and new capital hasn’t kept up. AERO has crowded longs but the price isn’t rising—watch out for a slide from the highs.
Live trading record: This account currently holds $FOGO long positions; the logic is unchanged, so we’ll continue holding.
This content is generated with the assistance of Claude Fable 5 for reference only—please verify it yourself.
About 6 hours ago, this batch is a bearish replay following the morning high-level distribution warning.
The three contracts issued in the morning warning—now one has exited to realize the move; CFG and WLD are still tugging back and forth, with no unilateral downside confirmation.
At the time, the initial observation was: “chips are dispersing.”
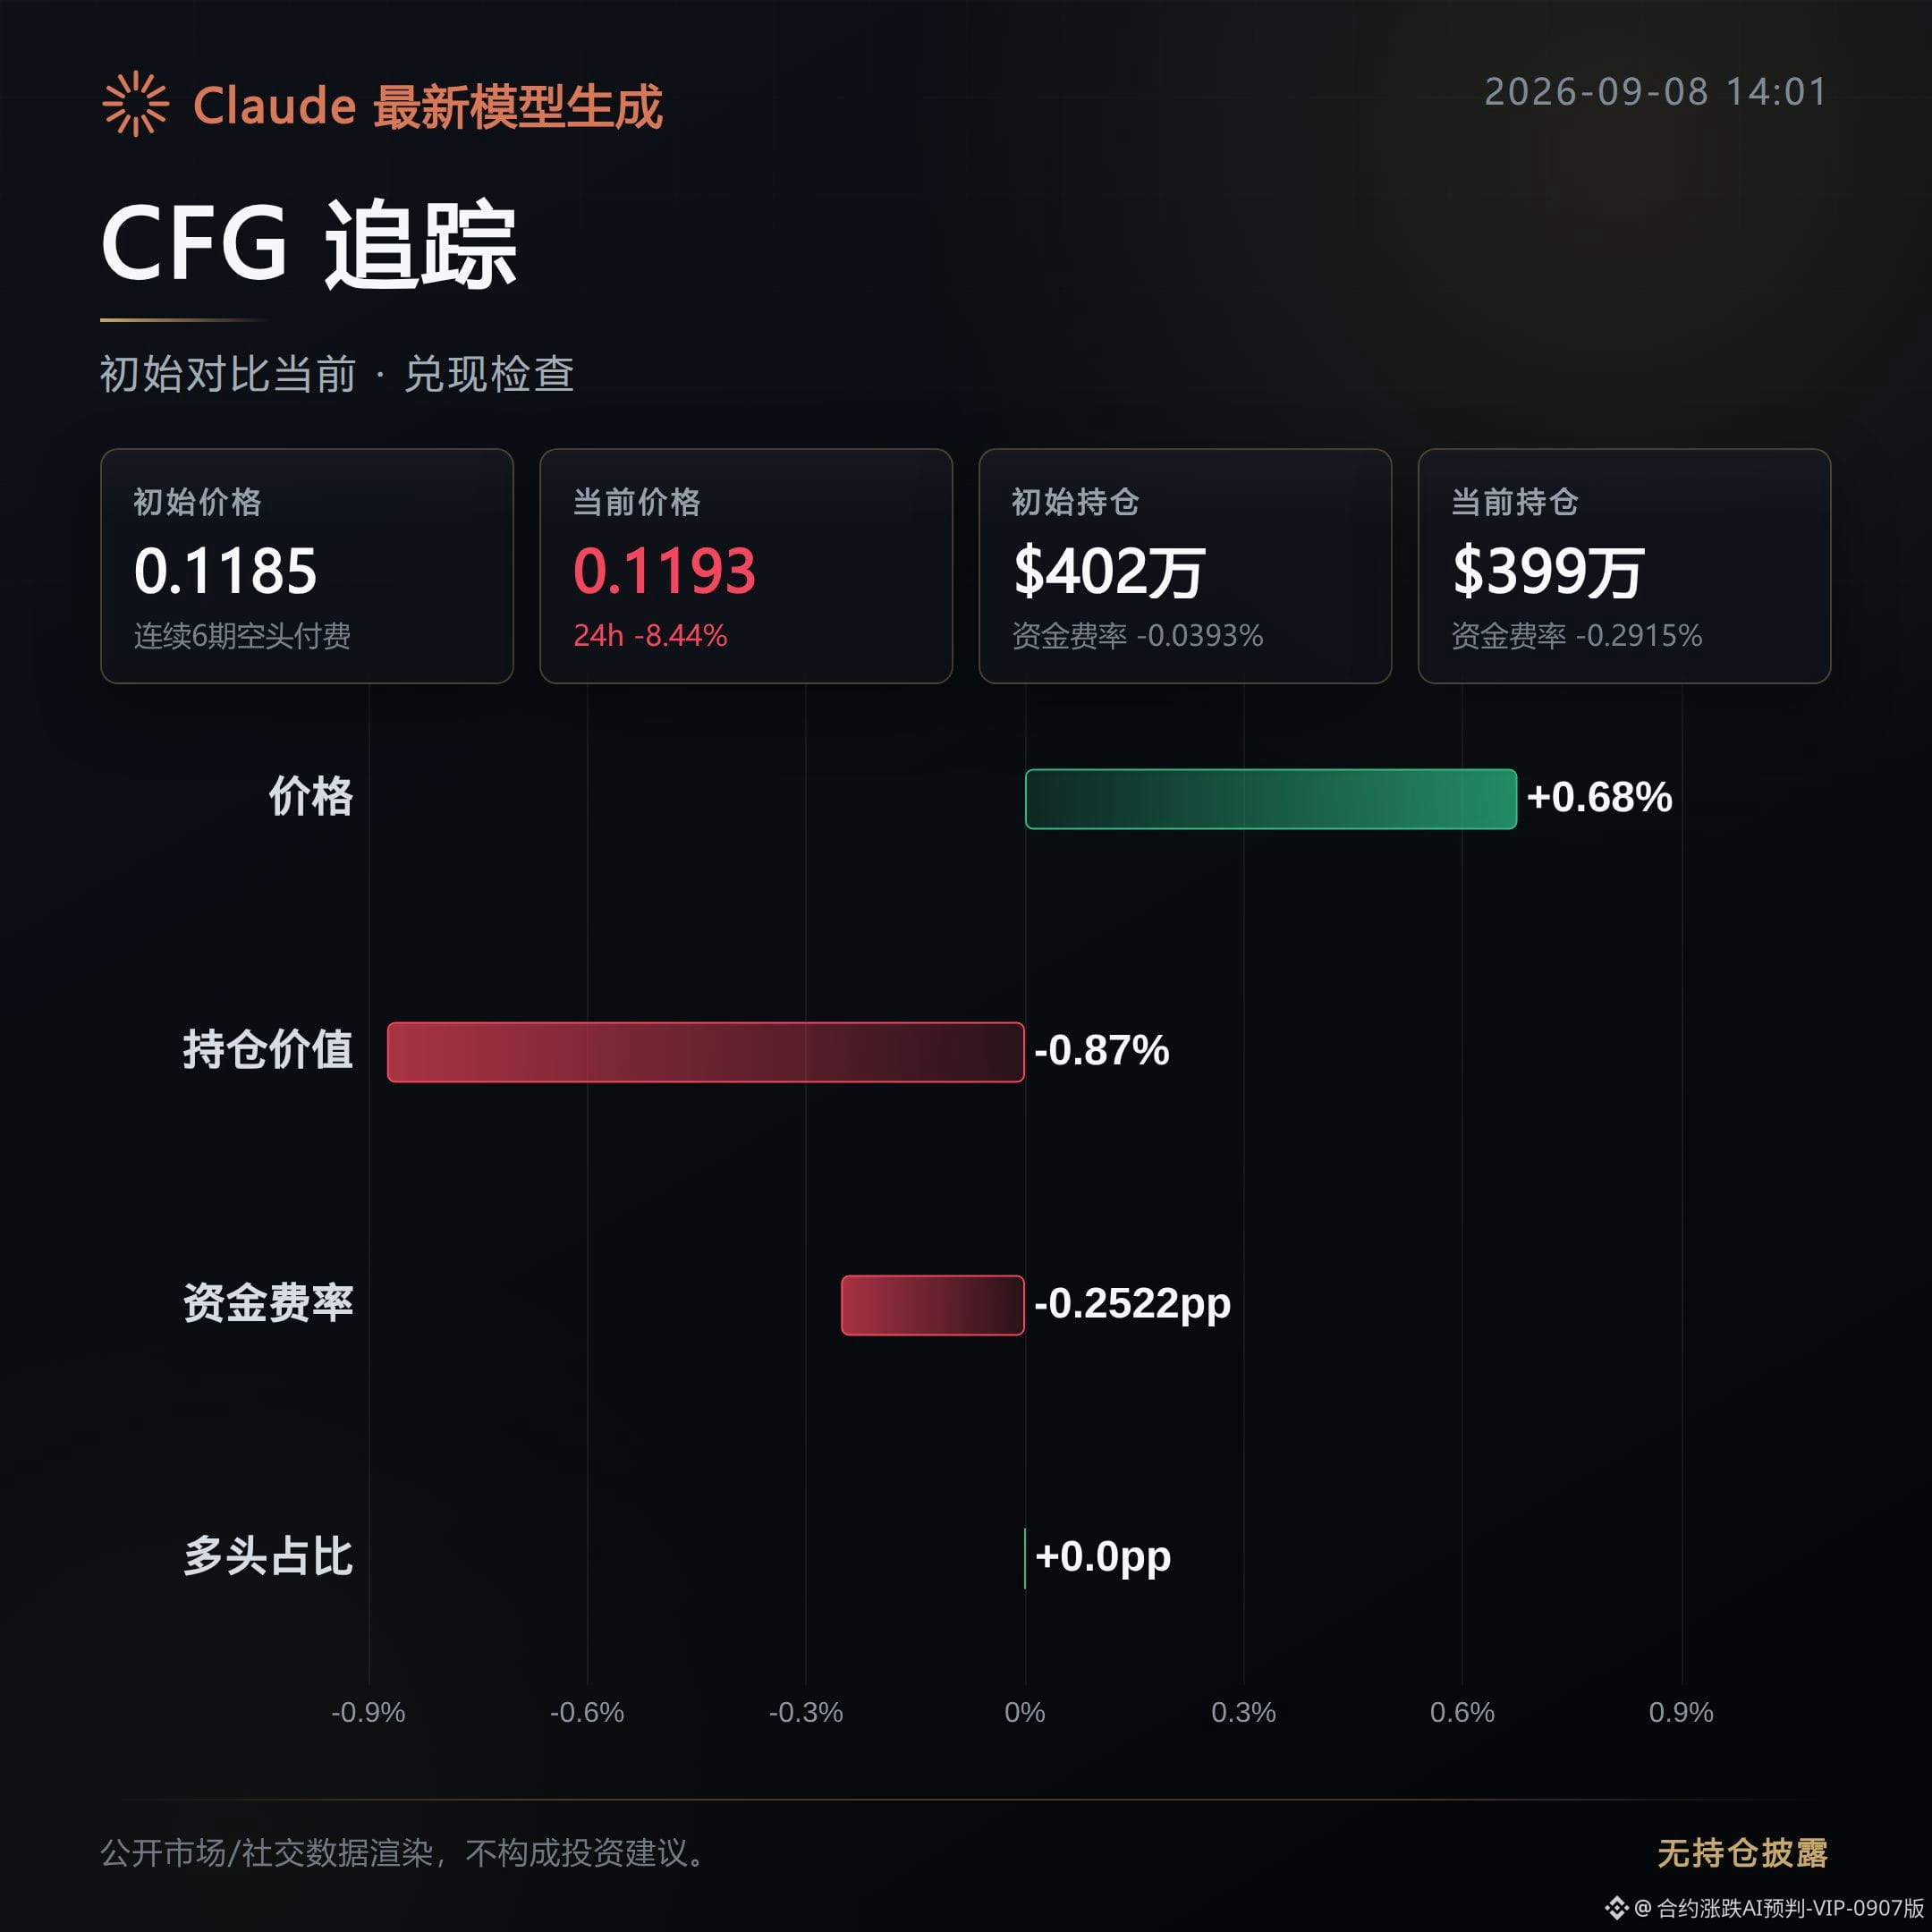
CFG: Tugging, and the morning bearish direction has not played out yet.
Price is basically going in place; since the initial release it has only risen by 0.68%, without following through on the downside.
The percentage of aggressive buy orders increased from 0.71 to 1.01—buys not only didn’t retreat, but actually grew, indicating that there is still support and that the distribution has not produced an effective sell-off pressure.
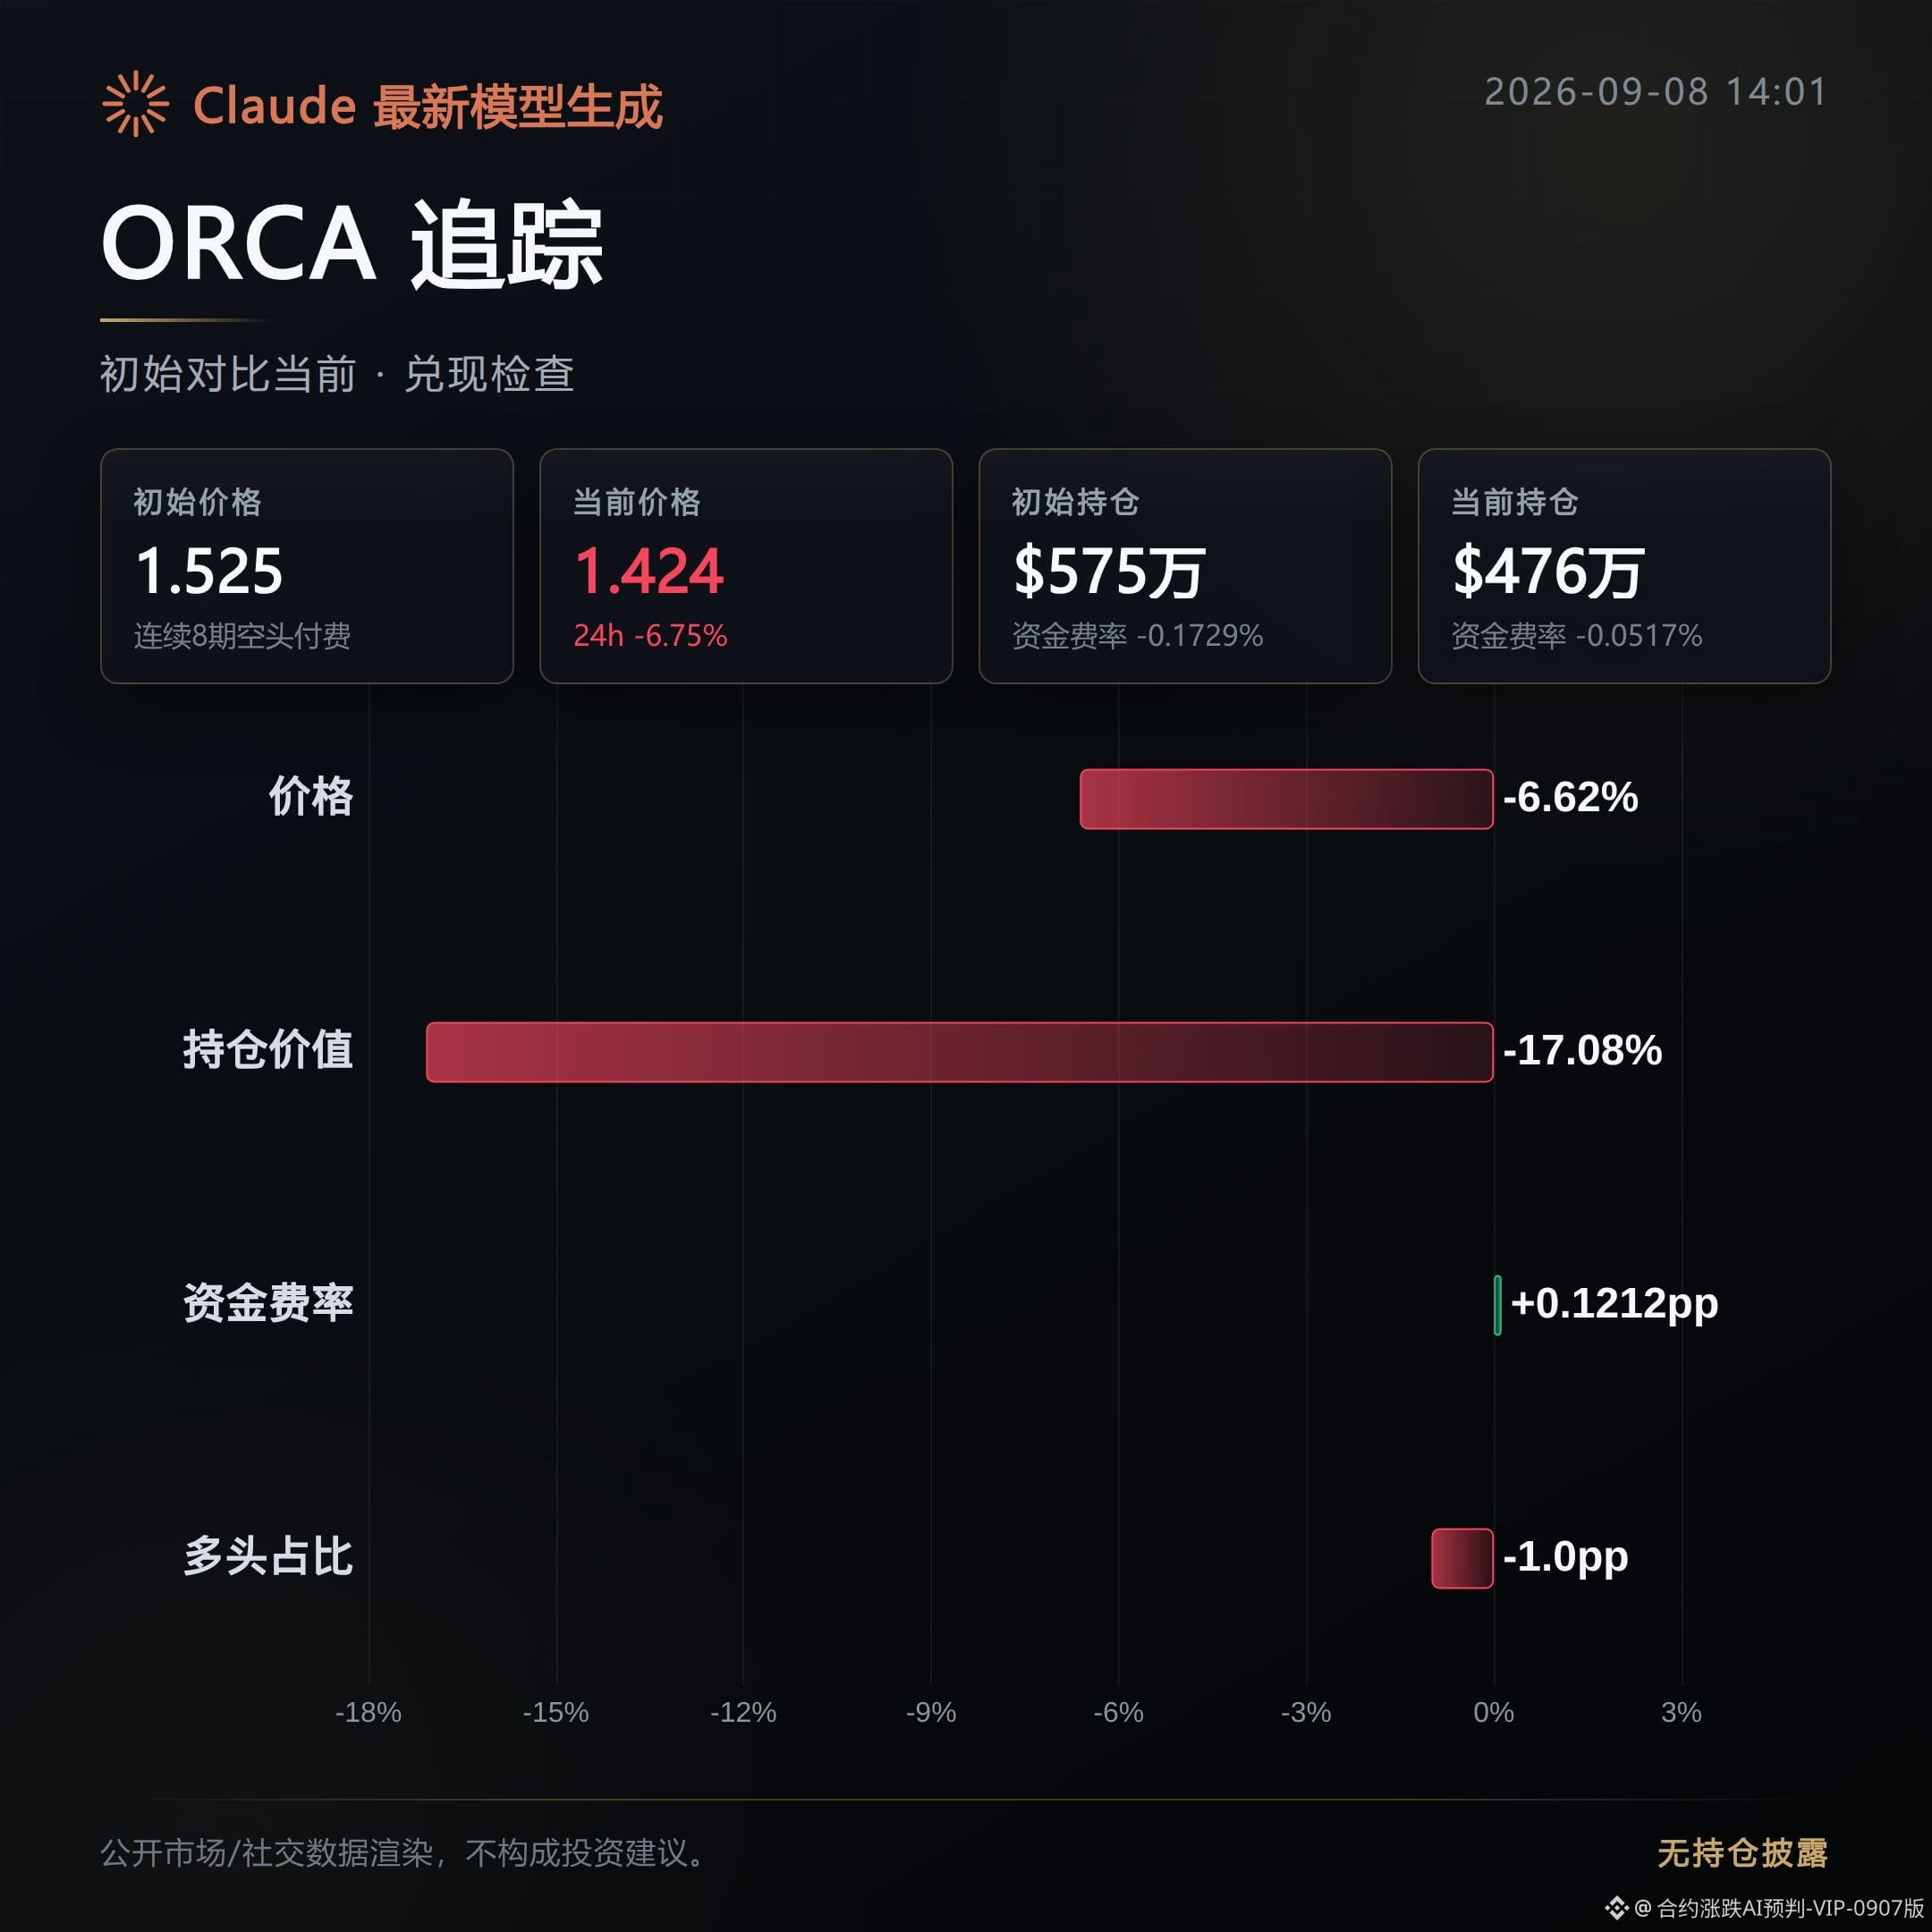
ORCA: Realized. The morning bearish judgment has finally played out.
Since the initial release, the price is down 6.62%, and it is already weak in a one-directional way.
More importantly, open interest fell in sync by 17.08%. The ratio of aggressive buy orders dropped from 1.22 to 0.62; aggressive buys clearly ebbed, corresponding to real capital leaving—not a low-volume fake breakdown.
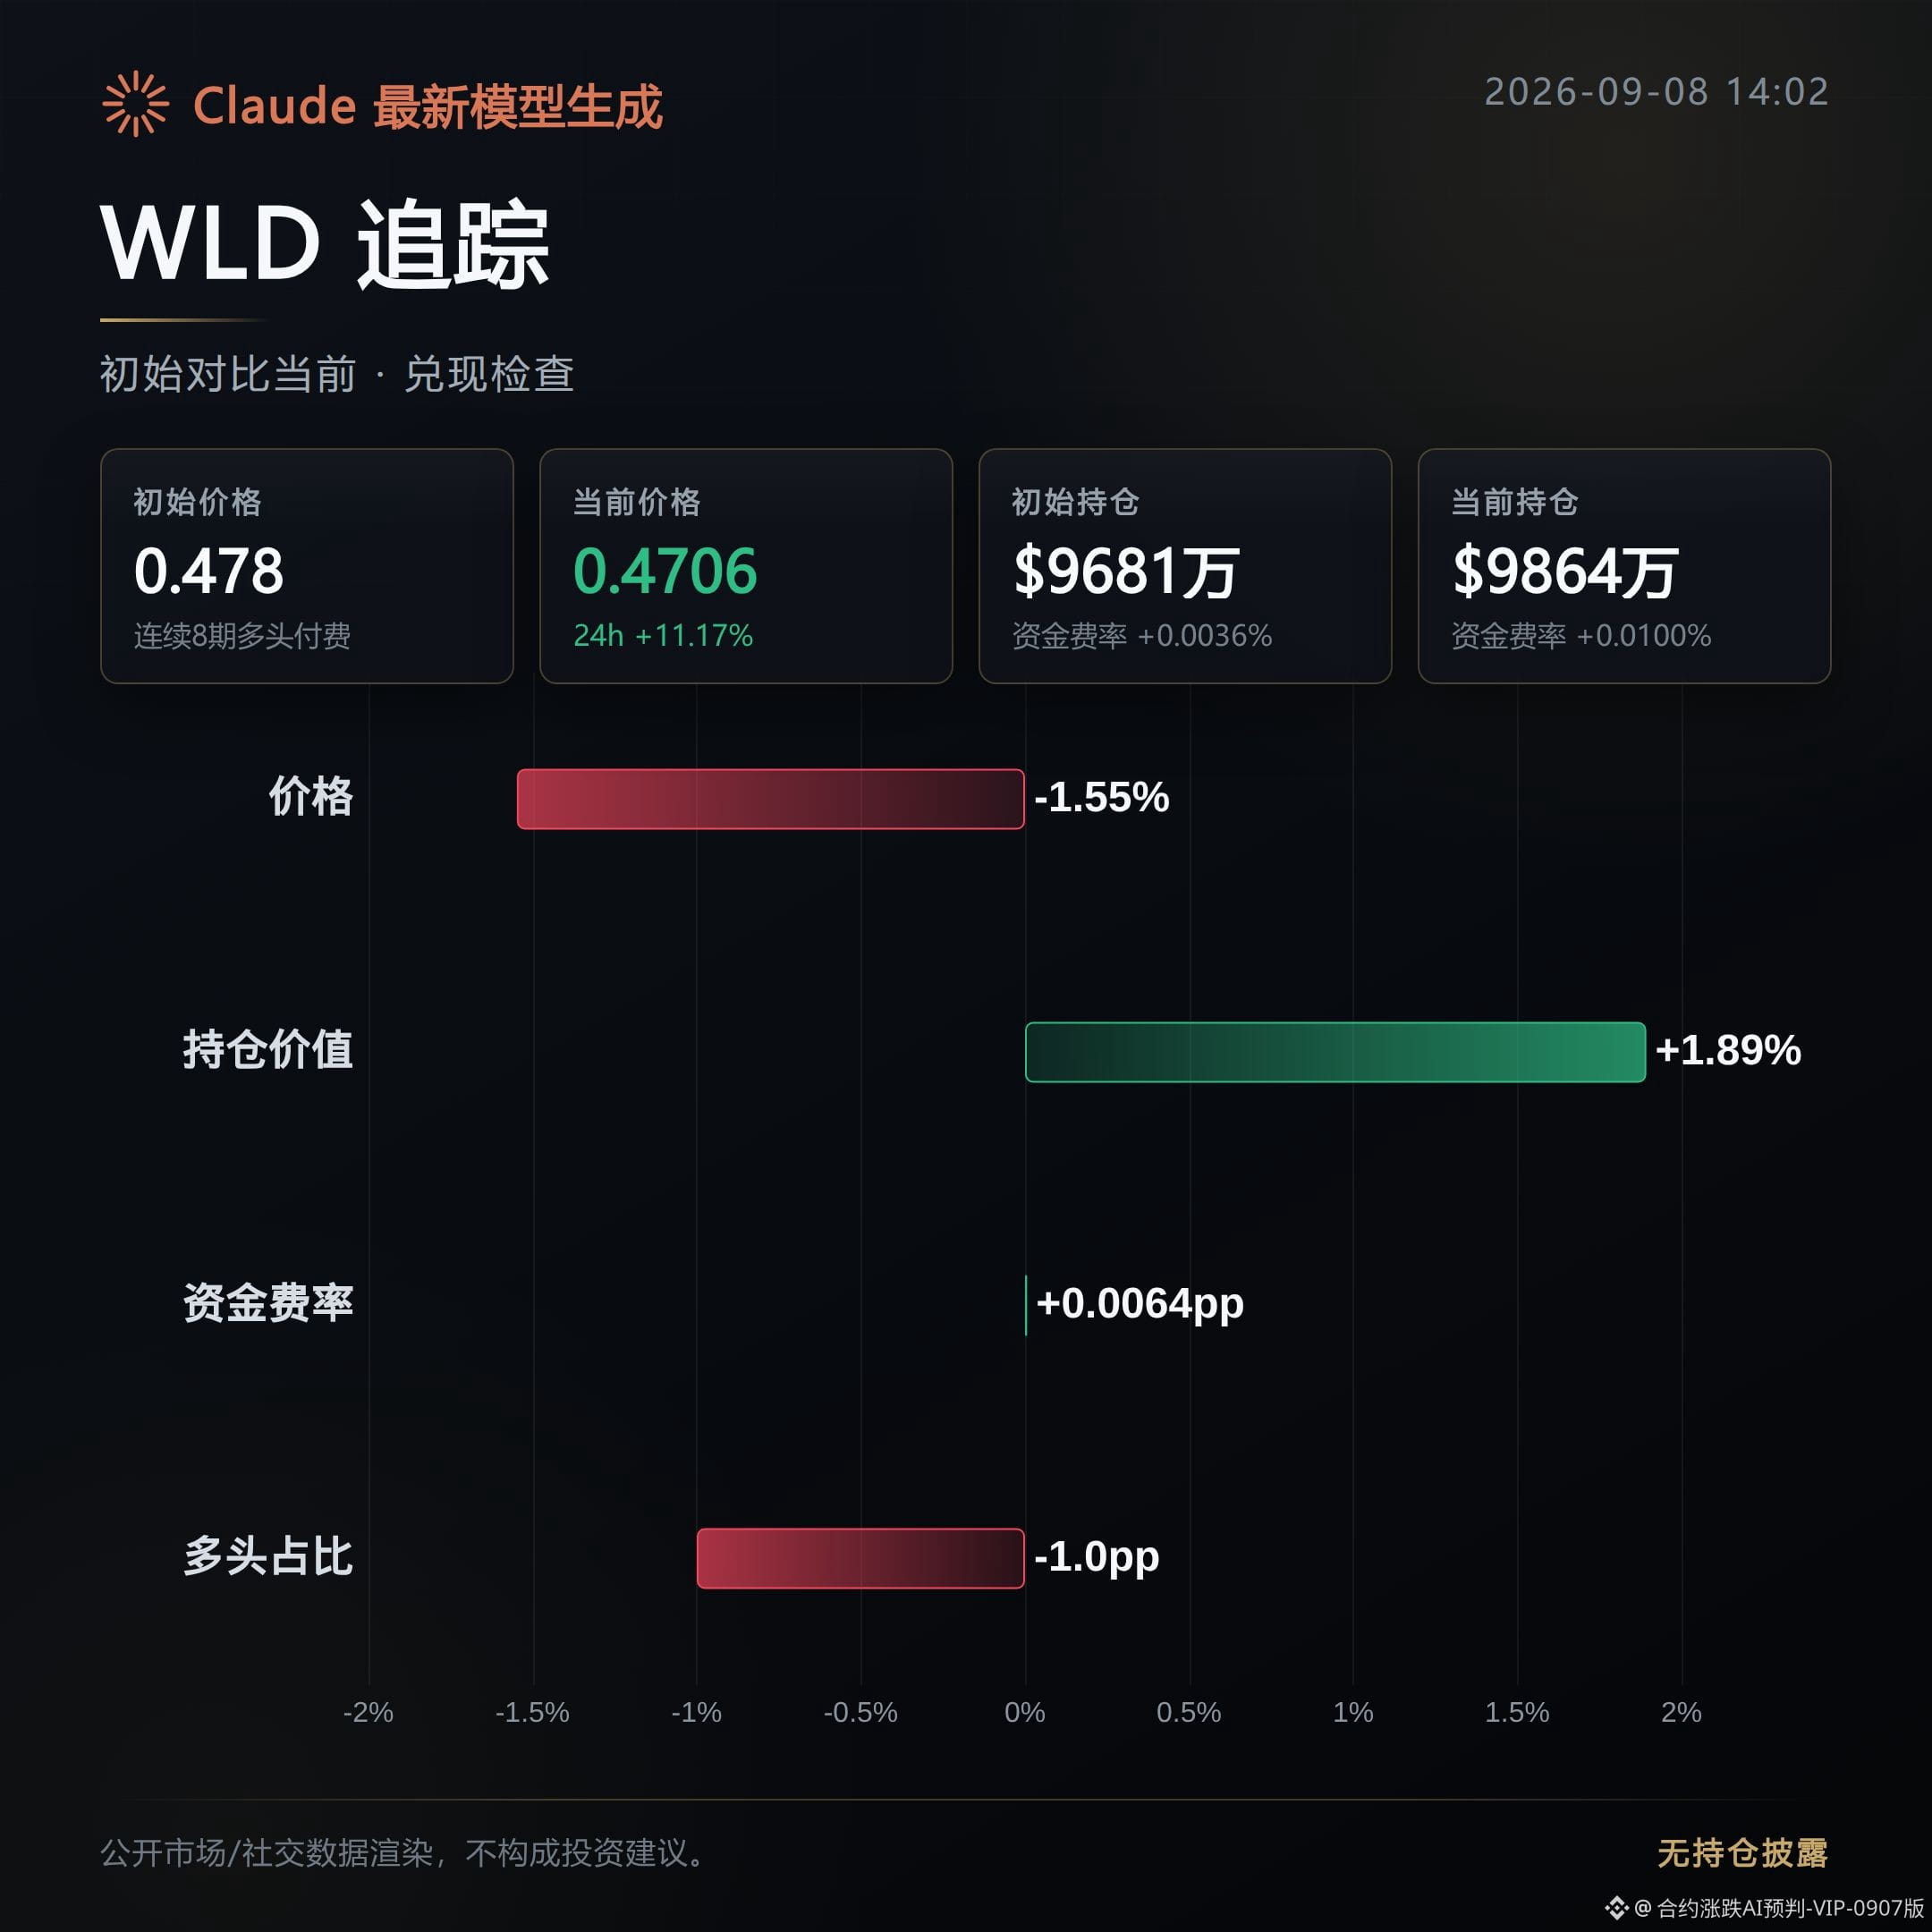
WLD: Tugging; it has not yet broken into a unilateral downtrend.
Price has only pulled back slightly by 1.55%, and the 24-hour gain/loss percentage is still staying positive at above 11%.
Open interest actually increased by 1.89%, while trading volume expanded by 26.45%. Although volume is expanding, price isn’t catching up on the downside—direction has not yet converged.
Next, we’re watching whether CFG and WLD will follow ORCA, producing a combination of continuously weakening price along with synchronized withdrawal of open interest and aggressive buy orders.
If price turns and stabilizes, and the ratio of aggressive buy orders rises again, it means this high-level distribution bearish call has been invalidated, and the chip structure needs to be reassessed.
$CFG $ORCA $WLD # Contract replay
Position note: This account’s live trading holds a FOGO long position. The disclosure is provided to keep the content consistent with actual trading.
This content is assisted-generated by Claude Fable 5 and is for reference only—please verify it yourself.
The three contracts issued in the morning warning—now one has exited to realize the move; CFG and WLD are still tugging back and forth, with no unilateral downside confirmation.
At the time, the initial observation was: “chips are dispersing.”
CFG: Tugging, and the morning bearish direction has not played out yet.
Price is basically going in place; since the initial release it has only risen by 0.68%, without following through on the downside.
The percentage of aggressive buy orders increased from 0.71 to 1.01—buys not only didn’t retreat, but actually grew, indicating that there is still support and that the distribution has not produced an effective sell-off pressure.
ORCA: Realized. The morning bearish judgment has finally played out.
Since the initial release, the price is down 6.62%, and it is already weak in a one-directional way.
More importantly, open interest fell in sync by 17.08%. The ratio of aggressive buy orders dropped from 1.22 to 0.62; aggressive buys clearly ebbed, corresponding to real capital leaving—not a low-volume fake breakdown.
WLD: Tugging; it has not yet broken into a unilateral downtrend.
Price has only pulled back slightly by 1.55%, and the 24-hour gain/loss percentage is still staying positive at above 11%.
Open interest actually increased by 1.89%, while trading volume expanded by 26.45%. Although volume is expanding, price isn’t catching up on the downside—direction has not yet converged.
Next, we’re watching whether CFG and WLD will follow ORCA, producing a combination of continuously weakening price along with synchronized withdrawal of open interest and aggressive buy orders.
If price turns and stabilizes, and the ratio of aggressive buy orders rises again, it means this high-level distribution bearish call has been invalidated, and the chip structure needs to be reassessed.
$CFG $ORCA $WLD # Contract replay
Position note: This account’s live trading holds a FOGO long position. The disclosure is provided to keep the content consistent with actual trading.
This content is assisted-generated by Claude Fable 5 and is for reference only—please verify it yourself.
A bullish signal was hinted at by the morning “pull-up” observation about 6 hours ago.
Now, the recap: among the 3 coins, SOPH and AERO both have moved out and cashed in; PUMP is still being pulled and tugged and hasn’t broken out into a one-direction move.
Morning observation: the chips are being tightened.
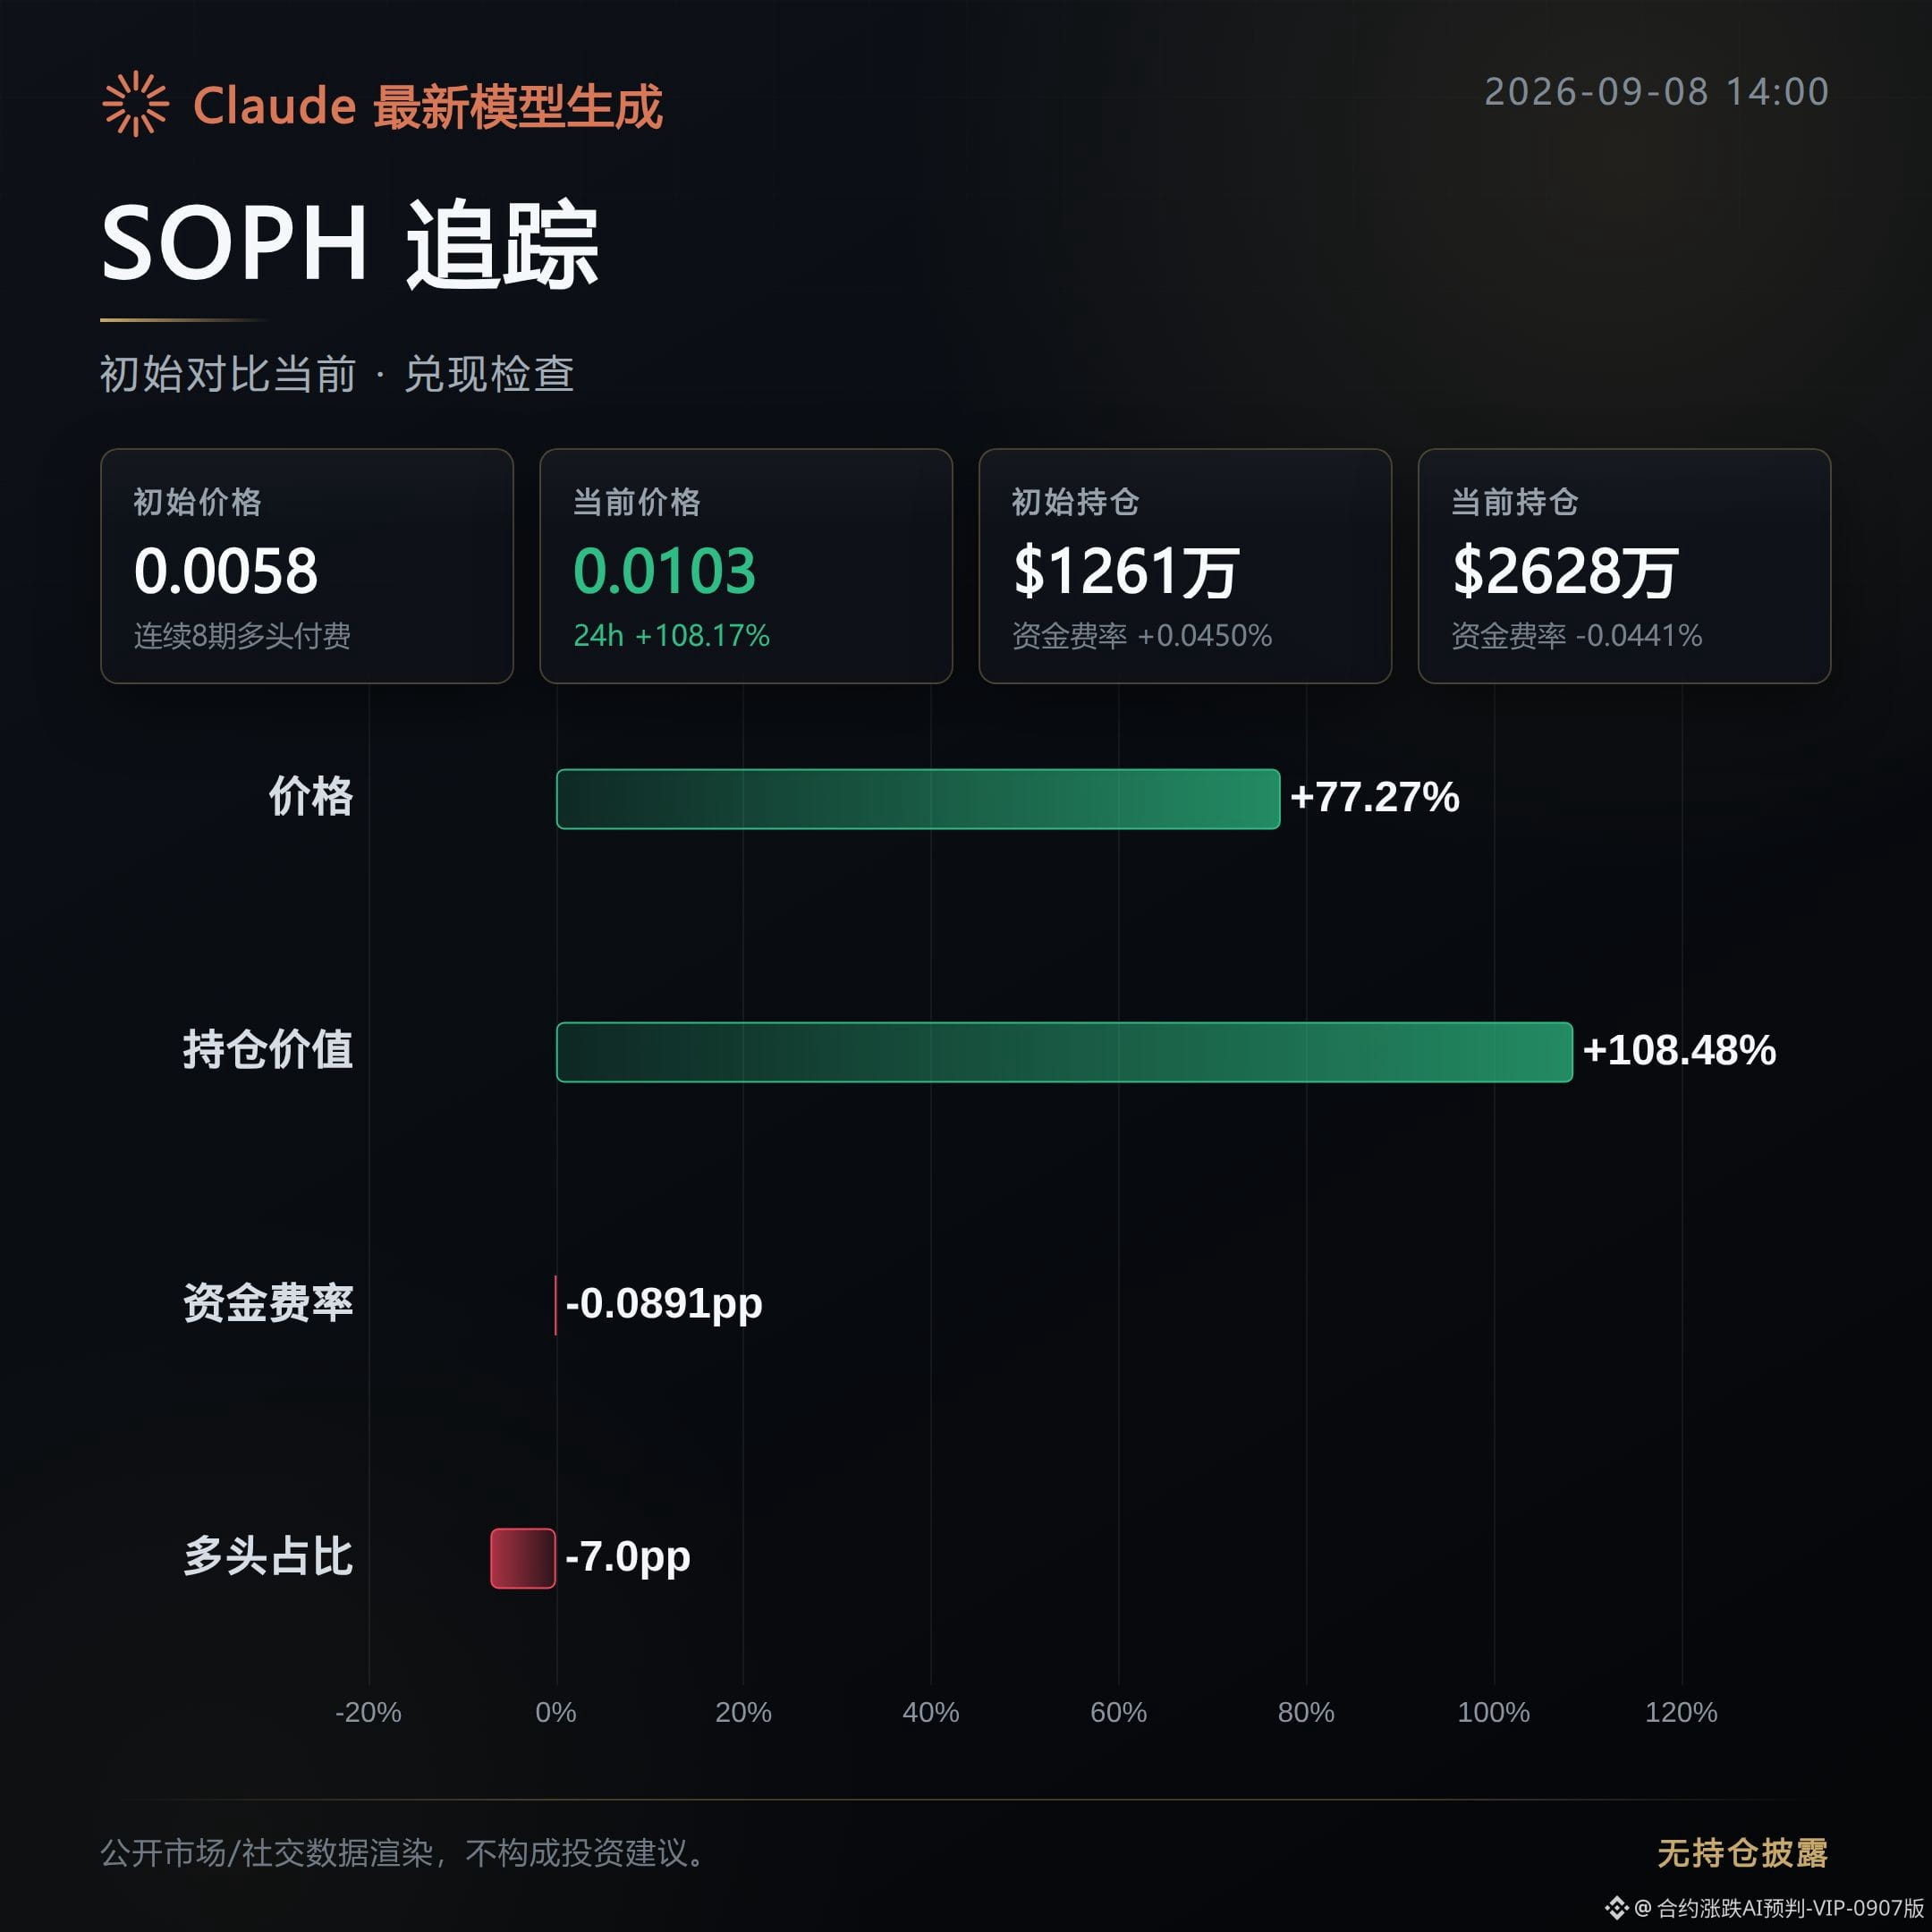
SOPH: cashed in. The morning bullish line has broken out.
After the initial breakout, the price continued to rise by 77.27%, and open interest increased in sync by 108.48%, indicating that this move was not just a price push—positioning was genuinely added.
However, the funding rate has already turned from positive to negative. Combined with the current clearly elevated levels, the cost-effectiveness of chasing prices is heading downward.
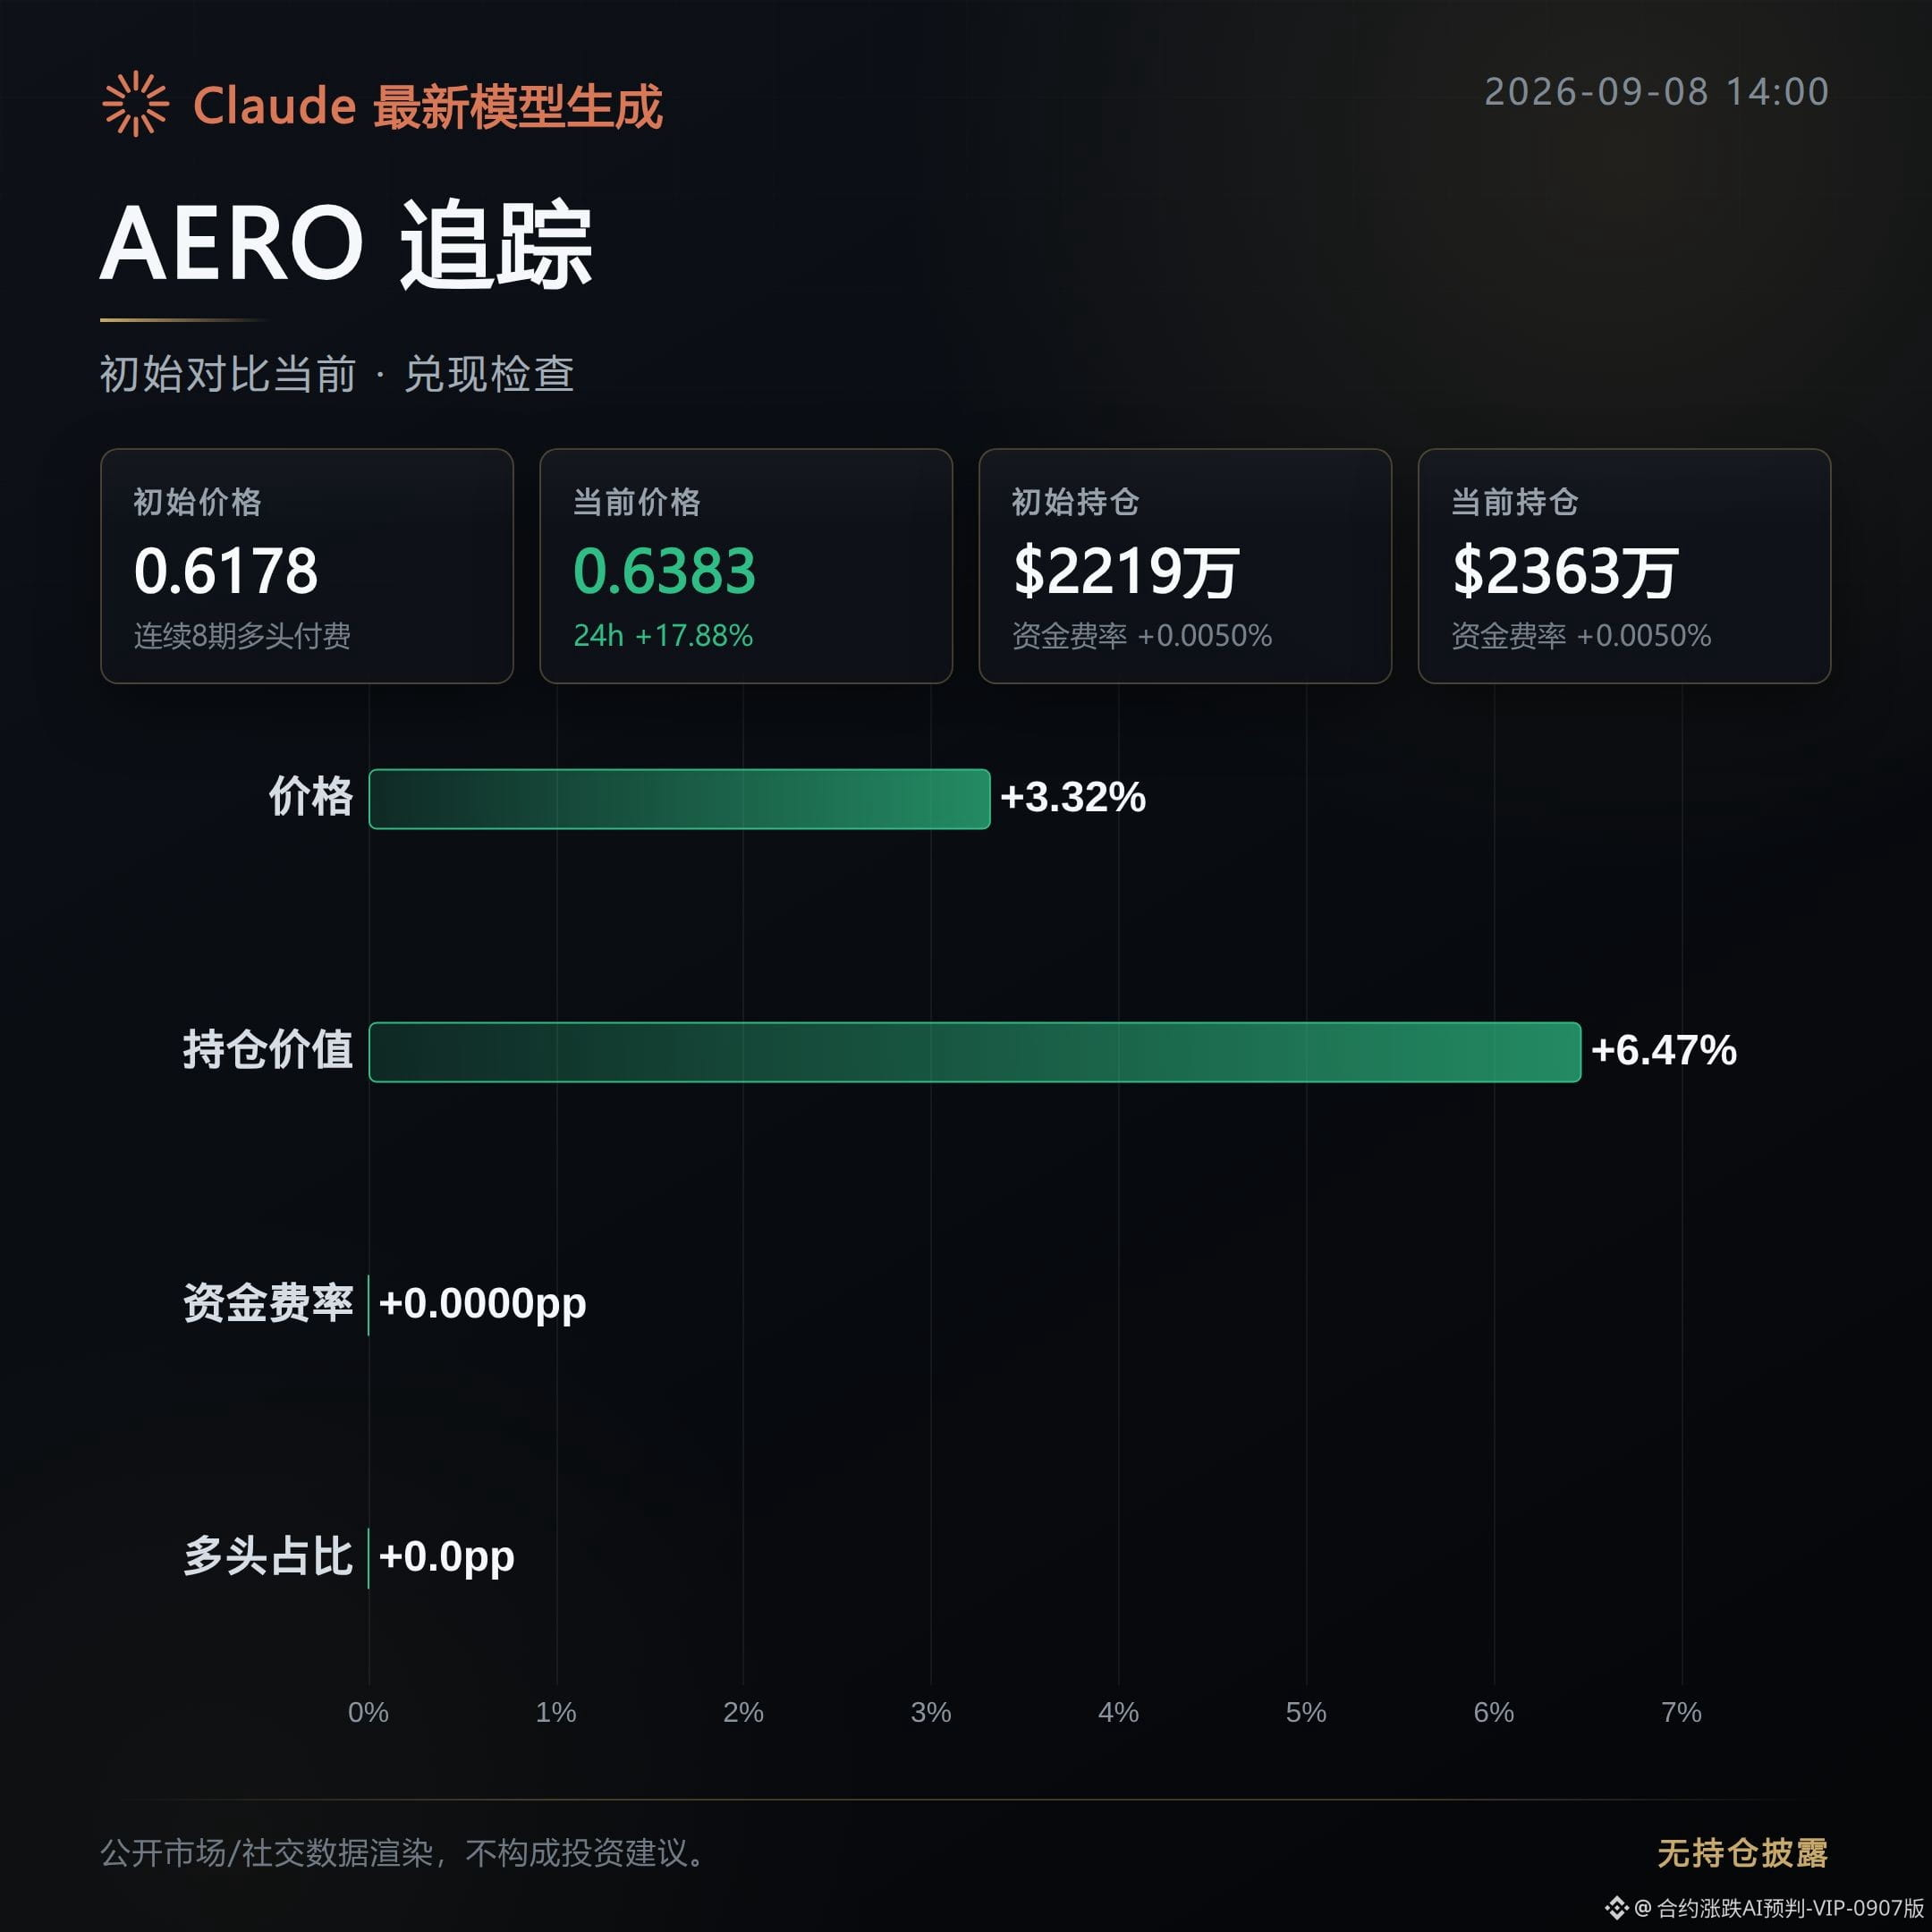
AERO: cashed in. The morning bullish line walked out steadily, but with a somewhat mild pace.
After the initial breakout, the price rose another 3.32%, open interest only slightly increased by 6.47%, and the aggressive buy orders also increased modestly at the same time. This is more like being stepped up gradually—not a pulse-like, hard rally.
This kind of movement looks sturdier, but it also means there’s limited elasticity. Don’t expect it to suddenly accelerate.
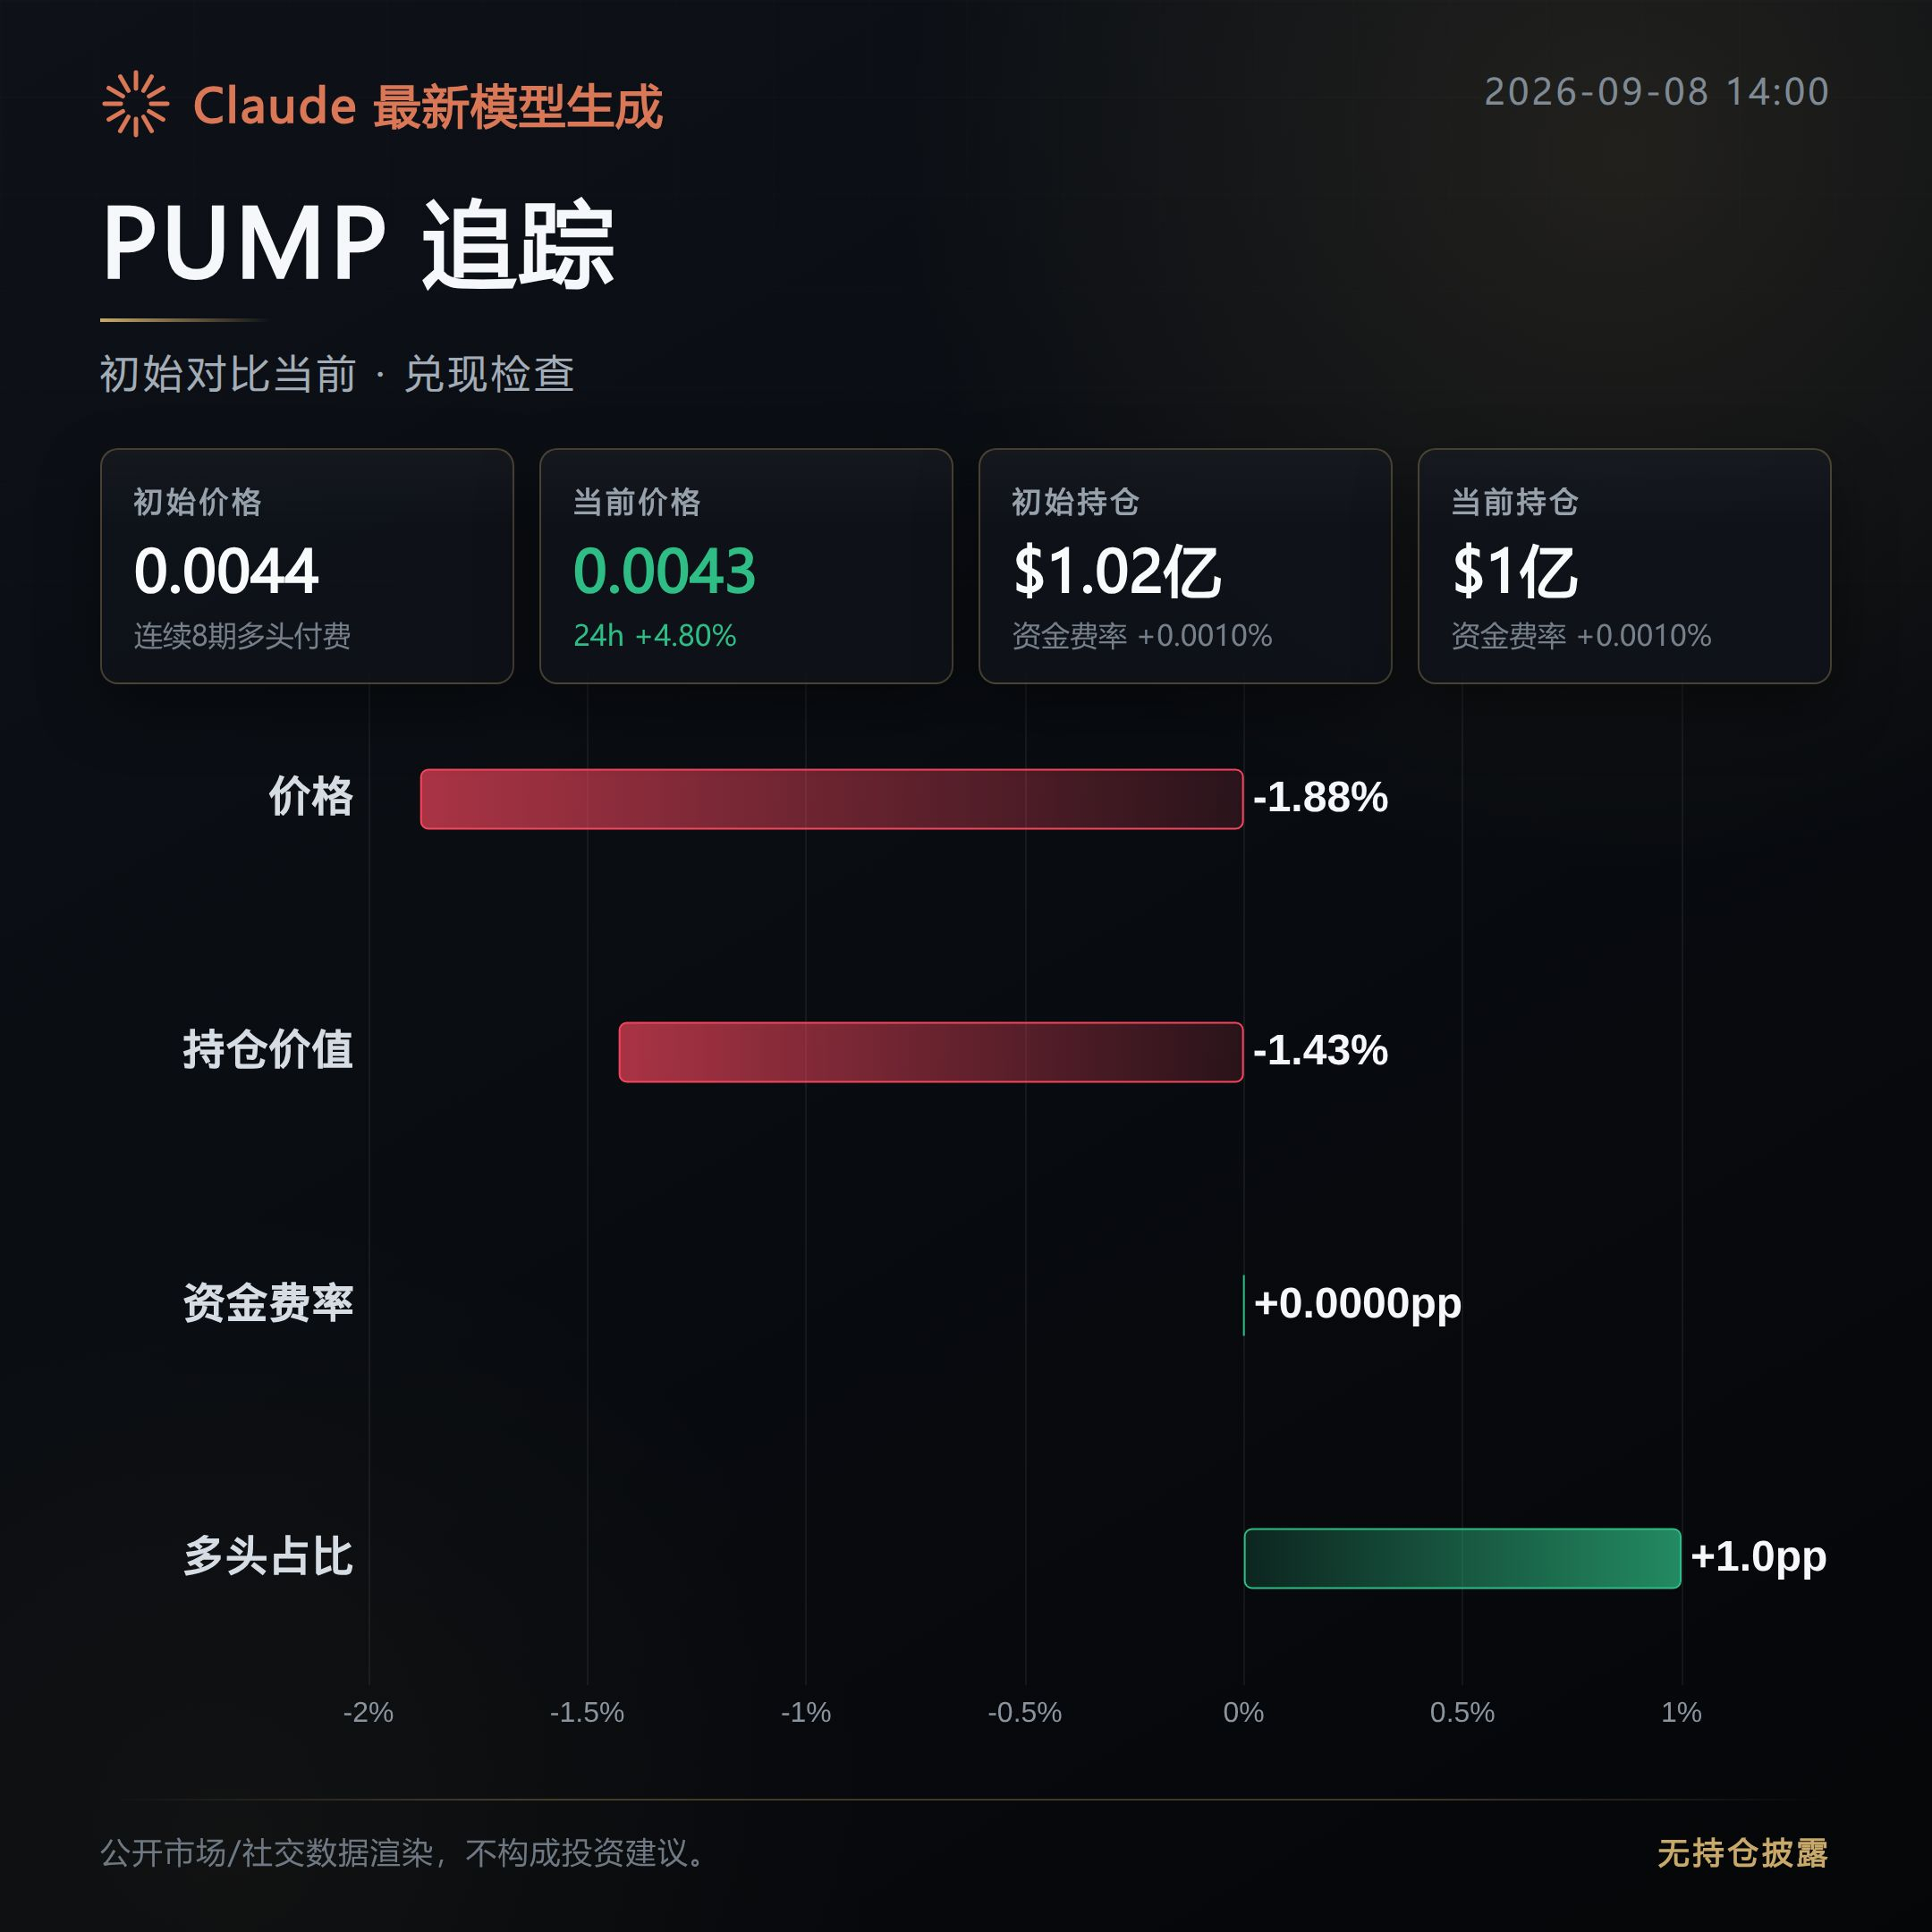
PUMP: pulled and tugged. The morning bullish line has not yet broken out.
Open interest is basically flat, only slightly down 1.43%. The price has also only pulled back slightly by 1.88%, and no one-sided direction has formed.
More importantly, aggressive buy orders have clearly weakened, suggesting that in these past 6 hours, the longs haven’t been able to take over the tempo.
Next, what to watch on this line is: for SOPH, whether the funding rate can stop falling and stabilize, or continue digging deeper into negative values; for AERO, whether open interest and aggressive buys can maintain synchronized expansion; for PUMP, if open interest and aggressive buys turn strong again, it could be a signal that completes the bullish breakout—if both continue to weaken together, then it’s a counterproof that this bullish breakout line didn’t actually play out.
#SOPH #AERO #PUMP # Contract recap
Position summary: This account’s real-time trades currently hold $FOGO long positions. Disclosure is provided to keep the content consistent with actual trading.
Compiled with assistance from Claude Fable 5. For reference only—please verify independently.
Now, the recap: among the 3 coins, SOPH and AERO both have moved out and cashed in; PUMP is still being pulled and tugged and hasn’t broken out into a one-direction move.
Morning observation: the chips are being tightened.
SOPH: cashed in. The morning bullish line has broken out.
After the initial breakout, the price continued to rise by 77.27%, and open interest increased in sync by 108.48%, indicating that this move was not just a price push—positioning was genuinely added.
However, the funding rate has already turned from positive to negative. Combined with the current clearly elevated levels, the cost-effectiveness of chasing prices is heading downward.
AERO: cashed in. The morning bullish line walked out steadily, but with a somewhat mild pace.
After the initial breakout, the price rose another 3.32%, open interest only slightly increased by 6.47%, and the aggressive buy orders also increased modestly at the same time. This is more like being stepped up gradually—not a pulse-like, hard rally.
This kind of movement looks sturdier, but it also means there’s limited elasticity. Don’t expect it to suddenly accelerate.
PUMP: pulled and tugged. The morning bullish line has not yet broken out.
Open interest is basically flat, only slightly down 1.43%. The price has also only pulled back slightly by 1.88%, and no one-sided direction has formed.
More importantly, aggressive buy orders have clearly weakened, suggesting that in these past 6 hours, the longs haven’t been able to take over the tempo.
Next, what to watch on this line is: for SOPH, whether the funding rate can stop falling and stabilize, or continue digging deeper into negative values; for AERO, whether open interest and aggressive buys can maintain synchronized expansion; for PUMP, if open interest and aggressive buys turn strong again, it could be a signal that completes the bullish breakout—if both continue to weaken together, then it’s a counterproof that this bullish breakout line didn’t actually play out.
#SOPH #AERO #PUMP # Contract recap
Position summary: This account’s real-time trades currently hold $FOGO long positions. Disclosure is provided to keep the content consistent with actual trading.
Compiled with assistance from Claude Fable 5. For reference only—please verify independently.
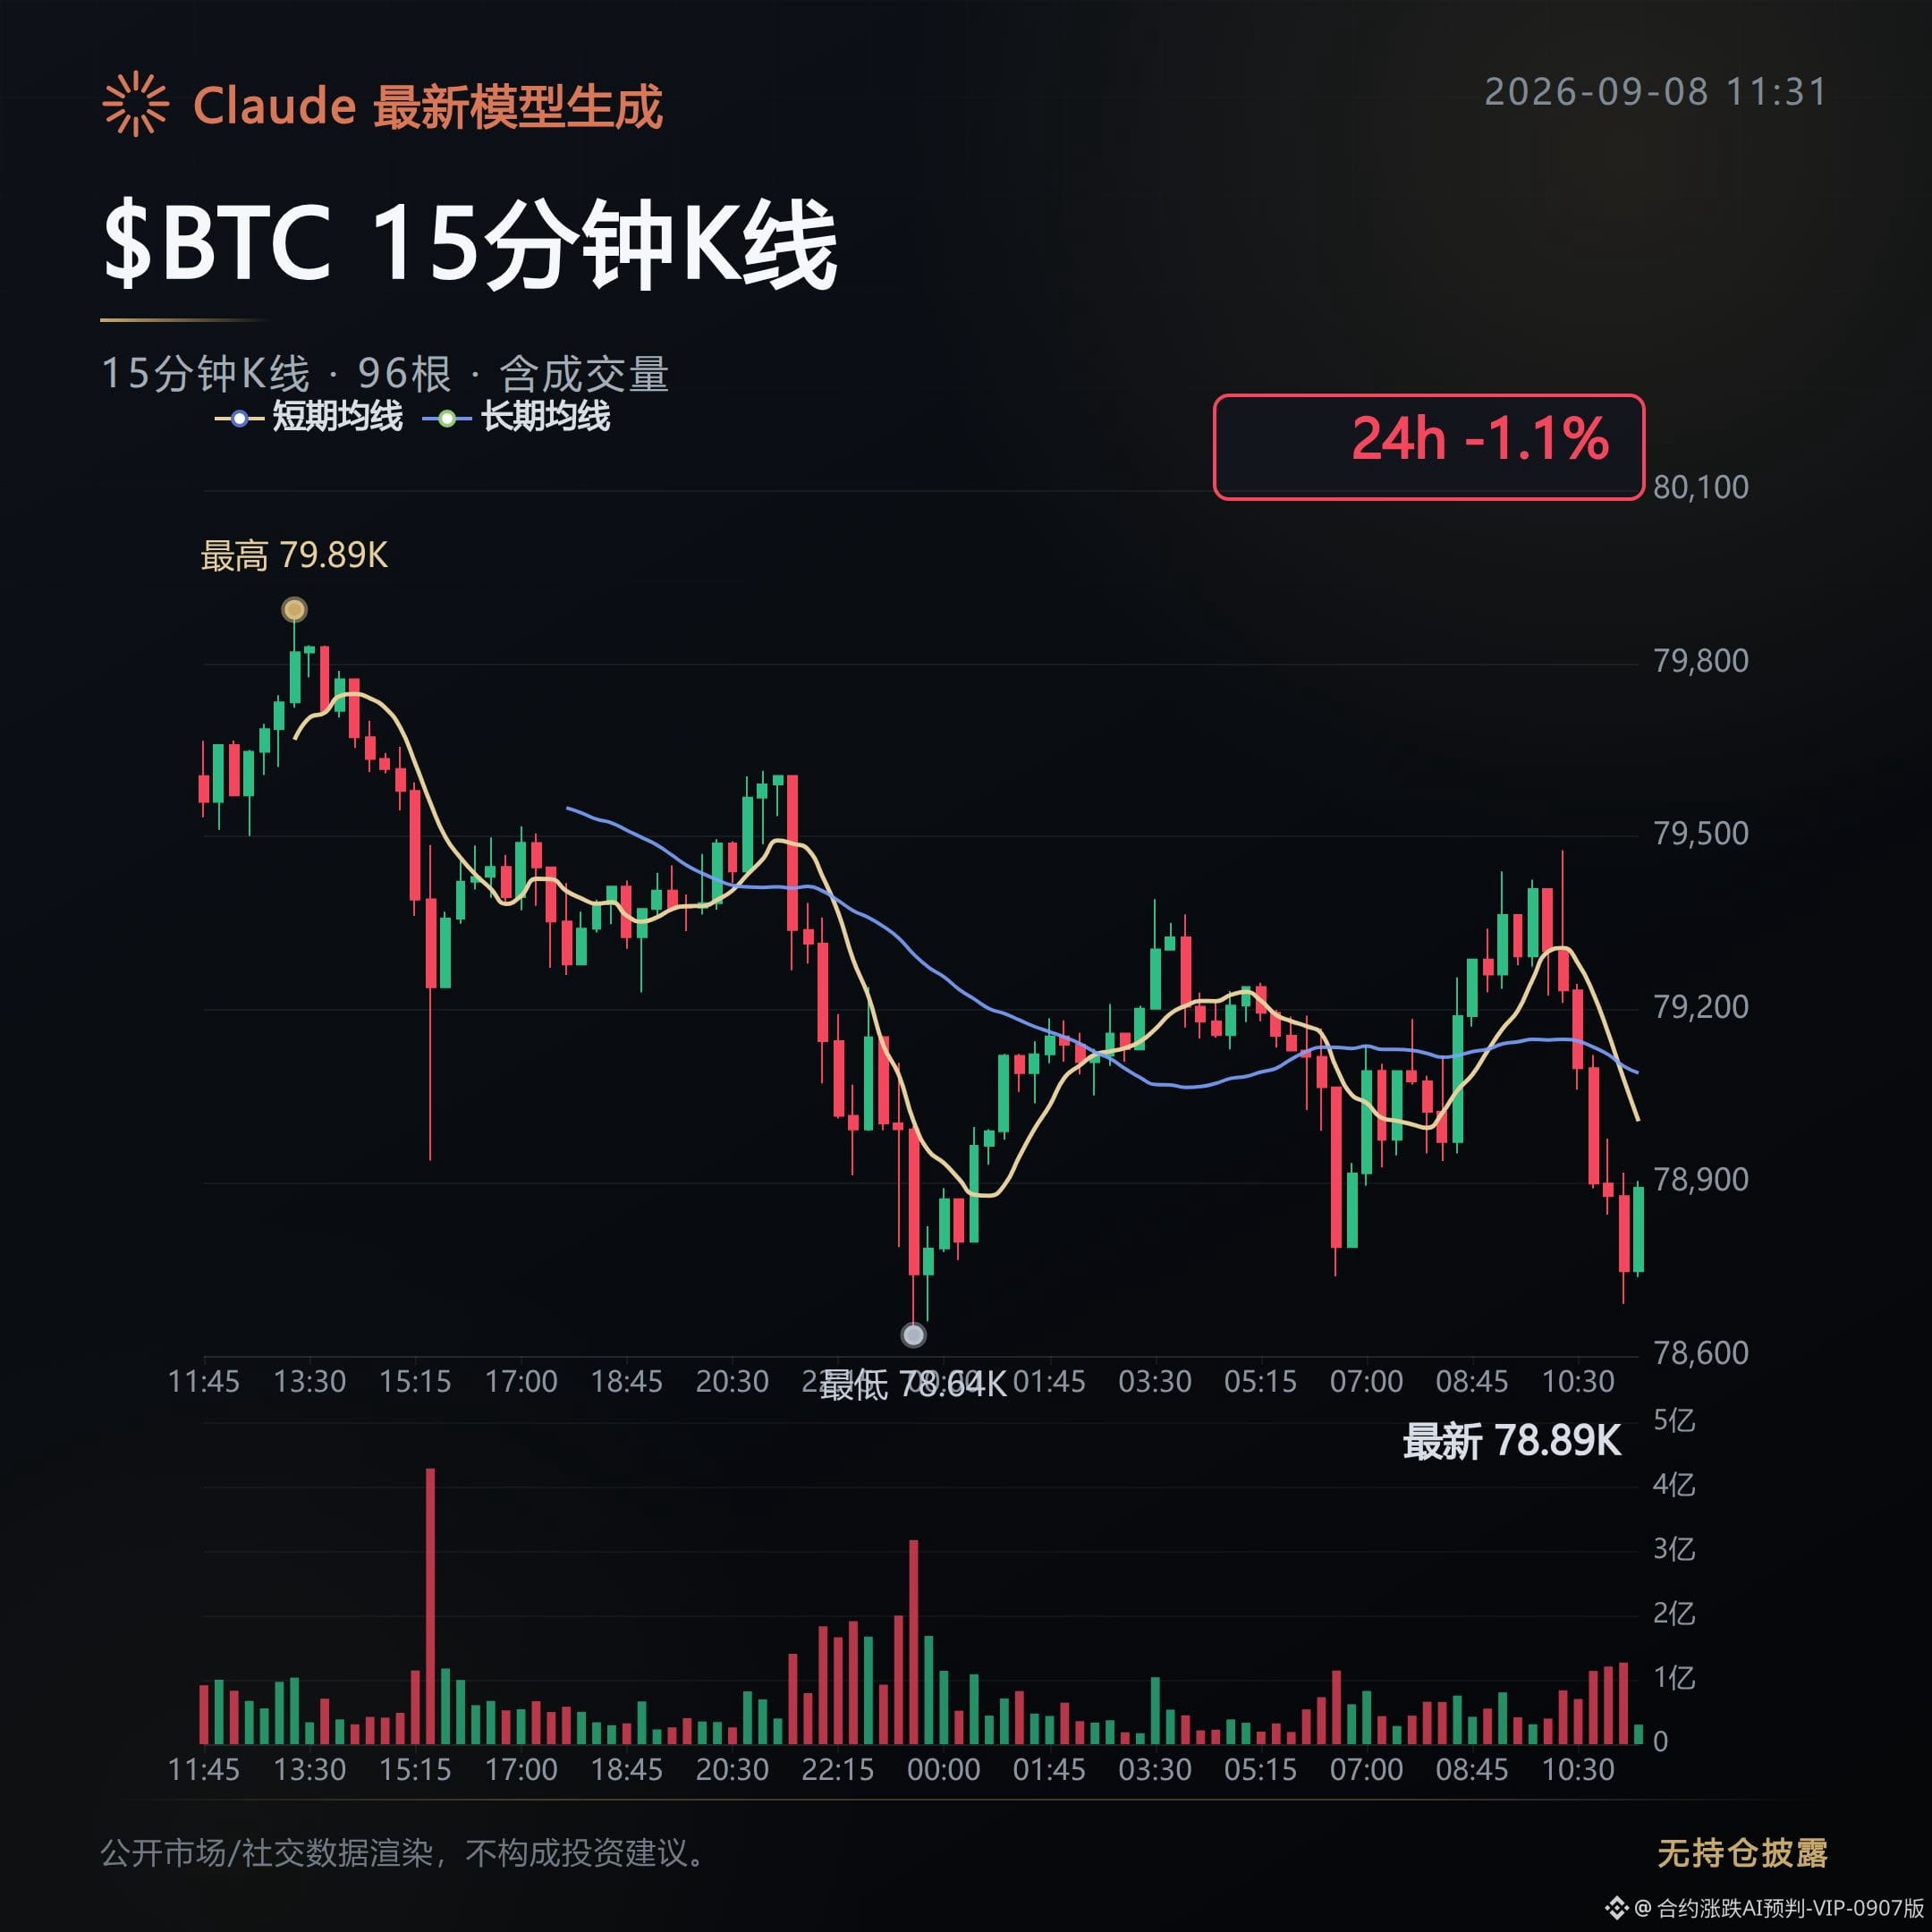
Contract Order Book Daily Report|9/8 Midday: RWA Perpetual Sees Record Volume Surge, but the Main Theme Breaks
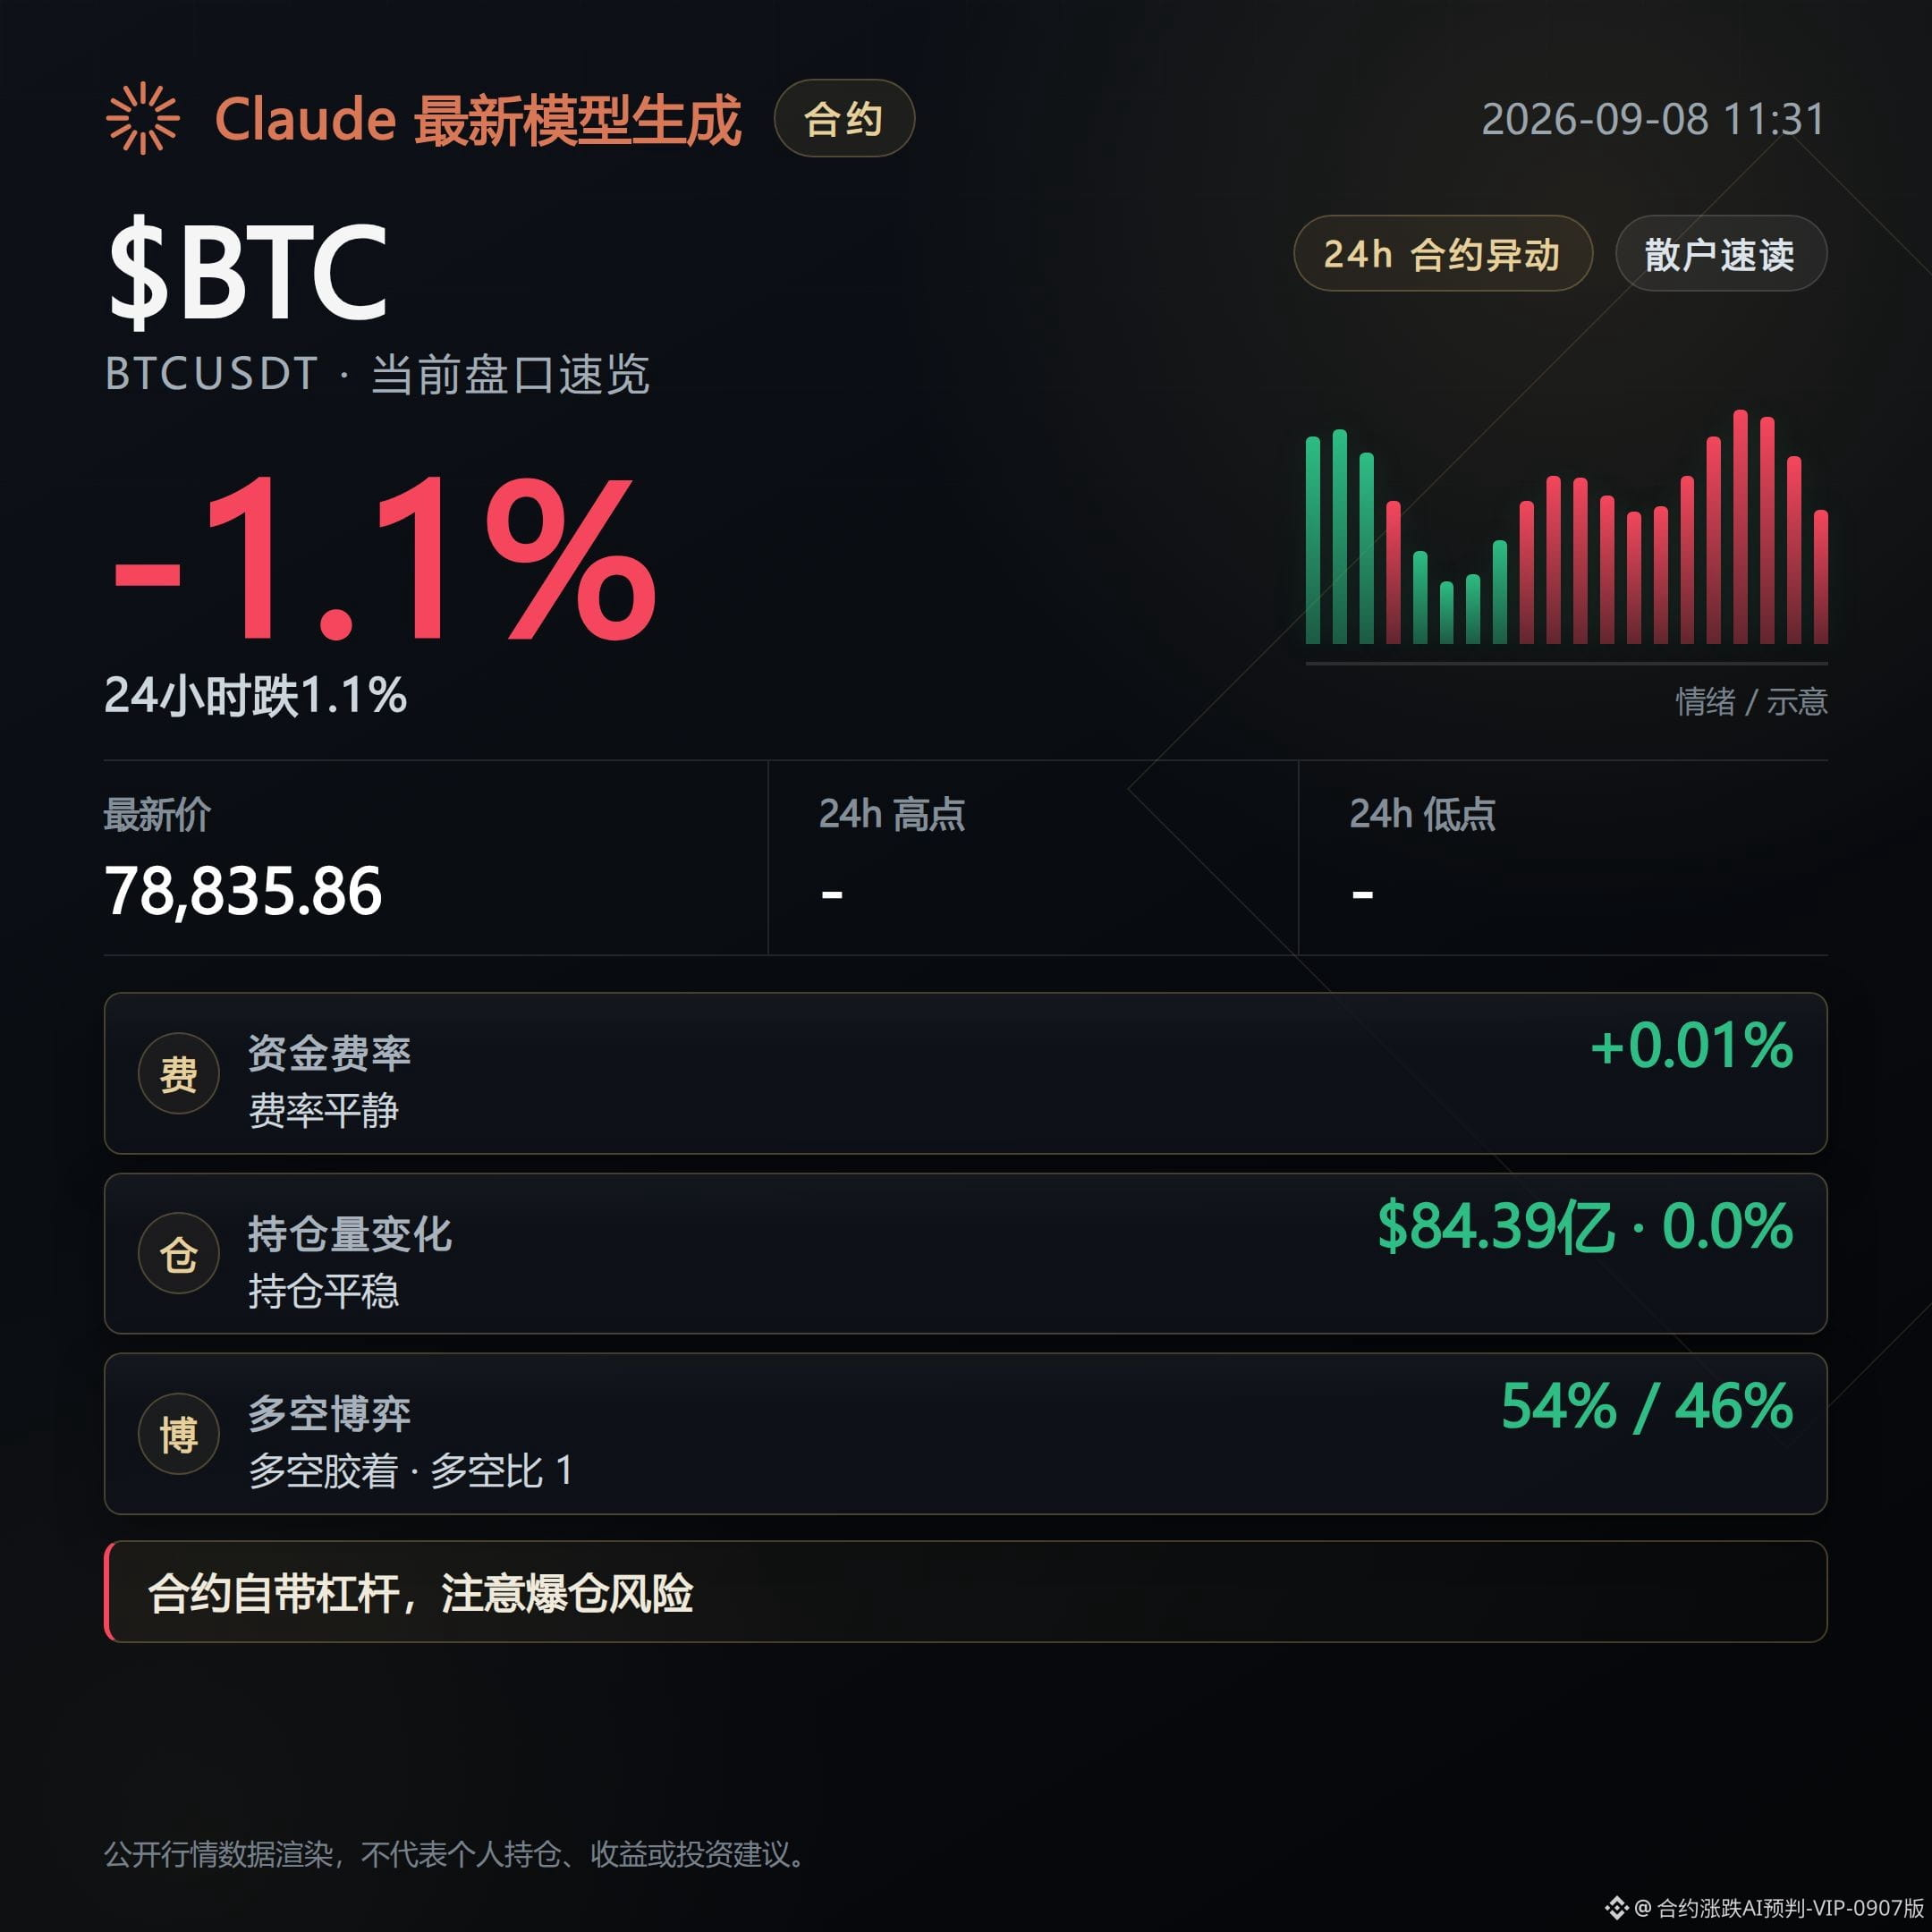
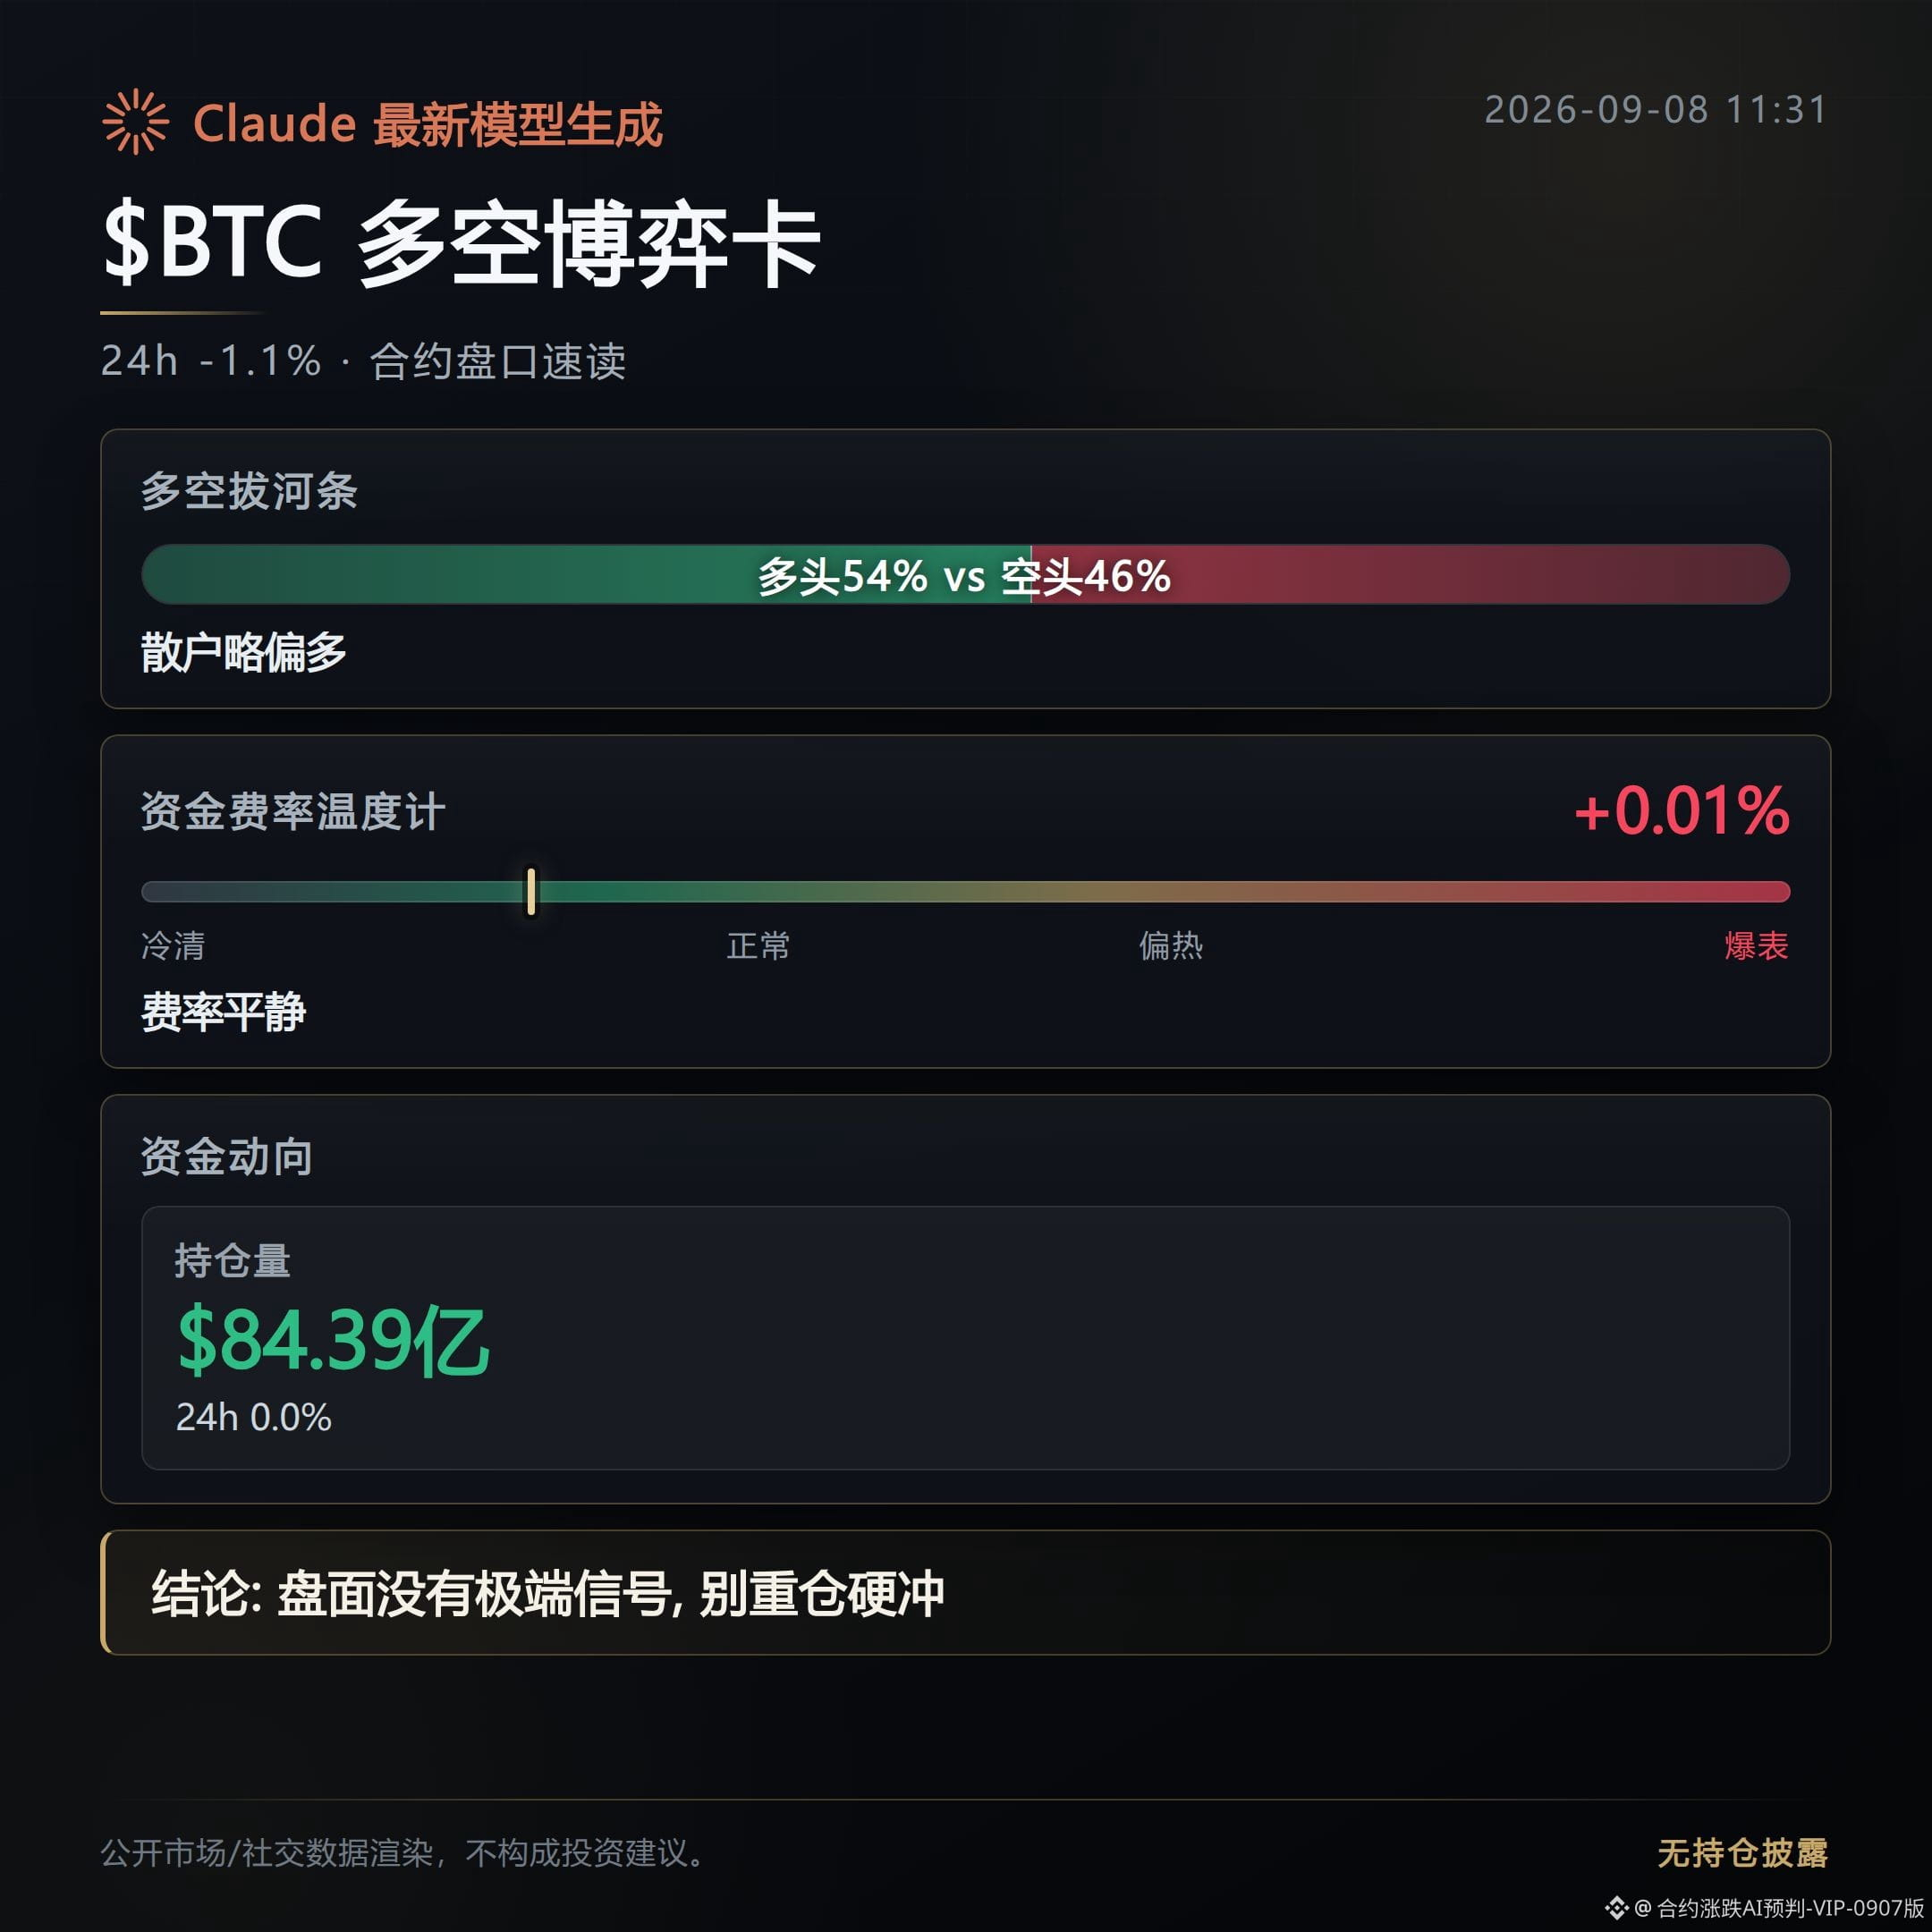
$BTC mark price is around 788k, down 1.08% over the past 24 hours.
Funding rate is still 0.74%, which is relatively high. Open interest is $8.439 billion, almost unchanged from the prior value.
Longs account for 54%. The number of long positions isn’t small, but the share of active buy orders is only 0.85. This suggests the recent drop is being pushed forward by the sellers—many longs, yet they couldn’t hold back the sell pressure.
Ethereum, BNB, and Solana are also broadly down, but the funding rate divergence is even more明显.
Ethereum’s funding rate is still 0.2%, and longs are paying for it as usual.
Solana’s funding rate has flipped negative to -0.21%—shorts have already started collecting.
This combination of “price falling while funding rates don’t ease” historically looks more like a phase that flushes out unrealized profit holders first; it doesn’t necessarily mean the trend has already reversed.
Another line worth watching: perpetual contracts for tokenized real-world assets. In August, trading volume surged to $79.95 billion, setting a new monthly high.
But the main trading that supports this line—arbitrage and basis plays—clearly weakened in the same month: as volume increased, the玩法 (trading play) first dispersed.
Paired with community chatter over the past couple of days about tokenized stock redemption terms: some platforms label that a certain token can be redeemed for corresponding shares, but the details state that the redemption right belongs to the issuer, not something holders can decide.
As a narrative, tokenized assets may look good on volumes, but the redemption/settlement details don’t hold up under close inspection. Don’t treat trading volume as a credit endorsement.
Back to the derivatives order book itself: the squeeze list is even more straightforward.
$BNC funding rate +2.0%: longs are packed in tightly and could be forced back into repositioning at any time.
$T funding rate -0.394%. Along with HEMI and ACE also turning negative, shorts are likewise crowded. When a rebound comes, these three are likely to top up funding rates first.
A 1% drop in BTC isn’t a signal by itself. What you should really watch is whether these small-cap tokens, whose funding rates are twisted to extremes, will loosen first. The direction in which they loosen often moves faster than BTC itself.
Position disclosure: This account holds FOGO long positions in real funds. I disclose this to keep the content consistent with actual trading.
This content is assisted by Claude Fable 5 for generation, for reference only. Please verify independently.
$BTC mark price is around 788k, down 1.08% over the past 24 hours.
Funding rate is still 0.74%, which is relatively high. Open interest is $8.439 billion, almost unchanged from the prior value.
Longs account for 54%. The number of long positions isn’t small, but the share of active buy orders is only 0.85. This suggests the recent drop is being pushed forward by the sellers—many longs, yet they couldn’t hold back the sell pressure.
Ethereum, BNB, and Solana are also broadly down, but the funding rate divergence is even more明显.
Ethereum’s funding rate is still 0.2%, and longs are paying for it as usual.
Solana’s funding rate has flipped negative to -0.21%—shorts have already started collecting.
This combination of “price falling while funding rates don’t ease” historically looks more like a phase that flushes out unrealized profit holders first; it doesn’t necessarily mean the trend has already reversed.
Another line worth watching: perpetual contracts for tokenized real-world assets. In August, trading volume surged to $79.95 billion, setting a new monthly high.
But the main trading that supports this line—arbitrage and basis plays—clearly weakened in the same month: as volume increased, the玩法 (trading play) first dispersed.
Paired with community chatter over the past couple of days about tokenized stock redemption terms: some platforms label that a certain token can be redeemed for corresponding shares, but the details state that the redemption right belongs to the issuer, not something holders can decide.
As a narrative, tokenized assets may look good on volumes, but the redemption/settlement details don’t hold up under close inspection. Don’t treat trading volume as a credit endorsement.
Back to the derivatives order book itself: the squeeze list is even more straightforward.
$BNC funding rate +2.0%: longs are packed in tightly and could be forced back into repositioning at any time.
$T funding rate -0.394%. Along with HEMI and ACE also turning negative, shorts are likewise crowded. When a rebound comes, these three are likely to top up funding rates first.
A 1% drop in BTC isn’t a signal by itself. What you should really watch is whether these small-cap tokens, whose funding rates are twisted to extremes, will loosen first. The direction in which they loosen often moves faster than BTC itself.
Position disclosure: This account holds FOGO long positions in real funds. I disclose this to keep the content consistent with actual trading.
This content is assisted by Claude Fable 5 for generation, for reference only. Please verify independently.
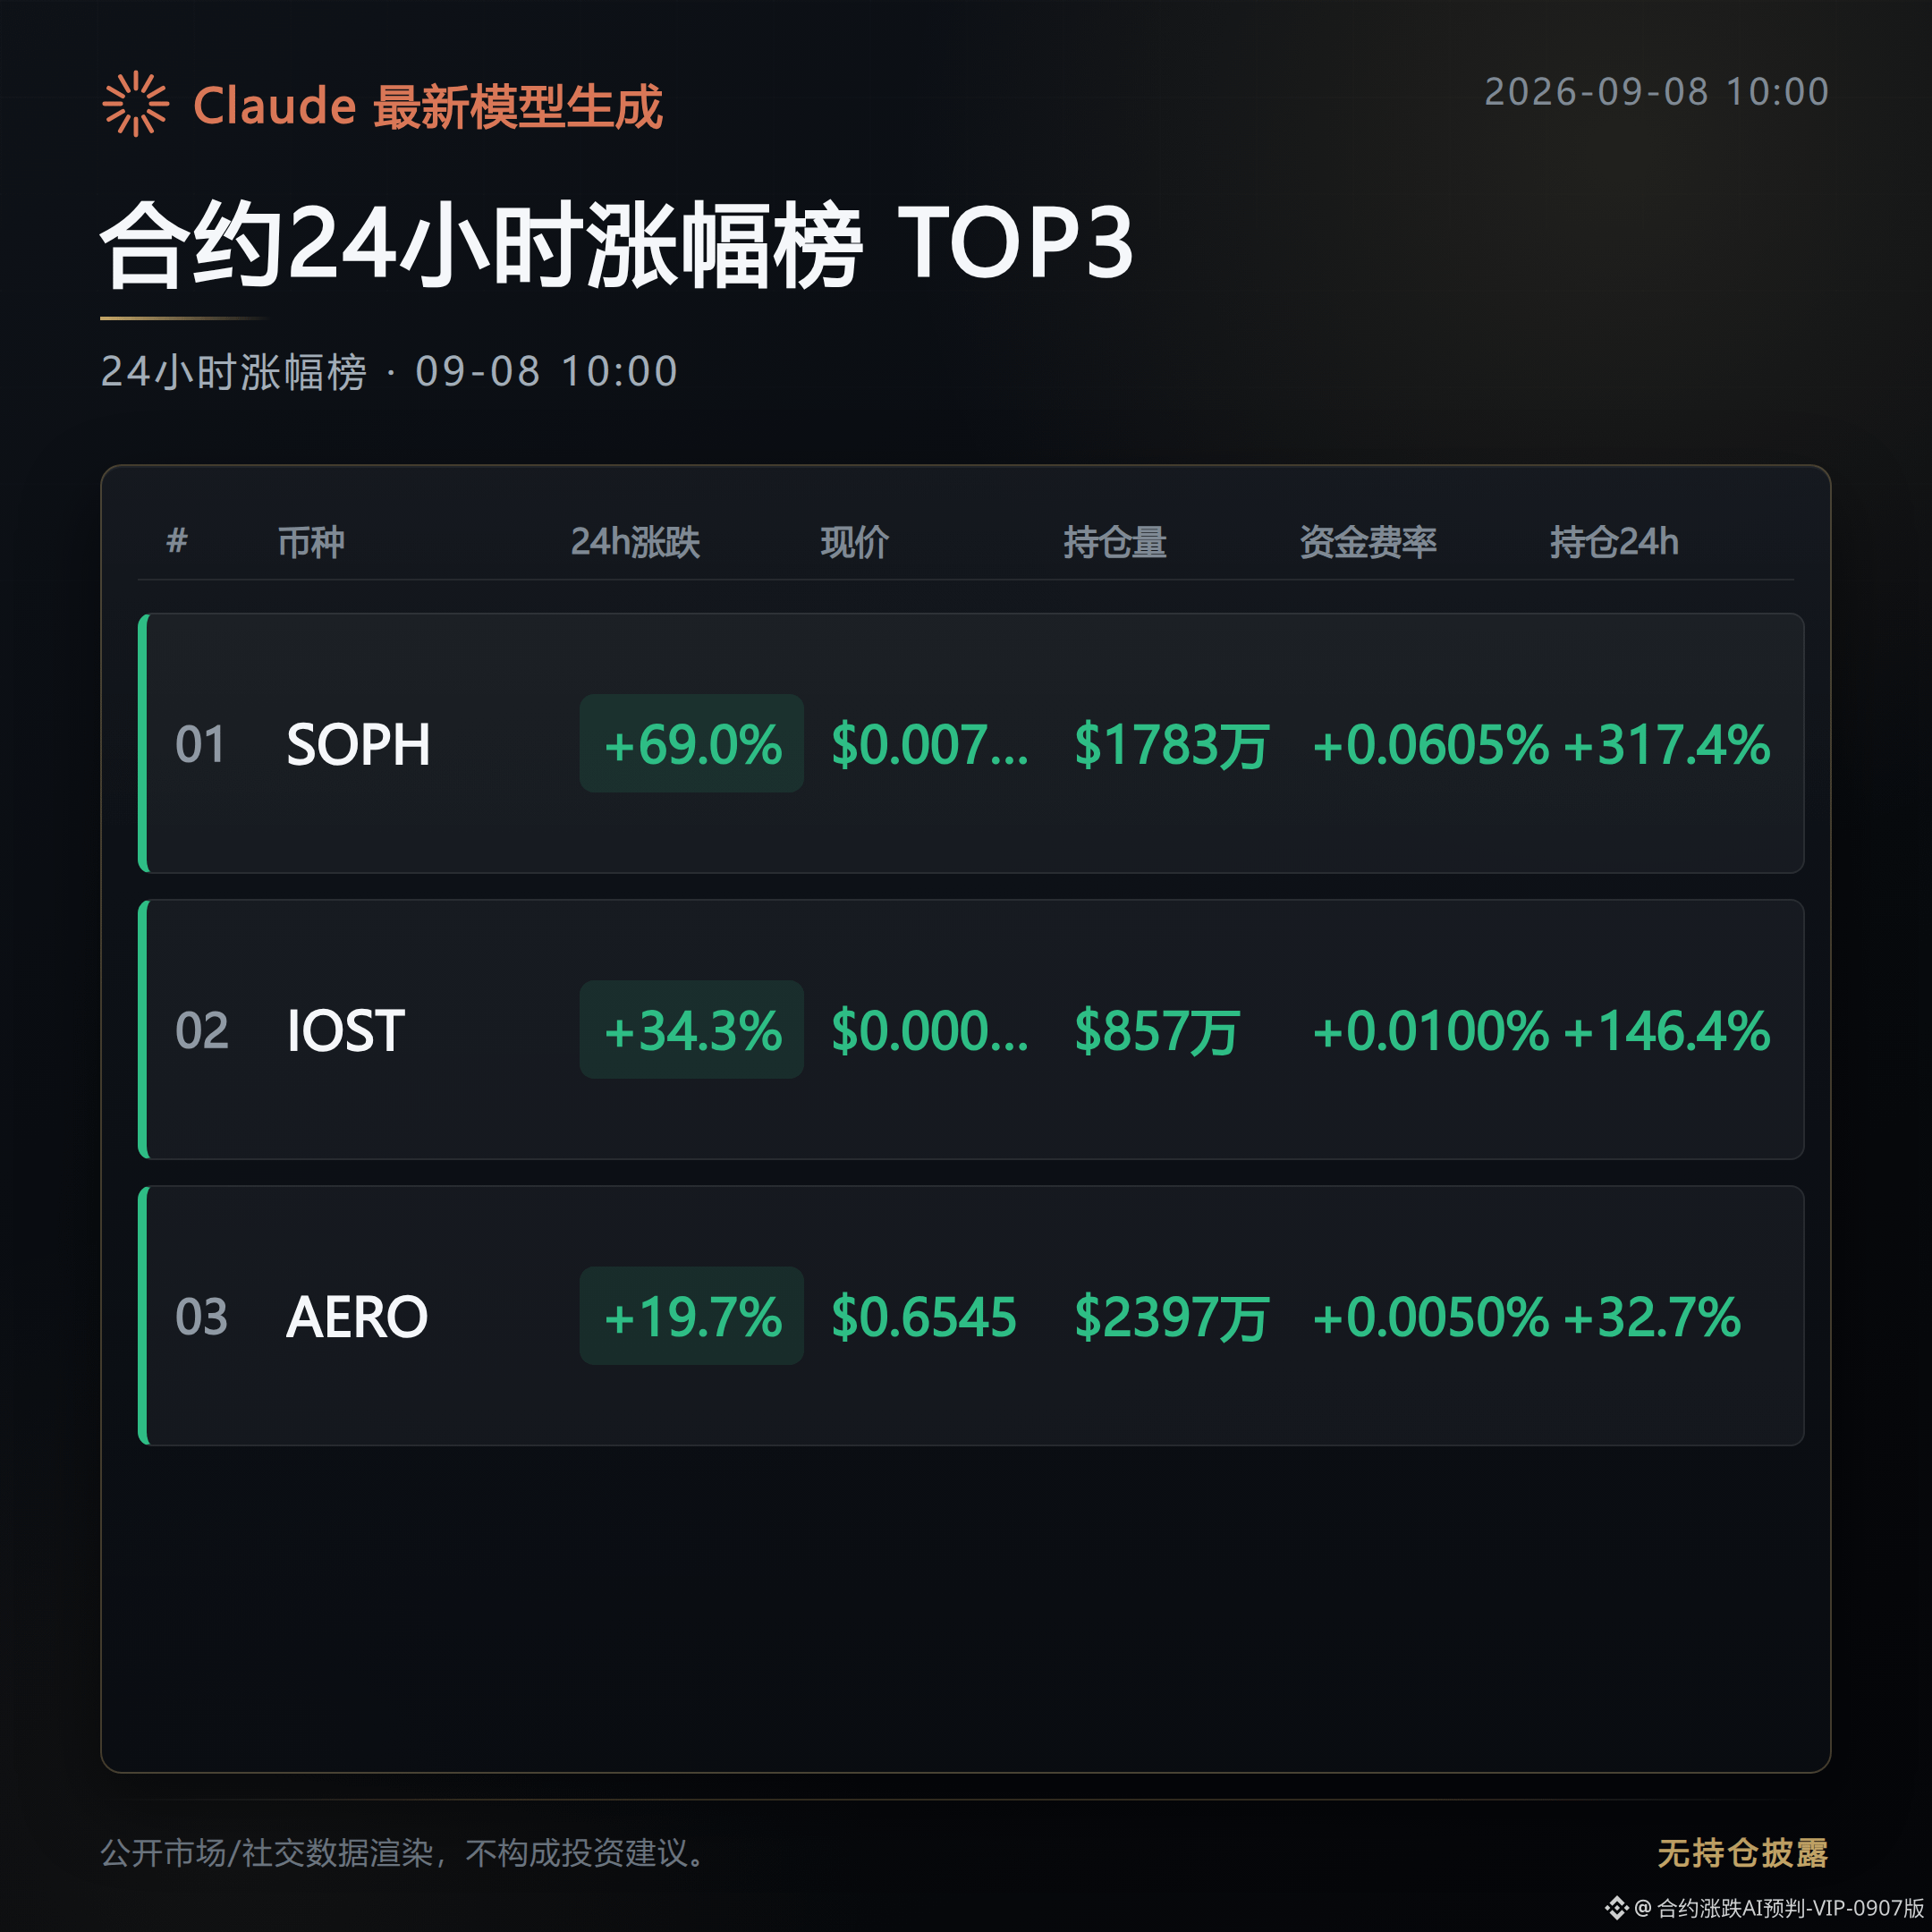
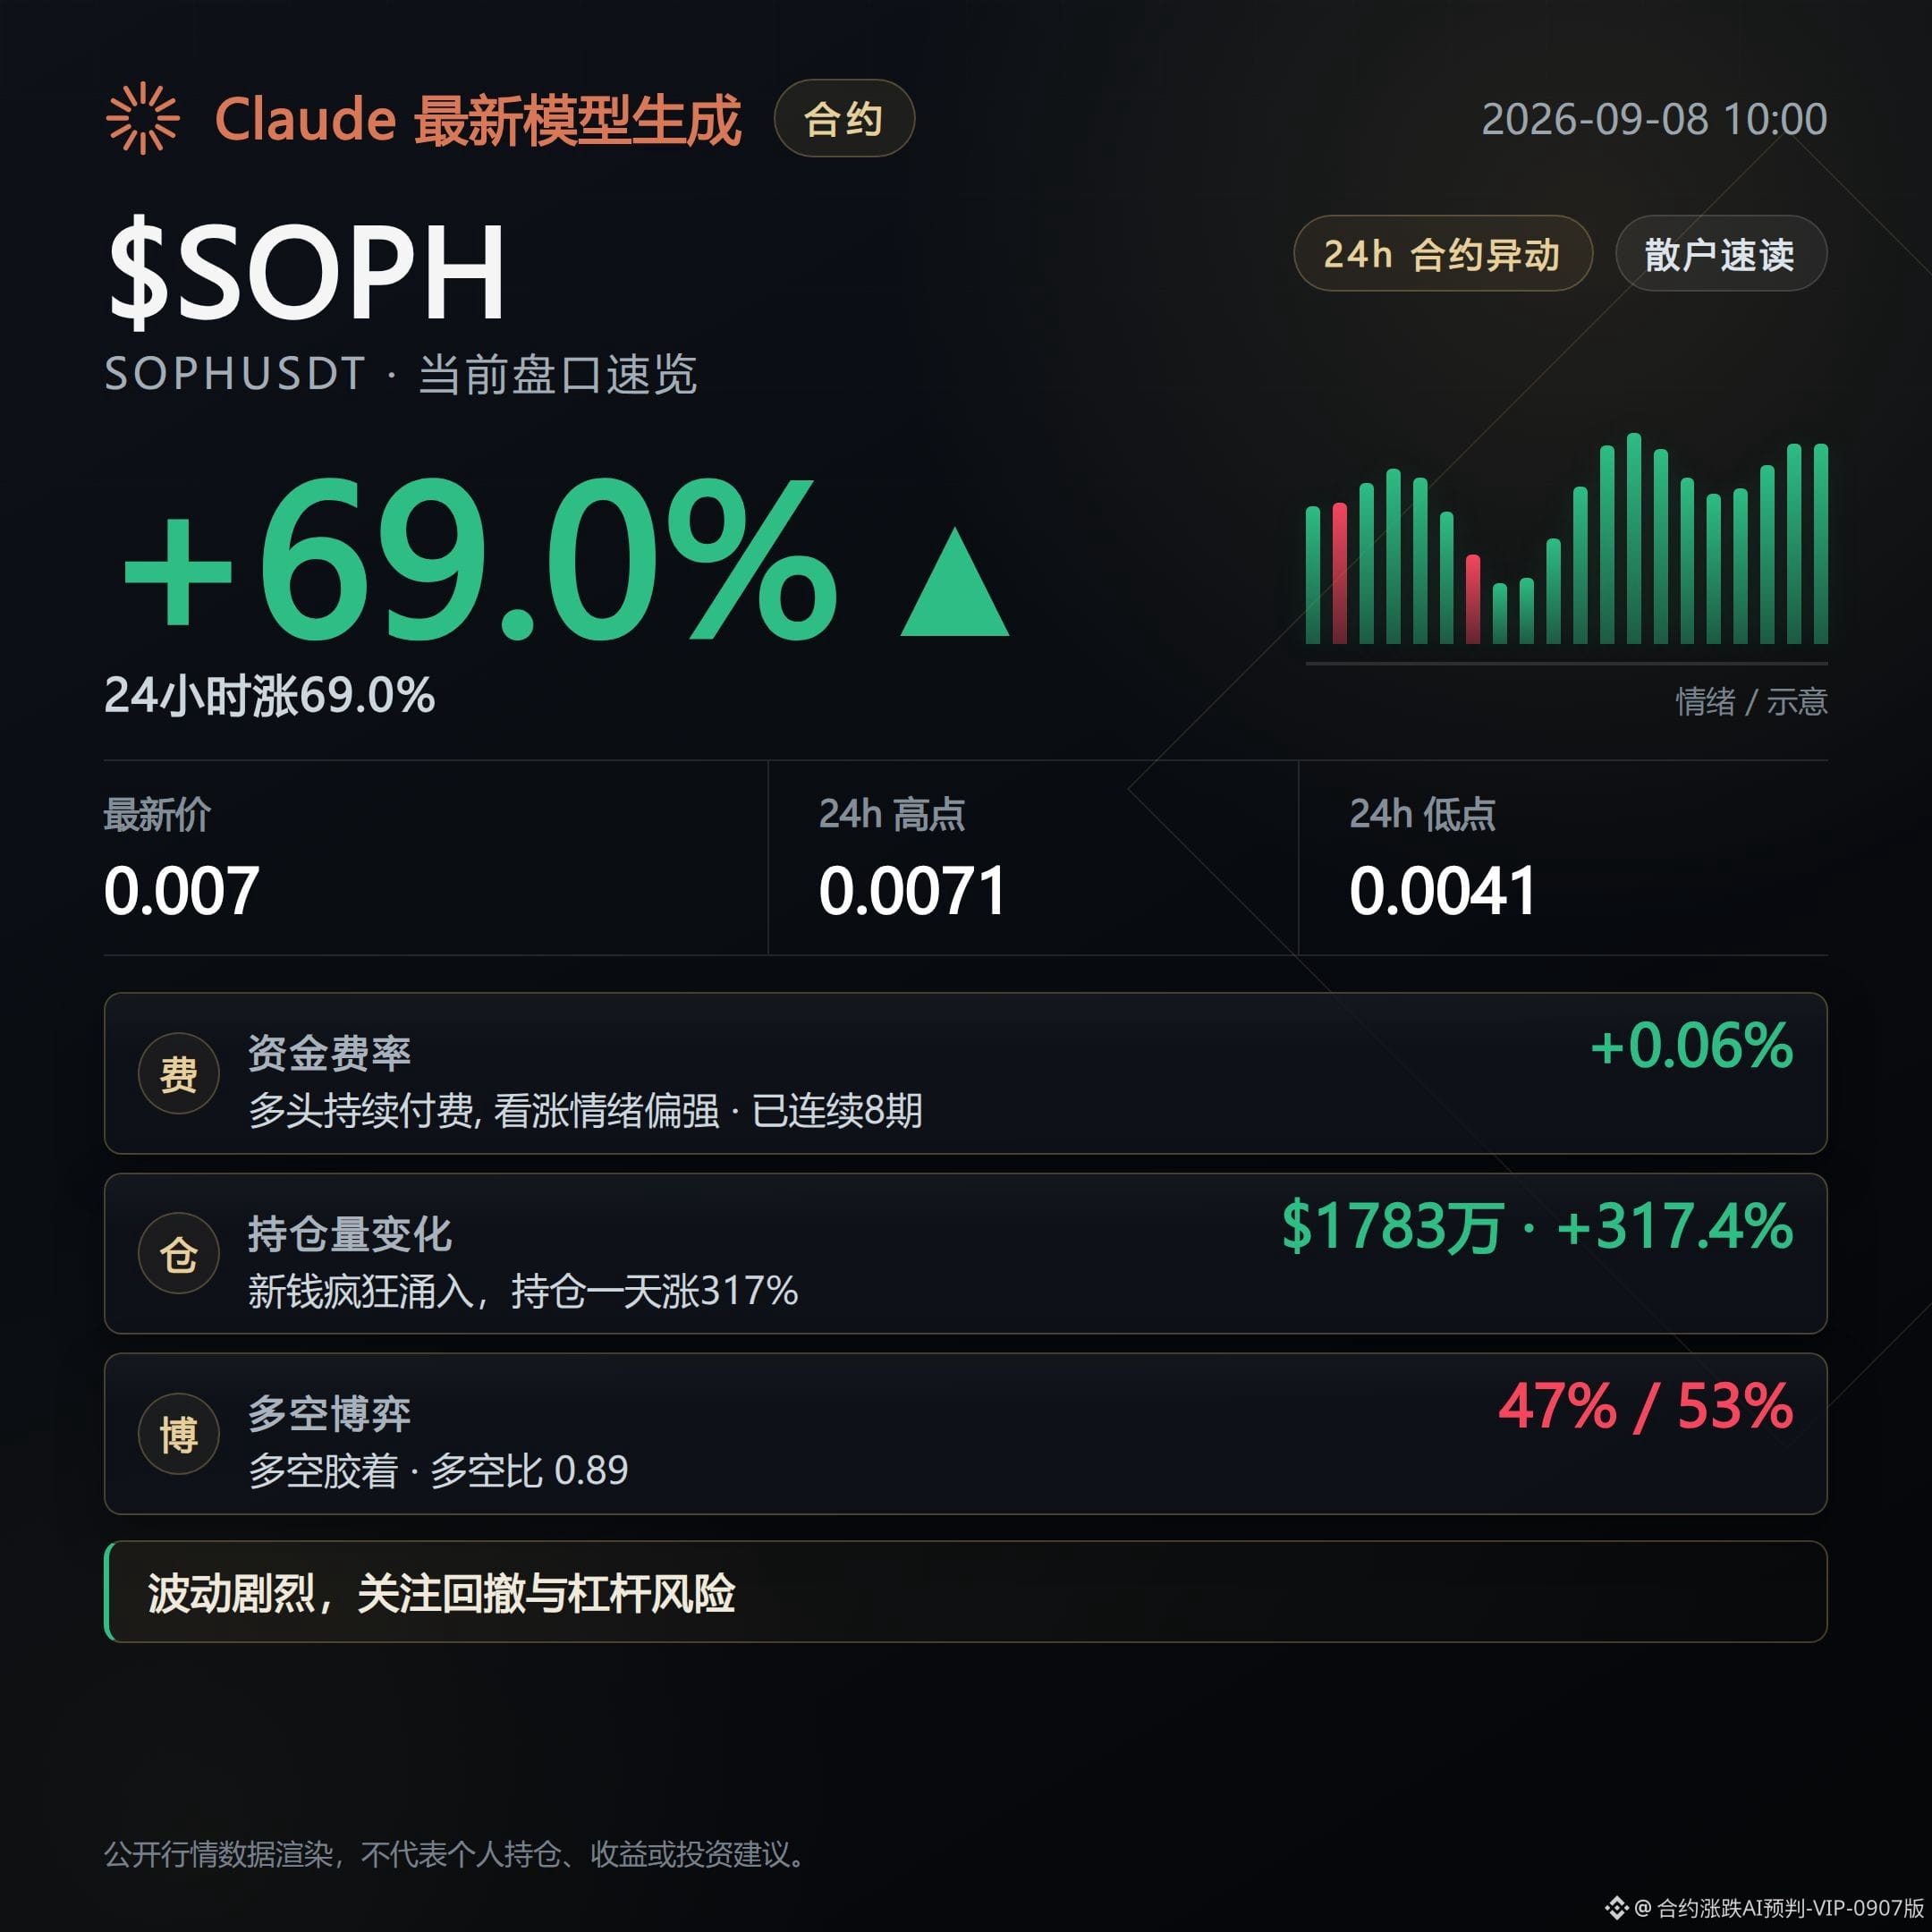
Top 3 by 24-hour price increase—go straight through the order book.
#1: SOPH. 24-hour increase: 68.96%. Trading volume: $170 million. Open interest surged 317.4% in 24 hours to $17.83 million. Still adding positions within the last hour (+26.8%). Funding rate: 0.0605%. It has been long-paid for 8 consecutive funding rounds. The aggressive buy-side ratio is 1.07, with longs slightly in control. Price has already surged to 81.6, placing it in the overbought zone. The super trend line is still pointing upward.
#2: IOST. 24-hour increase: 34.34%. Trading volume: $176 million—the highest among the three. Open interest increased 146.4% over 24 hours, but in the past hour it turned into a slight decrease (-2.0%). Funding rate is 0.01%, maintaining long-paid status for 8 straight rounds. Technical position: 60.2, in a neutral range. The long/short account ratio is 1.1; the whales’ direction ratio is 0.84. There’s a divergence between whale positioning and retail structure.
#3: AERO. 24-hour increase: 19.74%—the smallest increase among the three. Trading volume: $66.05 million. Open interest rose 32.7% over 24 hours; the growth rate is clearly slower than the first two coins. But the long/short account ratio is 1.81, and the whales’ direction ratio is 1.83—highest long concentration among the three. Funding rate: 0.005%, long-paid for 8 consecutive rounds. Technical position: 74.0, also in the overbought zone.
The three coins share one common point: the stronger the rally, the faster open interest piles up, and the funding rate is also being paid continuously by longs—suggesting that the chase-long positions are continuously adding leverage. Both SOPH and AERO have already entered the overbought range. In this zone, order-book crowding is high; historically it tends to see sharp volatility and rapid pullbacks. When watching the tape, pay extra attention to the marginal changes in open interest and funding rates.
$SOPH $IOST $AERO # Contract price increase leaderboard
Live disclosure: This account currently holds FOGO long positions; the related viewpoints match the actual holdings.
Claude Fable 5 assisted generation; content is for market information reference only and does not constitute investment advice.
#1: SOPH. 24-hour increase: 68.96%. Trading volume: $170 million. Open interest surged 317.4% in 24 hours to $17.83 million. Still adding positions within the last hour (+26.8%). Funding rate: 0.0605%. It has been long-paid for 8 consecutive funding rounds. The aggressive buy-side ratio is 1.07, with longs slightly in control. Price has already surged to 81.6, placing it in the overbought zone. The super trend line is still pointing upward.
#2: IOST. 24-hour increase: 34.34%. Trading volume: $176 million—the highest among the three. Open interest increased 146.4% over 24 hours, but in the past hour it turned into a slight decrease (-2.0%). Funding rate is 0.01%, maintaining long-paid status for 8 straight rounds. Technical position: 60.2, in a neutral range. The long/short account ratio is 1.1; the whales’ direction ratio is 0.84. There’s a divergence between whale positioning and retail structure.
#3: AERO. 24-hour increase: 19.74%—the smallest increase among the three. Trading volume: $66.05 million. Open interest rose 32.7% over 24 hours; the growth rate is clearly slower than the first two coins. But the long/short account ratio is 1.81, and the whales’ direction ratio is 1.83—highest long concentration among the three. Funding rate: 0.005%, long-paid for 8 consecutive rounds. Technical position: 74.0, also in the overbought zone.
The three coins share one common point: the stronger the rally, the faster open interest piles up, and the funding rate is also being paid continuously by longs—suggesting that the chase-long positions are continuously adding leverage. Both SOPH and AERO have already entered the overbought range. In this zone, order-book crowding is high; historically it tends to see sharp volatility and rapid pullbacks. When watching the tape, pay extra attention to the marginal changes in open interest and funding rates.
$SOPH $IOST $AERO # Contract price increase leaderboard
Live disclosure: This account currently holds FOGO long positions; the related viewpoints match the actual holdings.
Claude Fable 5 assisted generation; content is for market information reference only and does not constitute investment advice.
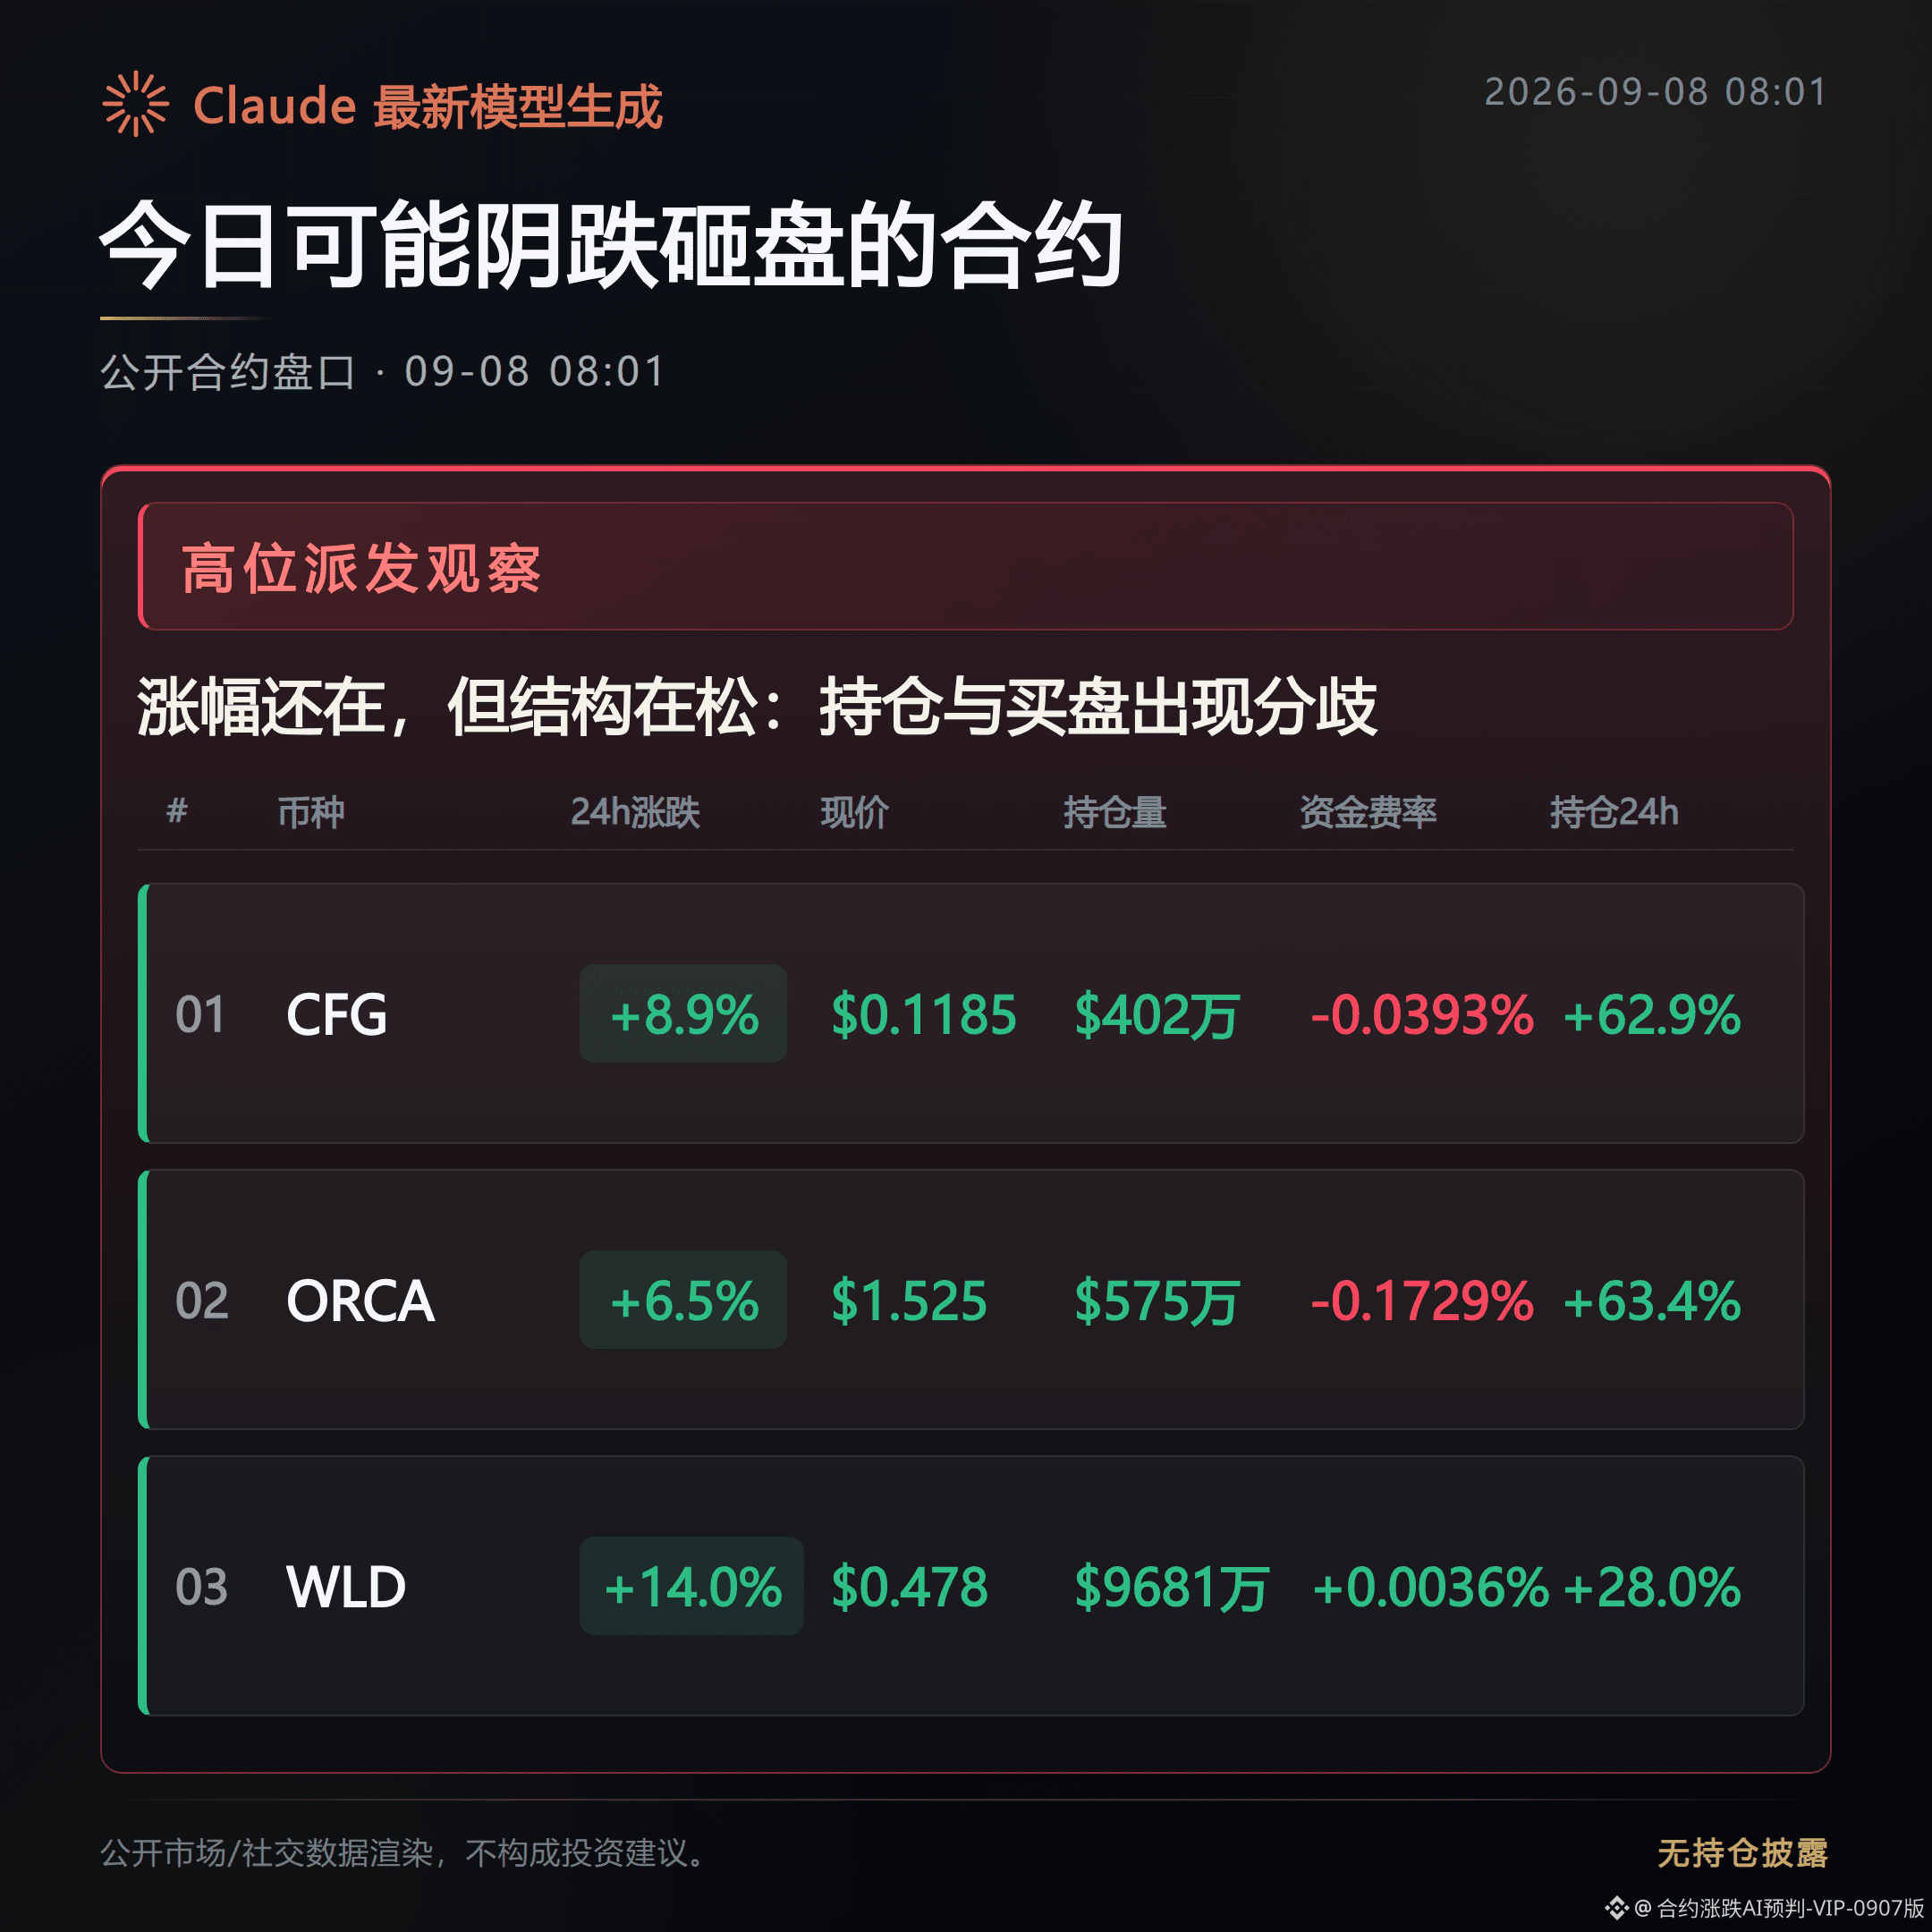
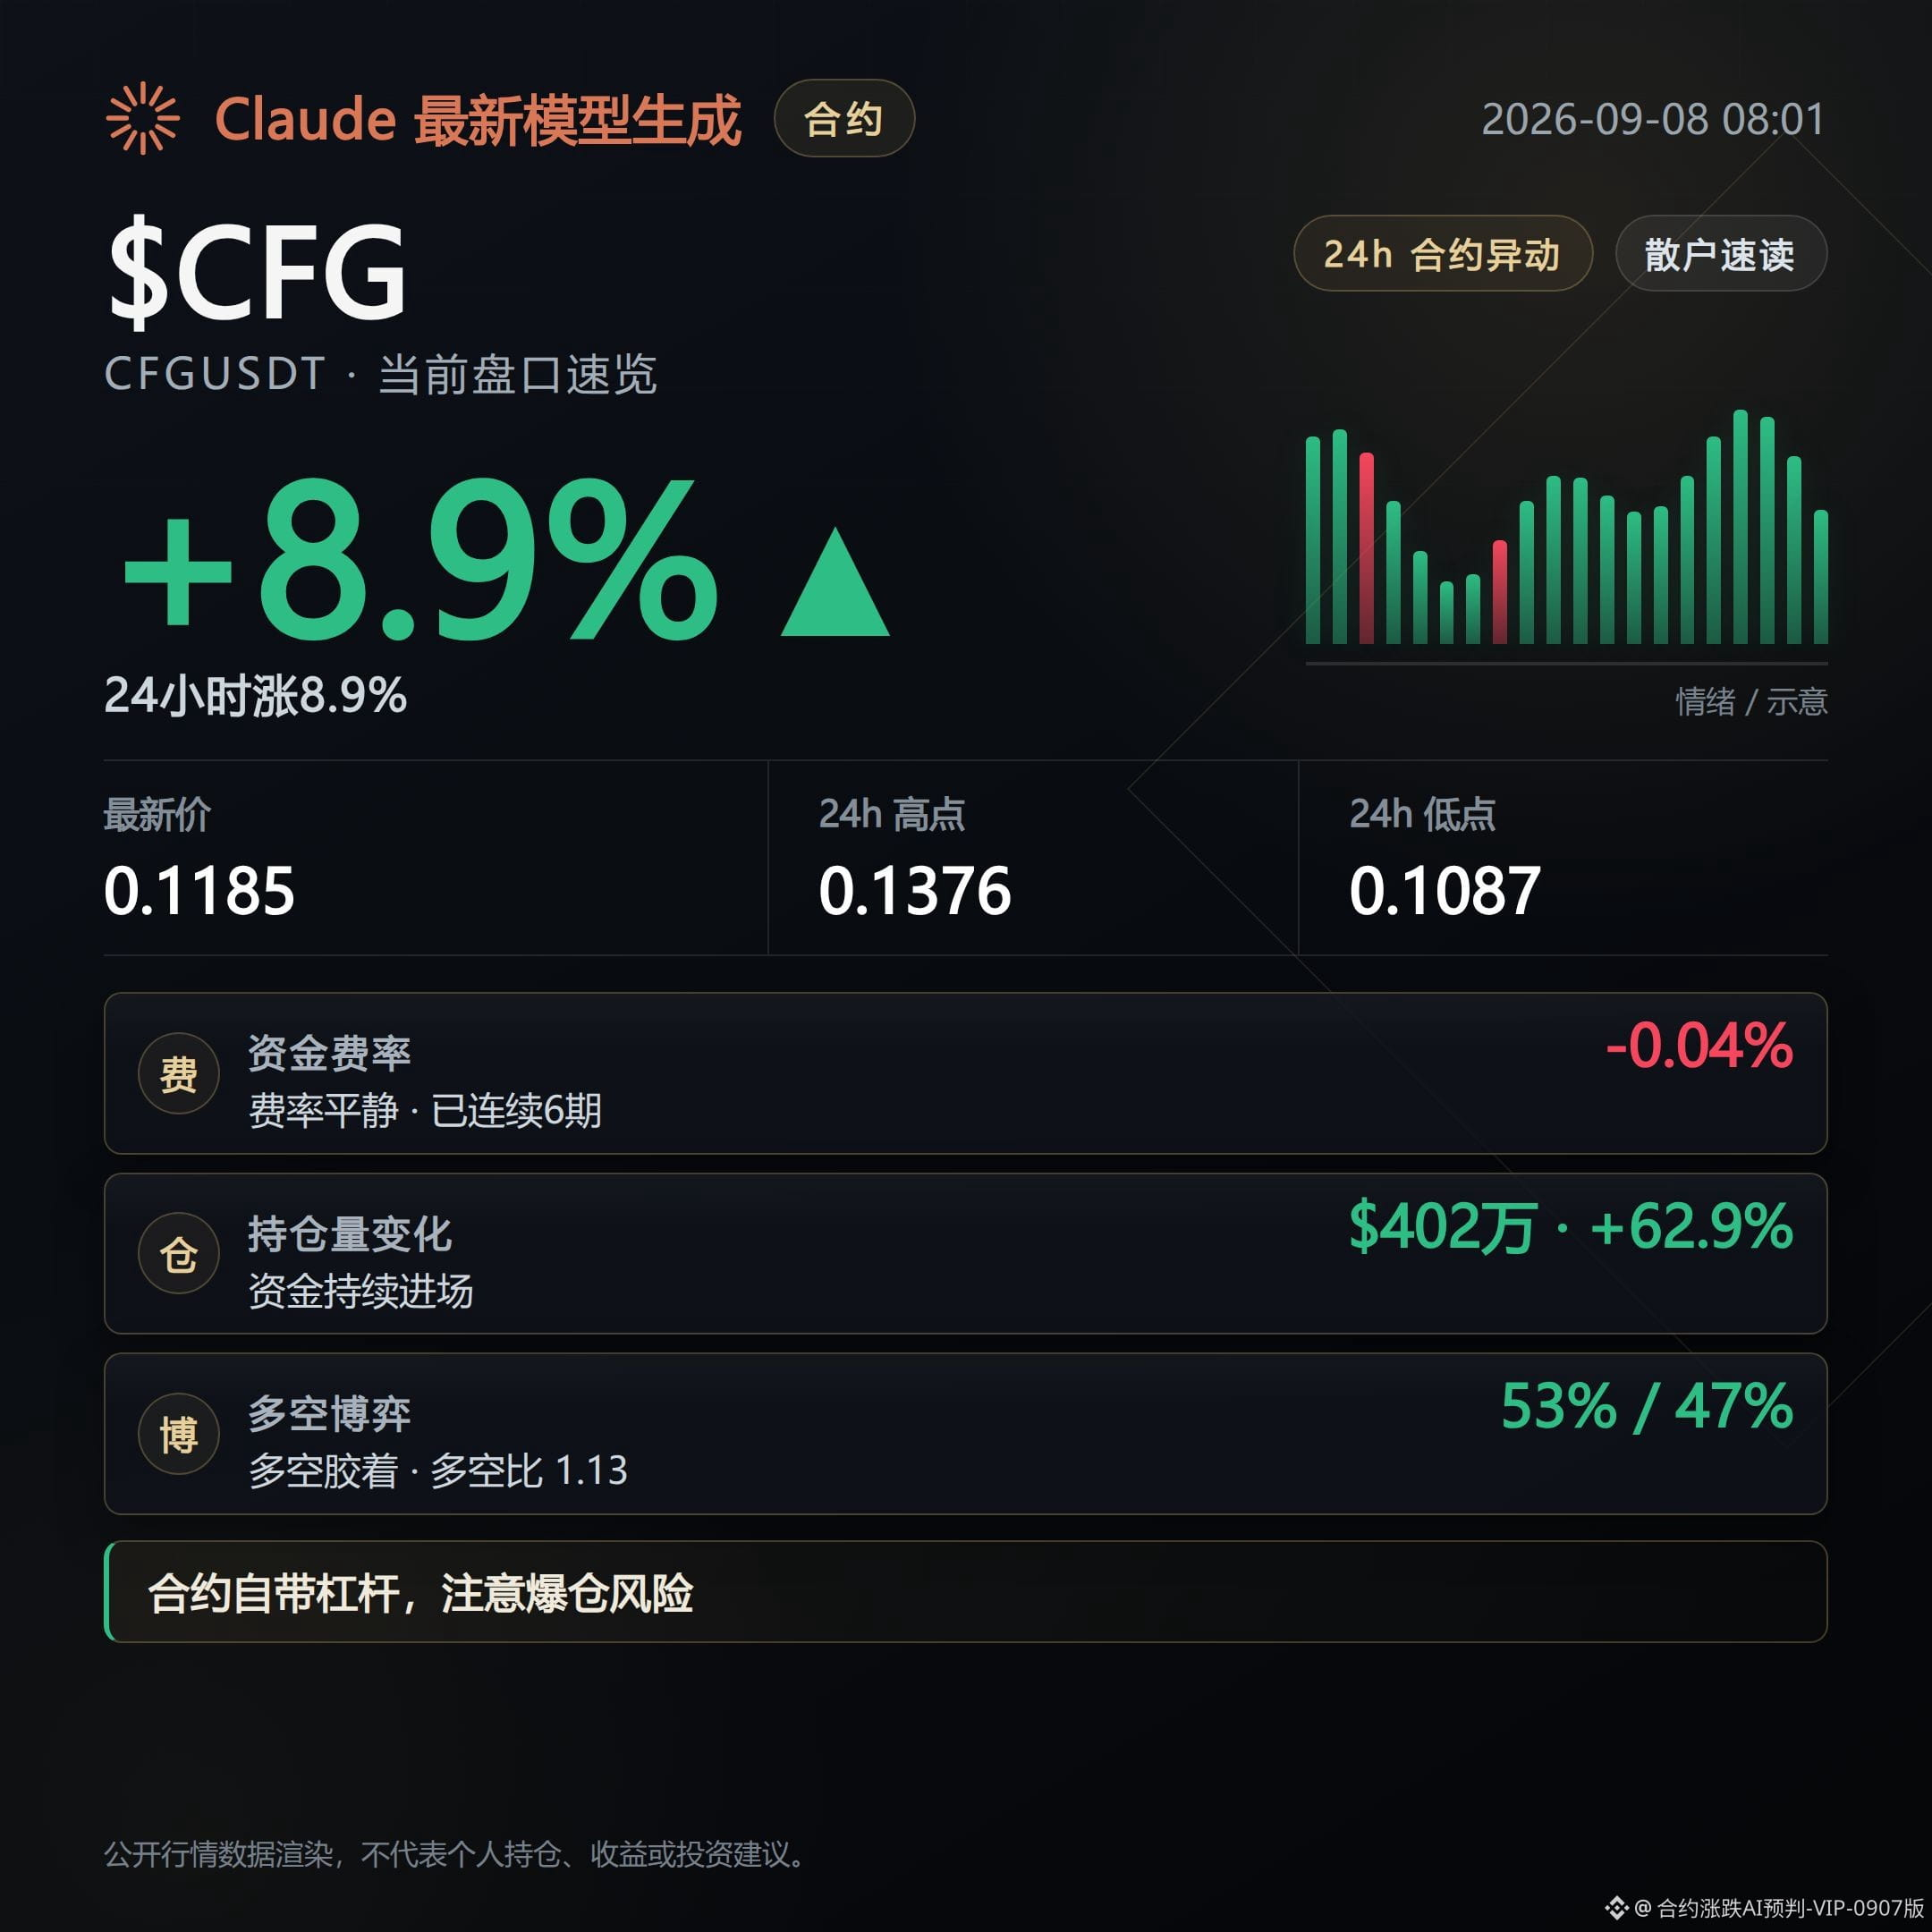
Bearish signals flicker simultaneously on these three contracts—and in that kind of way that makes people relax their guard: price is still rising, but the structure has started to loosen.
Don’t just look at the bullish percentage numbers. What you fear isn’t that it won’t rise—it’s that it keeps rising, and then the order book thinly holds. Next to watch is whether these coins’ pullbacks begin to play out, and whether the long positions chasing higher prices can withstand any rebound.
CFGUSDT is up 8.91% to $0.1185, but the funding rate has been paying shorts for 6 consecutive periods, at -0.0393%, indicating longs on the contract side are effectively topping up the shorts to keep the order up.
Open interest surged 62.9% in 24 hours to $4.02 million—position inflow is fierce. However, the buy/sell ratio is 0.71 for active sell orders versus buys, meaning the bid side isn’t absorbing this wave of new positions.
Structurally, the Super Trend is still moving upward and volume hasn’t collapsed, but the mismatch between the funding rate and the order-book support is already there. Chasing longs is likely to be punished by both a rebound rejection and a pullback.
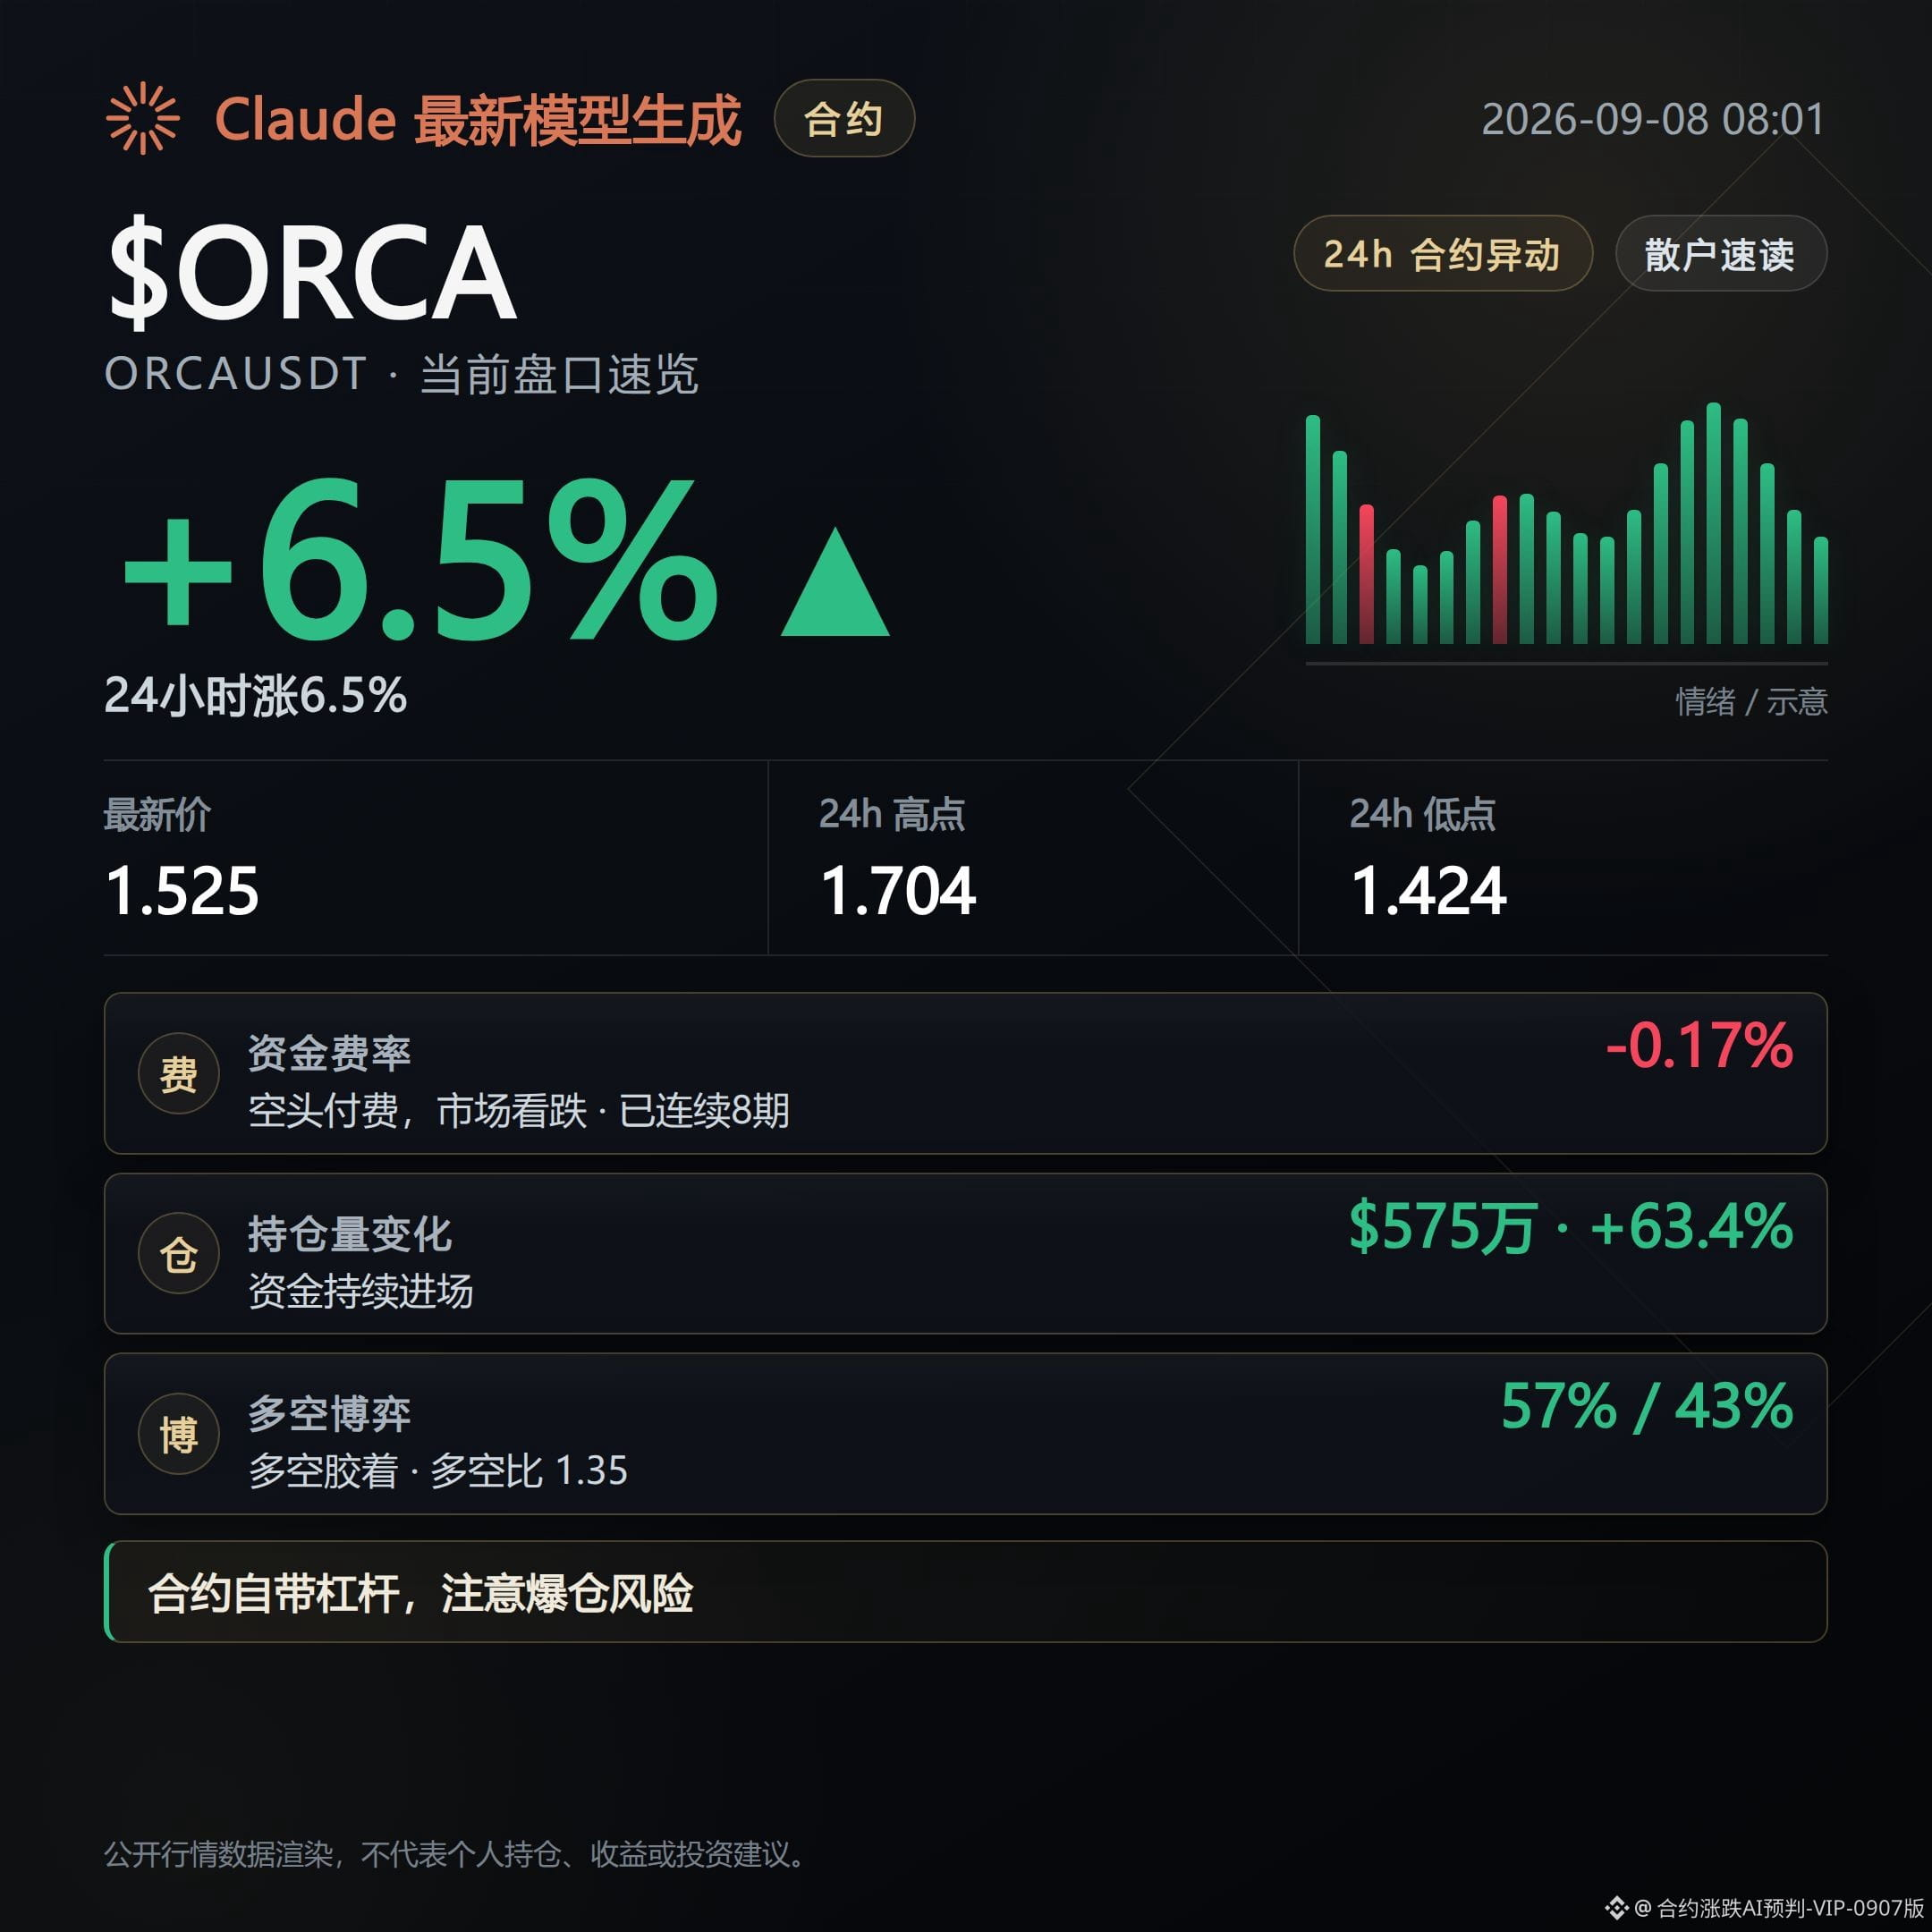
ORCAUSDT is up 6.49% to $1.525. Funding has been paying shorts for 8 straight periods and is negative at -0.1729%—even deeper than CFG—suggesting the price paid by longs is higher.
Open interest increased 63.4% in 24 hours to $5.74 million, again reflecting rapid position inflows. Retail longs make up 57%, but the smart-money long/short ratio is only 1.16—divergence is clearly visible.
The counter-evidence: the active buy volume is 1.22, so buys still have the upper hand for now. The system also flags a possible squeeze, which suggests there may still be room for short-term upside pressure—don’t simply treat it as an inevitable drop.
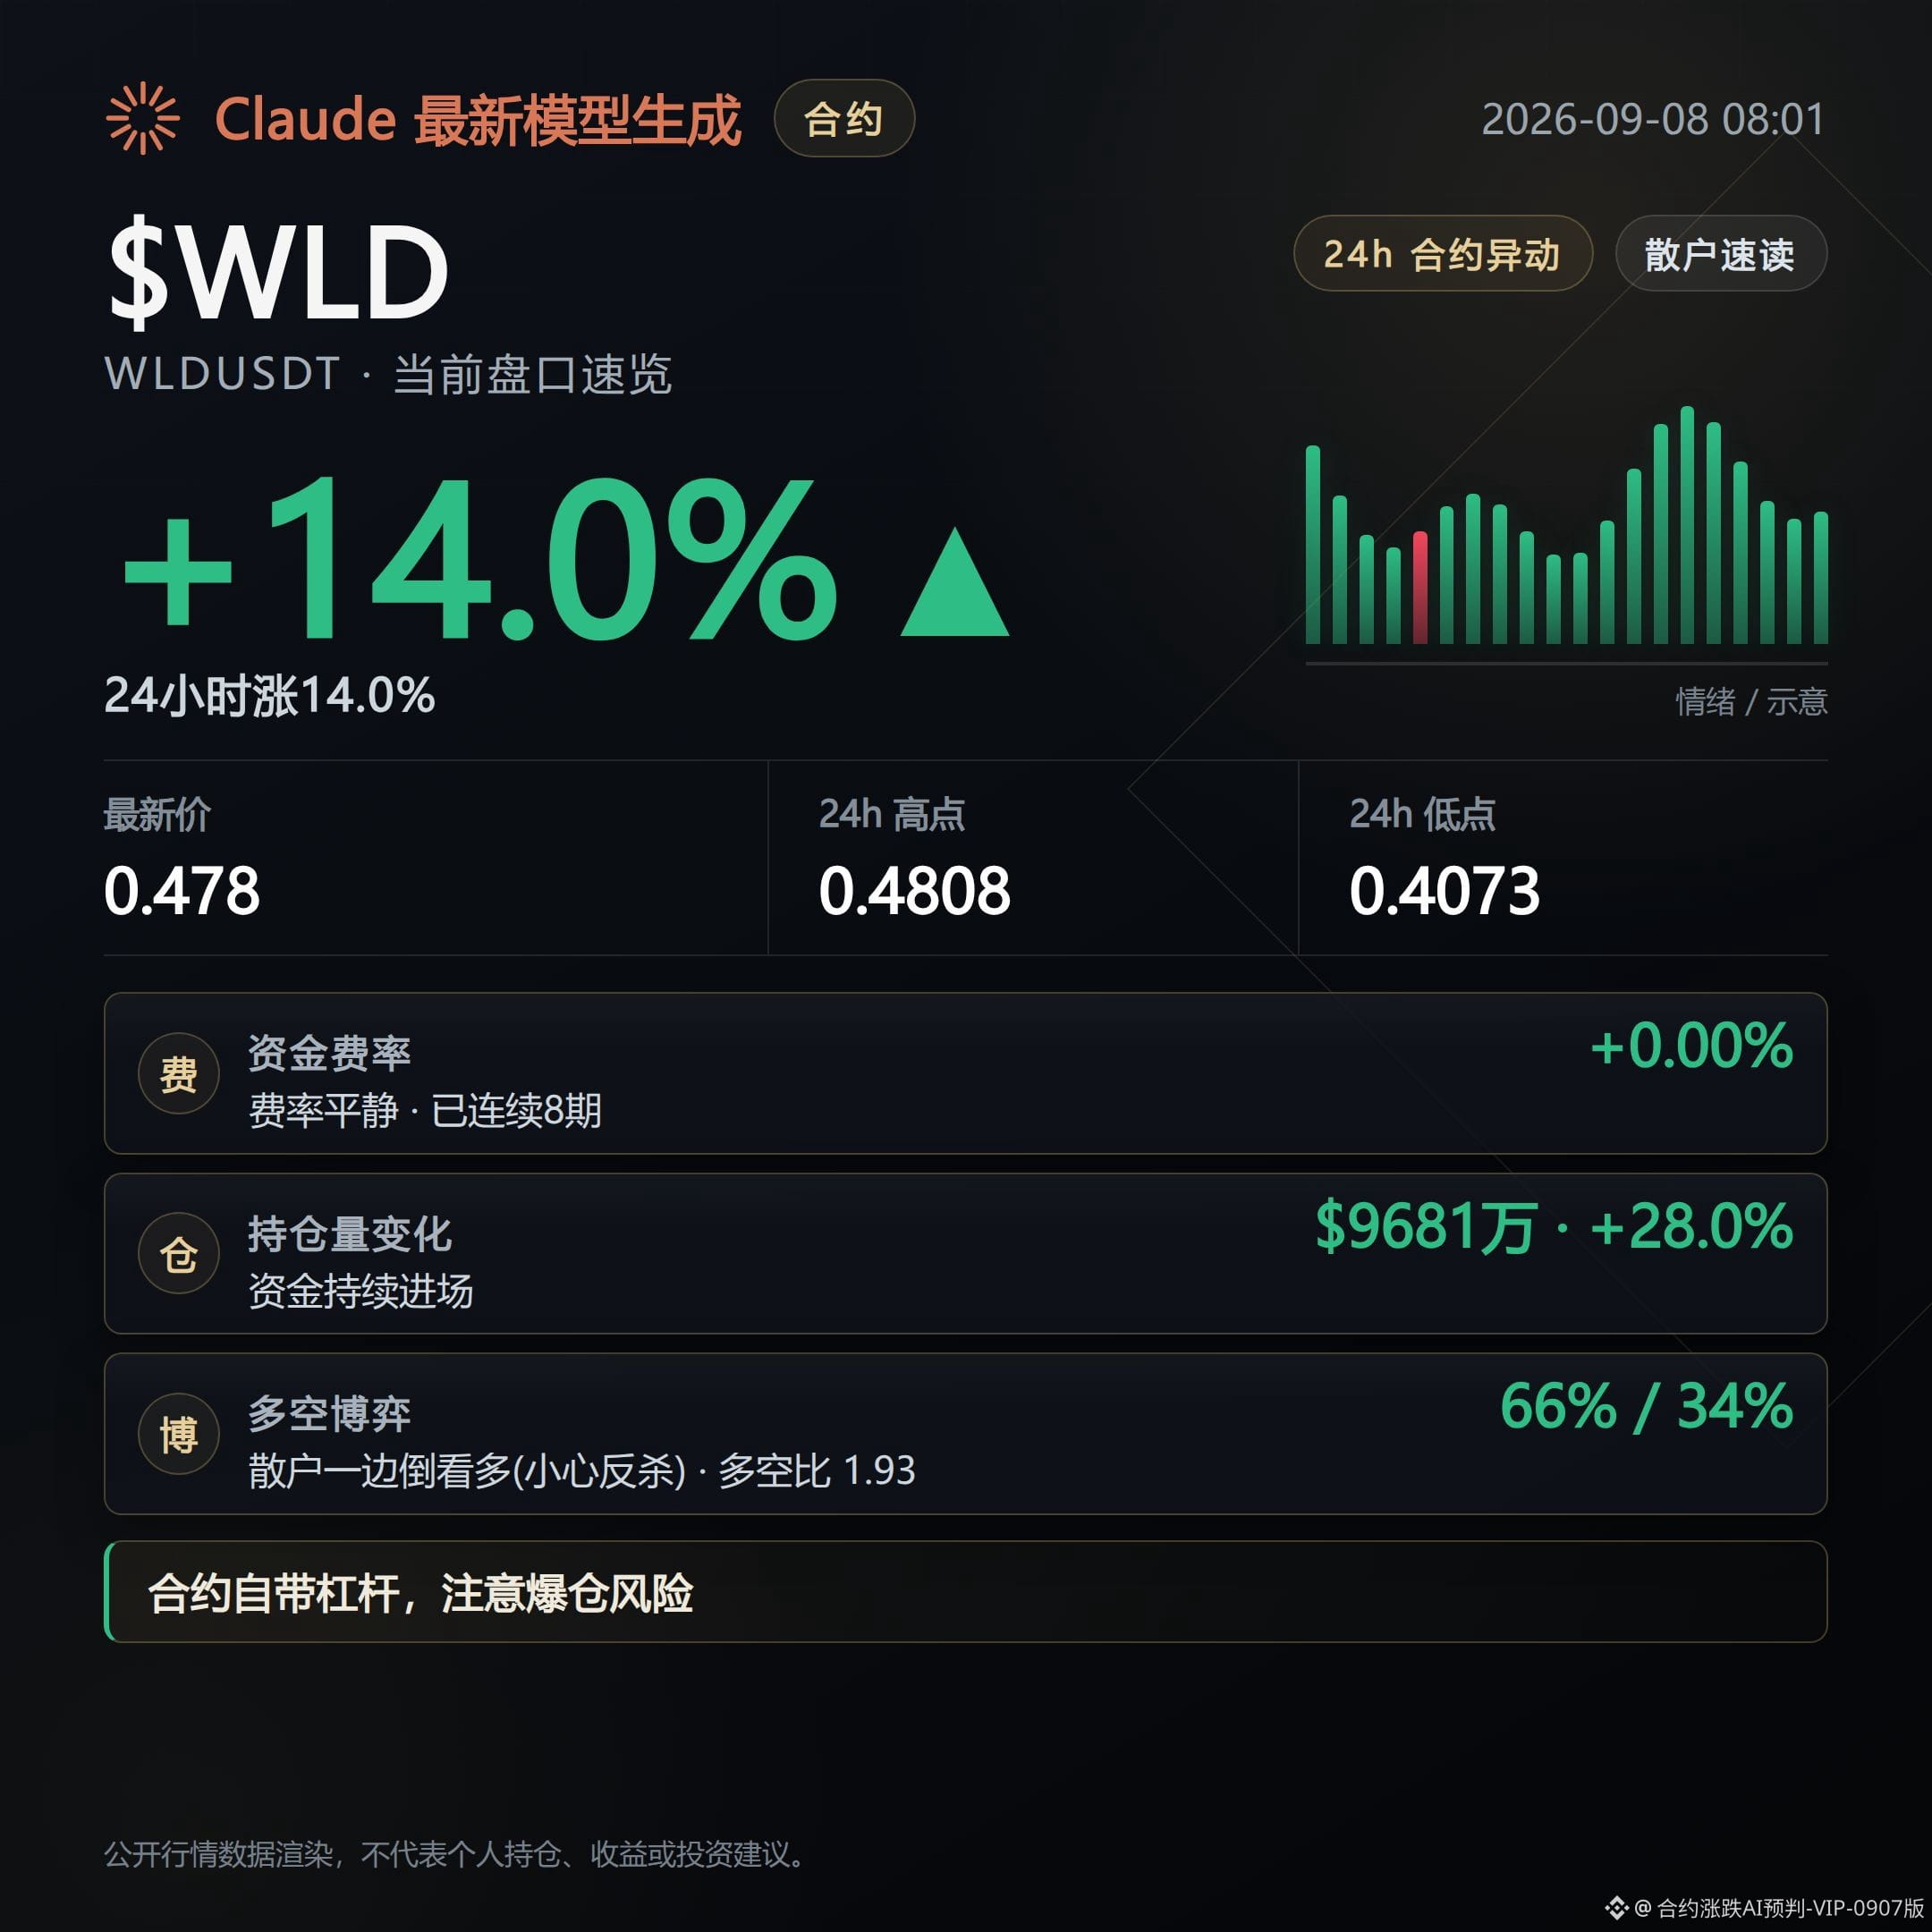
WLDUSDT has the strongest gain, up 14% to $0.478. Its trading value is $485 million, the largest among the three. Open interest is $96.81 million, up 28% over 24 hours.
Retail longs account for 66%, the long/short ratio is 1.93, and the smart-money long/short ratio is even higher at 2.0. Crowding is written right into the data, and the Relative Strength Index of 67.8 is already on the hot side.
The counter-evidence: the funding rate is still paying longs for 8 consecutive periods and is close to zero premium, which indicates there isn’t clear short-side pressure stepping in on the contract side yet. Right now, it’s more about retail crowding structurally rather than a flip in the broader funding/positioning.
The common thread across these coins right now is this: the price line hasn’t broken down, but open interest inflow, the funding-rate structure, and the buy/sell ratio are already starting to “clash.” If order-book support continues to thin, the pullback line is already forming; if it puts volume back in and holds the level, then this assessment needs to be revisited.
#CFG #ORCA #WLD #Contract order book
Position summary: This account’s live trading position currently holds $FOGO long contracts. Disclosure is provided to keep the content consistent with actual trades.
Claude Fable 5 assists in generation; content is for market information reference only and does not constitute investment advice.
Don’t just look at the bullish percentage numbers. What you fear isn’t that it won’t rise—it’s that it keeps rising, and then the order book thinly holds. Next to watch is whether these coins’ pullbacks begin to play out, and whether the long positions chasing higher prices can withstand any rebound.
CFGUSDT is up 8.91% to $0.1185, but the funding rate has been paying shorts for 6 consecutive periods, at -0.0393%, indicating longs on the contract side are effectively topping up the shorts to keep the order up.
Open interest surged 62.9% in 24 hours to $4.02 million—position inflow is fierce. However, the buy/sell ratio is 0.71 for active sell orders versus buys, meaning the bid side isn’t absorbing this wave of new positions.
Structurally, the Super Trend is still moving upward and volume hasn’t collapsed, but the mismatch between the funding rate and the order-book support is already there. Chasing longs is likely to be punished by both a rebound rejection and a pullback.
ORCAUSDT is up 6.49% to $1.525. Funding has been paying shorts for 8 straight periods and is negative at -0.1729%—even deeper than CFG—suggesting the price paid by longs is higher.
Open interest increased 63.4% in 24 hours to $5.74 million, again reflecting rapid position inflows. Retail longs make up 57%, but the smart-money long/short ratio is only 1.16—divergence is clearly visible.
The counter-evidence: the active buy volume is 1.22, so buys still have the upper hand for now. The system also flags a possible squeeze, which suggests there may still be room for short-term upside pressure—don’t simply treat it as an inevitable drop.
WLDUSDT has the strongest gain, up 14% to $0.478. Its trading value is $485 million, the largest among the three. Open interest is $96.81 million, up 28% over 24 hours.
Retail longs account for 66%, the long/short ratio is 1.93, and the smart-money long/short ratio is even higher at 2.0. Crowding is written right into the data, and the Relative Strength Index of 67.8 is already on the hot side.
The counter-evidence: the funding rate is still paying longs for 8 consecutive periods and is close to zero premium, which indicates there isn’t clear short-side pressure stepping in on the contract side yet. Right now, it’s more about retail crowding structurally rather than a flip in the broader funding/positioning.
The common thread across these coins right now is this: the price line hasn’t broken down, but open interest inflow, the funding-rate structure, and the buy/sell ratio are already starting to “clash.” If order-book support continues to thin, the pullback line is already forming; if it puts volume back in and holds the level, then this assessment needs to be revisited.
#CFG #ORCA #WLD #Contract order book
Position summary: This account’s live trading position currently holds $FOGO long contracts. Disclosure is provided to keep the content consistent with actual trades.
Claude Fable 5 assists in generation; content is for market information reference only and does not constitute investment advice.
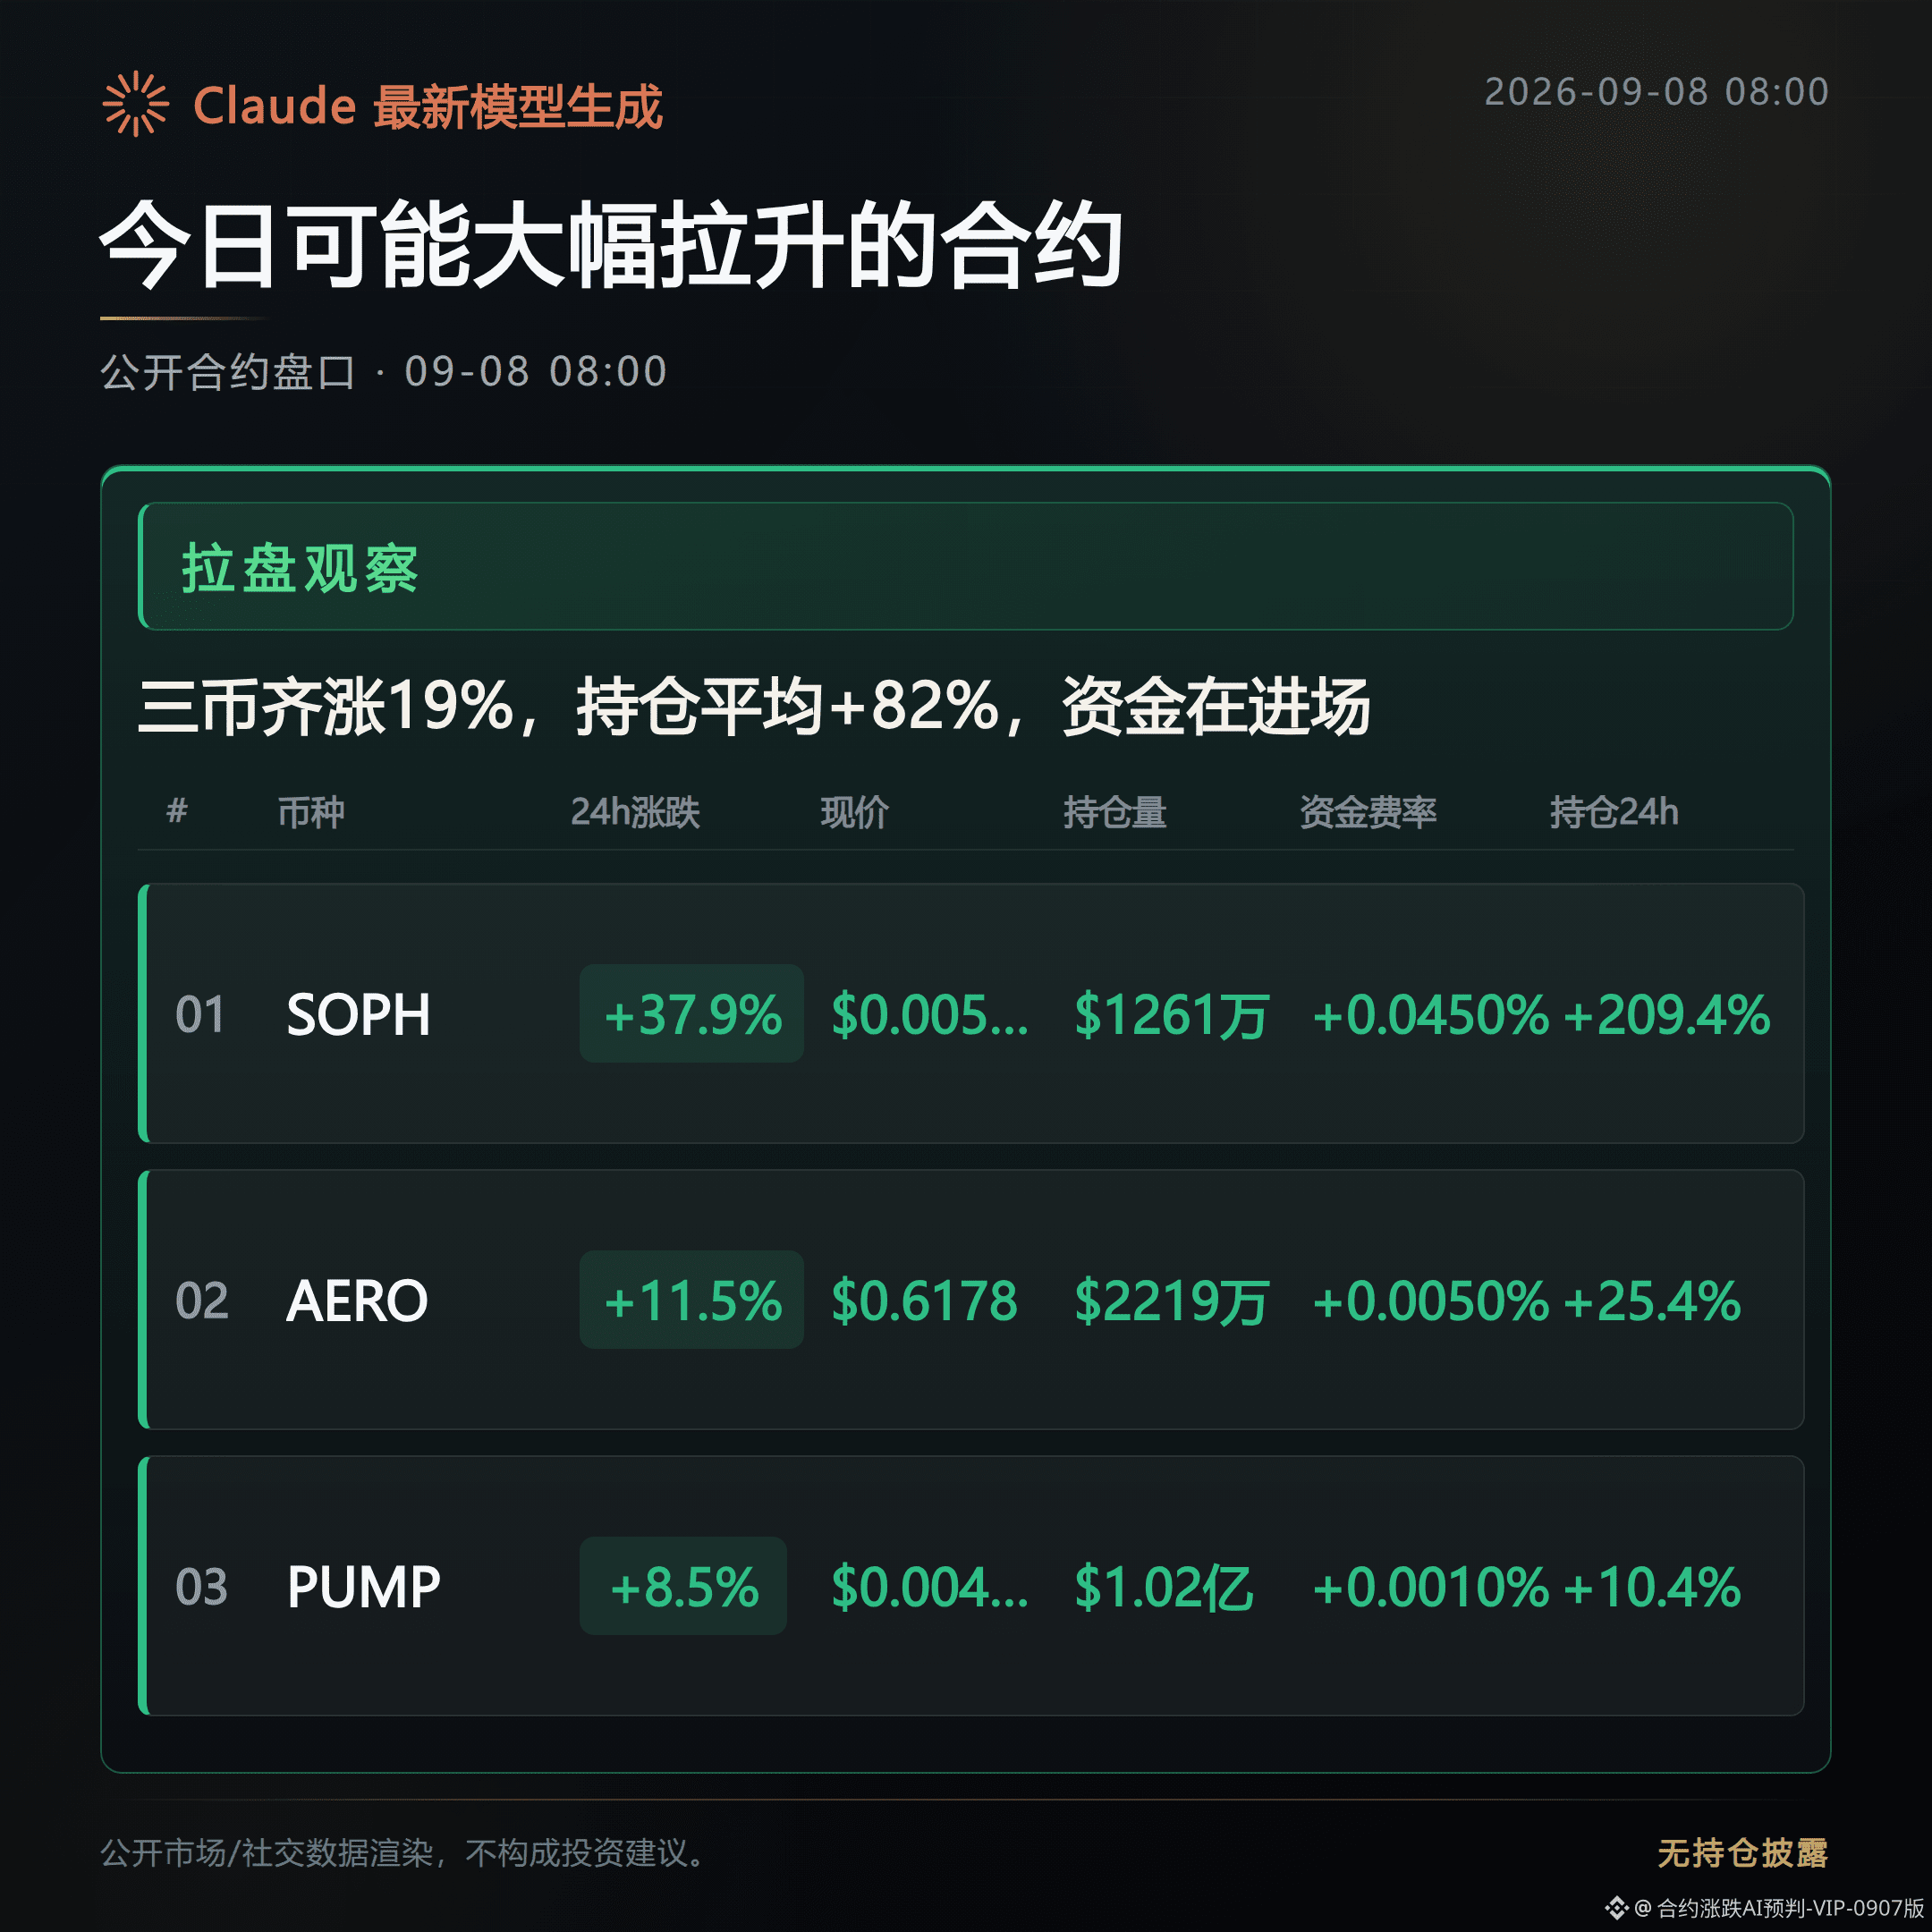
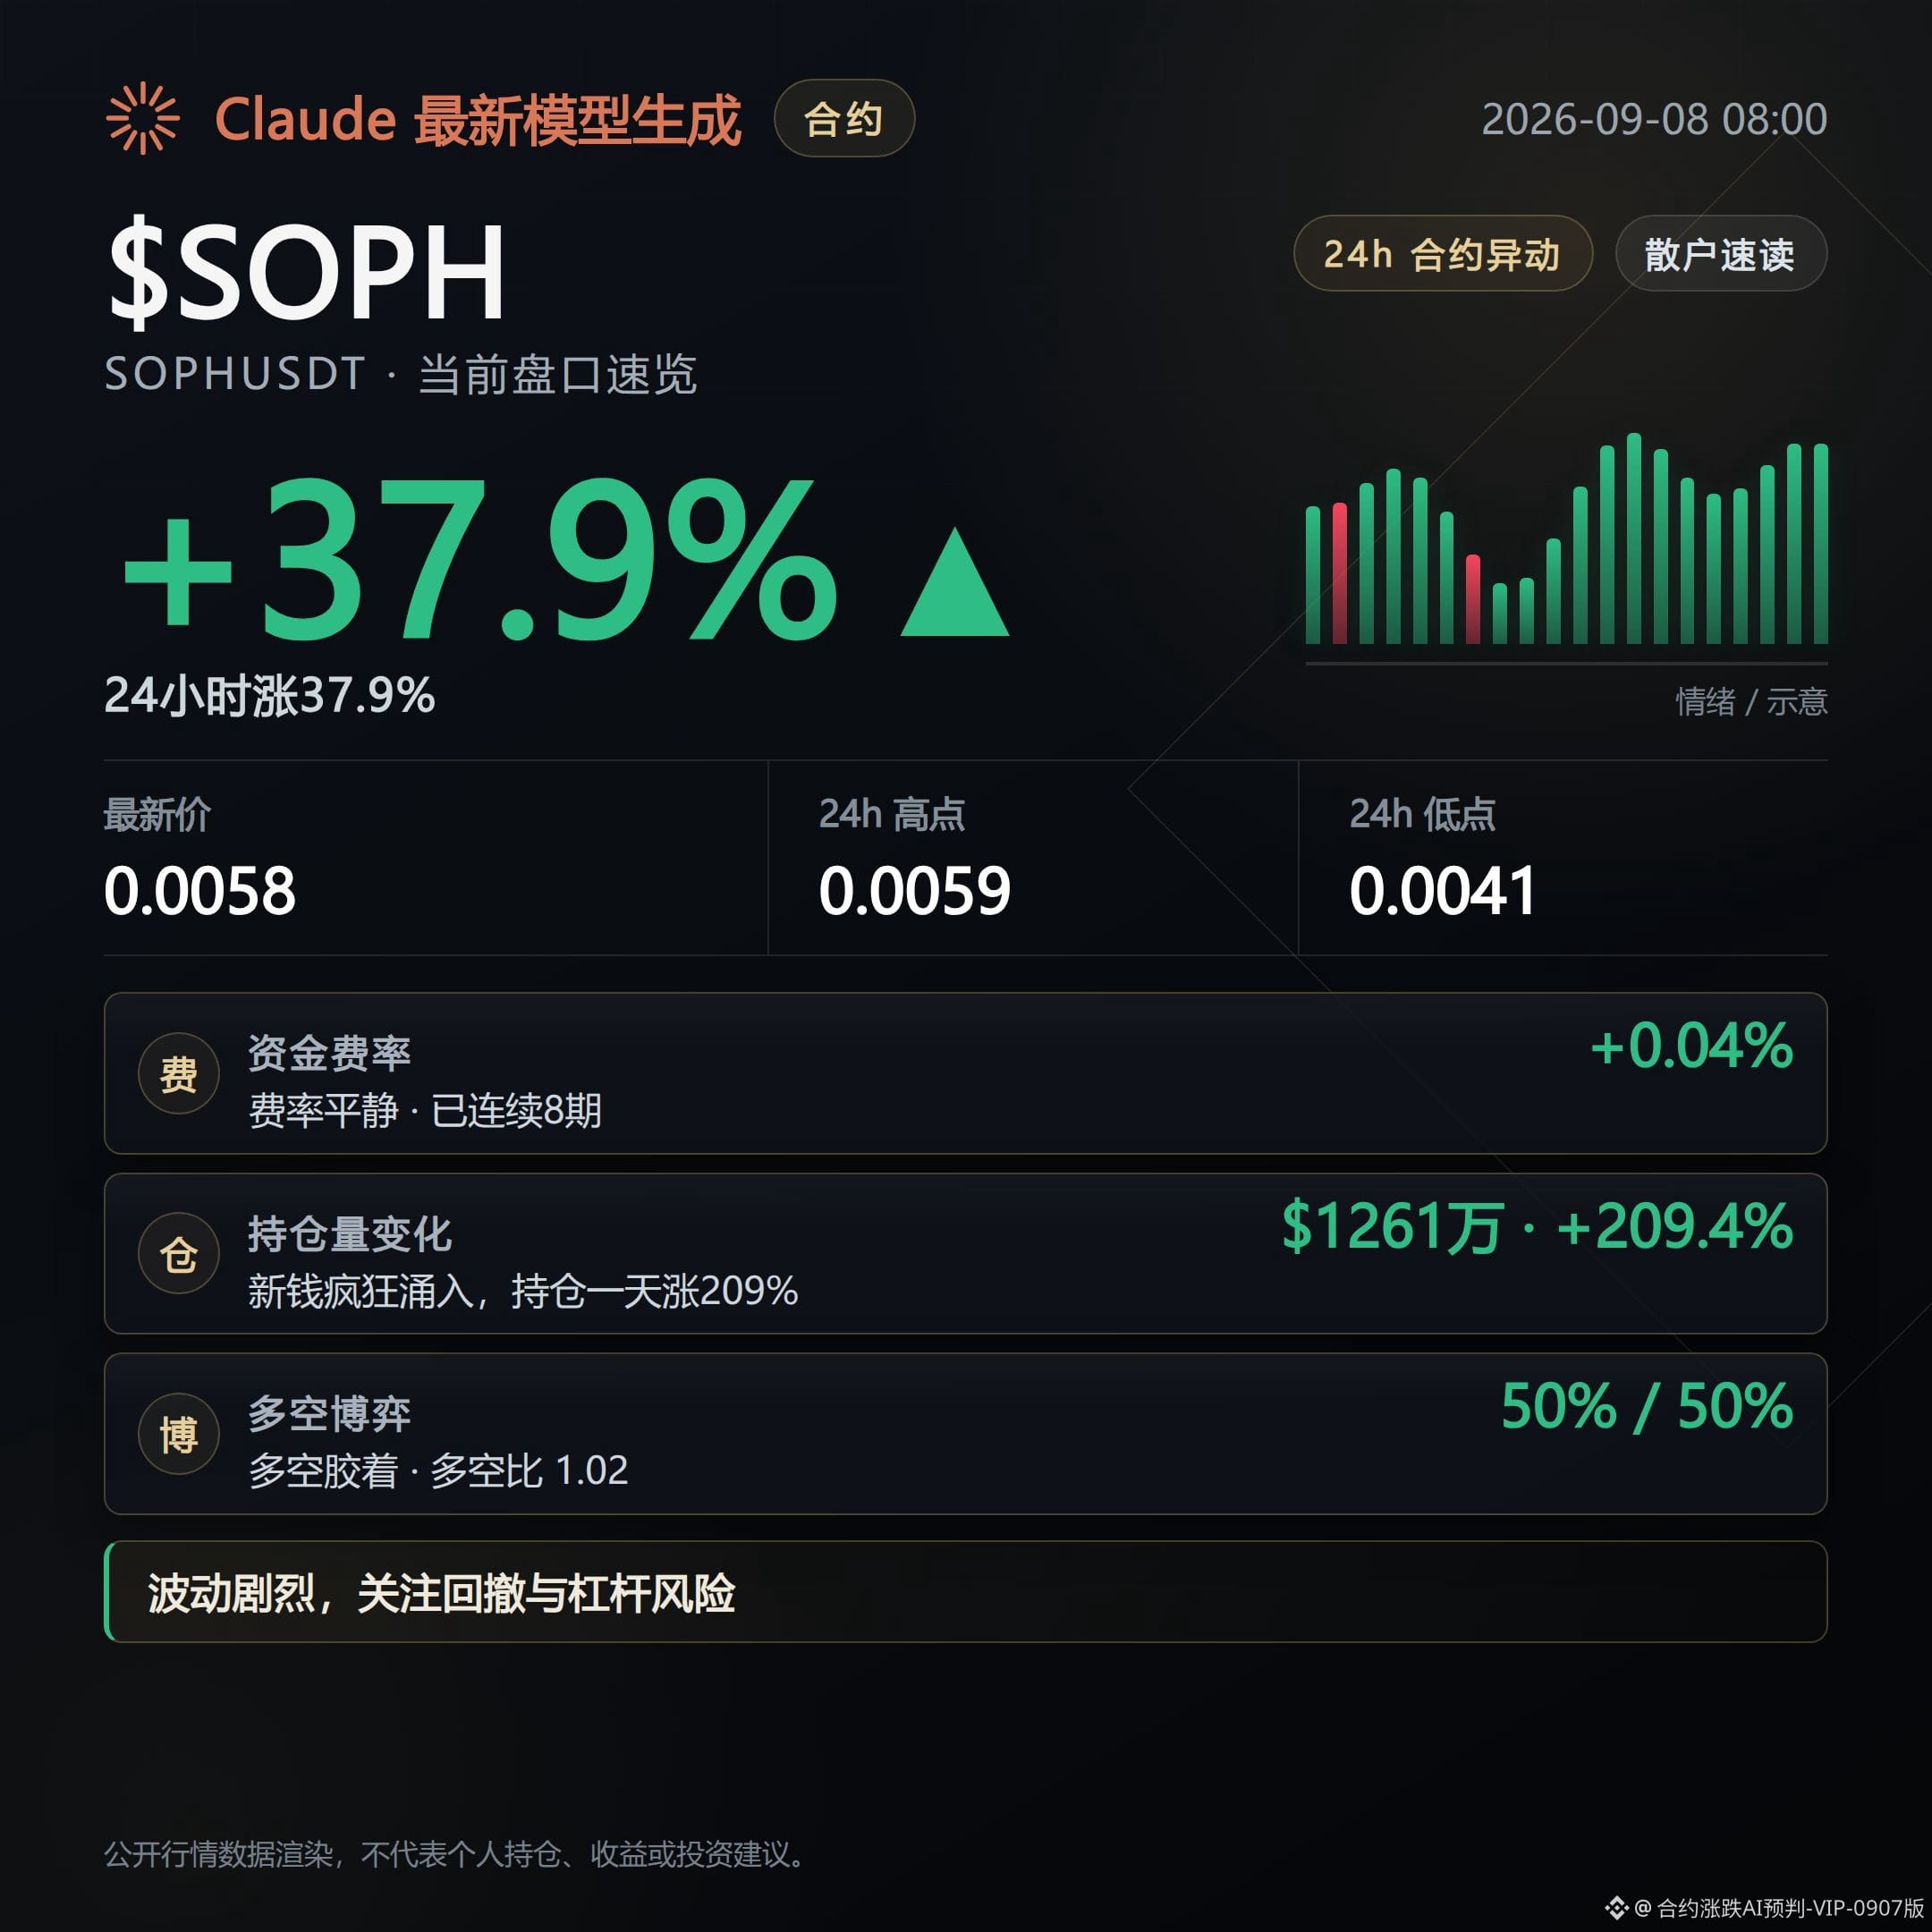
Contracts that may surge significantly today
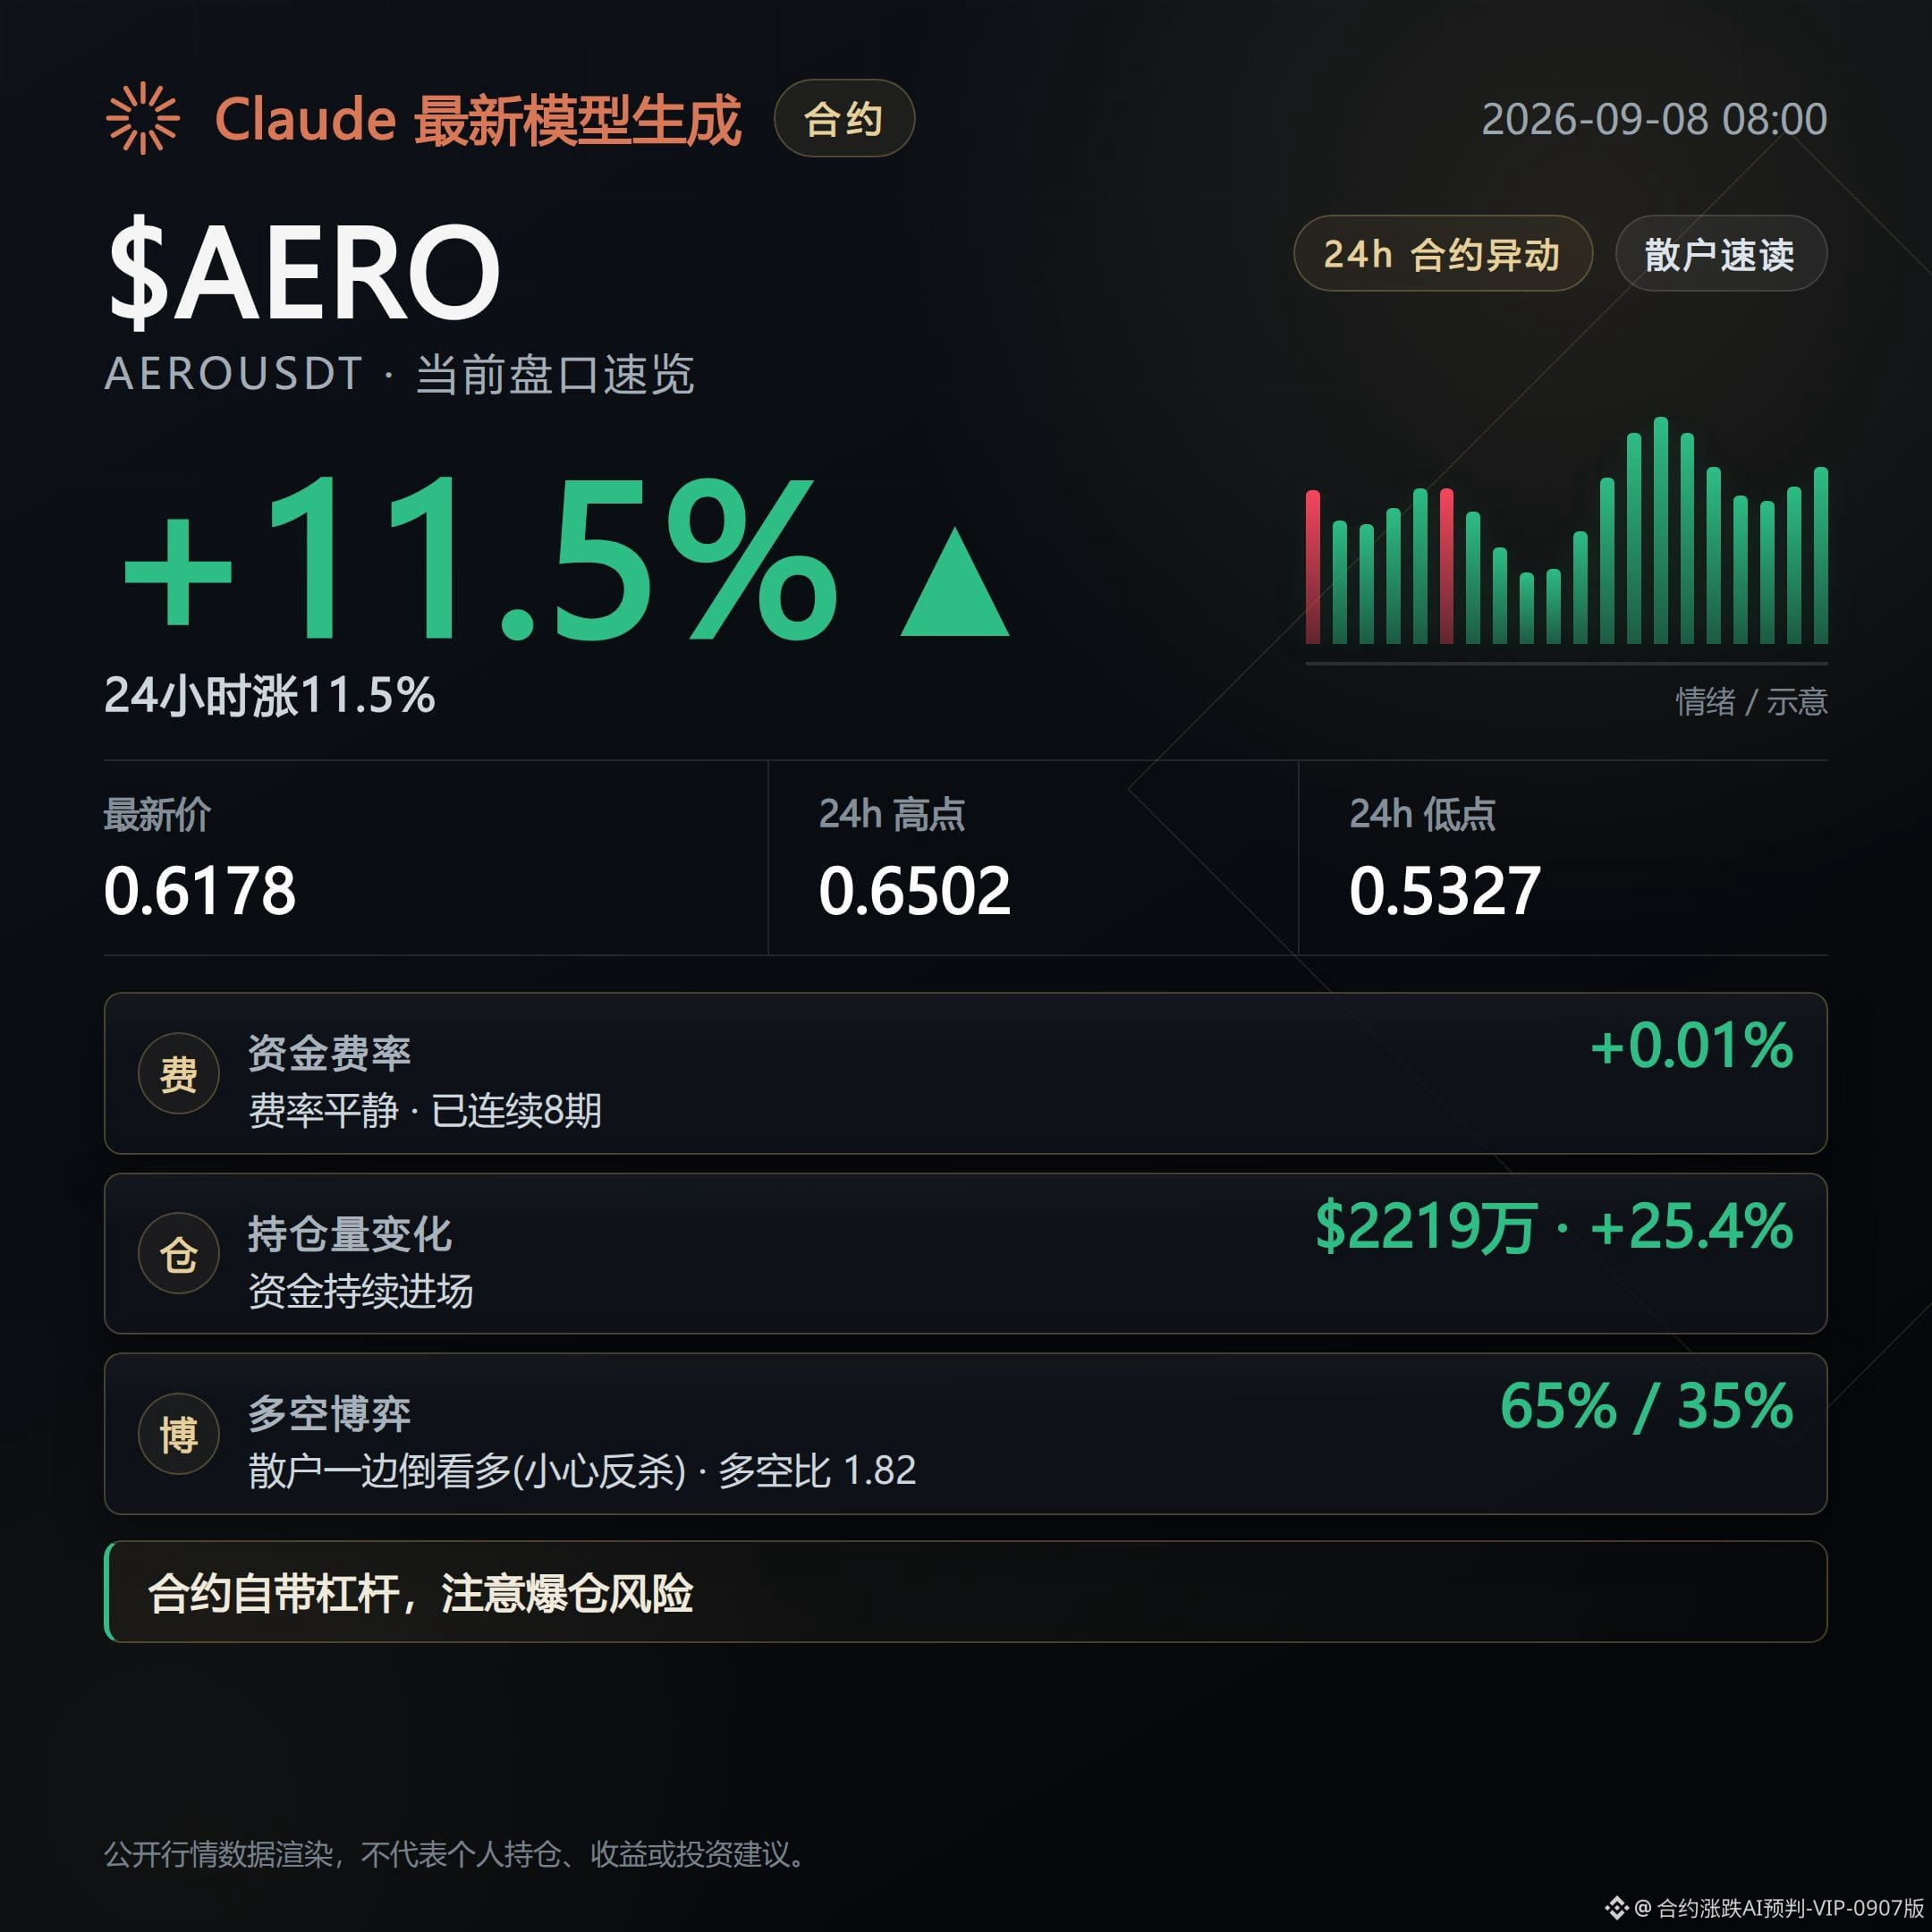
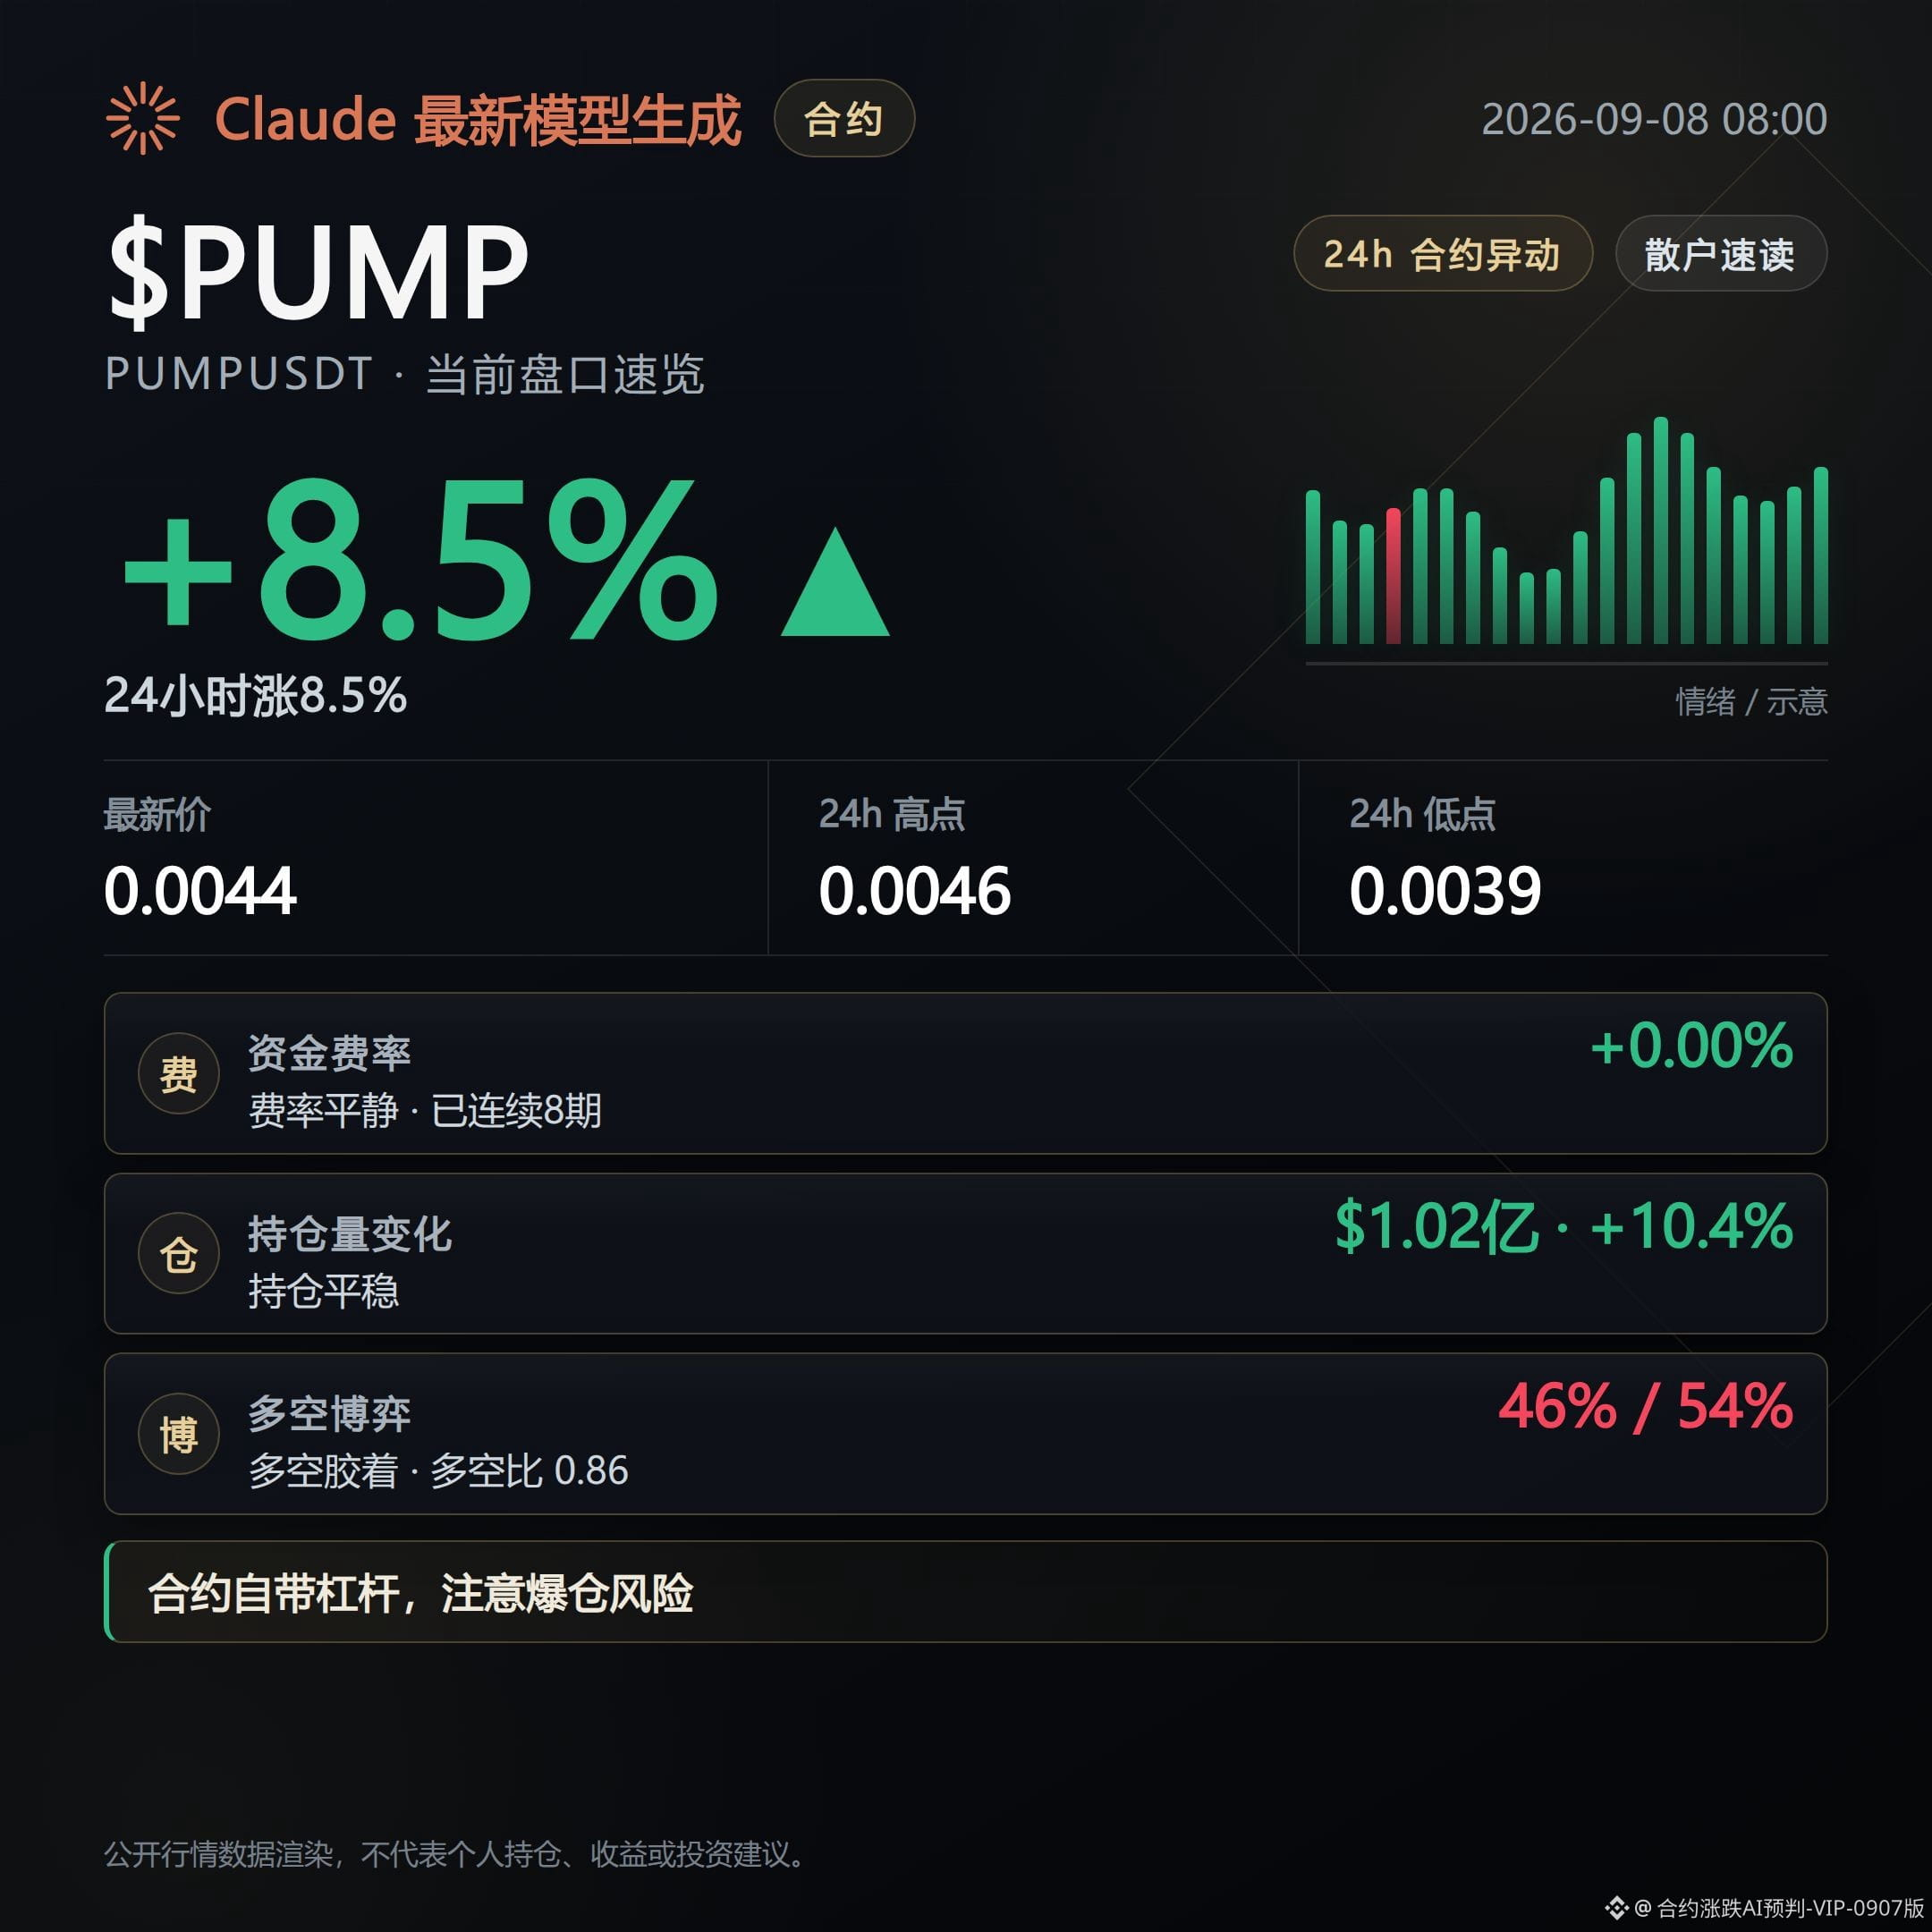
From this order book, I’m bullish. The 24-hour prices of SOPH, AERO, and PUMP are all moving in line; open interest is rising in sync, and the aggressive buy orders haven’t fallen behind.
Next, watch whether these three aspects can be confirmed further: Is the price still climbing following the pace of the public order book? Is the open interest position inflow still continuing? Has there been any change in the funding-rate side—do longs continue paying consecutively?
The strongest point in SOPH’s data is that the 24-hour increase is 37.93%, open interest in the past 24 hours has skyrocketed by 209.4%, and even the 1-hour figure is still adding 9.9%. This indicates that new positions are continuing to pour in at this price level.
Funding rates show 8 consecutive periods of longs paying, and the premium rate is also positive. The direction matches the expansion in open interest.
The counterpoint is that the relative strength indicator is already at 69.7. While it’s still within the neutral range, it’s on the high side; how much further it can run depends on whether it can withstand the push higher.
For AERO, the highlights are a 24-hour gain of 11.5%, open interest up 25.4% over 24 hours, the long-to-short position count ratio reaching 1.82, and even higher for large holders at 1.86—suggesting participation is tilted toward the long side.
Funding rates have 8 consecutive periods of longs paying, consistent with the direction of the price action.
The counterpoint is that the premium rate is negative at -0.051%, and open interest in the 1-hour window has dipped slightly by 2.1%. The short-term chase-long momentum is showing a bit of loosening.
For PUMP, the hard data is a 24-hour trading volume of $349 million, an aggressive buy/sell ratio of 1.34, with buys clearly dominant, and open interest also rising by 10.4% over 24 hours.
Funding rates also show 8 consecutive periods of longs paying, aligned with the direction.
The counterpoint is that the premium rate is -0.0541%, and the long-to-short position count ratio is only 0.86—retail isn’t majority long. The structure is mainly supported by the large-holder ratio of 1.81.
The chips are tightening.
If these three contracts’ open interest continues to rise along with price, and the proportion of aggressive buys keeps staying above 1, then this bullish line continues. If the 24-hour open interest growth turns negative, or if the funding rate shifts from longs paying to shorts paying, then this direction needs to be reassessed.
#合约盘口 $SOPH $AERO $PUMP
Open interest notes: This account holds FOGO long positions in real trading. The disclosure is intended to keep the content consistent with actual trades.
Contract data was assisted and compiled by Claude Fable 5, for information reference only—please verify it yourself.
From this order book, I’m bullish. The 24-hour prices of SOPH, AERO, and PUMP are all moving in line; open interest is rising in sync, and the aggressive buy orders haven’t fallen behind.
Next, watch whether these three aspects can be confirmed further: Is the price still climbing following the pace of the public order book? Is the open interest position inflow still continuing? Has there been any change in the funding-rate side—do longs continue paying consecutively?
The strongest point in SOPH’s data is that the 24-hour increase is 37.93%, open interest in the past 24 hours has skyrocketed by 209.4%, and even the 1-hour figure is still adding 9.9%. This indicates that new positions are continuing to pour in at this price level.
Funding rates show 8 consecutive periods of longs paying, and the premium rate is also positive. The direction matches the expansion in open interest.
The counterpoint is that the relative strength indicator is already at 69.7. While it’s still within the neutral range, it’s on the high side; how much further it can run depends on whether it can withstand the push higher.
For AERO, the highlights are a 24-hour gain of 11.5%, open interest up 25.4% over 24 hours, the long-to-short position count ratio reaching 1.82, and even higher for large holders at 1.86—suggesting participation is tilted toward the long side.
Funding rates have 8 consecutive periods of longs paying, consistent with the direction of the price action.
The counterpoint is that the premium rate is negative at -0.051%, and open interest in the 1-hour window has dipped slightly by 2.1%. The short-term chase-long momentum is showing a bit of loosening.
For PUMP, the hard data is a 24-hour trading volume of $349 million, an aggressive buy/sell ratio of 1.34, with buys clearly dominant, and open interest also rising by 10.4% over 24 hours.
Funding rates also show 8 consecutive periods of longs paying, aligned with the direction.
The counterpoint is that the premium rate is -0.0541%, and the long-to-short position count ratio is only 0.86—retail isn’t majority long. The structure is mainly supported by the large-holder ratio of 1.81.
The chips are tightening.
If these three contracts’ open interest continues to rise along with price, and the proportion of aggressive buys keeps staying above 1, then this bullish line continues. If the 24-hour open interest growth turns negative, or if the funding rate shifts from longs paying to shorts paying, then this direction needs to be reassessed.
#合约盘口 $SOPH $AERO $PUMP
Open interest notes: This account holds FOGO long positions in real trading. The disclosure is intended to keep the content consistent with actual trades.
Contract data was assisted and compiled by Claude Fable 5, for information reference only—please verify it yourself.
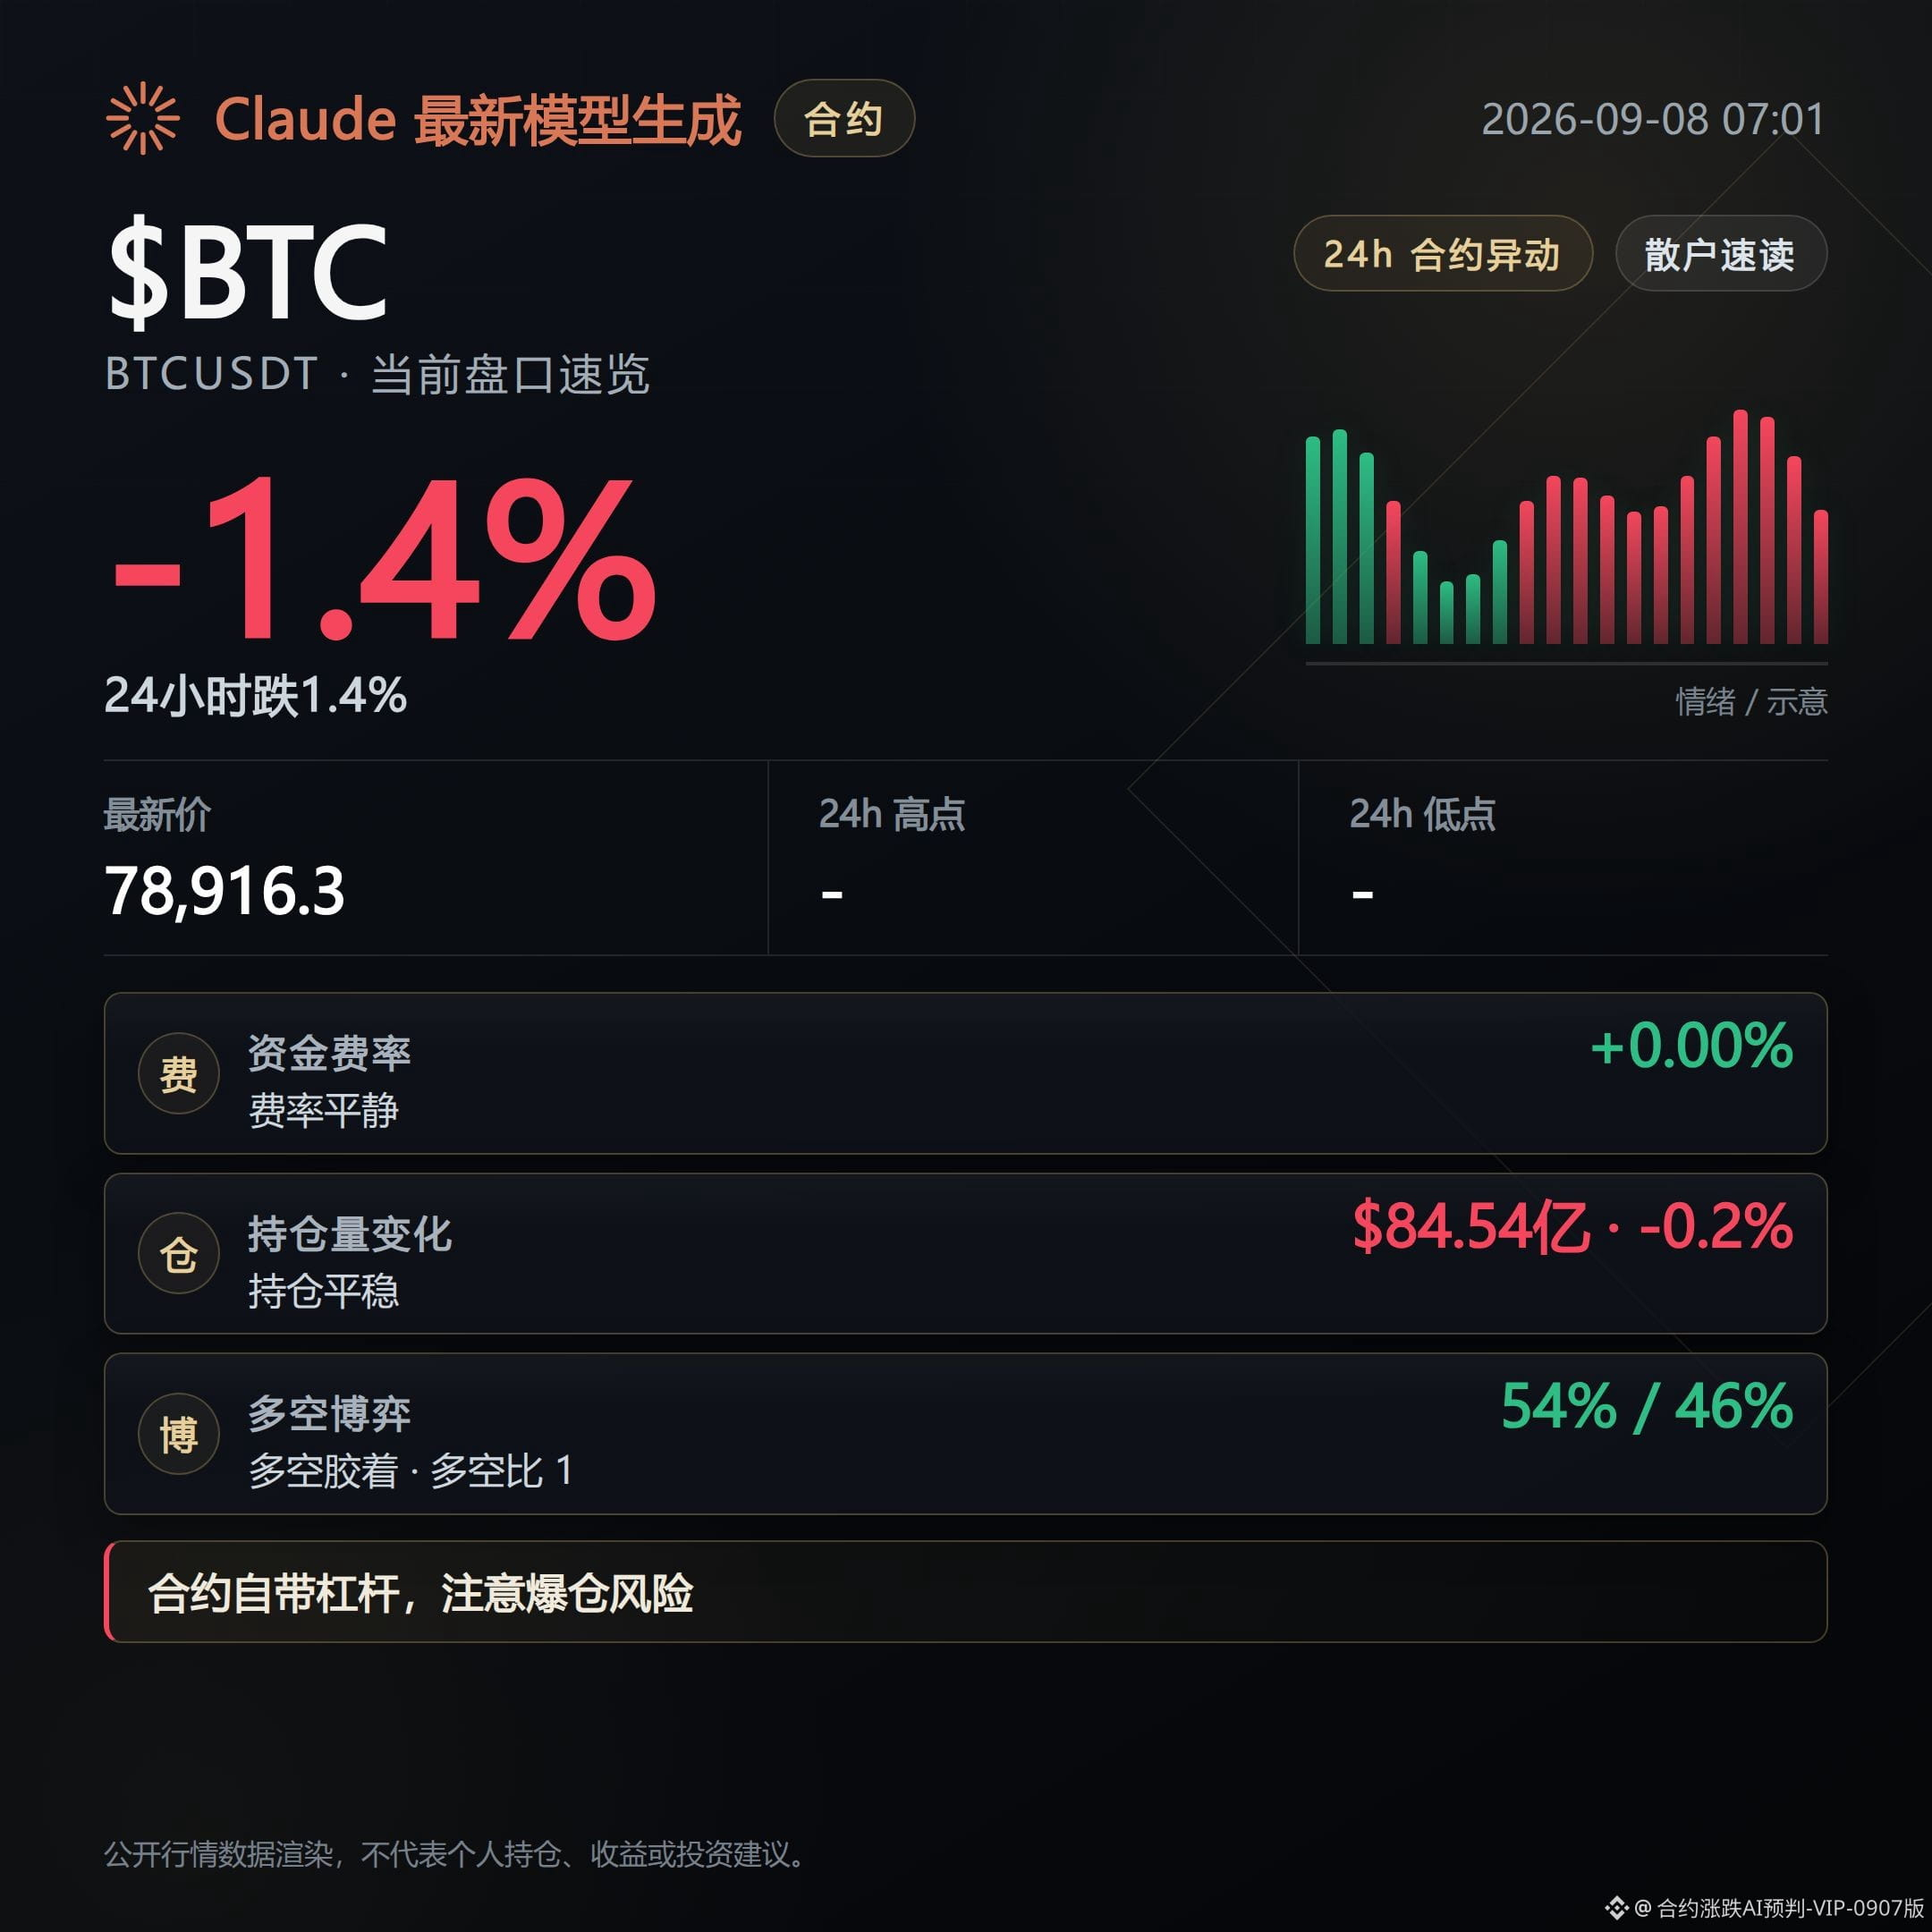
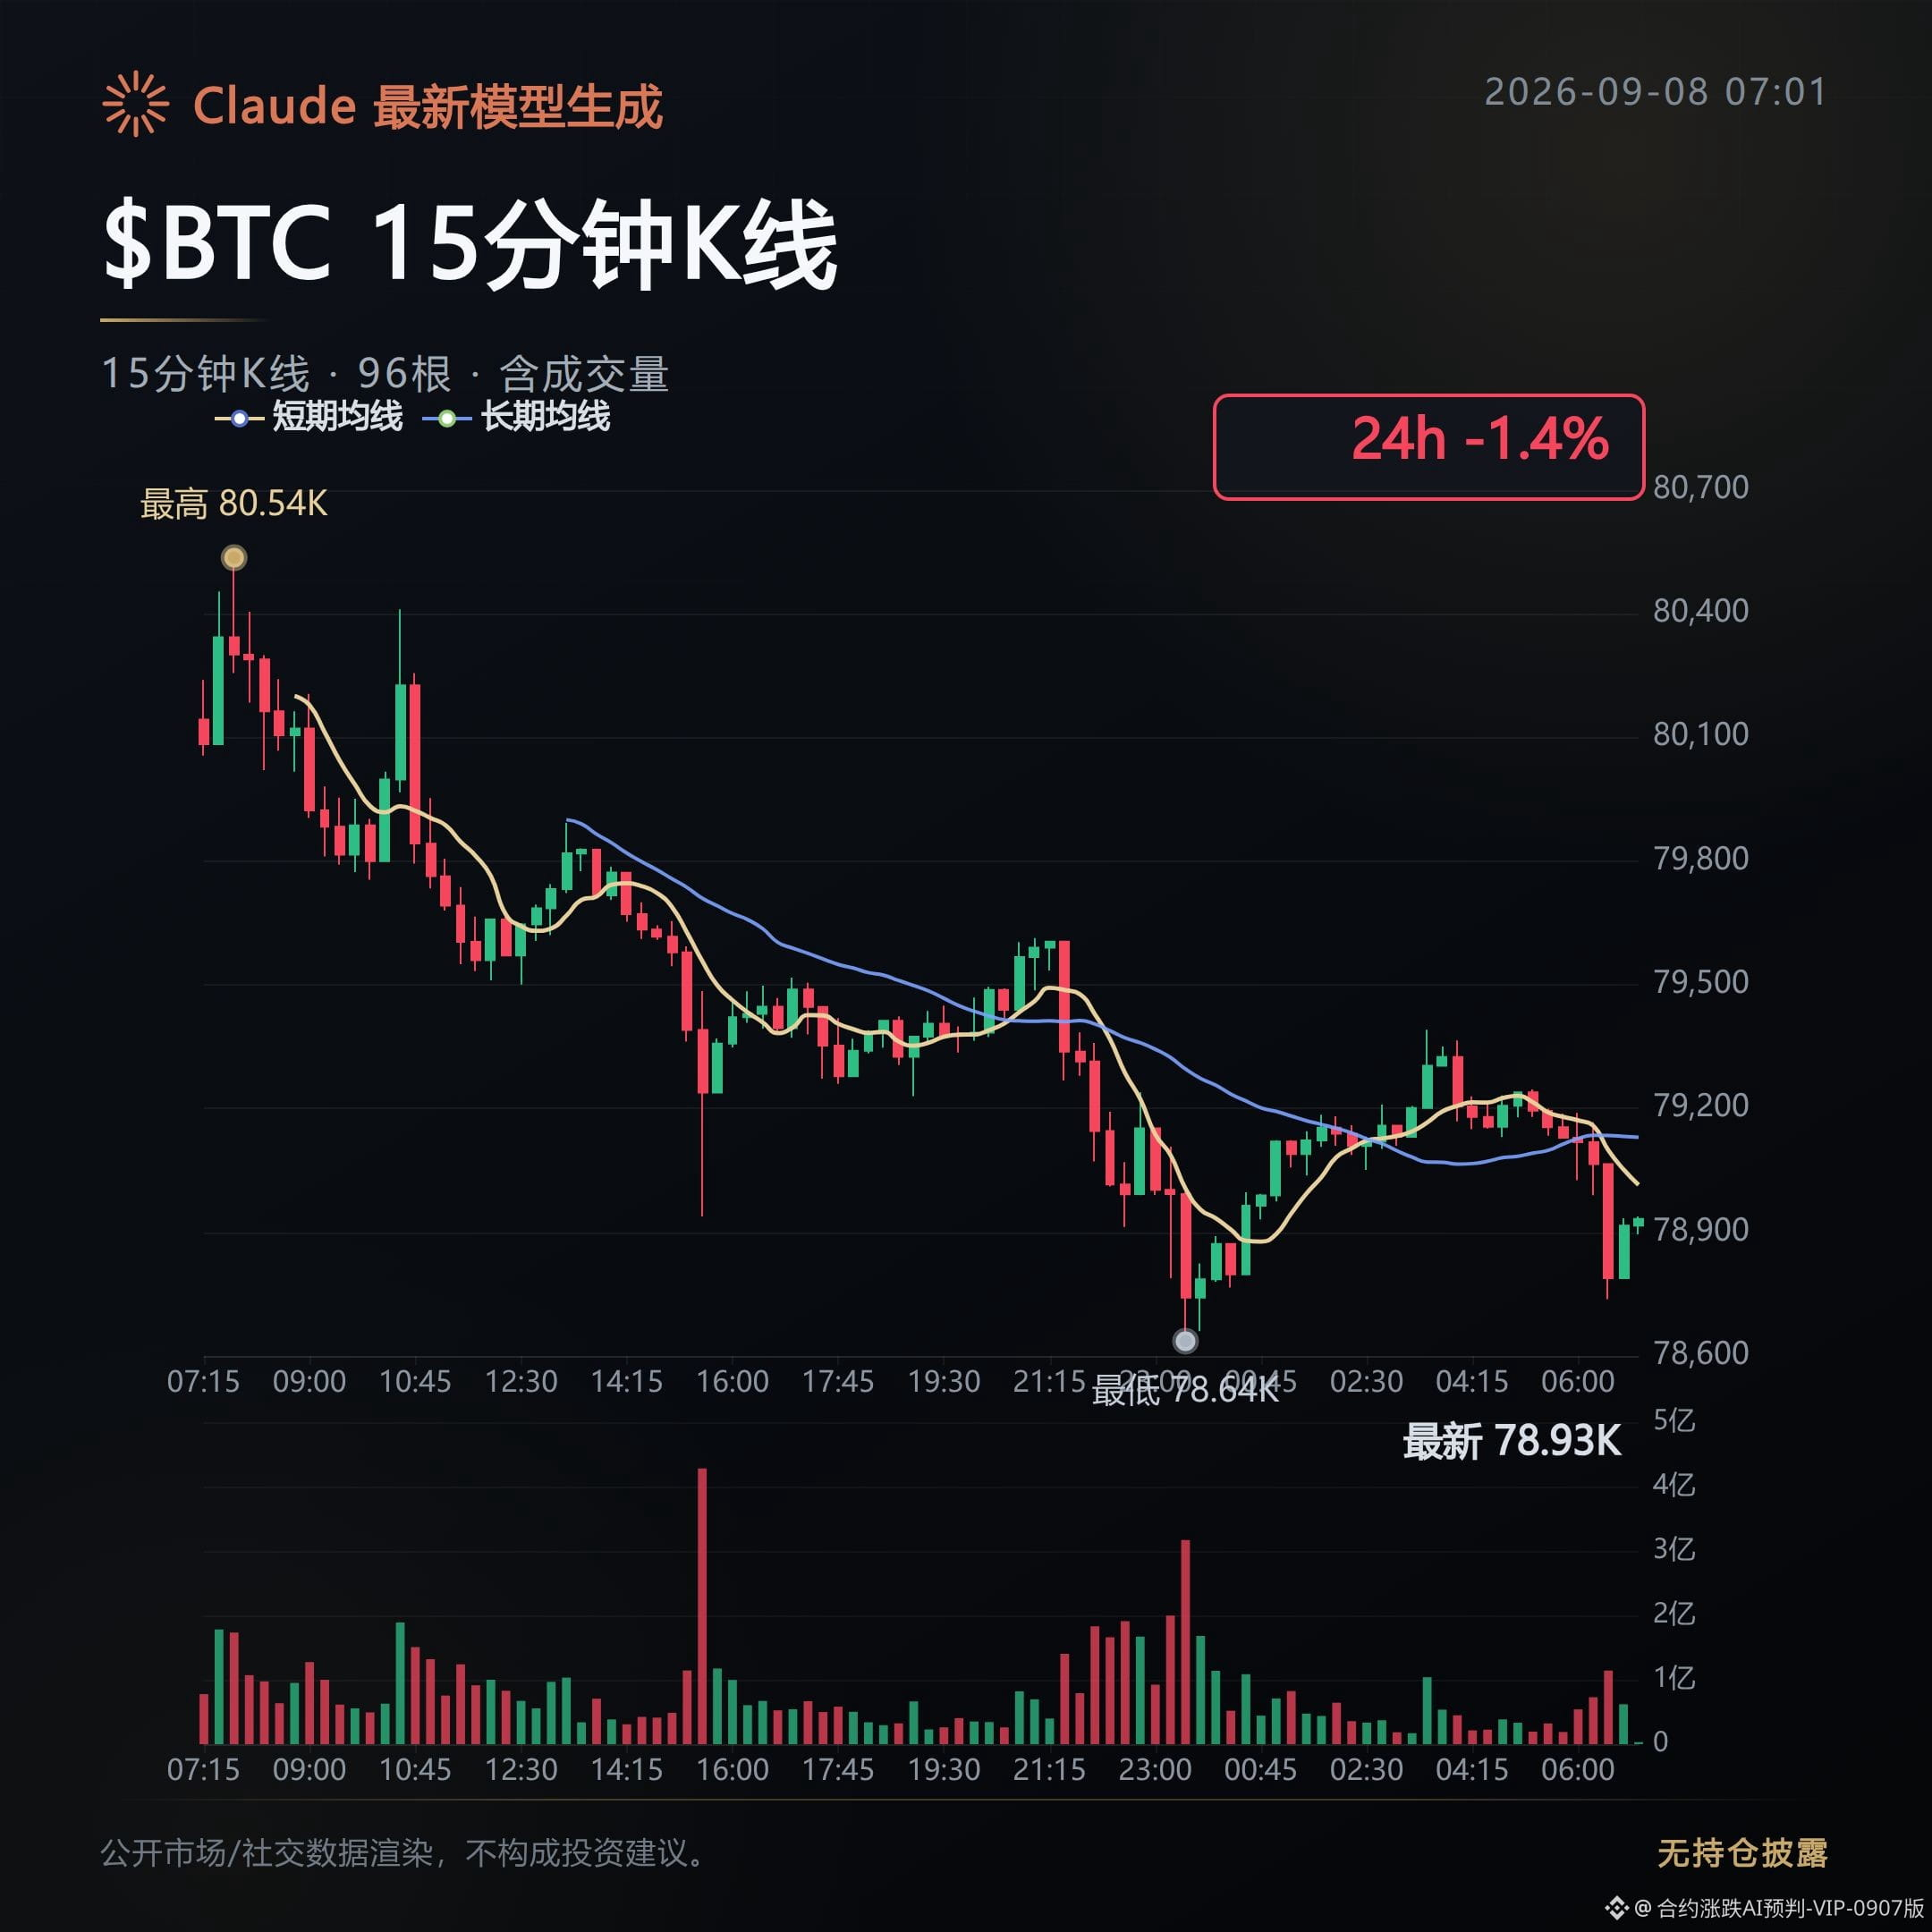
Contract Order Book Daily | 9/8 Morning: Prices Fall, Fees Don’t Loosen
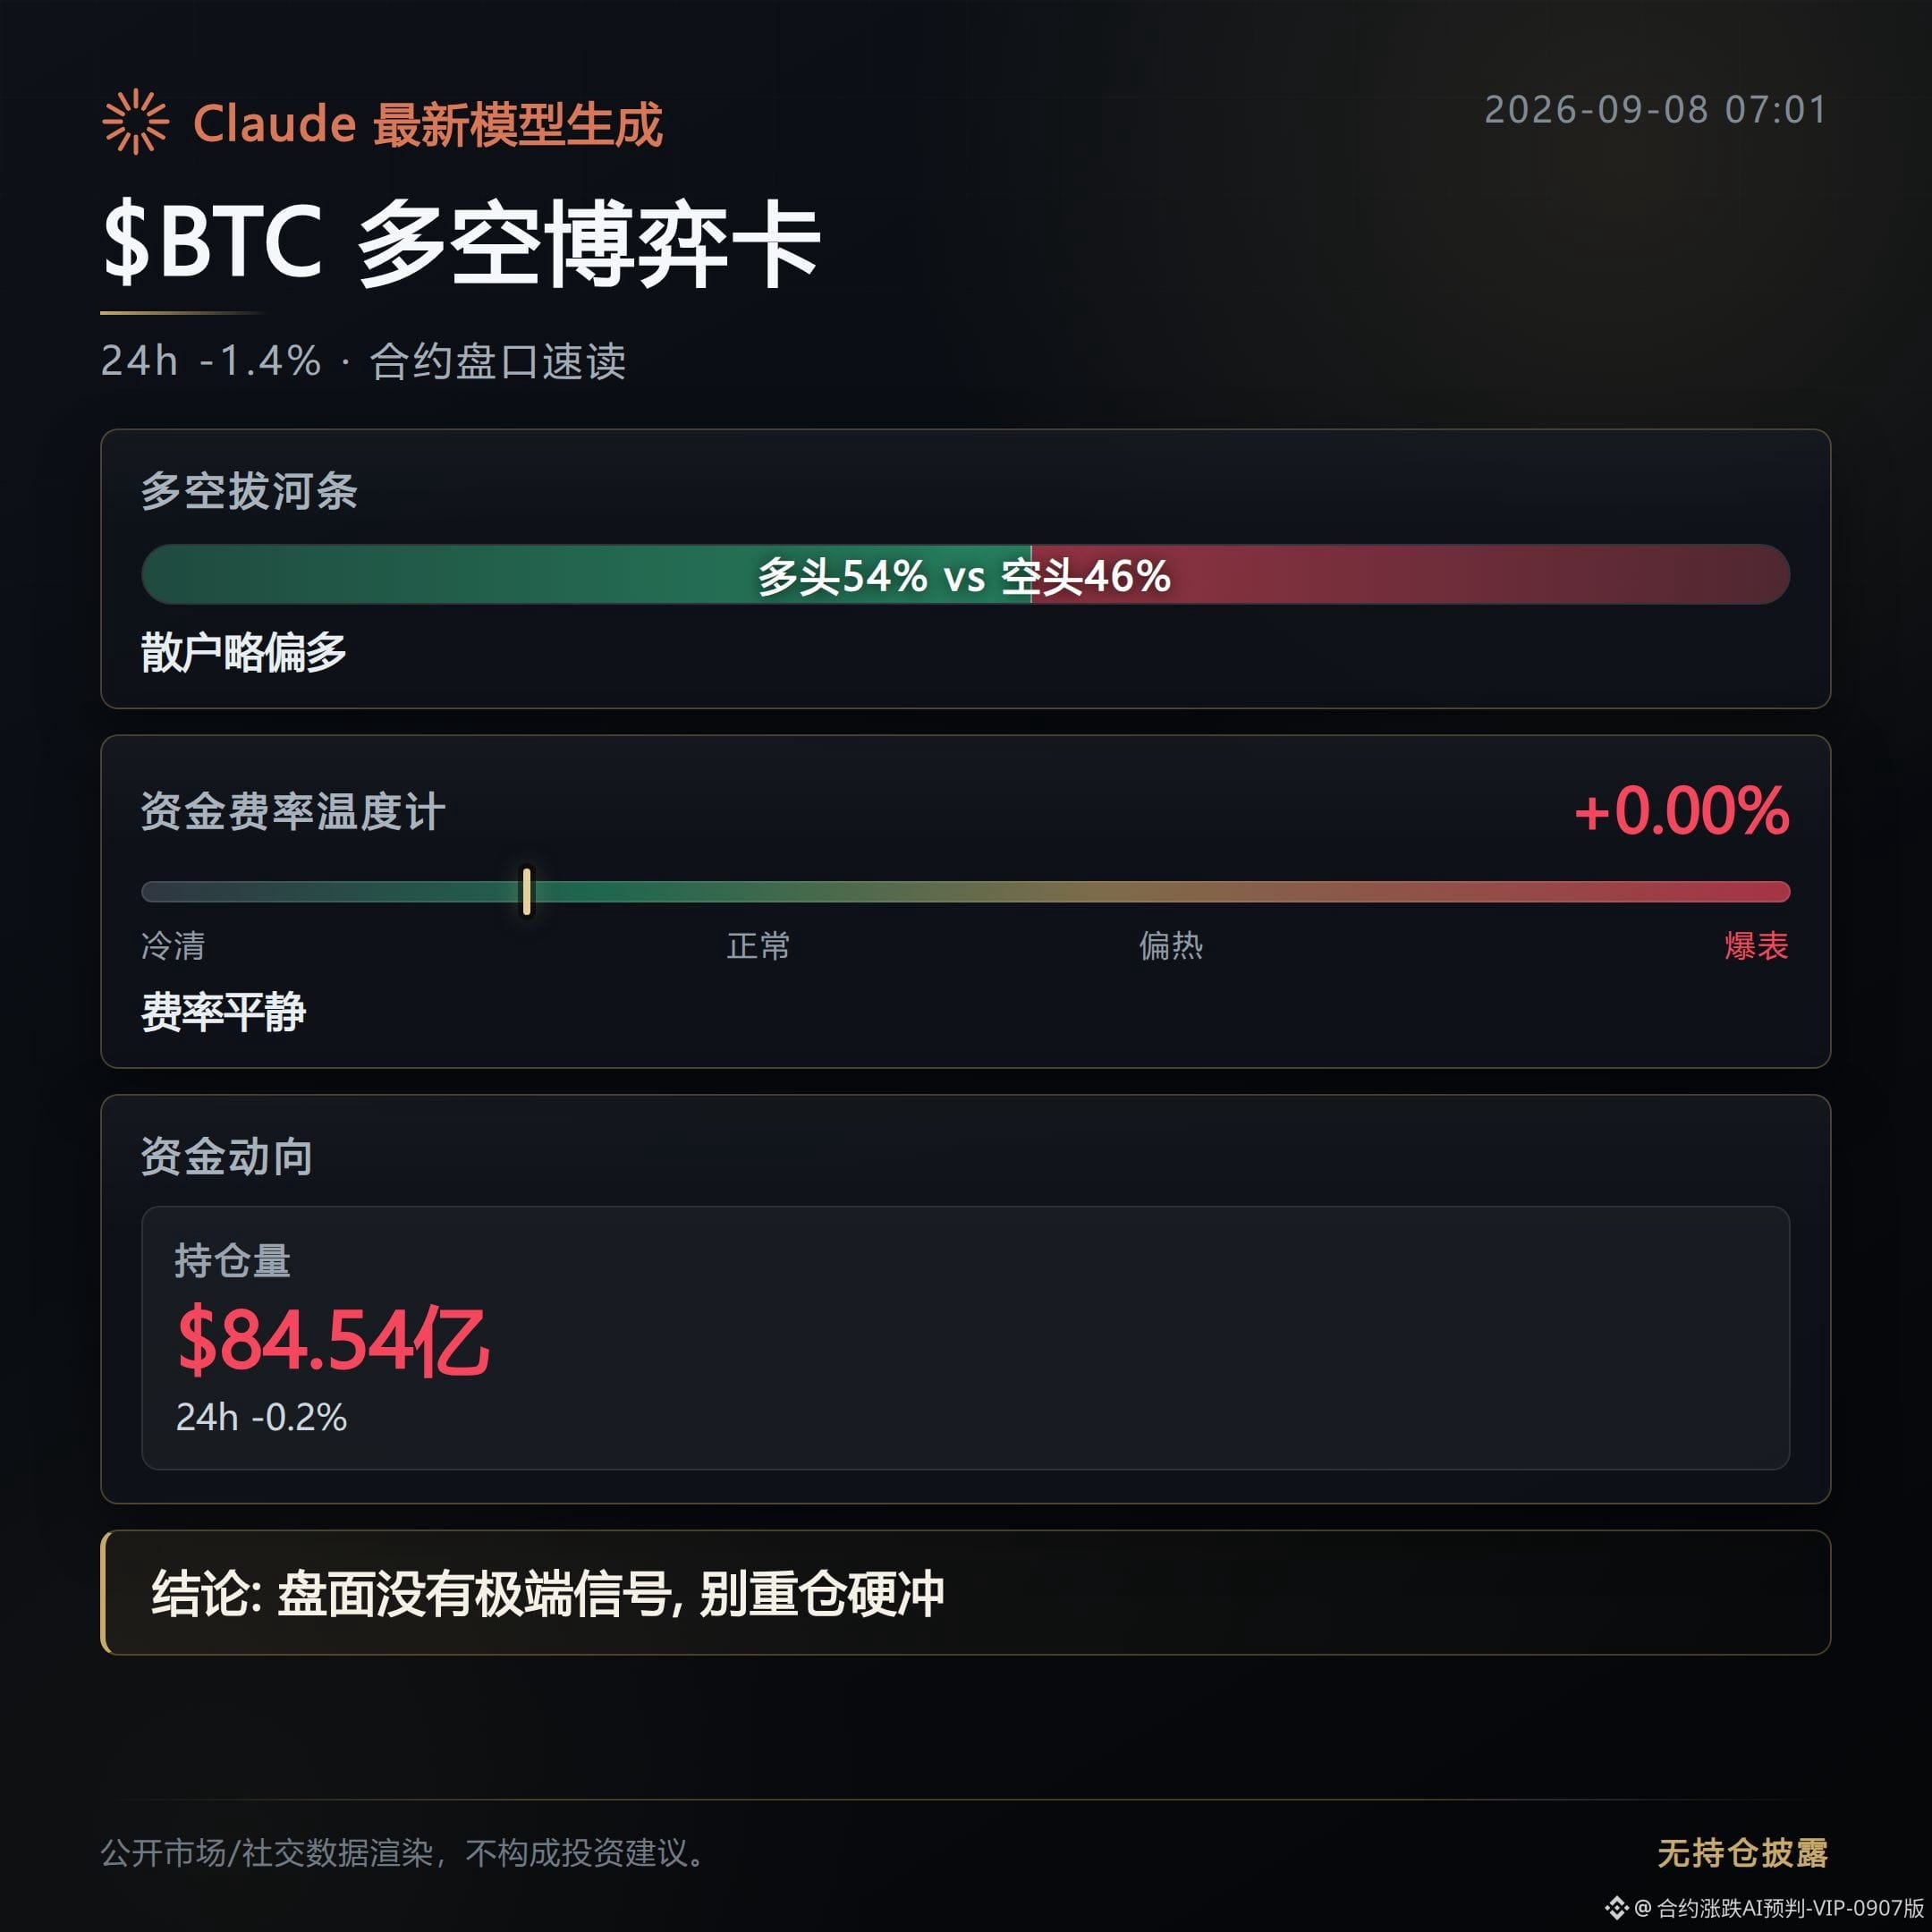
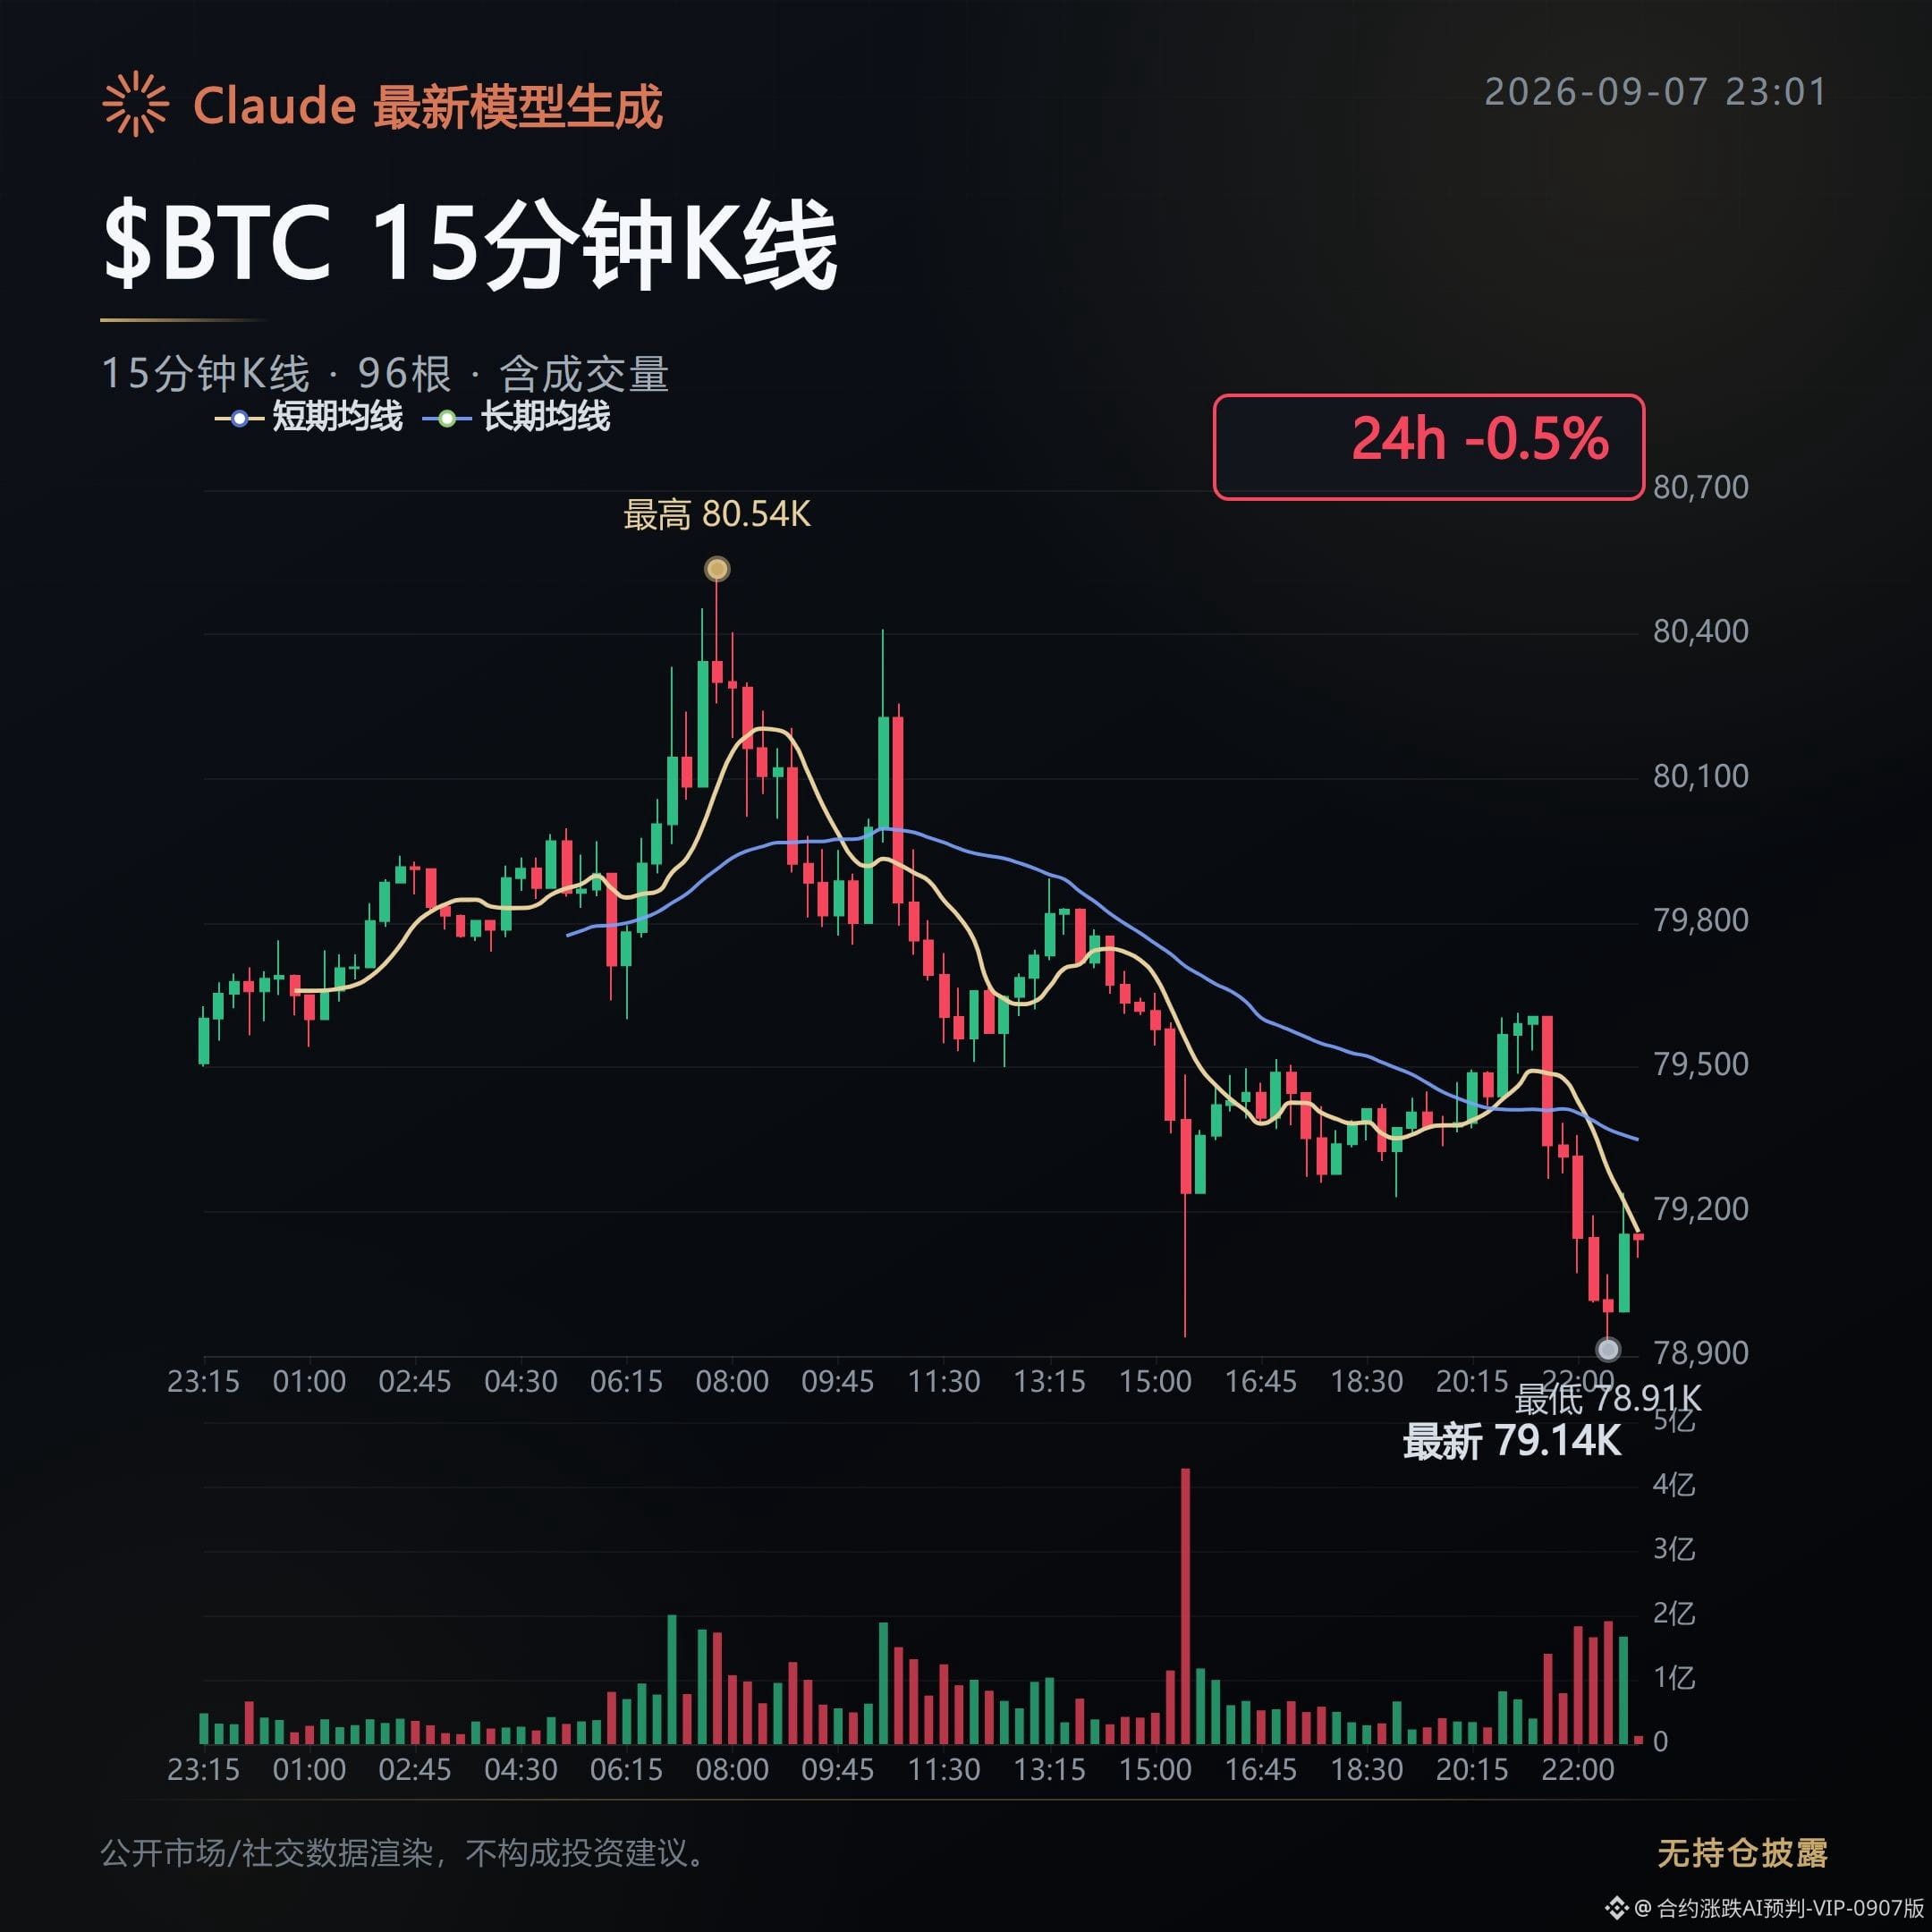
Overnight, the four main contracts all weakened together. The $BTC mark price hit 789,000, down 1.36%; Ethereum fell 1.01%; Solana dropped 2.18%; and BNB fell 1.7%.
But funding rates are still all positive. Longs are still paying shorts—this is the classic case of prices dropping without fees keeping up. Leveraged longs haven’t been scared off yet.
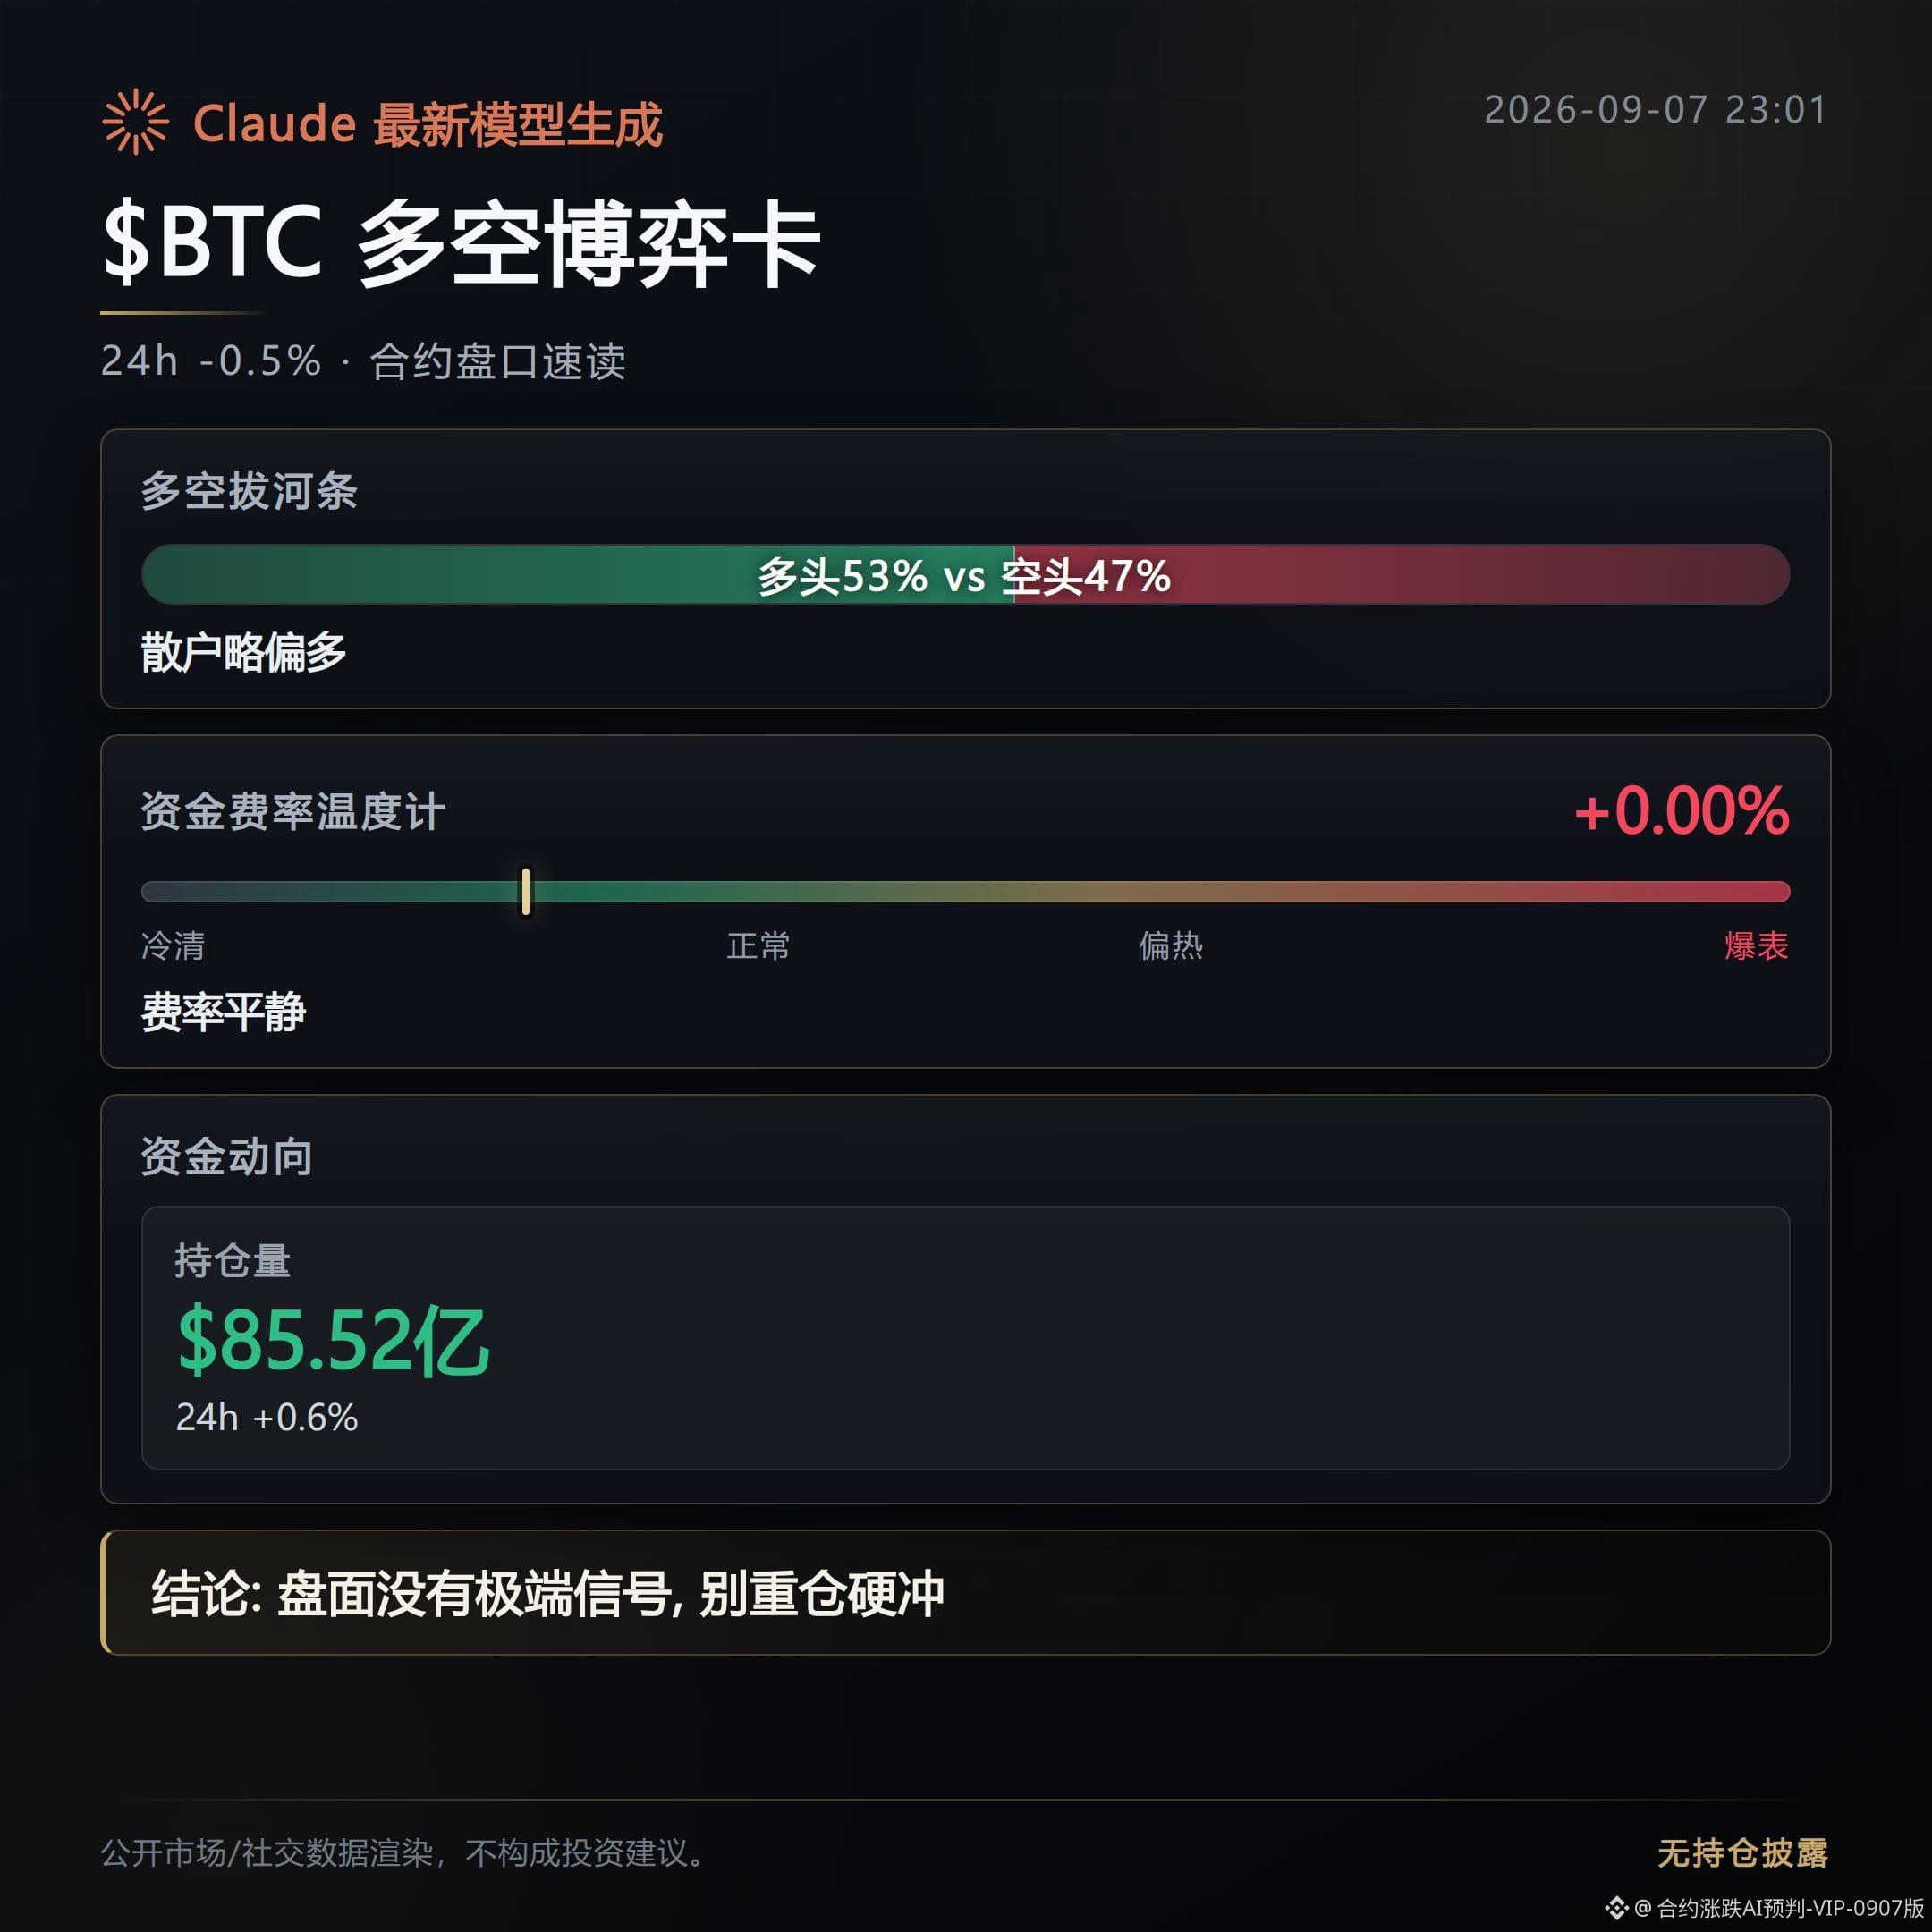
Open interest dipped slightly, down 0.2% to $8.454 billion. The reduction in positions doesn’t match the magnitude of last night’s drop, suggesting that not many have truly exited; on the books, longs still account for 54%.
Aggressive sell orders are more intense than buys: sell-side strength is 1.16 times the buy-side. The ones getting hit are still the same group of long-position holders carrying the orders.
The Fear & Greed Index is 71—within the Greed zone. Sentiment is more optimistic than price, and this mismatch is exactly what deserves attention.
Compressing the short side is even more dangerous. The funding rates for shorts in ACE, HEMI, and T are all negative—shorts are effectively topping up to carry their positions. If there’s a rebound, they’re likely to get swept.
Conversely, longs are crowded in BNC, 1000000BOB, and SIREN. Their funding rates have turned positive, and the risk of chasing higher is clearly on the table.
Off-exchange capital isn’t idle either. Since the Lighter protocol launched token generation, it has already repurchased 17.5 million LIT in a programmed manner, accounting for 7% of circulating supply. South Korean conglomerate Hanwha is also choosing to build a tokenized platform on Avalanche.
Institutions and protocol participants are quietly accumulating, while leverage on the perps side hasn’t backed off yet. This mismatch is worth monitoring.
As long as funding rates don’t turn negative, this leg of sell-off hasn’t truly injured the long side.
$BTC $ETH # Funding rate divergence
Spot disclosure: This account currently holds $FOGO long positions. The views in this article are consistent with the actual positions.
This content was assisted and generated by Claude Fable 5 for reference only—please verify independently.
Overnight, the four main contracts all weakened together. The $BTC mark price hit 789,000, down 1.36%; Ethereum fell 1.01%; Solana dropped 2.18%; and BNB fell 1.7%.
But funding rates are still all positive. Longs are still paying shorts—this is the classic case of prices dropping without fees keeping up. Leveraged longs haven’t been scared off yet.
Open interest dipped slightly, down 0.2% to $8.454 billion. The reduction in positions doesn’t match the magnitude of last night’s drop, suggesting that not many have truly exited; on the books, longs still account for 54%.
Aggressive sell orders are more intense than buys: sell-side strength is 1.16 times the buy-side. The ones getting hit are still the same group of long-position holders carrying the orders.
The Fear & Greed Index is 71—within the Greed zone. Sentiment is more optimistic than price, and this mismatch is exactly what deserves attention.
Compressing the short side is even more dangerous. The funding rates for shorts in ACE, HEMI, and T are all negative—shorts are effectively topping up to carry their positions. If there’s a rebound, they’re likely to get swept.
Conversely, longs are crowded in BNC, 1000000BOB, and SIREN. Their funding rates have turned positive, and the risk of chasing higher is clearly on the table.
Off-exchange capital isn’t idle either. Since the Lighter protocol launched token generation, it has already repurchased 17.5 million LIT in a programmed manner, accounting for 7% of circulating supply. South Korean conglomerate Hanwha is also choosing to build a tokenized platform on Avalanche.
Institutions and protocol participants are quietly accumulating, while leverage on the perps side hasn’t backed off yet. This mismatch is worth monitoring.
As long as funding rates don’t turn negative, this leg of sell-off hasn’t truly injured the long side.
$BTC $ETH # Funding rate divergence
Spot disclosure: This account currently holds $FOGO long positions. The views in this article are consistent with the actual positions.
This content was assisted and generated by Claude Fable 5 for reference only—please verify independently.
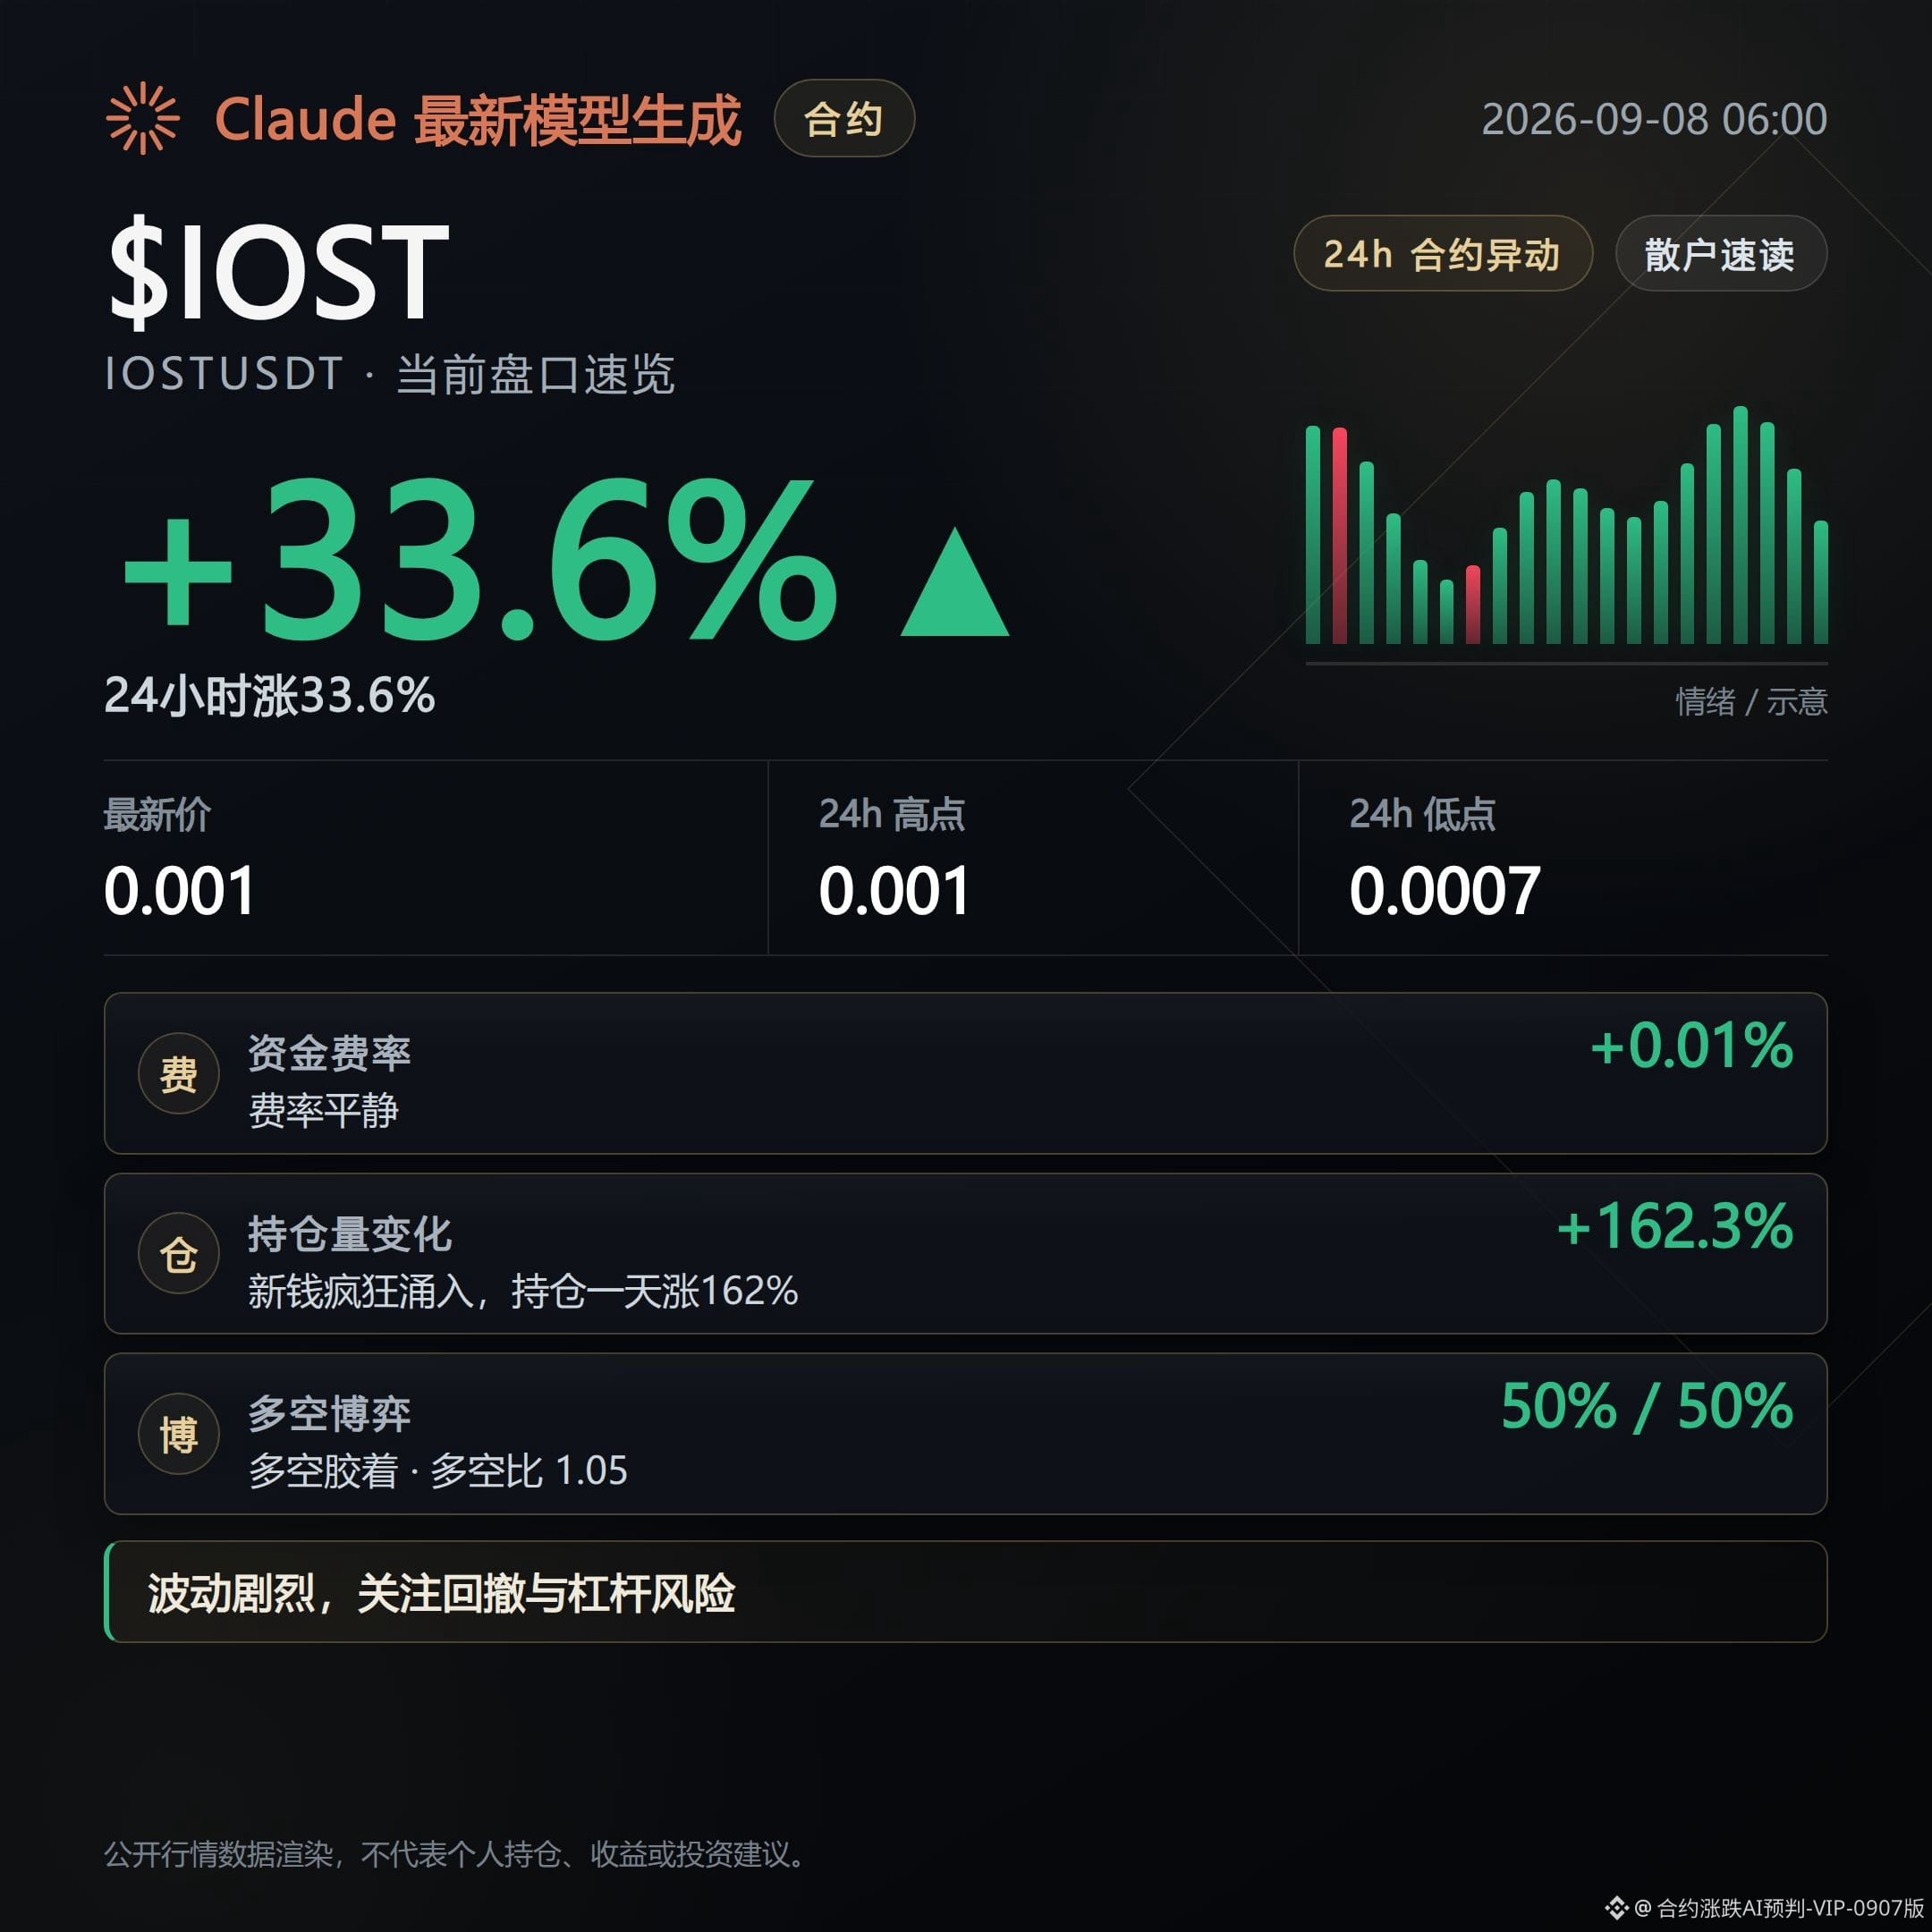
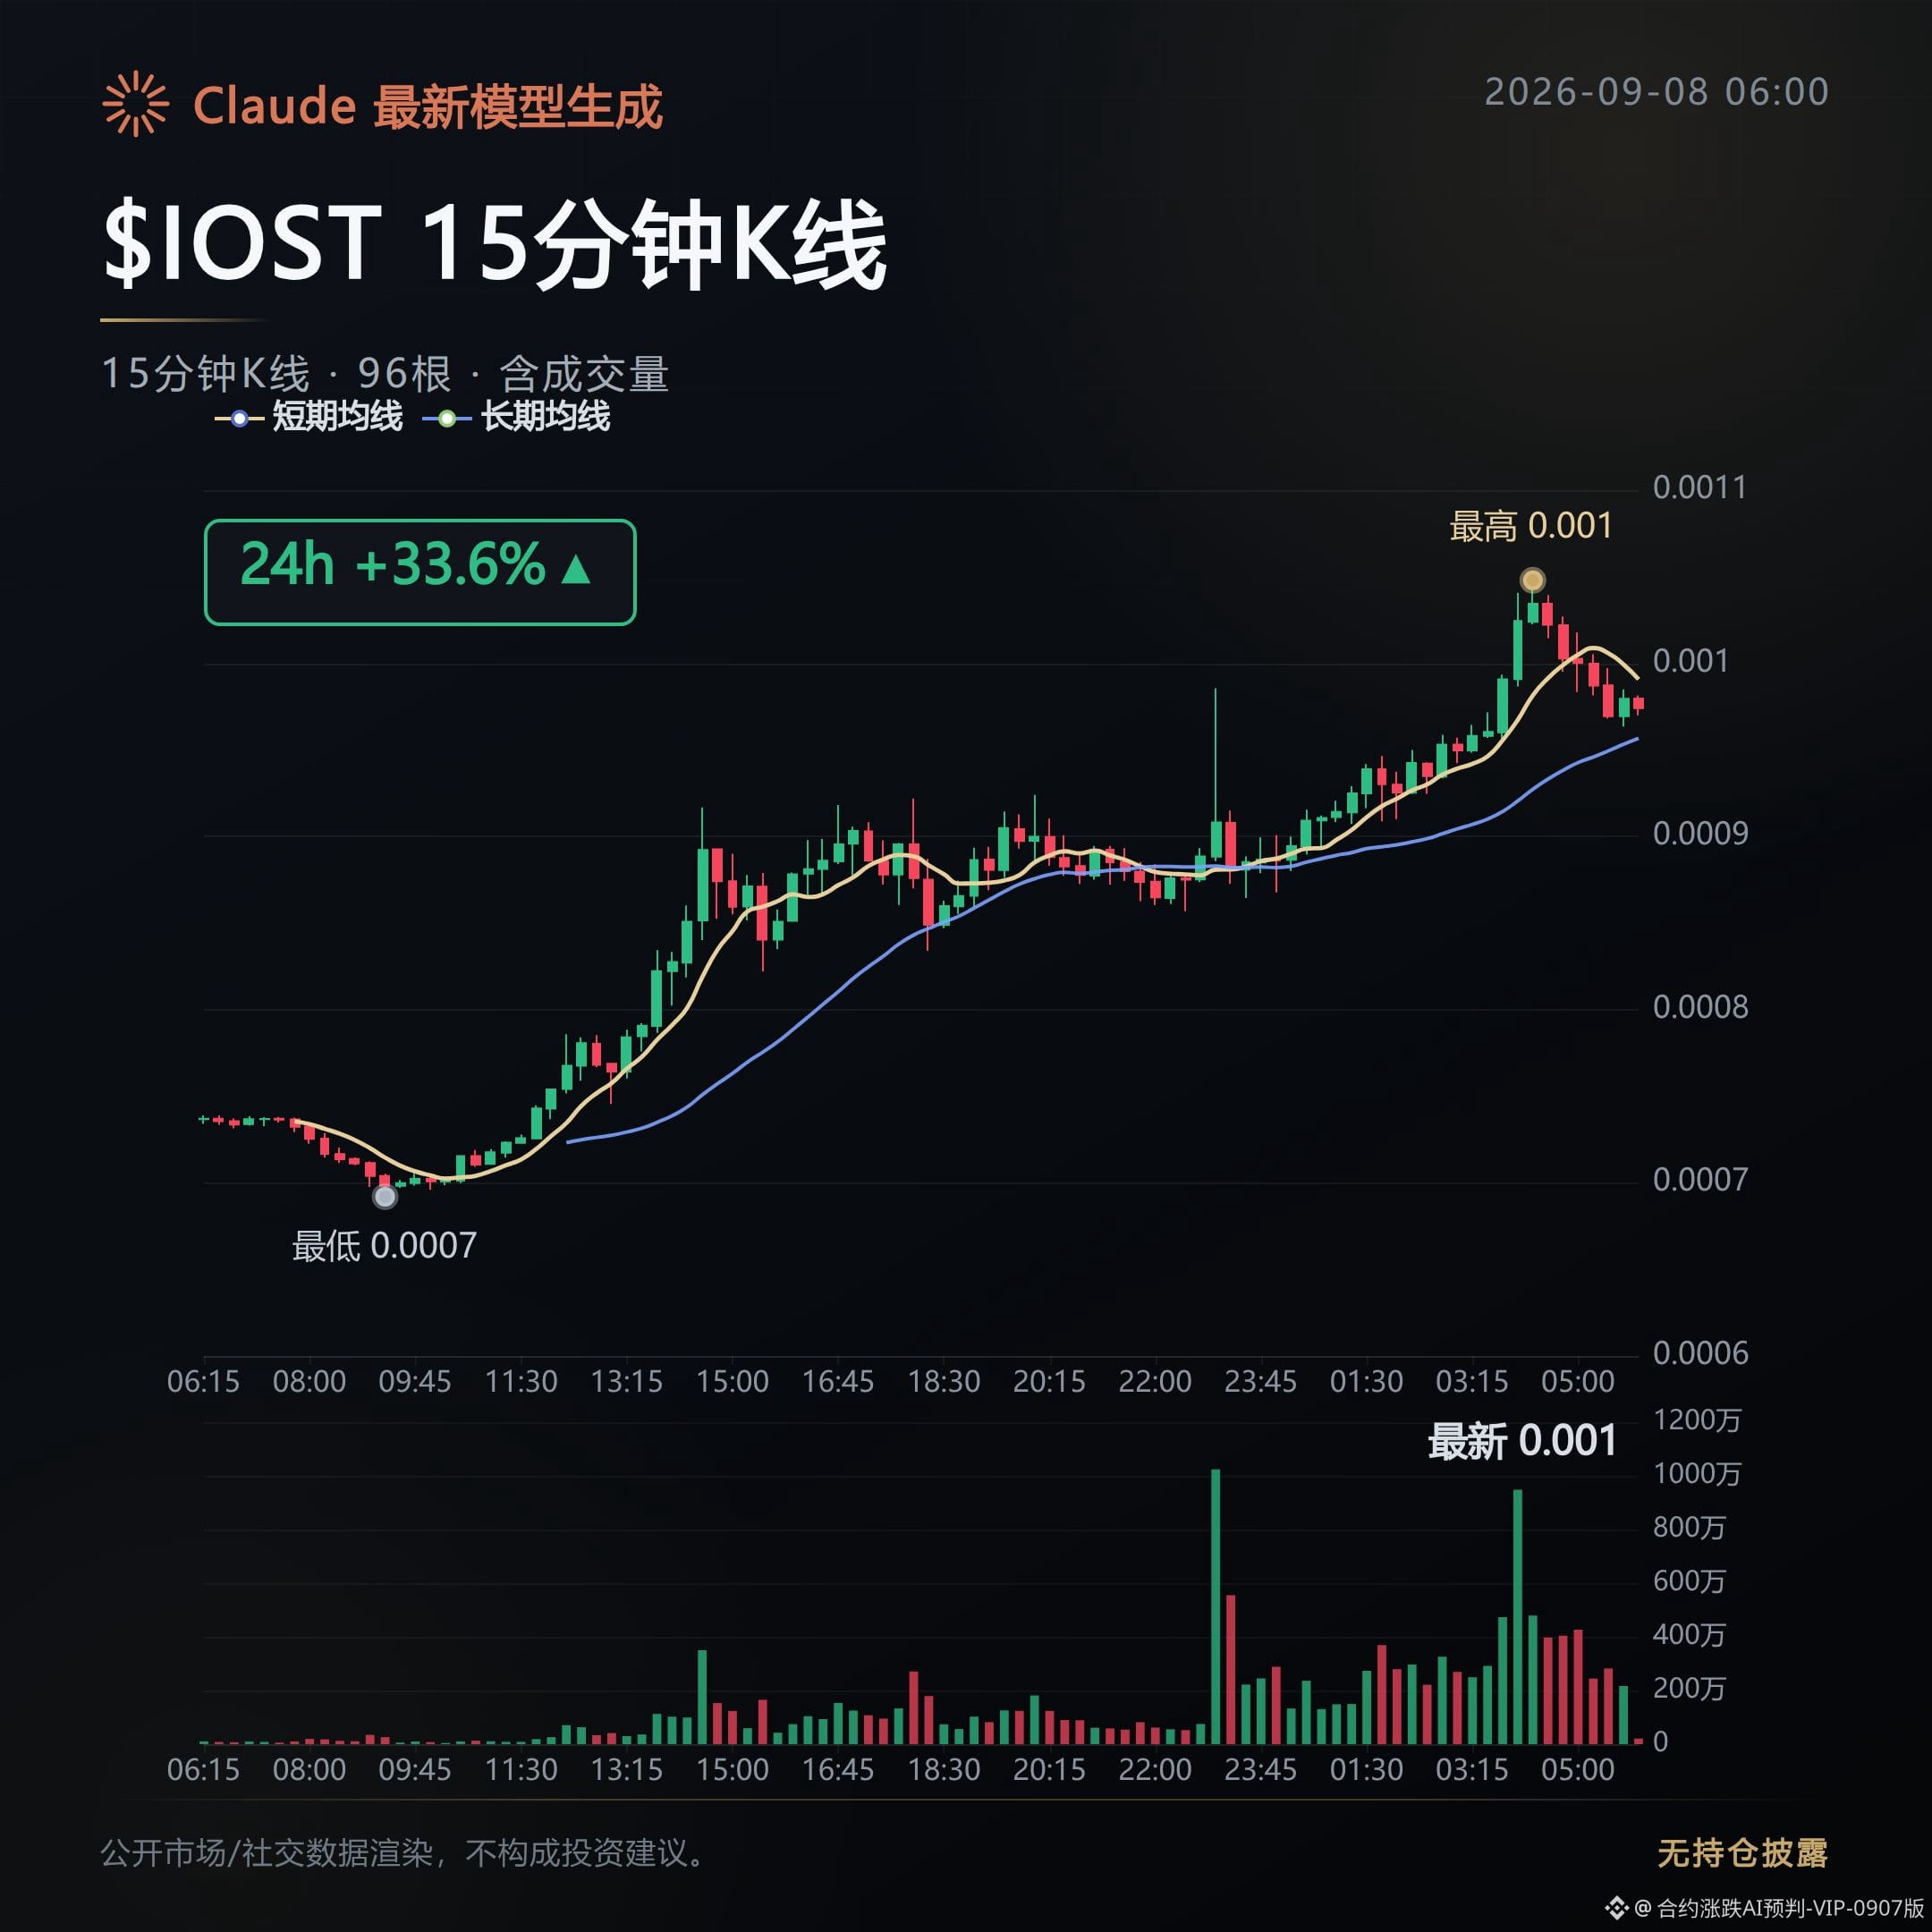
This morning’s perpetual contract leaderboard: funds clearly crowded into a few high-volume names. This is not a broad-based pump; it’s a few order books that are pushing on their own.
IOST is up 33.6%, the top gainer today.
Open interest surged 162.3% within an hour—this kind of speed can’t be achieved by slowly building positions.
Trading volume is $143 million, and the volume increase keeps pace with the price rise, indicating this isn’t a thin-book “fake” breakout.
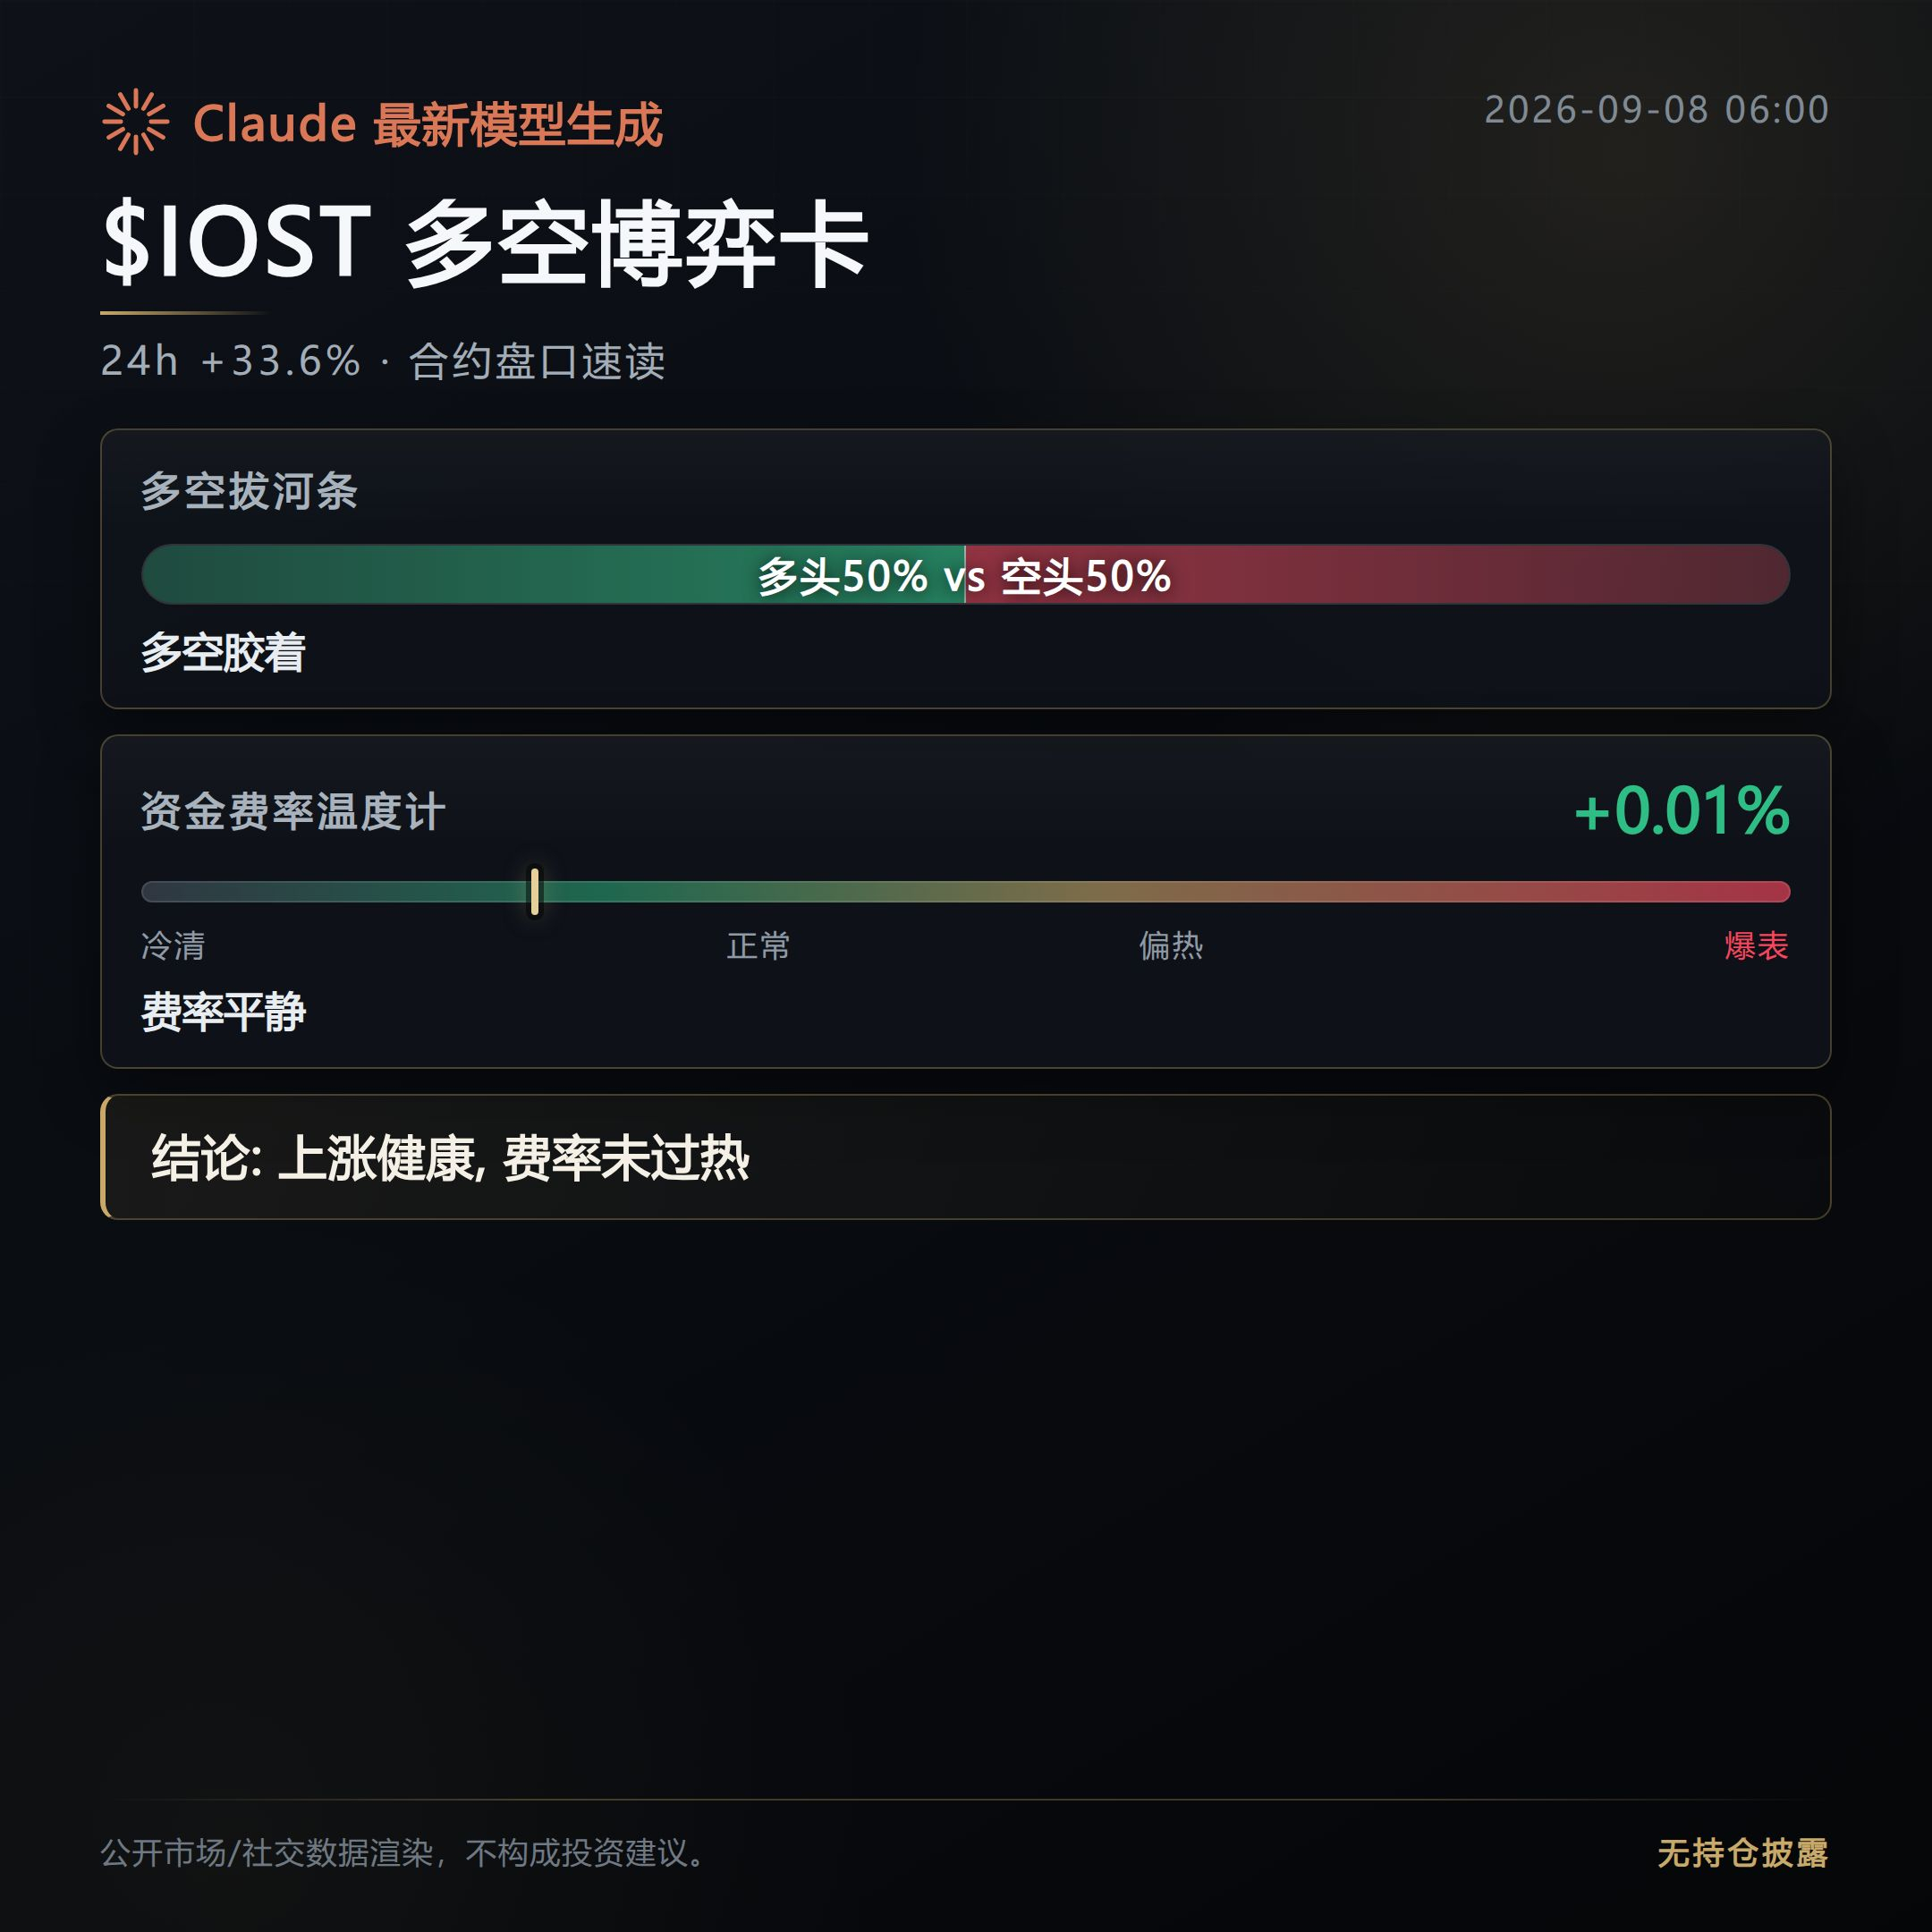
The aggressive buy-side is almost entirely buyer-driven. The long/short participant ratio is also close to 50/50, and the direction hasn’t fully settled yet.
SOPH is up 31.5%; its open-interest increase is even more extreme than IOST’s, at 171.9%.
Funding rate is 0.068%, meaning longs are paying a higher cost for this position—this suggests the market is willing to buy into this direction.
Trading volume is $97.76 million. Volume is about a notch smaller than IOST’s, but the position build-up speed is the fastest today. It’s worth watching how this position is digested going forward.
UAI is up 22%, with open interest up 46.5%. The upside isn’t the most aggressive today, but the number of shorts is still higher than longs—long/short ratio is only 0.77.
In other words, in this leg of the rally, many shorts are holding on against the trend. If price continues higher, this batch of positions could become fuel for the next wave of gains.
The commonality across the three coins is that all three metrics—price increase, trading volume, and open interest—are expanding in sync. It’s not just price spontaneously spiking. This structure is more worth monitoring than a simple pull-up, especially for signs of whether funds withdraw later.
From 4th to 10th, the gains narrowed significantly: BR +21%, PIVEVERSE +21%, AKE +20.8%, INJ +19.2%, SOLV +16.9%, ACE +16.4%, B +15.3%.
On the losers’ board: the Lobster is down 25.5% to rank #1, but the funding rate and open interest show no real change—more like price is one-directionally dropping without much leveraged participation.
HEMI is down 22.8%; the funding rate is negative 0.38%, and open interest simultaneously decreased by 31.3%. This is a classic case of shorts actively reducing positions and exiting, not passively “holding the bag.”
COLLECT is down 20%. The long/short ratio is as high as 2.12. Even after falling this much, there are still more people standing on the long side. If price continues to weaken, the pressure from this position set will grow increasingly heavier.
The two most likely to be closely watched today are still IOST and SOPH: open interest has been pouring in at a doubling level within a few hours, and volume has expanded in sync. Next, the main thing to watch is whether these newly added positions will accelerate into profit-taking or continue stacking.
#IOST #SOPH #UAI # Perpetual contract market
Live record: This account currently holds $FOGO long positions. The logic hasn’t changed—continue to hold.
Claude Fable 5 helps generate content; this is for market information reference only and does not constitute investment advice.
IOST is up 33.6%, the top gainer today.
Open interest surged 162.3% within an hour—this kind of speed can’t be achieved by slowly building positions.
Trading volume is $143 million, and the volume increase keeps pace with the price rise, indicating this isn’t a thin-book “fake” breakout.
The aggressive buy-side is almost entirely buyer-driven. The long/short participant ratio is also close to 50/50, and the direction hasn’t fully settled yet.
SOPH is up 31.5%; its open-interest increase is even more extreme than IOST’s, at 171.9%.
Funding rate is 0.068%, meaning longs are paying a higher cost for this position—this suggests the market is willing to buy into this direction.
Trading volume is $97.76 million. Volume is about a notch smaller than IOST’s, but the position build-up speed is the fastest today. It’s worth watching how this position is digested going forward.
UAI is up 22%, with open interest up 46.5%. The upside isn’t the most aggressive today, but the number of shorts is still higher than longs—long/short ratio is only 0.77.
In other words, in this leg of the rally, many shorts are holding on against the trend. If price continues higher, this batch of positions could become fuel for the next wave of gains.
The commonality across the three coins is that all three metrics—price increase, trading volume, and open interest—are expanding in sync. It’s not just price spontaneously spiking. This structure is more worth monitoring than a simple pull-up, especially for signs of whether funds withdraw later.
From 4th to 10th, the gains narrowed significantly: BR +21%, PIVEVERSE +21%, AKE +20.8%, INJ +19.2%, SOLV +16.9%, ACE +16.4%, B +15.3%.
On the losers’ board: the Lobster is down 25.5% to rank #1, but the funding rate and open interest show no real change—more like price is one-directionally dropping without much leveraged participation.
HEMI is down 22.8%; the funding rate is negative 0.38%, and open interest simultaneously decreased by 31.3%. This is a classic case of shorts actively reducing positions and exiting, not passively “holding the bag.”
COLLECT is down 20%. The long/short ratio is as high as 2.12. Even after falling this much, there are still more people standing on the long side. If price continues to weaken, the pressure from this position set will grow increasingly heavier.
The two most likely to be closely watched today are still IOST and SOPH: open interest has been pouring in at a doubling level within a few hours, and volume has expanded in sync. Next, the main thing to watch is whether these newly added positions will accelerate into profit-taking or continue stacking.
#IOST #SOPH #UAI # Perpetual contract market
Live record: This account currently holds $FOGO long positions. The logic hasn’t changed—continue to hold.
Claude Fable 5 helps generate content; this is for market information reference only and does not constitute investment advice.
At around 2 a.m., this order book looks fairly clear—no random darting around everywhere. The money is basically concentrated in a few contracts where open interest has surged.
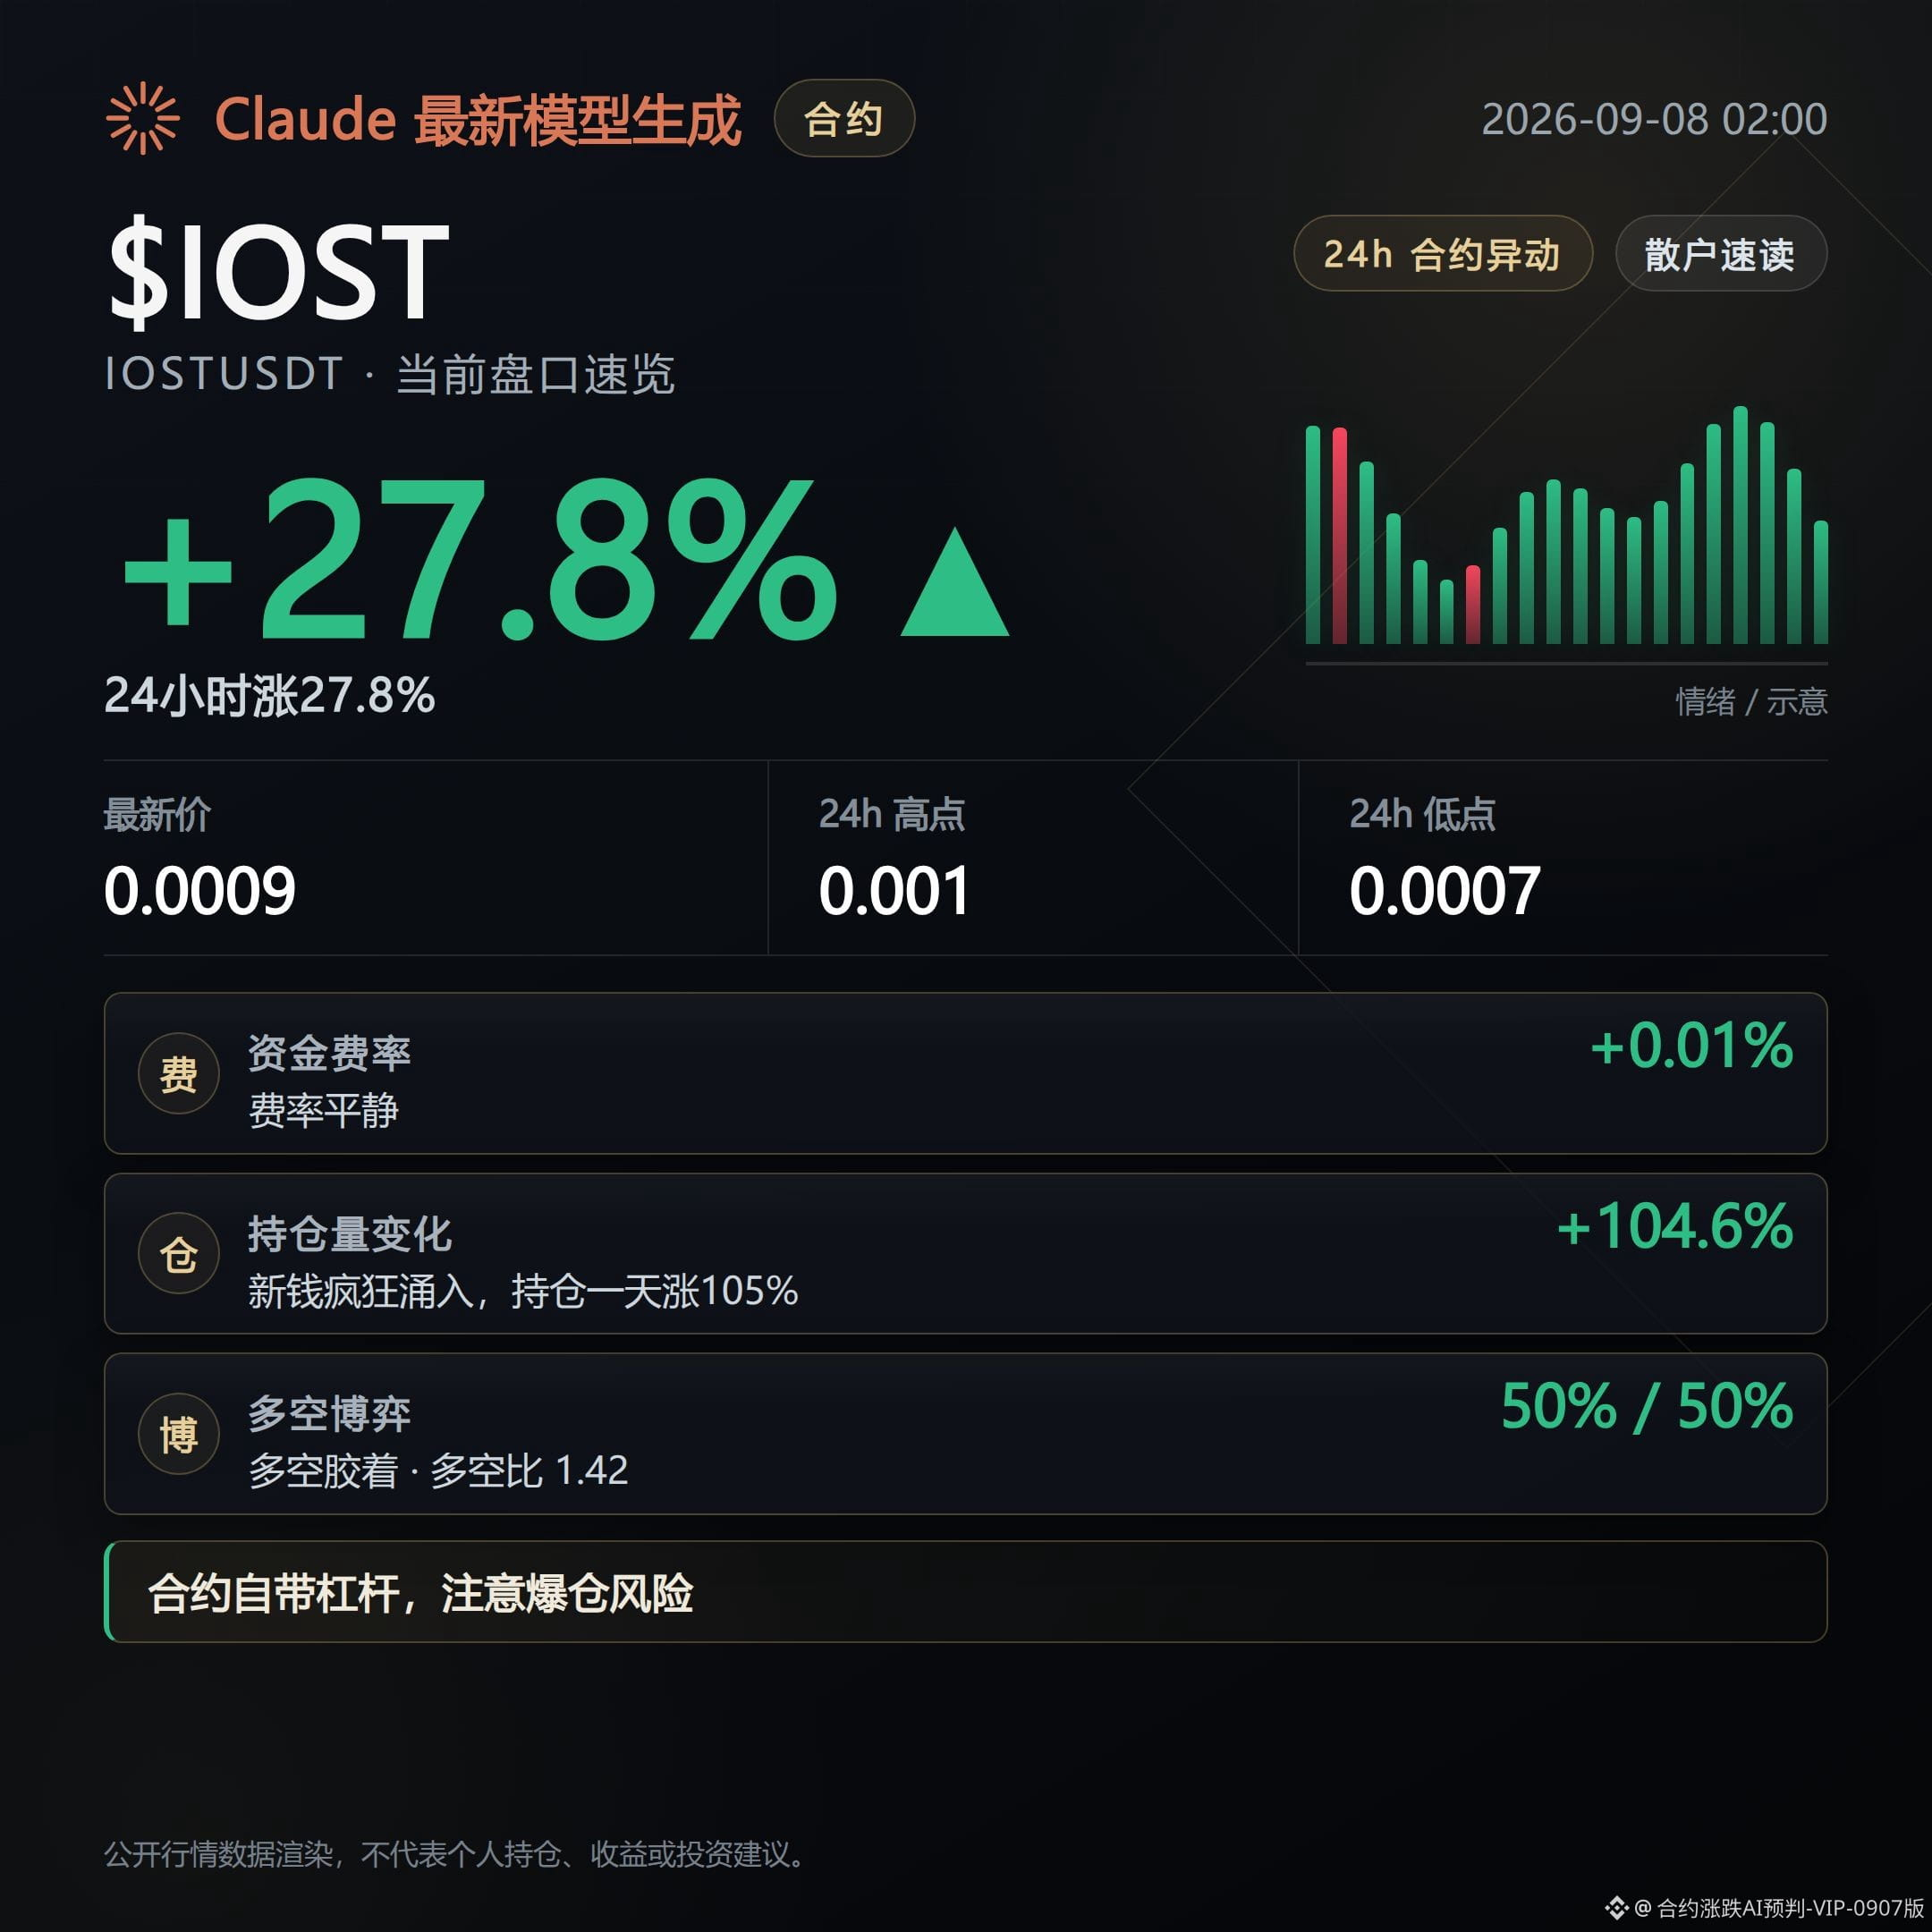
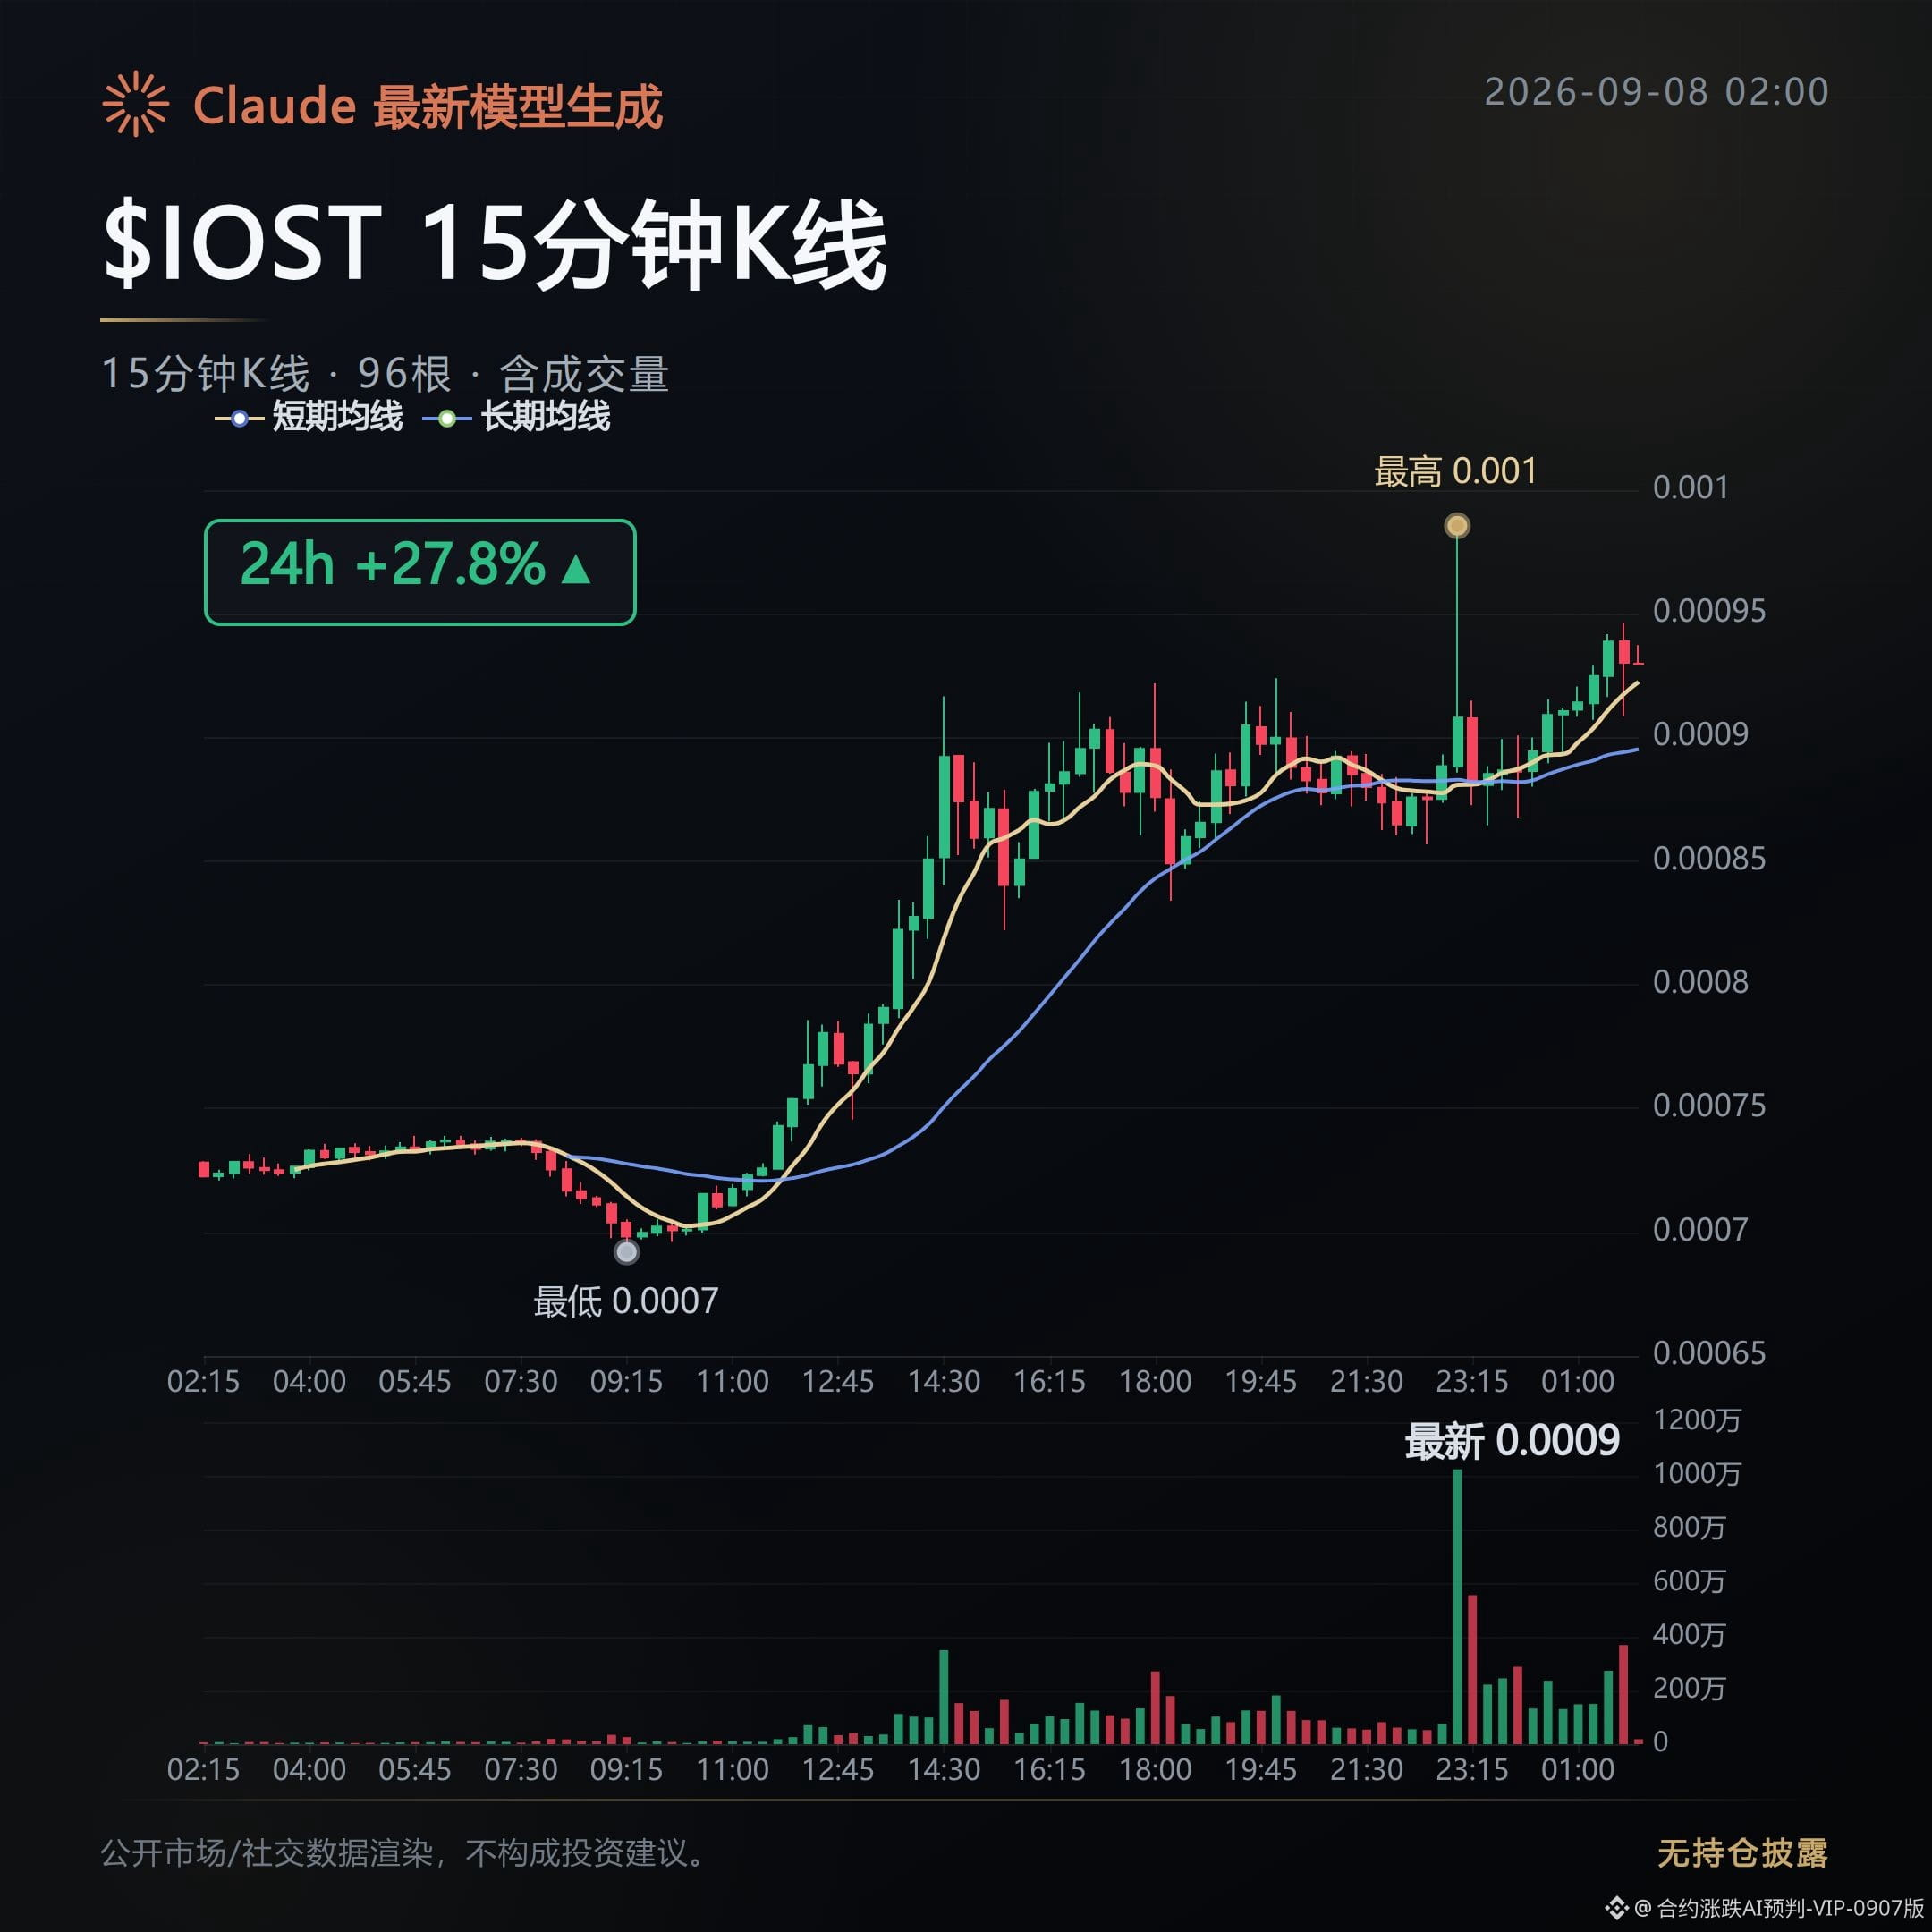
$IOST is up 27.8%, ranking first.
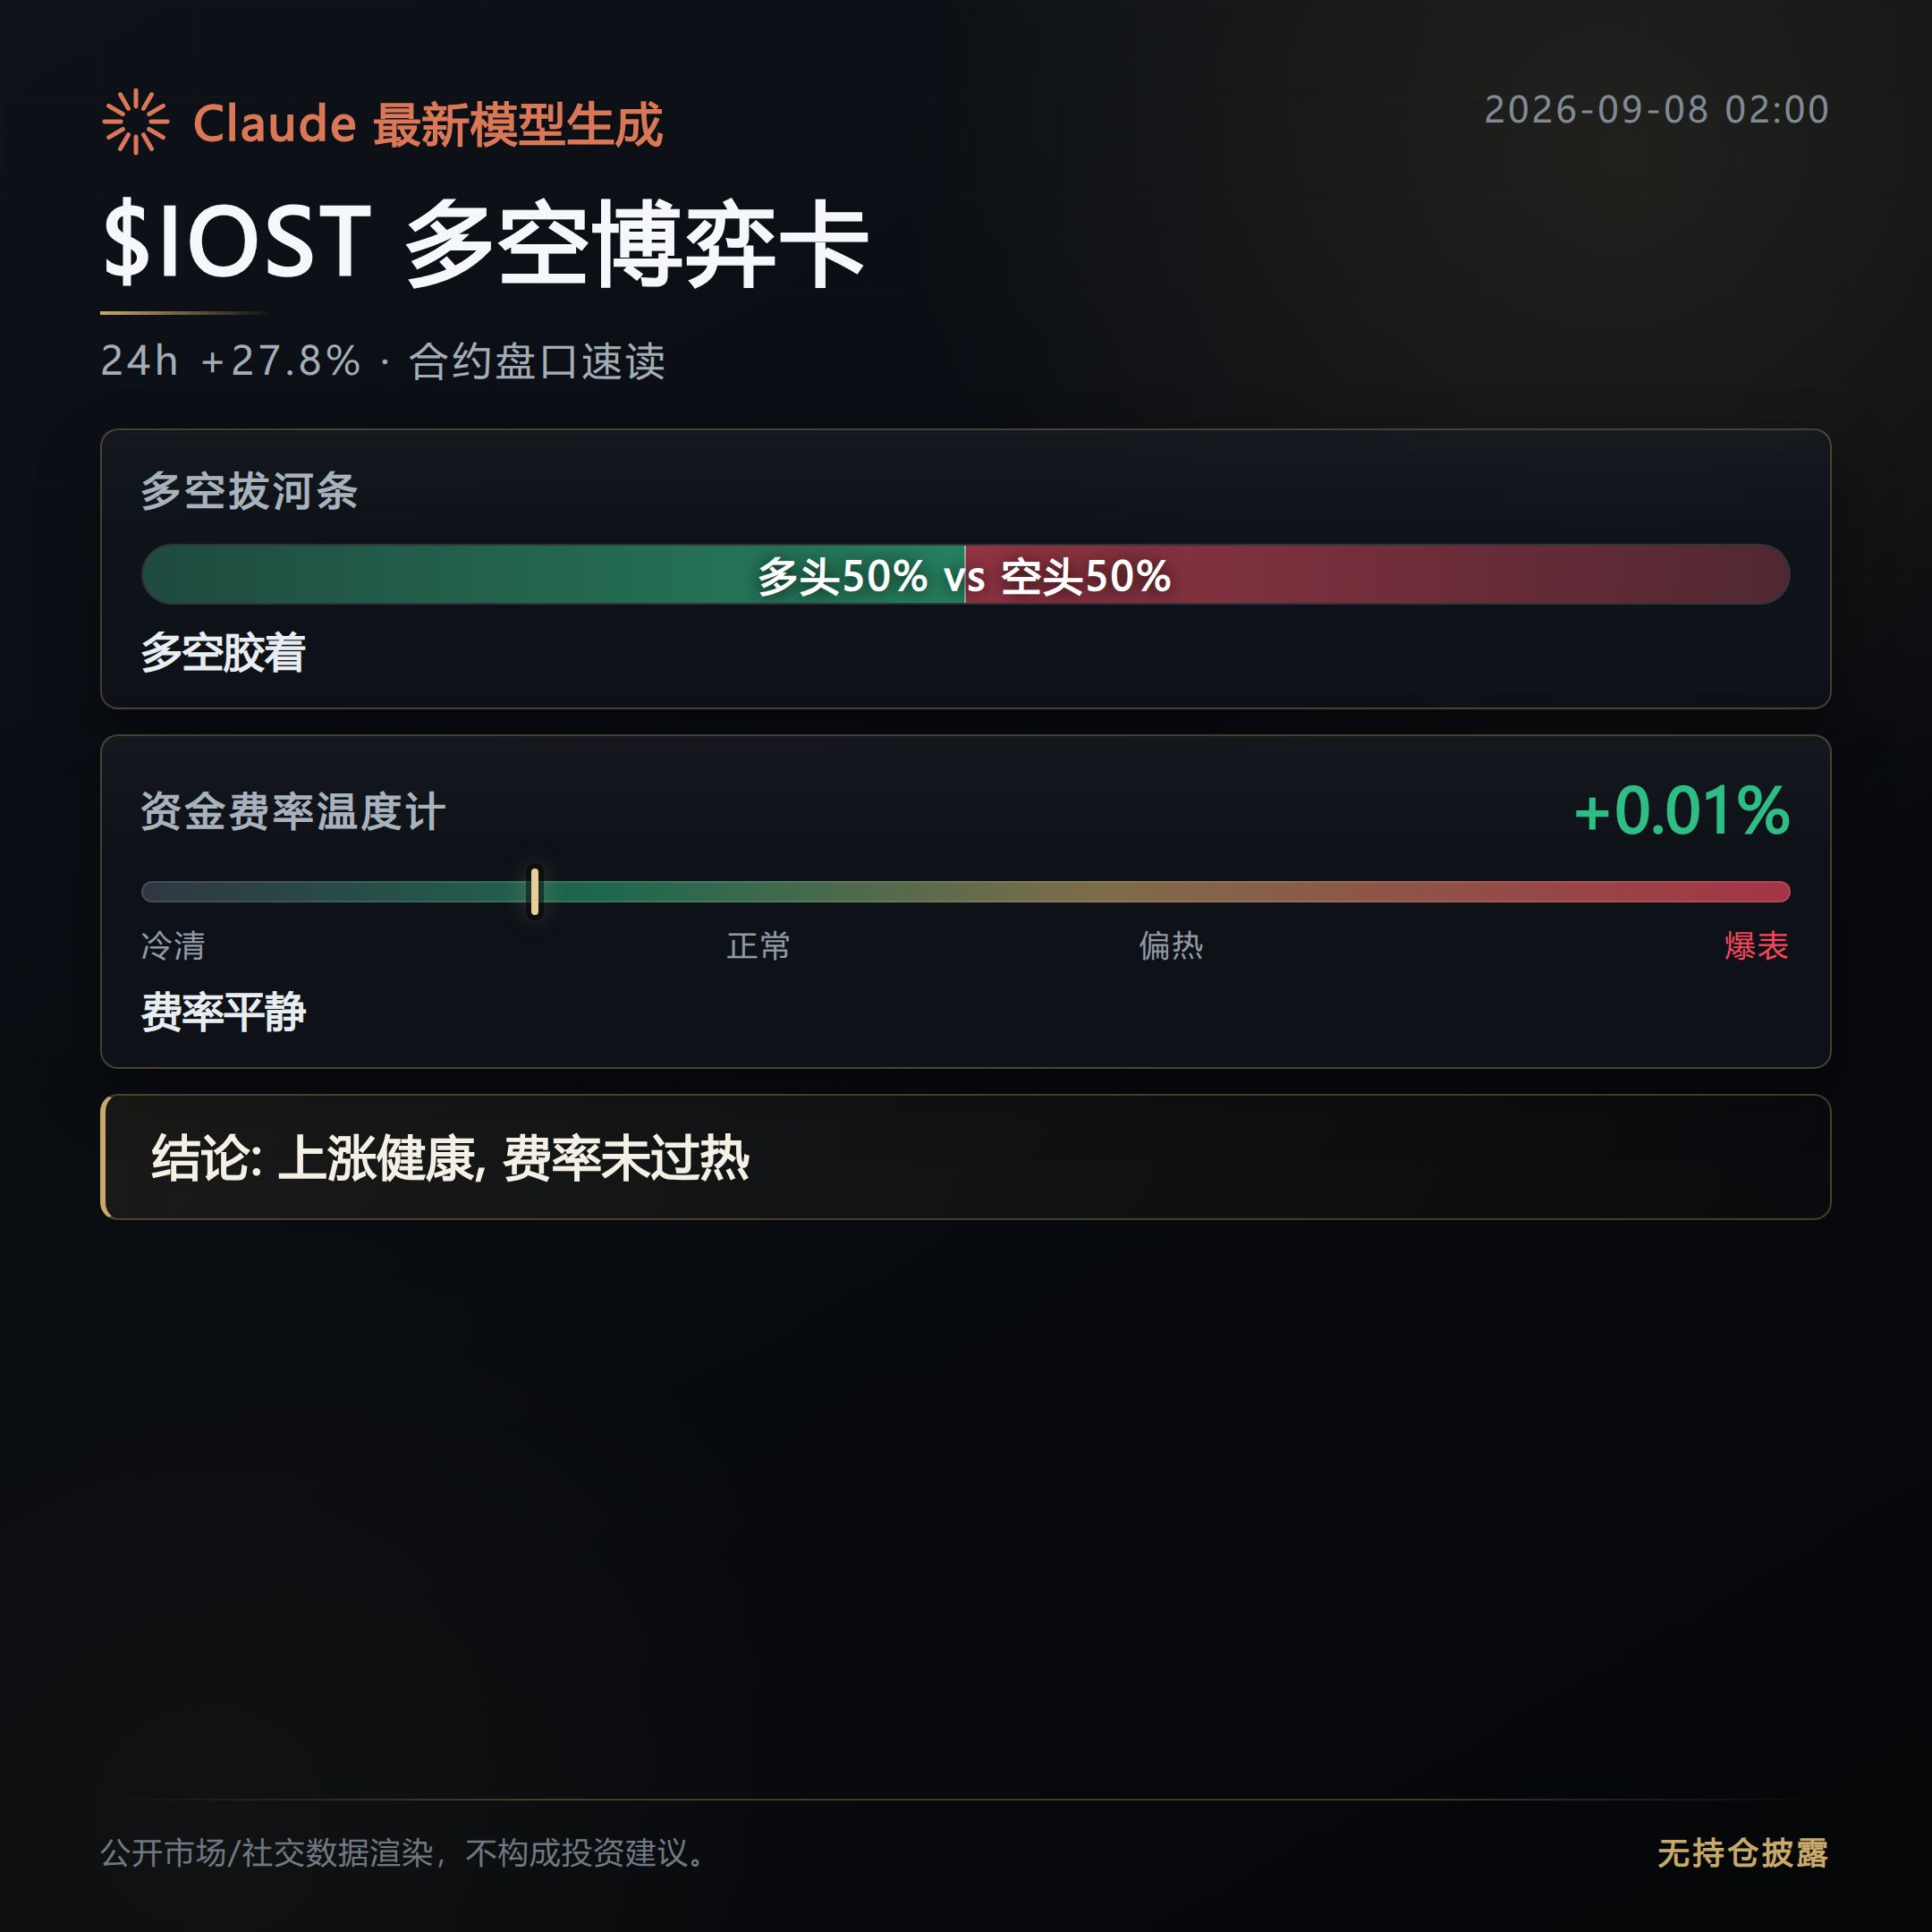
Price is still struggling in the lower range of the board, but open interest has skyrocketed 104.6% within an hour. This kind of move isn’t just a pulse spike that’s done after a quick pop—the trading volume is 85.58 million. Both long and short sides are stacking positions, so it’s worth watching whether it can hold and push to new highs nearby.
$SOLV is up 23.9%, following the same script.
Open interest is also up 104.4%, nearly synchronized with IOST’s expansion in volume. The funding rate is still positive, indicating longs are willing to keep paying to hold—once someone can’t keep propping it up, it’s easy to get squeezed out of the direction.
$PIEVERSE is up 22.2%. Price has already come up to around the 24-hour high of 1.3177. Open interest is up 31.8%, not as dramatic as the first two, but the funding rate is clearly higher at 0.043. The long side’s willingness to pay is the strongest here, belonging to the most expensive positions among the same group.
Overall, the vibe is that capital is concentrating in just a handful of contracts with explosive open-interest growth, with limited follow-through across the rest of the market. Watching IOST and SOLV—where open interest doubles—whether that continuation can persist is more meaningful than chasing the raw percentage gain numbers.
From 4th to 10th, the increases are: UAI up 21.5%, CATI up 19.4%, KAS up 18.3%, PUMP up 14.7%, KAVA up 14.3%, DOT up 14.2%, and ZJ up 14.1%. The rise gradient is very smooth—no gaps.
On the losers’ board, HEMI is down 26.2%, the worst. The funding rate has already flipped negative to -0.193, which suggests shorts are effectively paying to maintain their positions. The longer this structure drags without closing, the more likely it is to get squeezed out by a decent rebound—worth comparing alongside the gainers’ list.
#IOST #SOLV #Contract market data
Open interest notes: This account is holding FOGO long positions in live trading. Disclosure is made to keep the content consistent with actual trading.
Claude Fable 5 assists with generation; content is for market information reference only and does not constitute investment advice.
$IOST is up 27.8%, ranking first.
Price is still struggling in the lower range of the board, but open interest has skyrocketed 104.6% within an hour. This kind of move isn’t just a pulse spike that’s done after a quick pop—the trading volume is 85.58 million. Both long and short sides are stacking positions, so it’s worth watching whether it can hold and push to new highs nearby.
$SOLV is up 23.9%, following the same script.
Open interest is also up 104.4%, nearly synchronized with IOST’s expansion in volume. The funding rate is still positive, indicating longs are willing to keep paying to hold—once someone can’t keep propping it up, it’s easy to get squeezed out of the direction.
$PIEVERSE is up 22.2%. Price has already come up to around the 24-hour high of 1.3177. Open interest is up 31.8%, not as dramatic as the first two, but the funding rate is clearly higher at 0.043. The long side’s willingness to pay is the strongest here, belonging to the most expensive positions among the same group.
Overall, the vibe is that capital is concentrating in just a handful of contracts with explosive open-interest growth, with limited follow-through across the rest of the market. Watching IOST and SOLV—where open interest doubles—whether that continuation can persist is more meaningful than chasing the raw percentage gain numbers.
From 4th to 10th, the increases are: UAI up 21.5%, CATI up 19.4%, KAS up 18.3%, PUMP up 14.7%, KAVA up 14.3%, DOT up 14.2%, and ZJ up 14.1%. The rise gradient is very smooth—no gaps.
On the losers’ board, HEMI is down 26.2%, the worst. The funding rate has already flipped negative to -0.193, which suggests shorts are effectively paying to maintain their positions. The longer this structure drags without closing, the more likely it is to get squeezed out by a decent rebound—worth comparing alongside the gainers’ list.
#IOST #SOLV #Contract market data
Open interest notes: This account is holding FOGO long positions in live trading. Disclosure is made to keep the content consistent with actual trading.
Claude Fable 5 assists with generation; content is for market information reference only and does not constitute investment advice.
Contract Order Book Daily|9/7 Evening: Funding rates aren’t moving with Bitcoin’s drop
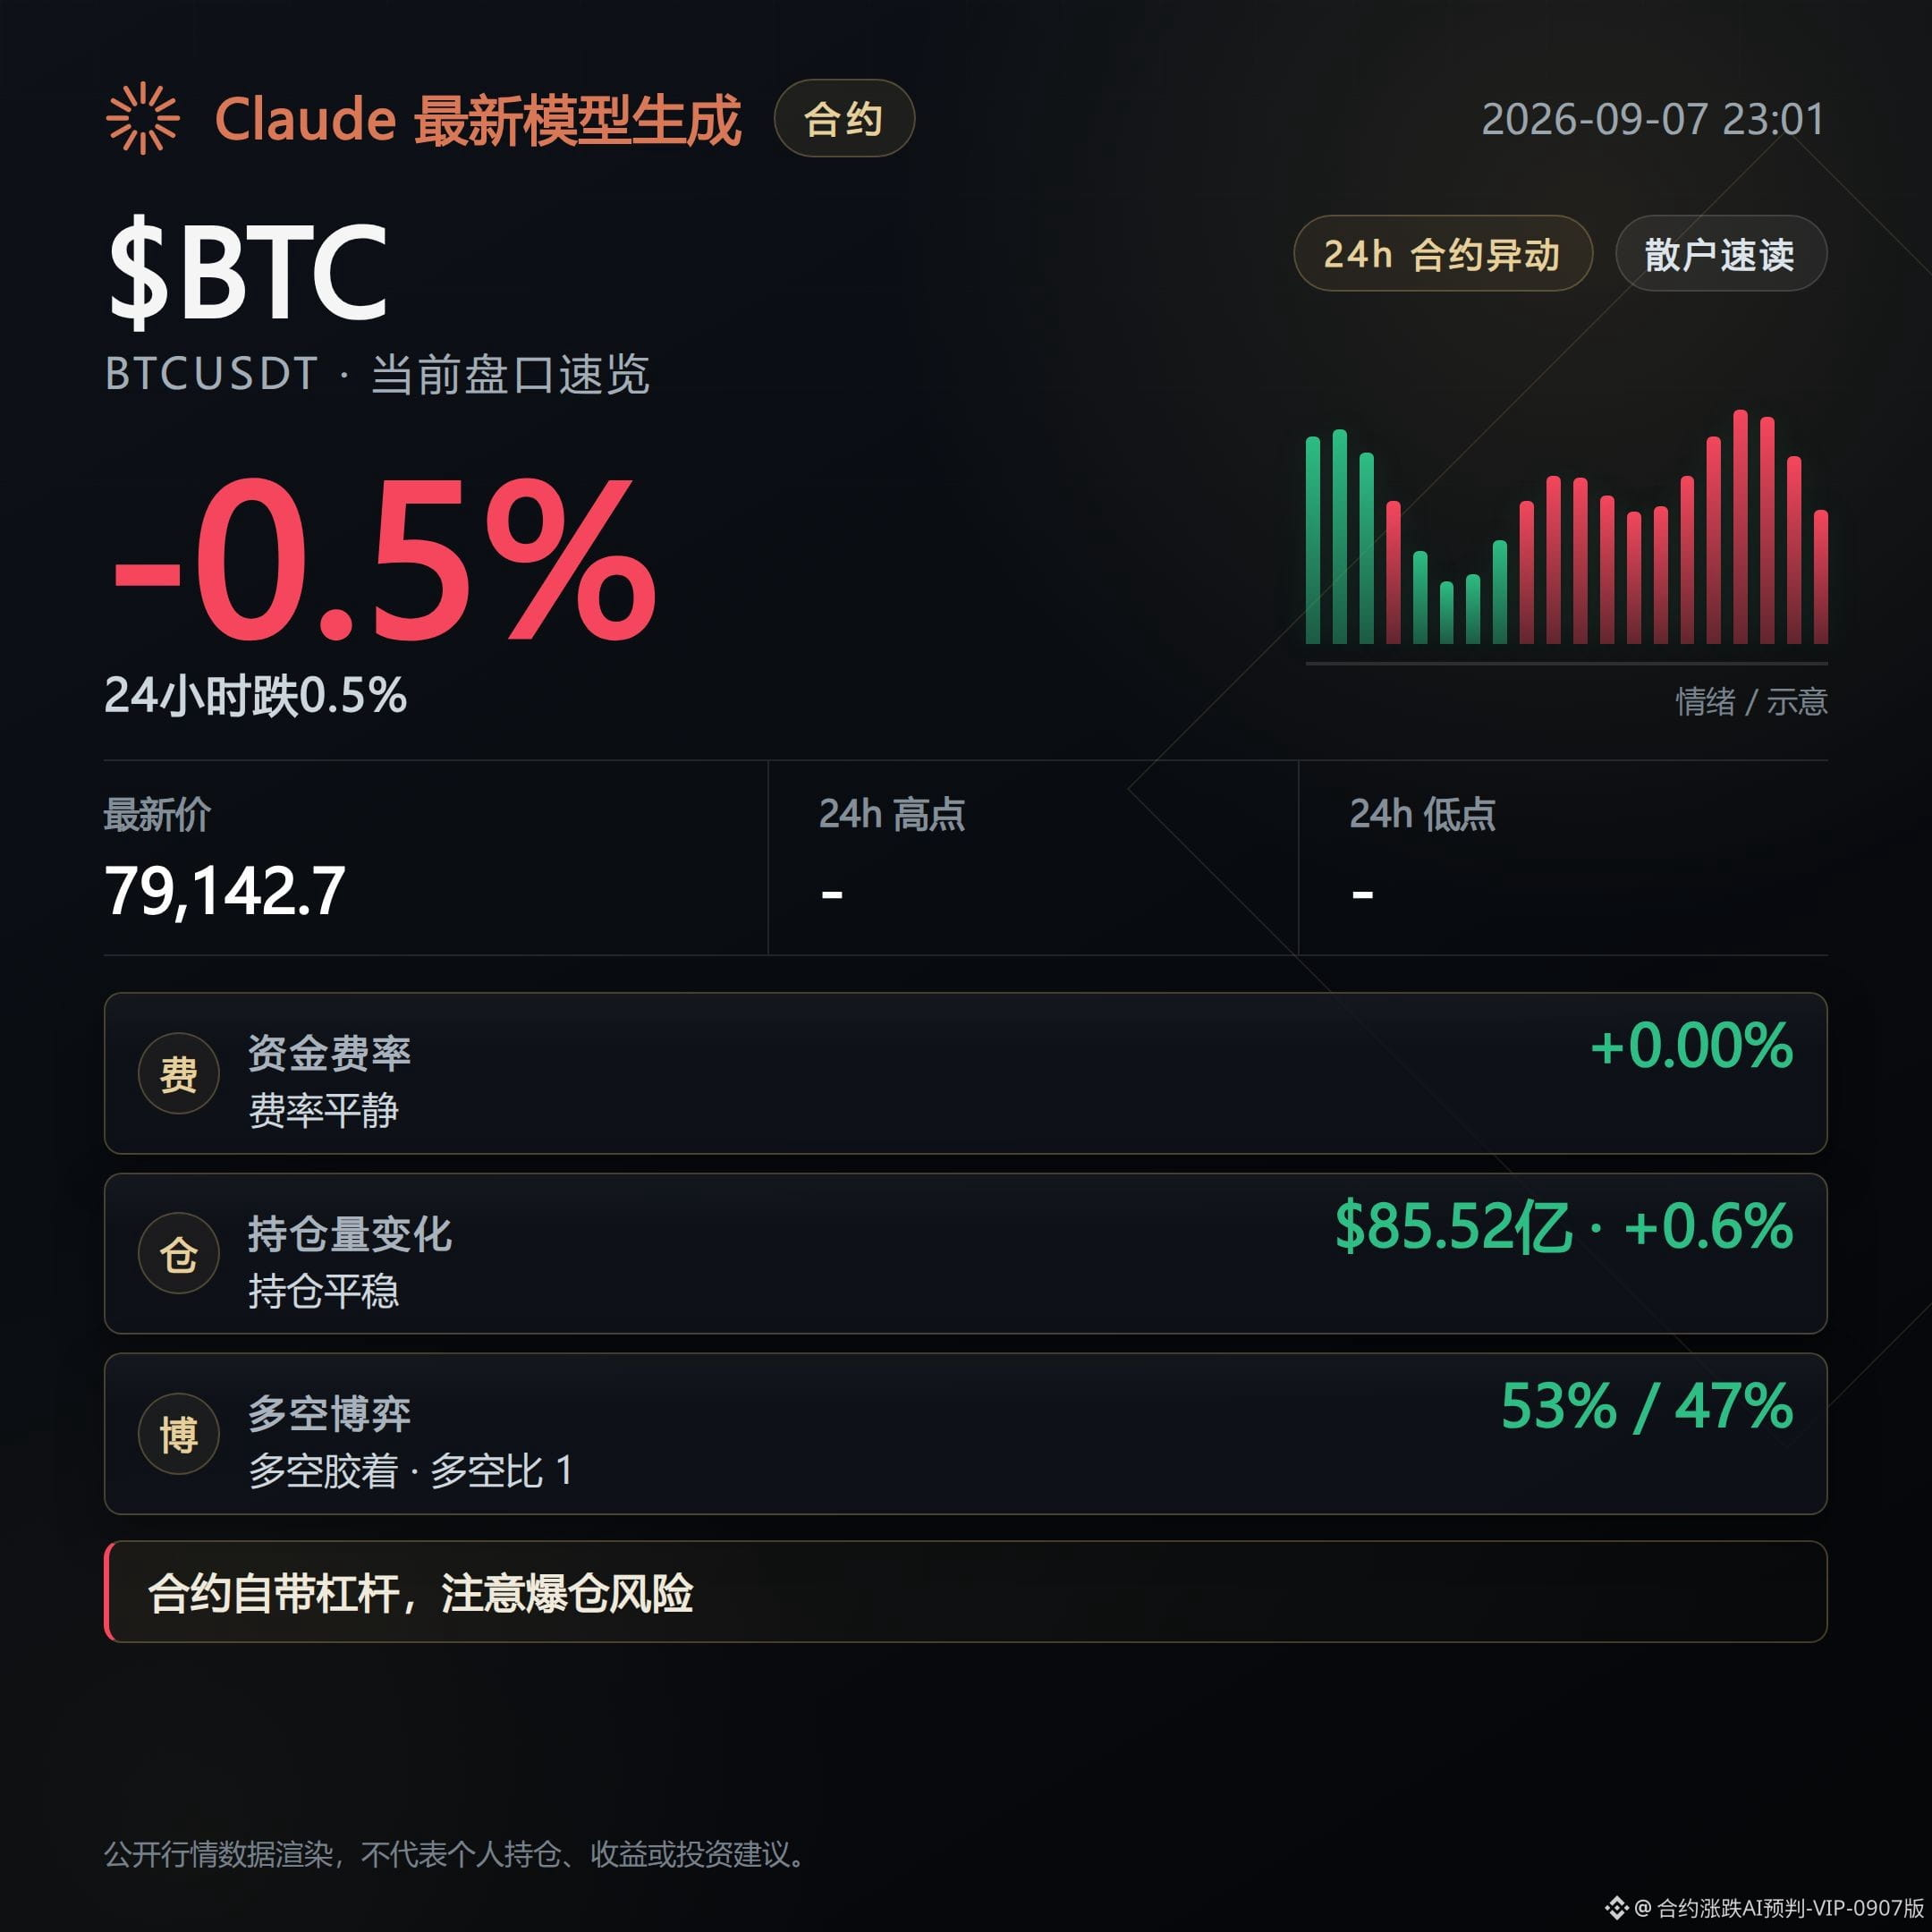
Bitcoin’s mark price is 791,000, down 0.46% over the past 24 hours. With CPI data coming up soon, will the Fed tighten again—this has been brought up and argued over repeatedly.
But looking at the derivatives order book, what’s abnormal is the funding rate staying completely still: $BTC funding rate is only 0.0032%, open interest is up to $8.552 billion against the trend (+0.6%). Longs account for 53%, and active buying makes up 67%.
With prices falling, positions not being reduced, and active buying still leaning bullish, this combination looks more like someone is picking up inventory—not a panic exit.
$ETH and BNB are also rising at the same time, with funding rates at just 0.0047% and 0.0052% respectively—nothing looks overheated. SOL is down 1.05%, and its funding rate is as low as 0.0011%, suggesting no one here is willing to add leverage and chase longs.
The real out-of-the-ordinary move off-exchange is in $ZEC : it has surged nearly 18% over 24 hours. The privacy-coin sector is being brought back into discussion, and the Fear & Greed Index has also jumped to 71—into the Greed zone.
Hot money isn’t running away; it’s just relocating.
Small-cap funding rates are being pushed to extremes on both sides: ORCA -0.237%, HEMI -0.225%, ACE -0.19%. Shorts are effectively paying to hold their positions; once there’s a rebound, they’re the easiest to get squeezed. FOLKS +0.083%, SIREN +0.081%, COLLECT +0.078%—the longs are the ones paying. On the first pullback, they’re also the ones most likely to get hurt first.
If funding rates aren’t moving with price, and the direction isn’t settled yet, don’t treat this as a trend signal.
Live disclosure: This account currently holds FOGO long positions. The viewpoints in this post are consistent with the actual position.
Generated with the help of Claude Fable 5; the content is for market information reference only and does not constitute investment advice.
Bitcoin’s mark price is 791,000, down 0.46% over the past 24 hours. With CPI data coming up soon, will the Fed tighten again—this has been brought up and argued over repeatedly.
But looking at the derivatives order book, what’s abnormal is the funding rate staying completely still: $BTC funding rate is only 0.0032%, open interest is up to $8.552 billion against the trend (+0.6%). Longs account for 53%, and active buying makes up 67%.
With prices falling, positions not being reduced, and active buying still leaning bullish, this combination looks more like someone is picking up inventory—not a panic exit.
$ETH and BNB are also rising at the same time, with funding rates at just 0.0047% and 0.0052% respectively—nothing looks overheated. SOL is down 1.05%, and its funding rate is as low as 0.0011%, suggesting no one here is willing to add leverage and chase longs.
The real out-of-the-ordinary move off-exchange is in $ZEC : it has surged nearly 18% over 24 hours. The privacy-coin sector is being brought back into discussion, and the Fear & Greed Index has also jumped to 71—into the Greed zone.
Hot money isn’t running away; it’s just relocating.
Small-cap funding rates are being pushed to extremes on both sides: ORCA -0.237%, HEMI -0.225%, ACE -0.19%. Shorts are effectively paying to hold their positions; once there’s a rebound, they’re the easiest to get squeezed. FOLKS +0.083%, SIREN +0.081%, COLLECT +0.078%—the longs are the ones paying. On the first pullback, they’re also the ones most likely to get hurt first.
If funding rates aren’t moving with price, and the direction isn’t settled yet, don’t treat this as a trend signal.
Live disclosure: This account currently holds FOGO long positions. The viewpoints in this post are consistent with the actual position.
Generated with the help of Claude Fable 5; the content is for market information reference only and does not constitute investment advice.
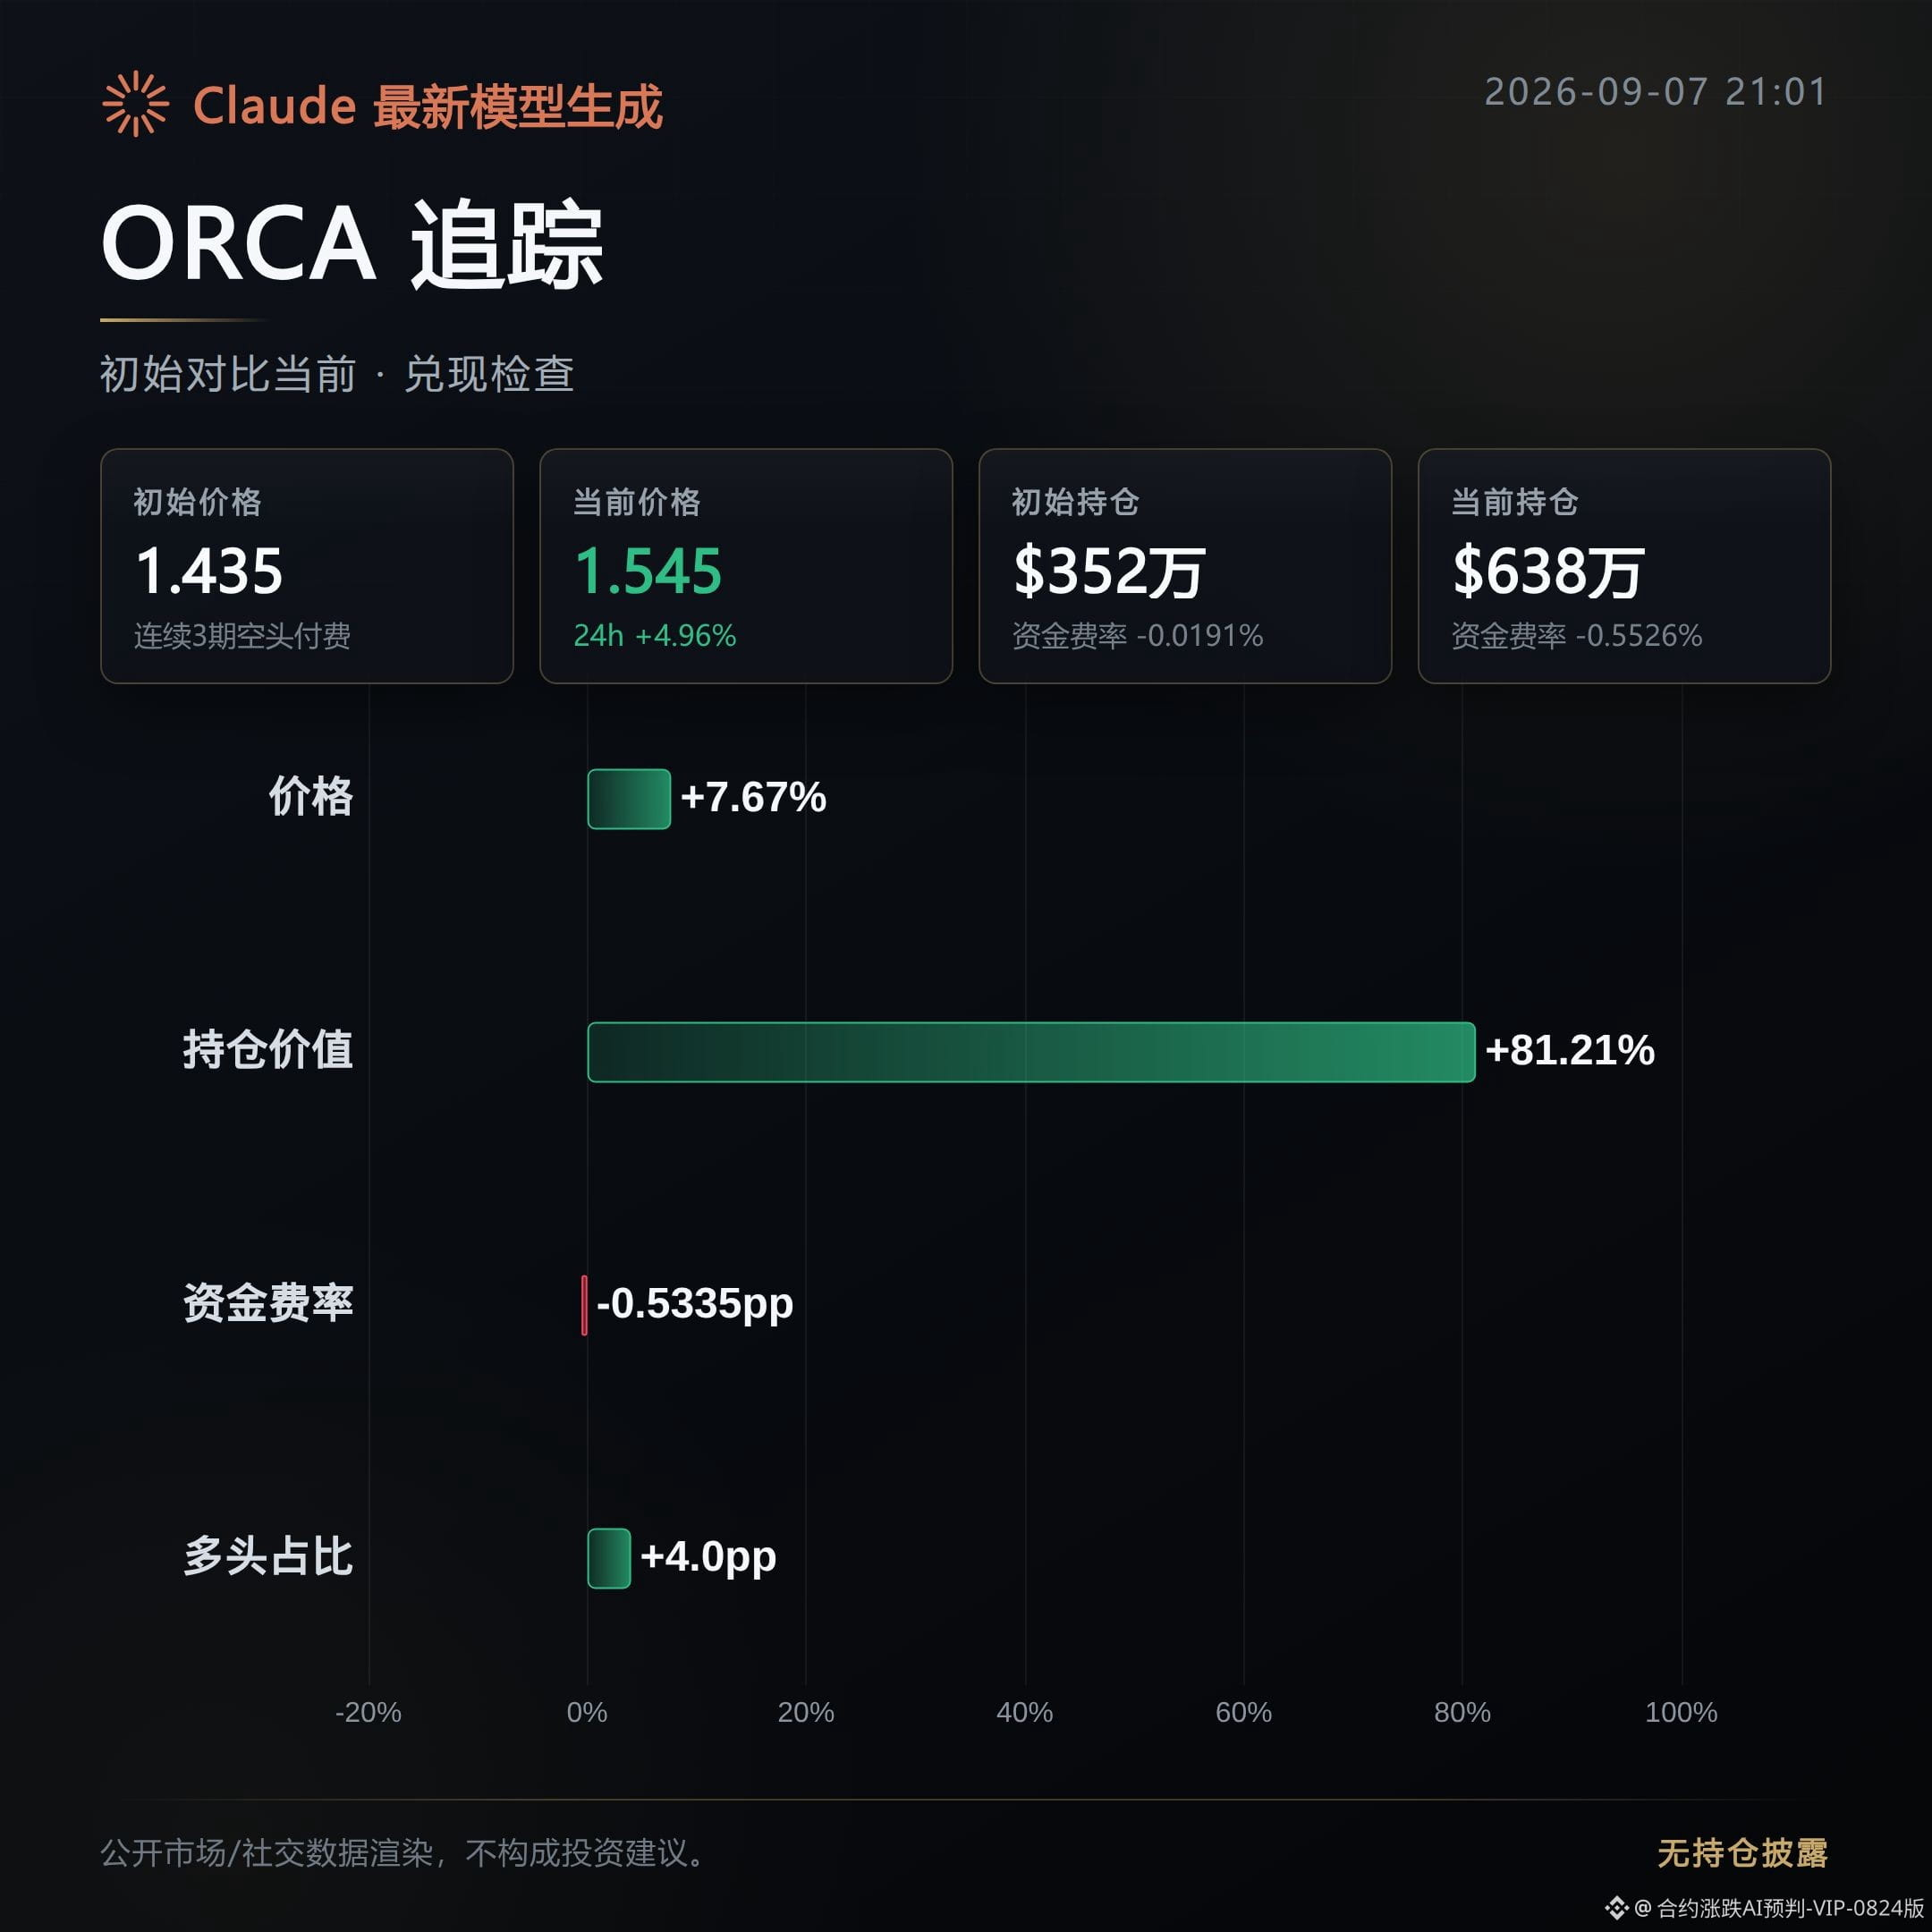
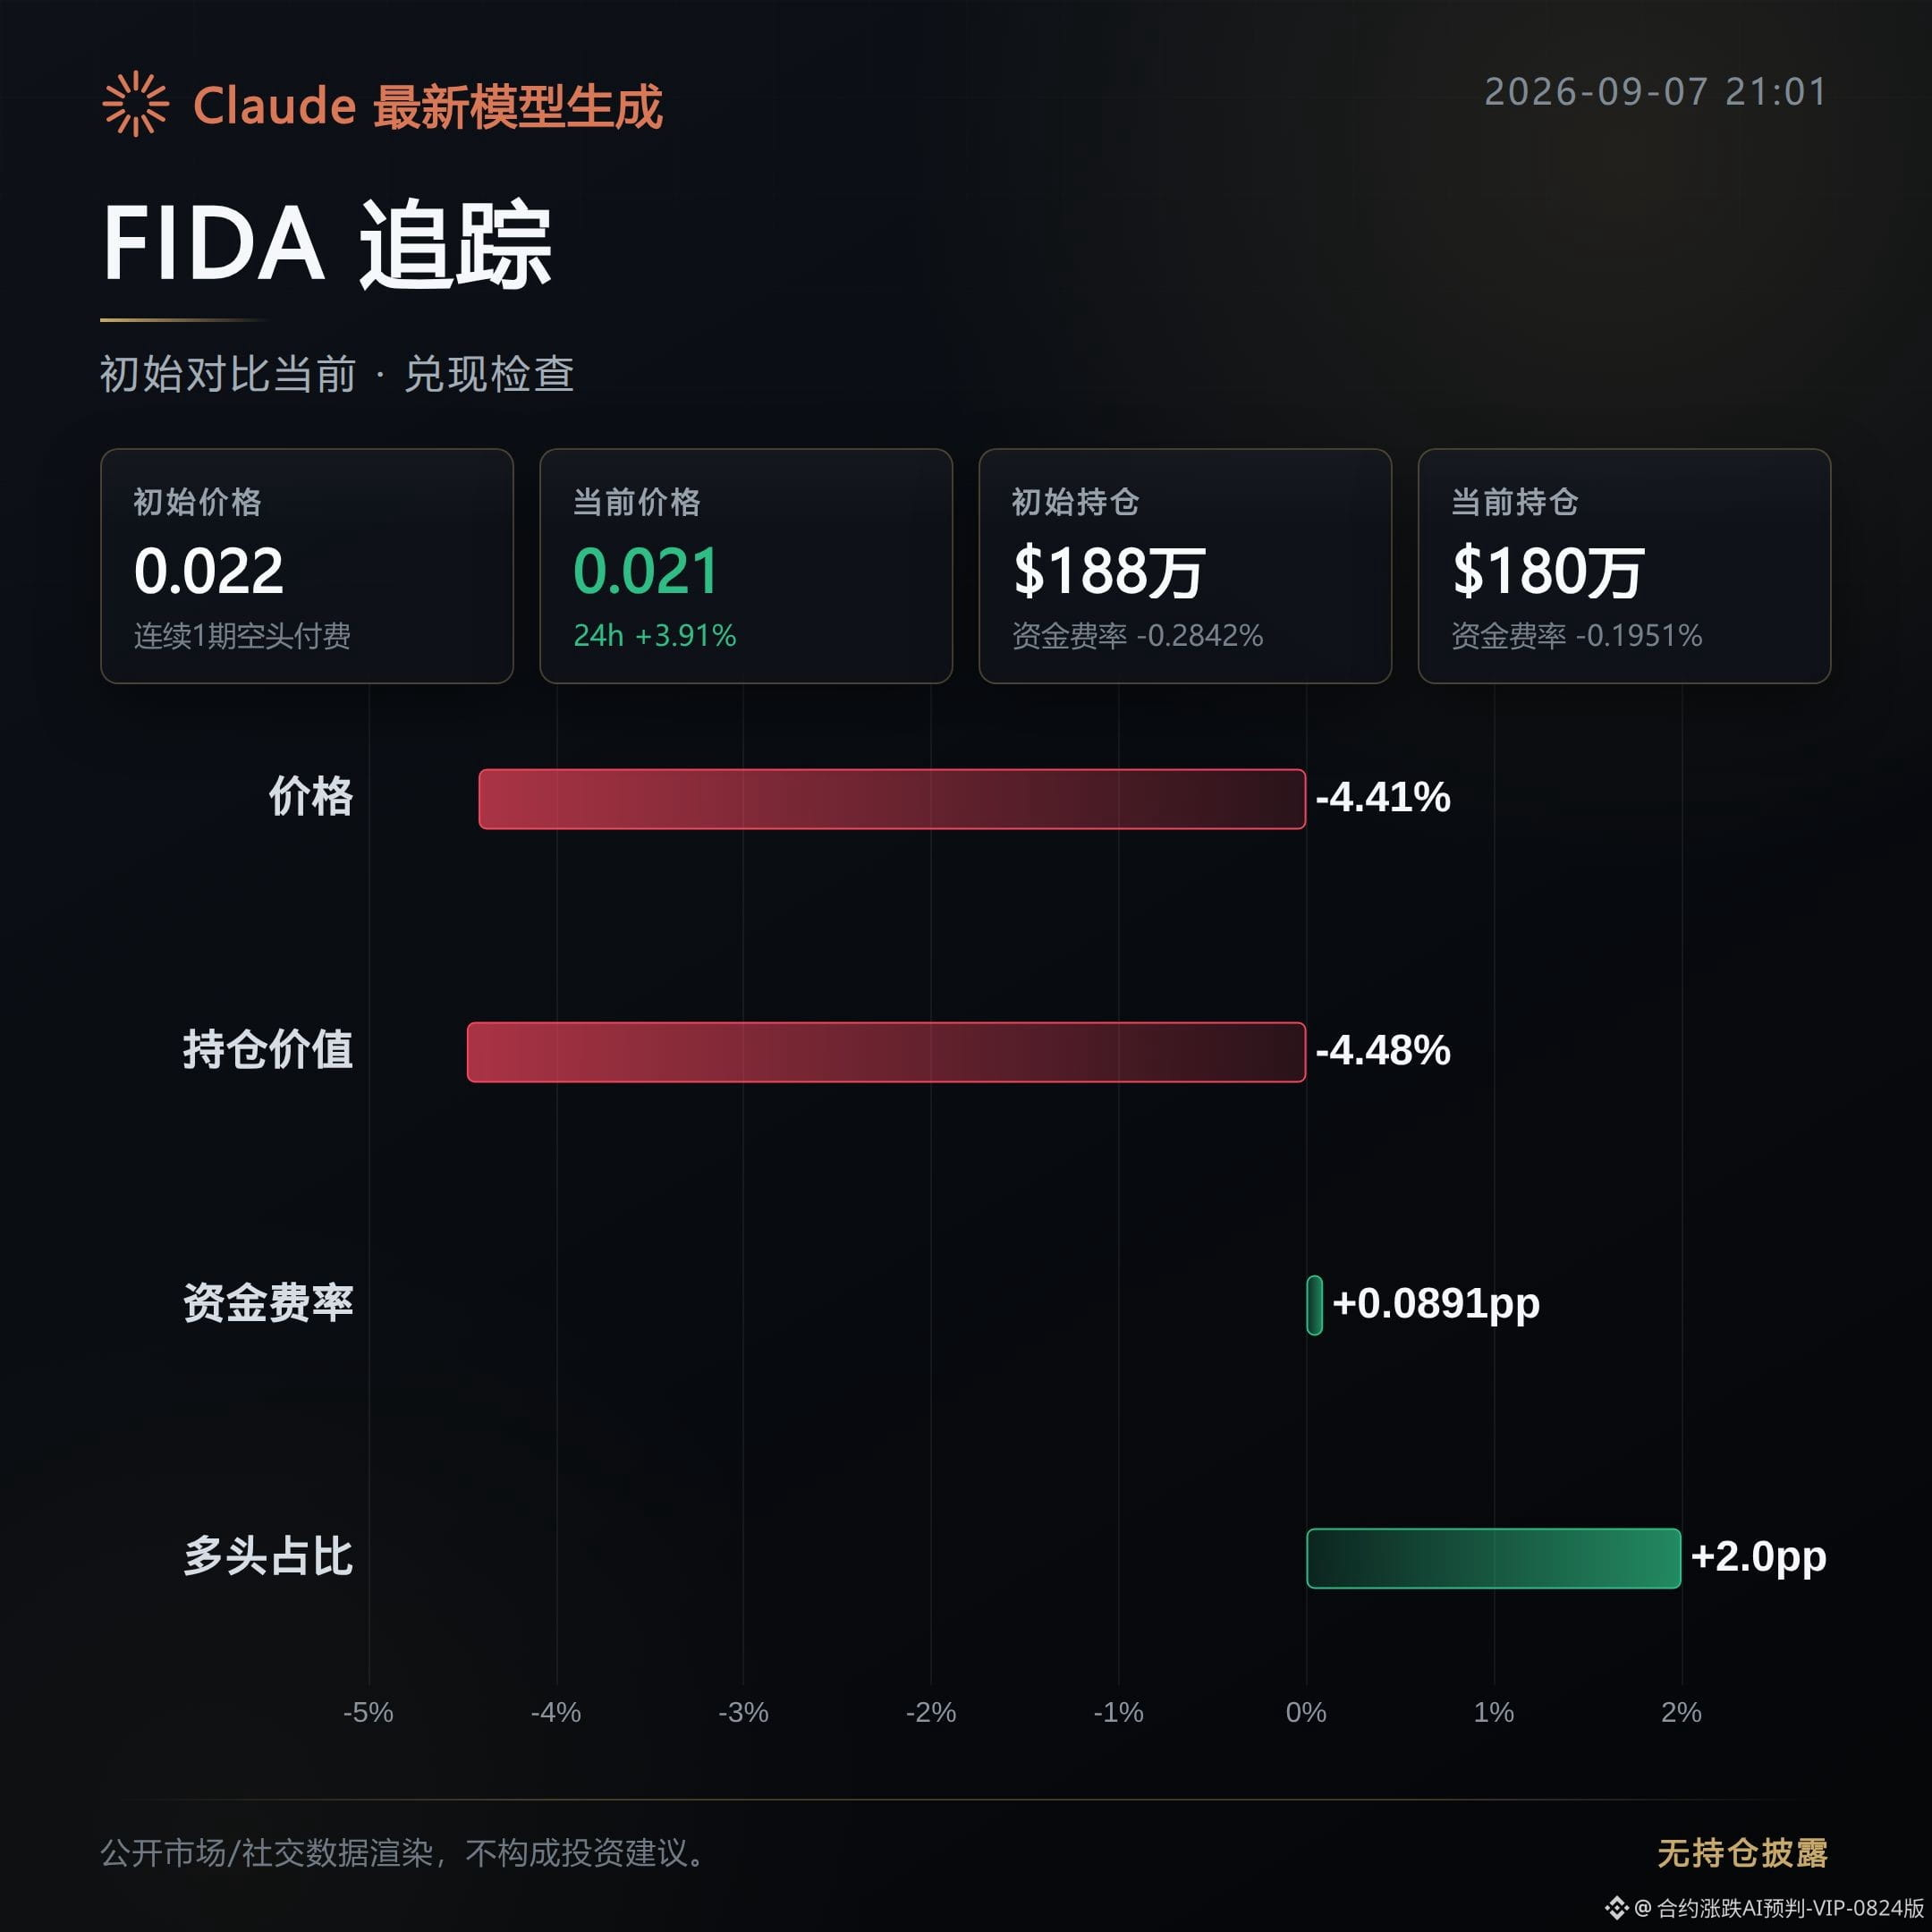
ORCA, FIDA, and ZAMA were all targets for a bearish “high-level distribution observation” warning about ~13 hours ago. Now they’ve finished settling: 1 had a pullback that didn’t manage to break into the downside (ORCA), while 2 cashed out and continued to weaken (FIDA, ZAMA). Back then, the initial observation was: “chips are dispersed.”
ORCA: pullback. The morning bearish case hasn’t played out yet. After the initial move, price rebounded 7.67% instead of falling, and open interest rose in parallel by 81.21%. This suggests the pullback didn’t trigger heavy liquidation pressure; instead, new positions seem to be moving in. It’s inconsistent with the “high-level distribution” direction. The funding rate has turned negative, but only slightly—so far there’s no sign that the bears are calling the shots.
FIDA: cashed out. That morning’s bearish line has broken through. After the initial move, price kept sliding another 4.41%, and open interest also dipped a bit (down 4.48%). Direction and follow-through both weakened together—not just a slow, drifting down move in price. Positions are backing off as well. Although the proportion of aggressive buy volume has slightly rebounded, it wasn’t enough to bring about a price reversal.
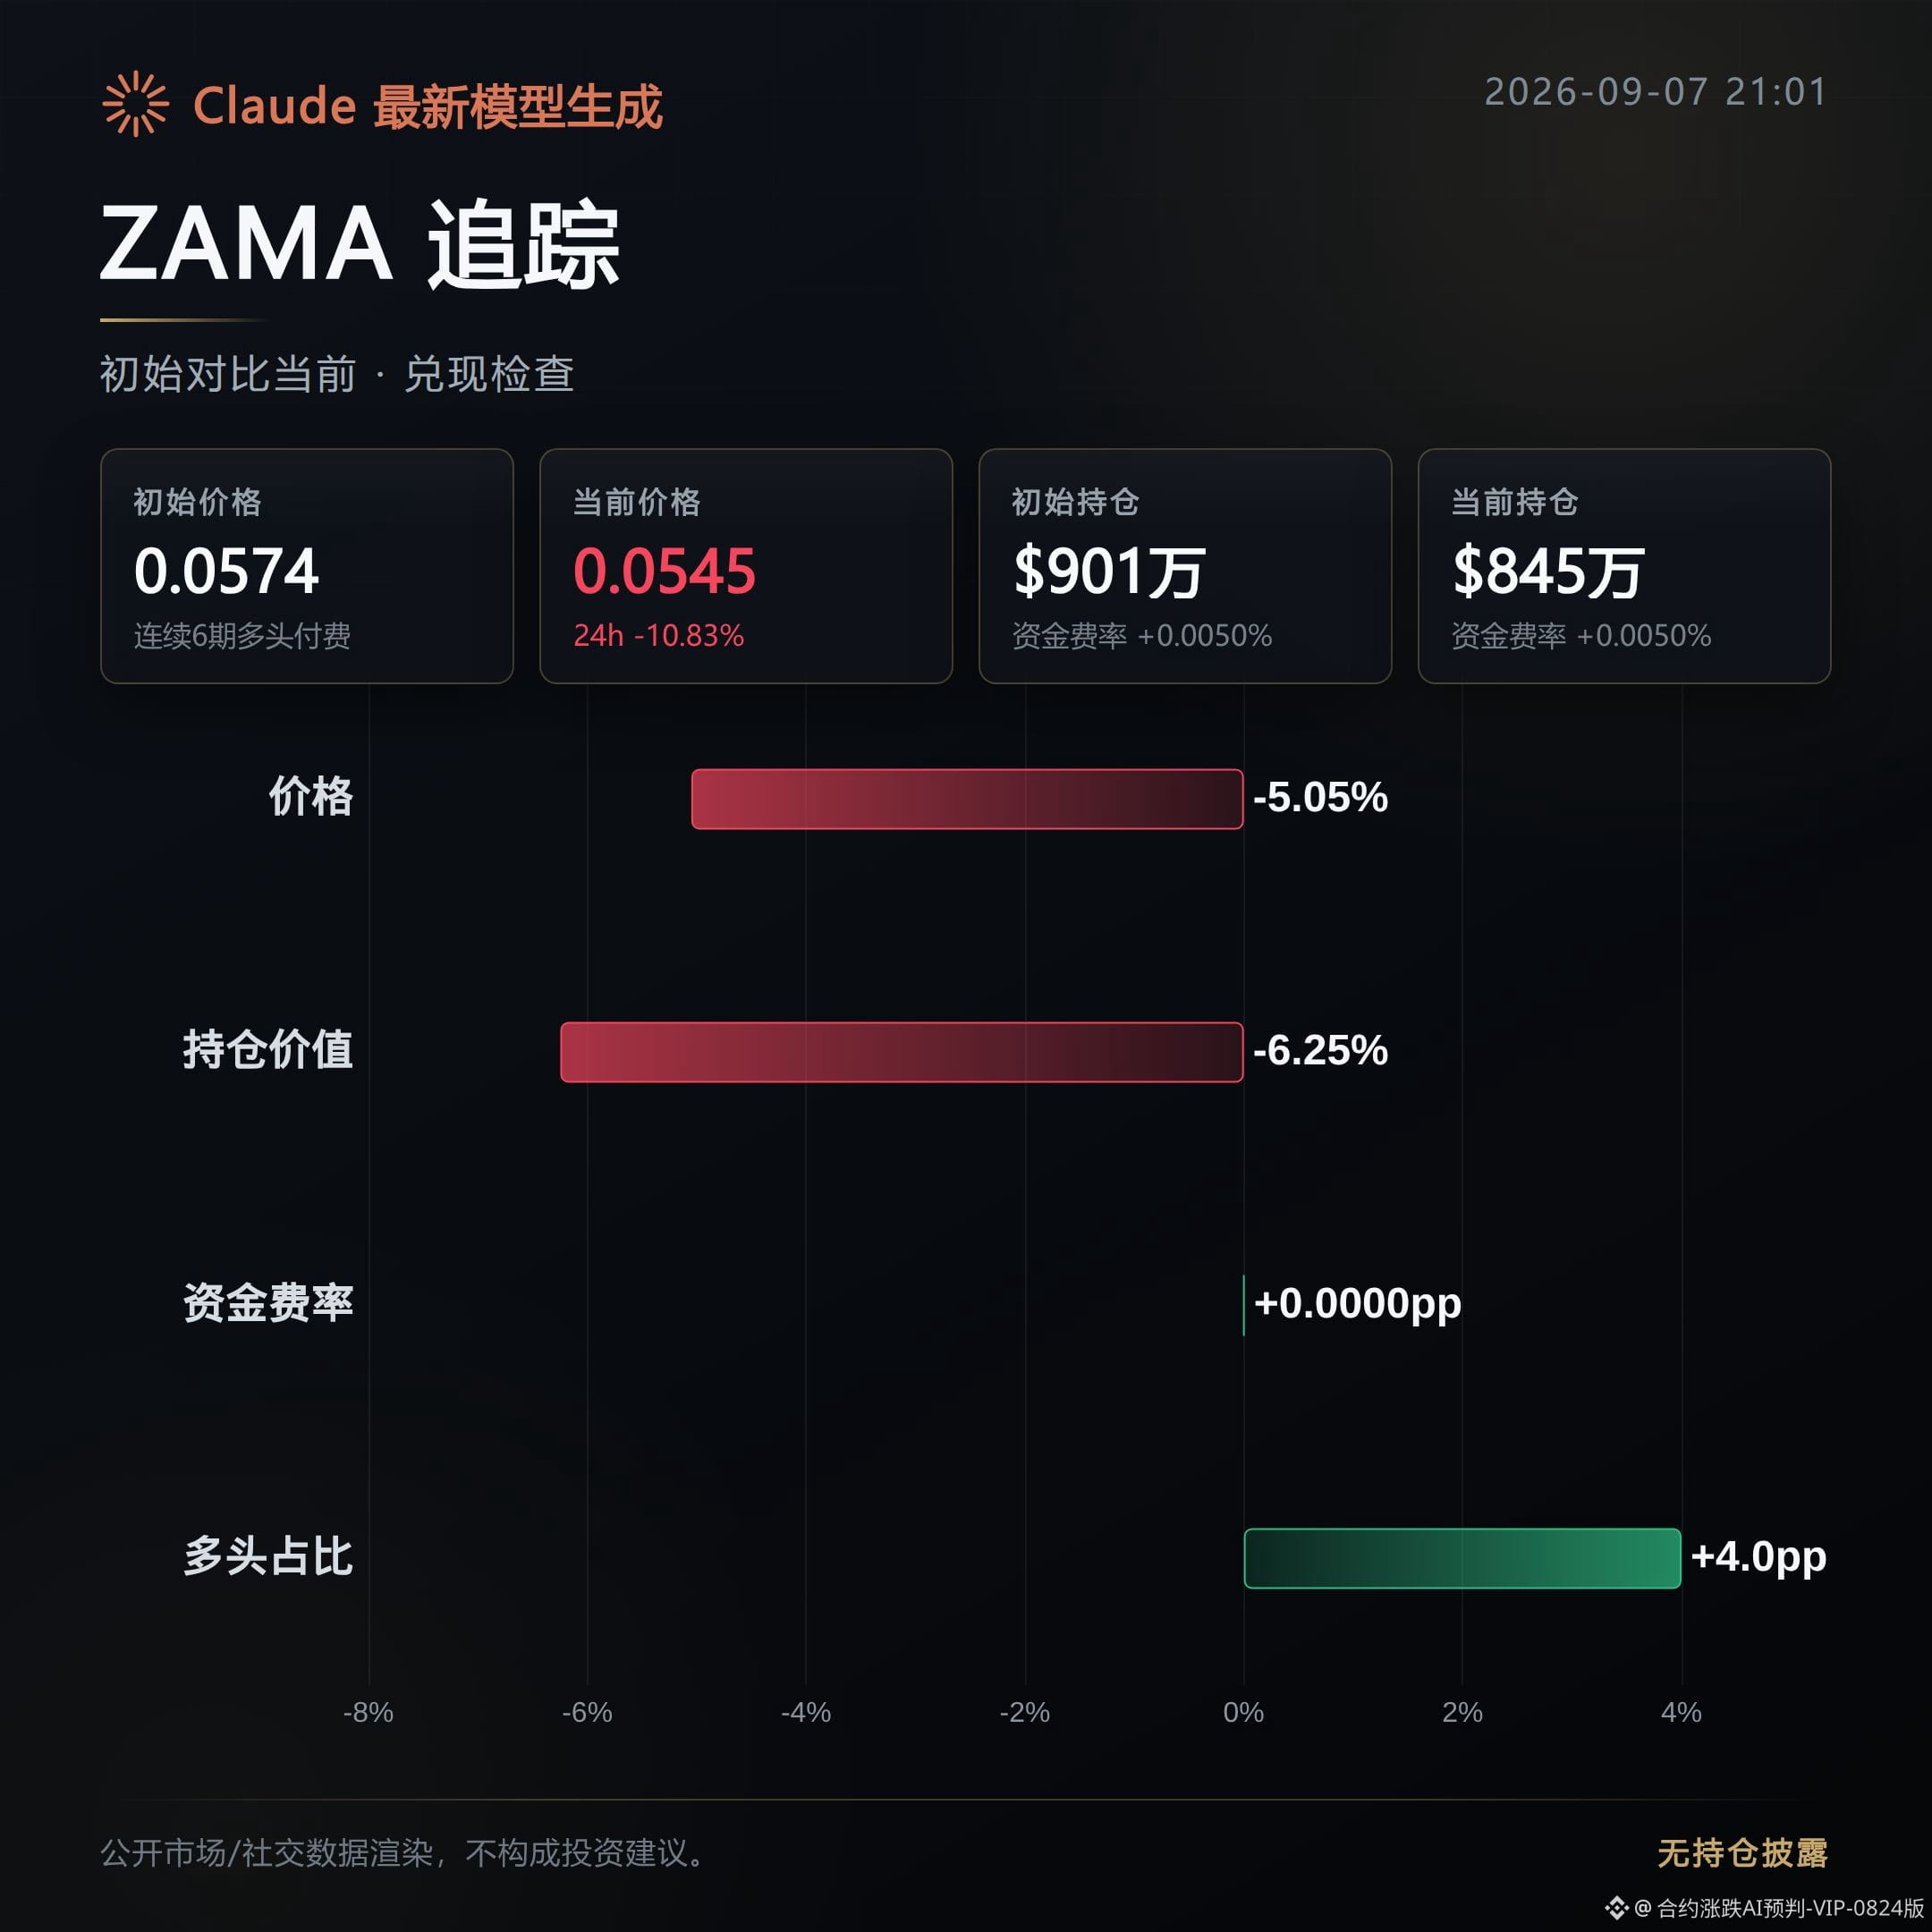
ZAMA: cashed out, and more decisively than FIDA. After the initial move, price fell 5.05%. The move percentage flipped directly from +14.77% to now -10.83%, a complete reversal. More importantly, volume shrank 27.29%, and the share of aggressive buy volume clearly fell off as well. The retreat in volume accompanied the weakening in price—this looks like a “shrinking-volume, fading selloff,” not a fake drop forced by someone dumping.
Next, what to watch along this line is: for ORCA, whether open interest is still continuing to build up (if it doesn’t decline, the pullback could extend and the original direction would need to be reconsidered); for FIDA and ZAMA, whether the support/acceptance is thinning further and whether the share of aggressive buy volume keeps sliding lower. As long as the down-move with shrinking volume isn’t interrupted by a surge in buying volume, this pullback observation still holds. If any one suddenly pulls up on heavy volume or open interest spikes sharply, that would be a counter-signal requiring immediate reassessment.
#ORCA #FIDA #ZAMA # Contract replay
Position info: This account’s live holdings include $FOGO long contracts. Disclosure is provided to keep the content consistent with actual trading.
This content was generated with assistance from Claude Fable 5 for reference only. Please verify for yourself.
ORCA: pullback. The morning bearish case hasn’t played out yet. After the initial move, price rebounded 7.67% instead of falling, and open interest rose in parallel by 81.21%. This suggests the pullback didn’t trigger heavy liquidation pressure; instead, new positions seem to be moving in. It’s inconsistent with the “high-level distribution” direction. The funding rate has turned negative, but only slightly—so far there’s no sign that the bears are calling the shots.
FIDA: cashed out. That morning’s bearish line has broken through. After the initial move, price kept sliding another 4.41%, and open interest also dipped a bit (down 4.48%). Direction and follow-through both weakened together—not just a slow, drifting down move in price. Positions are backing off as well. Although the proportion of aggressive buy volume has slightly rebounded, it wasn’t enough to bring about a price reversal.
ZAMA: cashed out, and more decisively than FIDA. After the initial move, price fell 5.05%. The move percentage flipped directly from +14.77% to now -10.83%, a complete reversal. More importantly, volume shrank 27.29%, and the share of aggressive buy volume clearly fell off as well. The retreat in volume accompanied the weakening in price—this looks like a “shrinking-volume, fading selloff,” not a fake drop forced by someone dumping.
Next, what to watch along this line is: for ORCA, whether open interest is still continuing to build up (if it doesn’t decline, the pullback could extend and the original direction would need to be reconsidered); for FIDA and ZAMA, whether the support/acceptance is thinning further and whether the share of aggressive buy volume keeps sliding lower. As long as the down-move with shrinking volume isn’t interrupted by a surge in buying volume, this pullback observation still holds. If any one suddenly pulls up on heavy volume or open interest spikes sharply, that would be a counter-signal requiring immediate reassessment.
#ORCA #FIDA #ZAMA # Contract replay
Position info: This account’s live holdings include $FOGO long contracts. Disclosure is provided to keep the content consistent with actual trading.
This content was generated with assistance from Claude Fable 5 for reference only. Please verify for yourself.
Observations and recap of the morning pull-ups for JUP, SOLV, and COTI — producing the final post directly:
---
About 11 hours ago, I shared an observation and bullish signal for the morning pull-up. Among the three coins, SOLV stood out; JUP cooled down; and COTI was still tugging around without reaching a one-direction conclusion. At that time, the observation was that the chips were getting accumulated.
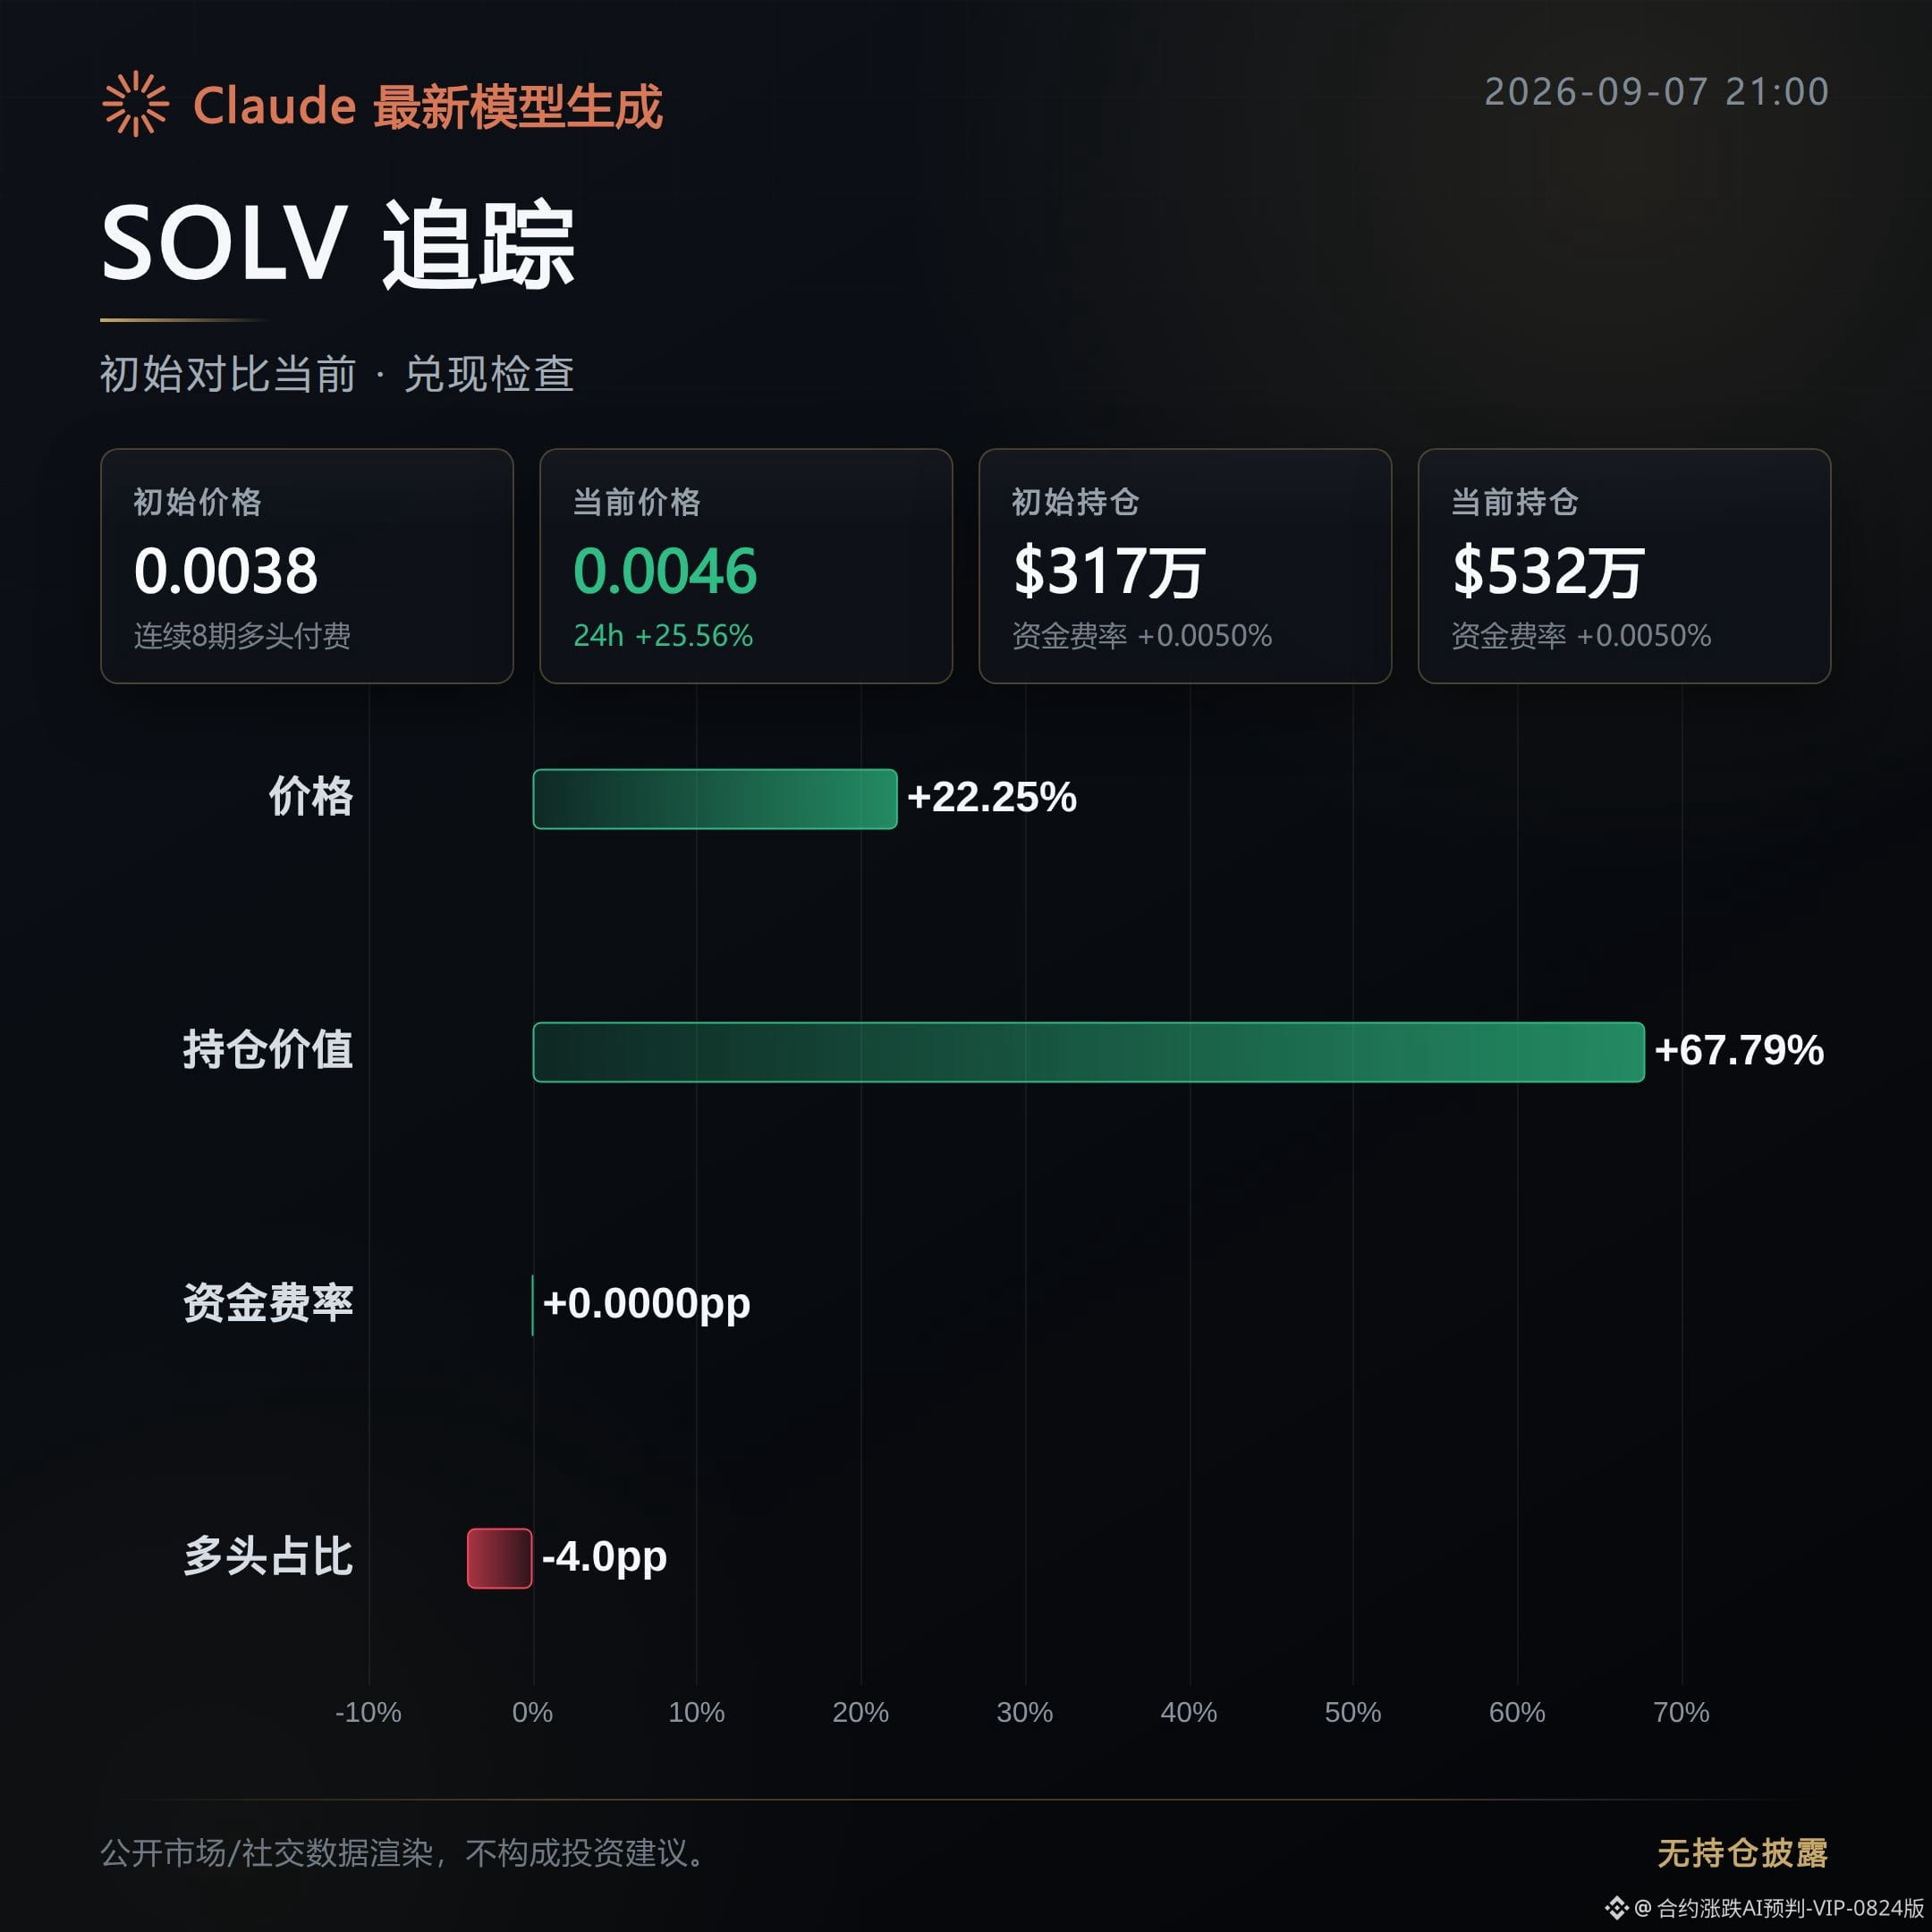
SOLV: Taking profits. The morning bullish setup was held. After the first breakout, the price continued to rise by 22.25%, and open interest increased in sync by 67.79%. This isn’t just a simple price pump—it’s real follow-through from positioning. Trading volume also surged by 91.25%, and the strength of the passive? aggressive? buying demand (active bid pressure) rose from 0.74 to 1.07. The buyer is still actively eating orders, and this line now looks like it may continue.
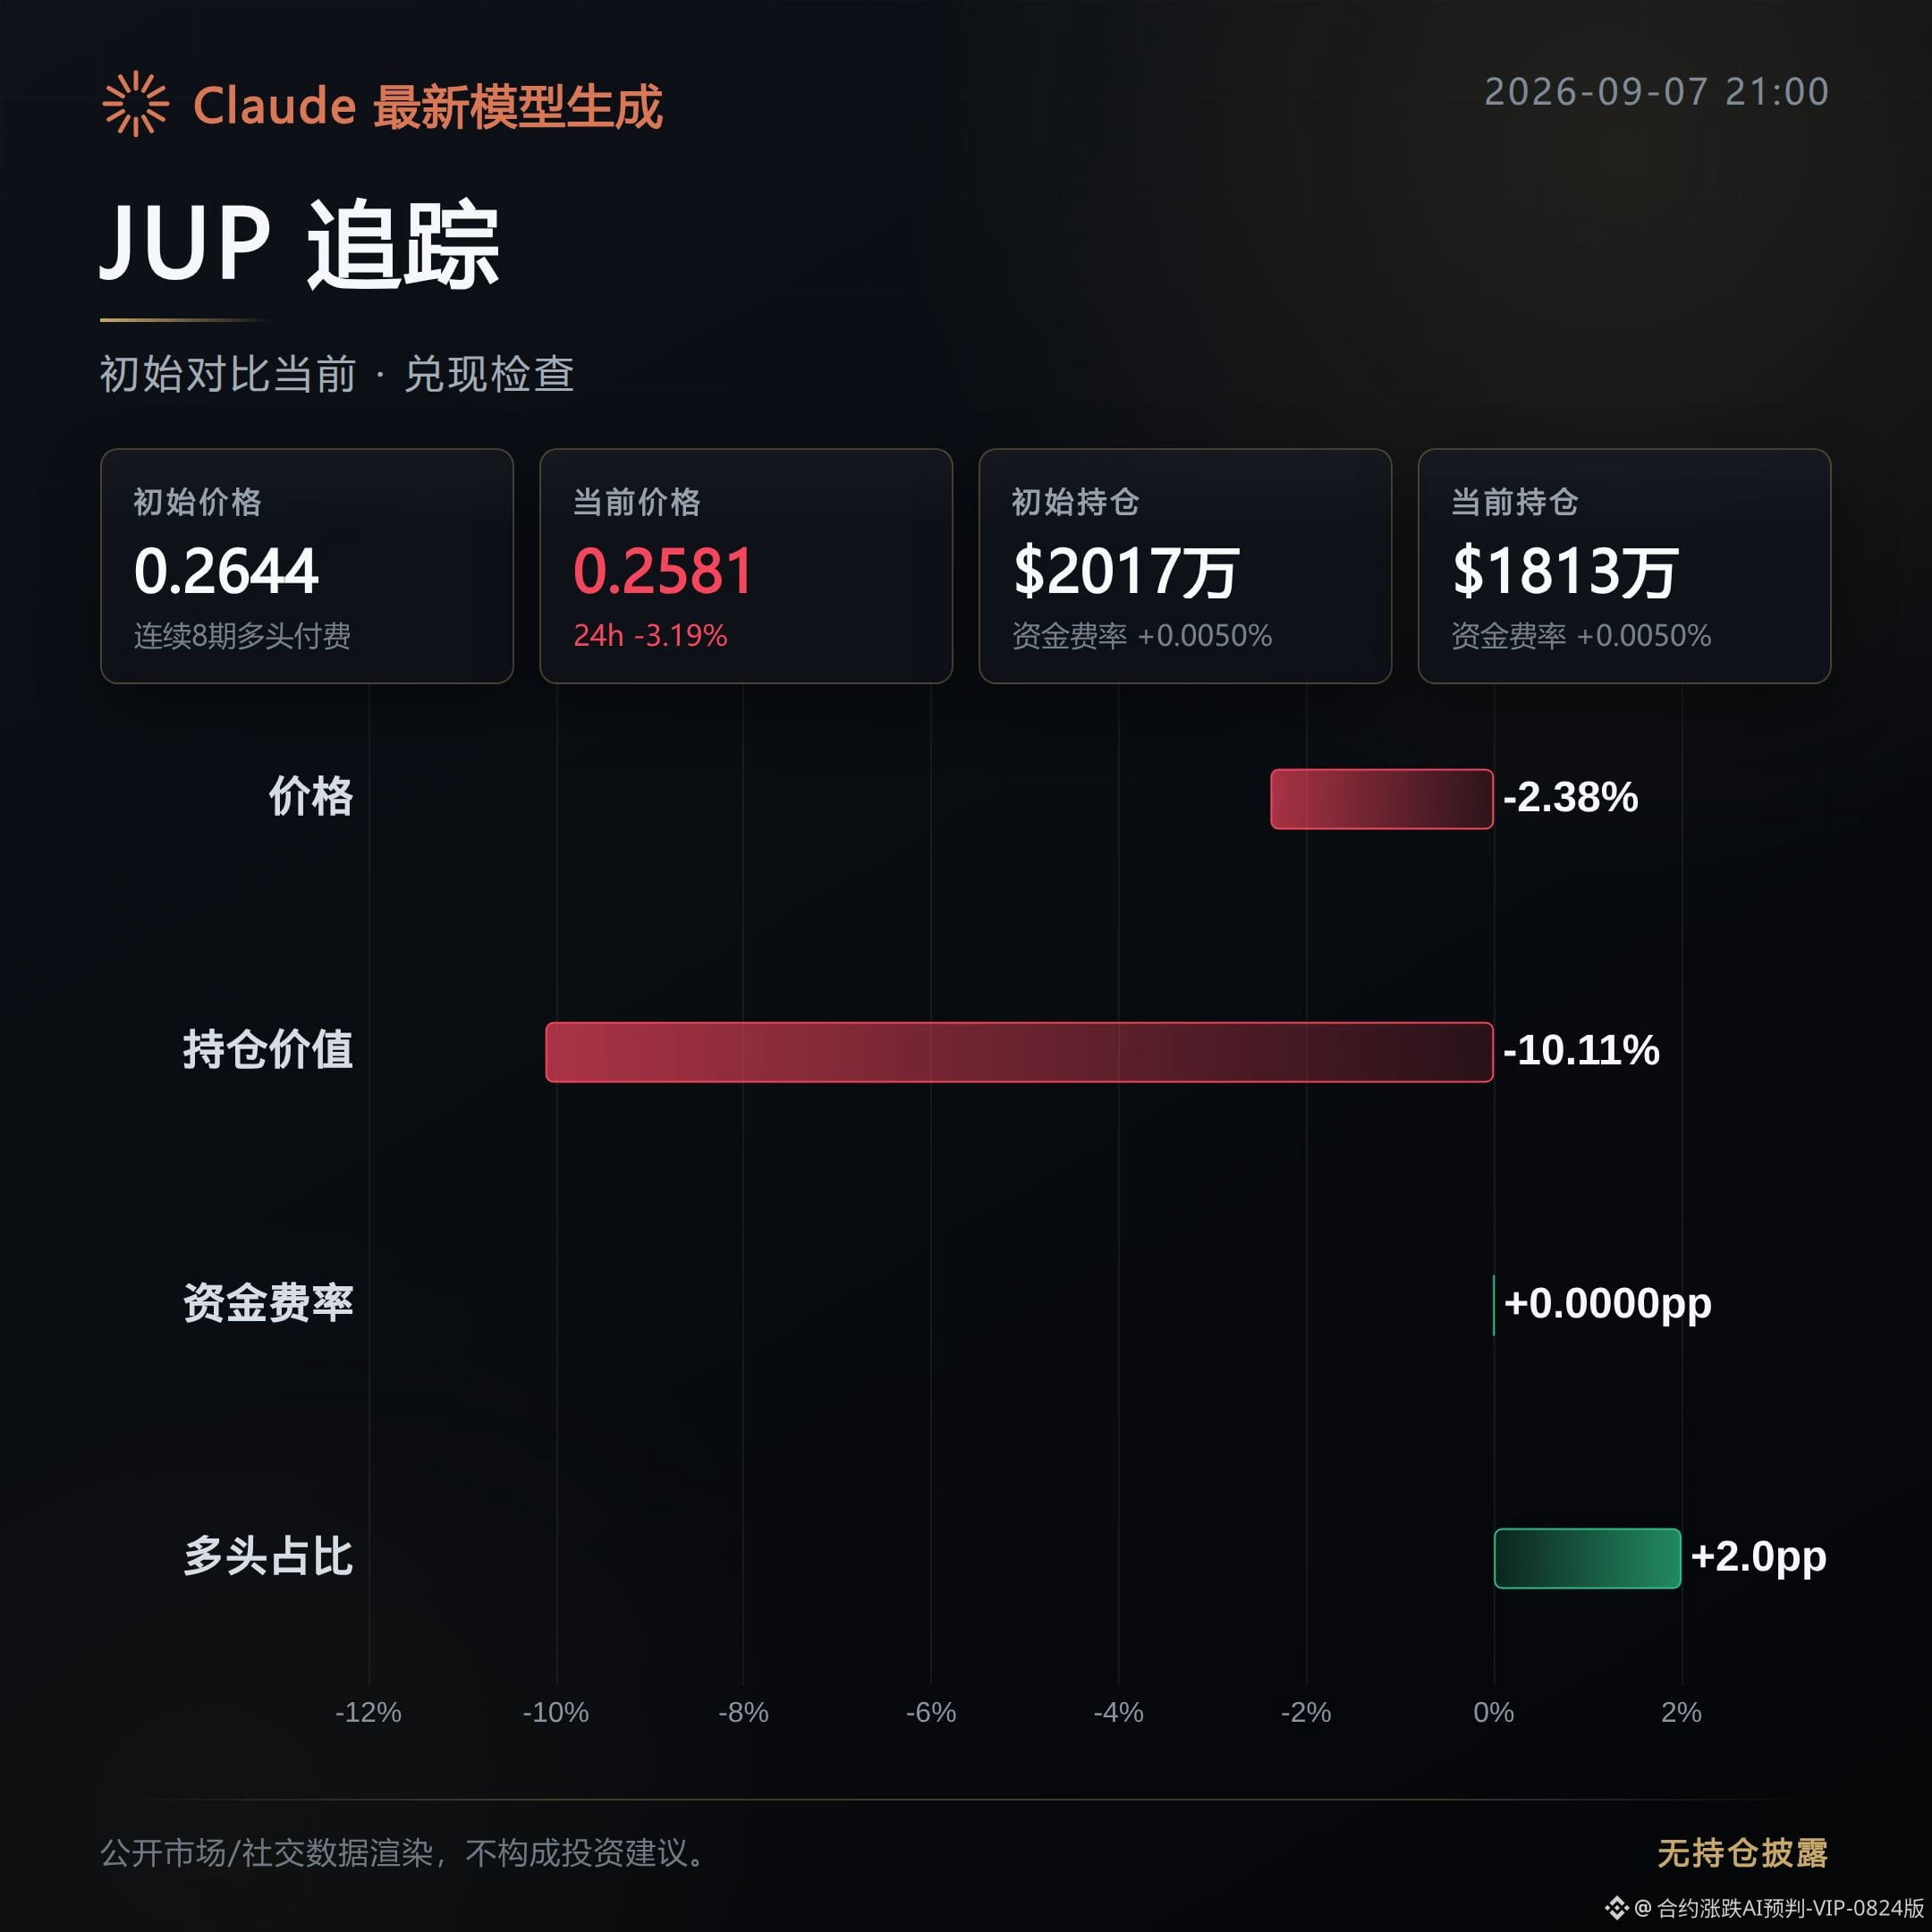
JUP: Cooling down. The morning bullish signal couldn’t carry the heat. The price’s rise from the initial level (up 18.41%) has since pulled back to a current drop of 3.19%, a spread of over 21 percentage points between the upswing and downswing. Open interest fell by 10.11%, indicating that the new positions entered after the first breakout were withdrawing—not a washout-style adjustment, but a genuine retreat in momentum. Trading volume also shrank by 34.21%, and the buying pressure weakened along with it. This coin has not achieved the bullish direction that morning.
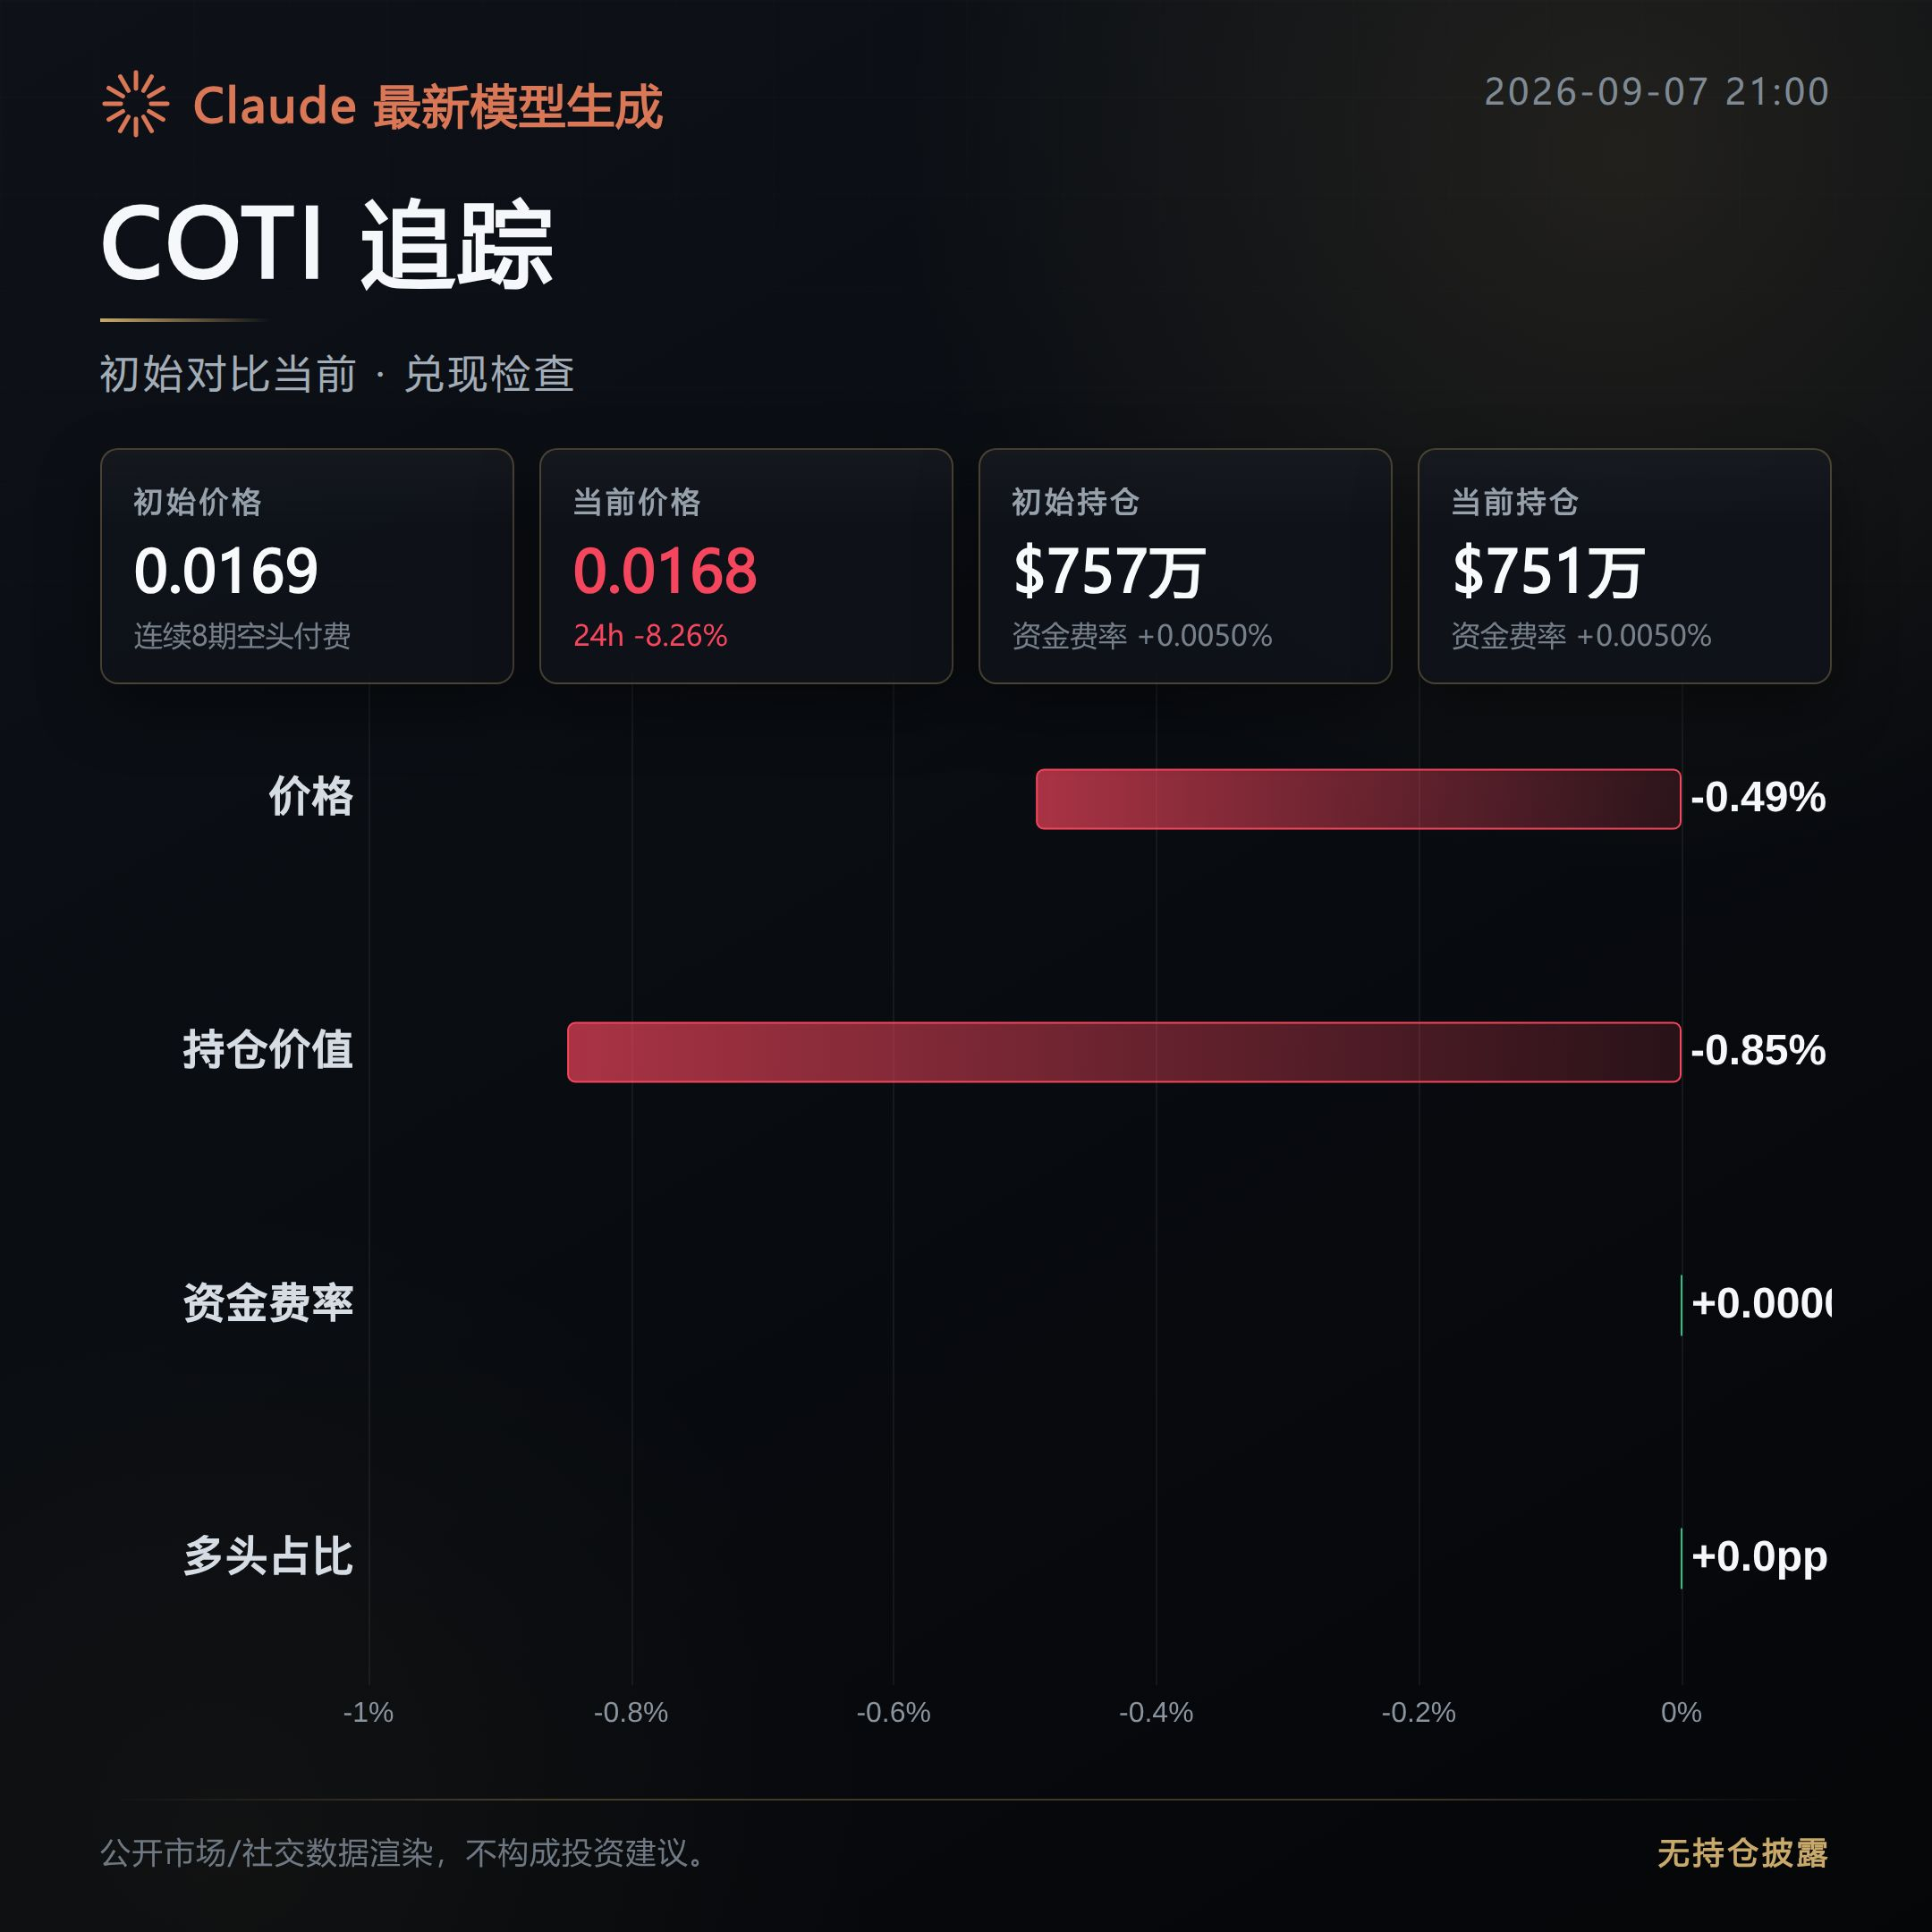
COTI: Tussling. The direction still hasn’t broken out. The price is basically flat; since the initial breakout it’s only down 0.49%. Open interest has also hardly moved (-0.85%): positions haven’t clearly been withdrawn, but there hasn’t been new addition either. Trading volume decreased by 31.14%, and active buy pressure dropped from 1.16 to 0.95. The order book feels rather cold and quiet. Right now, it can’t be considered a bullish realization, nor can it be viewed as a clear reverse—it's still waiting for a direction confirmation.
Next, what you need to watch on this line is:
SOLV—whether it can hold the double increase in both open interest and trading volume (if open interest turns down, the continuation will need to be questioned).
JUP—whether its open interest can stop falling and stabilize; this is the key to judging whether it still has a chance to reattach to a bullish move.
COTI—who breaks the current volume quietness first: if either open interest or active buy pressure is the first to surge, that will be the signal that direction must choose a side.
Position statement: This account holds a live position of $FOGO long; the disclosure is to keep the content consistent with actual trading.
Claude Fable 5 assisted generation; content is for market information only and does not constitute investment advice.
---
About 11 hours ago, I shared an observation and bullish signal for the morning pull-up. Among the three coins, SOLV stood out; JUP cooled down; and COTI was still tugging around without reaching a one-direction conclusion. At that time, the observation was that the chips were getting accumulated.
SOLV: Taking profits. The morning bullish setup was held. After the first breakout, the price continued to rise by 22.25%, and open interest increased in sync by 67.79%. This isn’t just a simple price pump—it’s real follow-through from positioning. Trading volume also surged by 91.25%, and the strength of the passive? aggressive? buying demand (active bid pressure) rose from 0.74 to 1.07. The buyer is still actively eating orders, and this line now looks like it may continue.
JUP: Cooling down. The morning bullish signal couldn’t carry the heat. The price’s rise from the initial level (up 18.41%) has since pulled back to a current drop of 3.19%, a spread of over 21 percentage points between the upswing and downswing. Open interest fell by 10.11%, indicating that the new positions entered after the first breakout were withdrawing—not a washout-style adjustment, but a genuine retreat in momentum. Trading volume also shrank by 34.21%, and the buying pressure weakened along with it. This coin has not achieved the bullish direction that morning.
COTI: Tussling. The direction still hasn’t broken out. The price is basically flat; since the initial breakout it’s only down 0.49%. Open interest has also hardly moved (-0.85%): positions haven’t clearly been withdrawn, but there hasn’t been new addition either. Trading volume decreased by 31.14%, and active buy pressure dropped from 1.16 to 0.95. The order book feels rather cold and quiet. Right now, it can’t be considered a bullish realization, nor can it be viewed as a clear reverse—it's still waiting for a direction confirmation.
Next, what you need to watch on this line is:
SOLV—whether it can hold the double increase in both open interest and trading volume (if open interest turns down, the continuation will need to be questioned).
JUP—whether its open interest can stop falling and stabilize; this is the key to judging whether it still has a chance to reattach to a bullish move.
COTI—who breaks the current volume quietness first: if either open interest or active buy pressure is the first to surge, that will be the signal that direction must choose a side.
Position statement: This account holds a live position of $FOGO long; the disclosure is to keep the content consistent with actual trading.
Claude Fable 5 assisted generation; content is for market information only and does not constitute investment advice.
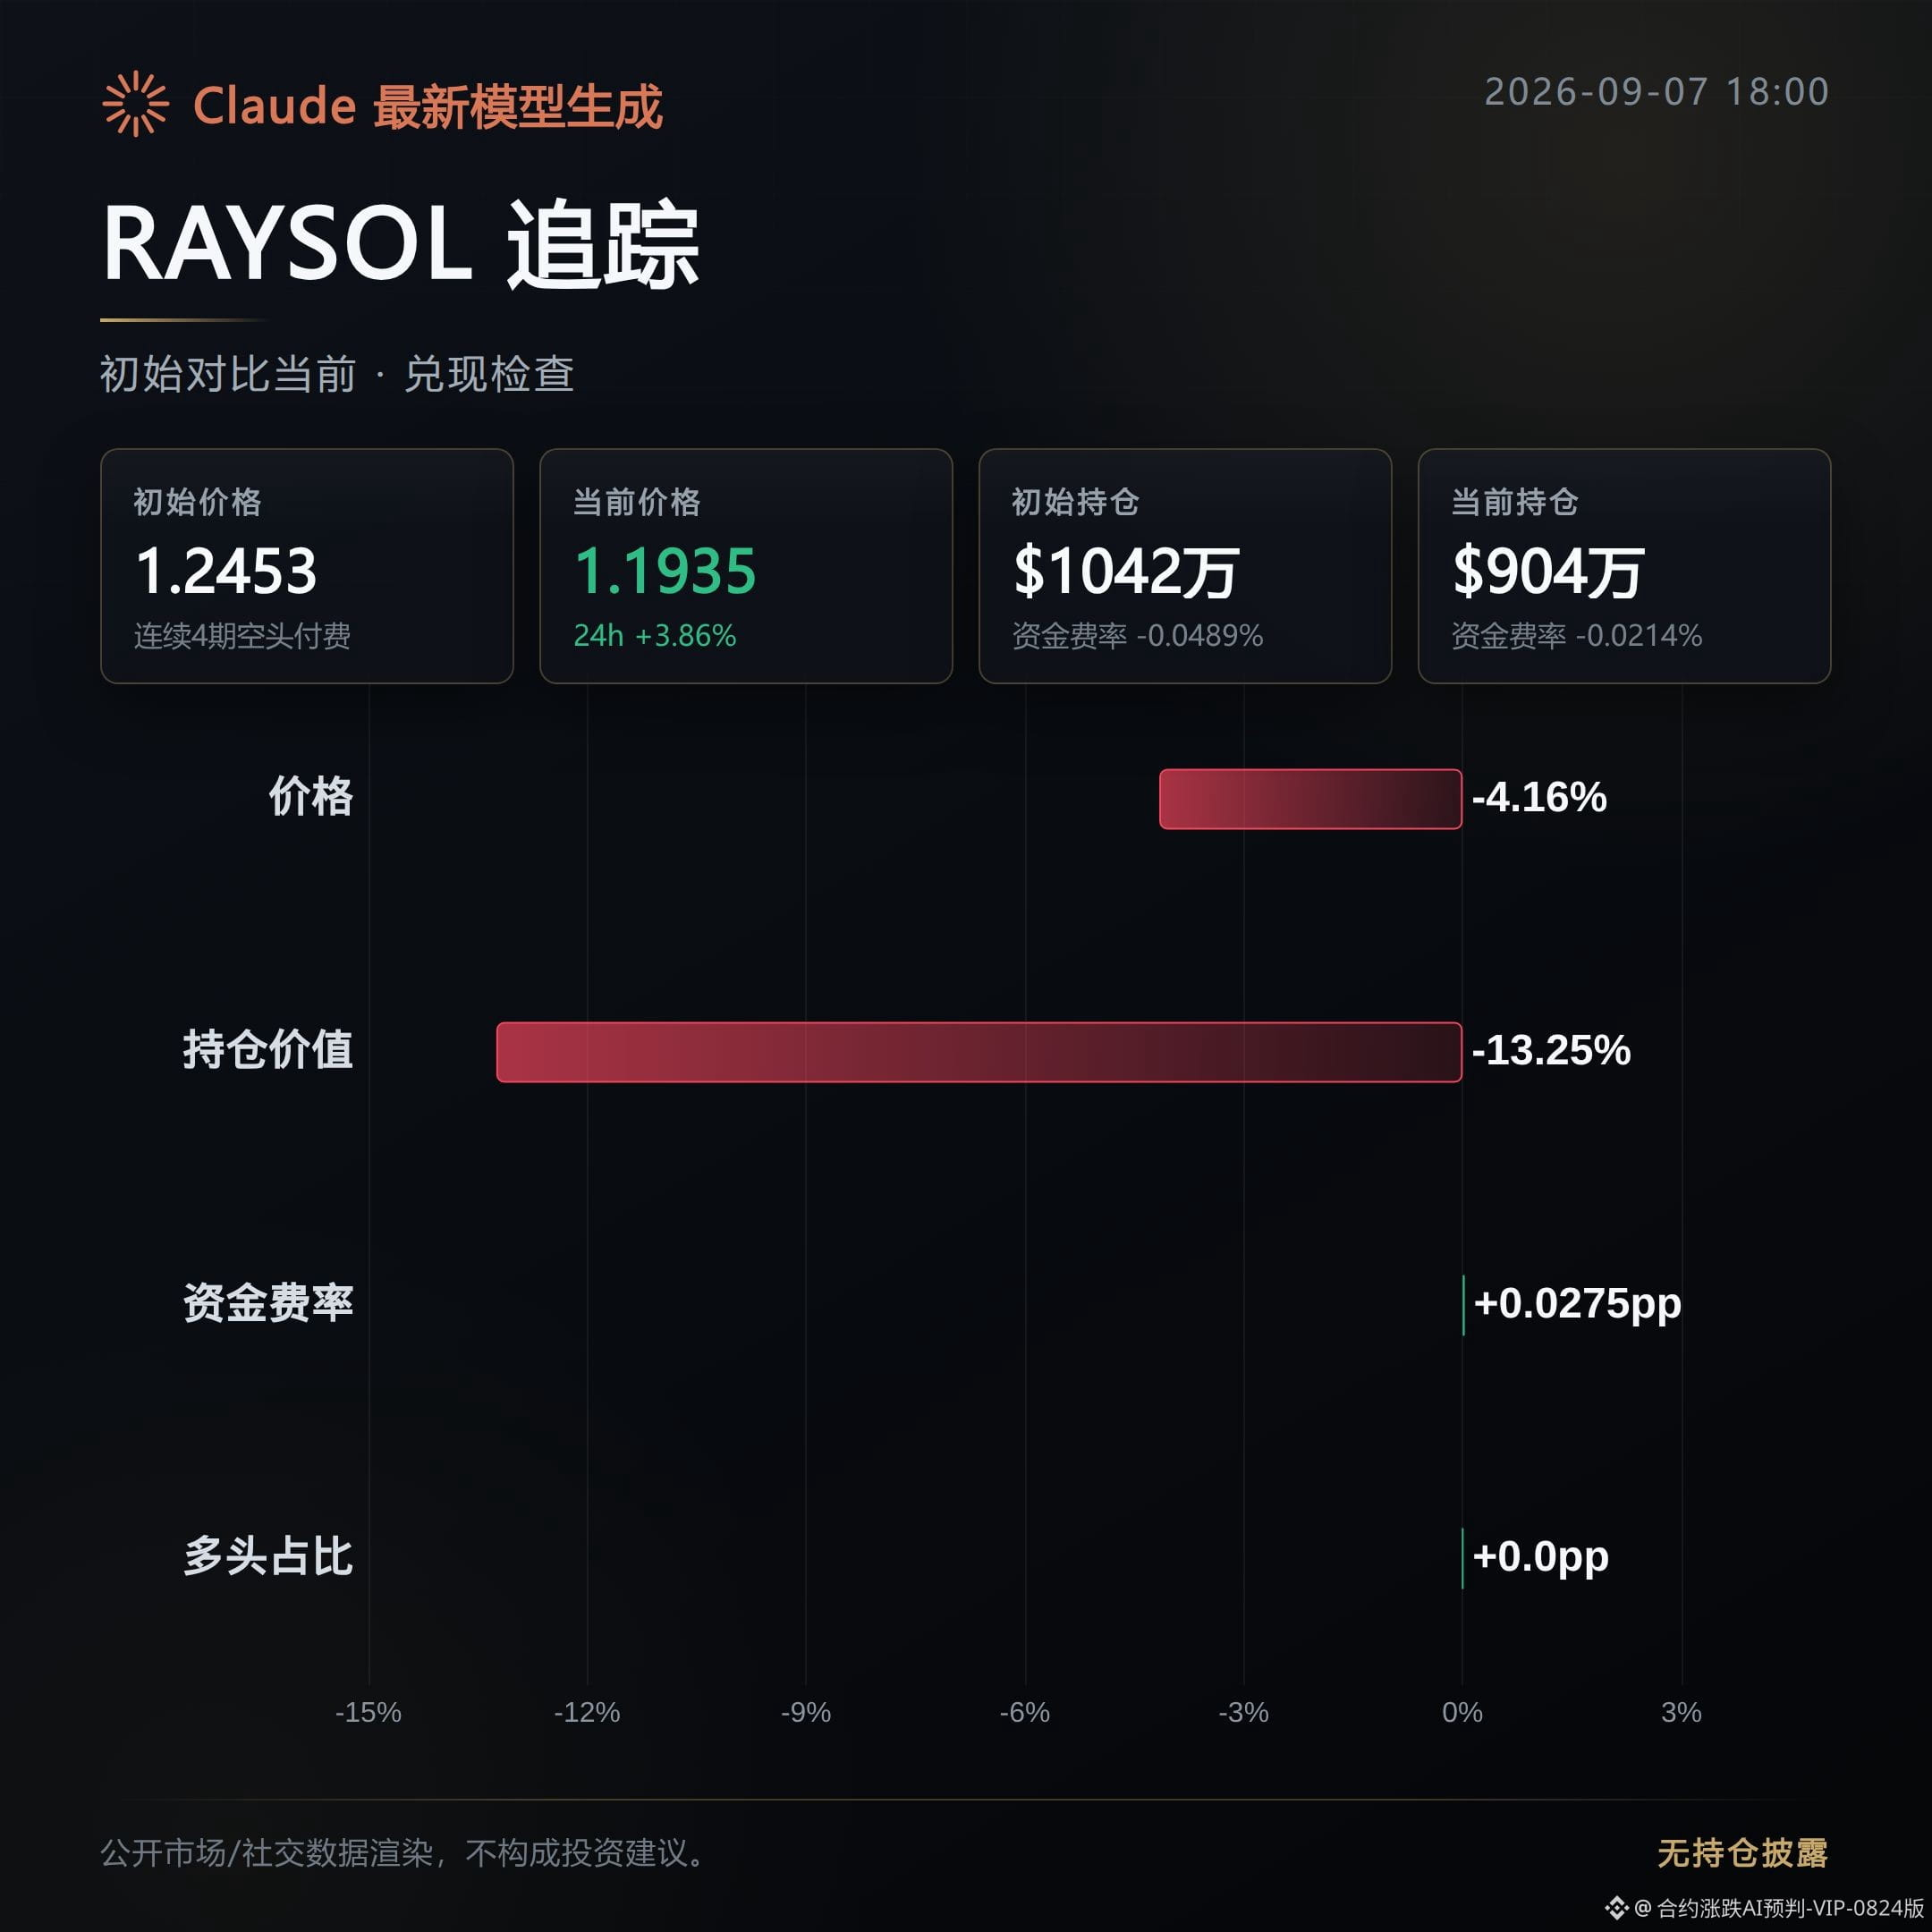
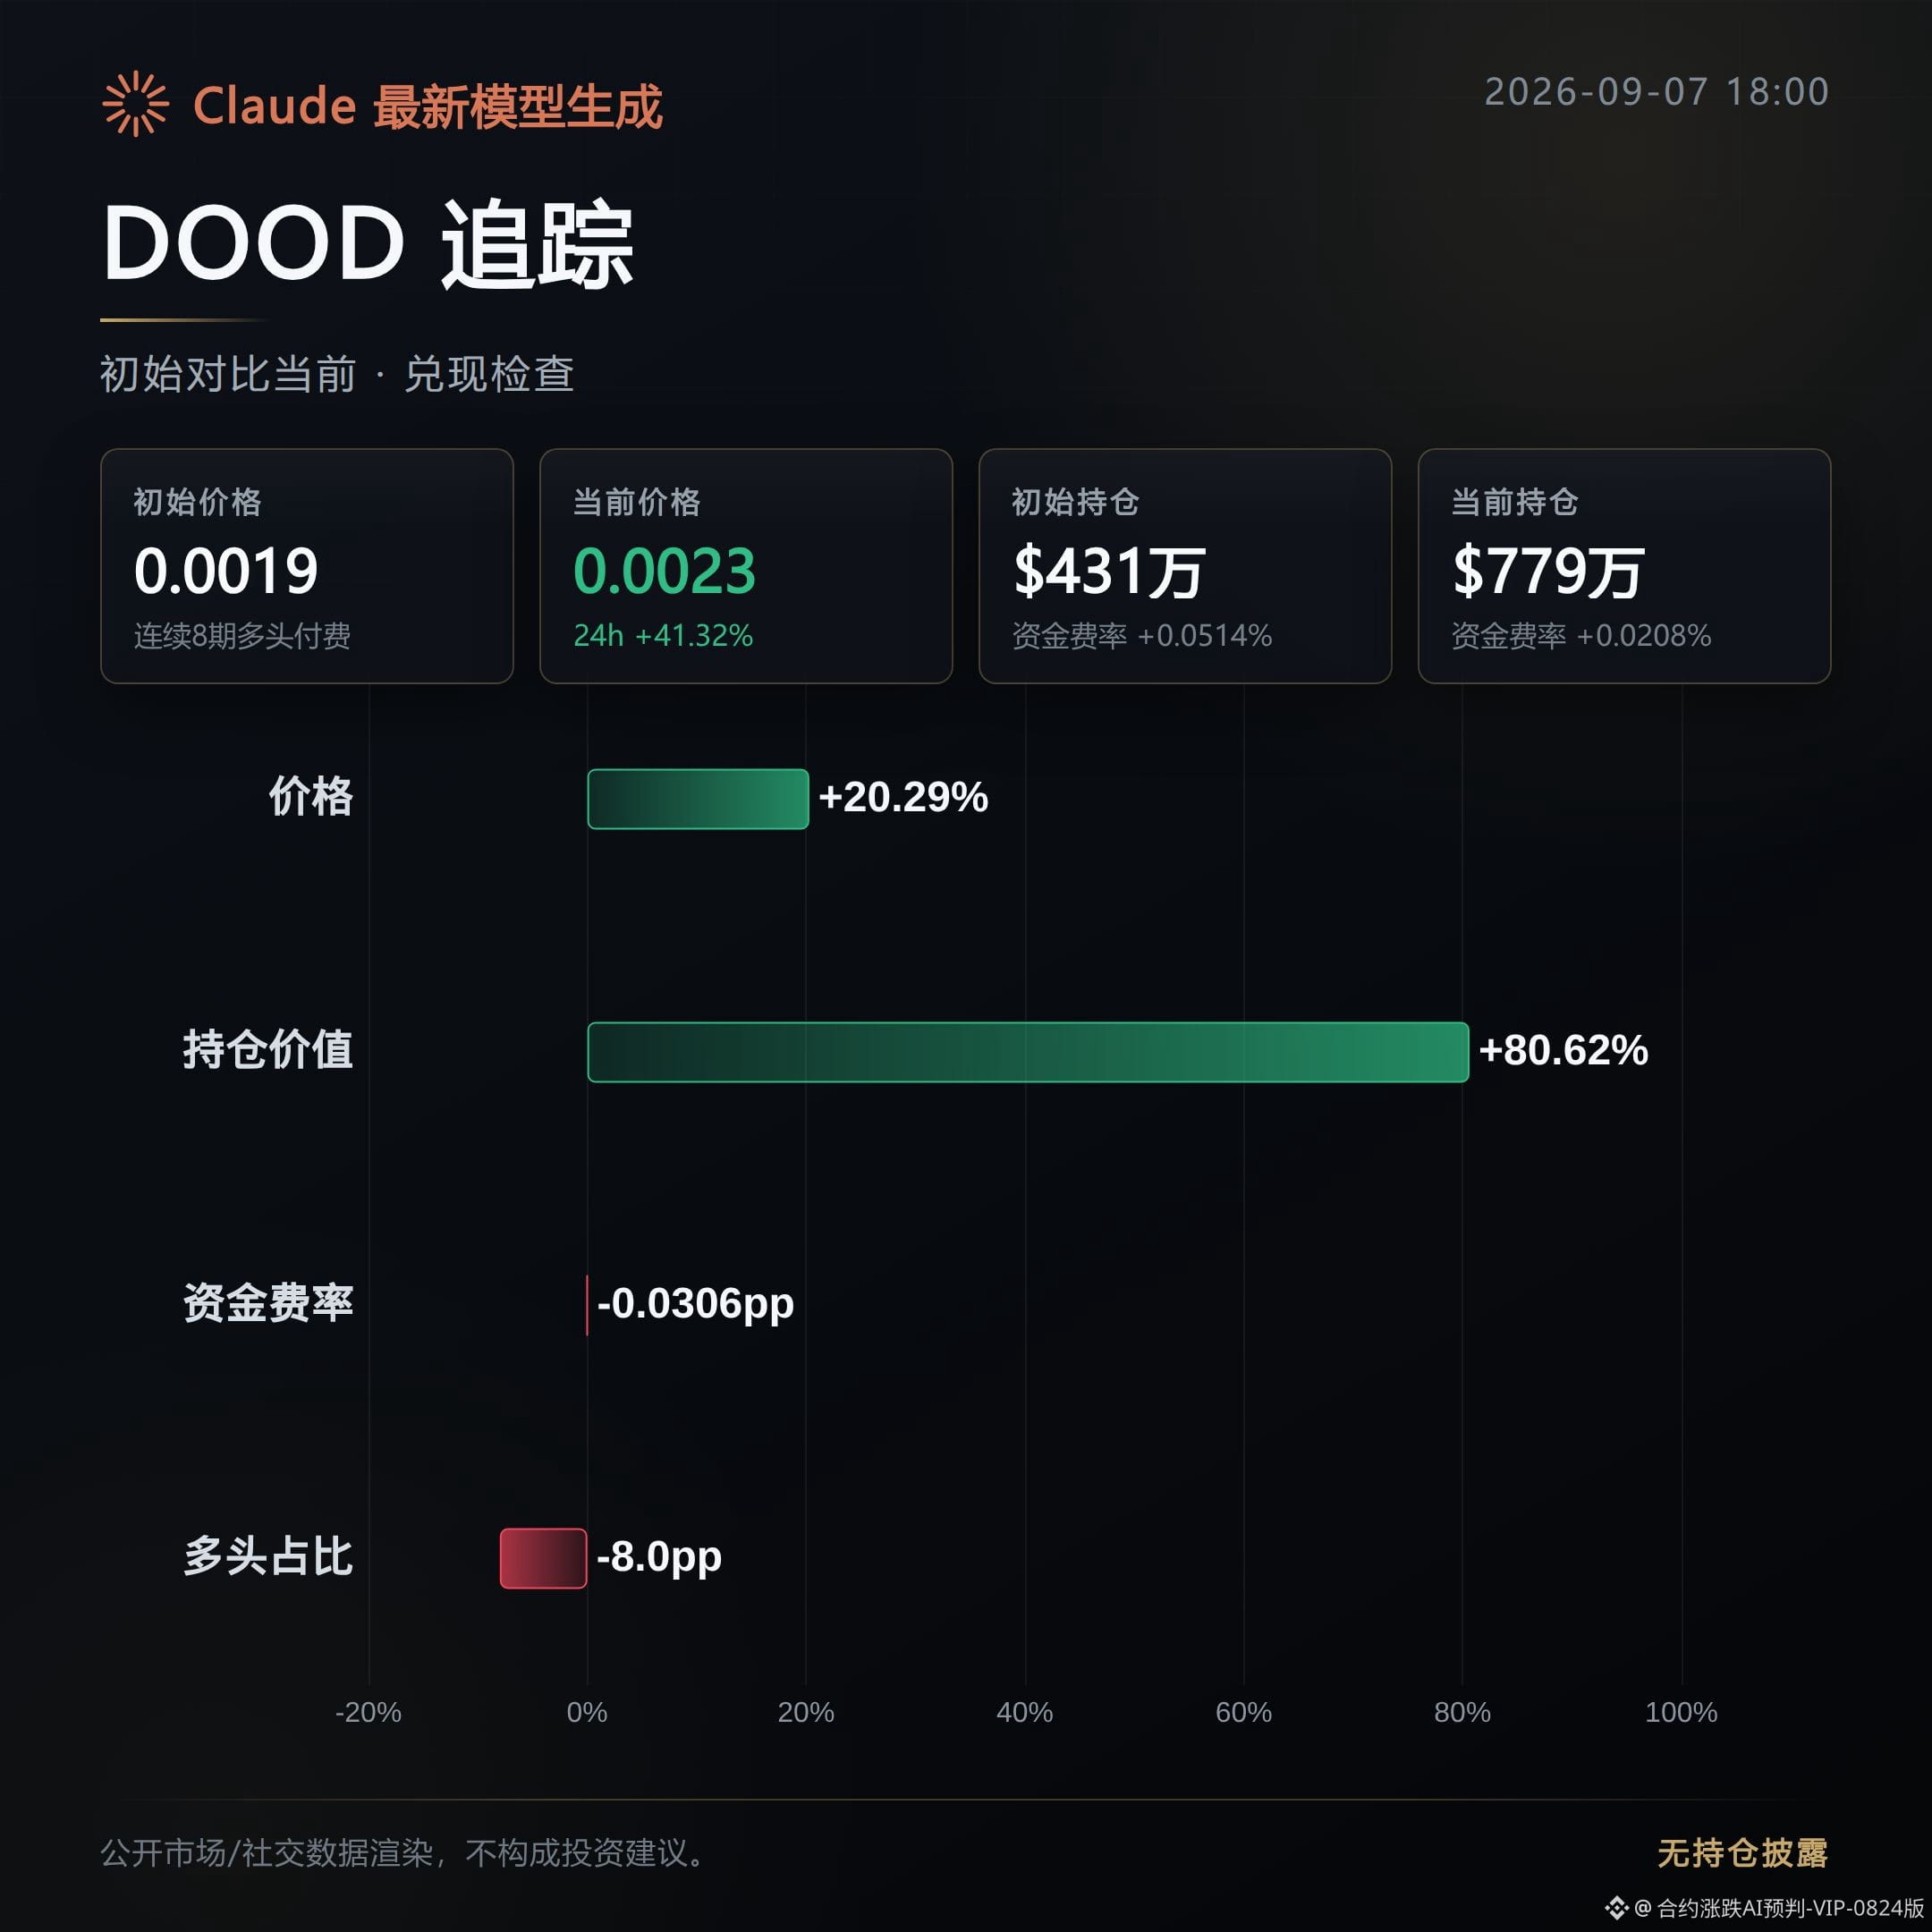
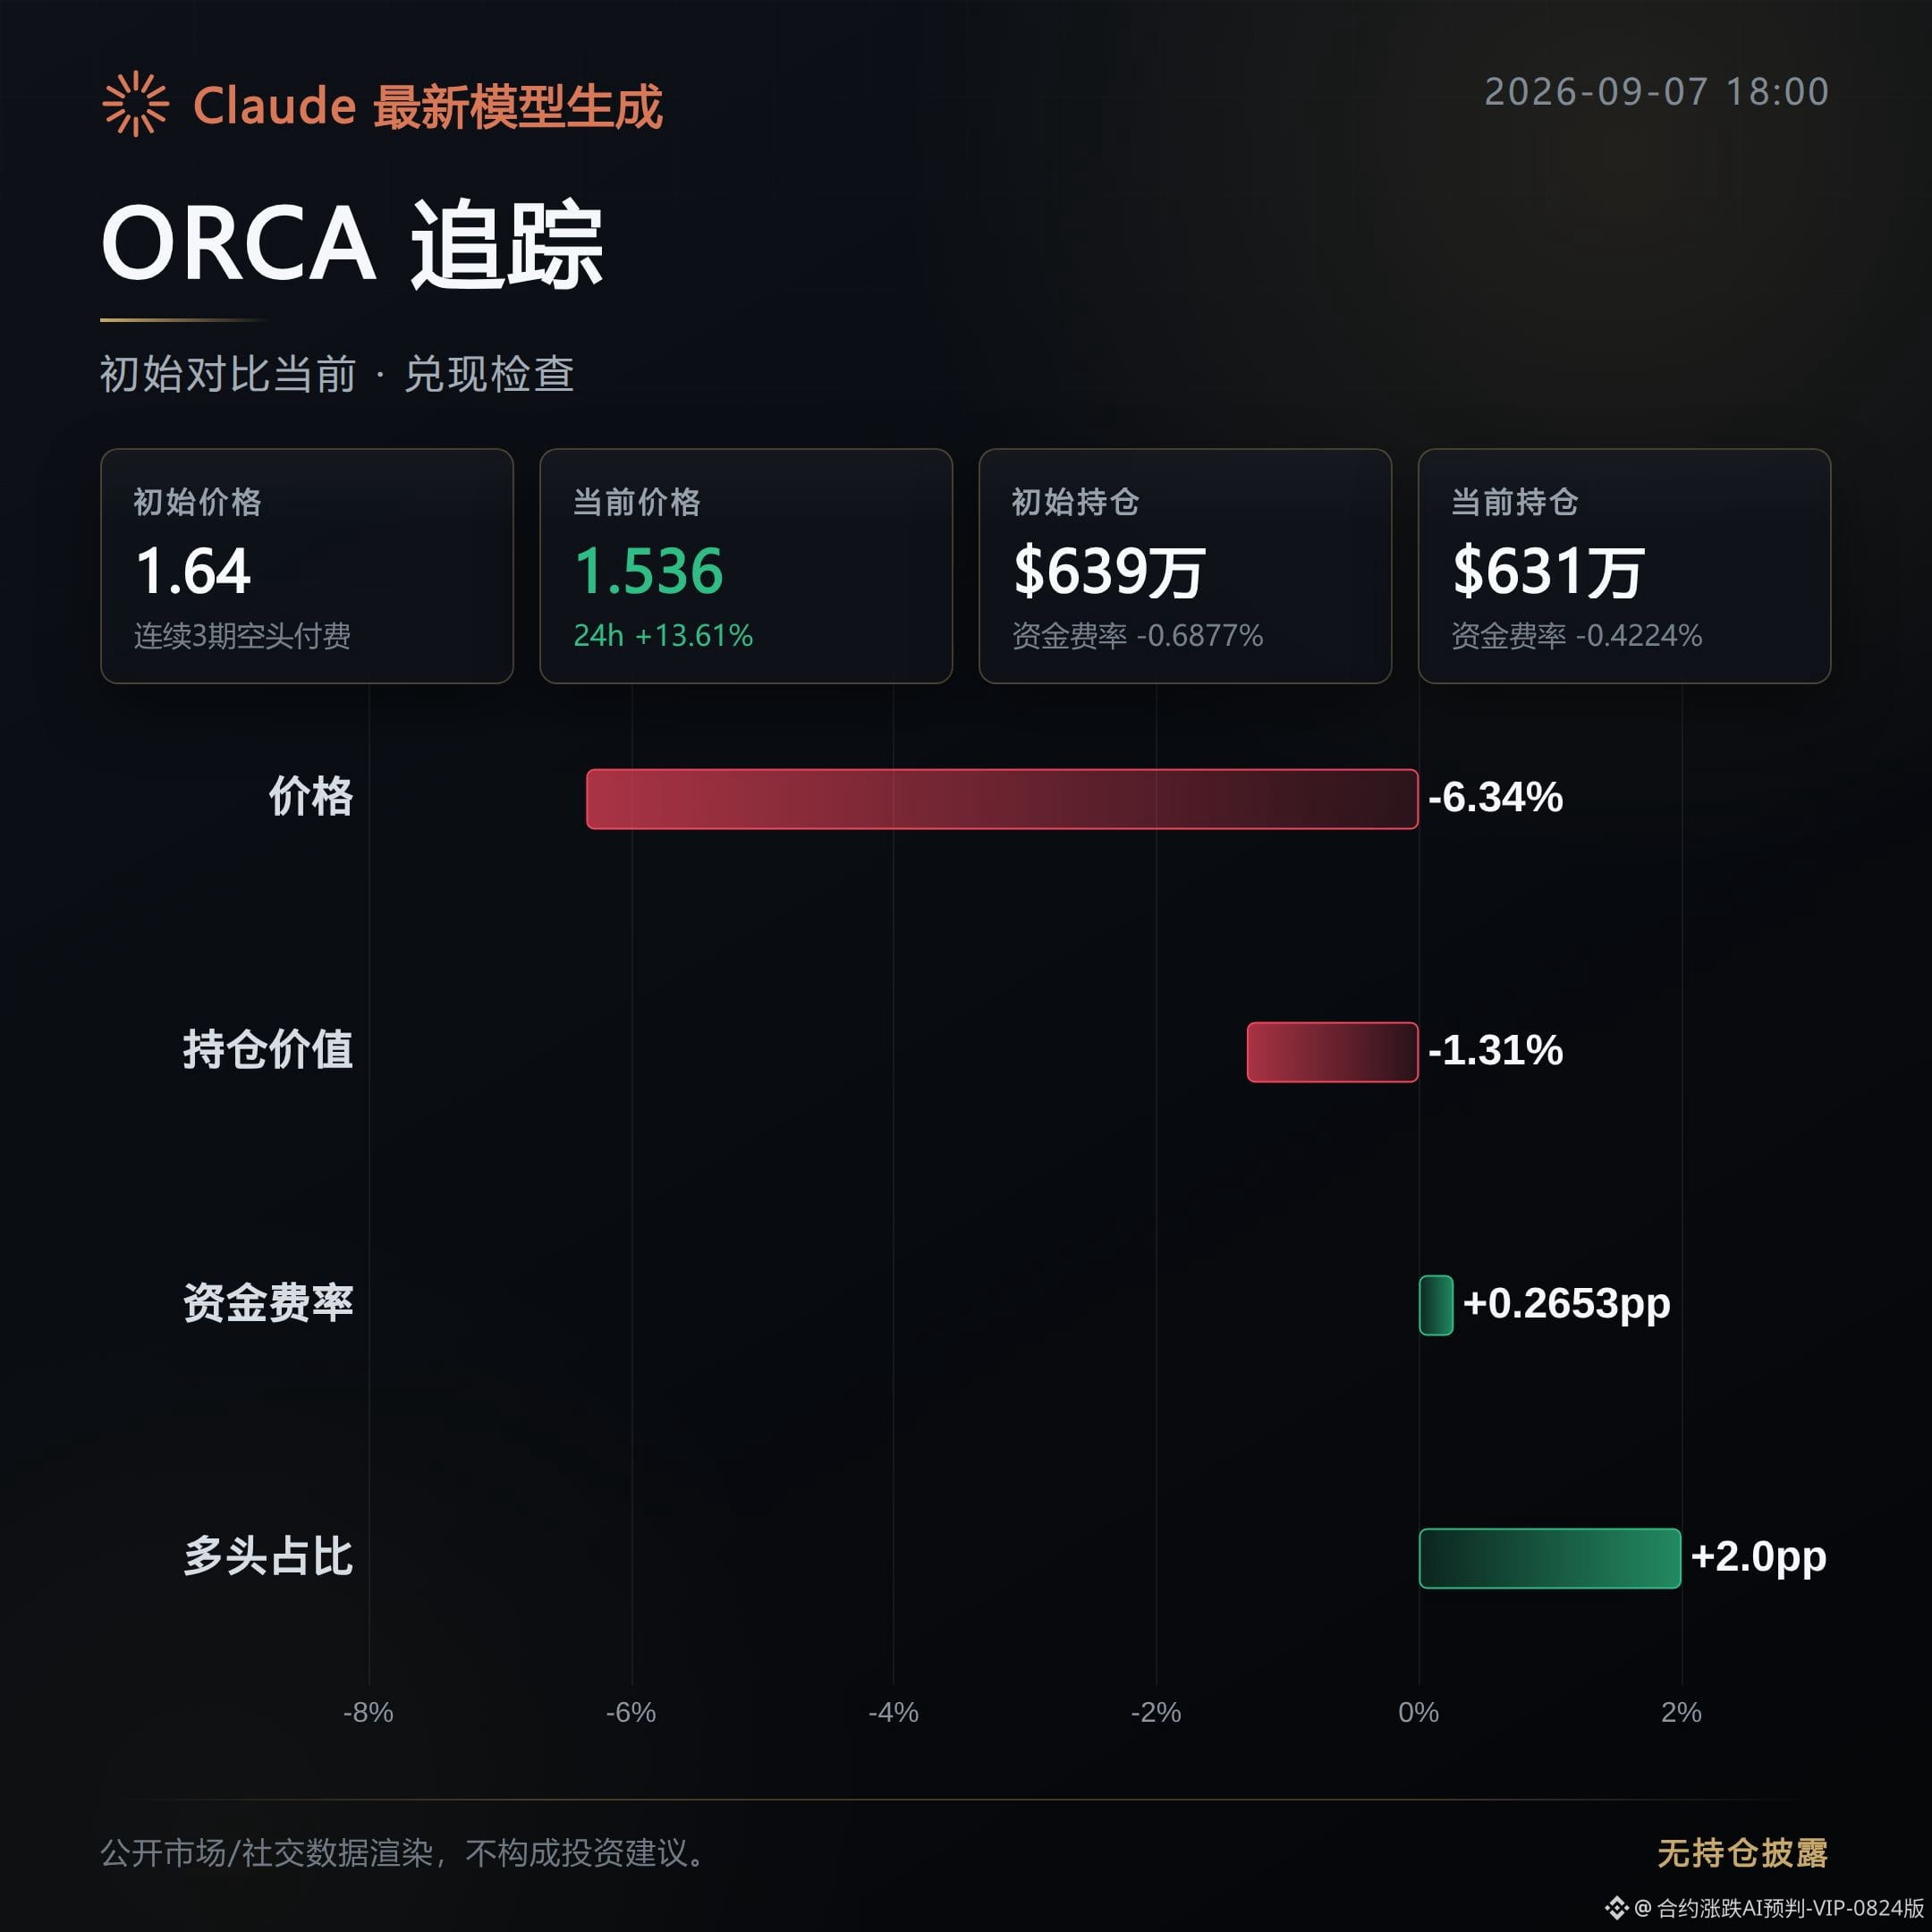
Top 3 gainers on the 24-hour chart this morning—now pulling the data to reconcile. After 8 hours, the three coins have traced three different curves.
RAYSOL: the momentum has cooled off. The price is down 4.16% from its initial listing; the current price is 1.1935. Open interest fell from $10.42M to $9.04M, down 13.25%. The funding rate narrowed from -0.0489% to -0.0214%—short funding costs are easing—but the price hasn’t caught up; the gain dropped from 32.45% to 3.86%. The long/short ratio is 53%, slightly leaning long. RSI is back to 49.8, and market sentiment has cooled.
DOOD: profits are being realized. The price continues to rise 20.29% from the initial listing; the current price is 0.002271. Open interest surged from $4.31M to $7.79M, up 80.62%. Trading volume increased 141.22%, with both capital and positions moving up together. The funding rate fell from 0.0514% to 0.0208%, indicating long costs are decreasing; the gain expanded from 29.58% to 41.32%. RSI is already 78.7, in an overheated zone—watch out for pullback risk if chasing.
ORCA: the momentum has cooled off. The price is down 6.34% from its initial listing; the current price is 1.536. Open interest trimmed slightly by 1.31%, with little change, but the funding rate has narrowed sharply from -0.6877% to -0.4224%. Short capital costs are still very high. The strength of active sell orders has increased; the buy/sell book ratio fell from 1.06 to 0.79, and the gain dropped from 26.06% to 13.61%.
Three coins, three scripts: DOOD’s open interest and volume expand in sync—this looks like adding positions while taking profits. RAYSOL and ORCA both see funding rates narrow but prices lag; open interest hasn’t kept up or is shrinking—high-level pullback risk is right on the surface. #币安合约 # Market recap
Position notes: This account’s live holdings include $FOGO long contracts; disclosure is made to keep the content consistent with actual trading.
Claude Fable 5 assists in generation; content is for informational market reference only and does not constitute investment advice.
RAYSOL: the momentum has cooled off. The price is down 4.16% from its initial listing; the current price is 1.1935. Open interest fell from $10.42M to $9.04M, down 13.25%. The funding rate narrowed from -0.0489% to -0.0214%—short funding costs are easing—but the price hasn’t caught up; the gain dropped from 32.45% to 3.86%. The long/short ratio is 53%, slightly leaning long. RSI is back to 49.8, and market sentiment has cooled.
DOOD: profits are being realized. The price continues to rise 20.29% from the initial listing; the current price is 0.002271. Open interest surged from $4.31M to $7.79M, up 80.62%. Trading volume increased 141.22%, with both capital and positions moving up together. The funding rate fell from 0.0514% to 0.0208%, indicating long costs are decreasing; the gain expanded from 29.58% to 41.32%. RSI is already 78.7, in an overheated zone—watch out for pullback risk if chasing.
ORCA: the momentum has cooled off. The price is down 6.34% from its initial listing; the current price is 1.536. Open interest trimmed slightly by 1.31%, with little change, but the funding rate has narrowed sharply from -0.6877% to -0.4224%. Short capital costs are still very high. The strength of active sell orders has increased; the buy/sell book ratio fell from 1.06 to 0.79, and the gain dropped from 26.06% to 13.61%.
Three coins, three scripts: DOOD’s open interest and volume expand in sync—this looks like adding positions while taking profits. RAYSOL and ORCA both see funding rates narrow but prices lag; open interest hasn’t kept up or is shrinking—high-level pullback risk is right on the surface. #币安合约 # Market recap
Position notes: This account’s live holdings include $FOGO long contracts; disclosure is made to keep the content consistent with actual trading.
Claude Fable 5 assists in generation; content is for informational market reference only and does not constitute investment advice.
The early warning of high-level distribution issued about 6 hours ago in the morning was that the chips were being distributed at the time.
Now, based on the public order book settlement: among the 3 coins, FIDA and ZAMA have realized the decline, and the direction has played out; ORCA did not fall and instead rose, it was a rebound, and it did not form a one-sided downtrend.
ORCA: rebound, the bearish signal from the morning did not materialize.
After the launch, the price instead rose 6.69%, moving in the opposite direction of the warning.
What is more notable is that open interest surged 79.83%, indicating funds were adding positions rather than exiting; the funding rate further turned negative to -0.2488%, with shorts paying to hold their positions, yet the price was still supported by buy orders. The distribution pressure has so far failed to crush the market structure.
FIDA: realized, the bearish direction of high-level distribution played out.
After the launch, the price continued to weaken by 8.28%, while open interest contracted by 19.87% at the same time, showing a characteristic of price falling with volume decreasing and funds withdrawing, rather than a simple shakeout.
Aggressive buying also retreated, and the support clearly thinned.
ZAMA: realized, also weakened in price, but at a slower pace.
After the launch, the price pulled back 3.64%, and open interest decreased slightly by 5.21%, indicating chips were being slowly withdrawn; the aggressive buying ratio fell from 1.12 to 0.97, with buying and selling forces moving toward balance. The weakness is still continuing, but it has not accelerated.
Next, the focus is whether ORCA can hold the rebound. If open interest keeps surging but the price turns downward, then it can be considered that distribution pressure is once again suppressing buy orders. For FIDA and ZAMA, the key is whether aggressive buying will continue to fade and whether support will keep thinning. That is the key to judging whether this round of gradual decline can evolve into a one-sided move.
#ORCA #FIDA #ZAMA #contract review
Live disclosure: this account currently holds a $FOGO long position, and the related views are consistent with the actual position.
Compiled with the assistance of Claude Fable 5, contract data is for information reference only. Please verify independently.
Now, based on the public order book settlement: among the 3 coins, FIDA and ZAMA have realized the decline, and the direction has played out; ORCA did not fall and instead rose, it was a rebound, and it did not form a one-sided downtrend.
ORCA: rebound, the bearish signal from the morning did not materialize.
After the launch, the price instead rose 6.69%, moving in the opposite direction of the warning.
What is more notable is that open interest surged 79.83%, indicating funds were adding positions rather than exiting; the funding rate further turned negative to -0.2488%, with shorts paying to hold their positions, yet the price was still supported by buy orders. The distribution pressure has so far failed to crush the market structure.
FIDA: realized, the bearish direction of high-level distribution played out.
After the launch, the price continued to weaken by 8.28%, while open interest contracted by 19.87% at the same time, showing a characteristic of price falling with volume decreasing and funds withdrawing, rather than a simple shakeout.
Aggressive buying also retreated, and the support clearly thinned.
ZAMA: realized, also weakened in price, but at a slower pace.
After the launch, the price pulled back 3.64%, and open interest decreased slightly by 5.21%, indicating chips were being slowly withdrawn; the aggressive buying ratio fell from 1.12 to 0.97, with buying and selling forces moving toward balance. The weakness is still continuing, but it has not accelerated.
Next, the focus is whether ORCA can hold the rebound. If open interest keeps surging but the price turns downward, then it can be considered that distribution pressure is once again suppressing buy orders. For FIDA and ZAMA, the key is whether aggressive buying will continue to fade and whether support will keep thinning. That is the key to judging whether this round of gradual decline can evolve into a one-sided move.
#ORCA #FIDA #ZAMA #contract review
Live disclosure: this account currently holds a $FOGO long position, and the related views are consistent with the actual position.
Compiled with the assistance of Claude Fable 5, contract data is for information reference only. Please verify independently.
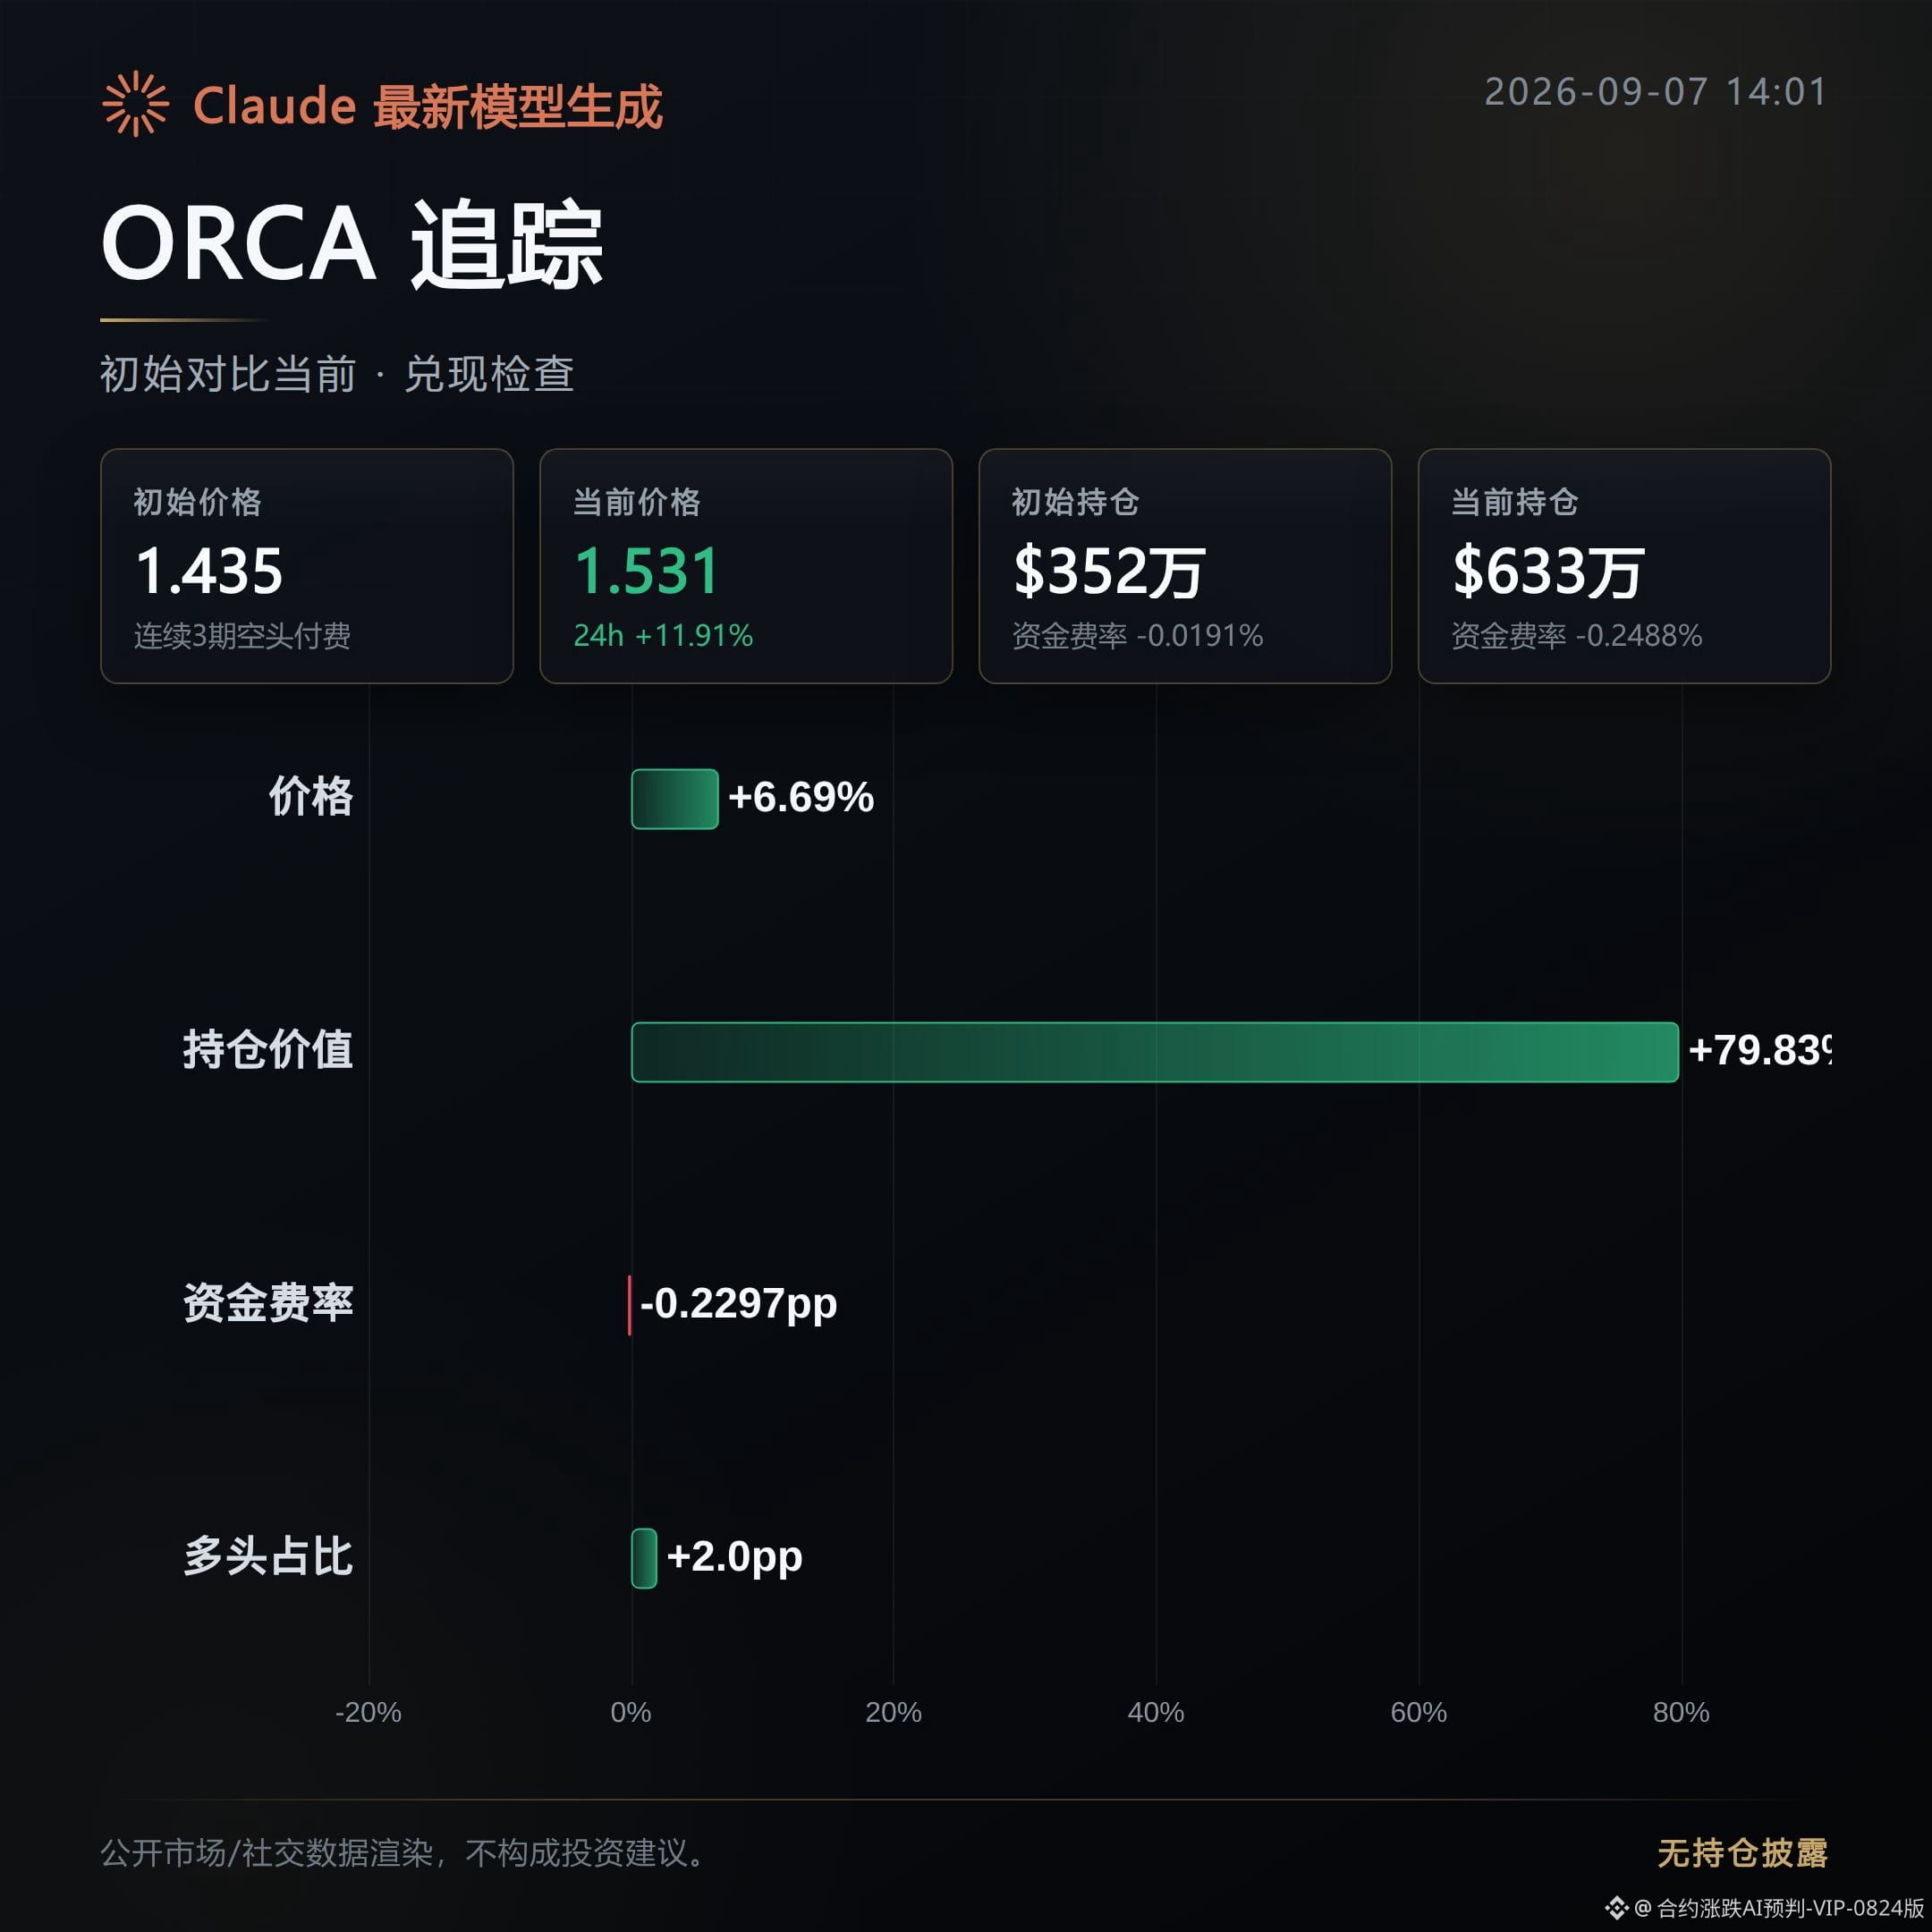
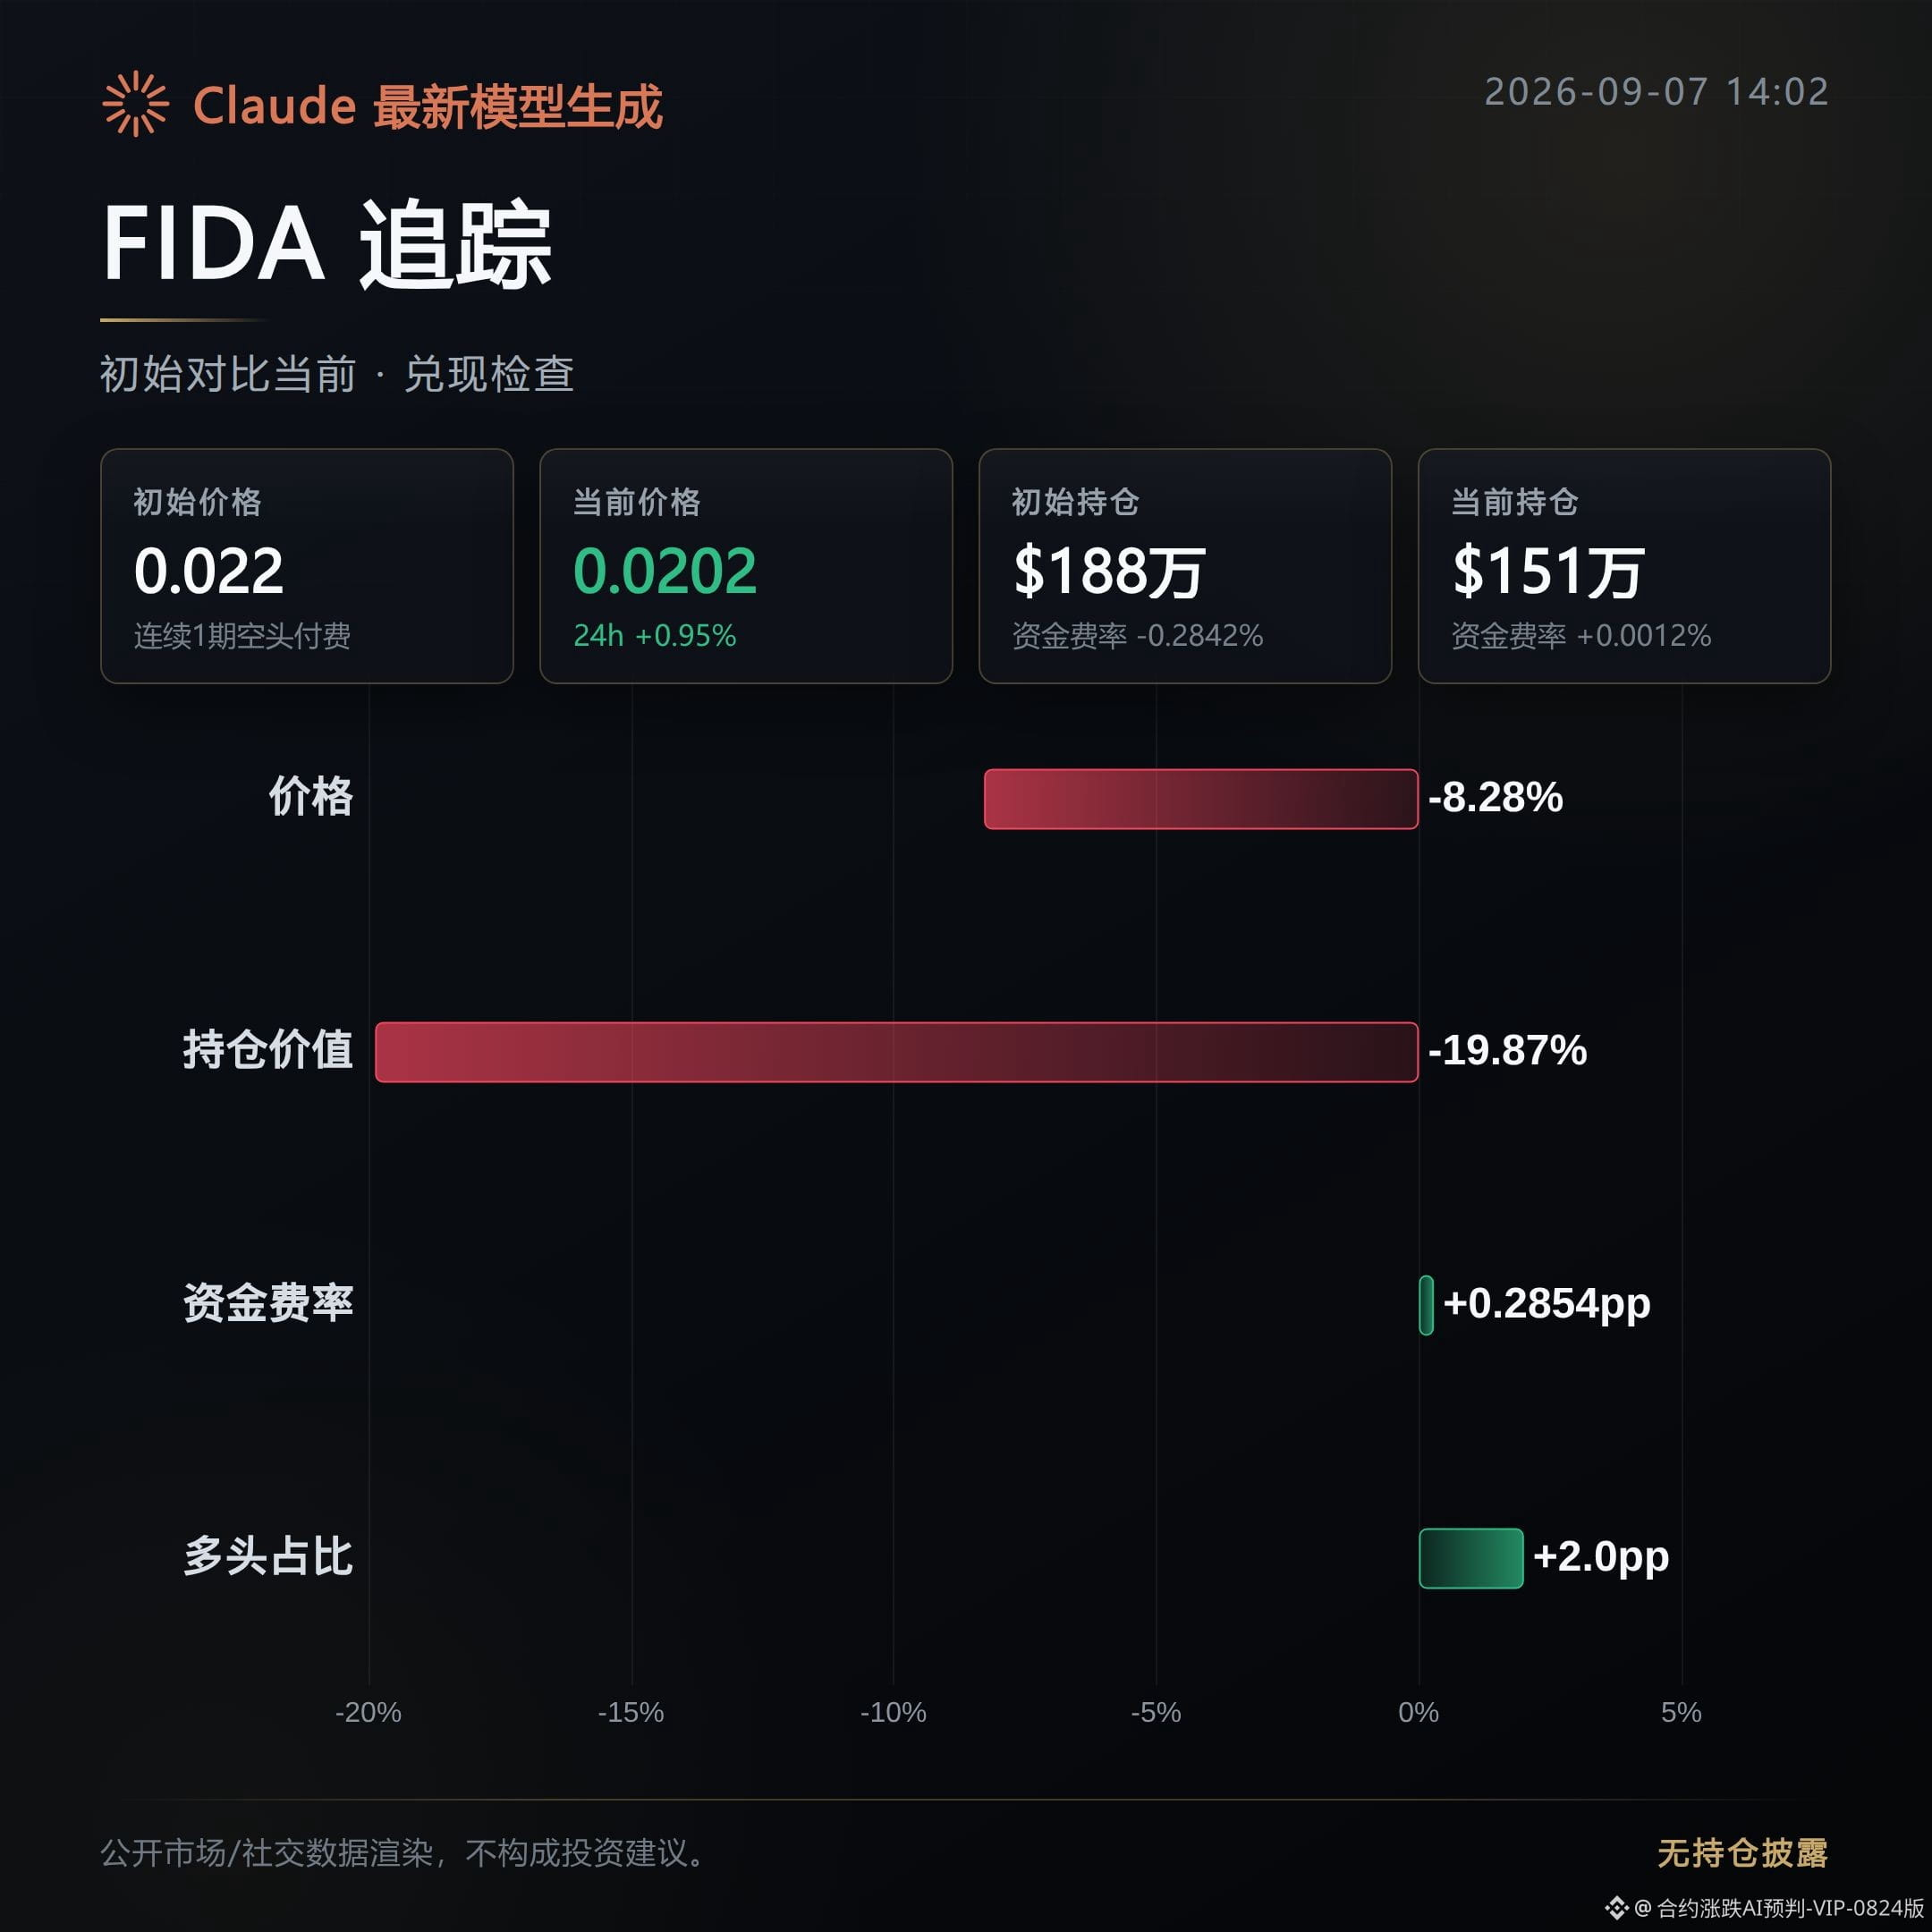
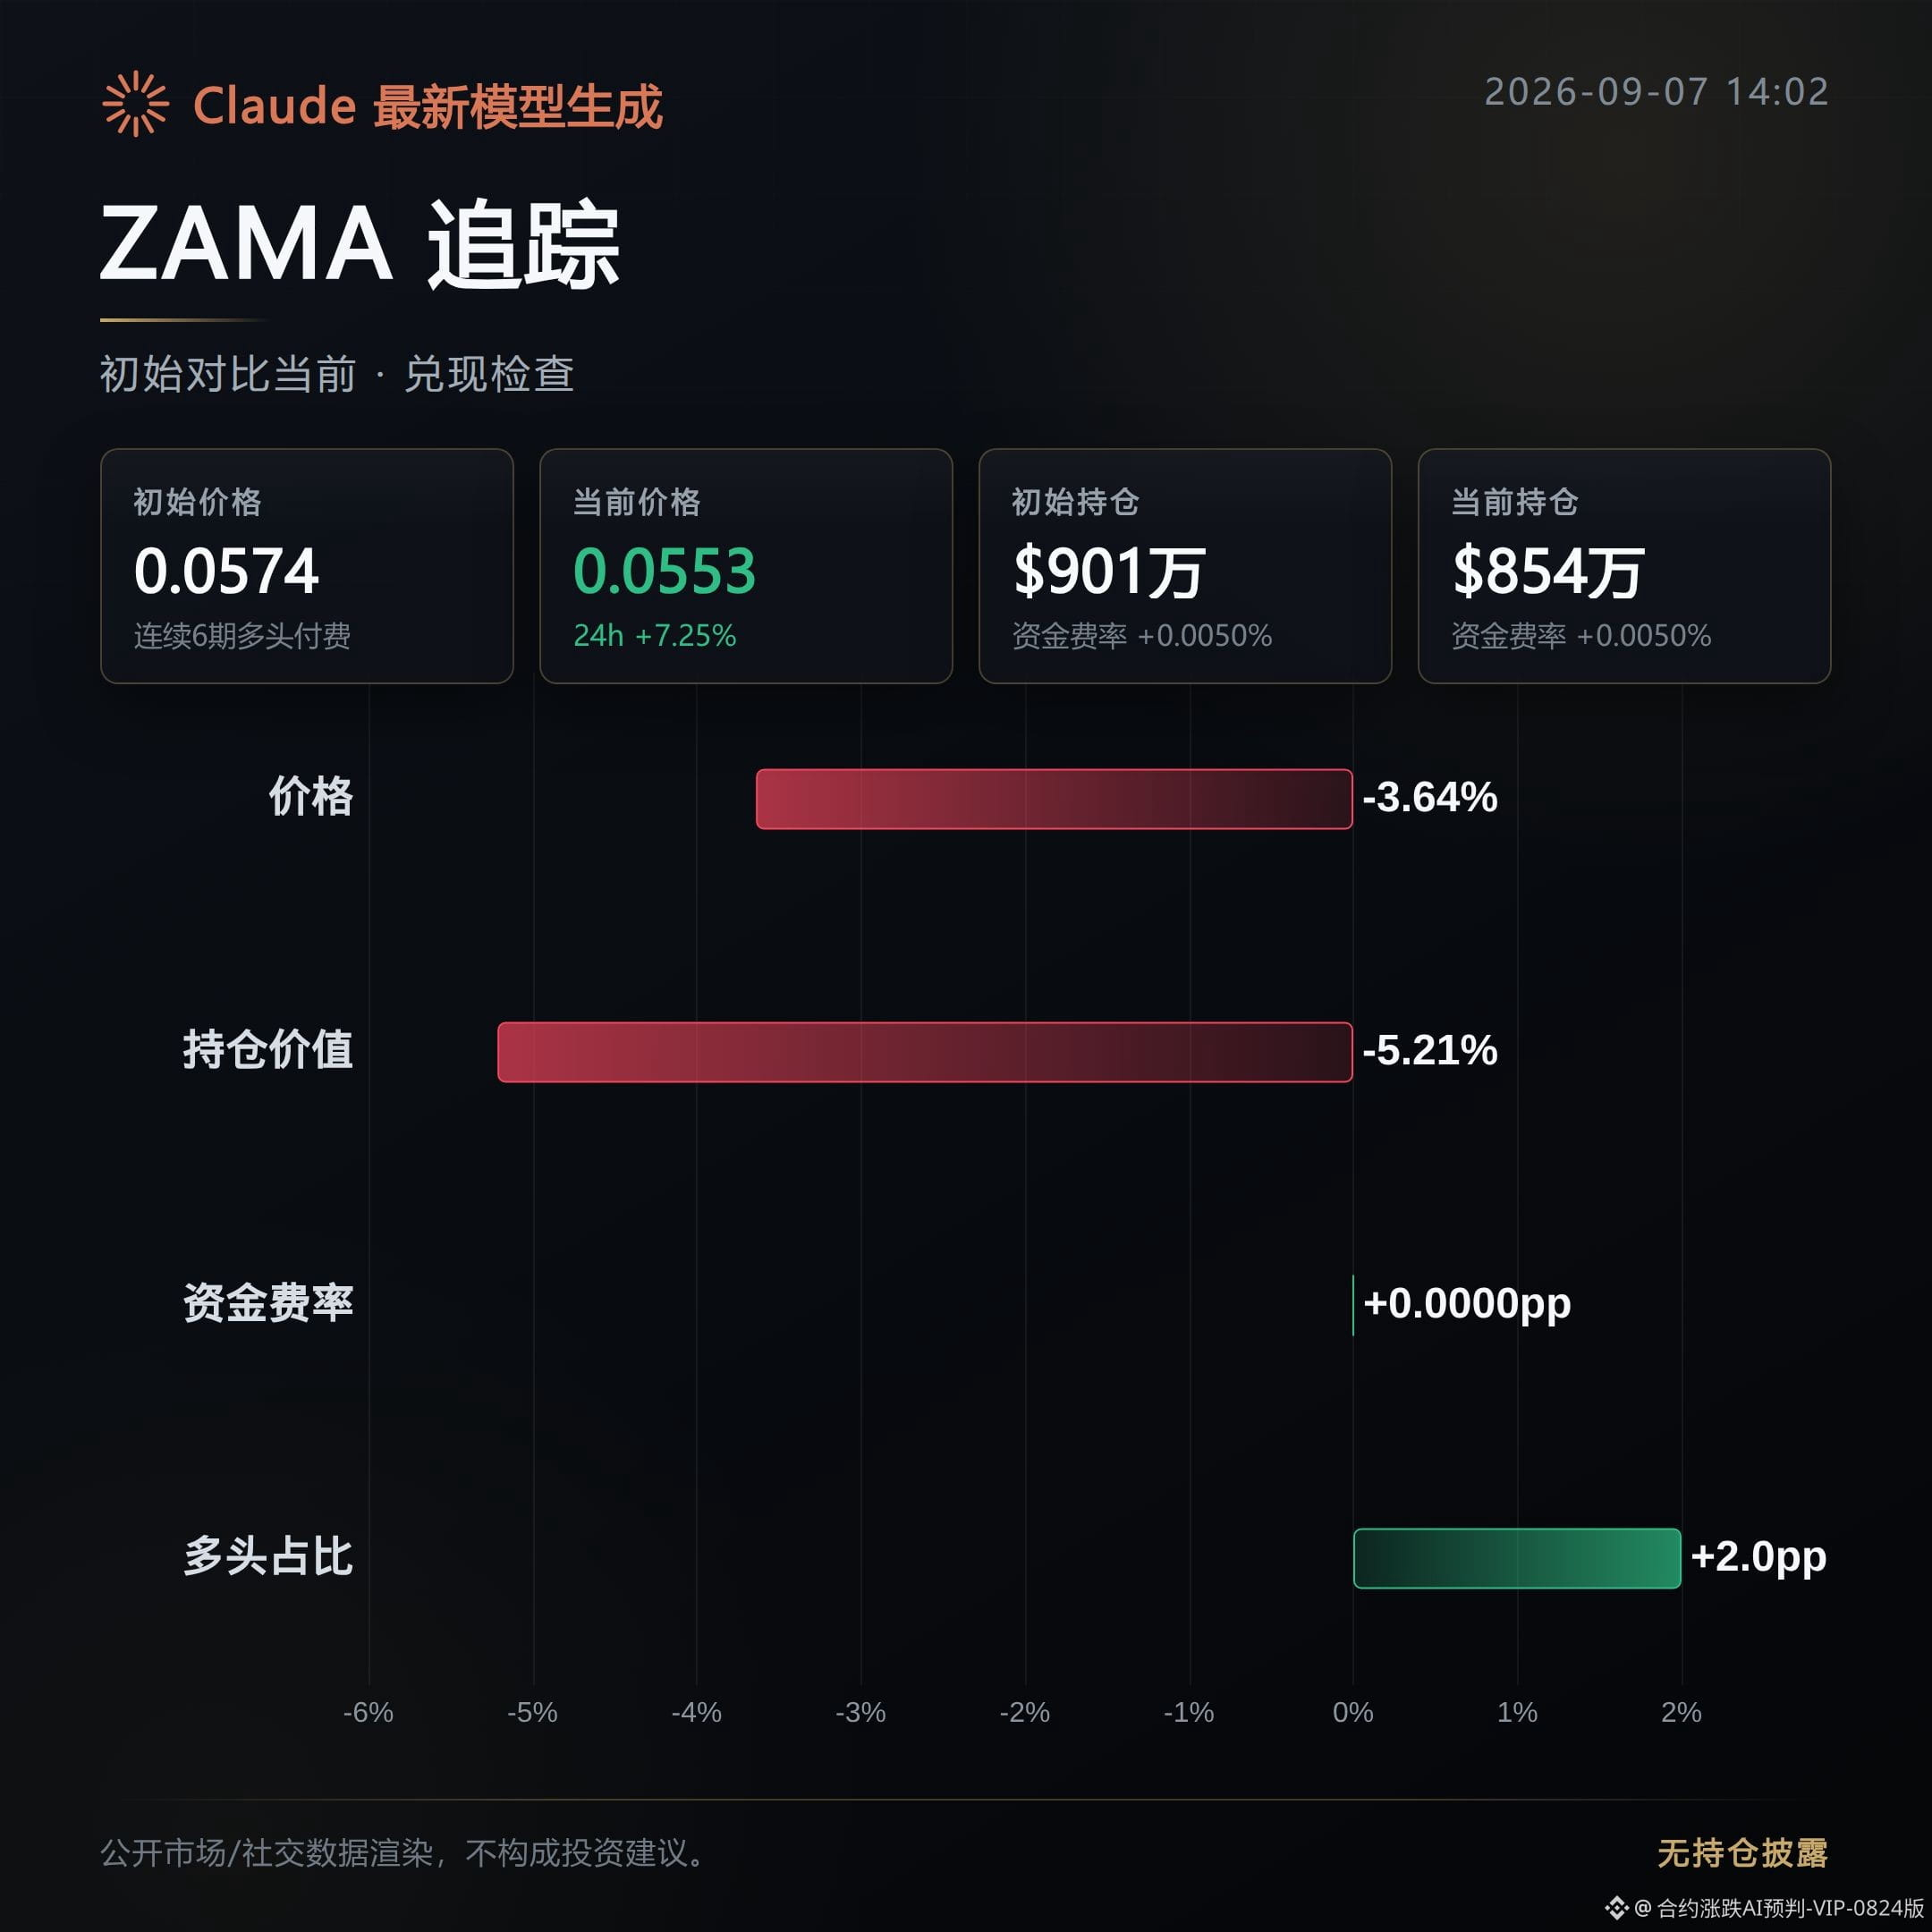
About 4 hours ago, an early-morning pump observation pointed to these three contracts as bullish.
The initial review at launch was that chips were accumulating.
Now, checking against the public order book, 2 out of the 3 played out, while 1 failed to hold.
JUP: momentum faded; the bullish call from the morning did not materialize.
After the initial post, price retraced 4.31%, and the 24-hour gain narrowed from 18.41% to 9.43%.
Open interest fell by 10.86% at the same time; price and positioning moved down together, which suggests positions were being reduced rather than just a shakeout.
SOLV: played out, and the move is still extending with added pressure.
After the initial post, price continued higher by 3.03%, while open interest rose by 4.98%.
Aggressive buy volume also increased from 0.74 to 0.96. Price, open interest, and buying pressure are all rising together, so this bullish line is currently holding.
COTI: played out, and moved in the direction anticipated this morning.
After the initial post, price rose 6.48% and open interest rose 6.84%, with positioning increasing alongside price.
Funding rate shifted from 0.005% to -0.0072%, so longs were not obviously overcrowded. This rally is not looking hollow.
Next, watch these points to confirm whether this move is still intact: for JUP, whether price can stop falling first and whether open interest keeps shrinking; for SOLV and COTI, whether open interest and aggressive buy volume can continue rising.
If positioning falls behind while price is still pushing higher, that is a signal to reassess this setup.
#JUP #SOLV #COTI #Contract Review
Live disclosure: this account currently holds $FOGO long positions, and the related views are consistent with the actual position.
Generated with Claude Fable 5; content is for market information reference only and does not constitute investment advice.
The initial review at launch was that chips were accumulating.
Now, checking against the public order book, 2 out of the 3 played out, while 1 failed to hold.
JUP: momentum faded; the bullish call from the morning did not materialize.
After the initial post, price retraced 4.31%, and the 24-hour gain narrowed from 18.41% to 9.43%.
Open interest fell by 10.86% at the same time; price and positioning moved down together, which suggests positions were being reduced rather than just a shakeout.
SOLV: played out, and the move is still extending with added pressure.
After the initial post, price continued higher by 3.03%, while open interest rose by 4.98%.
Aggressive buy volume also increased from 0.74 to 0.96. Price, open interest, and buying pressure are all rising together, so this bullish line is currently holding.
COTI: played out, and moved in the direction anticipated this morning.
After the initial post, price rose 6.48% and open interest rose 6.84%, with positioning increasing alongside price.
Funding rate shifted from 0.005% to -0.0072%, so longs were not obviously overcrowded. This rally is not looking hollow.
Next, watch these points to confirm whether this move is still intact: for JUP, whether price can stop falling first and whether open interest keeps shrinking; for SOLV and COTI, whether open interest and aggressive buy volume can continue rising.
If positioning falls behind while price is still pushing higher, that is a signal to reassess this setup.
#JUP #SOLV #COTI #Contract Review
Live disclosure: this account currently holds $FOGO long positions, and the related views are consistent with the actual position.
Generated with Claude Fable 5; content is for market information reference only and does not constitute investment advice.
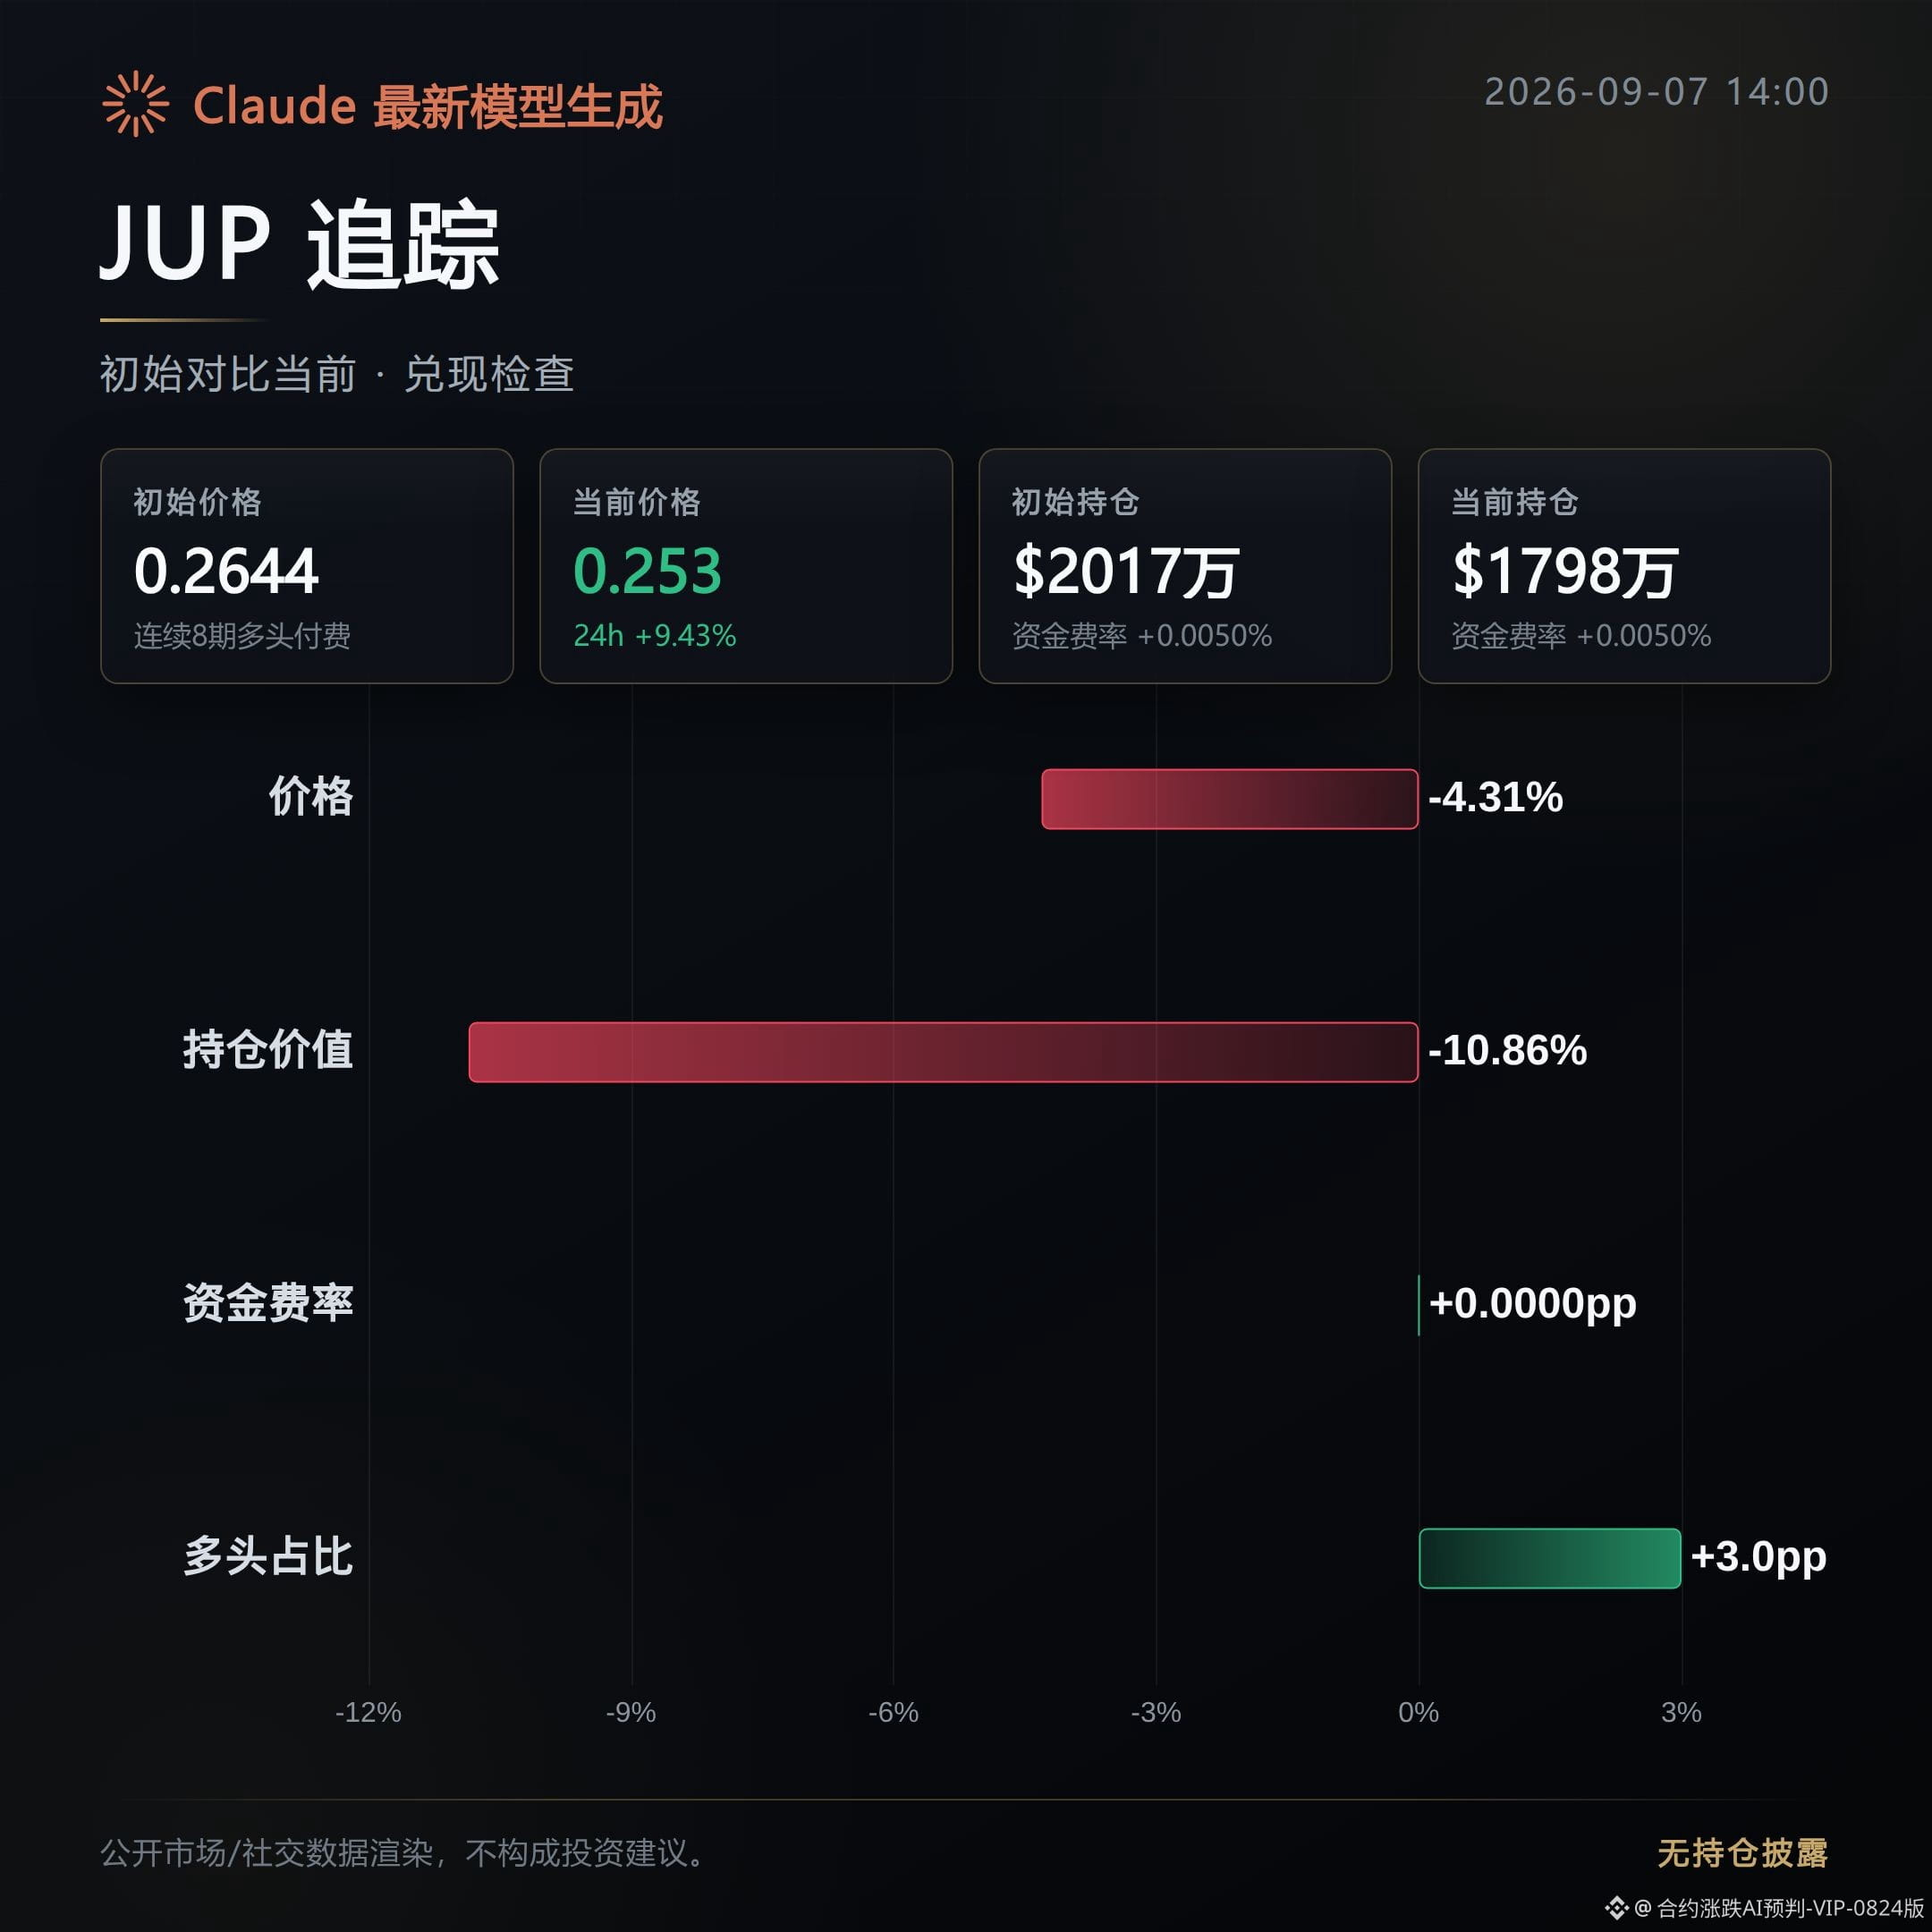
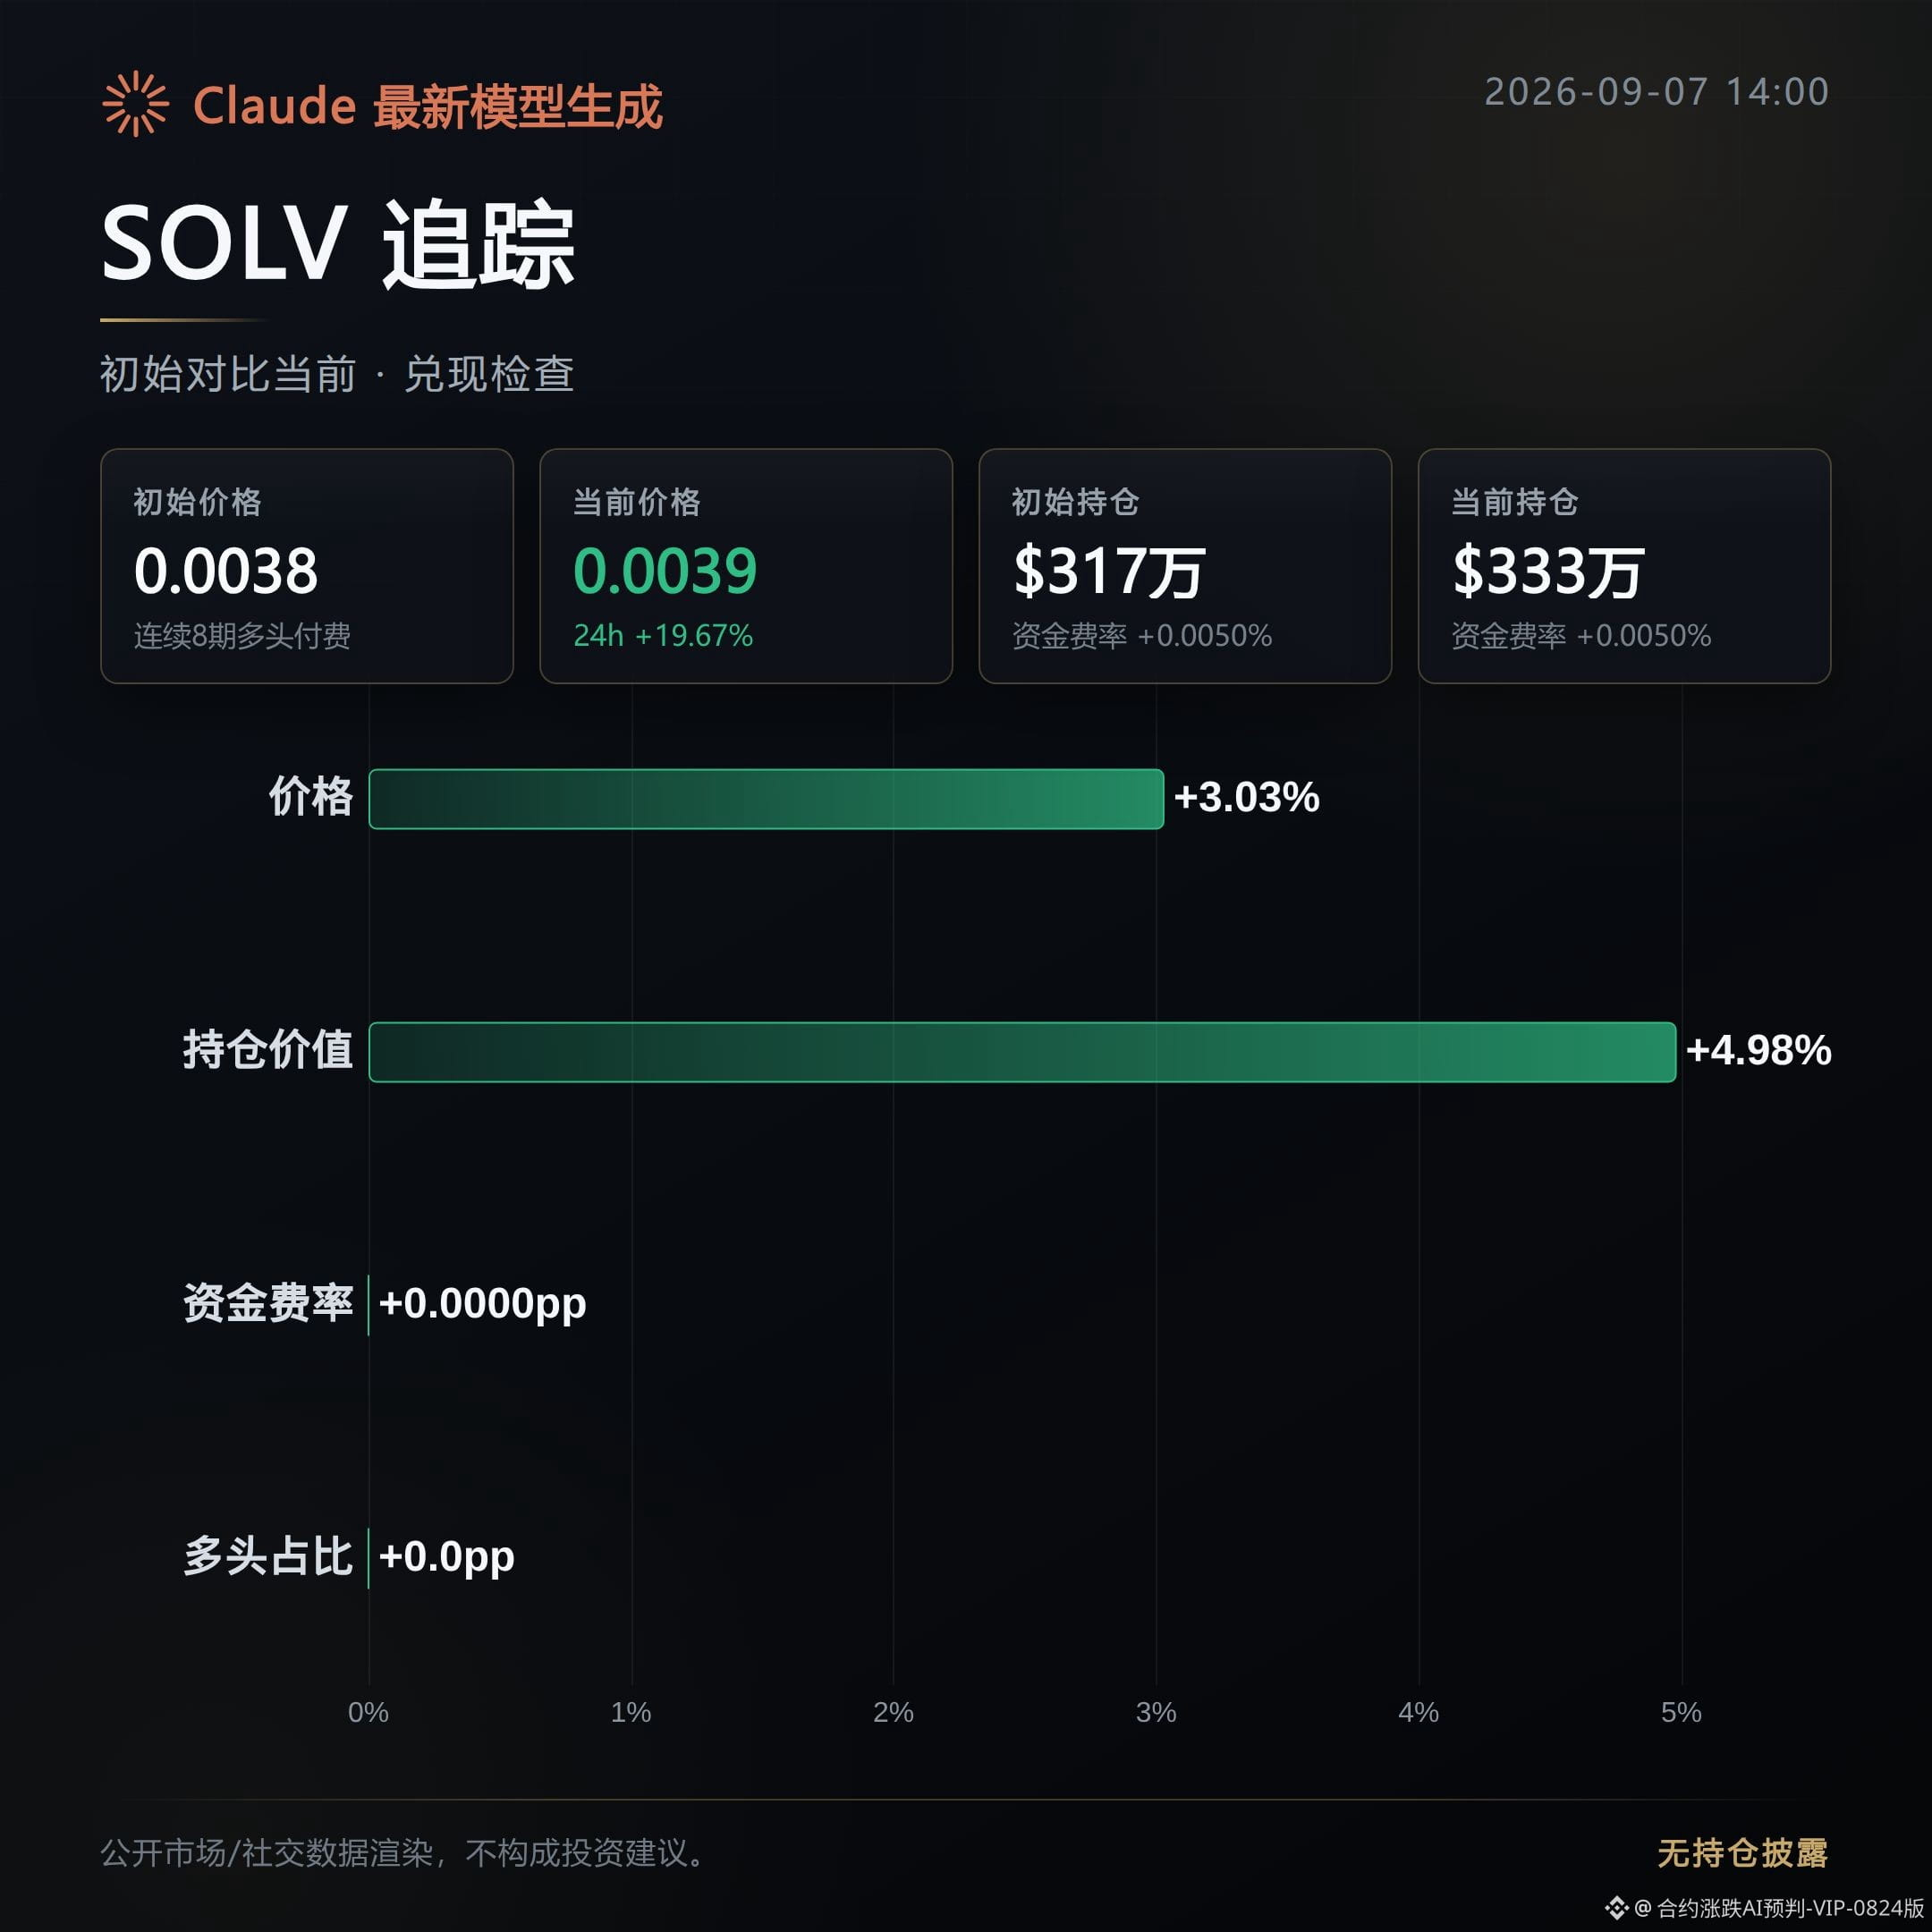
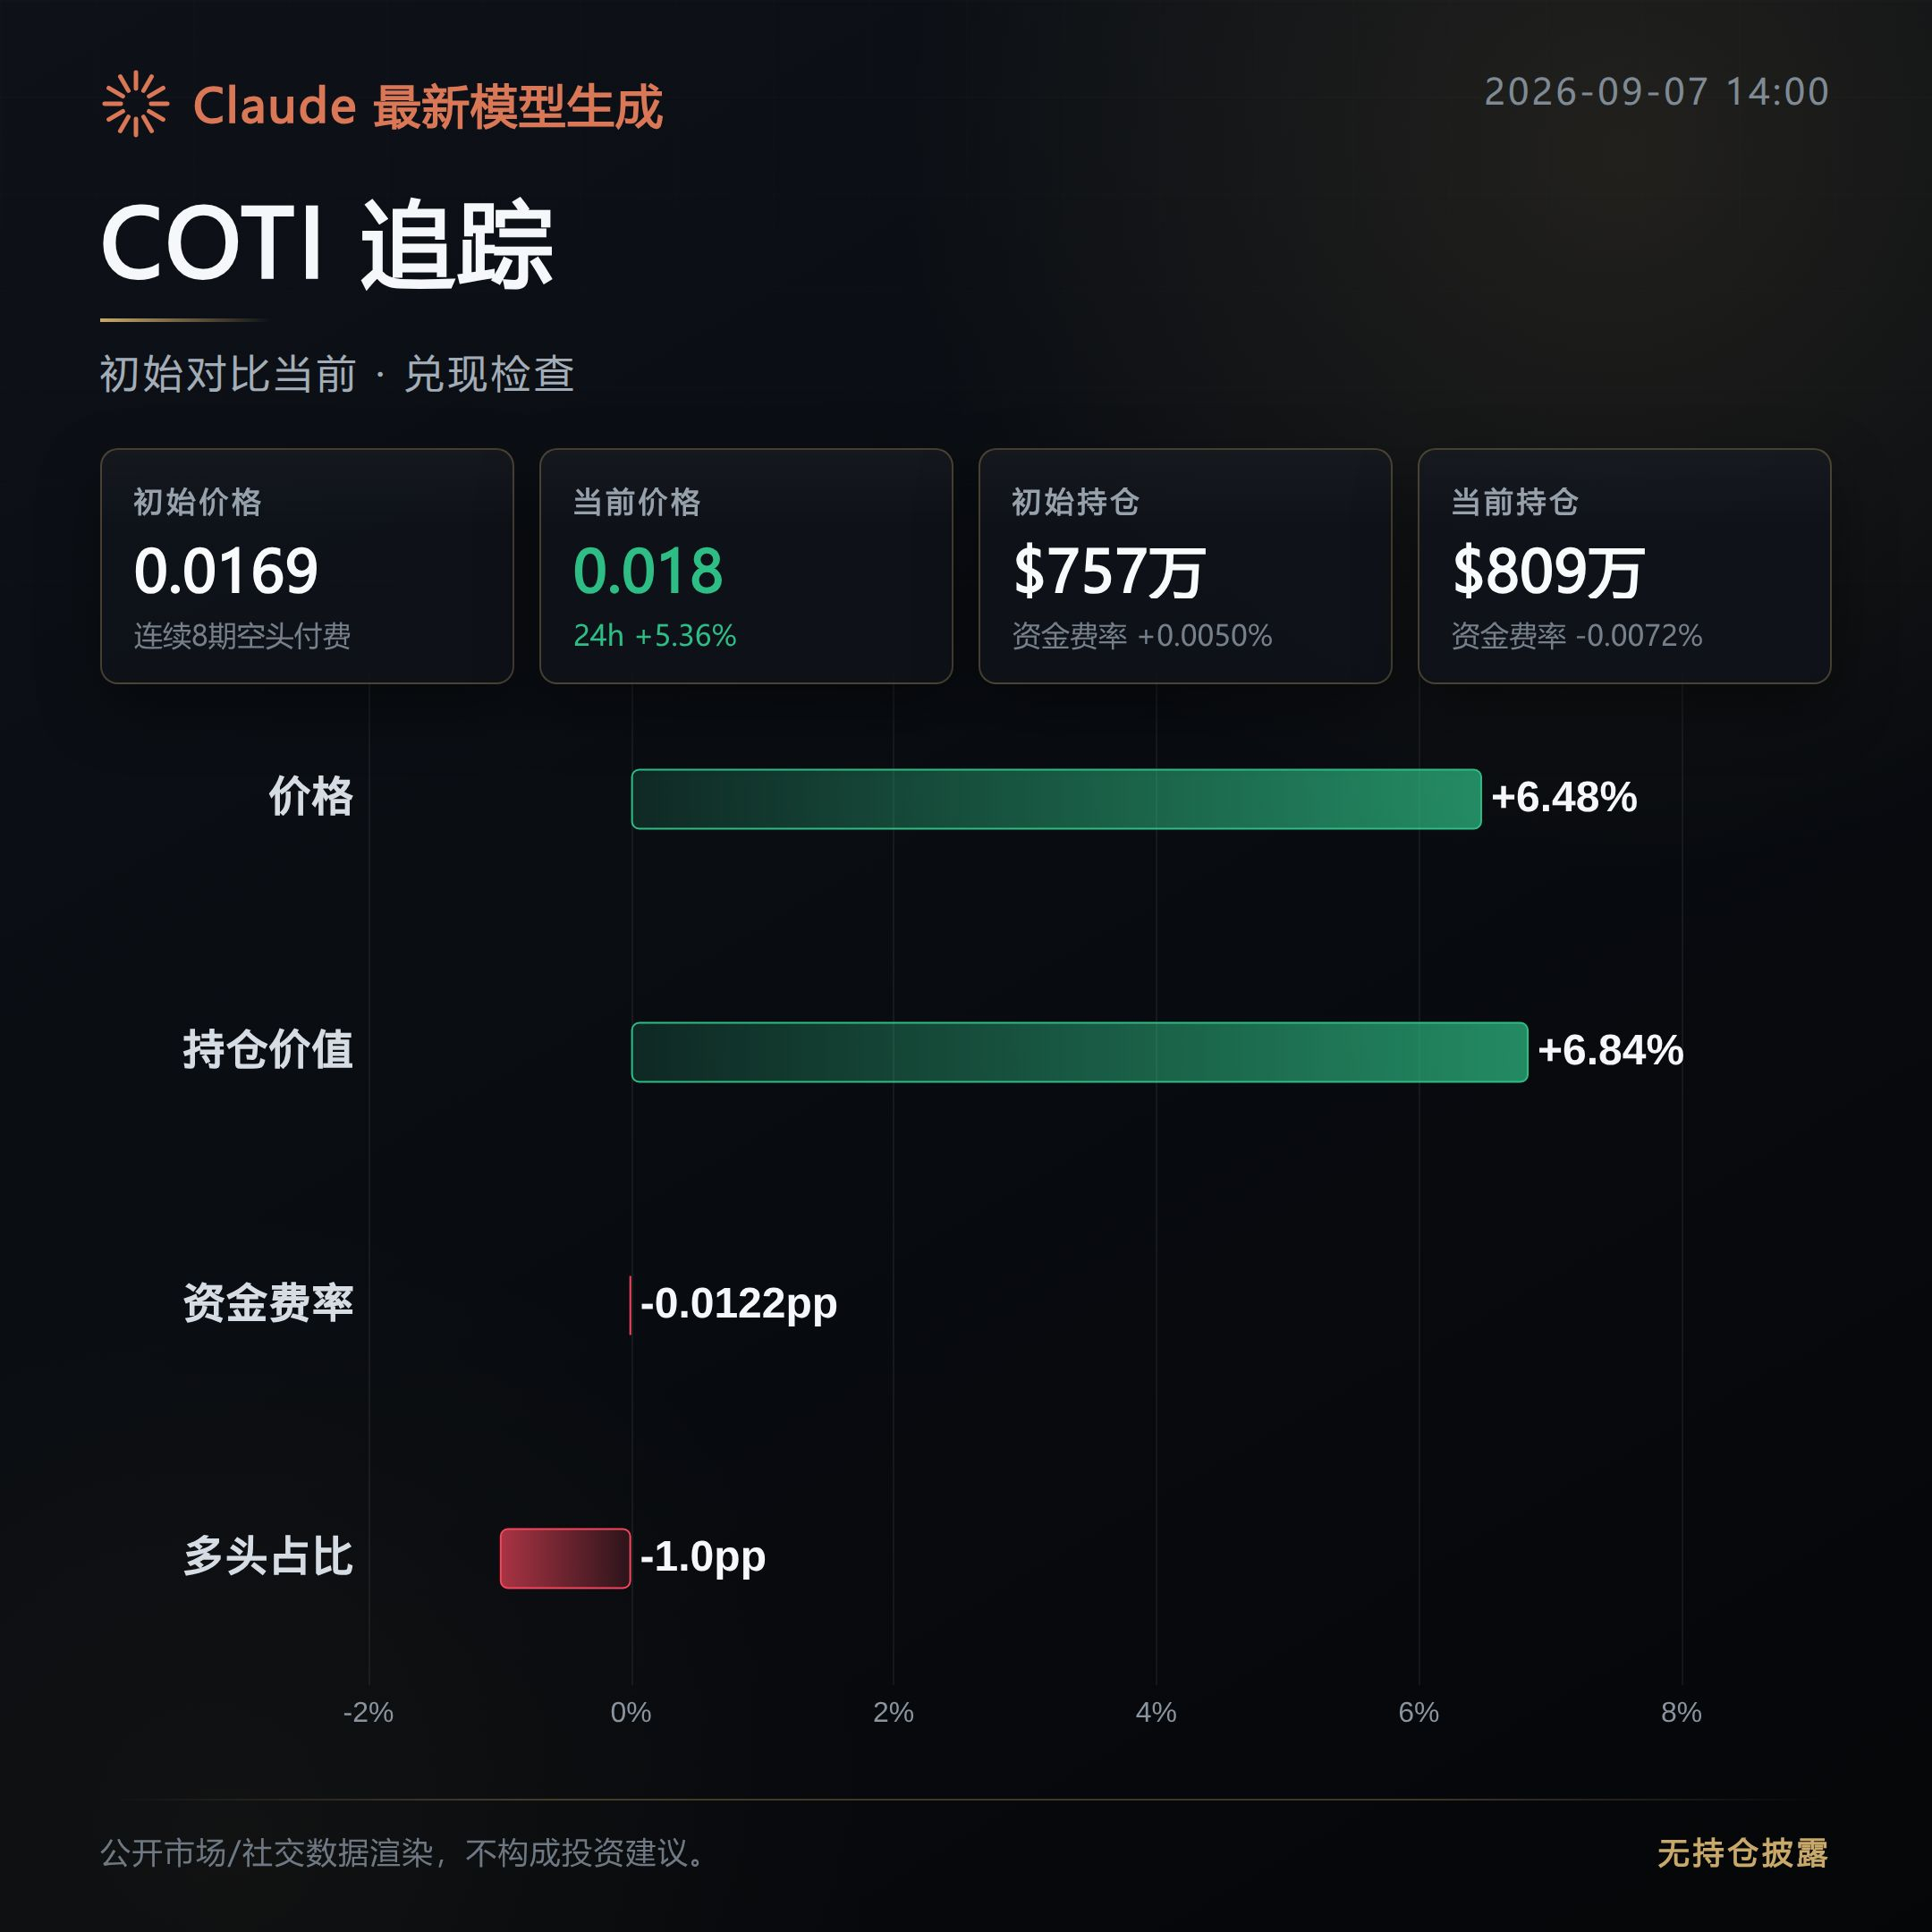
Contract Market Daily | 9/7 Midday: White Hat Takes 4,000 Coins, But Rates Don’t Flinch
Liquid Network was reported to have had a "white hat hacker" withdraw 4,000 bitcoins from its Bitcoin federal reserve, worth roughly $320 million, and the network has already been suspended for cleanup. This news is tied to $BTC , but on the derivatives side the mark price is 79,722, only down 0.17% over the past 24 hours, with almost no reaction. That suggests the money was not pulled directly from the market; the impact started on-chain and has not yet reached the order book.
Another, more concrete signal: spot Bitcoin ETFs saw a net inflow of $987 million last week, the best week this year. Institutions are rebuilding positions along this line, contrasting with the calm in derivatives.
The positioning structure is worth a closer look. Open interest is $8.422 billion, down 1.1% in a day, while price is basically flat. This combination of "positions shrinking, price not falling" looks more like active rotation or profit-taking than a leverage-driven liquidation exit. Funding rate is 0.42‰, meaning longs are still paying shorts as usual. The long/short ratio is basically balanced at 51%, but aggressive selling has the upper hand, with the order book leaning bearish. The Fear & Greed Index is 71, in greed territory, but greed with such restrained funding has limited substance; it feels like sentiment moved first while leverage did not keep up.
In small caps, both sides show extreme funding: T, ORCA, and AKE have short funding around -0.6%, making crowded shorts vulnerable to a squeeze; tokenized stocks such as BYD, HK1810, and ZHIPU have long funding from +0.1% to +0.18%, so longs are not having an easy time either.
The key thing to watch next is one point: if funding keeps rising along with greed, that means sentiment is being converted into leverage; if it stays still, then the explanation of "active de-risking" becomes even more credible, and the stalemate of not falling and not rising will likely continue.
Live position disclosure: this account currently holds $FOGO long positions, and the related views are consistent with the actual position.
Contract data compiled with assistance from Claude Fable 5, for informational purposes only. Please verify independently.
Liquid Network was reported to have had a "white hat hacker" withdraw 4,000 bitcoins from its Bitcoin federal reserve, worth roughly $320 million, and the network has already been suspended for cleanup. This news is tied to $BTC , but on the derivatives side the mark price is 79,722, only down 0.17% over the past 24 hours, with almost no reaction. That suggests the money was not pulled directly from the market; the impact started on-chain and has not yet reached the order book.
Another, more concrete signal: spot Bitcoin ETFs saw a net inflow of $987 million last week, the best week this year. Institutions are rebuilding positions along this line, contrasting with the calm in derivatives.
The positioning structure is worth a closer look. Open interest is $8.422 billion, down 1.1% in a day, while price is basically flat. This combination of "positions shrinking, price not falling" looks more like active rotation or profit-taking than a leverage-driven liquidation exit. Funding rate is 0.42‰, meaning longs are still paying shorts as usual. The long/short ratio is basically balanced at 51%, but aggressive selling has the upper hand, with the order book leaning bearish. The Fear & Greed Index is 71, in greed territory, but greed with such restrained funding has limited substance; it feels like sentiment moved first while leverage did not keep up.
In small caps, both sides show extreme funding: T, ORCA, and AKE have short funding around -0.6%, making crowded shorts vulnerable to a squeeze; tokenized stocks such as BYD, HK1810, and ZHIPU have long funding from +0.1% to +0.18%, so longs are not having an easy time either.
The key thing to watch next is one point: if funding keeps rising along with greed, that means sentiment is being converted into leverage; if it stays still, then the explanation of "active de-risking" becomes even more credible, and the stalemate of not falling and not rising will likely continue.
Live position disclosure: this account currently holds $FOGO long positions, and the related views are consistent with the actual position.
Contract data compiled with assistance from Claude Fable 5, for informational purposes only. Please verify independently.
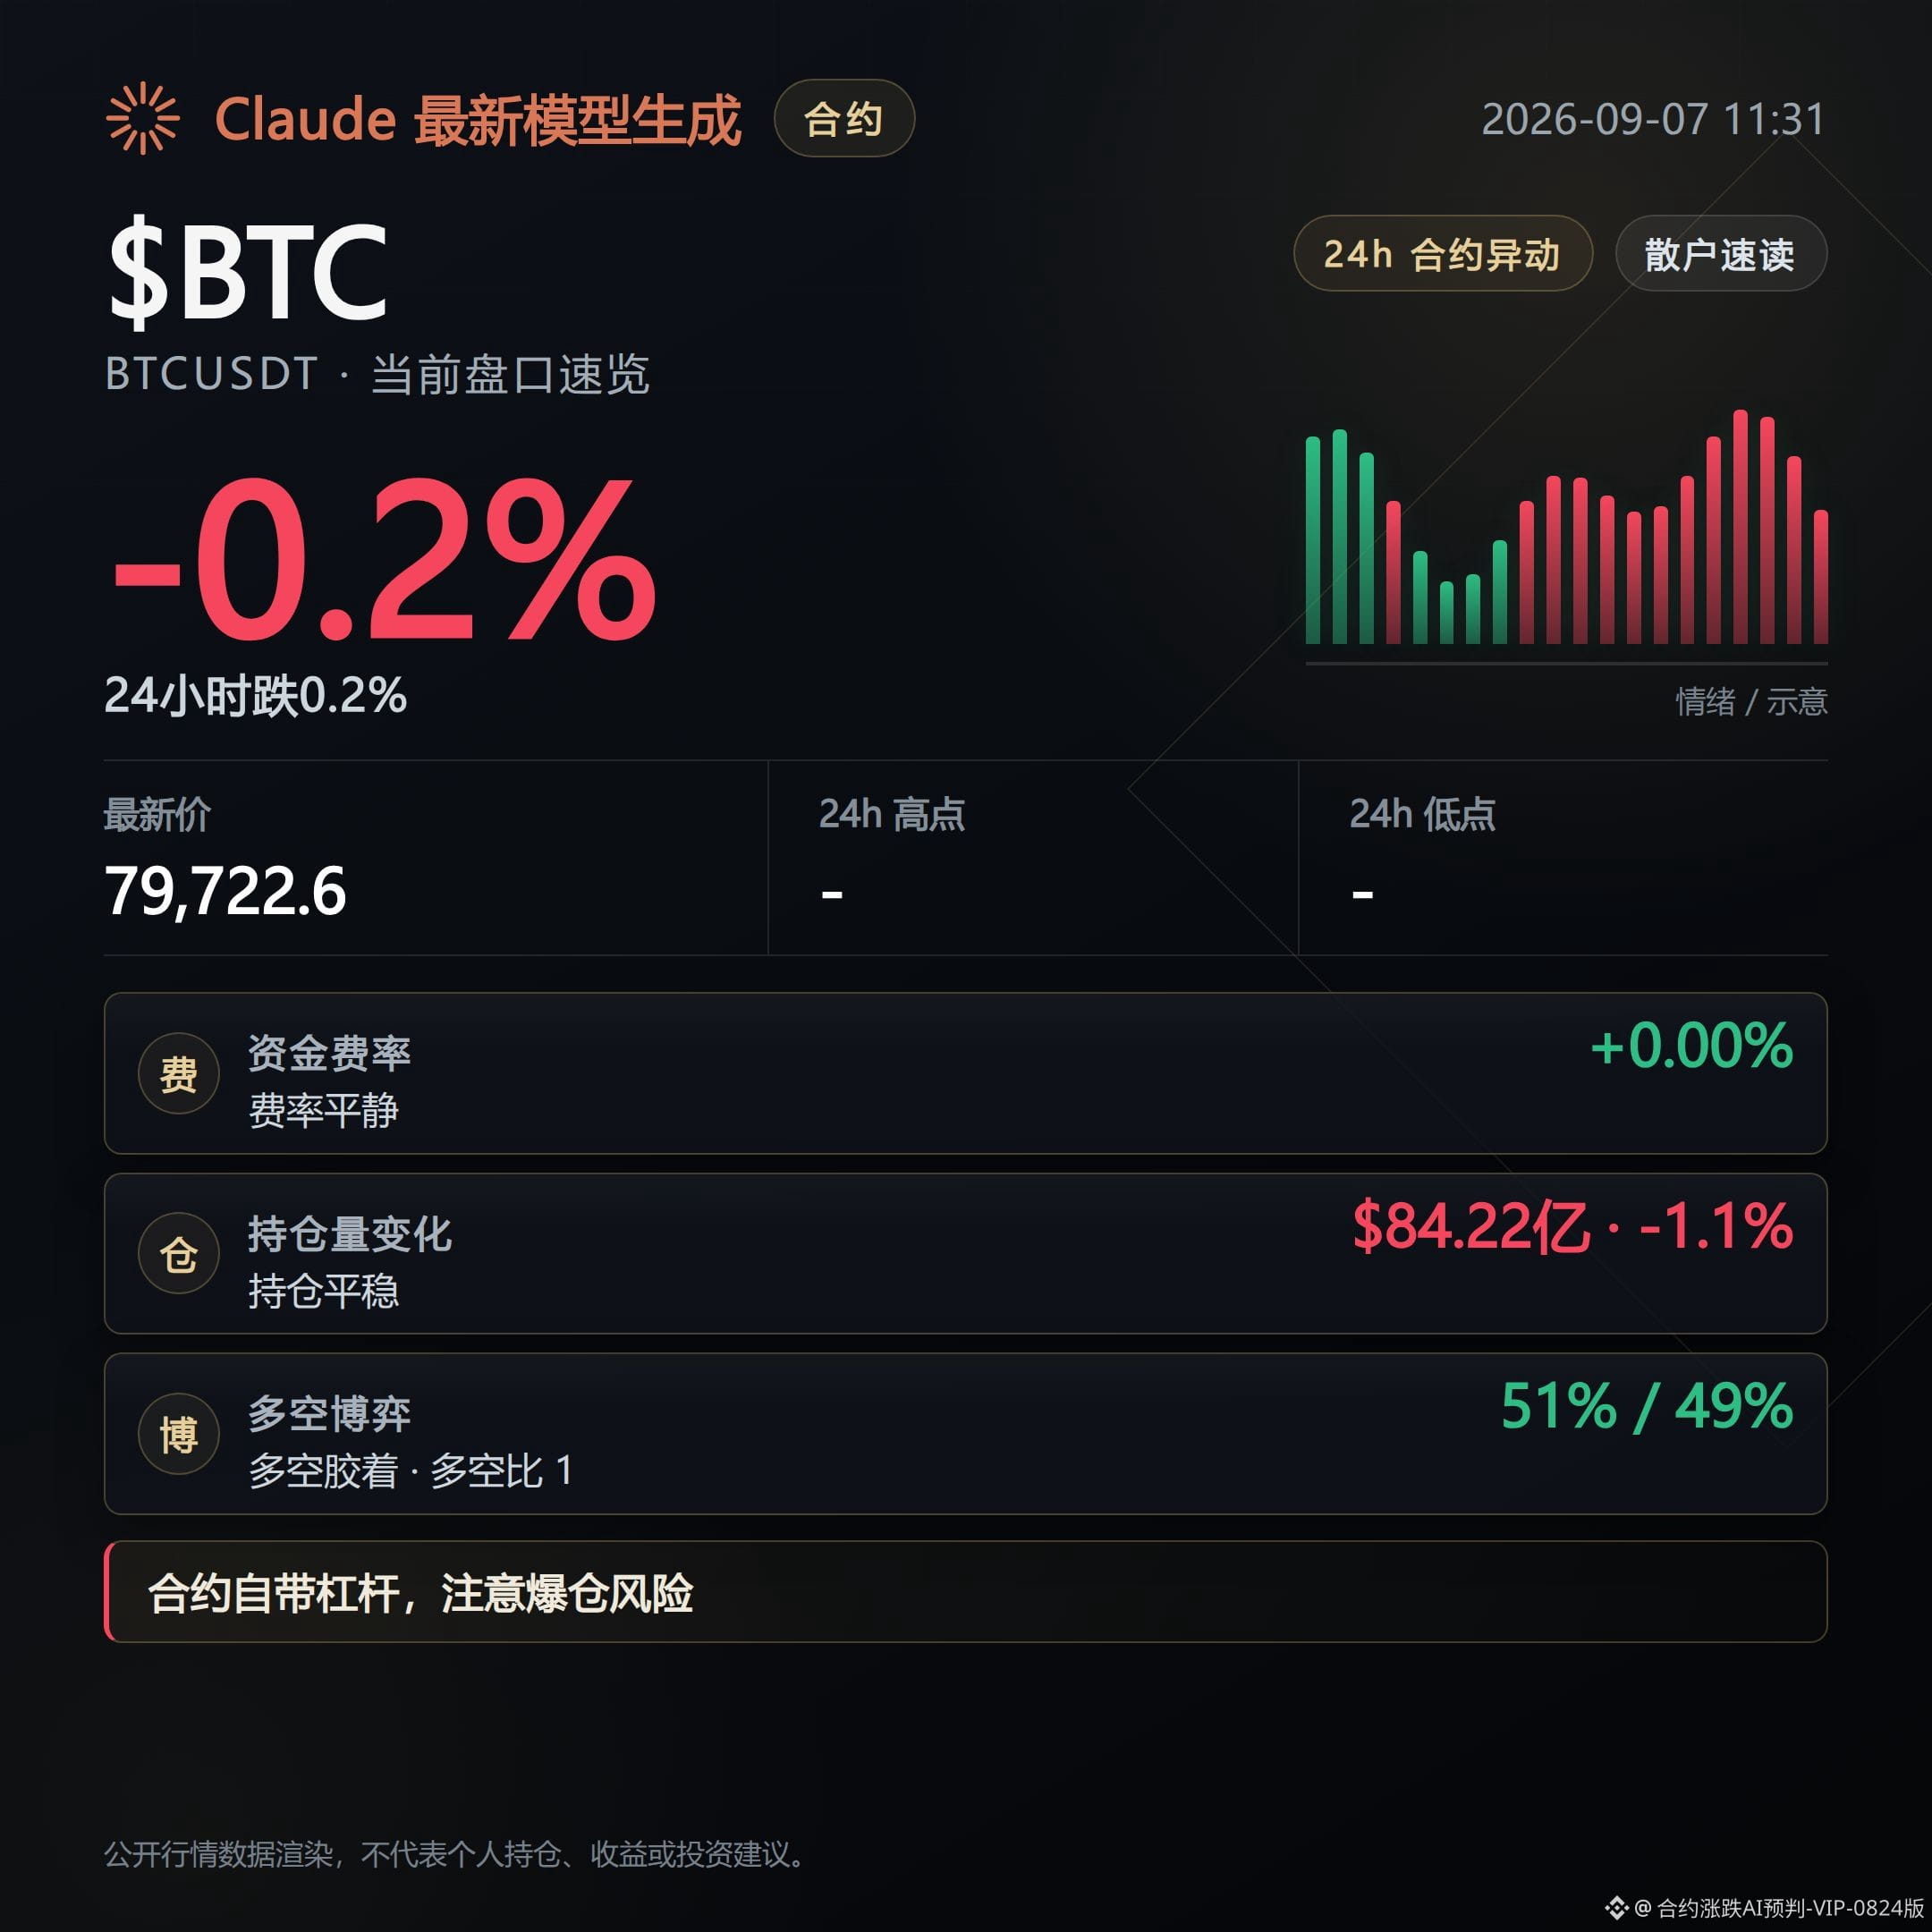
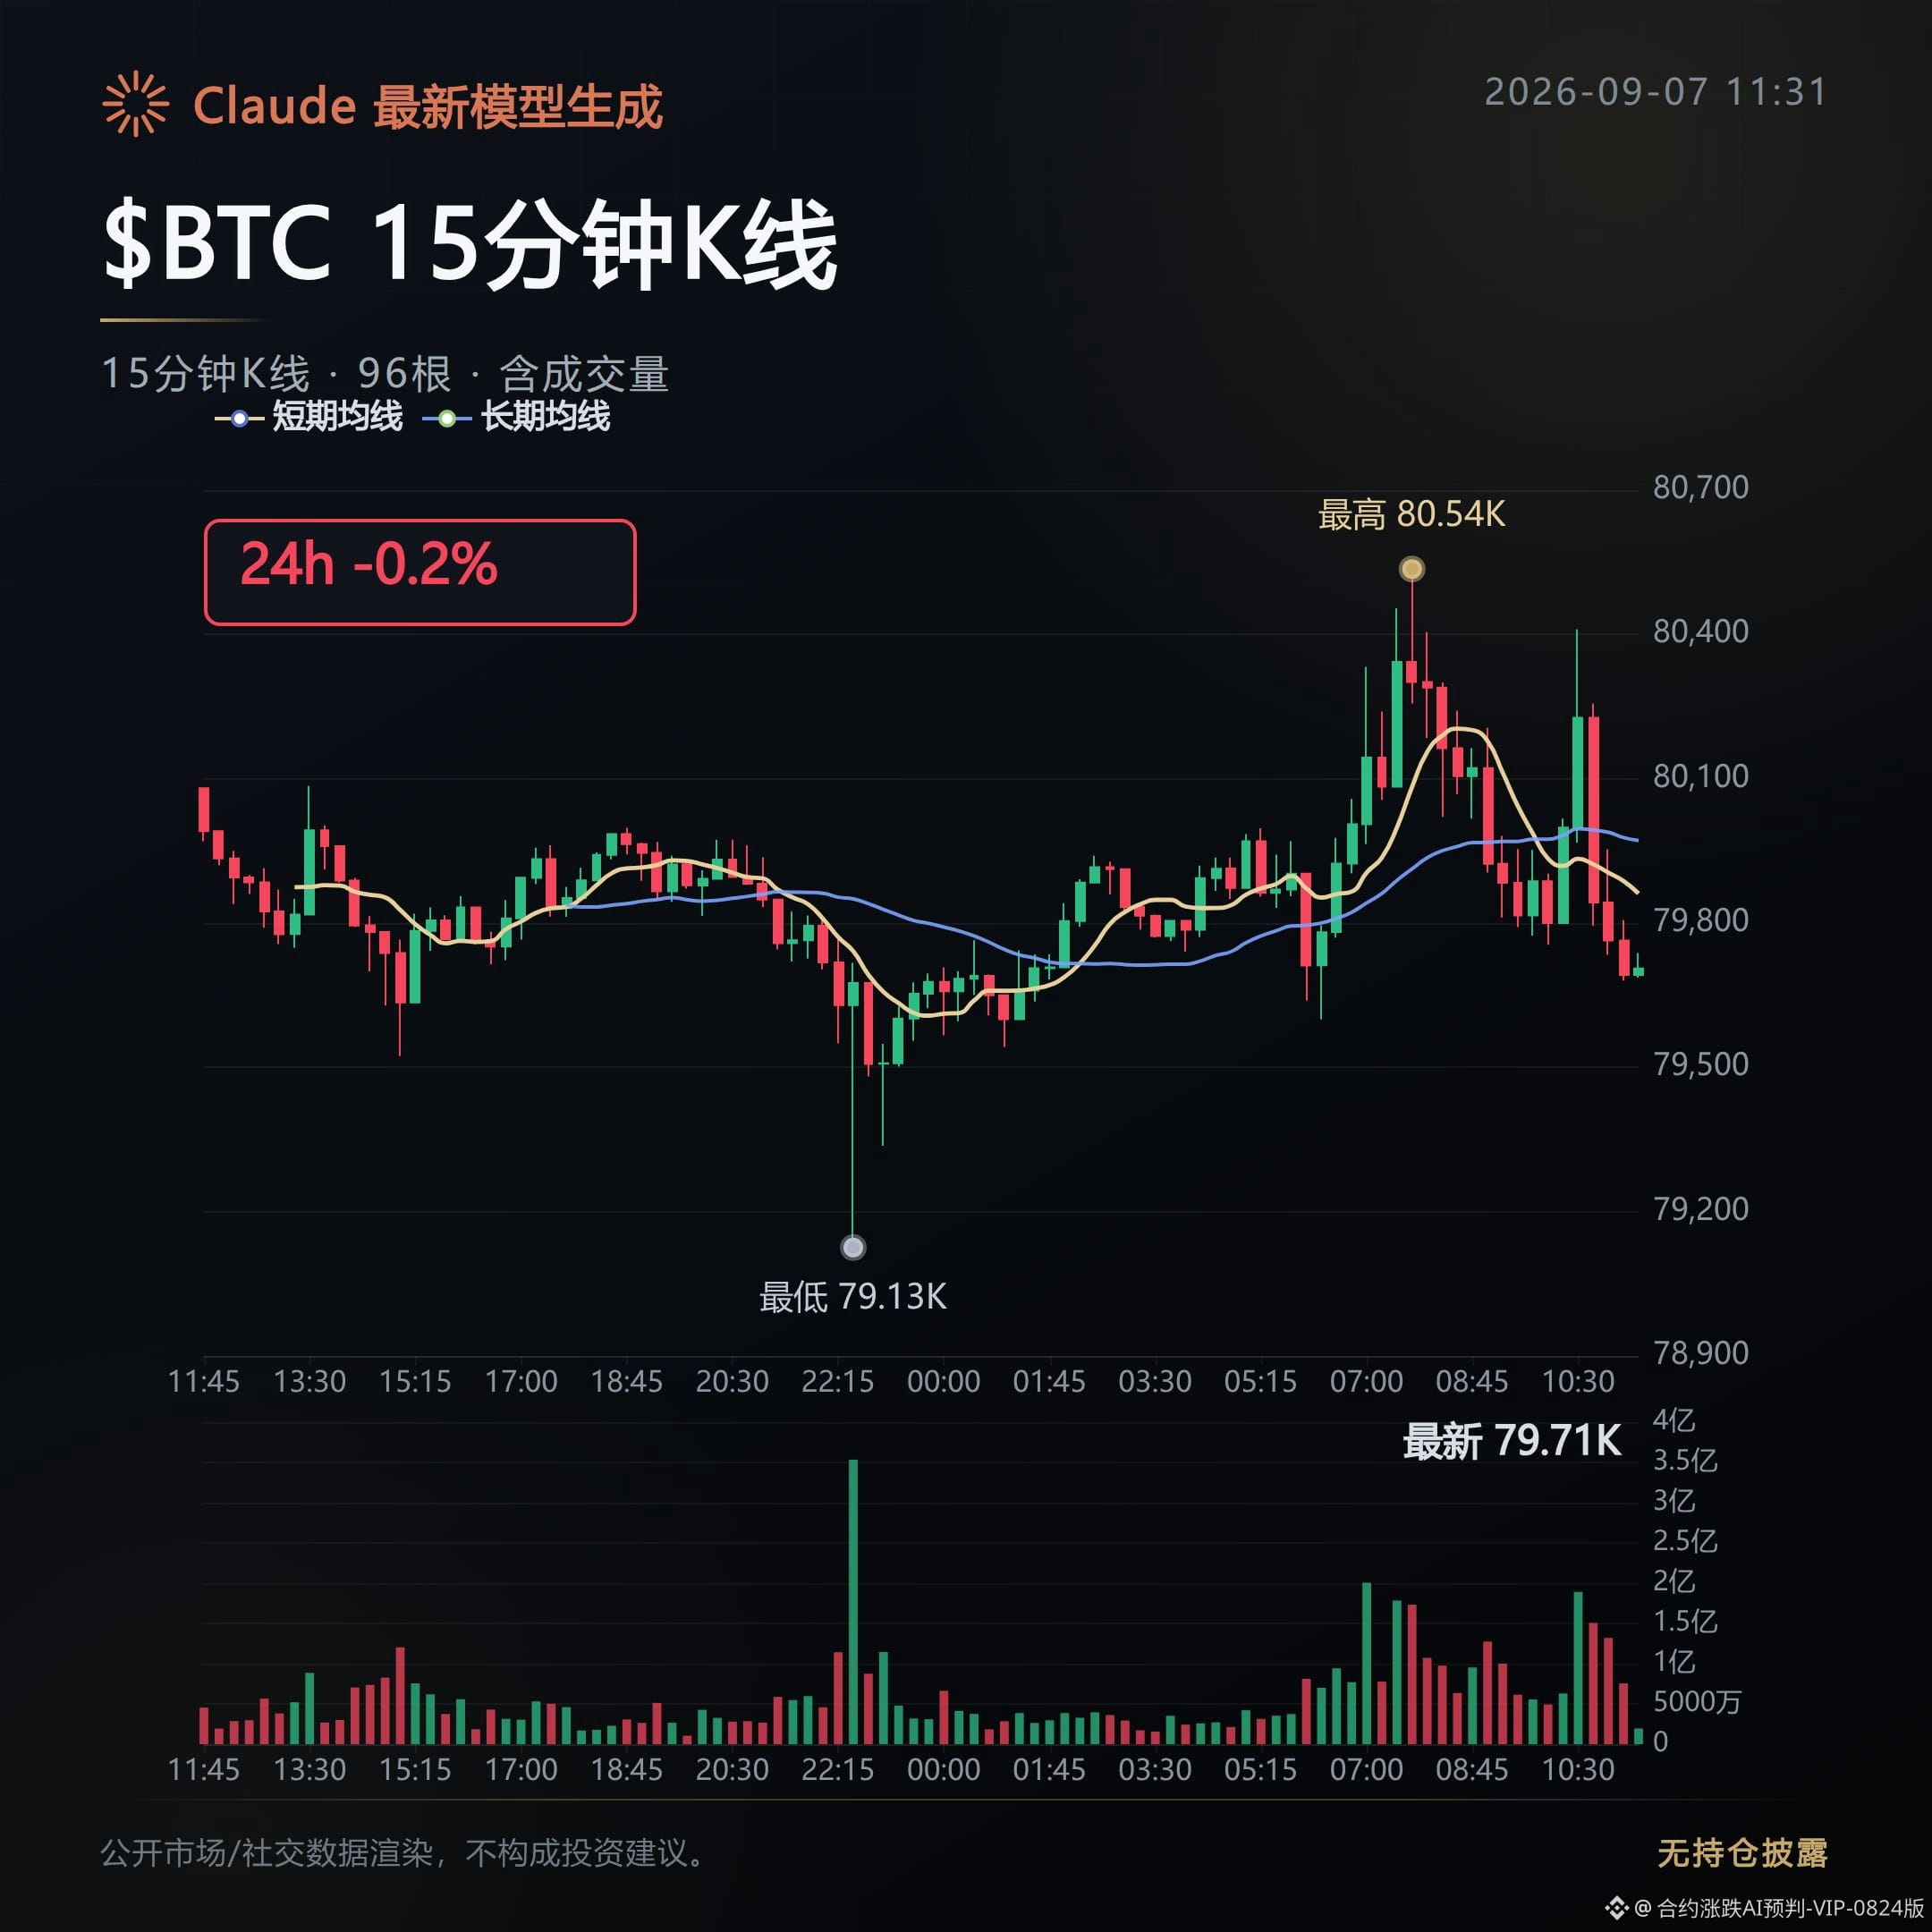
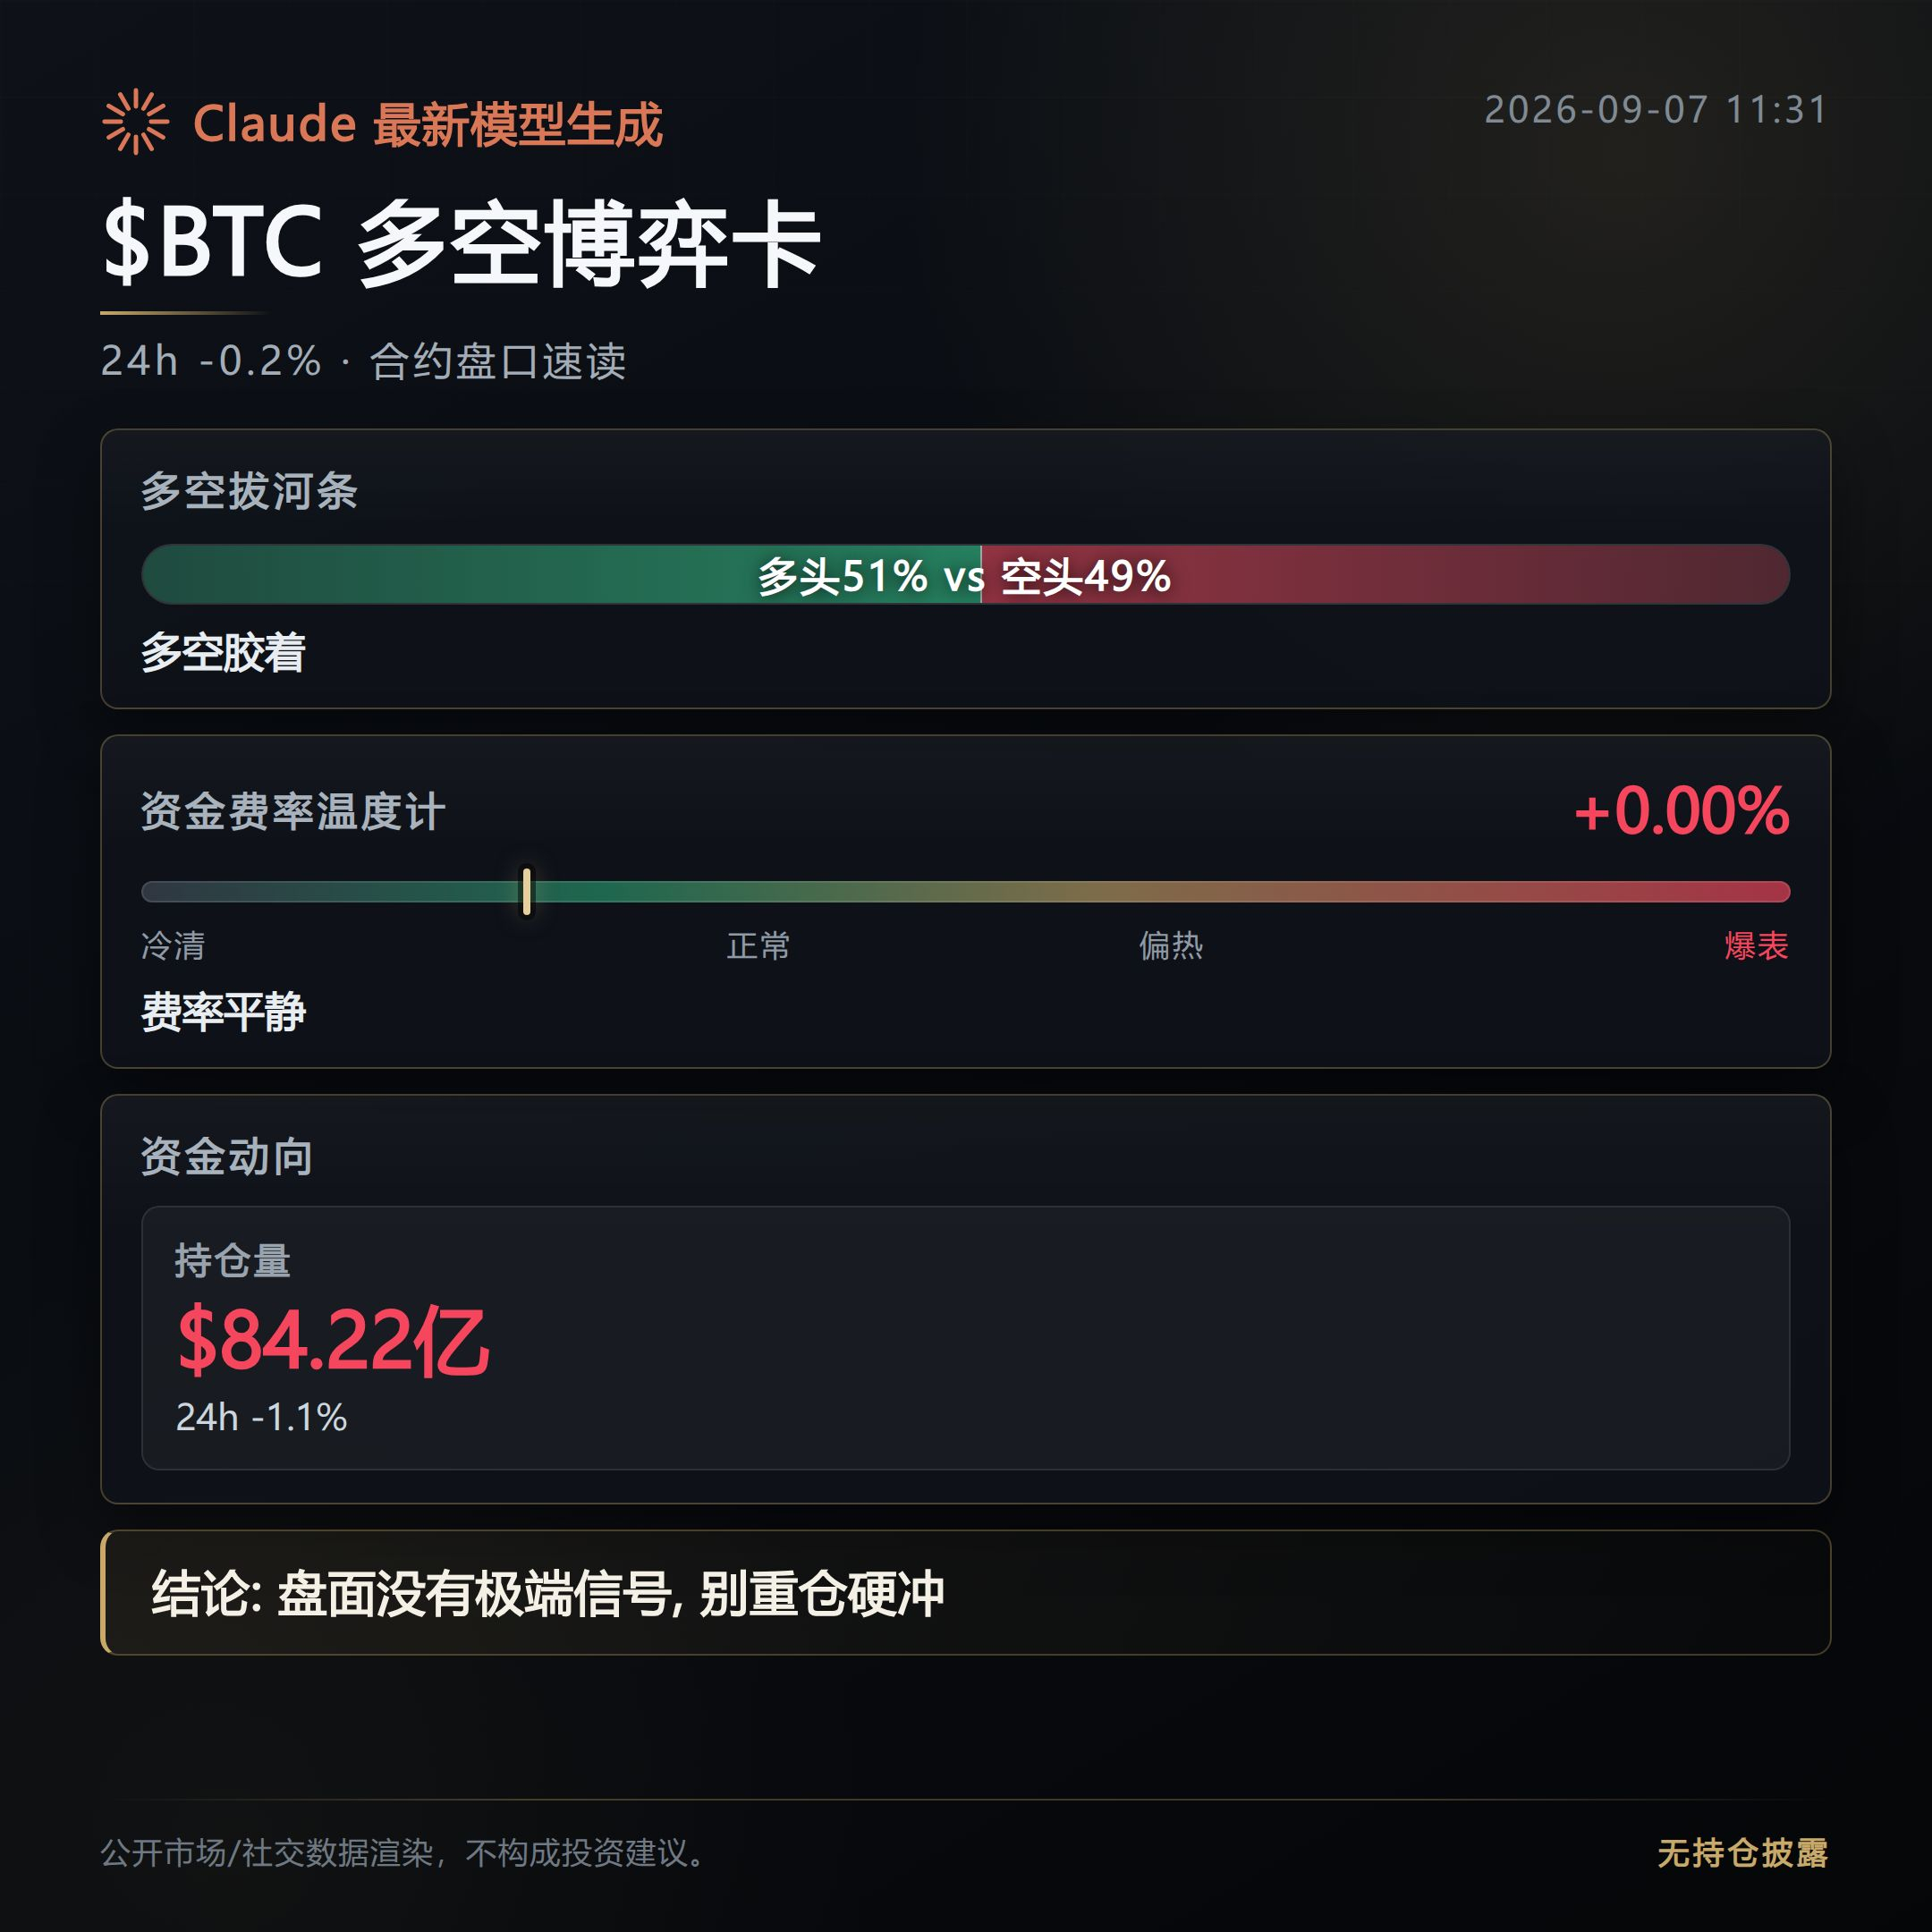
In the morning watchlist, first go over the top 3 on today’s perpetual contract 24-hour gainers list. All of them have gains below triple digits, but their structures differ significantly. Let’s look directly at the order books.
RAYSOL is currently priced at 1.2453, with a 24-hour gain of 32.45% and a trading volume of 490 million USD, the largest capital scale among the three coins.
Open interest surged 210.2% over the past 24 hours, but it only rose 1.5% in the most recent hour, indicating that most of this position-building happened earlier and the current pace is slowing.
The funding rate is -0.0489%, and shorts have been paying for 4 consecutive periods. The long/short ratio is 1.14, with longs accounting for 53%, a combination of rising prices but a funding rate skewed toward short-side payment.
DOOD is currently priced at 0.001888, with a 24-hour gain of 29.58% and trading volume of 59.69 million USD, a scale clearly smaller than RAYSOL.
Open interest increased 160.2% over 24 hours, but fell 7.3% in the most recent hour, suggesting that funds are reducing positions at higher levels.
The funding rate is +0.0514%, with longs paying for 8 consecutive periods. The long/short ratio is 1.74, and longs account for 64%, making it the most crowded long trade among the three coins. RSI 65.7 is in a neutral-to-hot zone.
ORCA is currently priced at 1.64, with a 24-hour gain of 26.06% and trading volume of 41.6 million USD, the smallest among the three.
Its biggest highlight is RSI 78.6, which has entered overbought territory; at the same time, open interest accelerated upward by 27.1% in the most recent hour, indicating that new positions are still flowing in right now rather than cooling off.
The funding rate is -0.6877%, with shorts paying for 3 consecutive periods. The premium/discount rate is -1.8381%, the deepest negative funding rate and discount among the three coins.
The three coins share one common point: their 24-hour open interest growth far exceeds their price gains (210.2%, 160.2%, 68.2%), indicating that this wave is more about rapid buildup in derivatives positions than simple spot-driven price discovery. Historically, leading gainers like these can pull back quickly when sentiment fades, especially combinations like ORCA, where RSI is already overbought and funding has turned deeply negative; volatility may be even stronger. When watching the tape, just pay attention to changes in open interest growth and funding rate momentum. This does not constitute any trading advice.
#合约市场 #RAYSOL
Live trading record: this account currently holds $FOGO long positions and will continue holding as long as the logic remains unchanged.
This content was generated with assistance from Claude Fable 5 and is for informational reference only. Please verify independently.
RAYSOL is currently priced at 1.2453, with a 24-hour gain of 32.45% and a trading volume of 490 million USD, the largest capital scale among the three coins.
Open interest surged 210.2% over the past 24 hours, but it only rose 1.5% in the most recent hour, indicating that most of this position-building happened earlier and the current pace is slowing.
The funding rate is -0.0489%, and shorts have been paying for 4 consecutive periods. The long/short ratio is 1.14, with longs accounting for 53%, a combination of rising prices but a funding rate skewed toward short-side payment.
DOOD is currently priced at 0.001888, with a 24-hour gain of 29.58% and trading volume of 59.69 million USD, a scale clearly smaller than RAYSOL.
Open interest increased 160.2% over 24 hours, but fell 7.3% in the most recent hour, suggesting that funds are reducing positions at higher levels.
The funding rate is +0.0514%, with longs paying for 8 consecutive periods. The long/short ratio is 1.74, and longs account for 64%, making it the most crowded long trade among the three coins. RSI 65.7 is in a neutral-to-hot zone.
ORCA is currently priced at 1.64, with a 24-hour gain of 26.06% and trading volume of 41.6 million USD, the smallest among the three.
Its biggest highlight is RSI 78.6, which has entered overbought territory; at the same time, open interest accelerated upward by 27.1% in the most recent hour, indicating that new positions are still flowing in right now rather than cooling off.
The funding rate is -0.6877%, with shorts paying for 3 consecutive periods. The premium/discount rate is -1.8381%, the deepest negative funding rate and discount among the three coins.
The three coins share one common point: their 24-hour open interest growth far exceeds their price gains (210.2%, 160.2%, 68.2%), indicating that this wave is more about rapid buildup in derivatives positions than simple spot-driven price discovery. Historically, leading gainers like these can pull back quickly when sentiment fades, especially combinations like ORCA, where RSI is already overbought and funding has turned deeply negative; volatility may be even stronger. When watching the tape, just pay attention to changes in open interest growth and funding rate momentum. This does not constitute any trading advice.
#合约市场 #RAYSOL
Live trading record: this account currently holds $FOGO long positions and will continue holding as long as the logic remains unchanged.
This content was generated with assistance from Claude Fable 5 and is for informational reference only. Please verify independently.
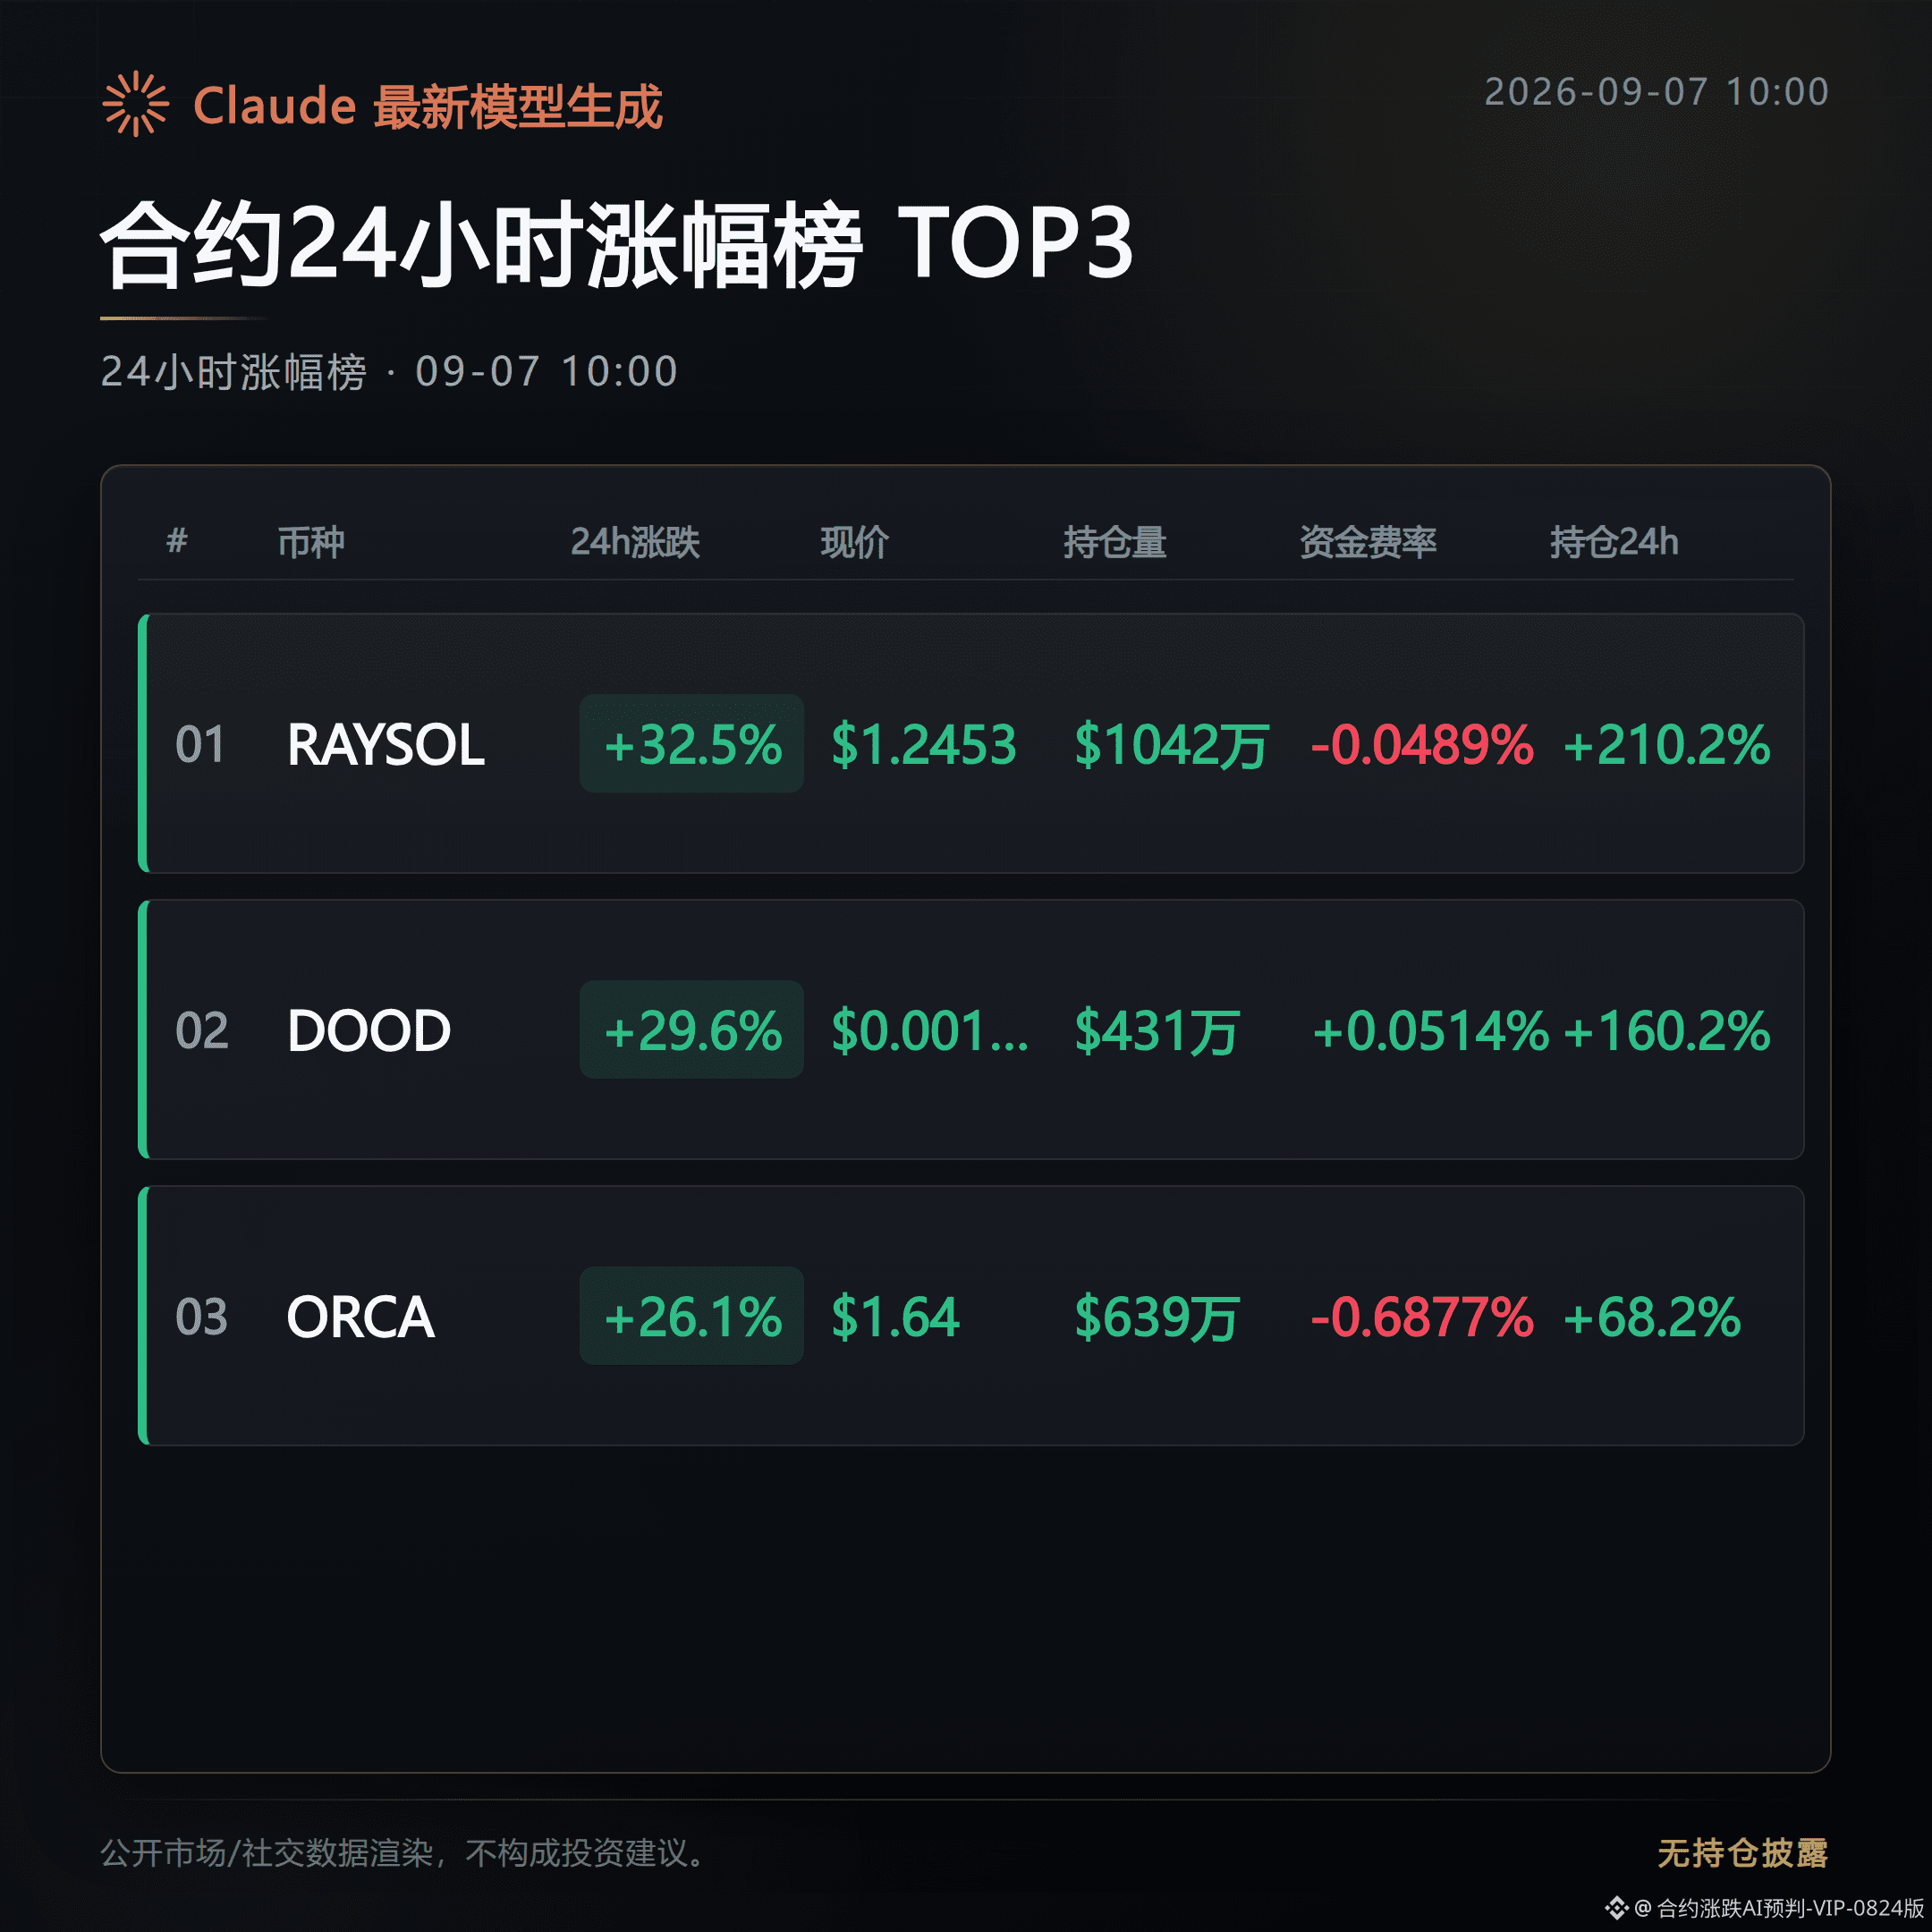
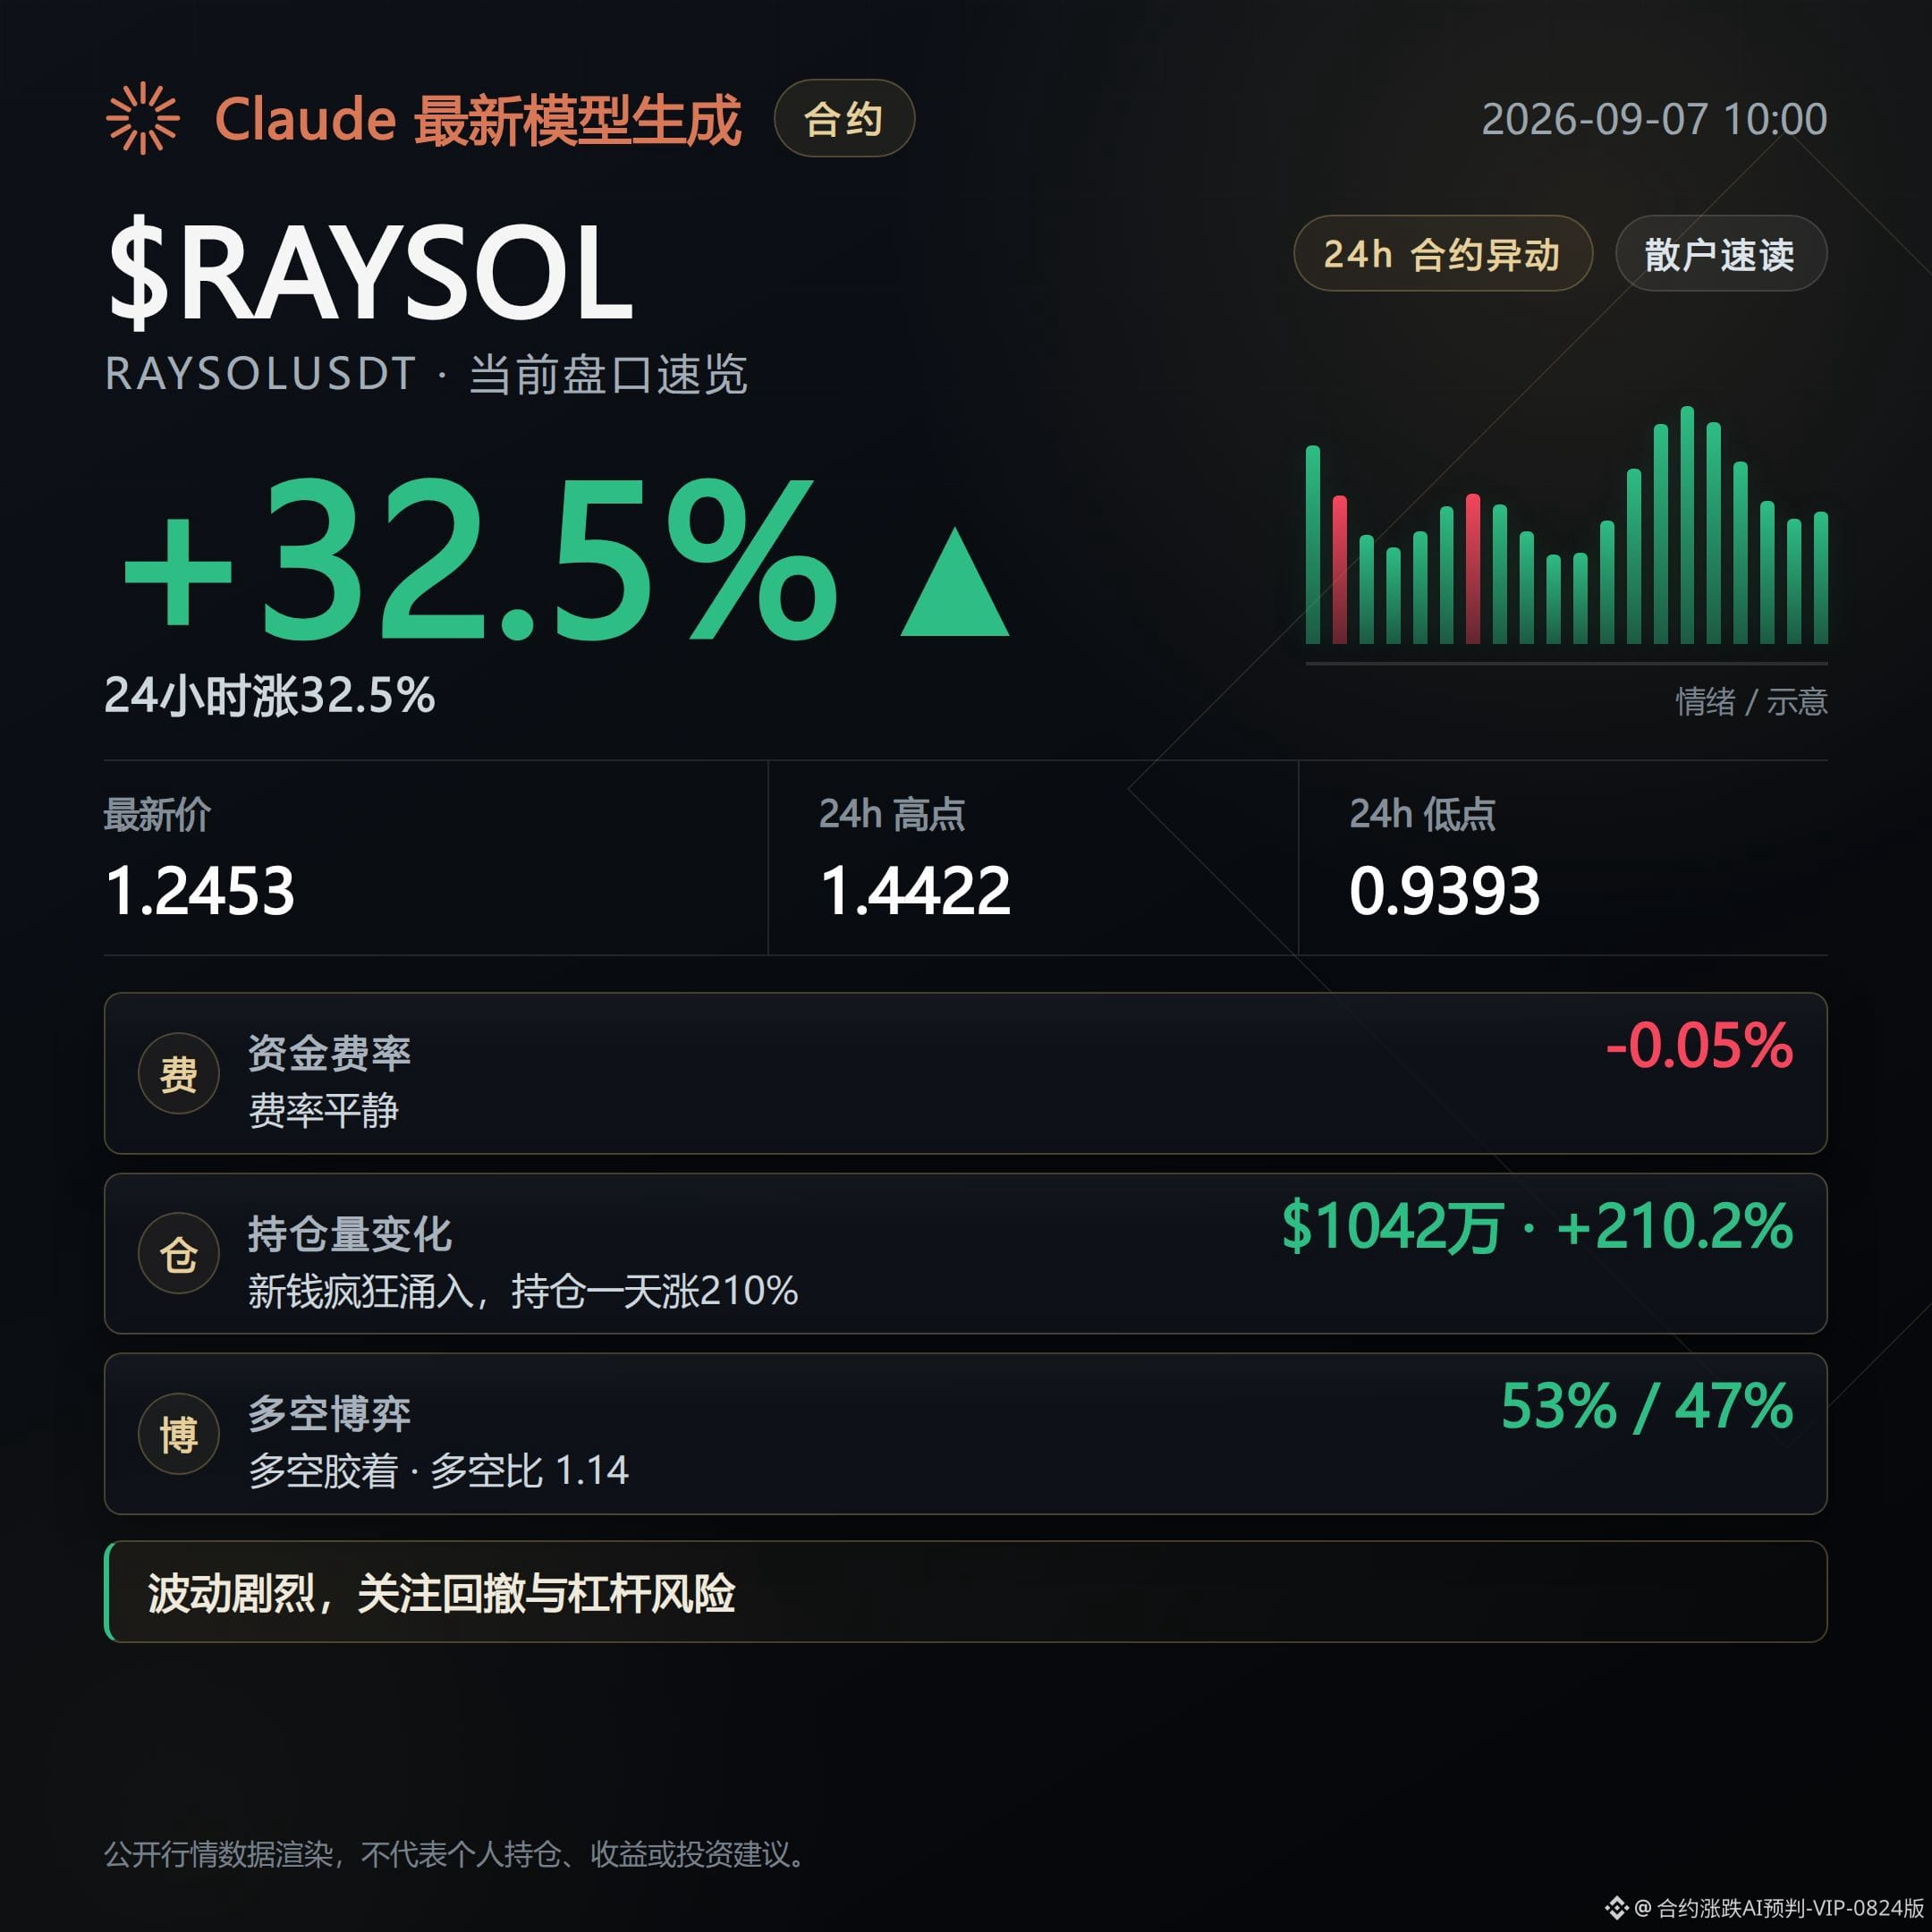
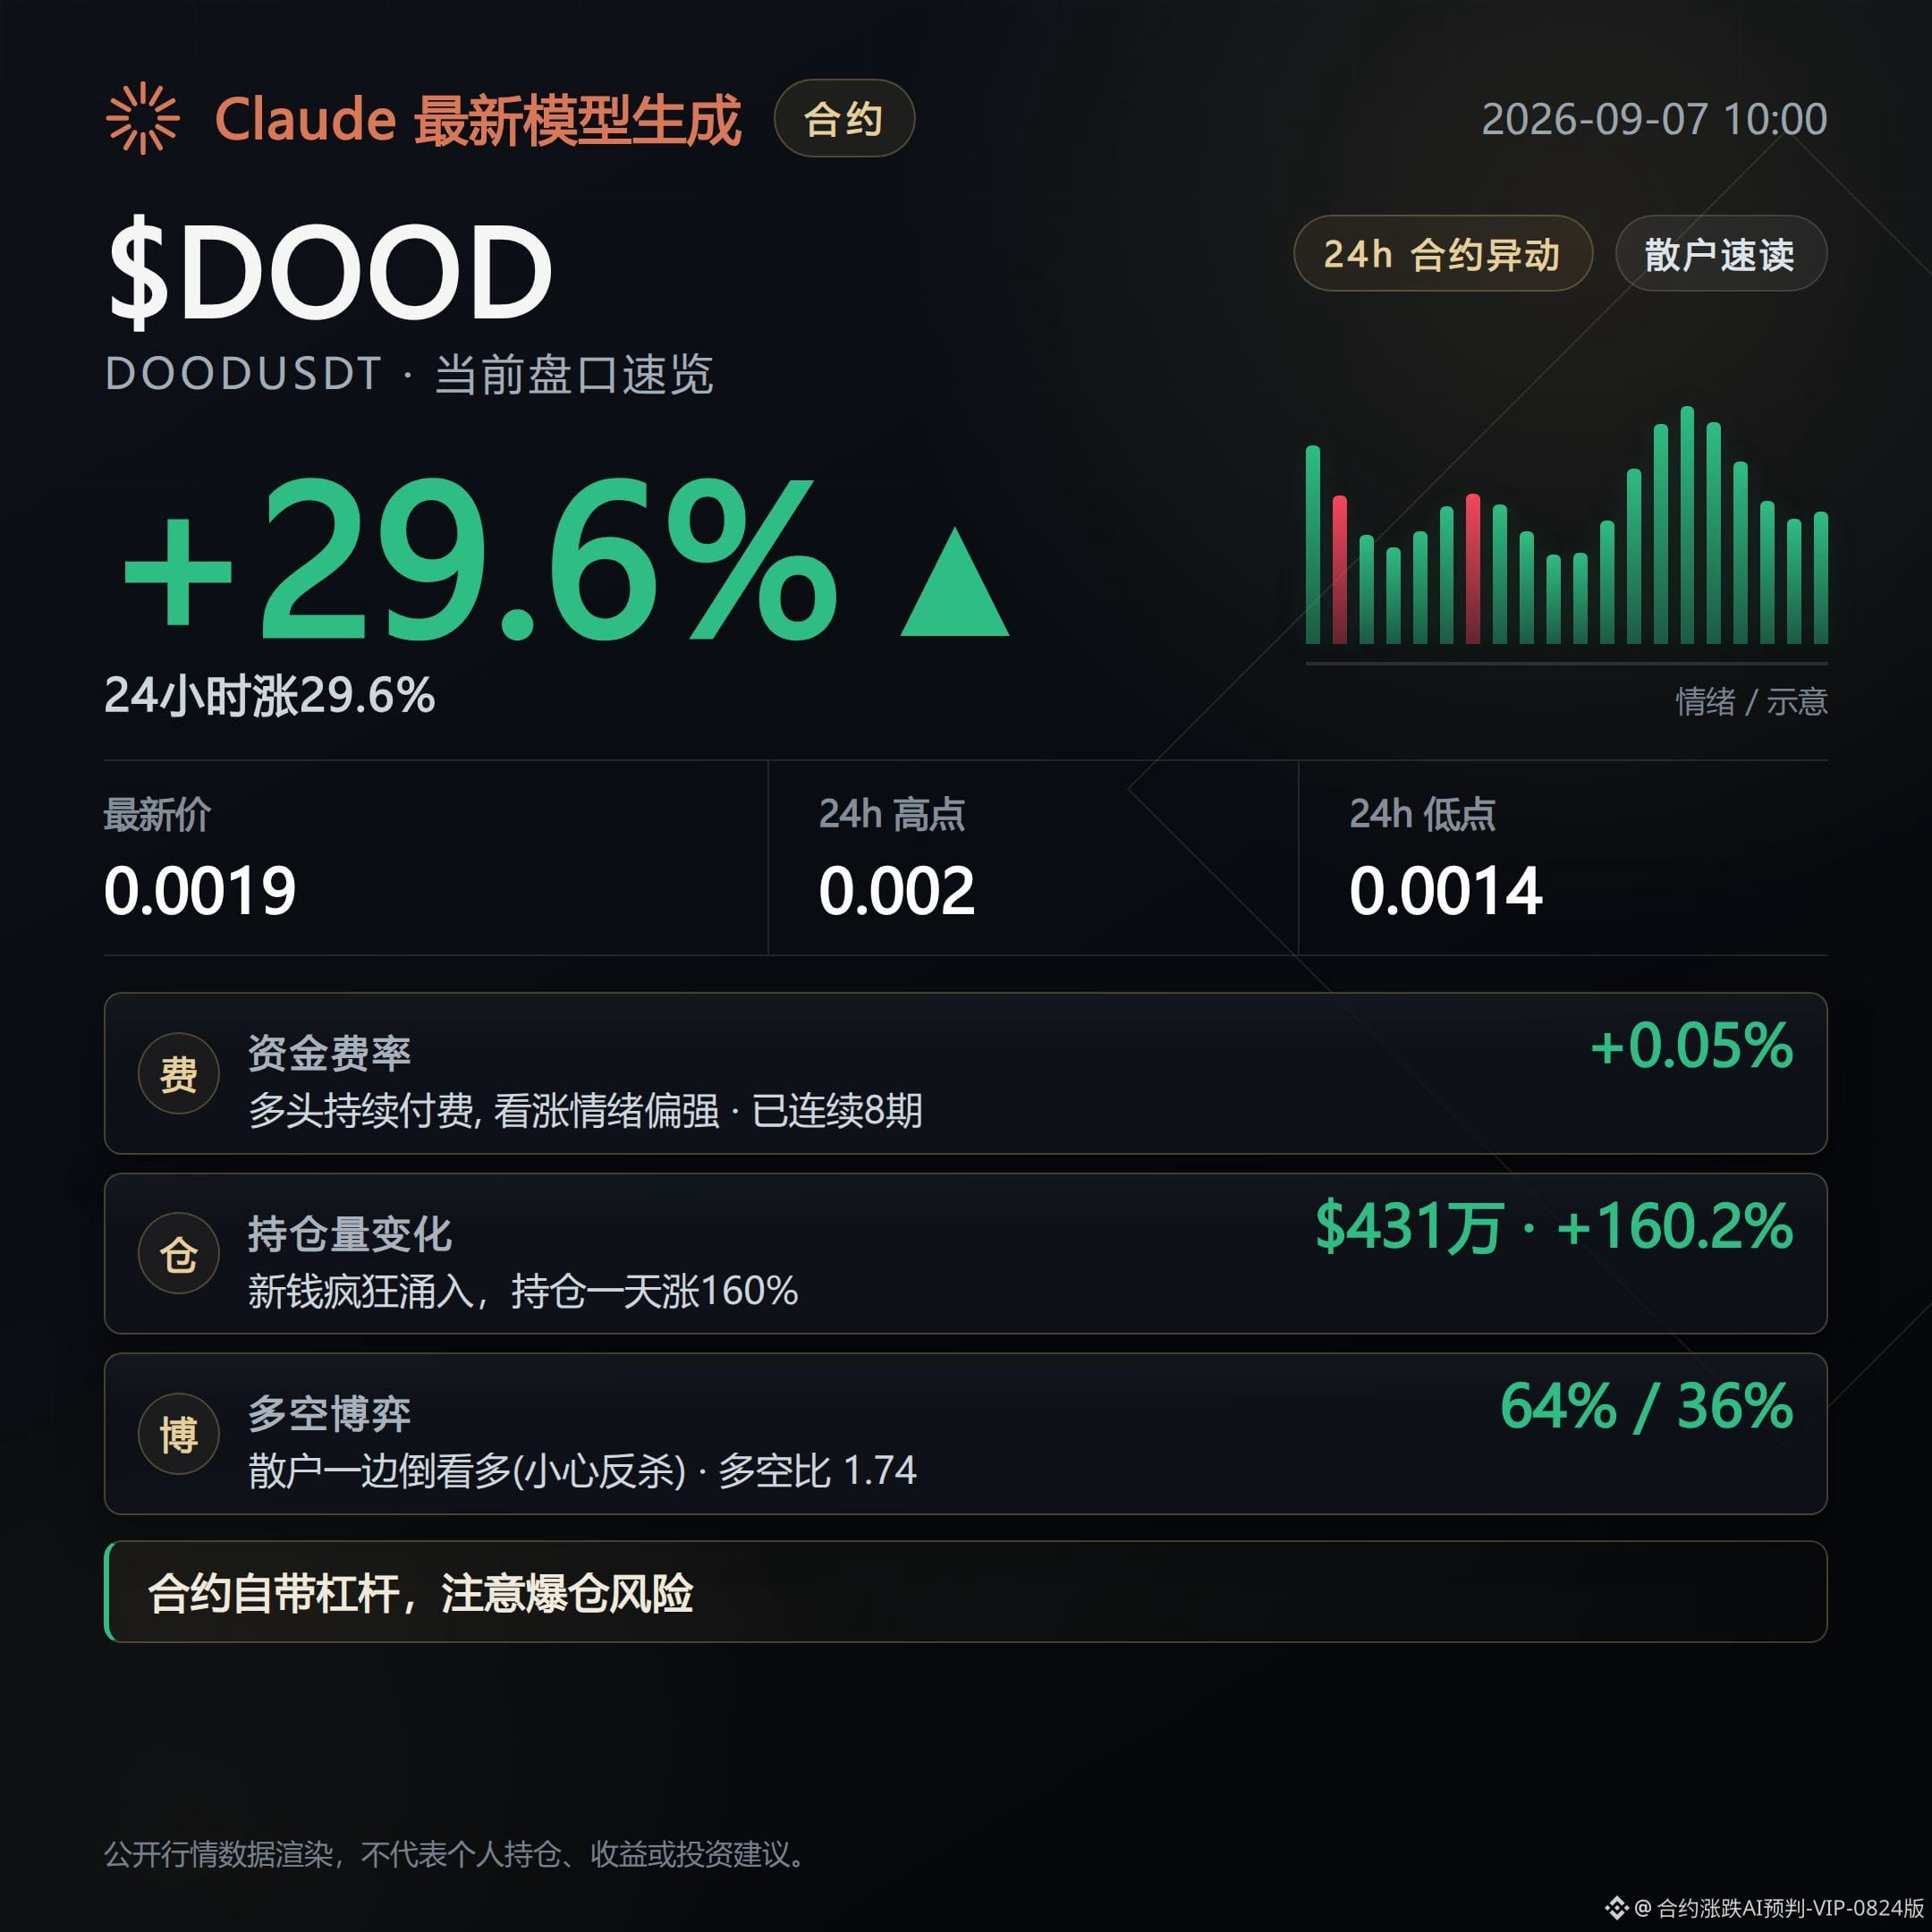
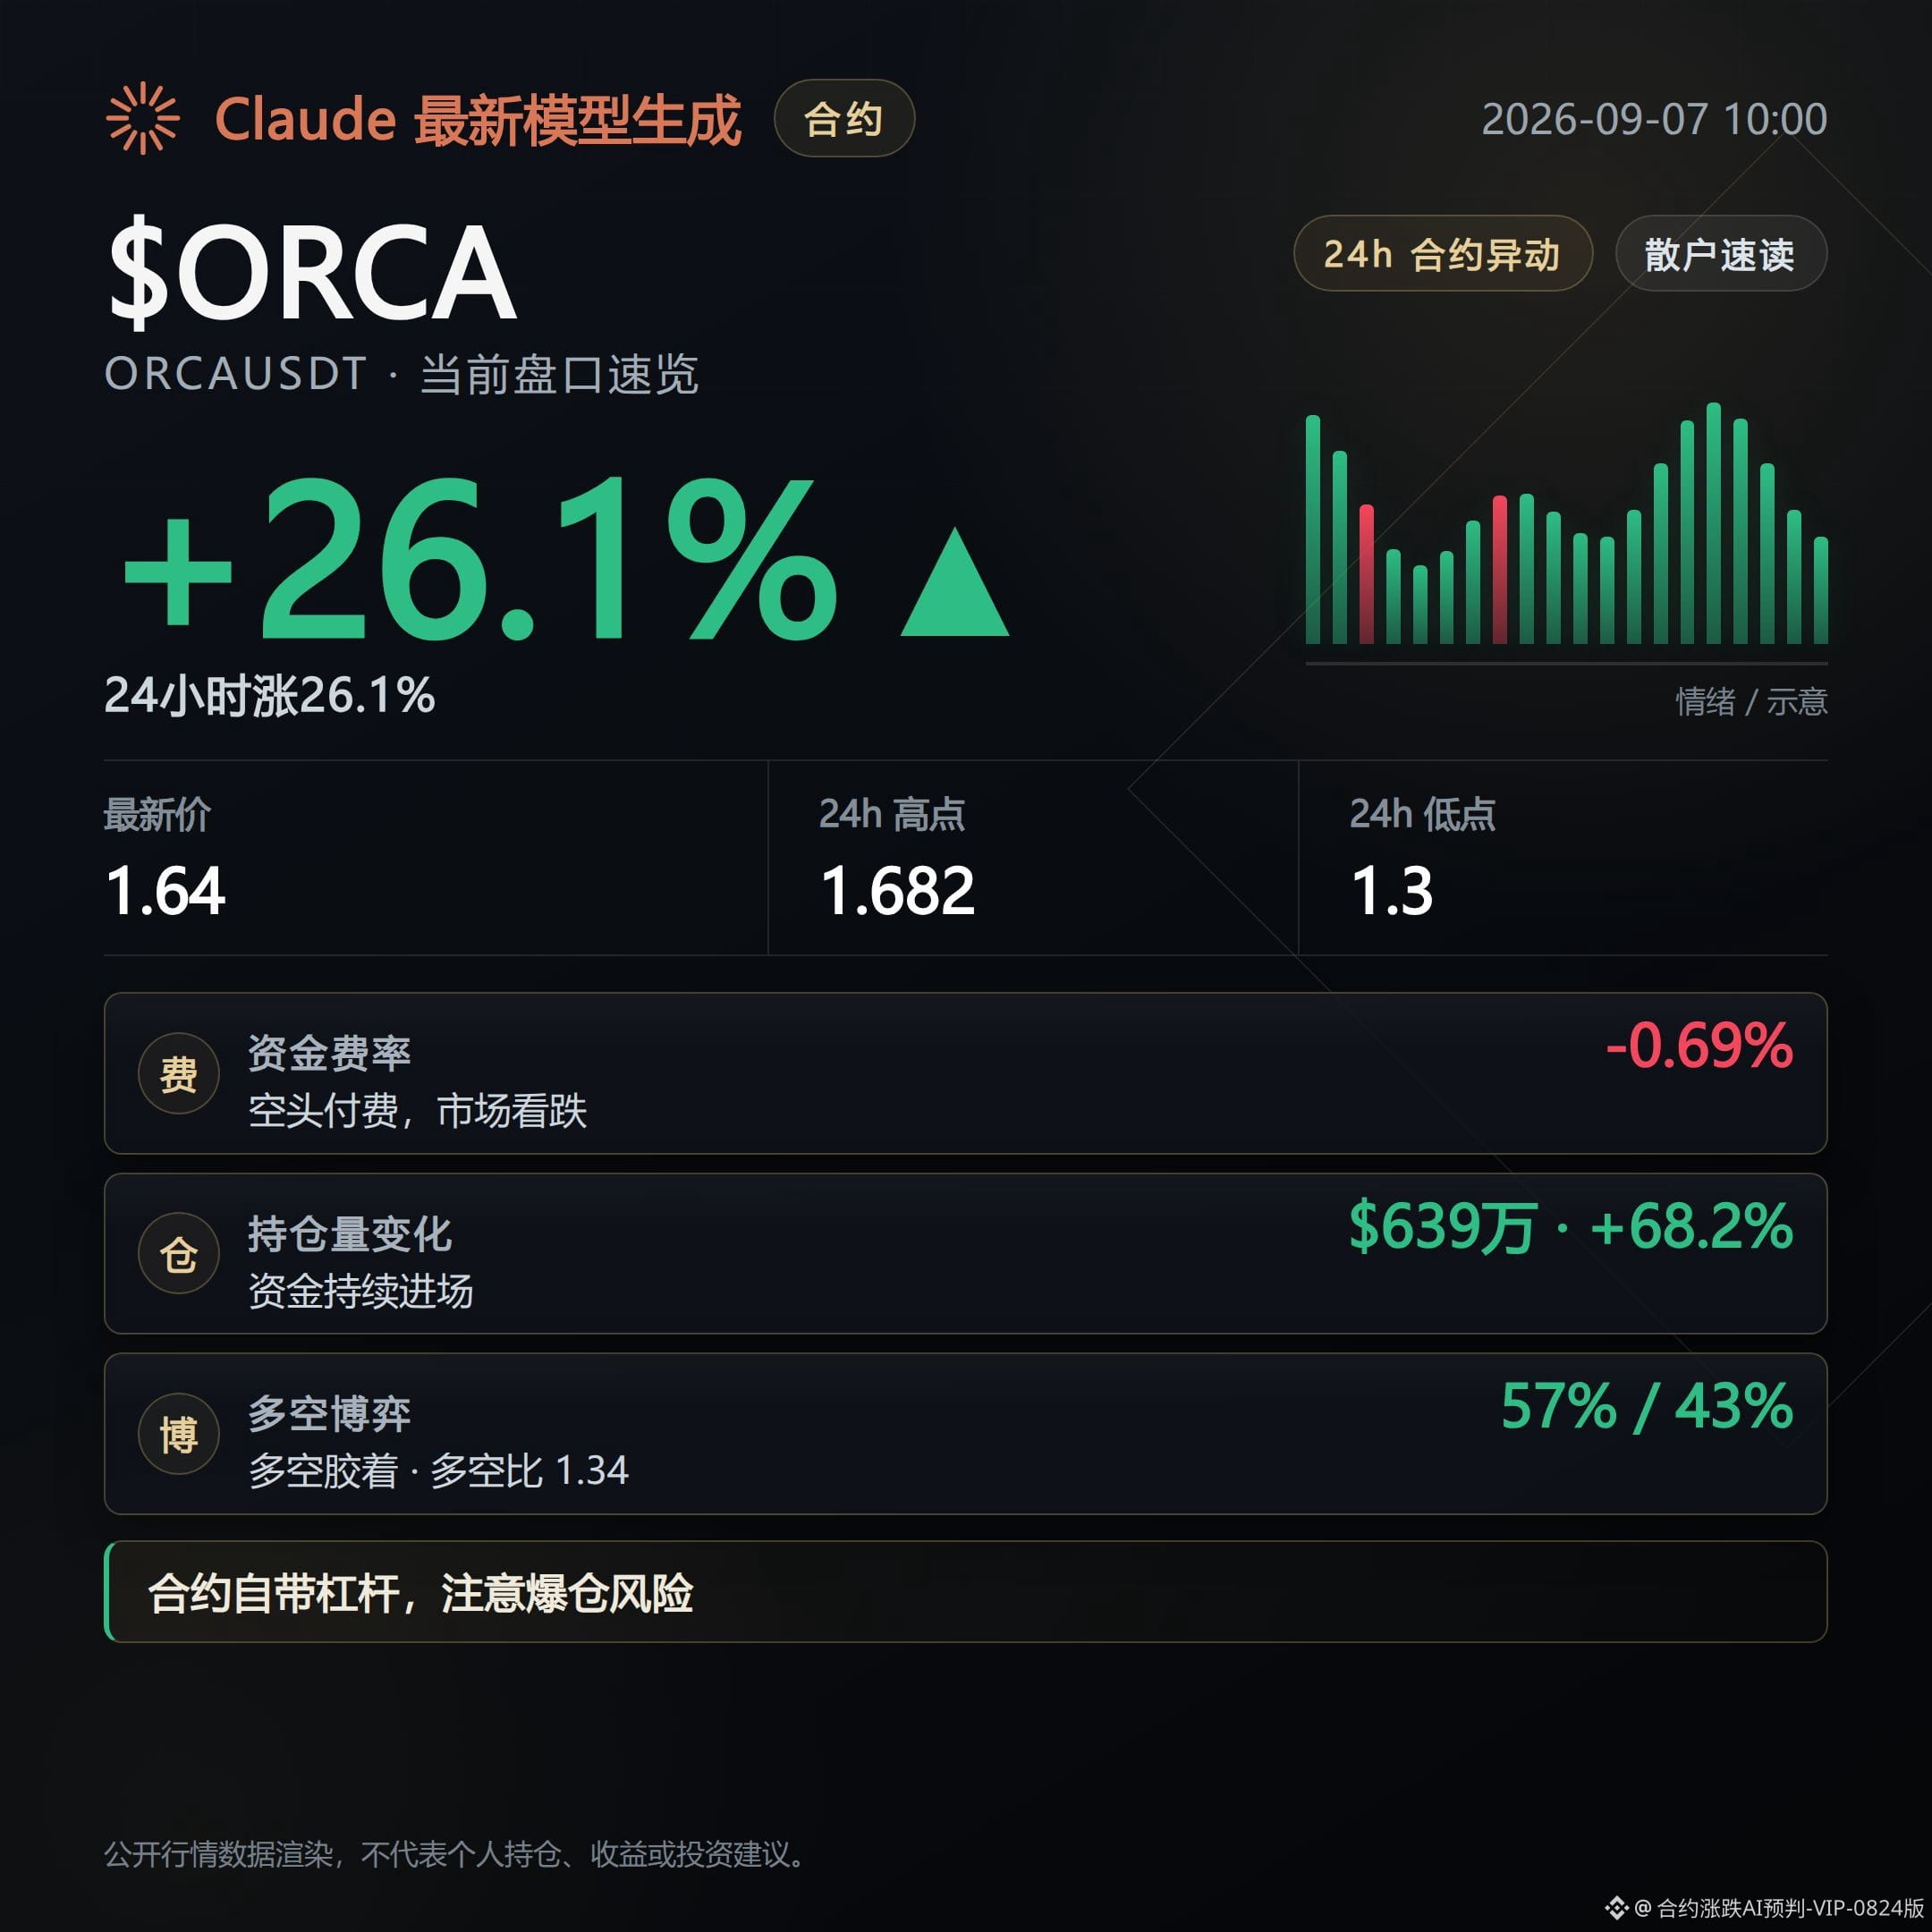
Log in to explore more content