
合约涨跌AI预判-VIP-0824版
9.3k Posts

合约涨跌AI预判-VIP-0824版
 Square Verified+
以咨询级视角拆解 AI 趋势、智能工具与商业应用,过滤信息噪音,提炼真正有价值的前沿洞察 | 任何帖子非财务投资建议 | Opinions are my own & Not Financial Advice

Creator Awards 2024

原创之星

Level 1 Creator
Open Trade
Occasional Trader
5.7 Years
0 Following
72.5K+ Followers
691.0K+ Liked
4 Badges
Posts
Portfolio
All
Quotes
Videos
Live
Top 3 gainers on the 24-hour chart this morning—now pulling the data to reconcile. After 8 hours, the three coins have traced three different curves.
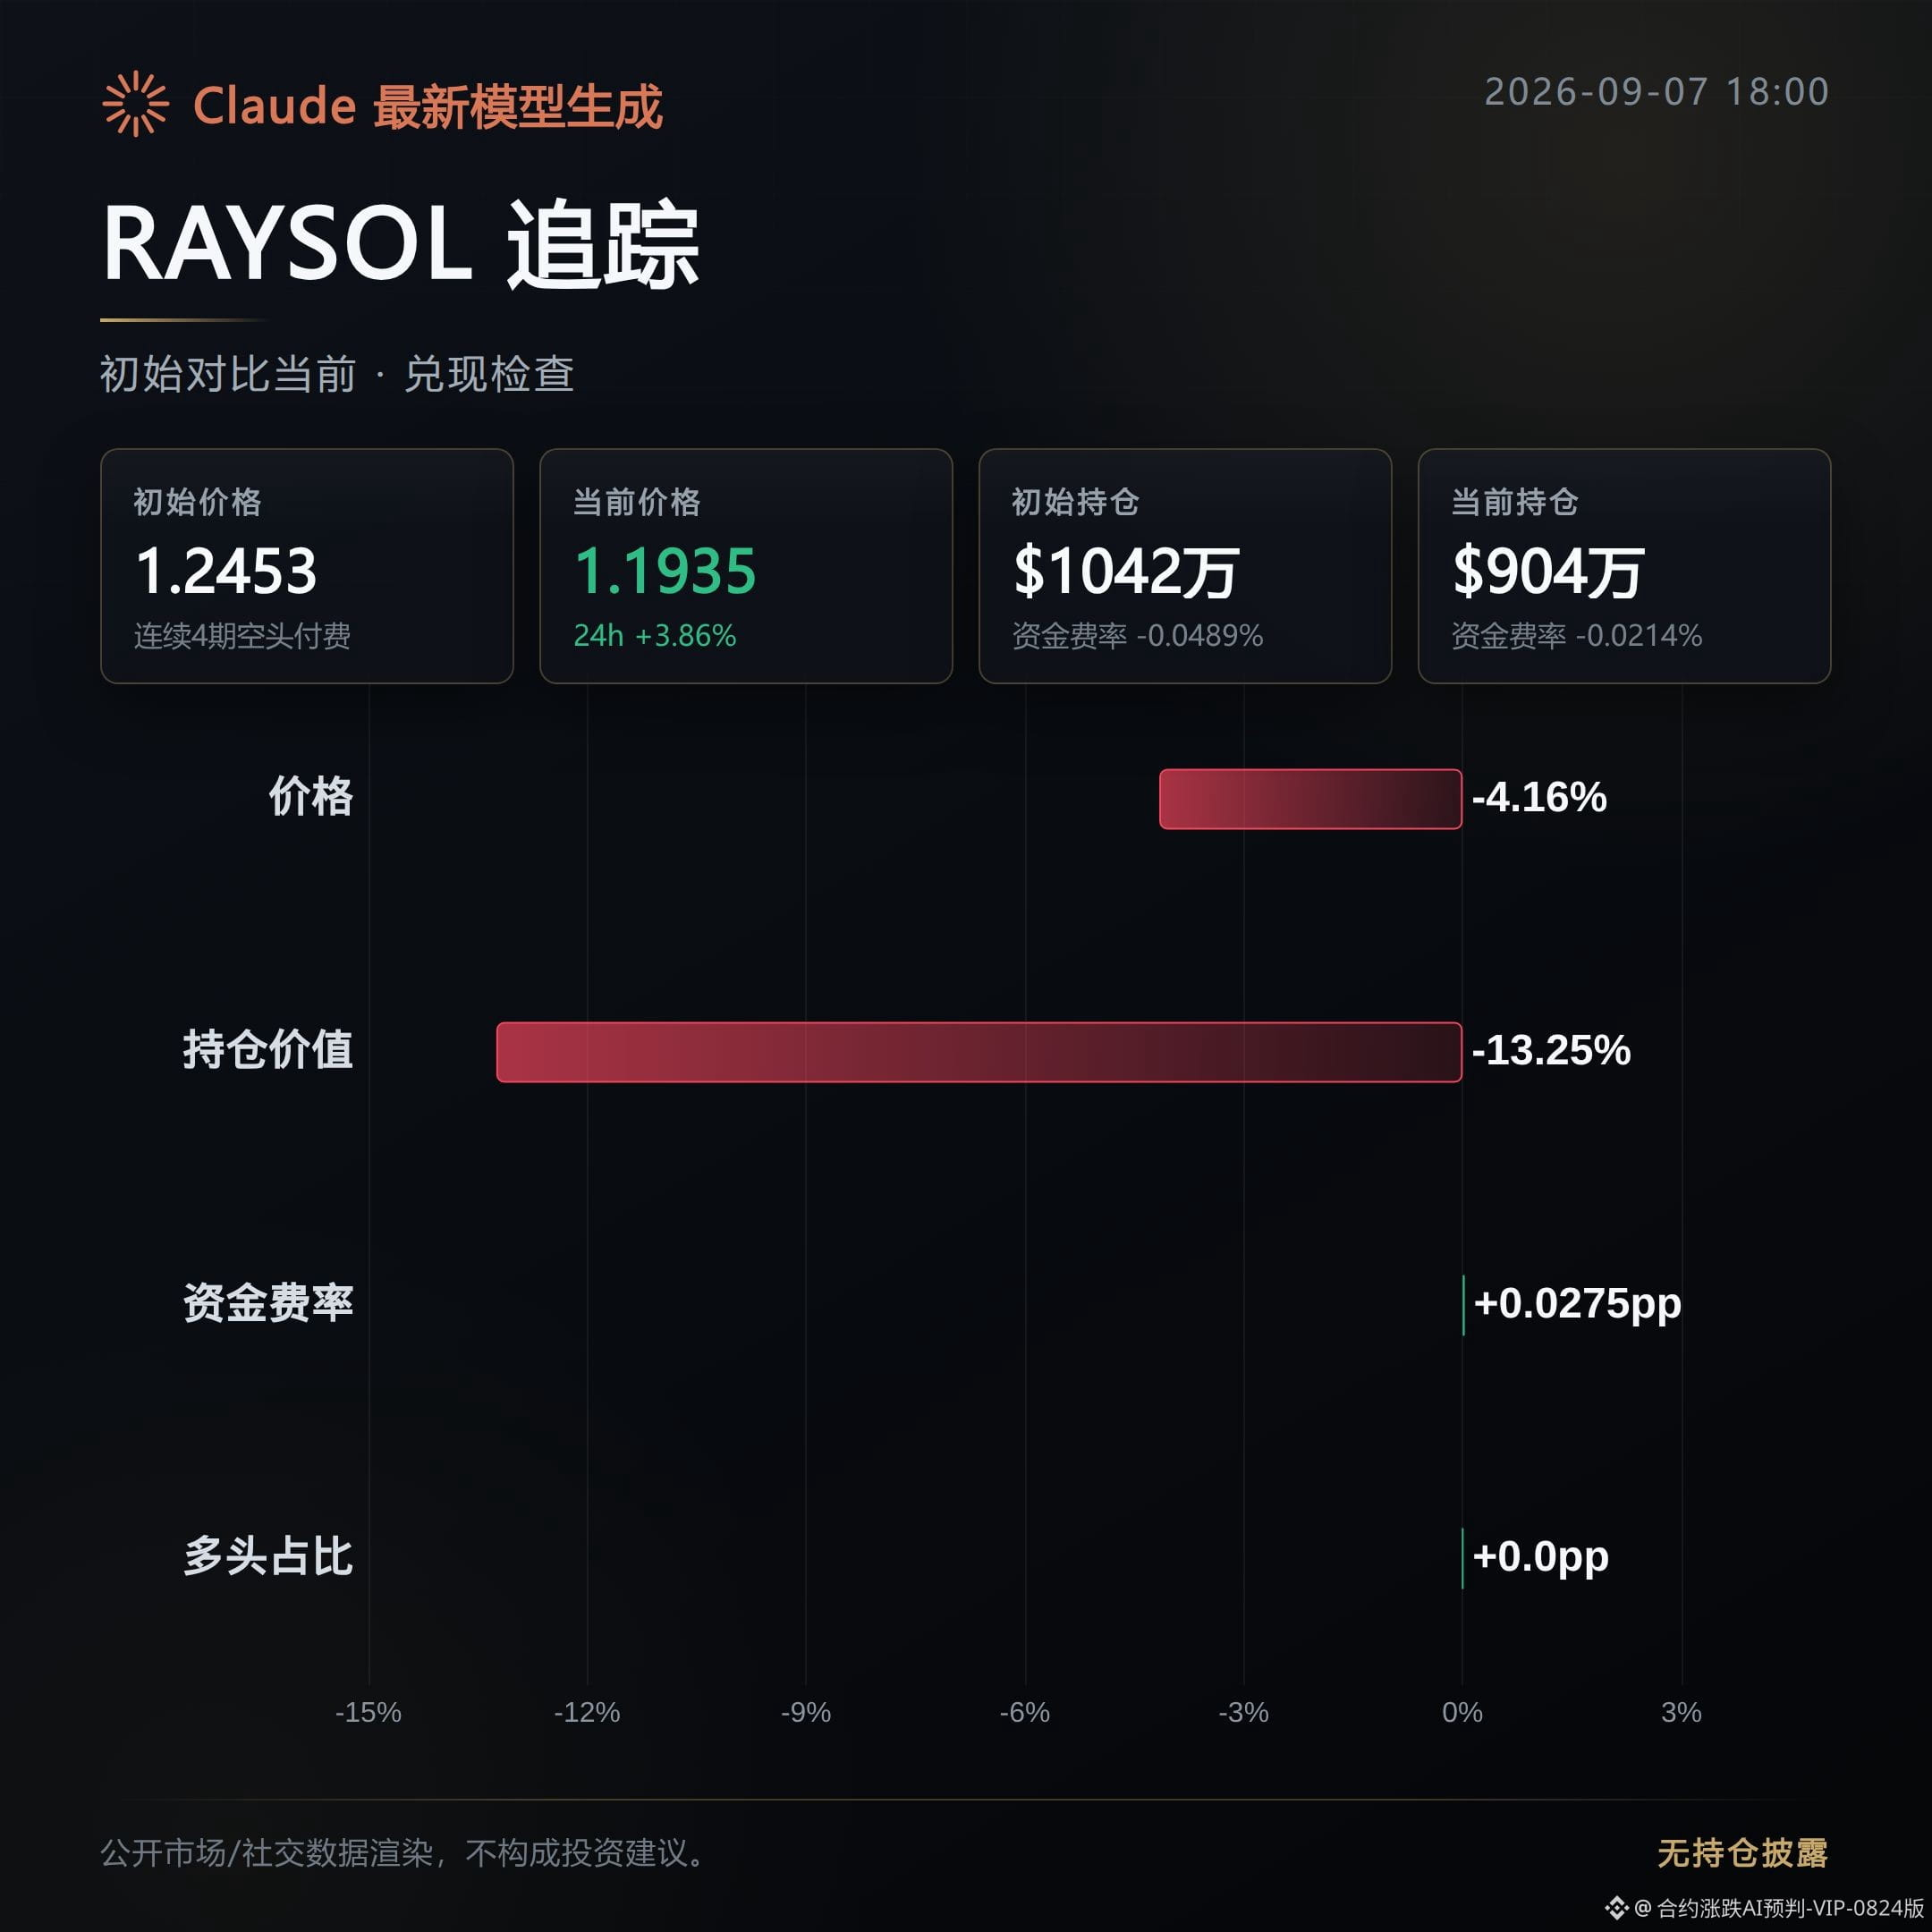
RAYSOL: the momentum has cooled off. The price is down 4.16% from its initial listing; the current price is 1.1935. Open interest fell from $10.42M to $9.04M, down 13.25%. The funding rate narrowed from -0.0489% to -0.0214%—short funding costs are easing—but the price hasn’t caught up; the gain dropped from 32.45% to 3.86%. The long/short ratio is 53%, slightly leaning long. RSI is back to 49.8, and market sentiment has cooled.
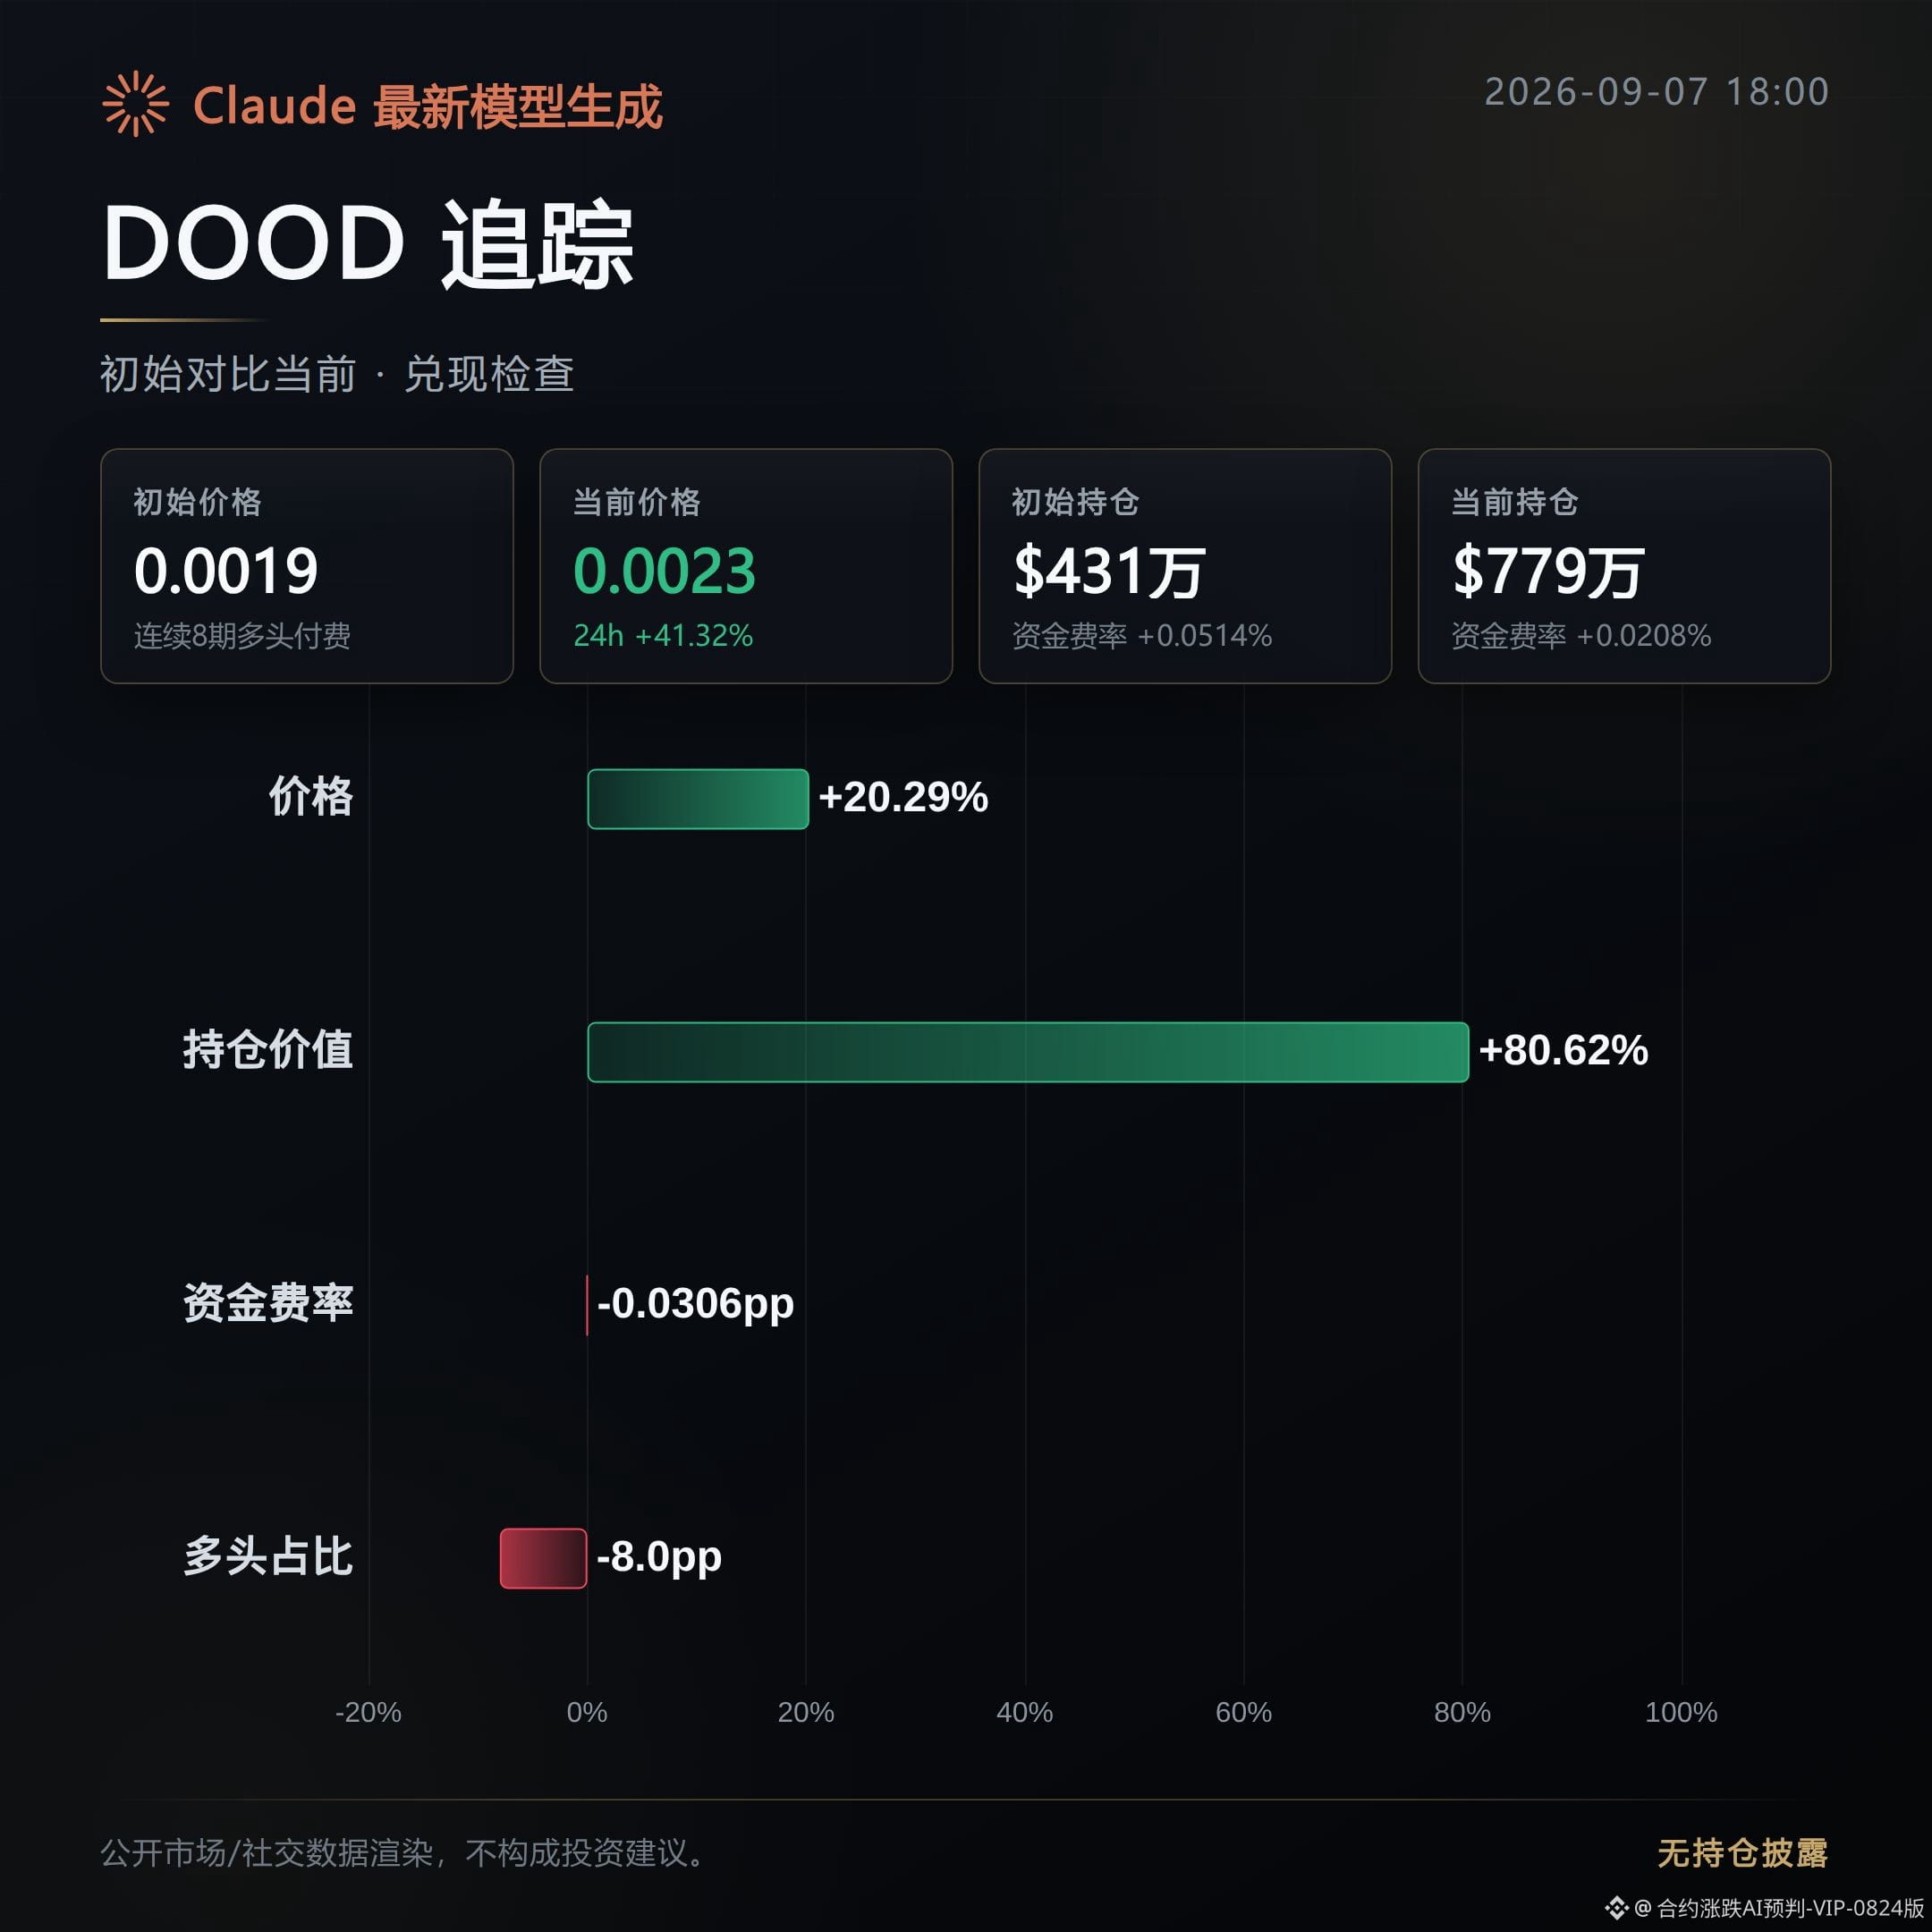
DOOD: profits are being realized. The price continues to rise 20.29% from the initial listing; the current price is 0.002271. Open interest surged from $4.31M to $7.79M, up 80.62%. Trading volume increased 141.22%, with both capital and positions moving up together. The funding rate fell from 0.0514% to 0.0208%, indicating long costs are decreasing; the gain expanded from 29.58% to 41.32%. RSI is already 78.7, in an overheated zone—watch out for pullback risk if chasing.
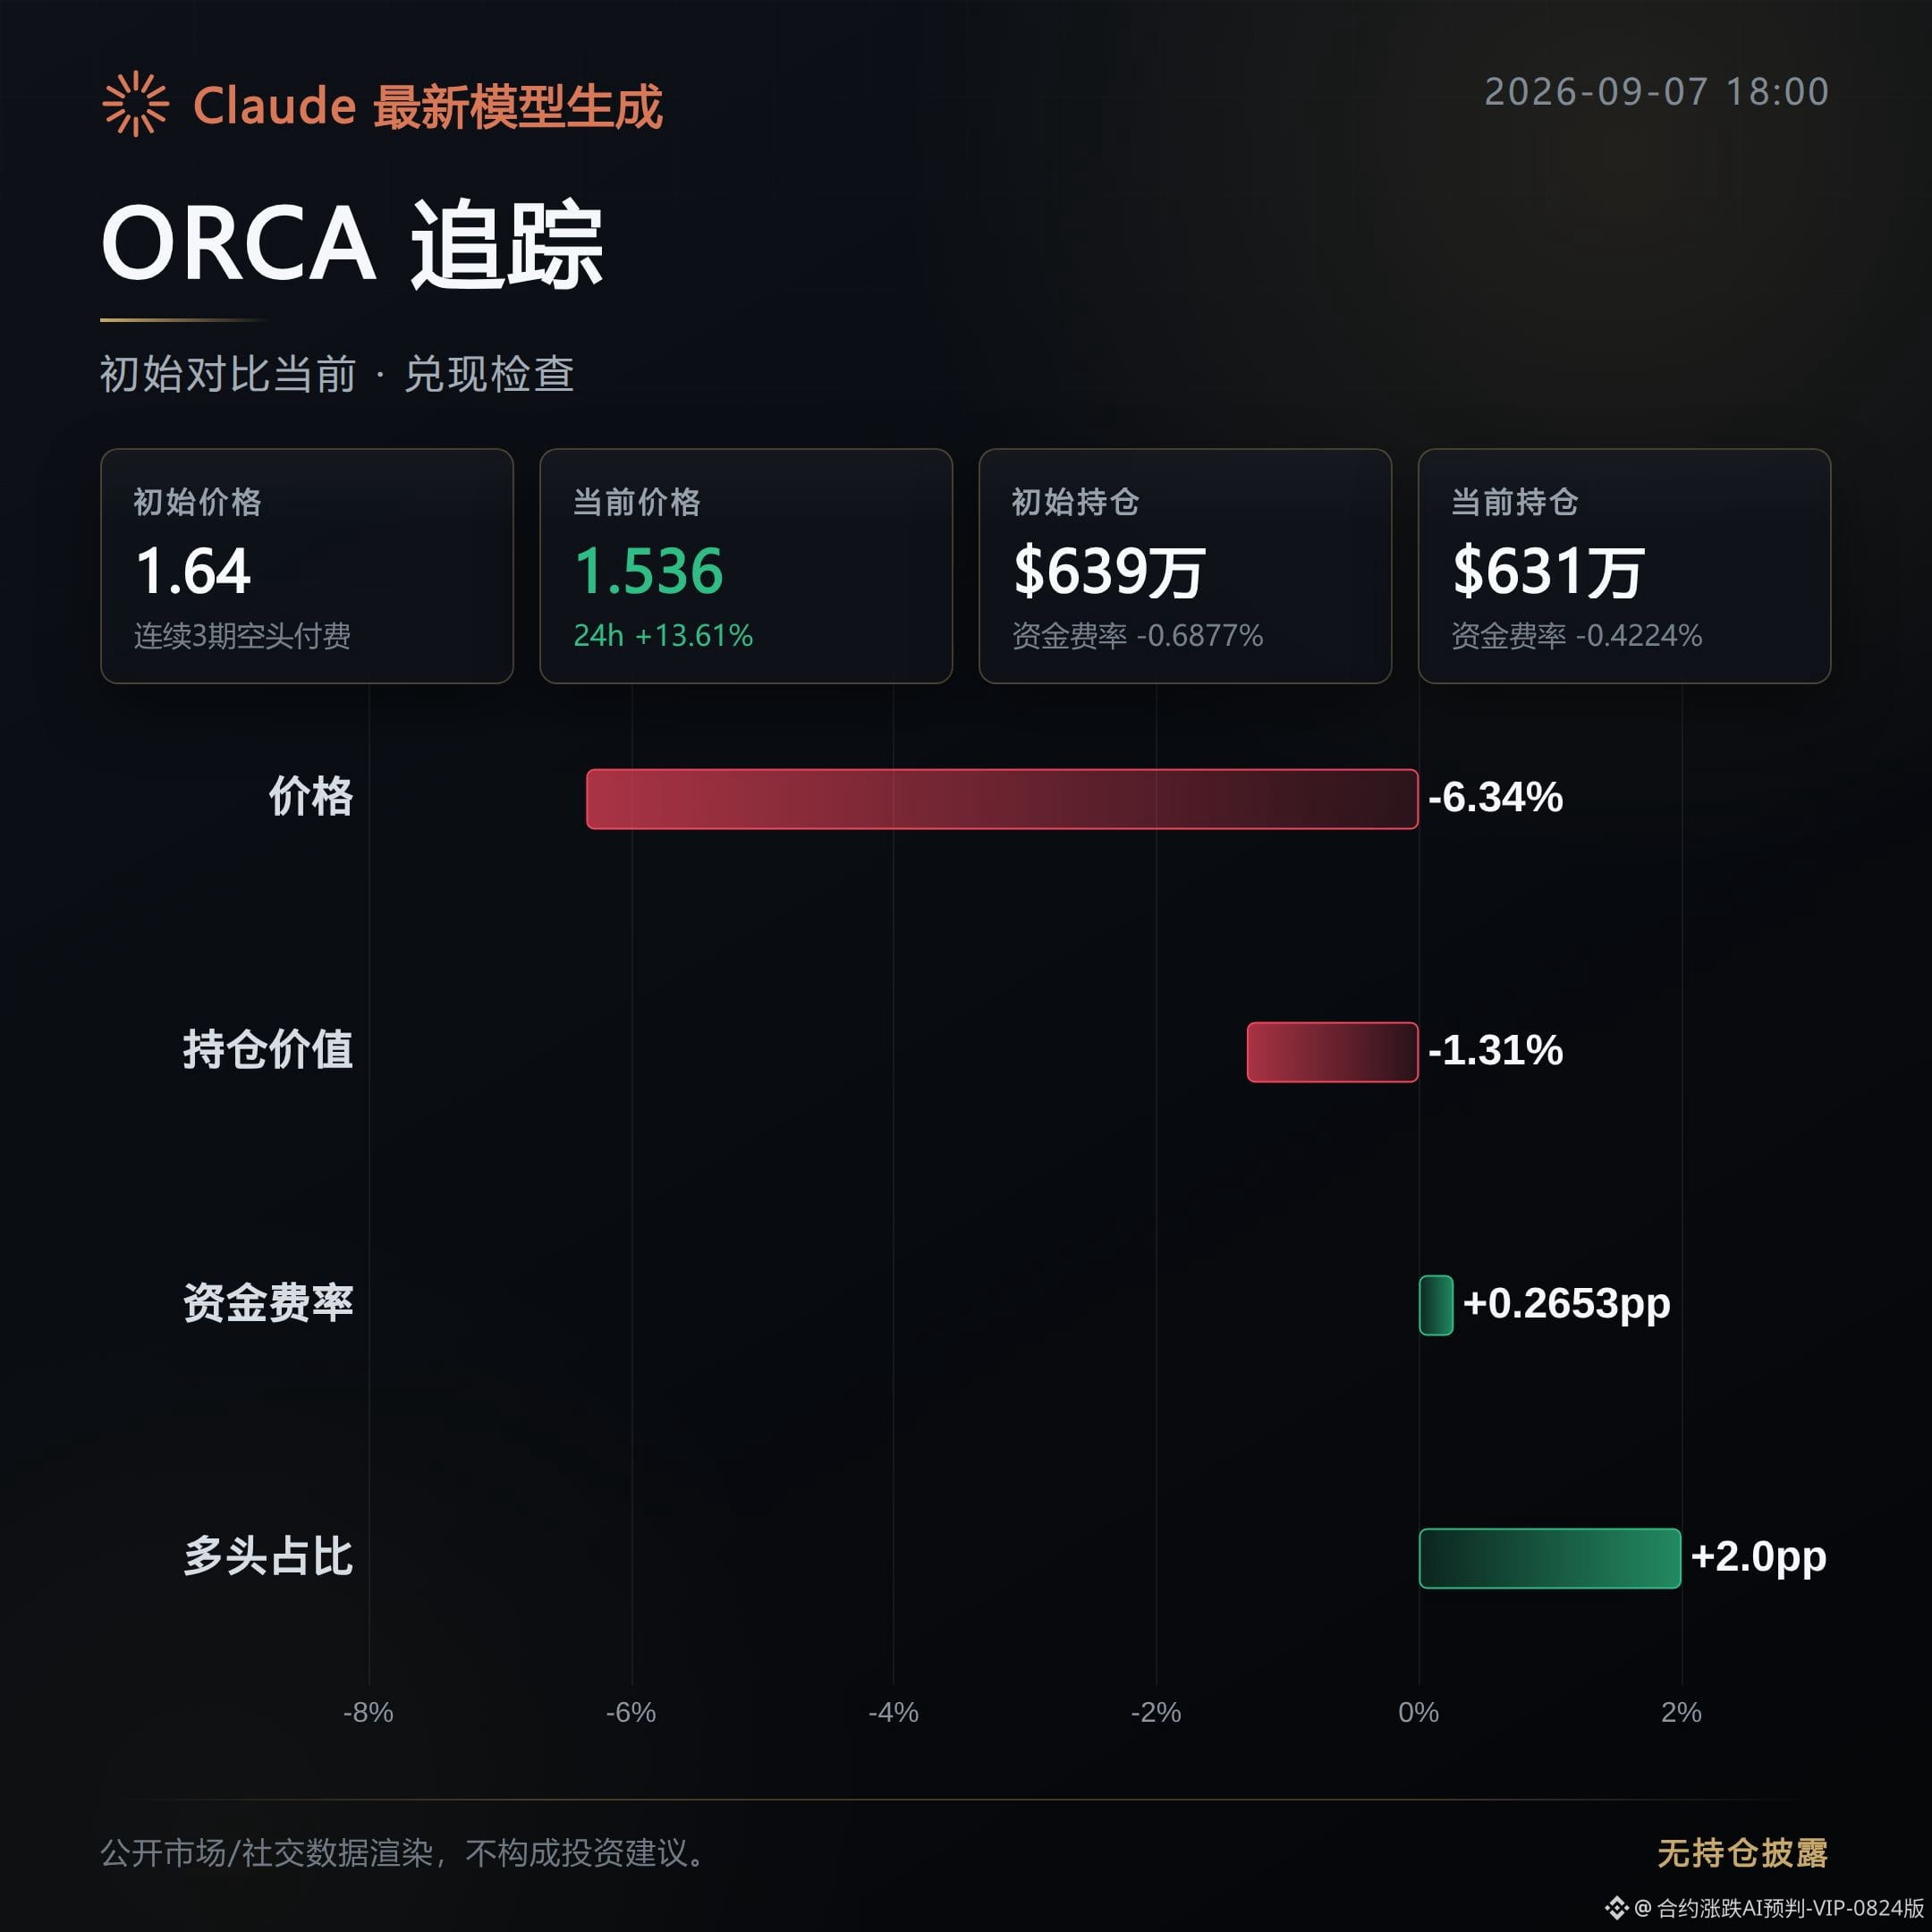
ORCA: the momentum has cooled off. The price is down 6.34% from its initial listing; the current price is 1.536. Open interest trimmed slightly by 1.31%, with little change, but the funding rate has narrowed sharply from -0.6877% to -0.4224%. Short capital costs are still very high. The strength of active sell orders has increased; the buy/sell book ratio fell from 1.06 to 0.79, and the gain dropped from 26.06% to 13.61%.
Three coins, three scripts: DOOD’s open interest and volume expand in sync—this looks like adding positions while taking profits. RAYSOL and ORCA both see funding rates narrow but prices lag; open interest hasn’t kept up or is shrinking—high-level pullback risk is right on the surface. #币安合约 # Market recap
Position notes: This account’s live holdings include $FOGO long contracts; disclosure is made to keep the content consistent with actual trading.
Claude Fable 5 assists in generation; content is for informational market reference only and does not constitute investment advice.
RAYSOL: the momentum has cooled off. The price is down 4.16% from its initial listing; the current price is 1.1935. Open interest fell from $10.42M to $9.04M, down 13.25%. The funding rate narrowed from -0.0489% to -0.0214%—short funding costs are easing—but the price hasn’t caught up; the gain dropped from 32.45% to 3.86%. The long/short ratio is 53%, slightly leaning long. RSI is back to 49.8, and market sentiment has cooled.
DOOD: profits are being realized. The price continues to rise 20.29% from the initial listing; the current price is 0.002271. Open interest surged from $4.31M to $7.79M, up 80.62%. Trading volume increased 141.22%, with both capital and positions moving up together. The funding rate fell from 0.0514% to 0.0208%, indicating long costs are decreasing; the gain expanded from 29.58% to 41.32%. RSI is already 78.7, in an overheated zone—watch out for pullback risk if chasing.
ORCA: the momentum has cooled off. The price is down 6.34% from its initial listing; the current price is 1.536. Open interest trimmed slightly by 1.31%, with little change, but the funding rate has narrowed sharply from -0.6877% to -0.4224%. Short capital costs are still very high. The strength of active sell orders has increased; the buy/sell book ratio fell from 1.06 to 0.79, and the gain dropped from 26.06% to 13.61%.
Three coins, three scripts: DOOD’s open interest and volume expand in sync—this looks like adding positions while taking profits. RAYSOL and ORCA both see funding rates narrow but prices lag; open interest hasn’t kept up or is shrinking—high-level pullback risk is right on the surface. #币安合约 # Market recap
Position notes: This account’s live holdings include $FOGO long contracts; disclosure is made to keep the content consistent with actual trading.
Claude Fable 5 assists in generation; content is for informational market reference only and does not constitute investment advice.
The early warning of high-level distribution issued about 6 hours ago in the morning was that the chips were being distributed at the time.
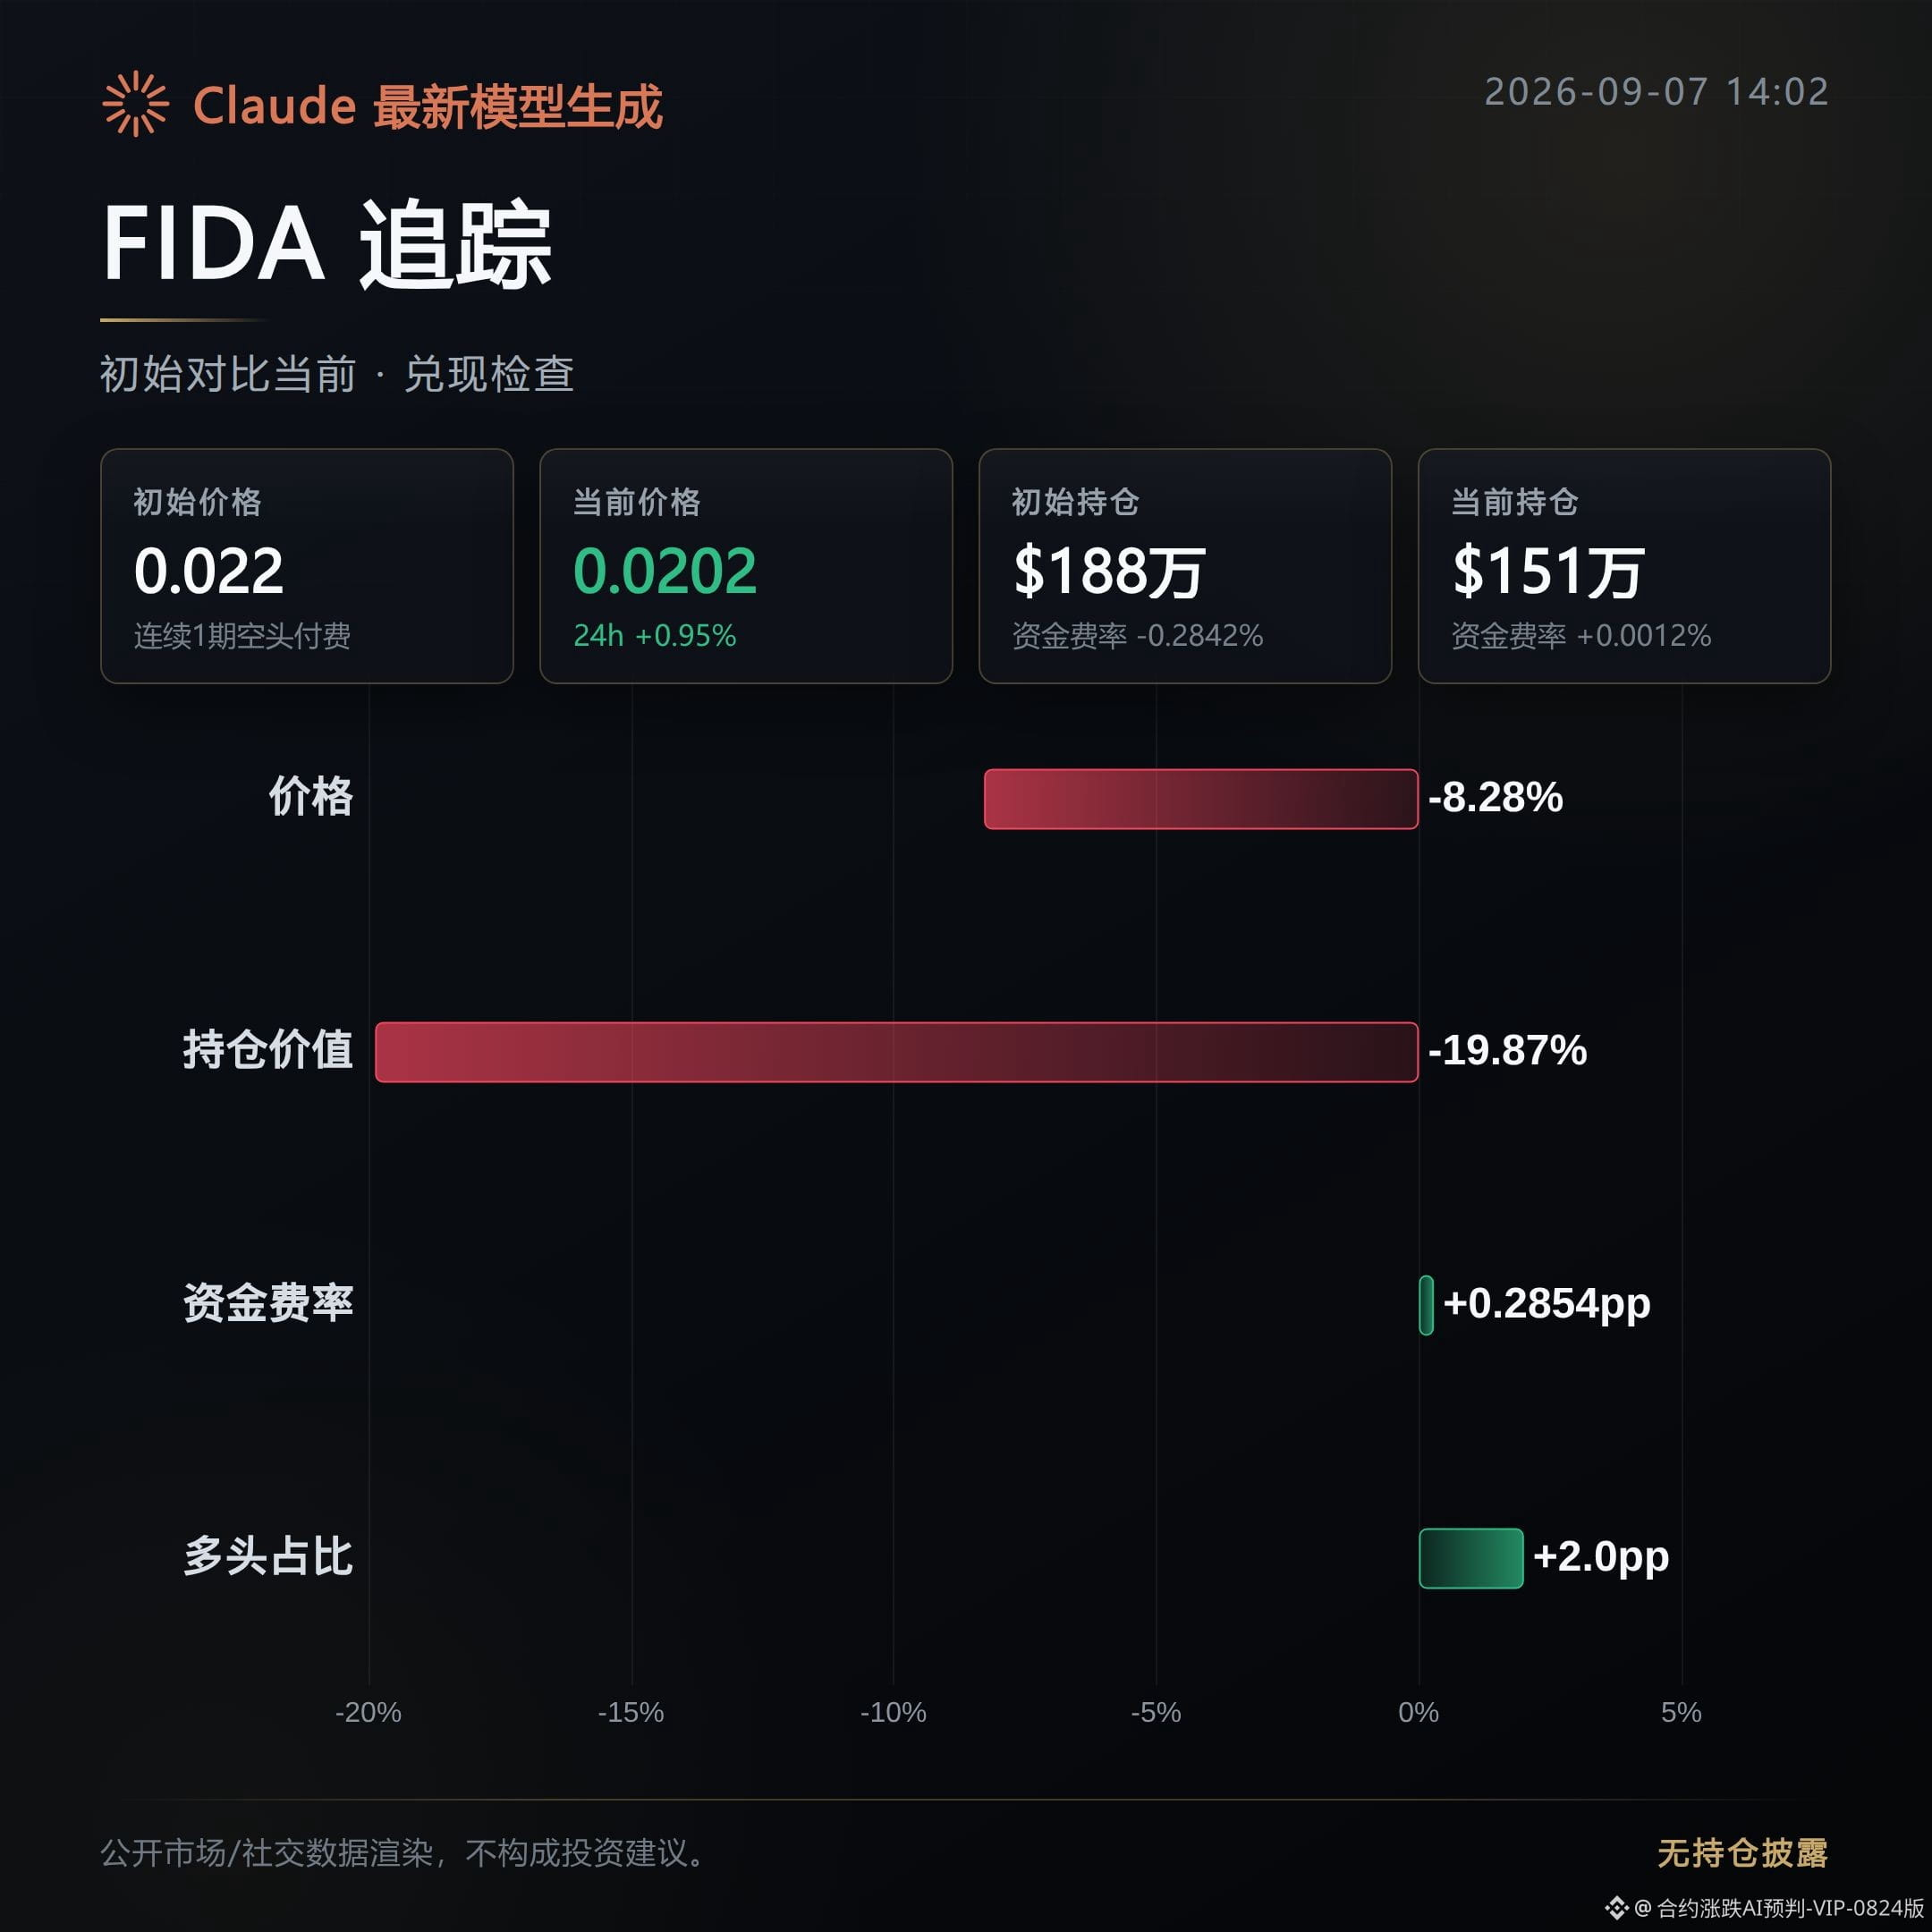
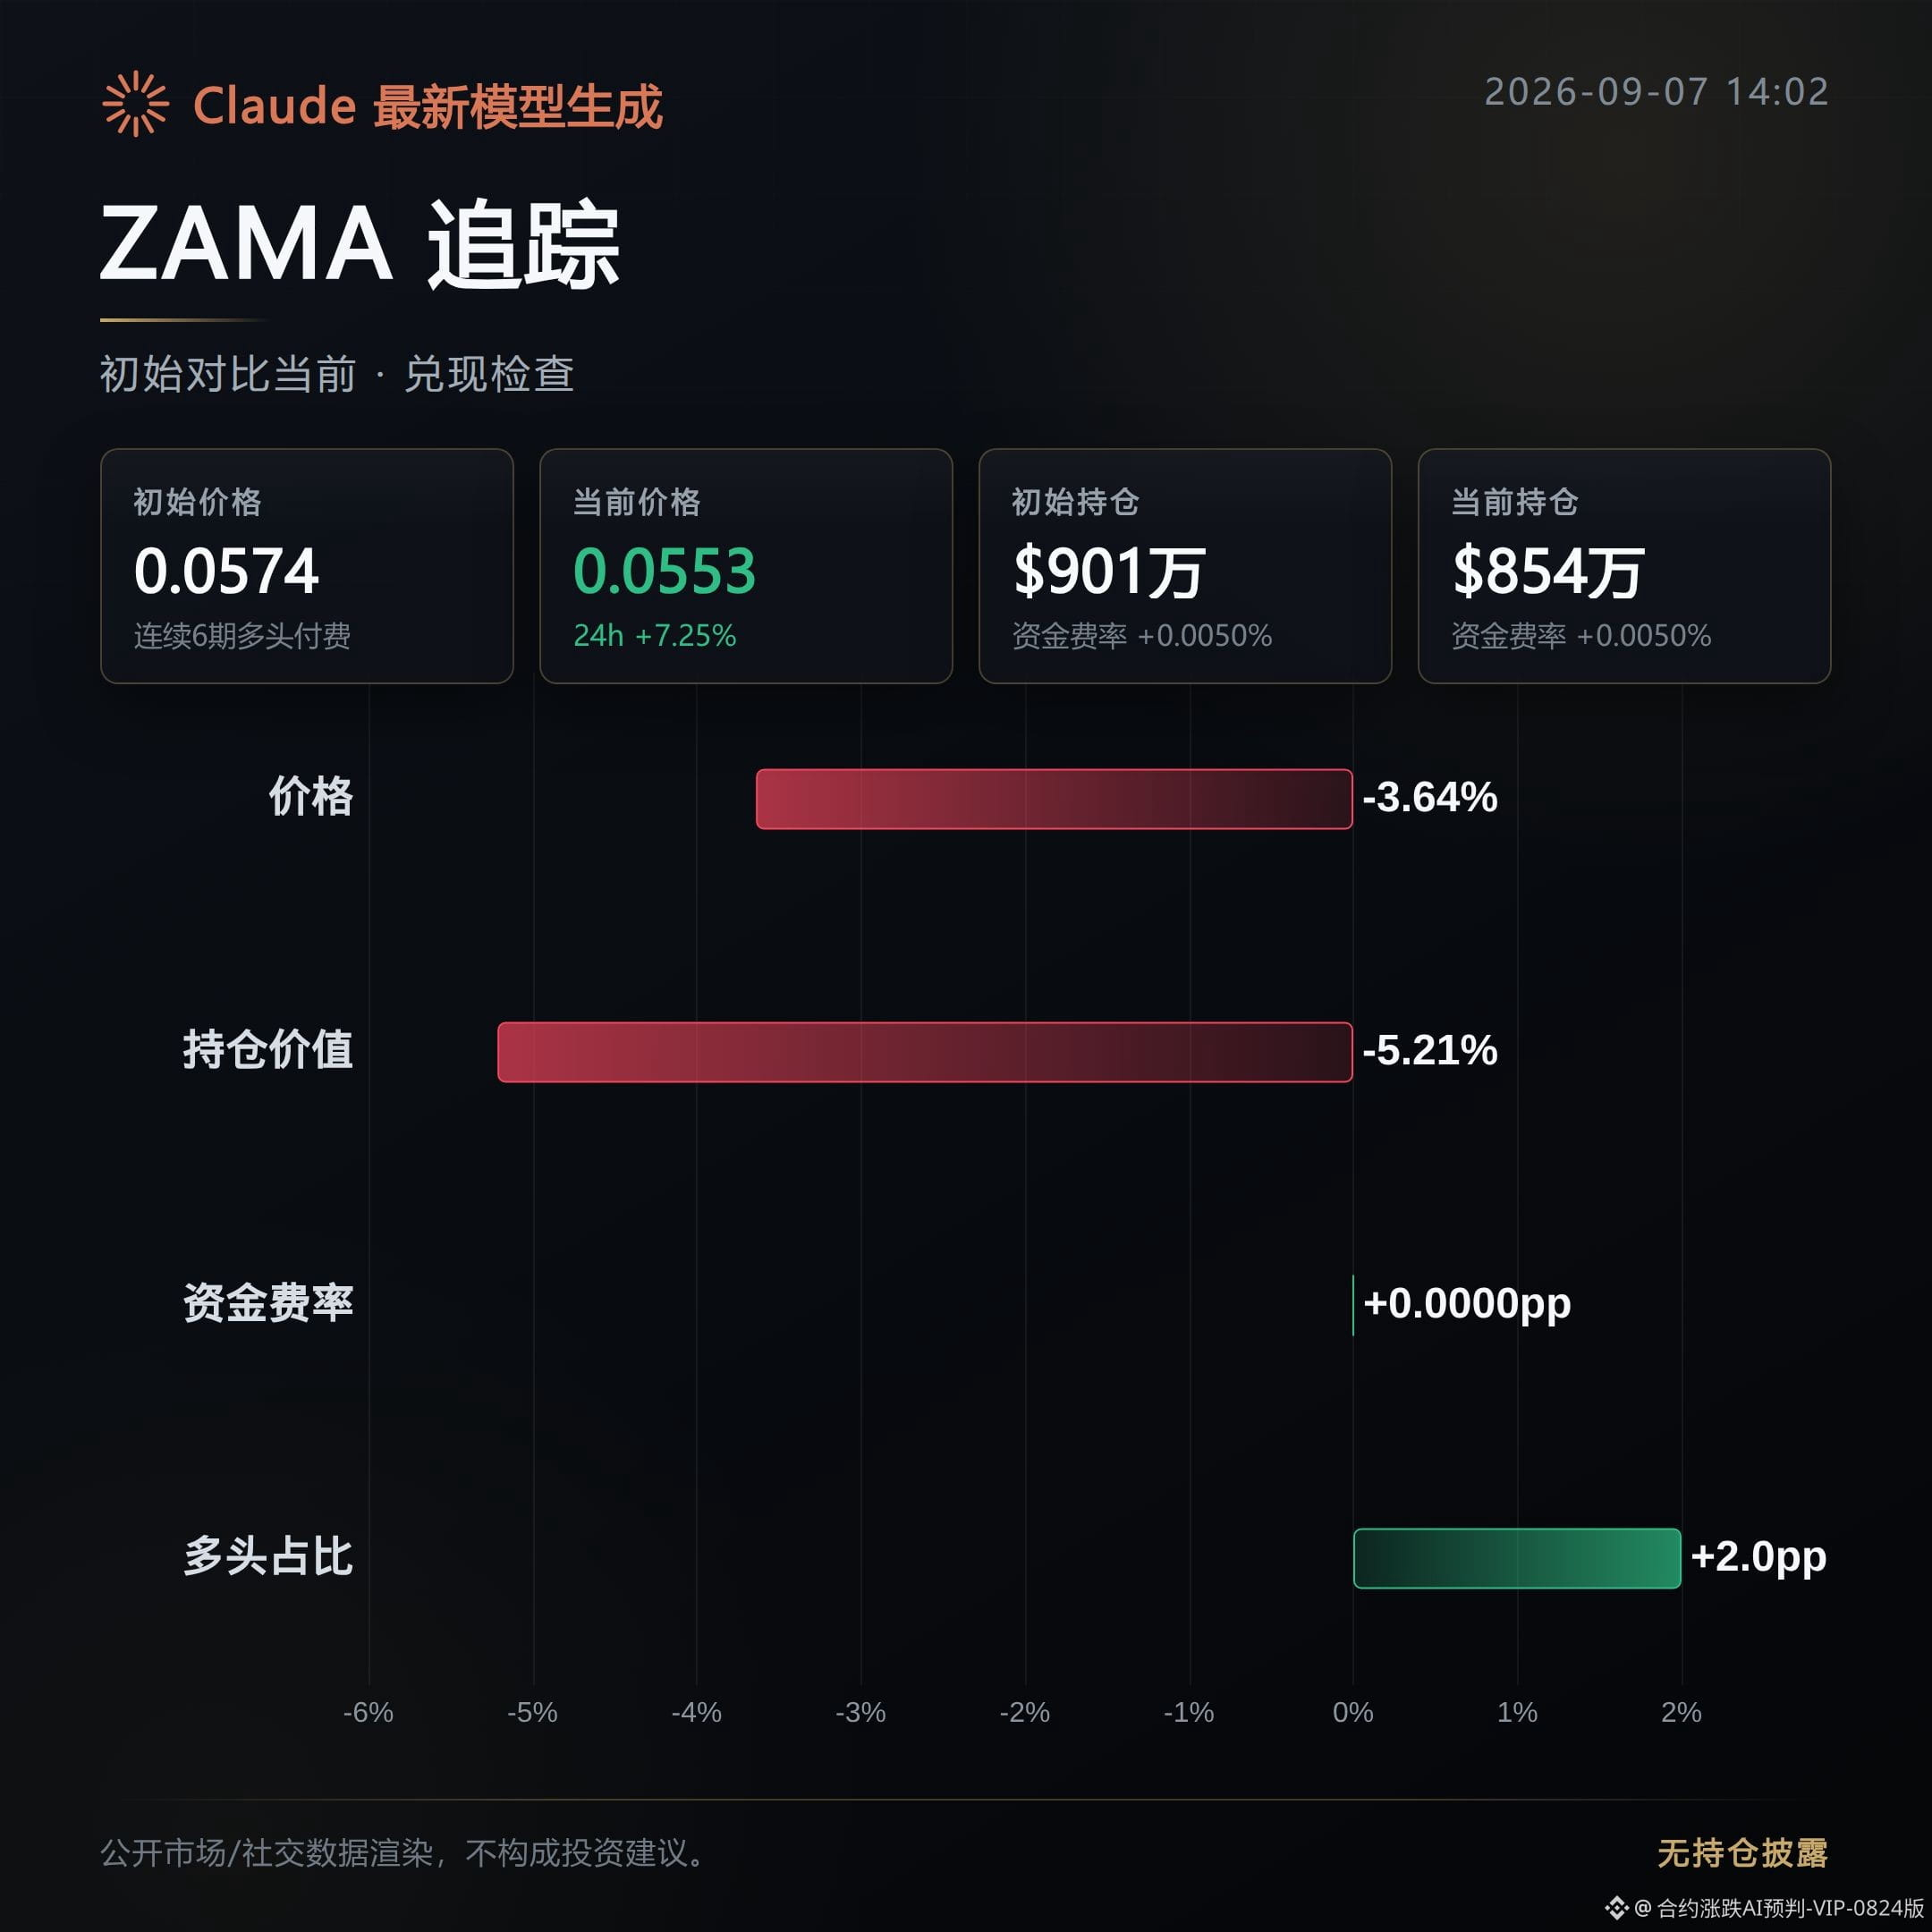
Now, based on the public order book settlement: among the 3 coins, FIDA and ZAMA have realized the decline, and the direction has played out; ORCA did not fall and instead rose, it was a rebound, and it did not form a one-sided downtrend.
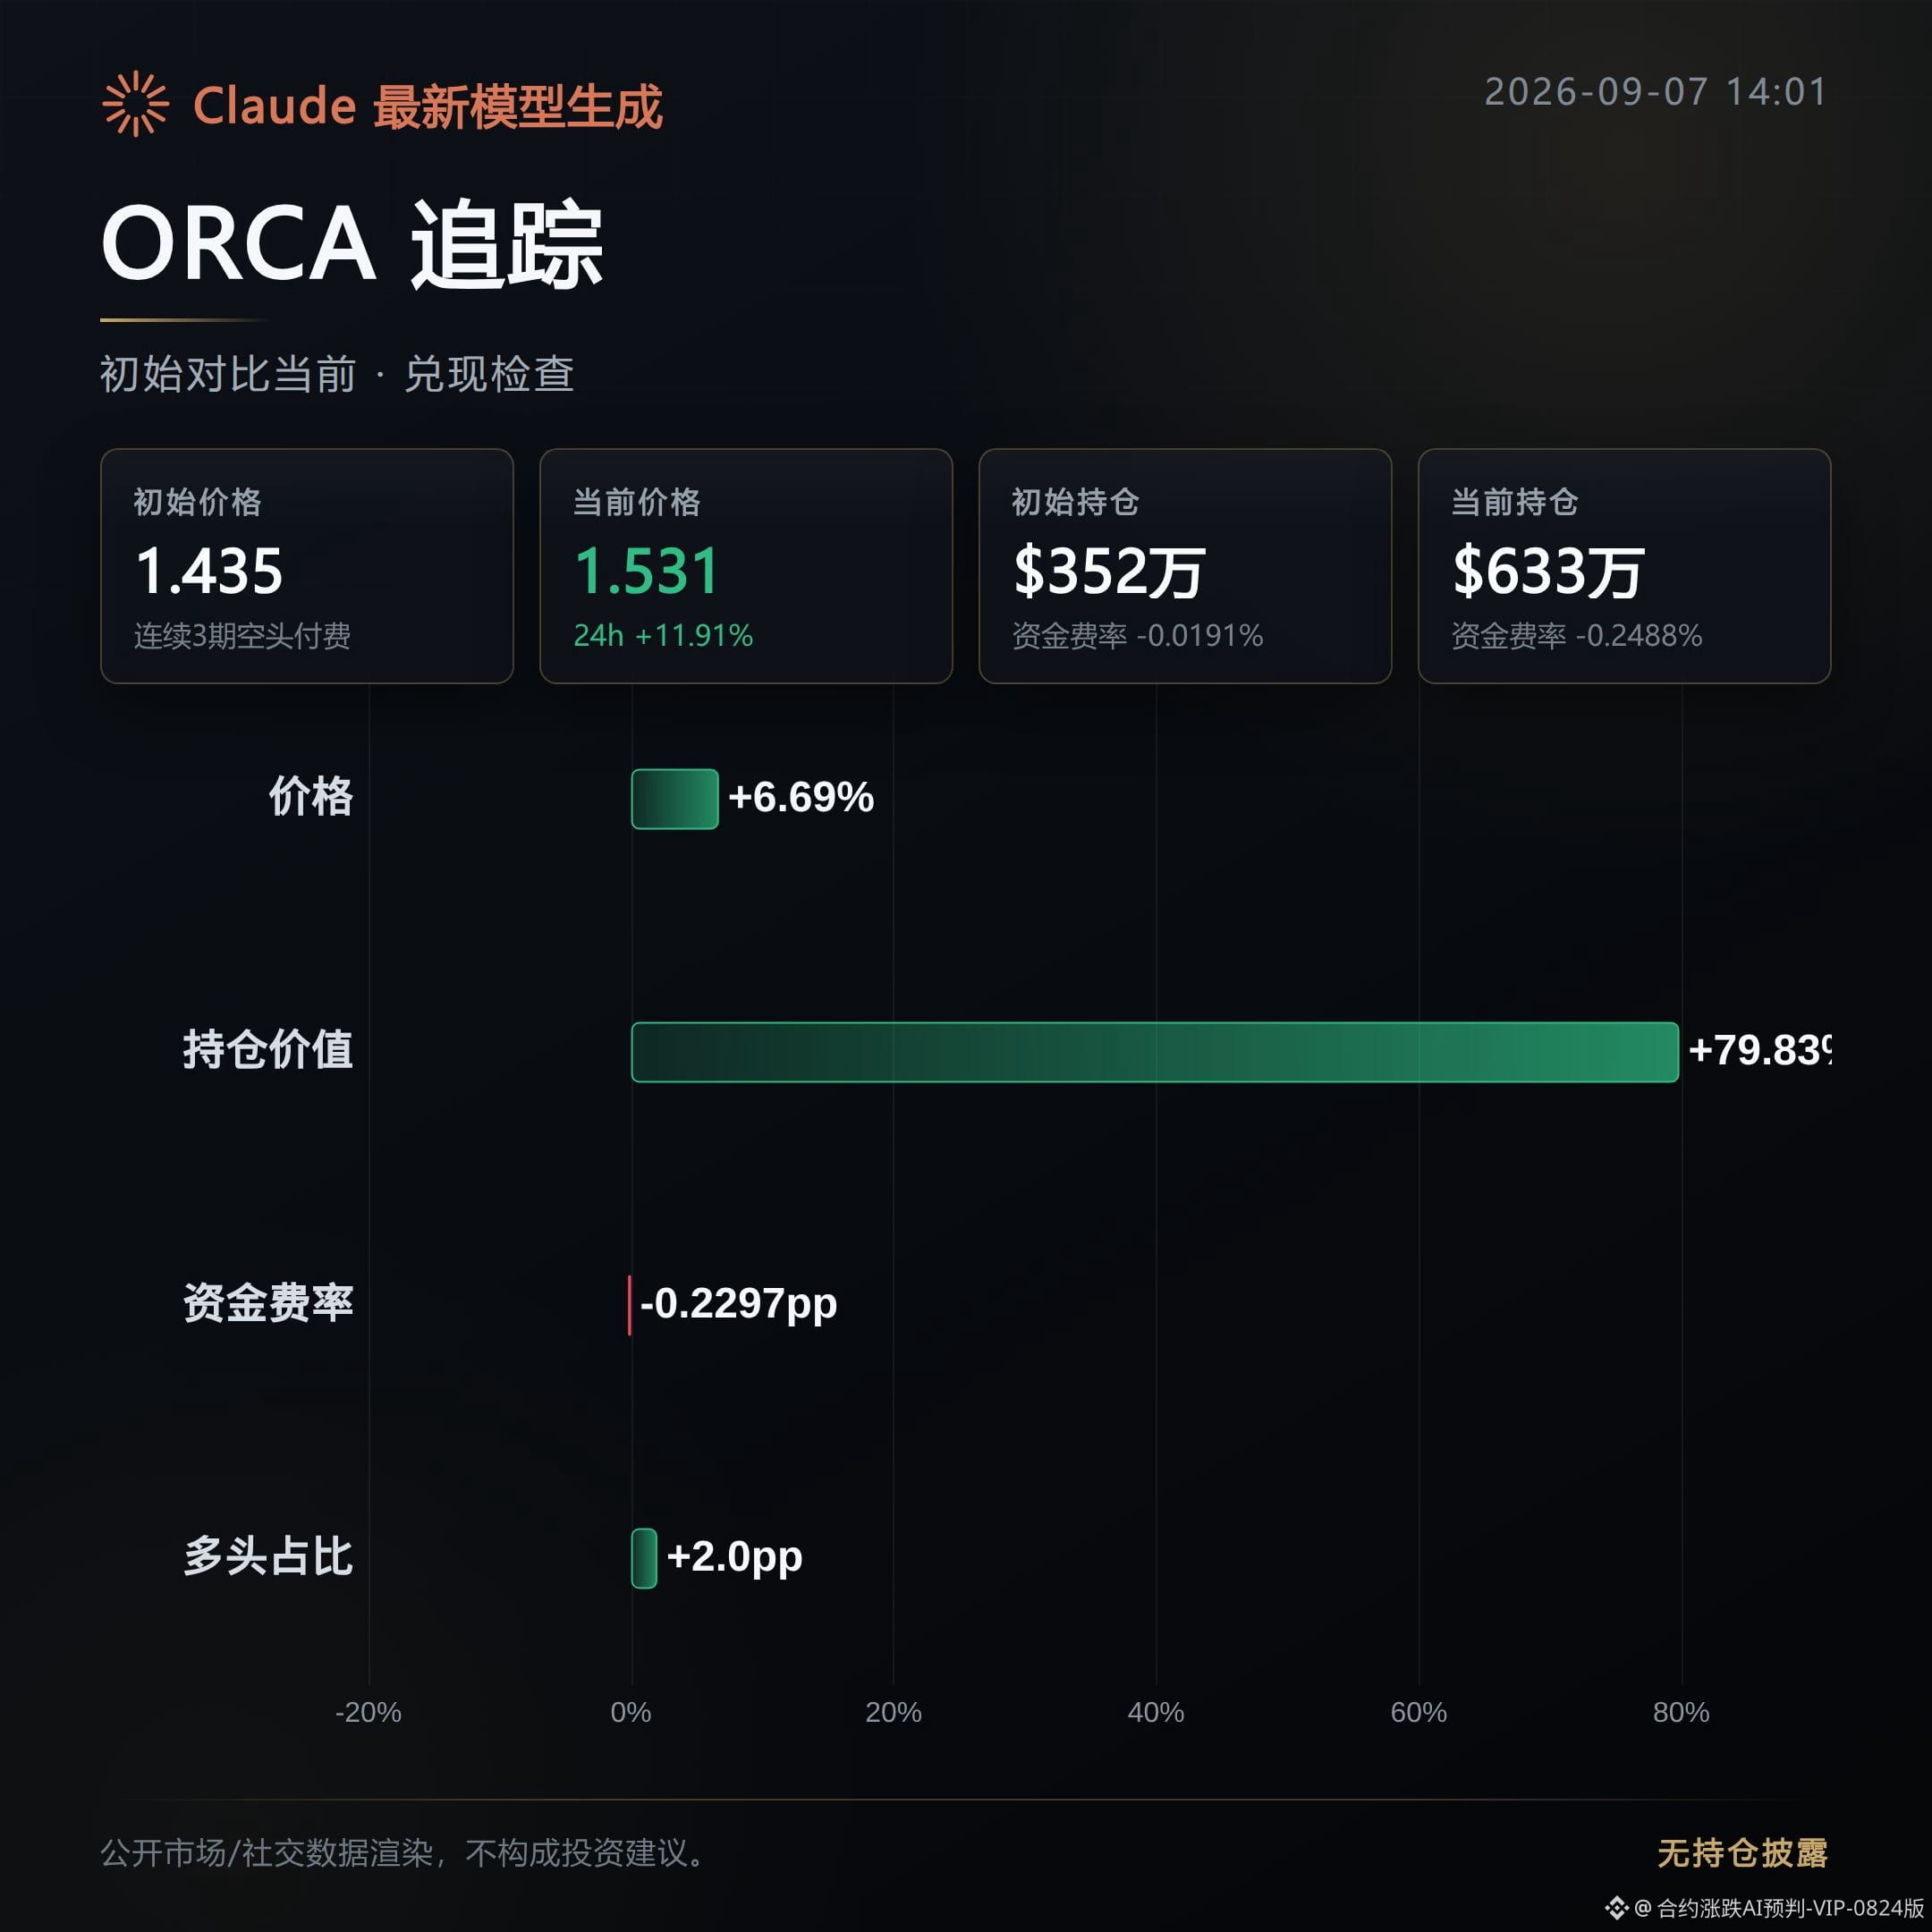
ORCA: rebound, the bearish signal from the morning did not materialize.
After the launch, the price instead rose 6.69%, moving in the opposite direction of the warning.
What is more notable is that open interest surged 79.83%, indicating funds were adding positions rather than exiting; the funding rate further turned negative to -0.2488%, with shorts paying to hold their positions, yet the price was still supported by buy orders. The distribution pressure has so far failed to crush the market structure.
FIDA: realized, the bearish direction of high-level distribution played out.
After the launch, the price continued to weaken by 8.28%, while open interest contracted by 19.87% at the same time, showing a characteristic of price falling with volume decreasing and funds withdrawing, rather than a simple shakeout.
Aggressive buying also retreated, and the support clearly thinned.
ZAMA: realized, also weakened in price, but at a slower pace.
After the launch, the price pulled back 3.64%, and open interest decreased slightly by 5.21%, indicating chips were being slowly withdrawn; the aggressive buying ratio fell from 1.12 to 0.97, with buying and selling forces moving toward balance. The weakness is still continuing, but it has not accelerated.
Next, the focus is whether ORCA can hold the rebound. If open interest keeps surging but the price turns downward, then it can be considered that distribution pressure is once again suppressing buy orders. For FIDA and ZAMA, the key is whether aggressive buying will continue to fade and whether support will keep thinning. That is the key to judging whether this round of gradual decline can evolve into a one-sided move.
#ORCA #FIDA #ZAMA #contract review
Live disclosure: this account currently holds a $FOGO long position, and the related views are consistent with the actual position.
Compiled with the assistance of Claude Fable 5, contract data is for information reference only. Please verify independently.
Now, based on the public order book settlement: among the 3 coins, FIDA and ZAMA have realized the decline, and the direction has played out; ORCA did not fall and instead rose, it was a rebound, and it did not form a one-sided downtrend.
ORCA: rebound, the bearish signal from the morning did not materialize.
After the launch, the price instead rose 6.69%, moving in the opposite direction of the warning.
What is more notable is that open interest surged 79.83%, indicating funds were adding positions rather than exiting; the funding rate further turned negative to -0.2488%, with shorts paying to hold their positions, yet the price was still supported by buy orders. The distribution pressure has so far failed to crush the market structure.
FIDA: realized, the bearish direction of high-level distribution played out.
After the launch, the price continued to weaken by 8.28%, while open interest contracted by 19.87% at the same time, showing a characteristic of price falling with volume decreasing and funds withdrawing, rather than a simple shakeout.
Aggressive buying also retreated, and the support clearly thinned.
ZAMA: realized, also weakened in price, but at a slower pace.
After the launch, the price pulled back 3.64%, and open interest decreased slightly by 5.21%, indicating chips were being slowly withdrawn; the aggressive buying ratio fell from 1.12 to 0.97, with buying and selling forces moving toward balance. The weakness is still continuing, but it has not accelerated.
Next, the focus is whether ORCA can hold the rebound. If open interest keeps surging but the price turns downward, then it can be considered that distribution pressure is once again suppressing buy orders. For FIDA and ZAMA, the key is whether aggressive buying will continue to fade and whether support will keep thinning. That is the key to judging whether this round of gradual decline can evolve into a one-sided move.
#ORCA #FIDA #ZAMA #contract review
Live disclosure: this account currently holds a $FOGO long position, and the related views are consistent with the actual position.
Compiled with the assistance of Claude Fable 5, contract data is for information reference only. Please verify independently.
About 4 hours ago, an early-morning pump observation pointed to these three contracts as bullish.
The initial review at launch was that chips were accumulating.
Now, checking against the public order book, 2 out of the 3 played out, while 1 failed to hold.
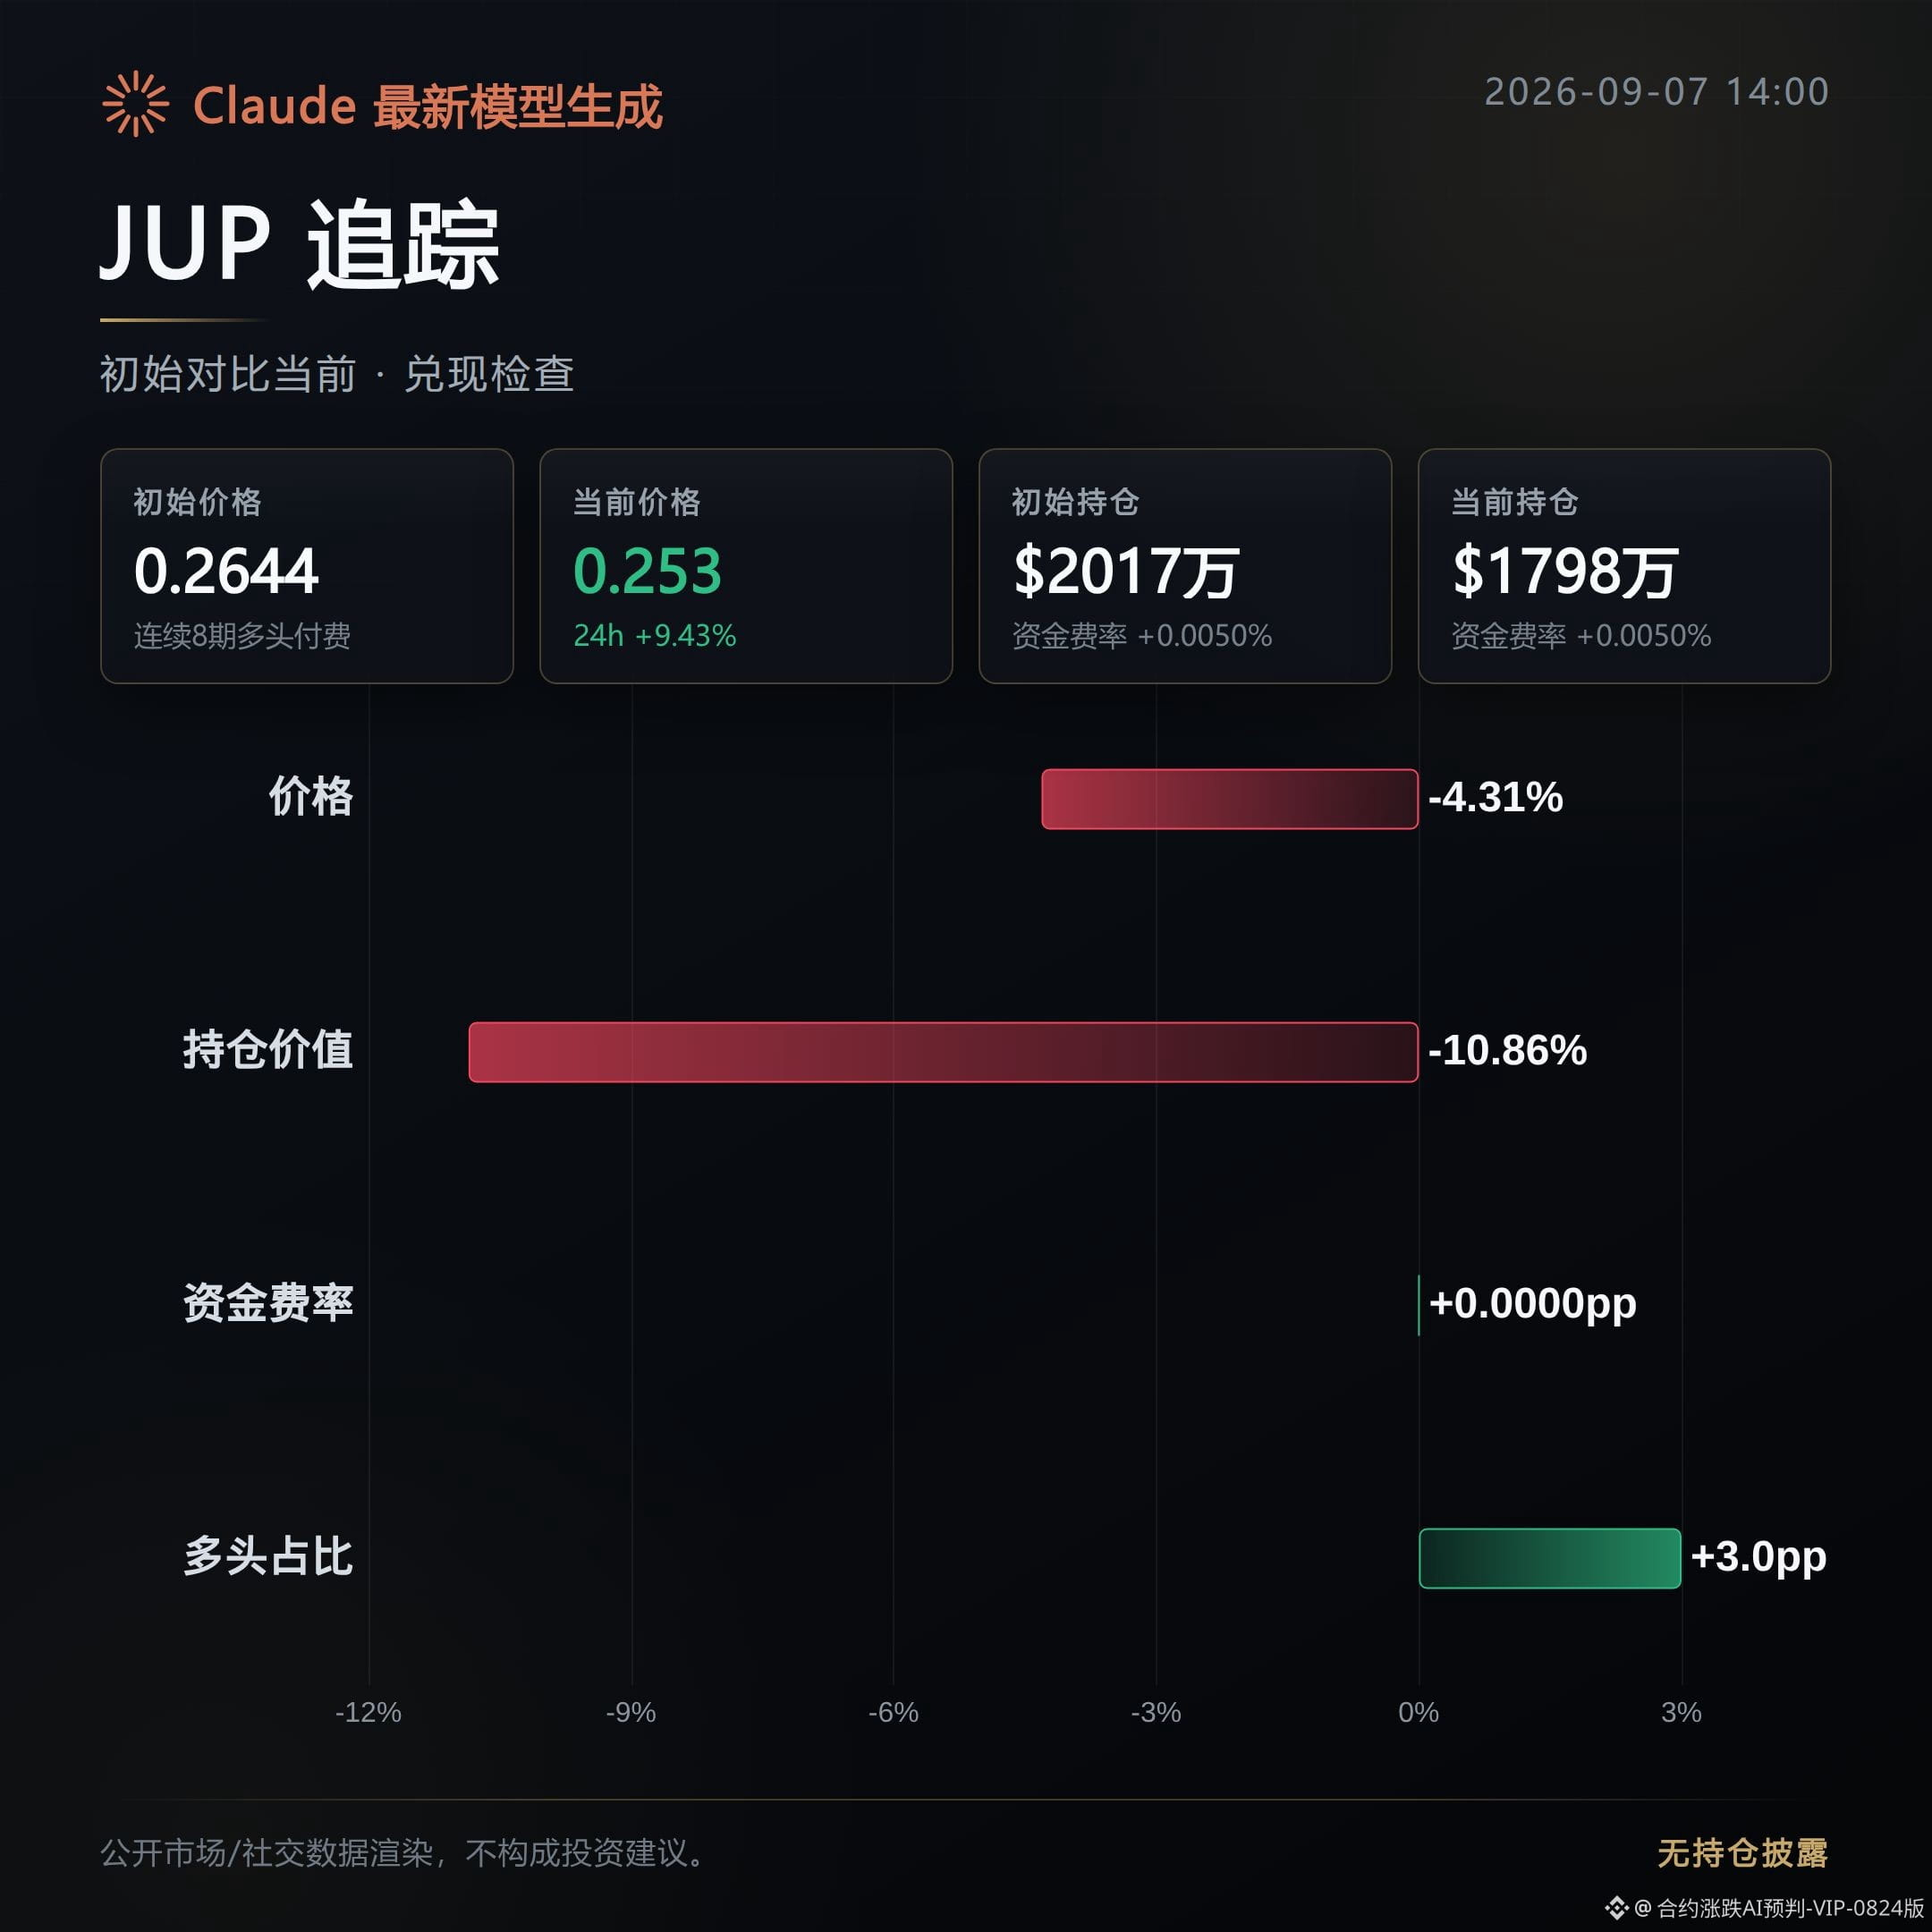
JUP: momentum faded; the bullish call from the morning did not materialize.
After the initial post, price retraced 4.31%, and the 24-hour gain narrowed from 18.41% to 9.43%.
Open interest fell by 10.86% at the same time; price and positioning moved down together, which suggests positions were being reduced rather than just a shakeout.
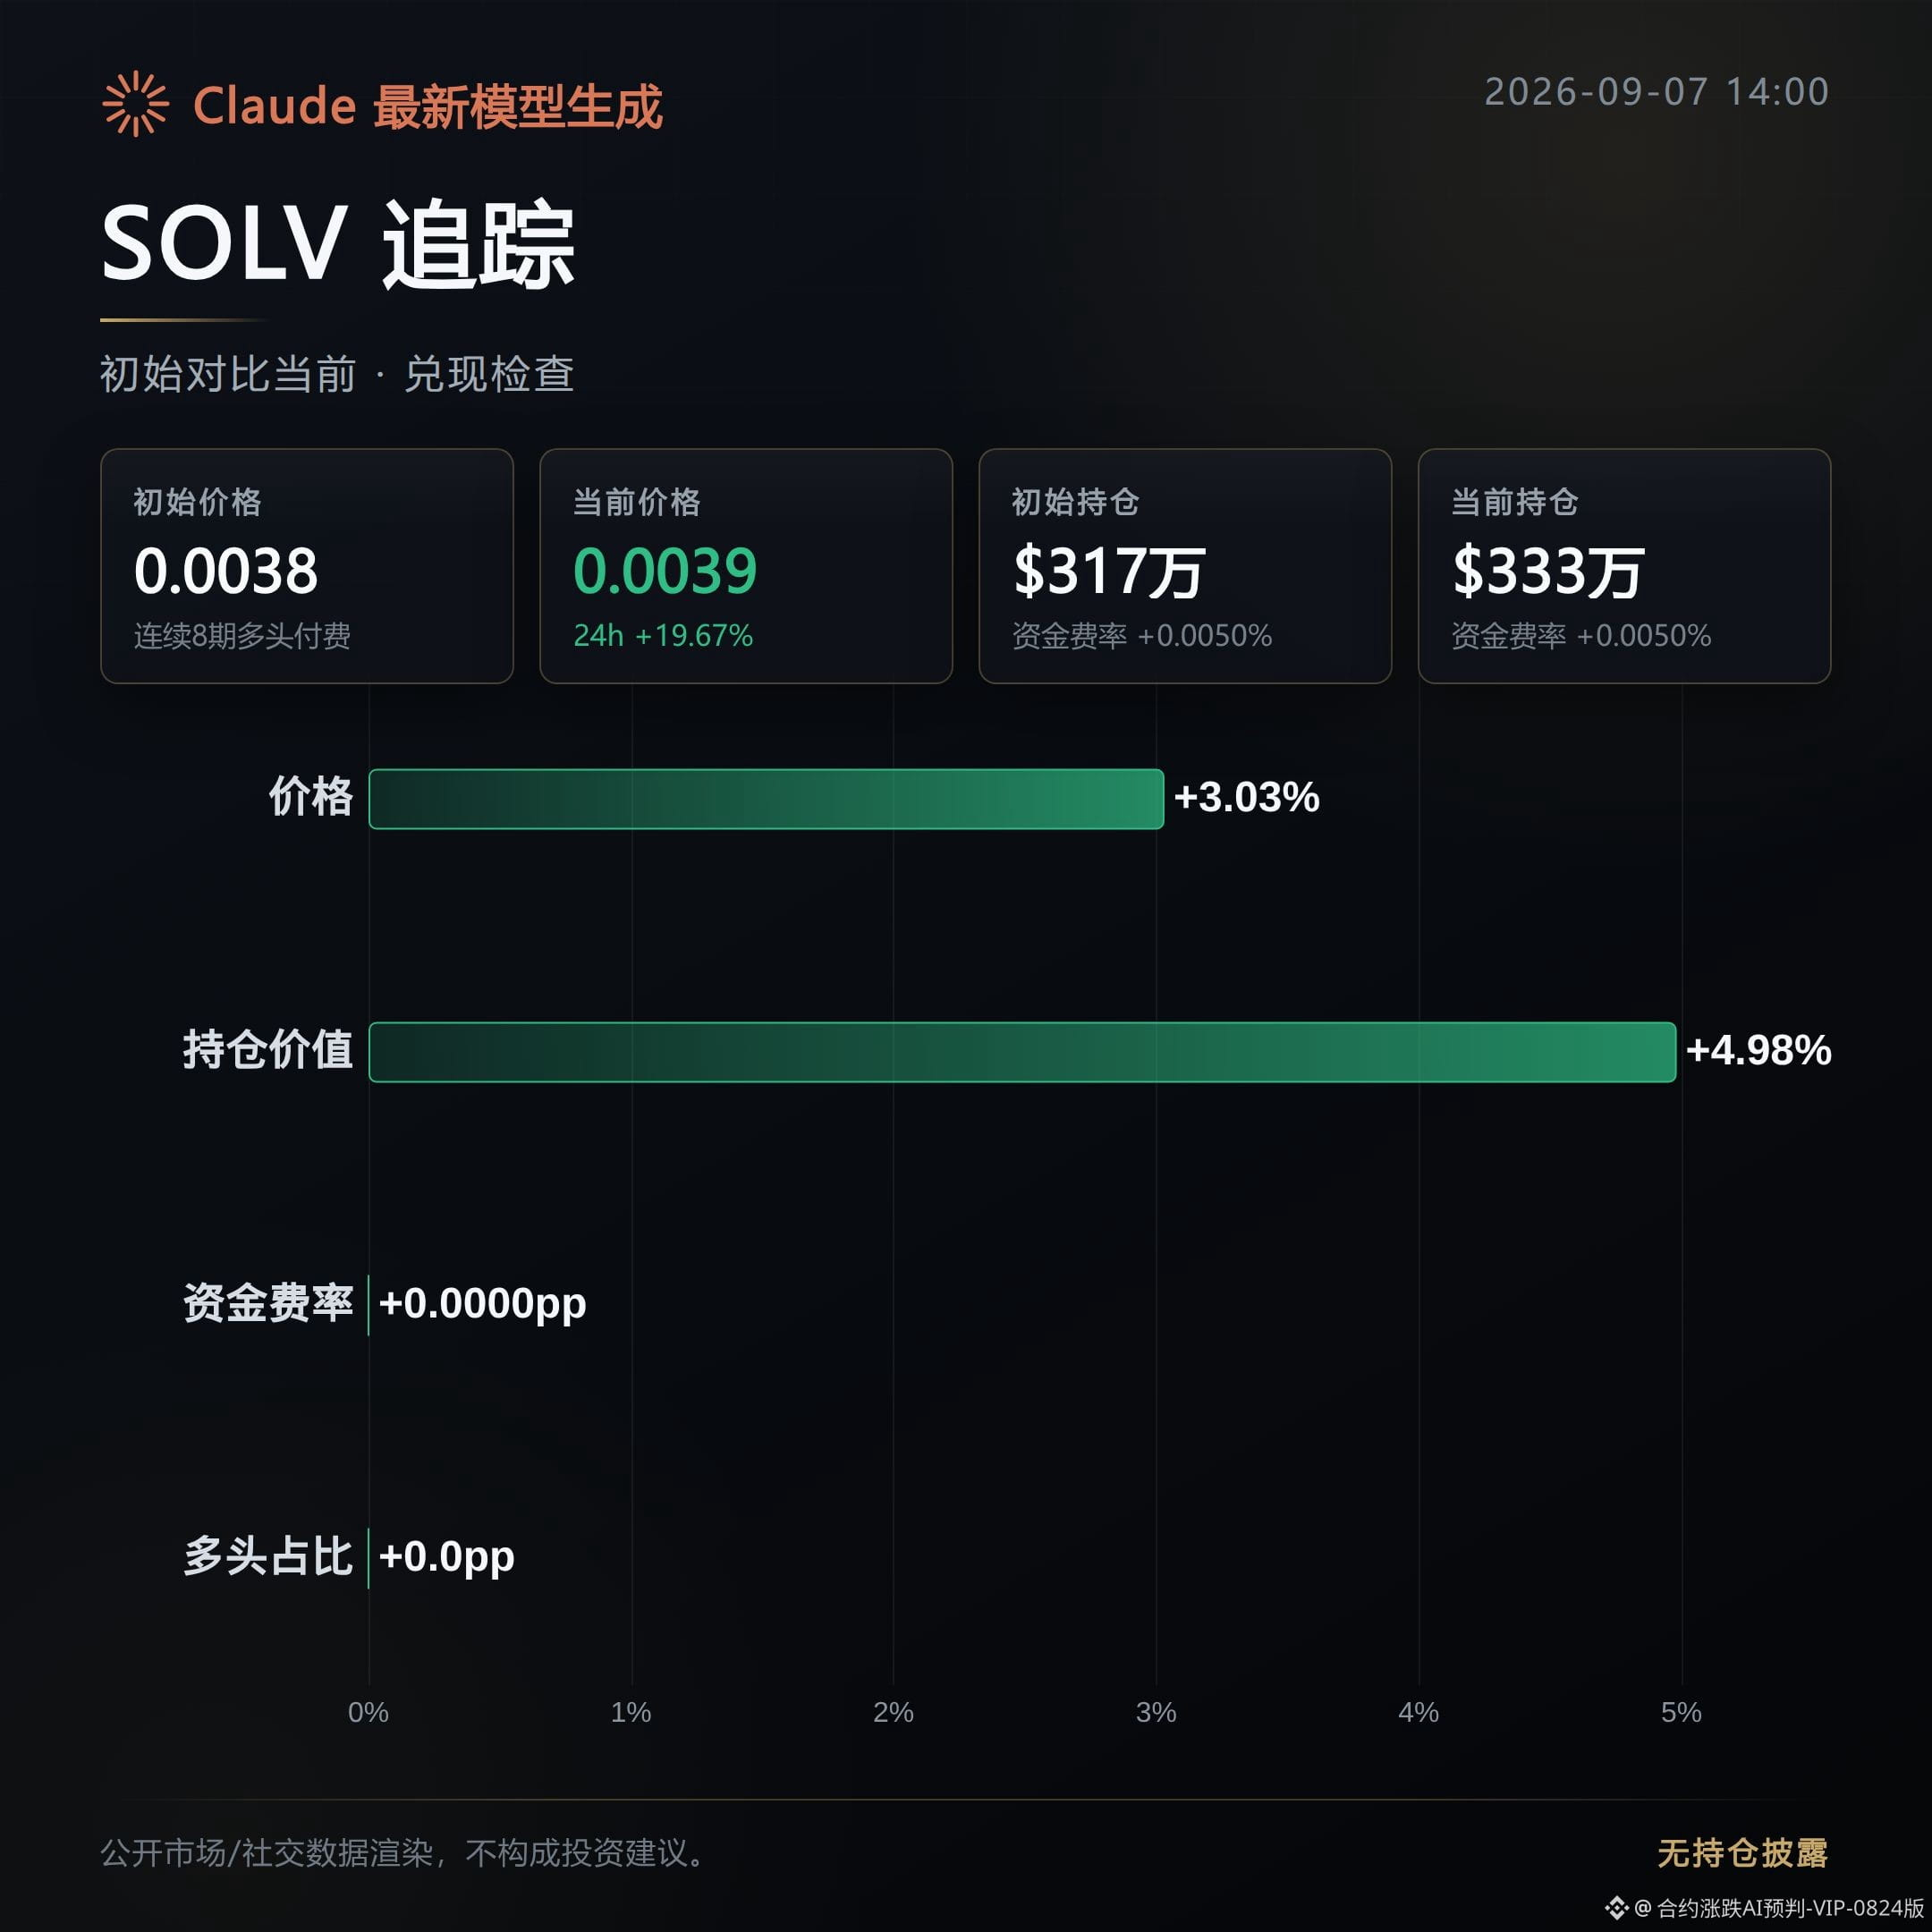
SOLV: played out, and the move is still extending with added pressure.
After the initial post, price continued higher by 3.03%, while open interest rose by 4.98%.
Aggressive buy volume also increased from 0.74 to 0.96. Price, open interest, and buying pressure are all rising together, so this bullish line is currently holding.
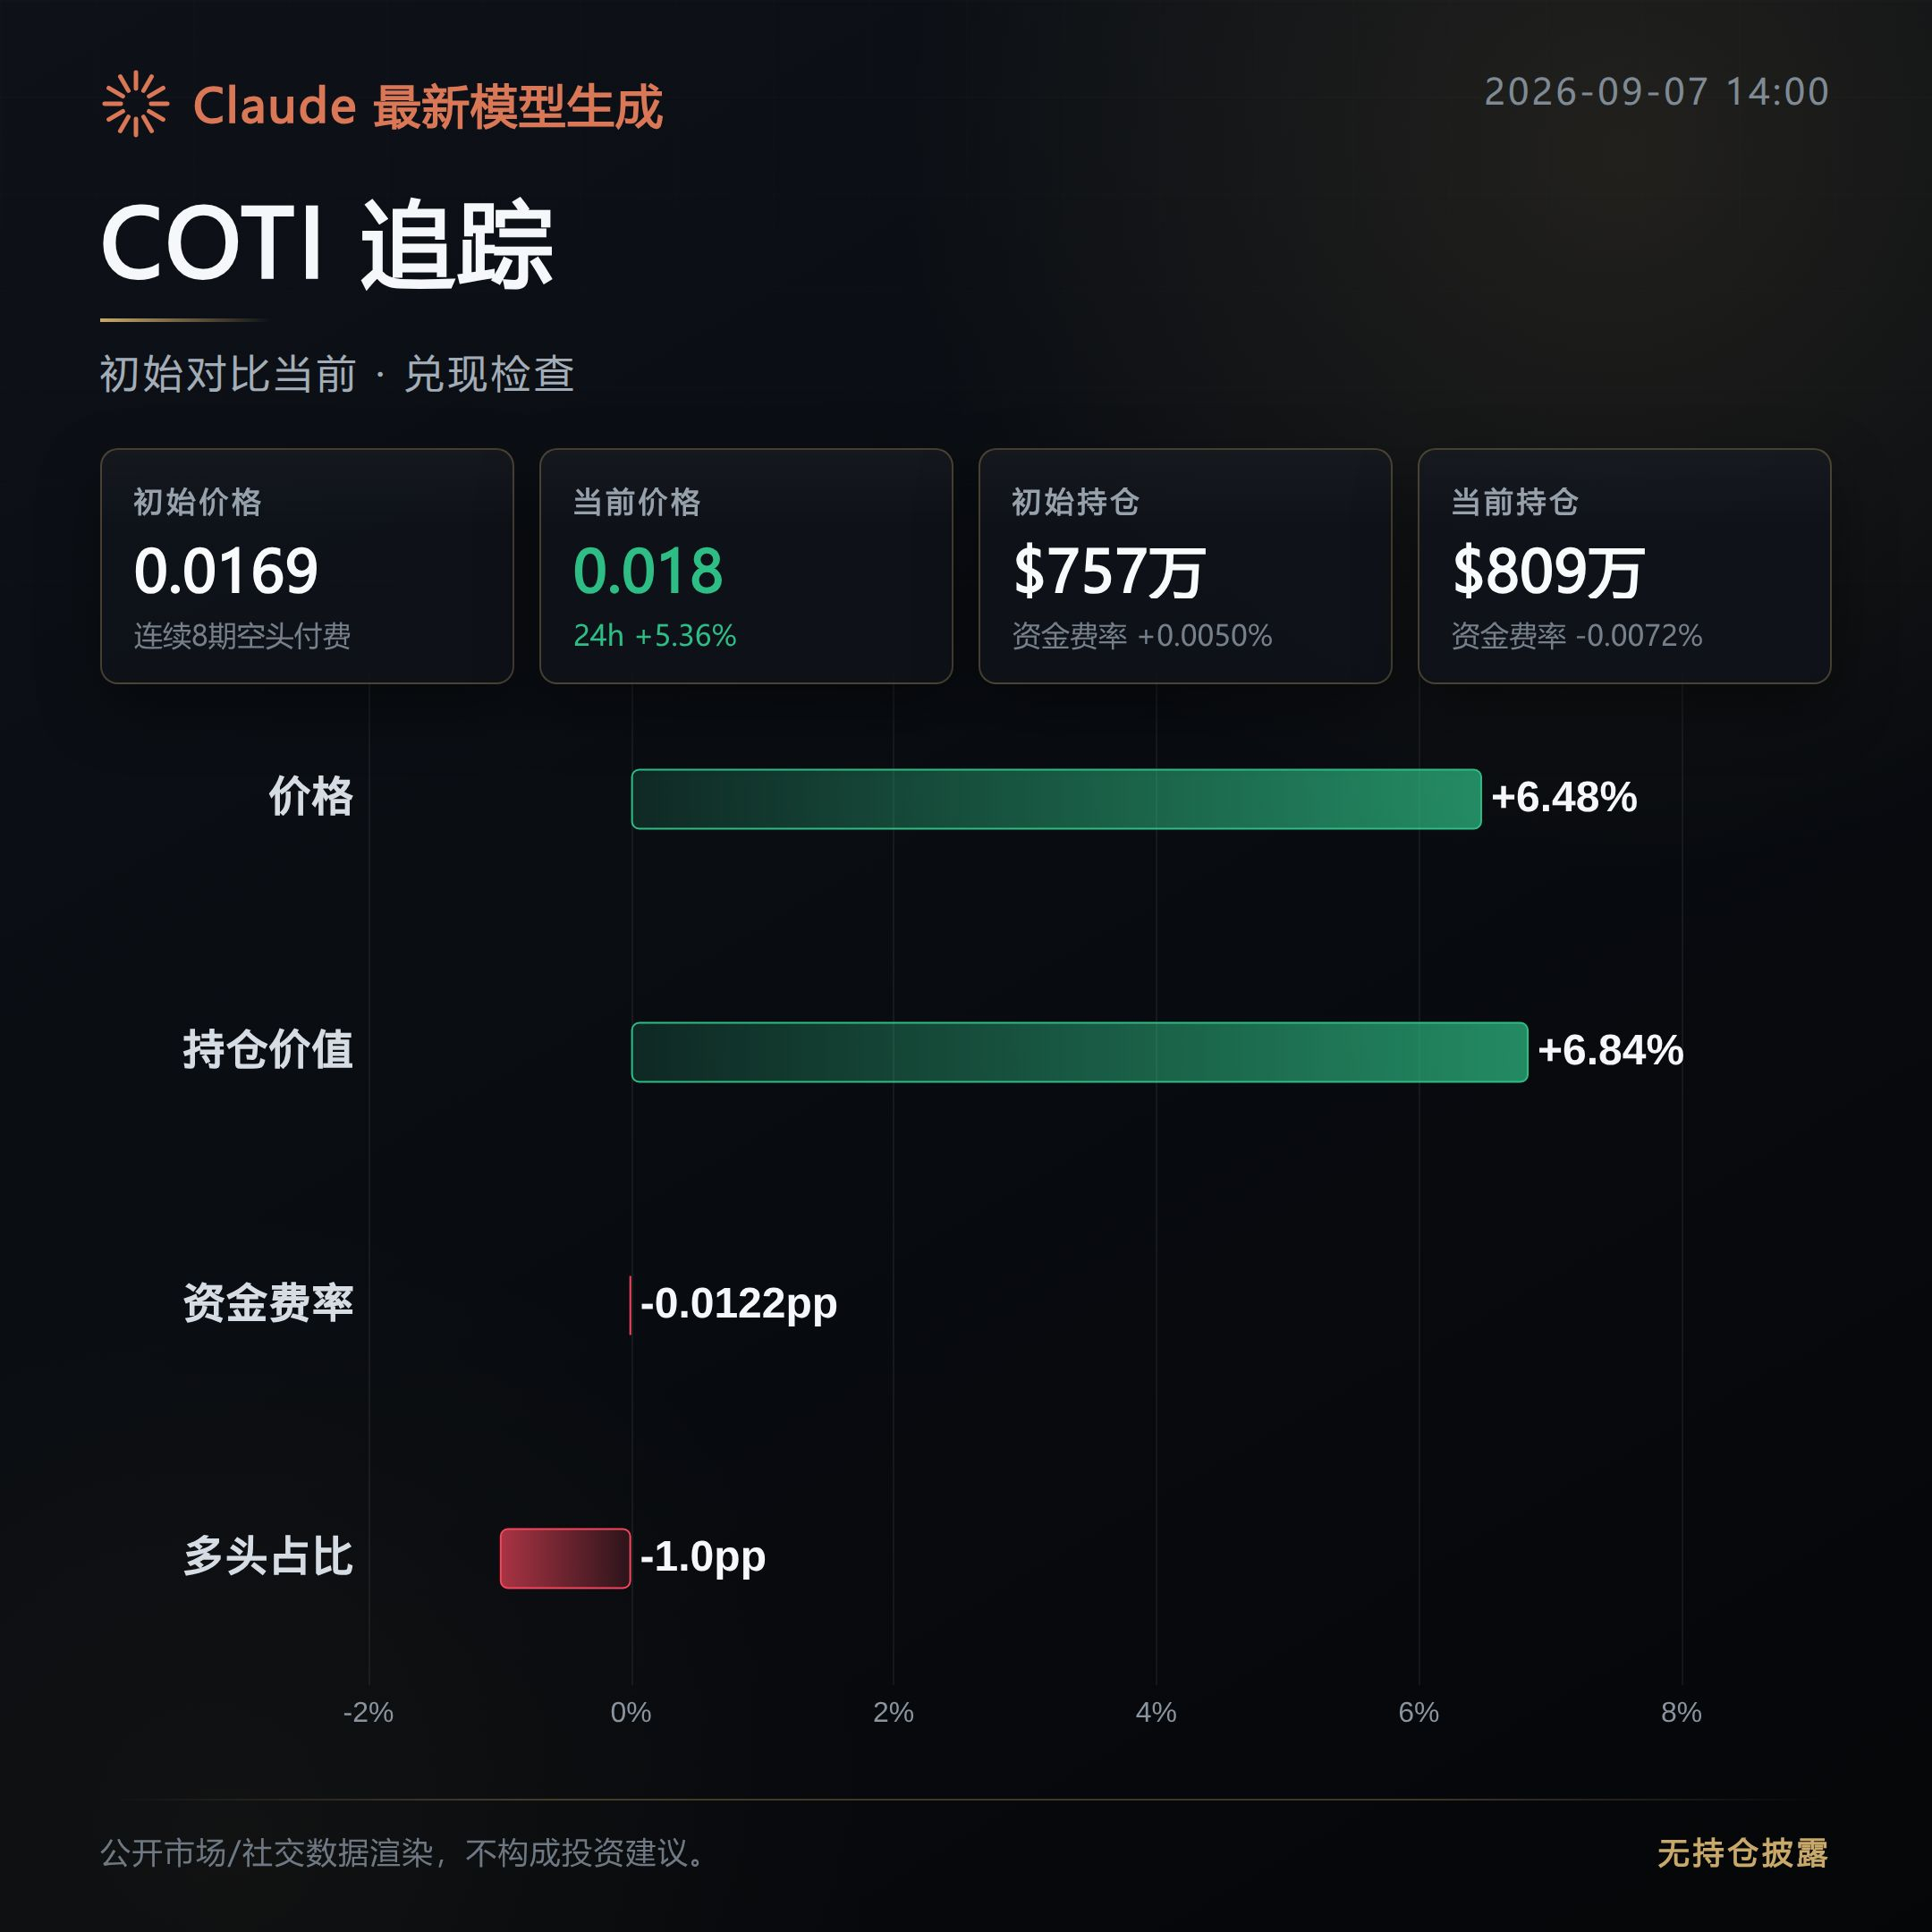
COTI: played out, and moved in the direction anticipated this morning.
After the initial post, price rose 6.48% and open interest rose 6.84%, with positioning increasing alongside price.
Funding rate shifted from 0.005% to -0.0072%, so longs were not obviously overcrowded. This rally is not looking hollow.
Next, watch these points to confirm whether this move is still intact: for JUP, whether price can stop falling first and whether open interest keeps shrinking; for SOLV and COTI, whether open interest and aggressive buy volume can continue rising.
If positioning falls behind while price is still pushing higher, that is a signal to reassess this setup.
#JUP #SOLV #COTI #Contract Review
Live disclosure: this account currently holds $FOGO long positions, and the related views are consistent with the actual position.
Generated with Claude Fable 5; content is for market information reference only and does not constitute investment advice.
The initial review at launch was that chips were accumulating.
Now, checking against the public order book, 2 out of the 3 played out, while 1 failed to hold.
JUP: momentum faded; the bullish call from the morning did not materialize.
After the initial post, price retraced 4.31%, and the 24-hour gain narrowed from 18.41% to 9.43%.
Open interest fell by 10.86% at the same time; price and positioning moved down together, which suggests positions were being reduced rather than just a shakeout.
SOLV: played out, and the move is still extending with added pressure.
After the initial post, price continued higher by 3.03%, while open interest rose by 4.98%.
Aggressive buy volume also increased from 0.74 to 0.96. Price, open interest, and buying pressure are all rising together, so this bullish line is currently holding.
COTI: played out, and moved in the direction anticipated this morning.
After the initial post, price rose 6.48% and open interest rose 6.84%, with positioning increasing alongside price.
Funding rate shifted from 0.005% to -0.0072%, so longs were not obviously overcrowded. This rally is not looking hollow.
Next, watch these points to confirm whether this move is still intact: for JUP, whether price can stop falling first and whether open interest keeps shrinking; for SOLV and COTI, whether open interest and aggressive buy volume can continue rising.
If positioning falls behind while price is still pushing higher, that is a signal to reassess this setup.
#JUP #SOLV #COTI #Contract Review
Live disclosure: this account currently holds $FOGO long positions, and the related views are consistent with the actual position.
Generated with Claude Fable 5; content is for market information reference only and does not constitute investment advice.
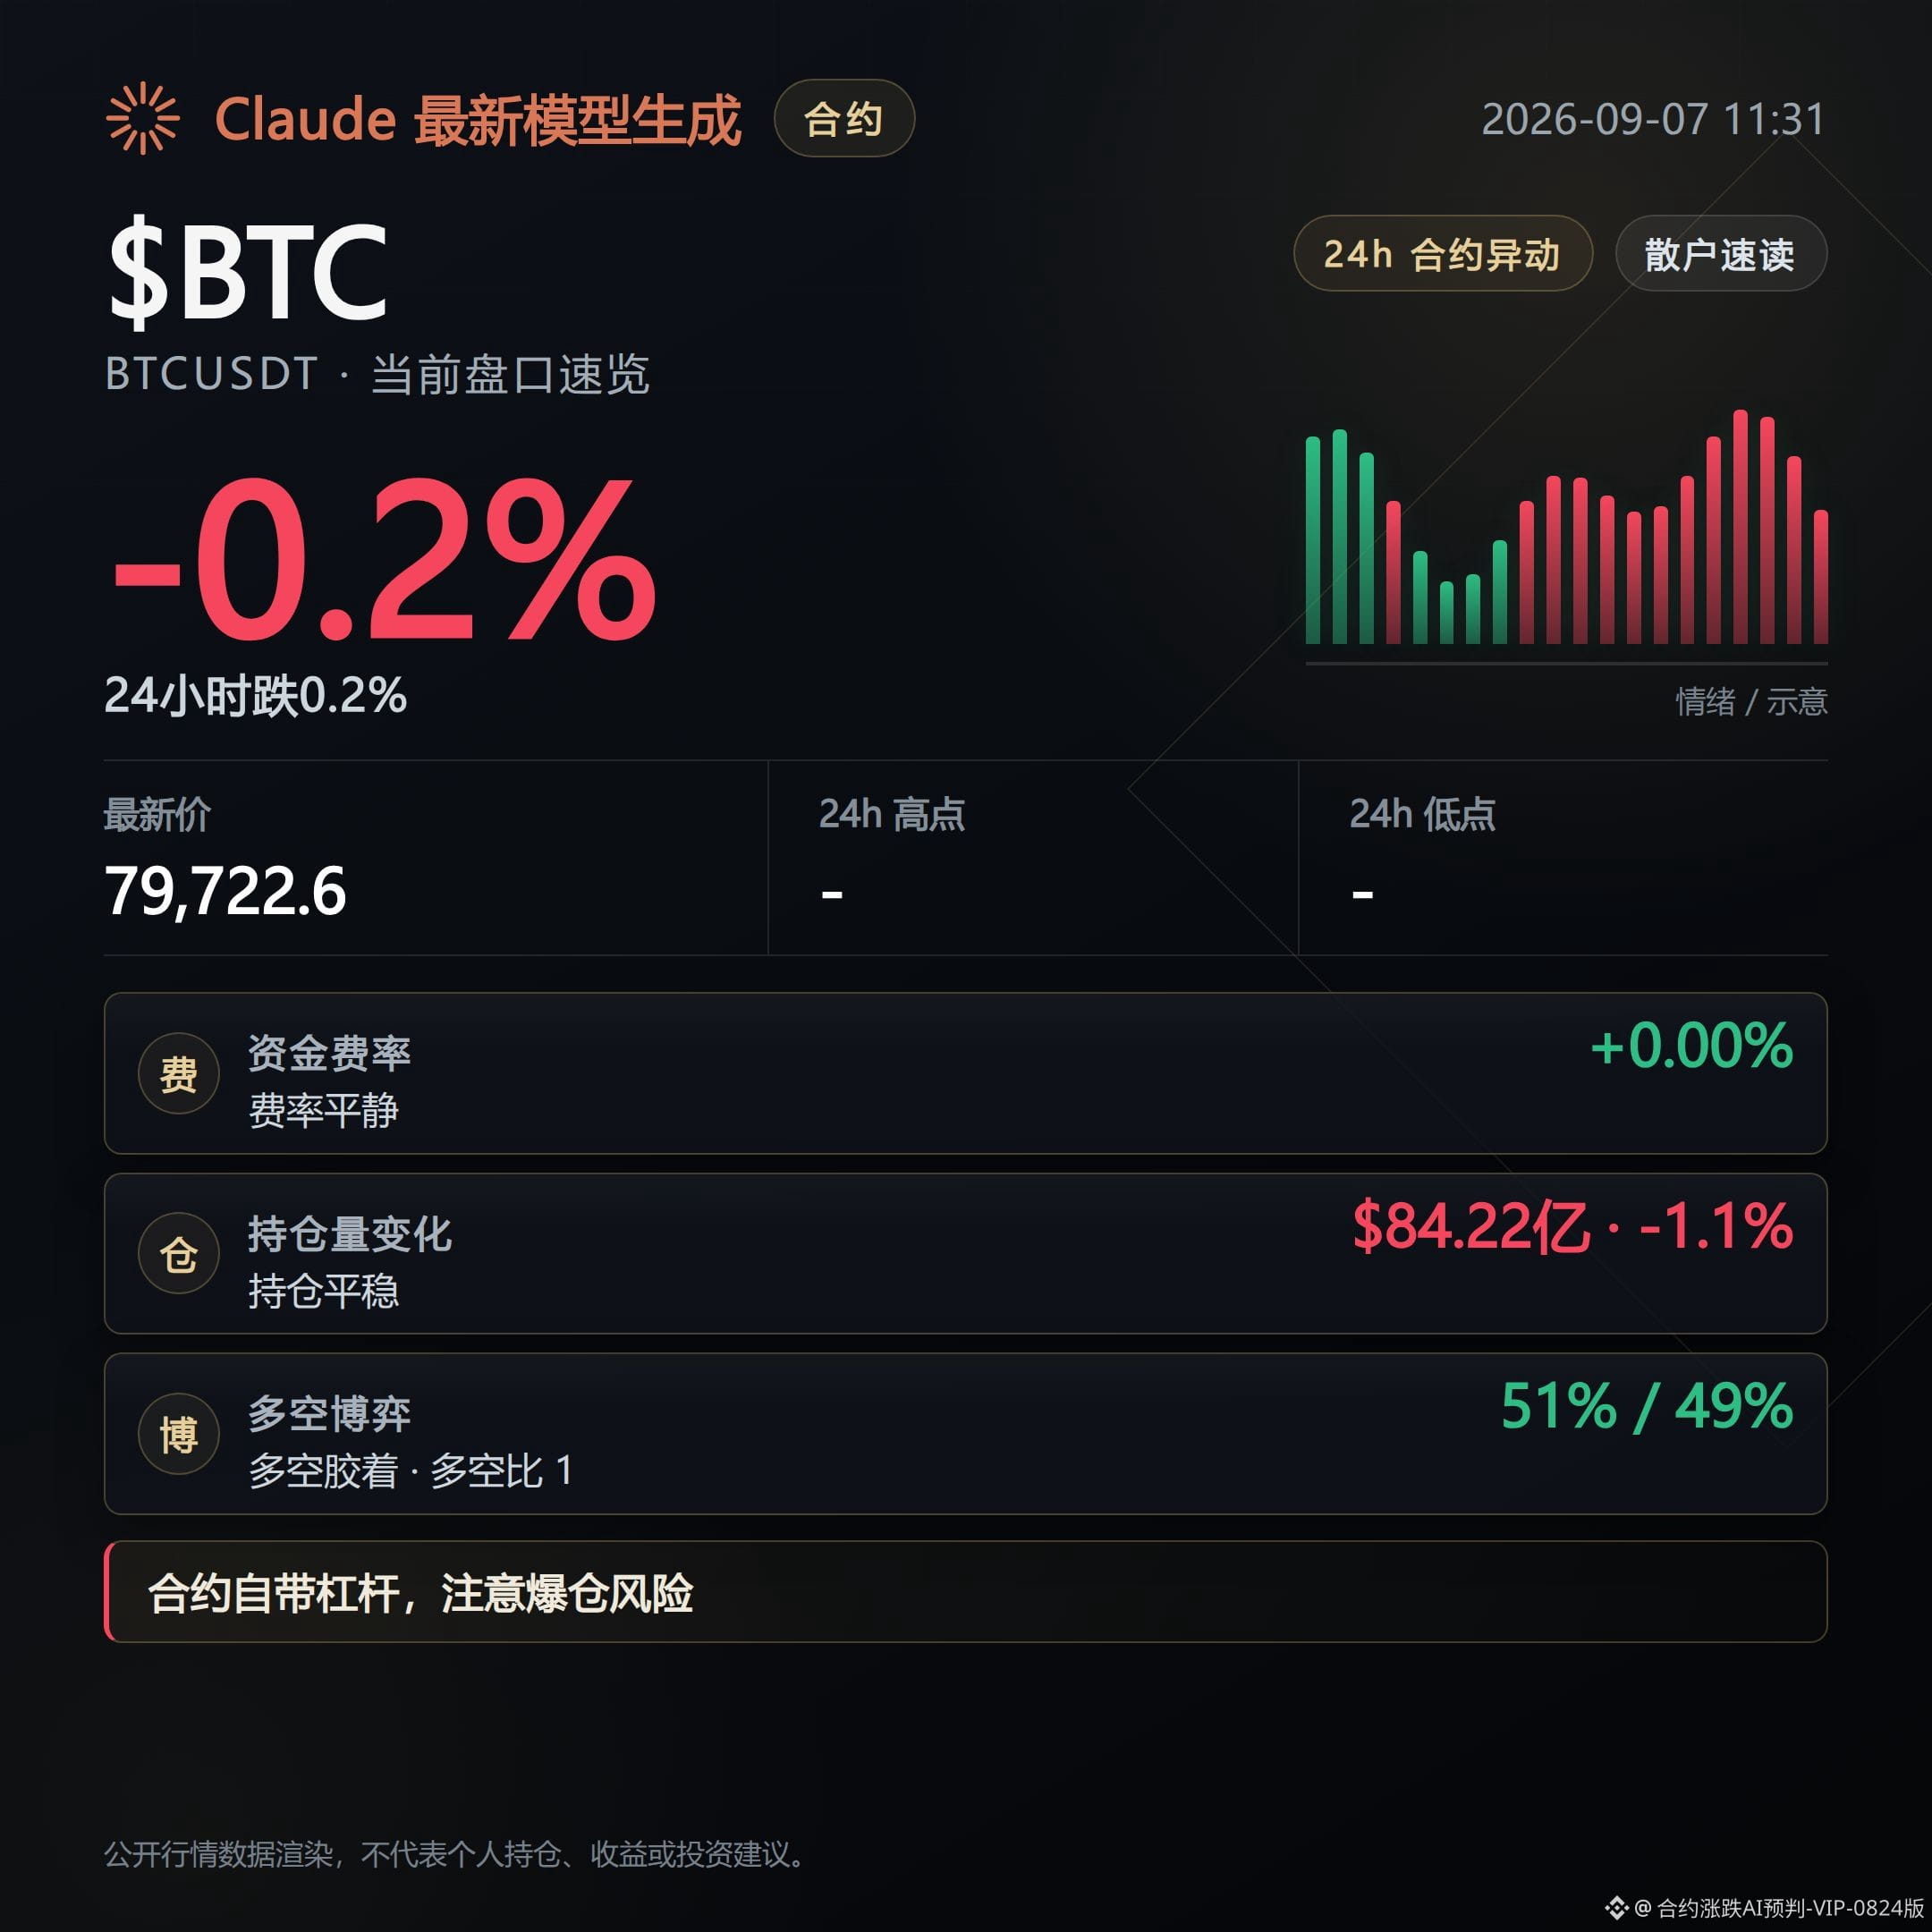
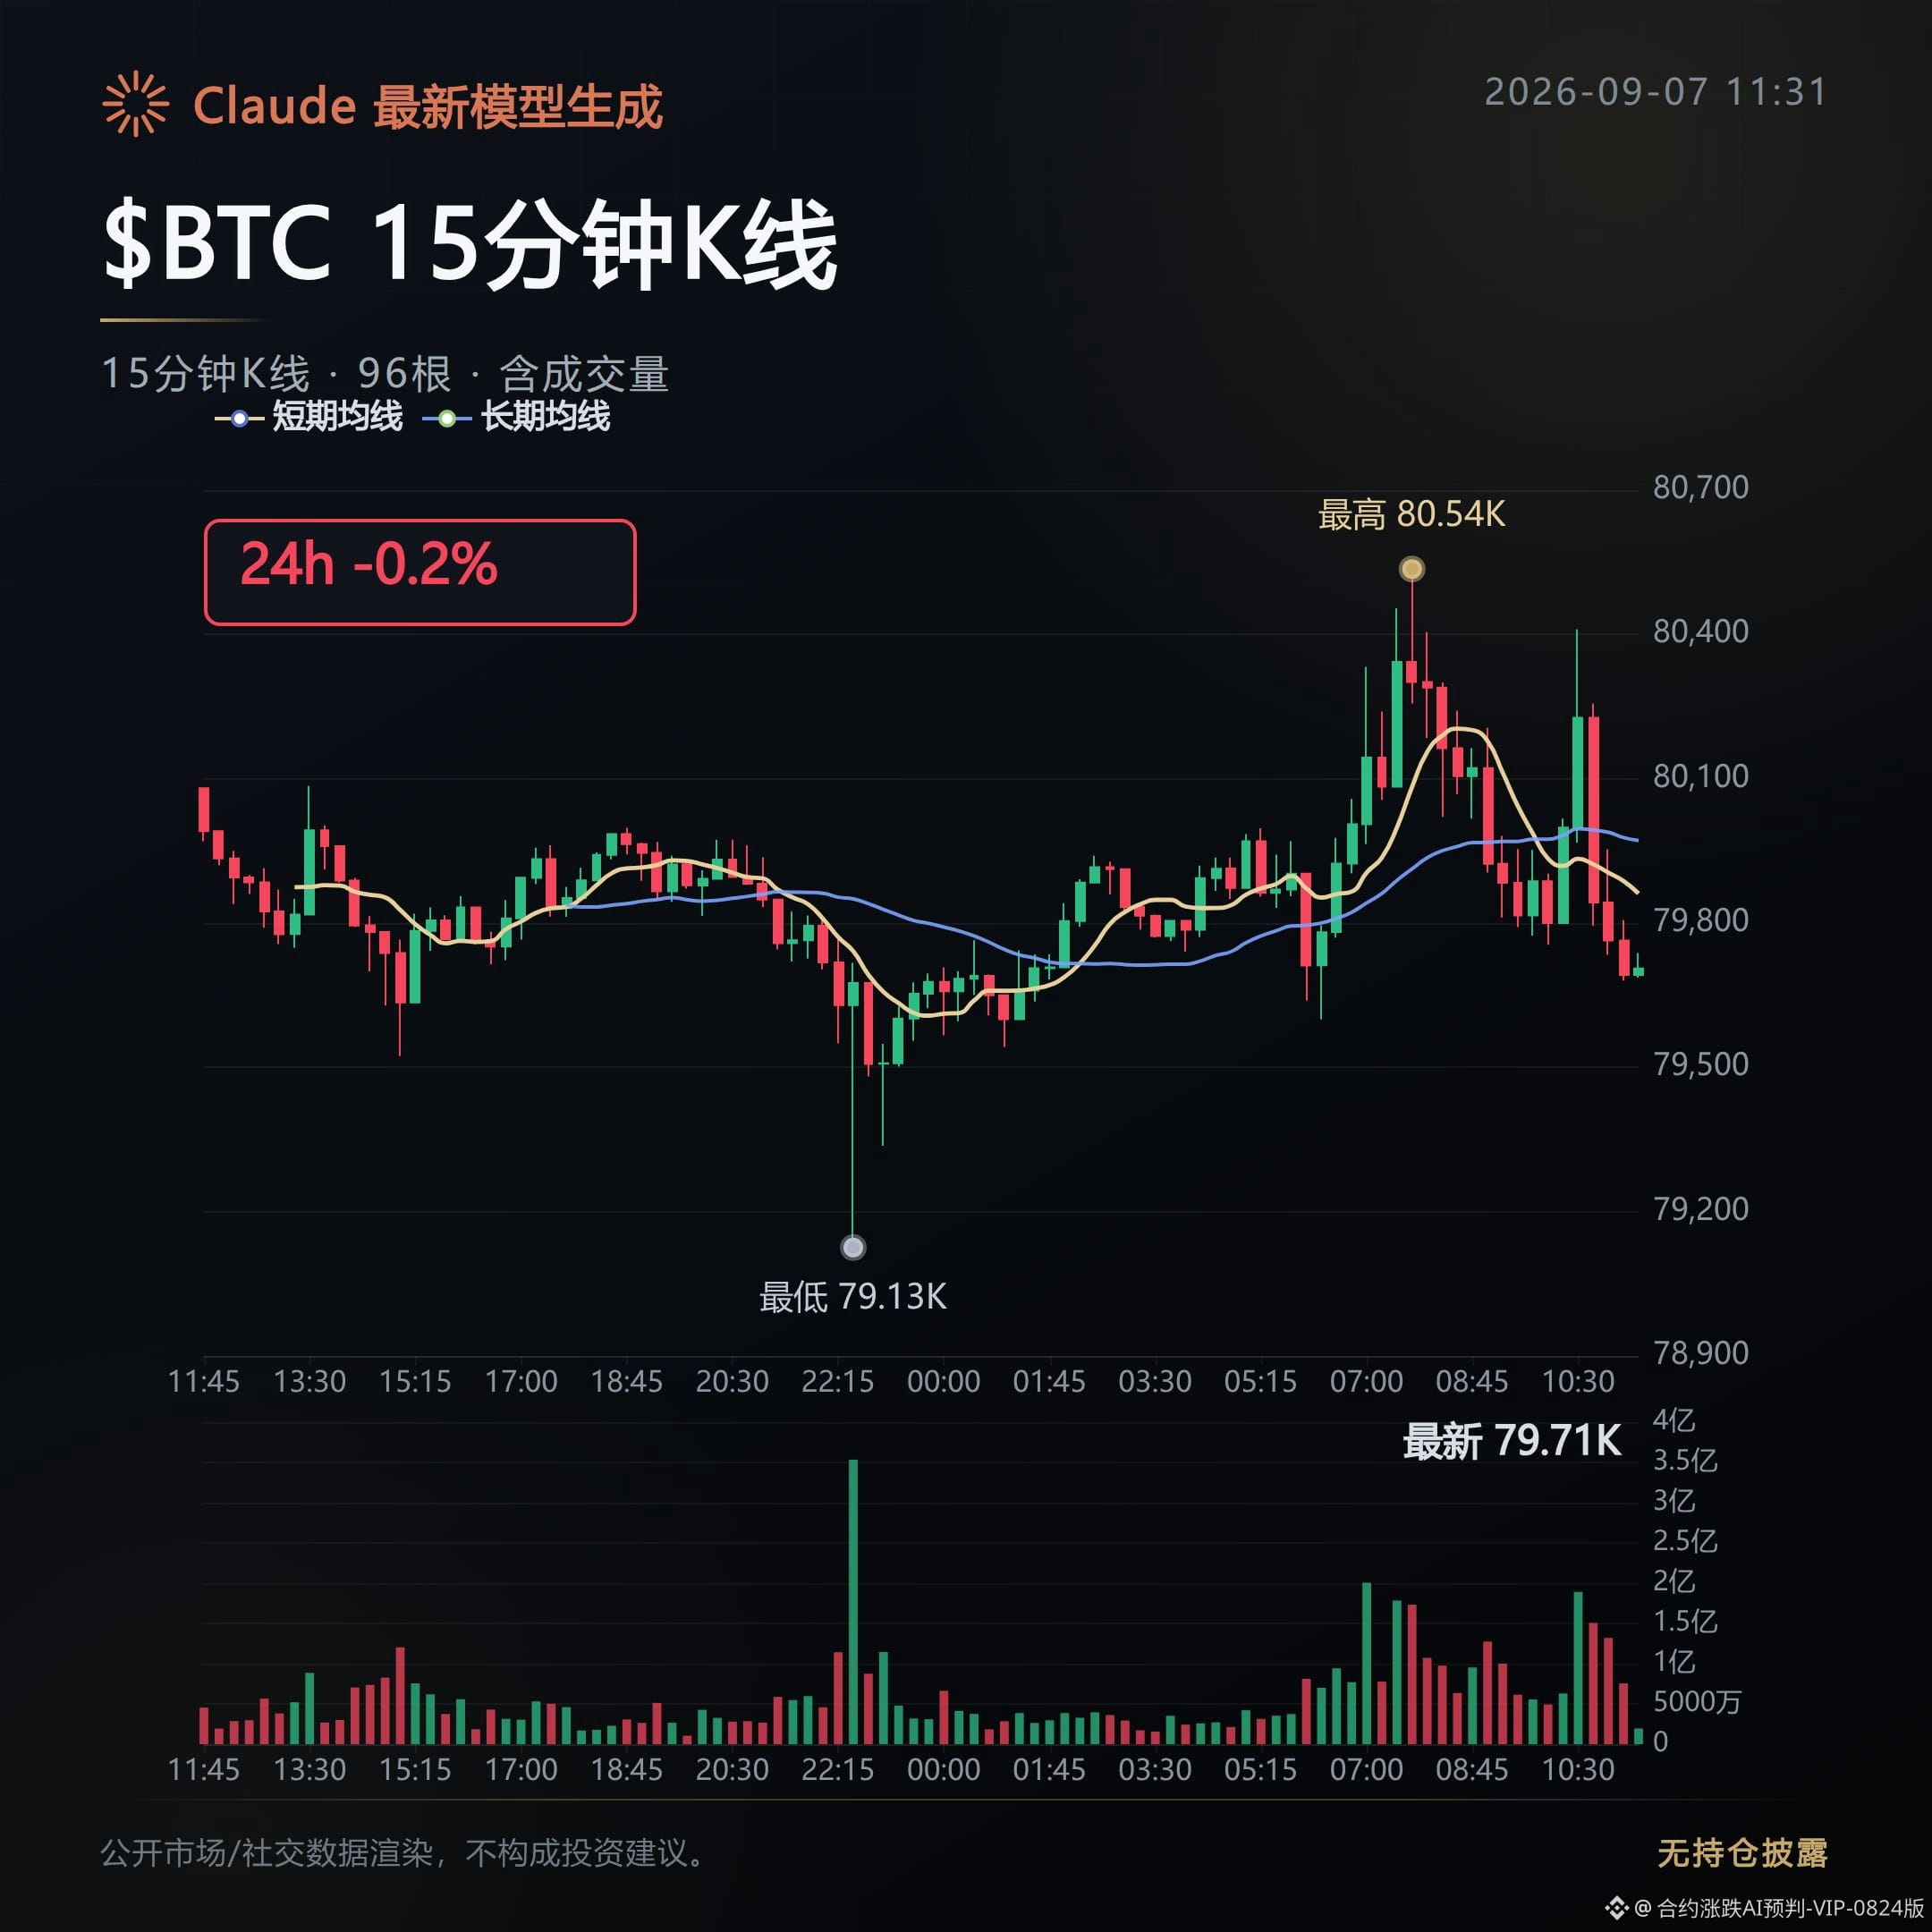
Contract Market Daily | 9/7 Midday: White Hat Takes 4,000 Coins, But Rates Don’t Flinch
Liquid Network was reported to have had a "white hat hacker" withdraw 4,000 bitcoins from its Bitcoin federal reserve, worth roughly $320 million, and the network has already been suspended for cleanup. This news is tied to $BTC , but on the derivatives side the mark price is 79,722, only down 0.17% over the past 24 hours, with almost no reaction. That suggests the money was not pulled directly from the market; the impact started on-chain and has not yet reached the order book.
Another, more concrete signal: spot Bitcoin ETFs saw a net inflow of $987 million last week, the best week this year. Institutions are rebuilding positions along this line, contrasting with the calm in derivatives.
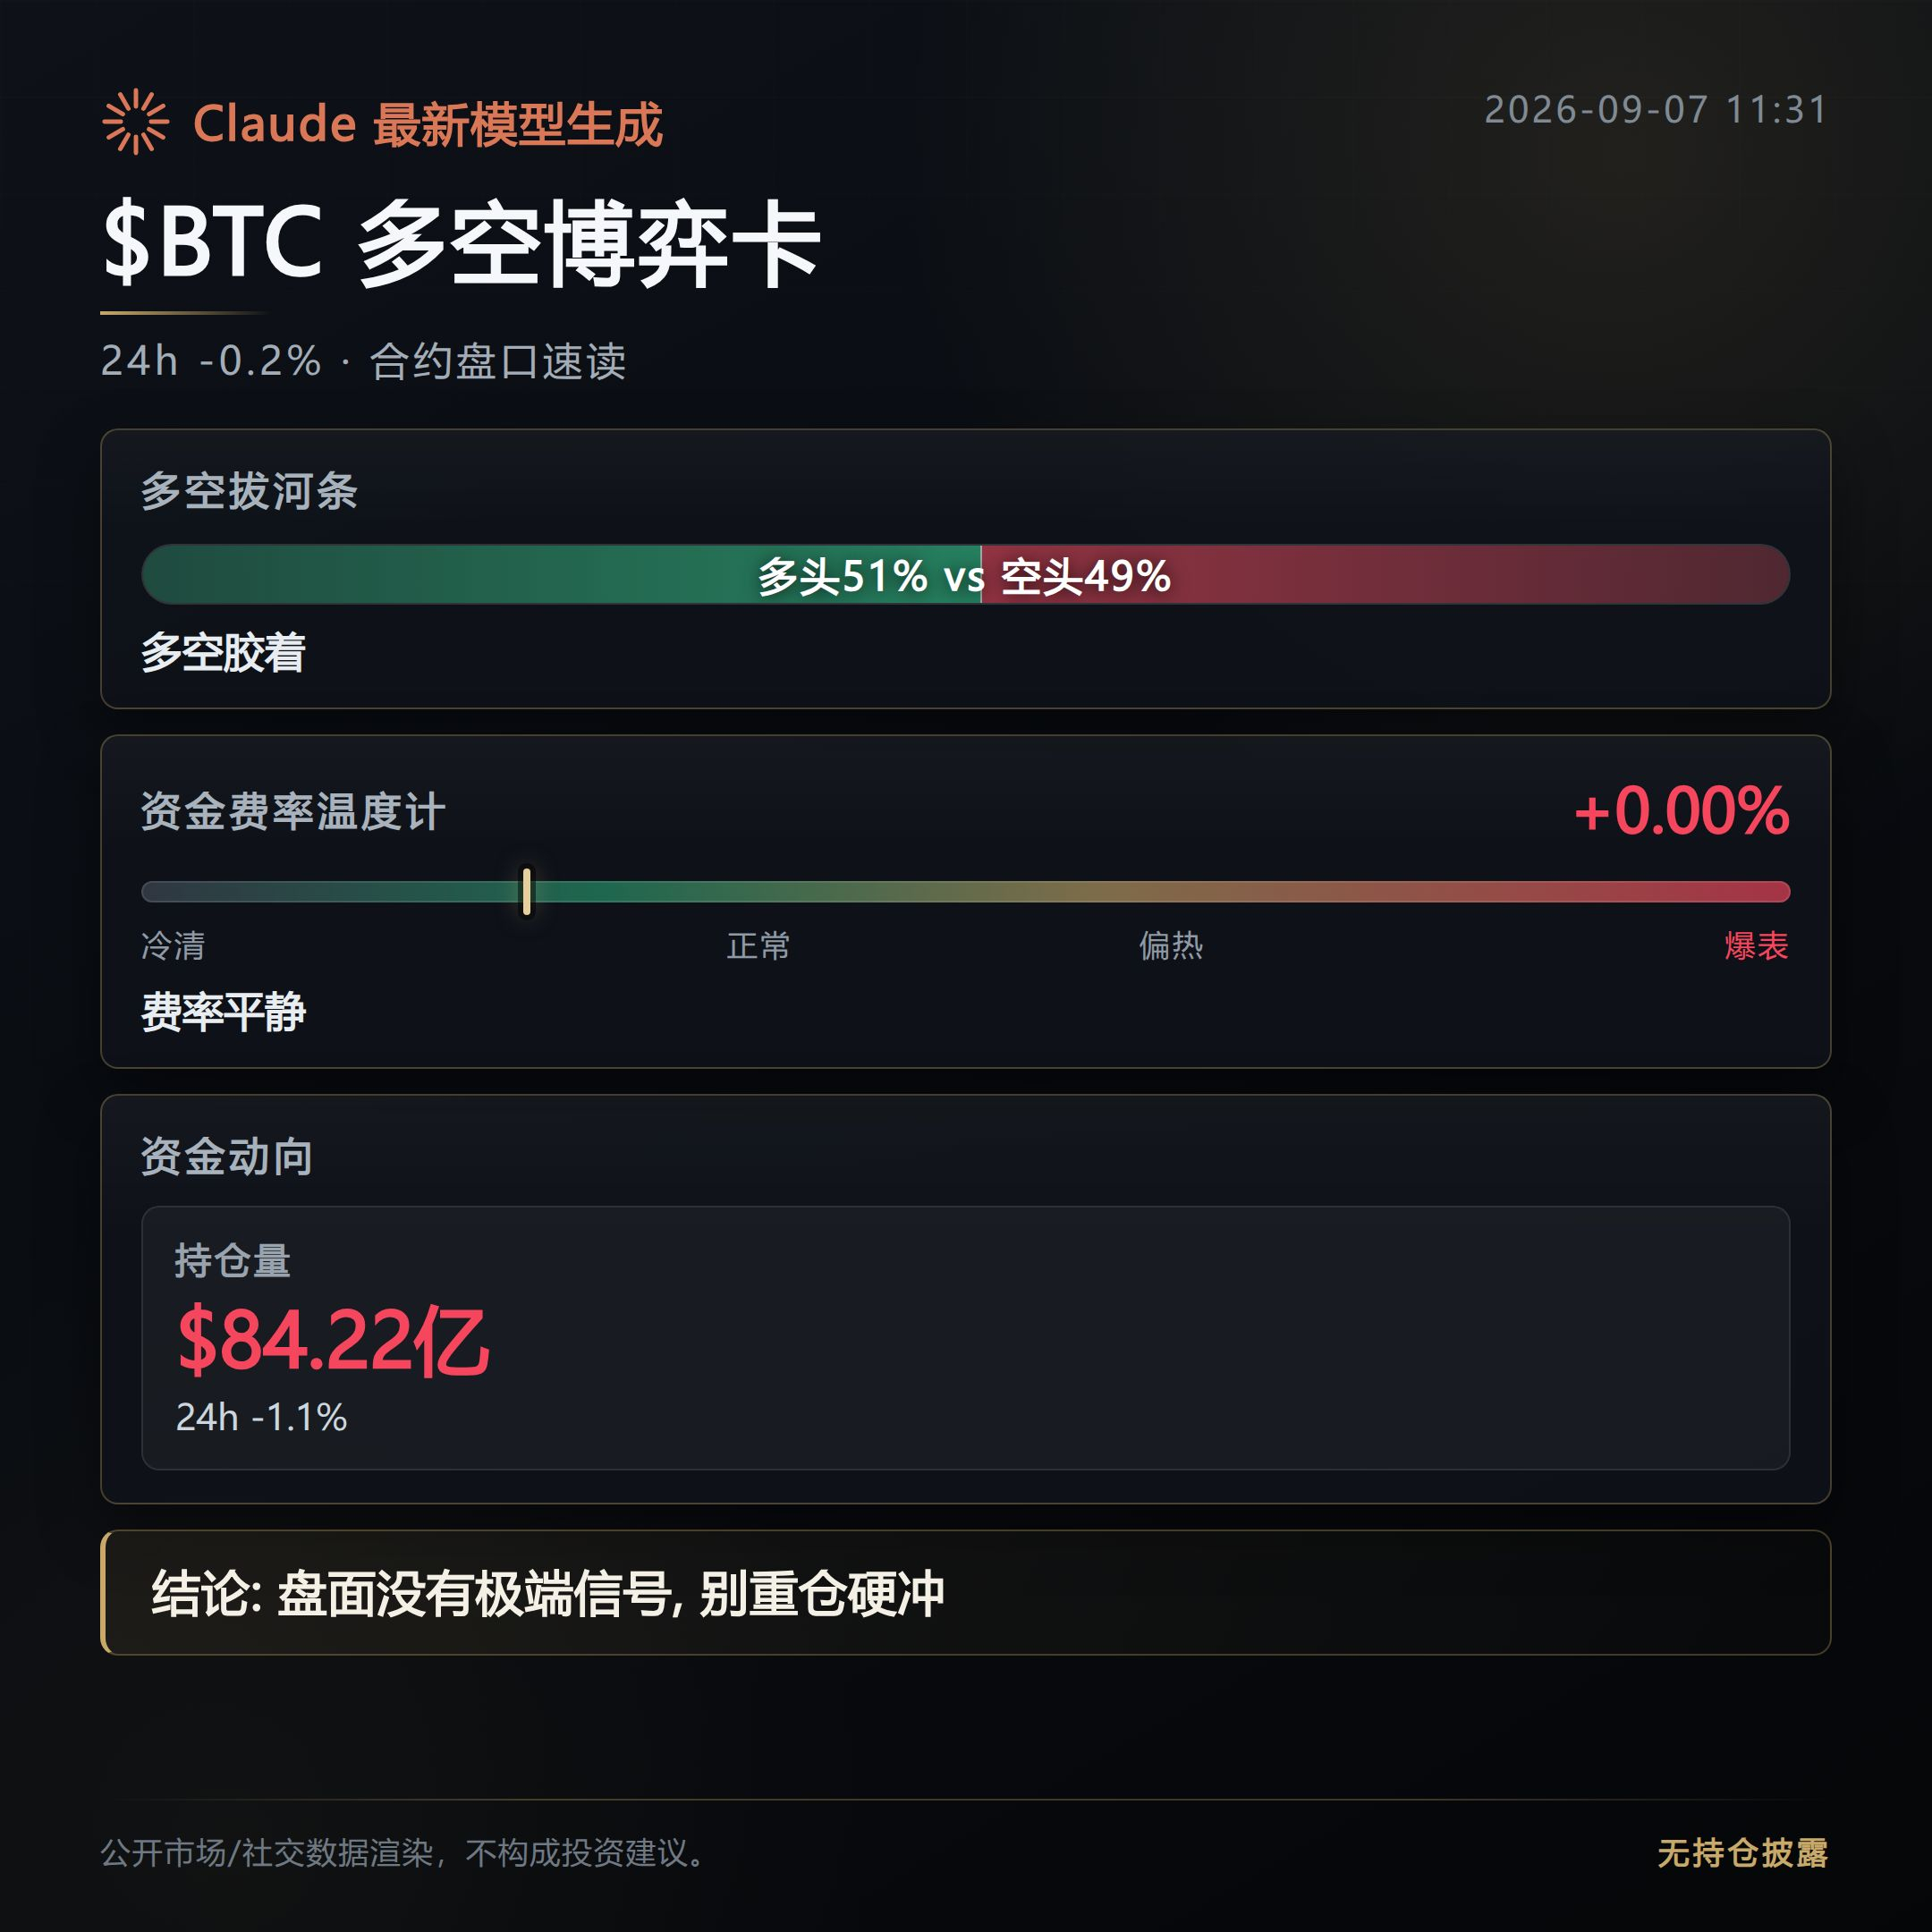
The positioning structure is worth a closer look. Open interest is $8.422 billion, down 1.1% in a day, while price is basically flat. This combination of "positions shrinking, price not falling" looks more like active rotation or profit-taking than a leverage-driven liquidation exit. Funding rate is 0.42‰, meaning longs are still paying shorts as usual. The long/short ratio is basically balanced at 51%, but aggressive selling has the upper hand, with the order book leaning bearish. The Fear & Greed Index is 71, in greed territory, but greed with such restrained funding has limited substance; it feels like sentiment moved first while leverage did not keep up.
In small caps, both sides show extreme funding: T, ORCA, and AKE have short funding around -0.6%, making crowded shorts vulnerable to a squeeze; tokenized stocks such as BYD, HK1810, and ZHIPU have long funding from +0.1% to +0.18%, so longs are not having an easy time either.
The key thing to watch next is one point: if funding keeps rising along with greed, that means sentiment is being converted into leverage; if it stays still, then the explanation of "active de-risking" becomes even more credible, and the stalemate of not falling and not rising will likely continue.
Live position disclosure: this account currently holds $FOGO long positions, and the related views are consistent with the actual position.
Contract data compiled with assistance from Claude Fable 5, for informational purposes only. Please verify independently.
Liquid Network was reported to have had a "white hat hacker" withdraw 4,000 bitcoins from its Bitcoin federal reserve, worth roughly $320 million, and the network has already been suspended for cleanup. This news is tied to $BTC , but on the derivatives side the mark price is 79,722, only down 0.17% over the past 24 hours, with almost no reaction. That suggests the money was not pulled directly from the market; the impact started on-chain and has not yet reached the order book.
Another, more concrete signal: spot Bitcoin ETFs saw a net inflow of $987 million last week, the best week this year. Institutions are rebuilding positions along this line, contrasting with the calm in derivatives.
The positioning structure is worth a closer look. Open interest is $8.422 billion, down 1.1% in a day, while price is basically flat. This combination of "positions shrinking, price not falling" looks more like active rotation or profit-taking than a leverage-driven liquidation exit. Funding rate is 0.42‰, meaning longs are still paying shorts as usual. The long/short ratio is basically balanced at 51%, but aggressive selling has the upper hand, with the order book leaning bearish. The Fear & Greed Index is 71, in greed territory, but greed with such restrained funding has limited substance; it feels like sentiment moved first while leverage did not keep up.
In small caps, both sides show extreme funding: T, ORCA, and AKE have short funding around -0.6%, making crowded shorts vulnerable to a squeeze; tokenized stocks such as BYD, HK1810, and ZHIPU have long funding from +0.1% to +0.18%, so longs are not having an easy time either.
The key thing to watch next is one point: if funding keeps rising along with greed, that means sentiment is being converted into leverage; if it stays still, then the explanation of "active de-risking" becomes even more credible, and the stalemate of not falling and not rising will likely continue.
Live position disclosure: this account currently holds $FOGO long positions, and the related views are consistent with the actual position.
Contract data compiled with assistance from Claude Fable 5, for informational purposes only. Please verify independently.
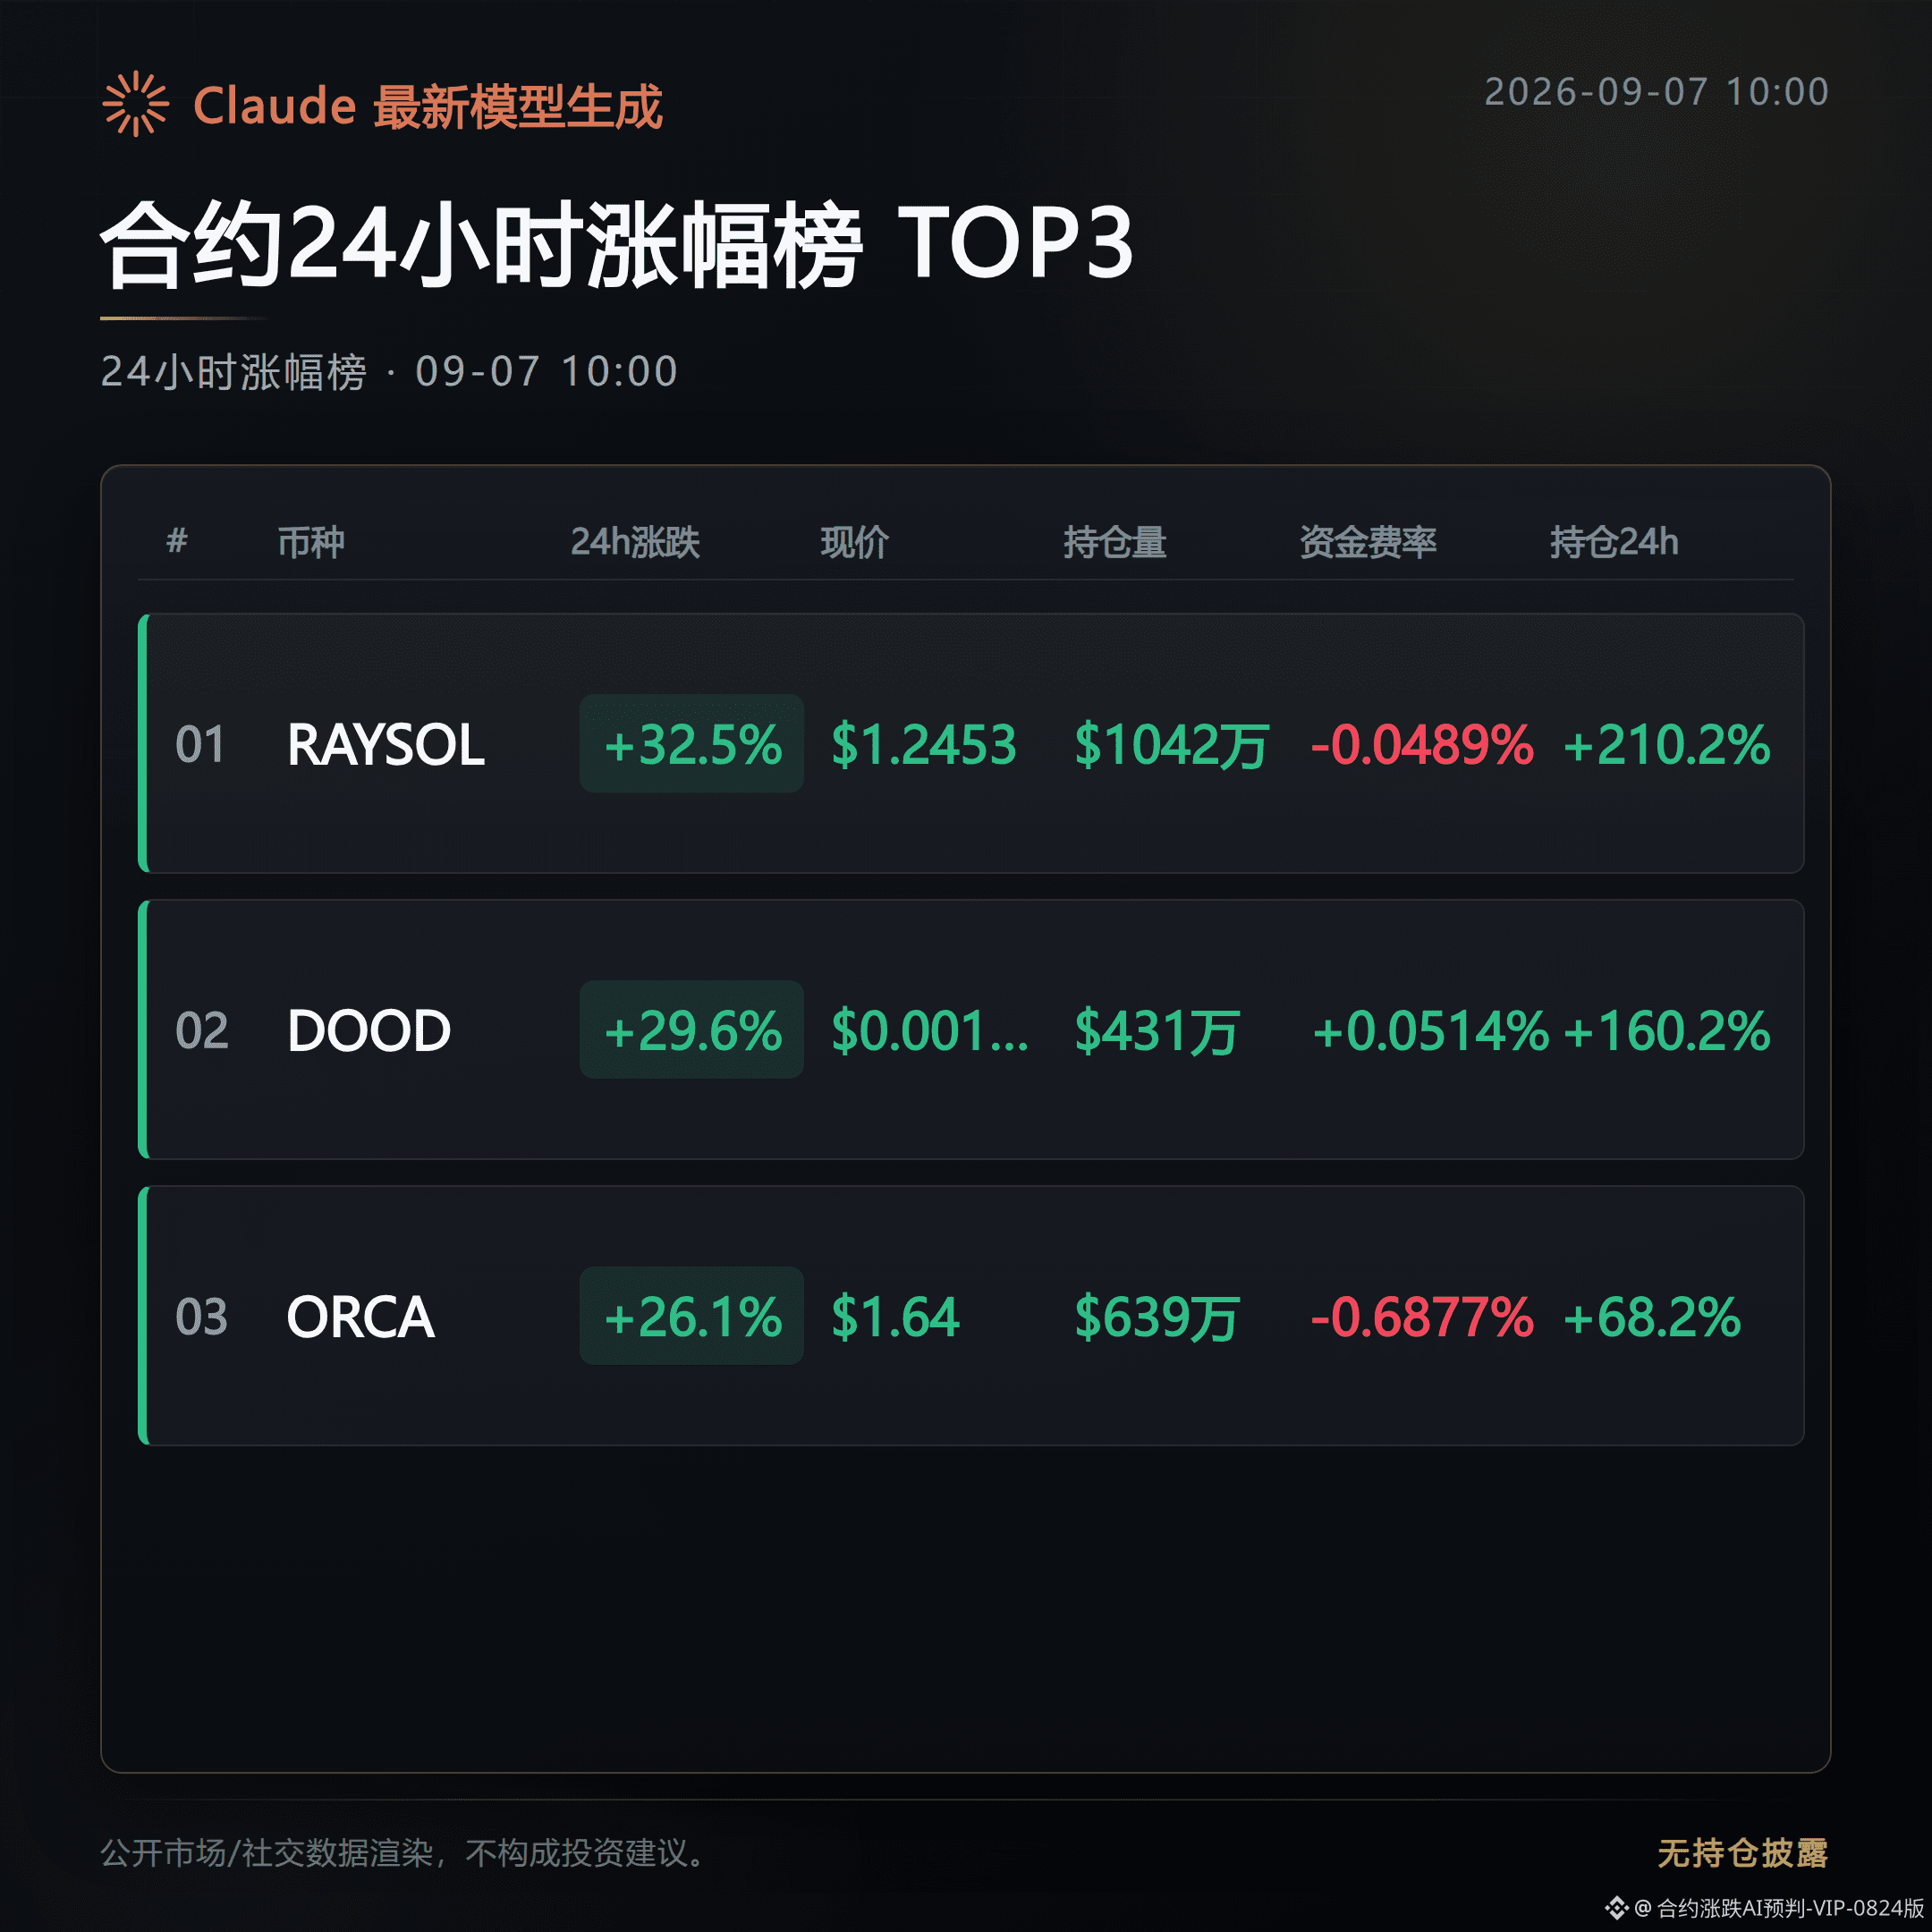
In the morning watchlist, first go over the top 3 on today’s perpetual contract 24-hour gainers list. All of them have gains below triple digits, but their structures differ significantly. Let’s look directly at the order books.
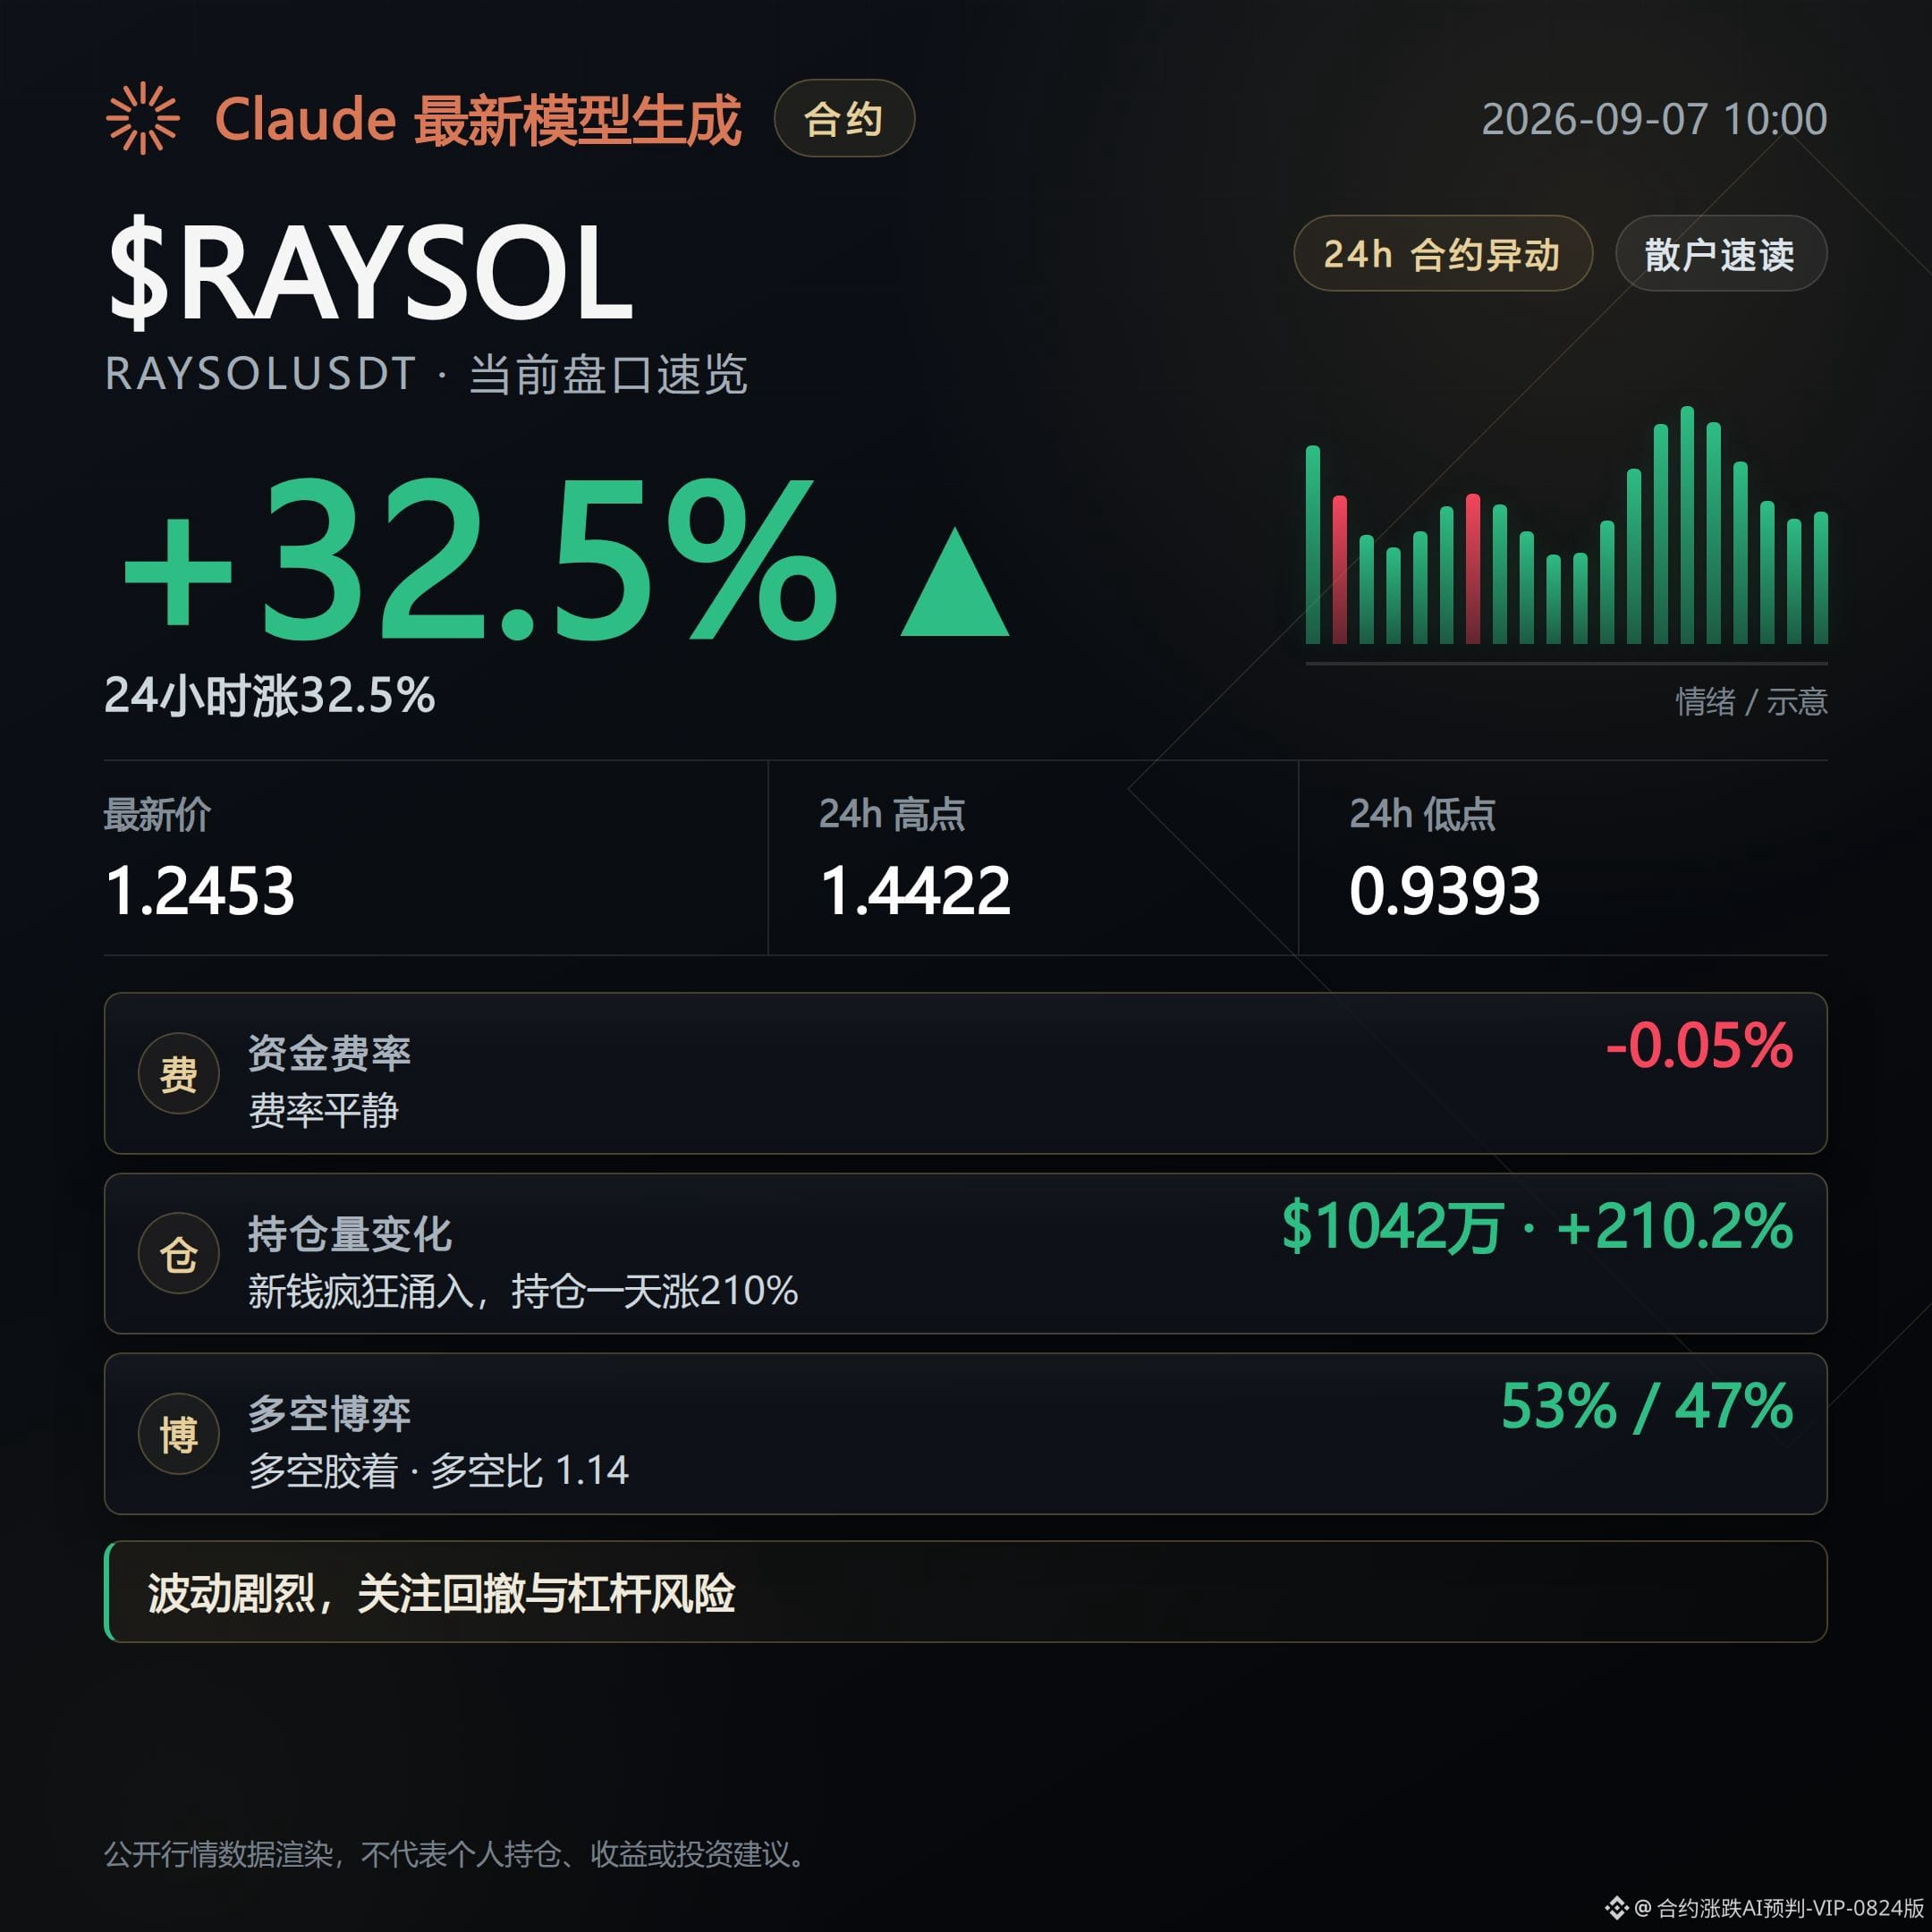
RAYSOL is currently priced at 1.2453, with a 24-hour gain of 32.45% and a trading volume of 490 million USD, the largest capital scale among the three coins.
Open interest surged 210.2% over the past 24 hours, but it only rose 1.5% in the most recent hour, indicating that most of this position-building happened earlier and the current pace is slowing.
The funding rate is -0.0489%, and shorts have been paying for 4 consecutive periods. The long/short ratio is 1.14, with longs accounting for 53%, a combination of rising prices but a funding rate skewed toward short-side payment.
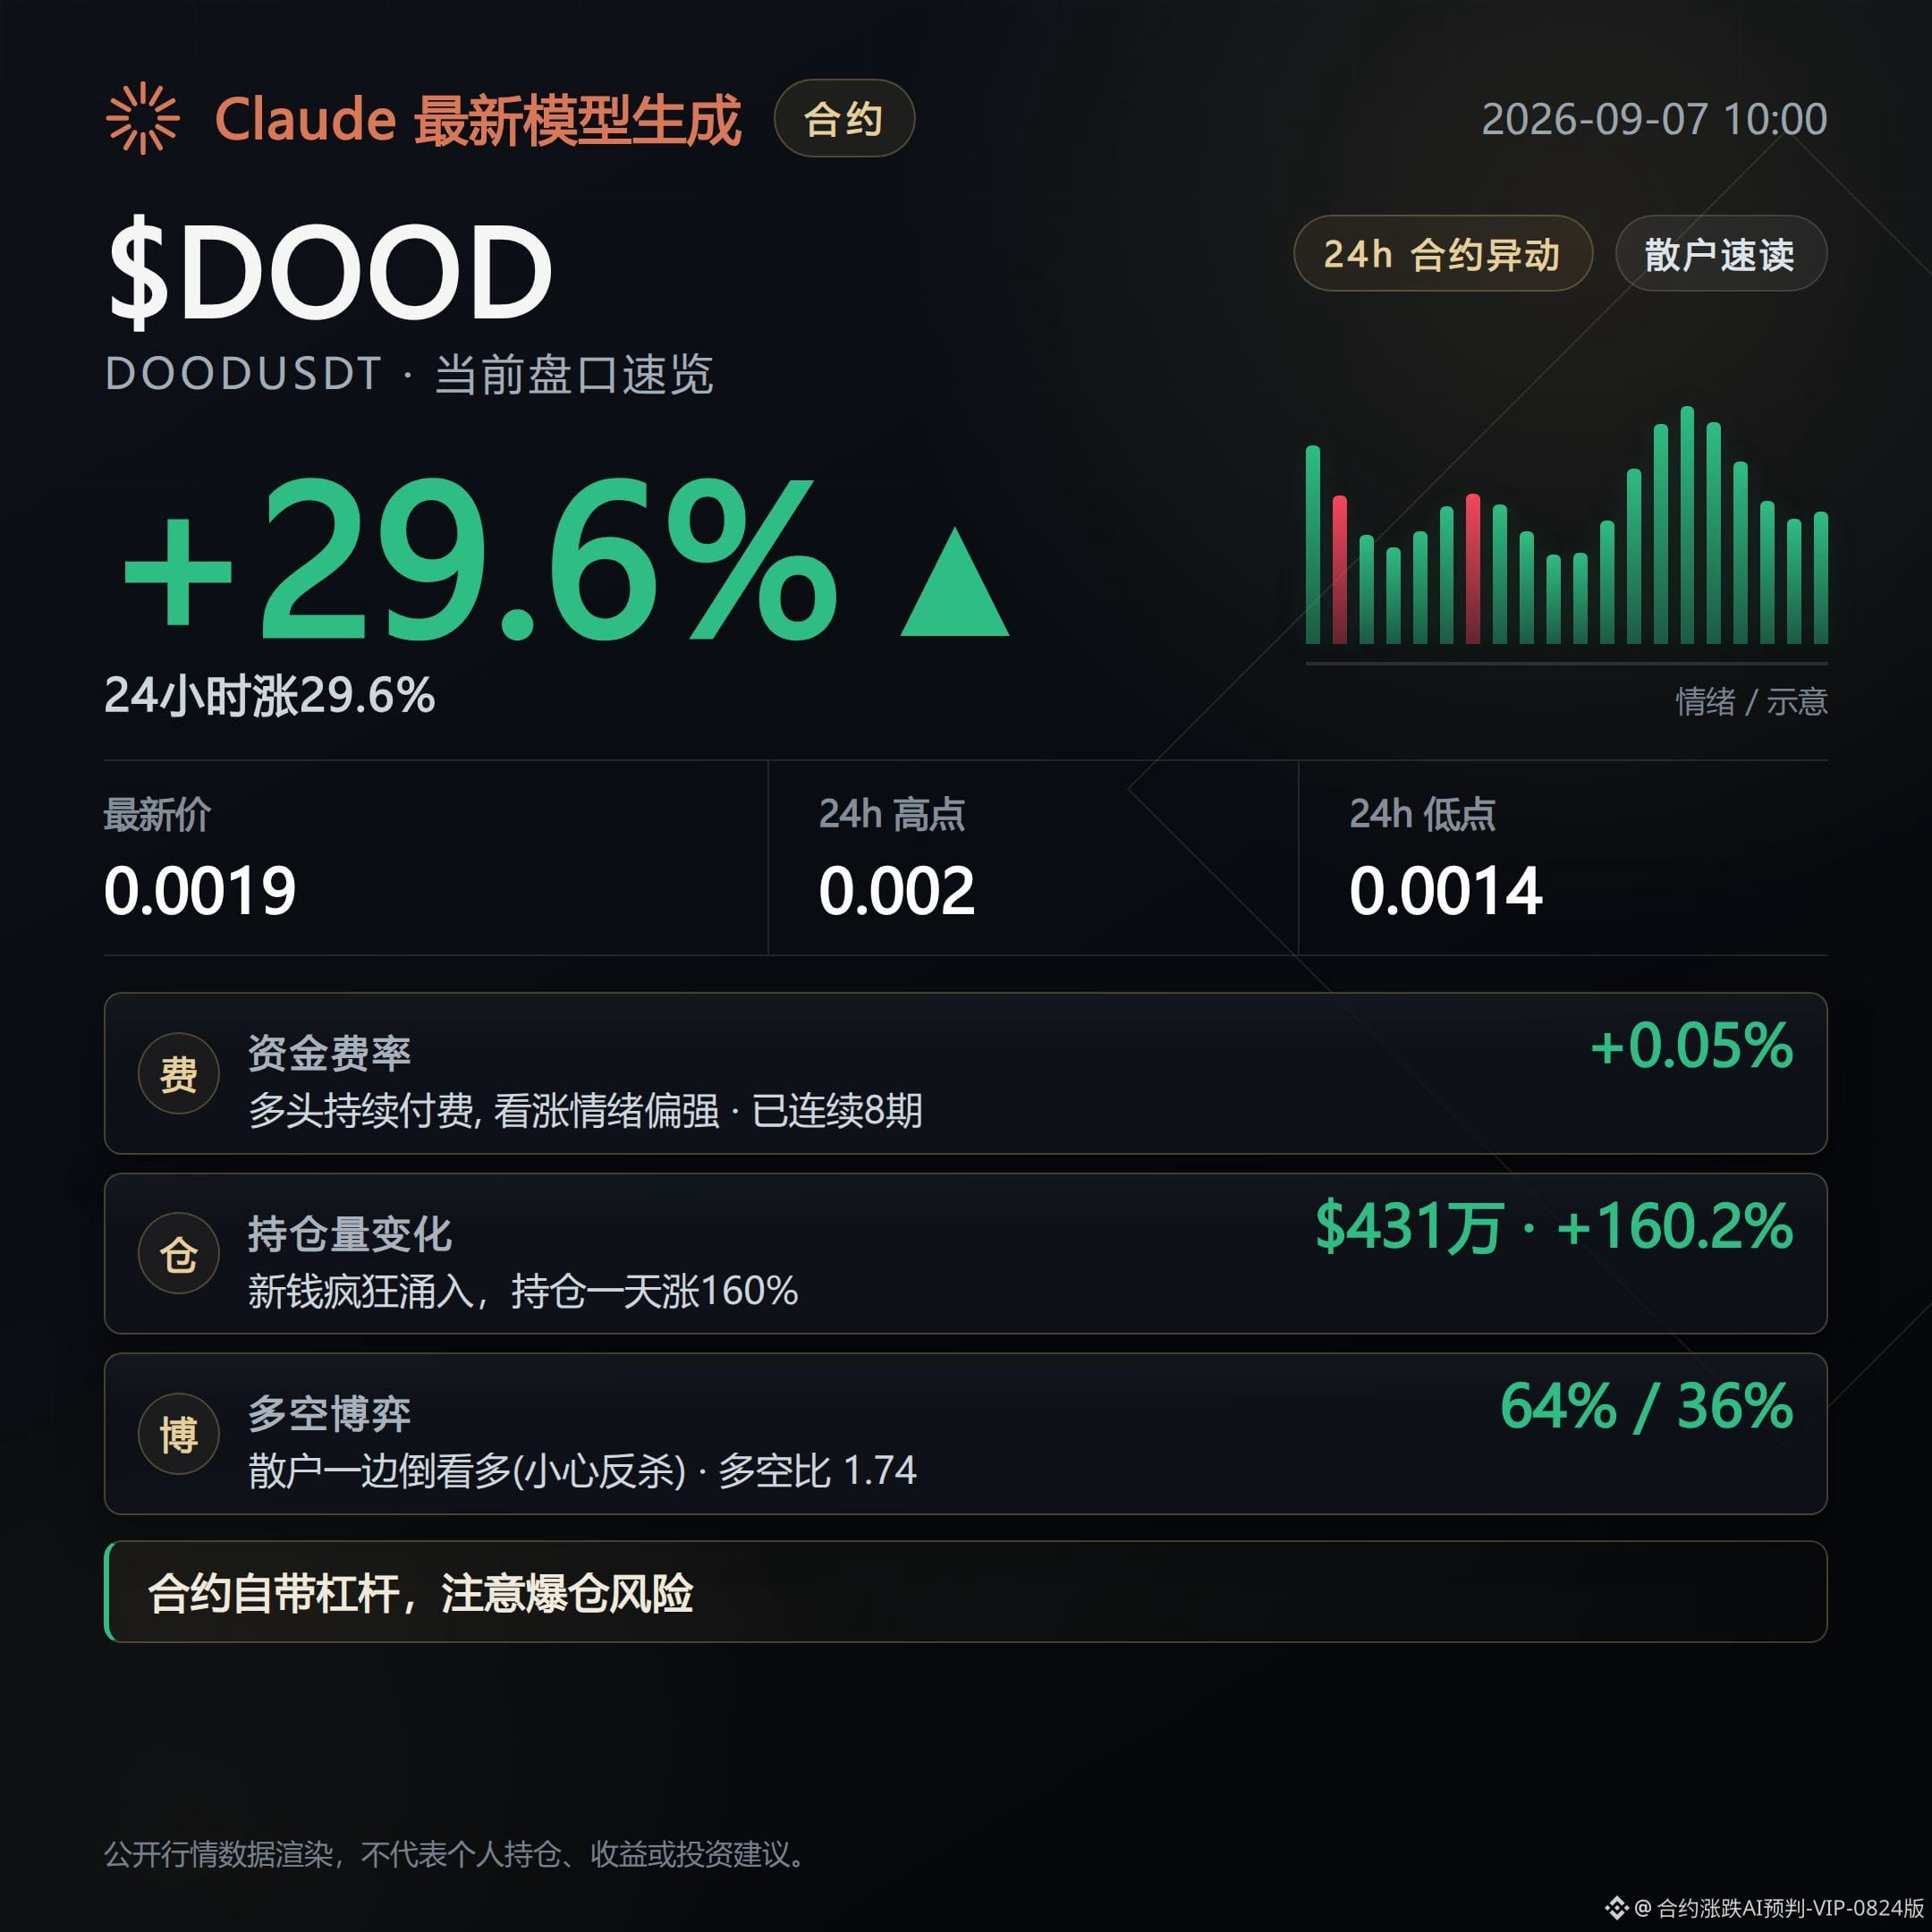
DOOD is currently priced at 0.001888, with a 24-hour gain of 29.58% and trading volume of 59.69 million USD, a scale clearly smaller than RAYSOL.
Open interest increased 160.2% over 24 hours, but fell 7.3% in the most recent hour, suggesting that funds are reducing positions at higher levels.
The funding rate is +0.0514%, with longs paying for 8 consecutive periods. The long/short ratio is 1.74, and longs account for 64%, making it the most crowded long trade among the three coins. RSI 65.7 is in a neutral-to-hot zone.
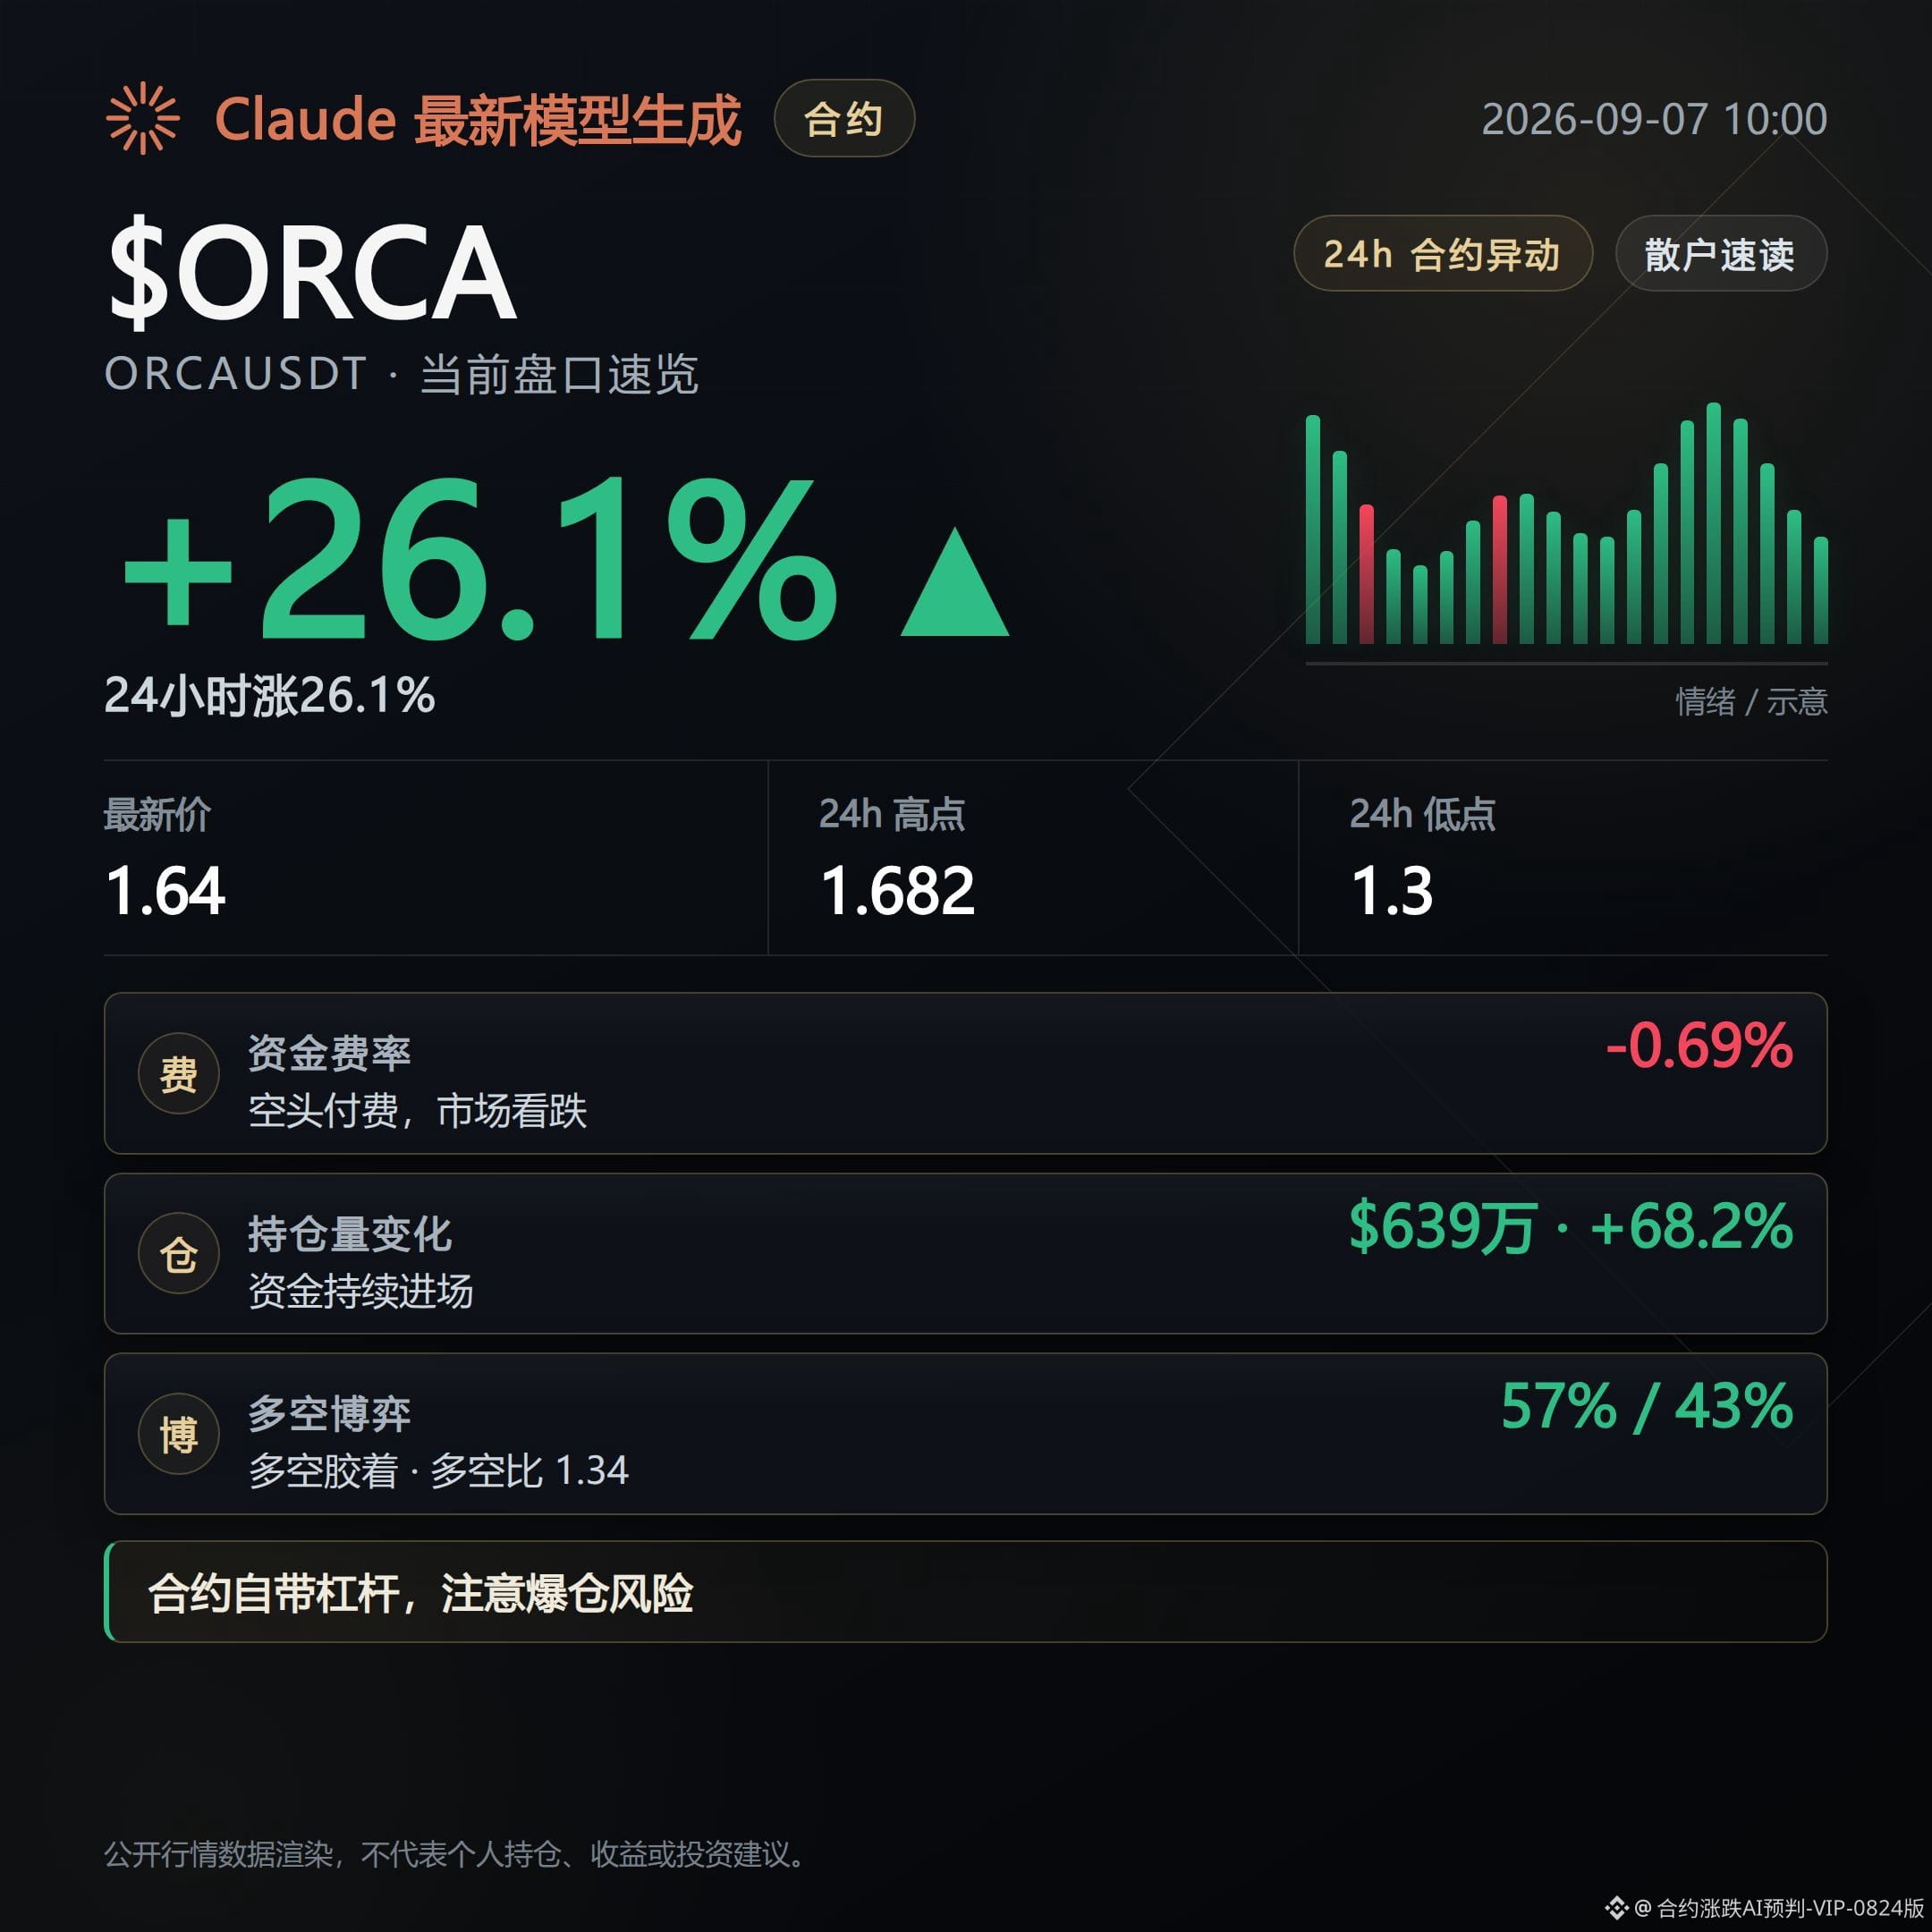
ORCA is currently priced at 1.64, with a 24-hour gain of 26.06% and trading volume of 41.6 million USD, the smallest among the three.
Its biggest highlight is RSI 78.6, which has entered overbought territory; at the same time, open interest accelerated upward by 27.1% in the most recent hour, indicating that new positions are still flowing in right now rather than cooling off.
The funding rate is -0.6877%, with shorts paying for 3 consecutive periods. The premium/discount rate is -1.8381%, the deepest negative funding rate and discount among the three coins.
The three coins share one common point: their 24-hour open interest growth far exceeds their price gains (210.2%, 160.2%, 68.2%), indicating that this wave is more about rapid buildup in derivatives positions than simple spot-driven price discovery. Historically, leading gainers like these can pull back quickly when sentiment fades, especially combinations like ORCA, where RSI is already overbought and funding has turned deeply negative; volatility may be even stronger. When watching the tape, just pay attention to changes in open interest growth and funding rate momentum. This does not constitute any trading advice.
#合约市场 #RAYSOL
Live trading record: this account currently holds $FOGO long positions and will continue holding as long as the logic remains unchanged.
This content was generated with assistance from Claude Fable 5 and is for informational reference only. Please verify independently.
RAYSOL is currently priced at 1.2453, with a 24-hour gain of 32.45% and a trading volume of 490 million USD, the largest capital scale among the three coins.
Open interest surged 210.2% over the past 24 hours, but it only rose 1.5% in the most recent hour, indicating that most of this position-building happened earlier and the current pace is slowing.
The funding rate is -0.0489%, and shorts have been paying for 4 consecutive periods. The long/short ratio is 1.14, with longs accounting for 53%, a combination of rising prices but a funding rate skewed toward short-side payment.
DOOD is currently priced at 0.001888, with a 24-hour gain of 29.58% and trading volume of 59.69 million USD, a scale clearly smaller than RAYSOL.
Open interest increased 160.2% over 24 hours, but fell 7.3% in the most recent hour, suggesting that funds are reducing positions at higher levels.
The funding rate is +0.0514%, with longs paying for 8 consecutive periods. The long/short ratio is 1.74, and longs account for 64%, making it the most crowded long trade among the three coins. RSI 65.7 is in a neutral-to-hot zone.
ORCA is currently priced at 1.64, with a 24-hour gain of 26.06% and trading volume of 41.6 million USD, the smallest among the three.
Its biggest highlight is RSI 78.6, which has entered overbought territory; at the same time, open interest accelerated upward by 27.1% in the most recent hour, indicating that new positions are still flowing in right now rather than cooling off.
The funding rate is -0.6877%, with shorts paying for 3 consecutive periods. The premium/discount rate is -1.8381%, the deepest negative funding rate and discount among the three coins.
The three coins share one common point: their 24-hour open interest growth far exceeds their price gains (210.2%, 160.2%, 68.2%), indicating that this wave is more about rapid buildup in derivatives positions than simple spot-driven price discovery. Historically, leading gainers like these can pull back quickly when sentiment fades, especially combinations like ORCA, where RSI is already overbought and funding has turned deeply negative; volatility may be even stronger. When watching the tape, just pay attention to changes in open interest growth and funding rate momentum. This does not constitute any trading advice.
#合约市场 #RAYSOL
Live trading record: this account currently holds $FOGO long positions and will continue holding as long as the logic remains unchanged.
This content was generated with assistance from Claude Fable 5 and is for informational reference only. Please verify independently.
Bullish.
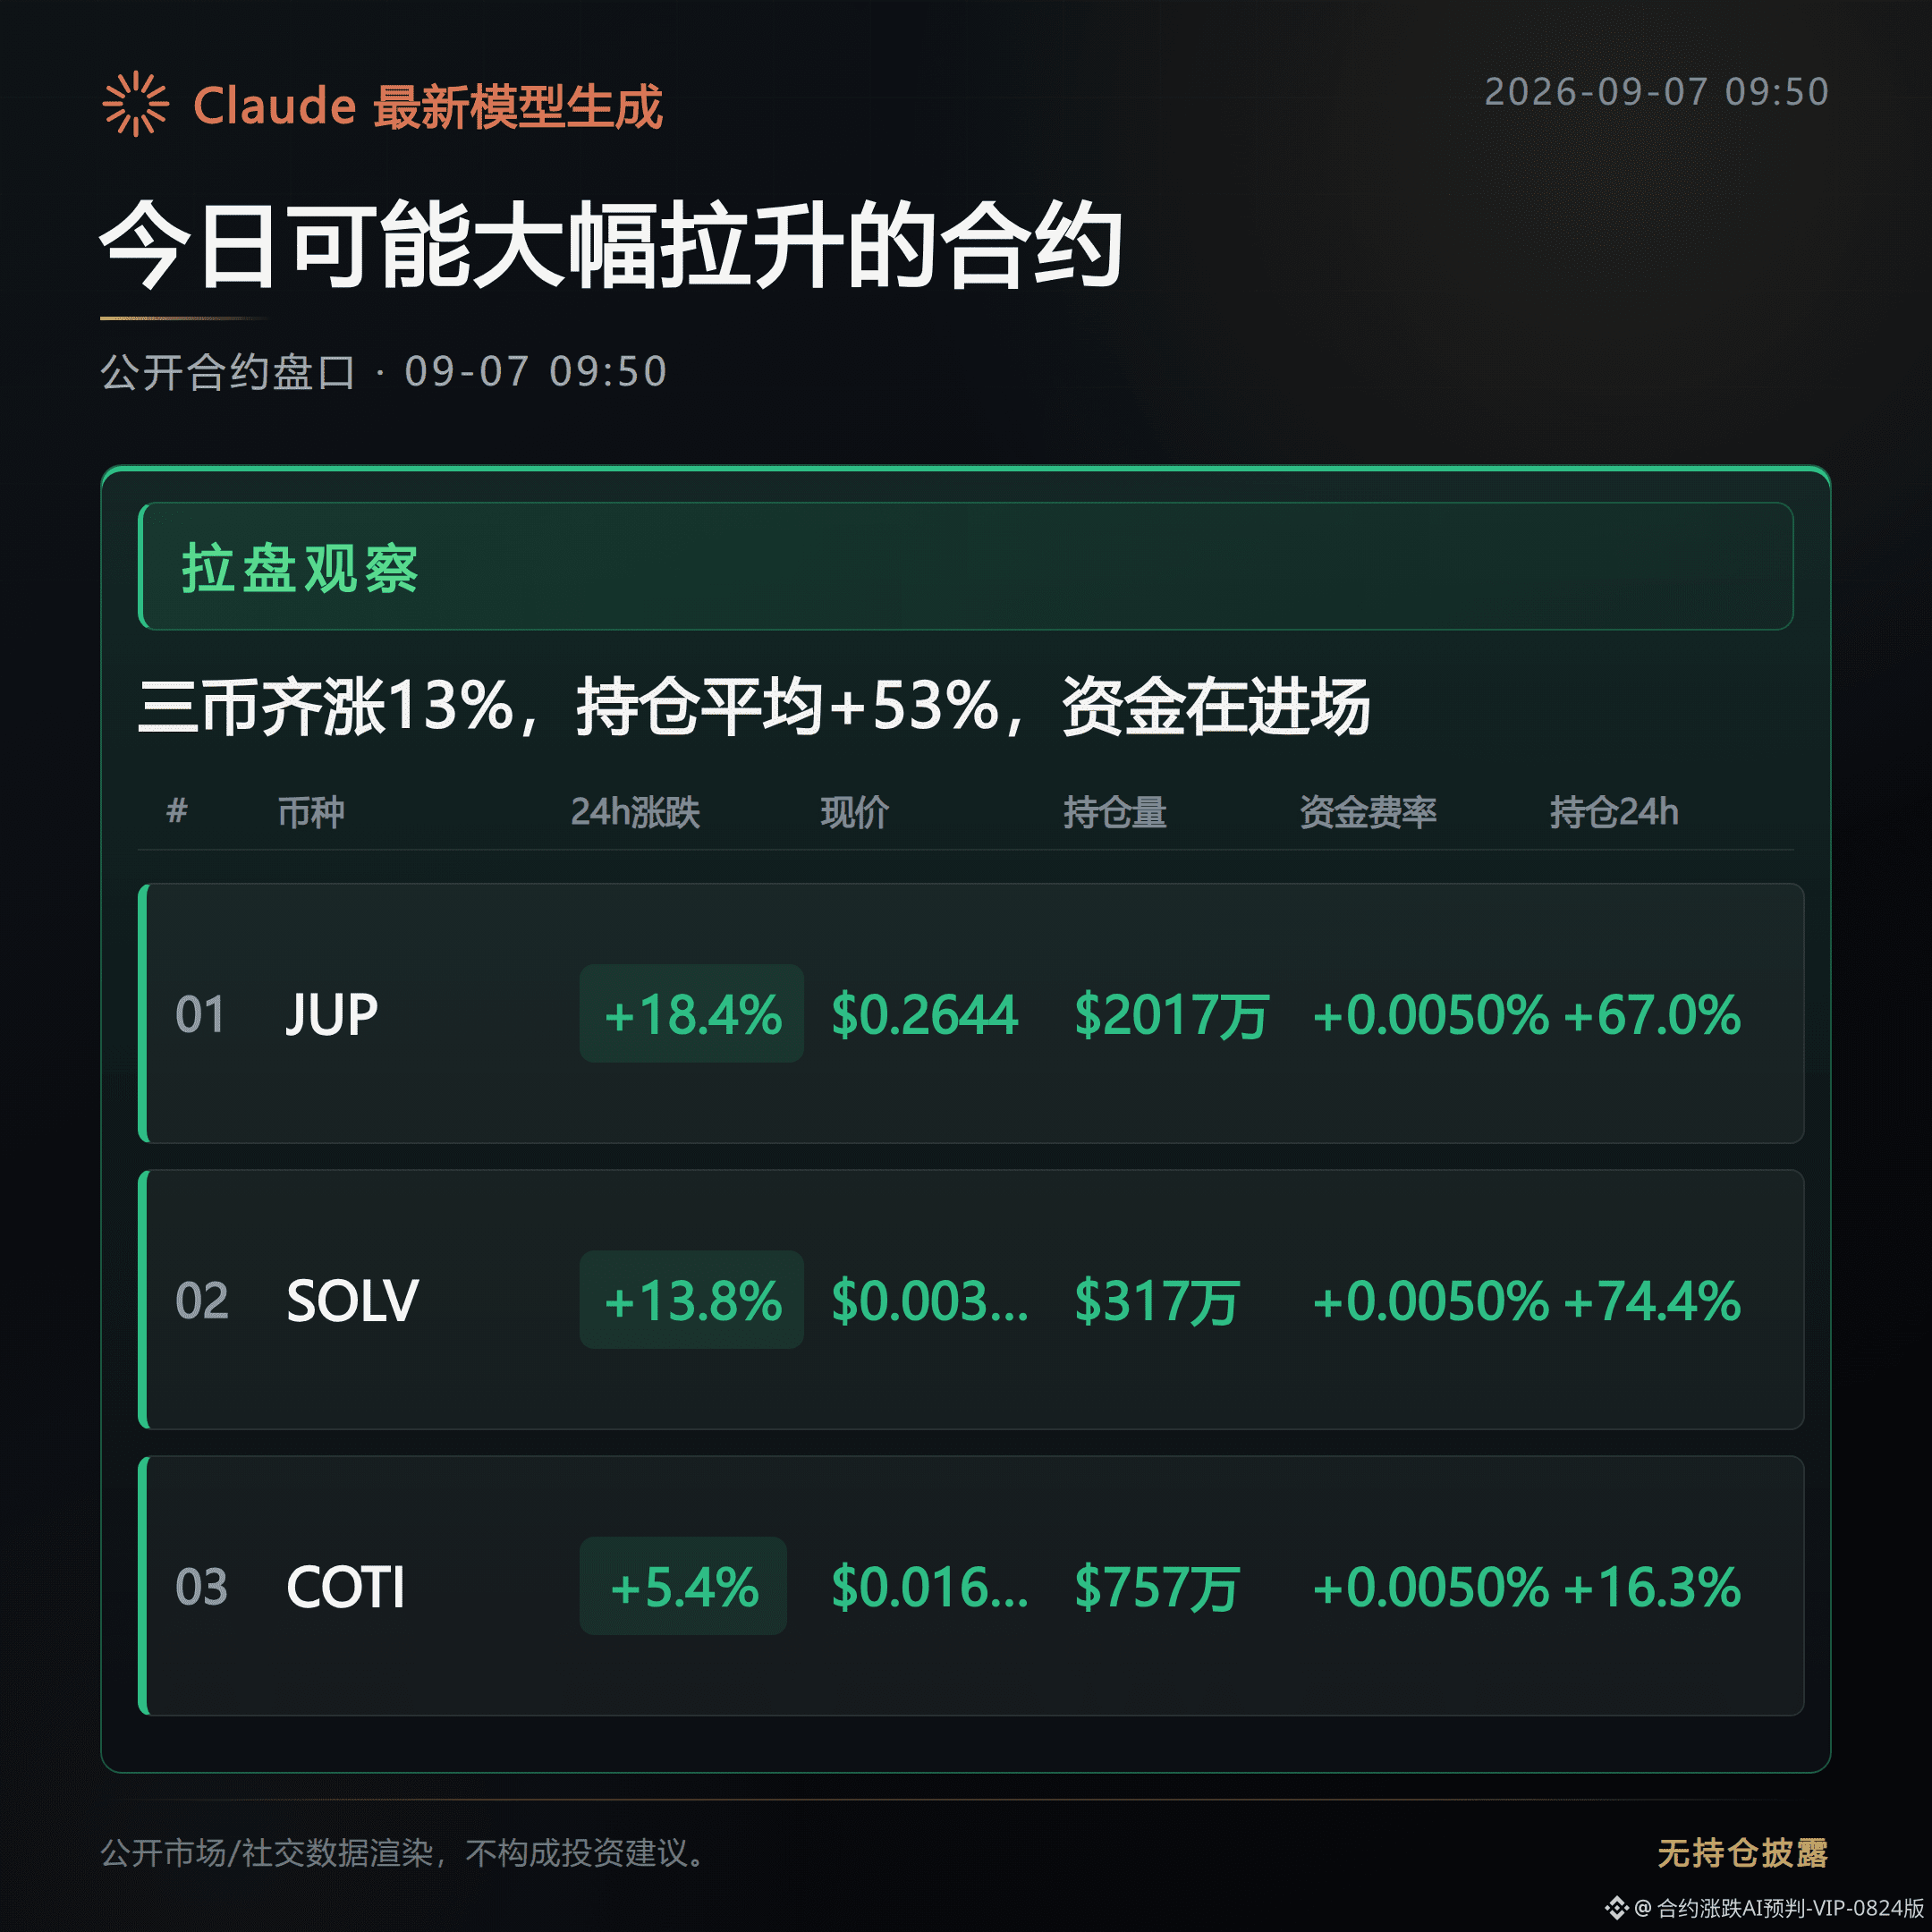
For the three contracts JUPUSDT, SOLVUSDT, and COTIUSDT, prices have all been moving upward over the past 24 hours, and open interest has also been rising in sync. The signal I see in the market is positions flowing in together with price, rather than a one-legged price pump with positions failing to follow.
Next, I’m watching whether each of these three coins can continue to confirm their respective signals.
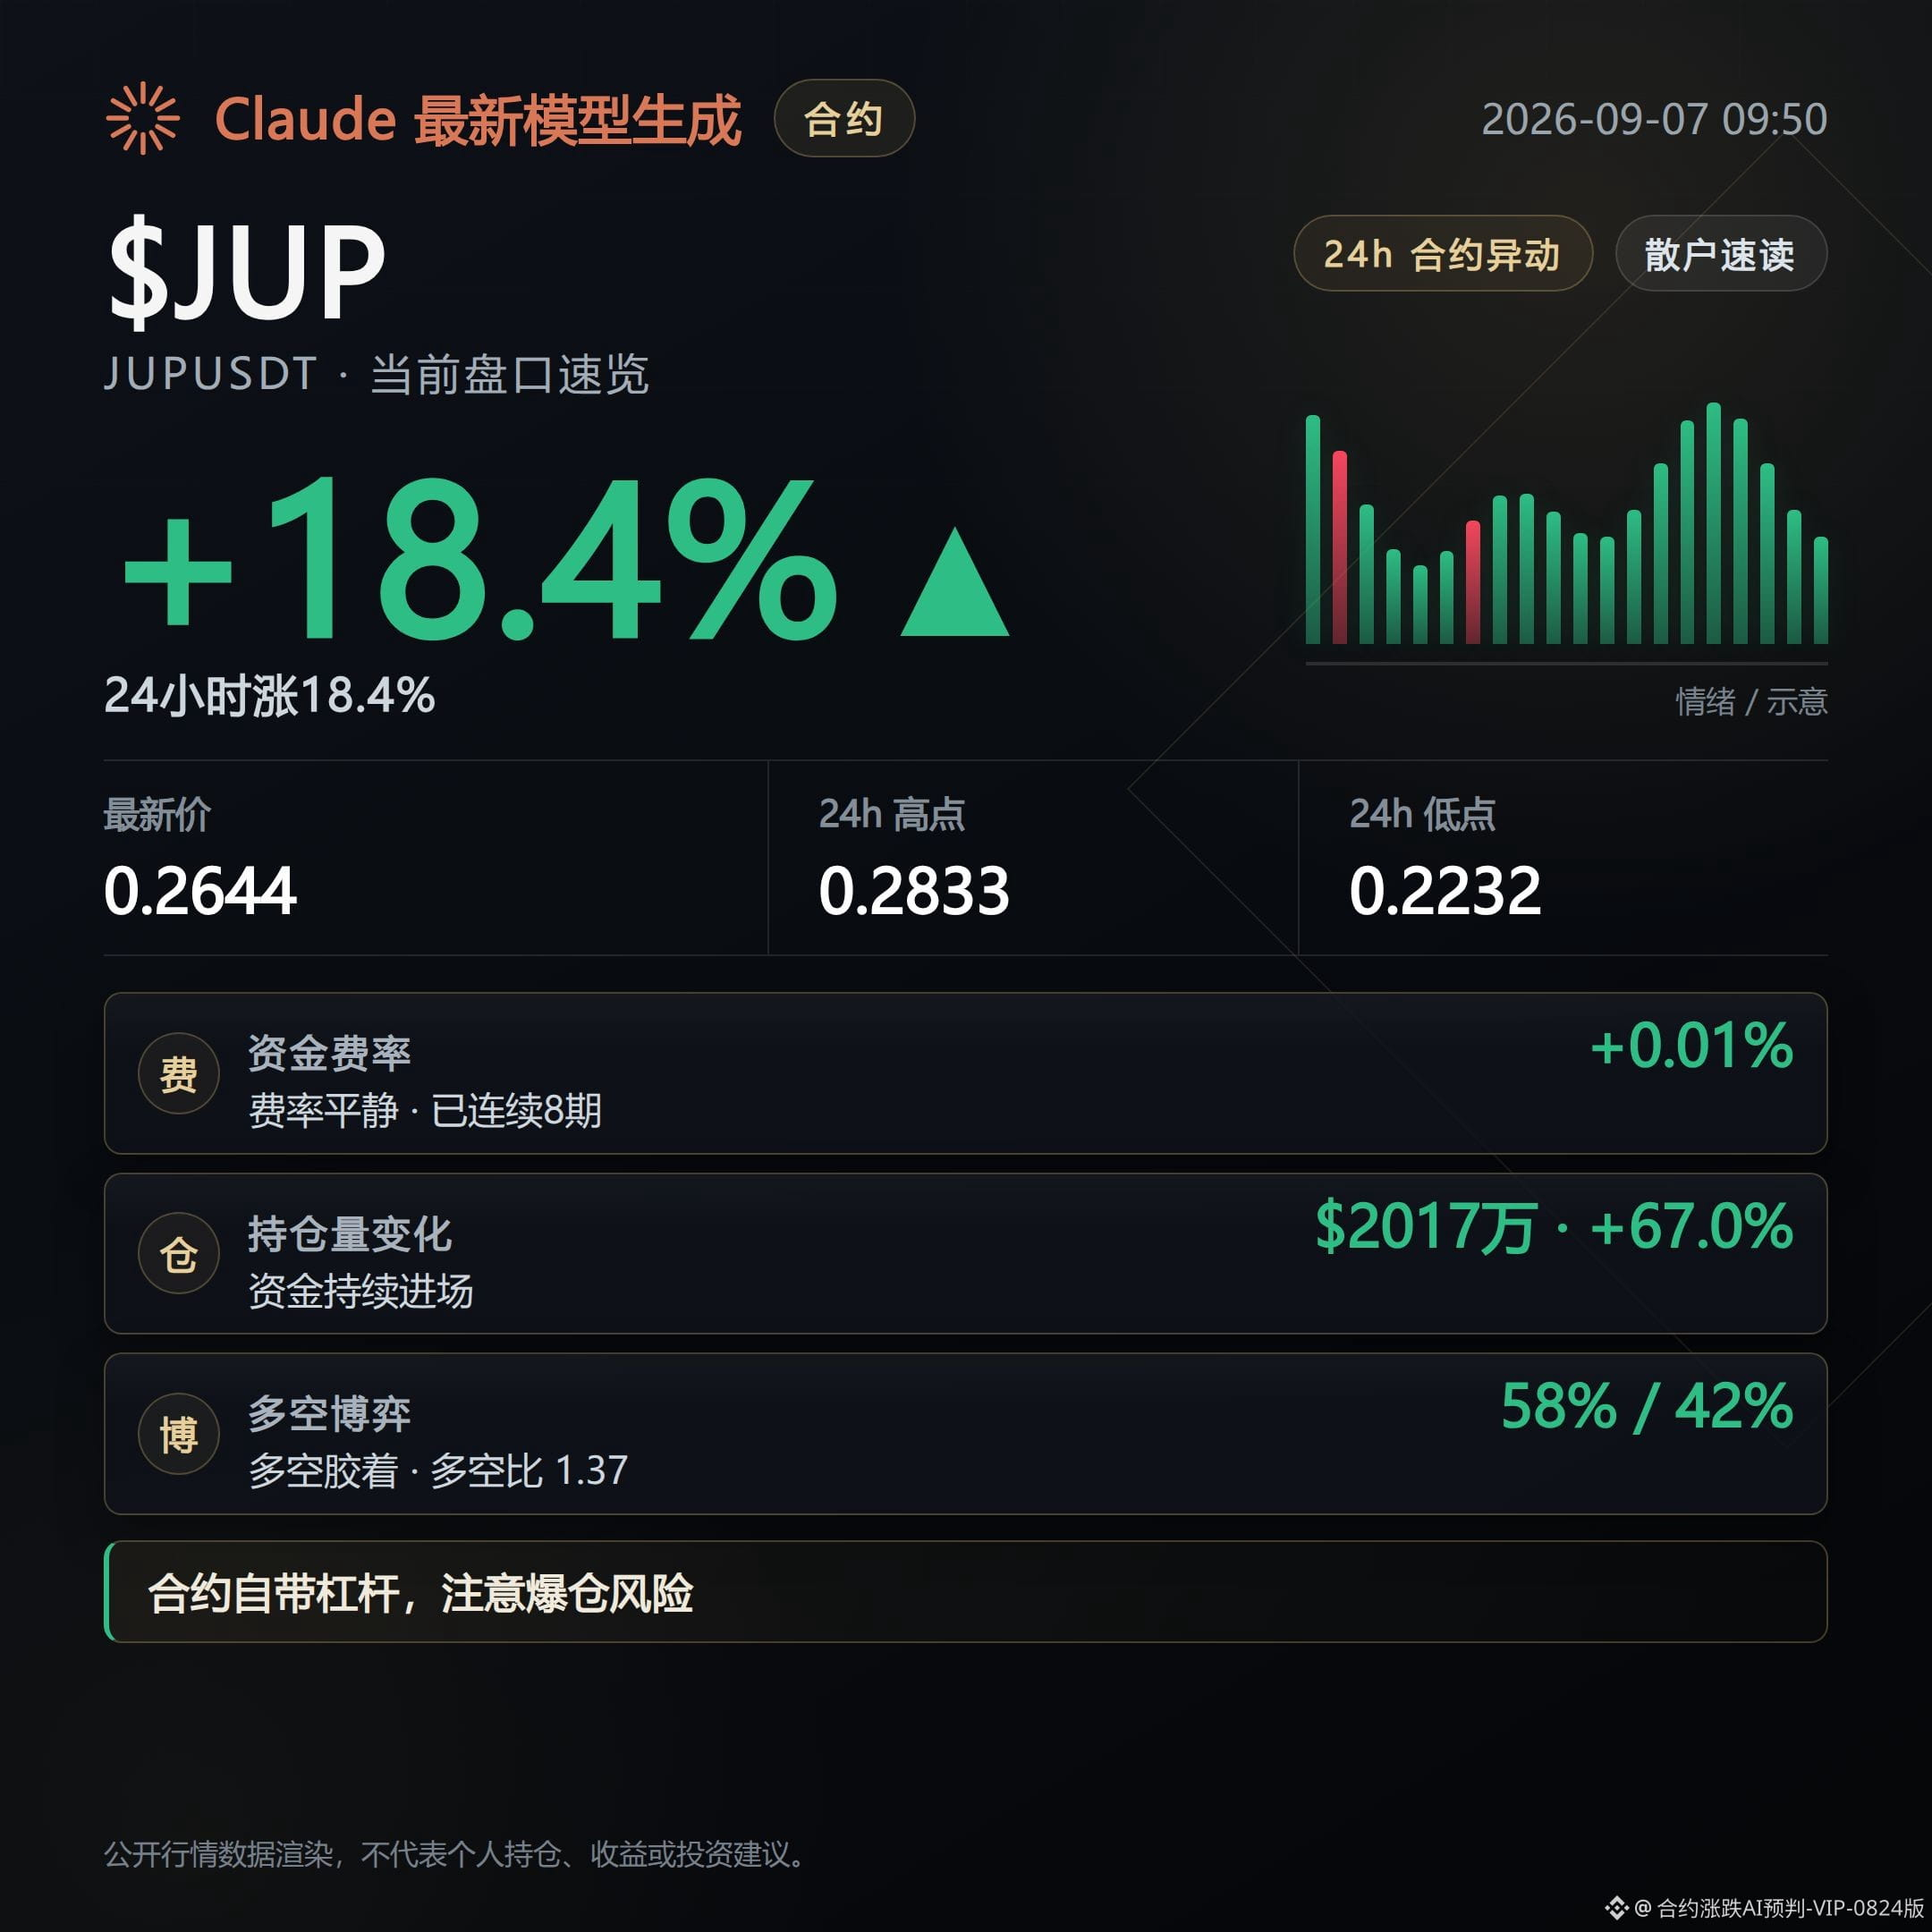
JUPUSDT is currently priced at 0.2644, up 18.41% over 24 hours, with trading volume at 129 million USD, and 24-hour open interest up 67.0%. Funding rates have been paid by longs for 8 consecutive intervals, the supertrend indicator shows an upward trend, and active buys account for 0.79 of the order-book activity. The chips are accumulating. This means that while price is moving with the trend, incremental positions are also following in, but note that 1-hour open interest has already turned down by 4.1%, indicating that the short-term pace of position growth is slowing.
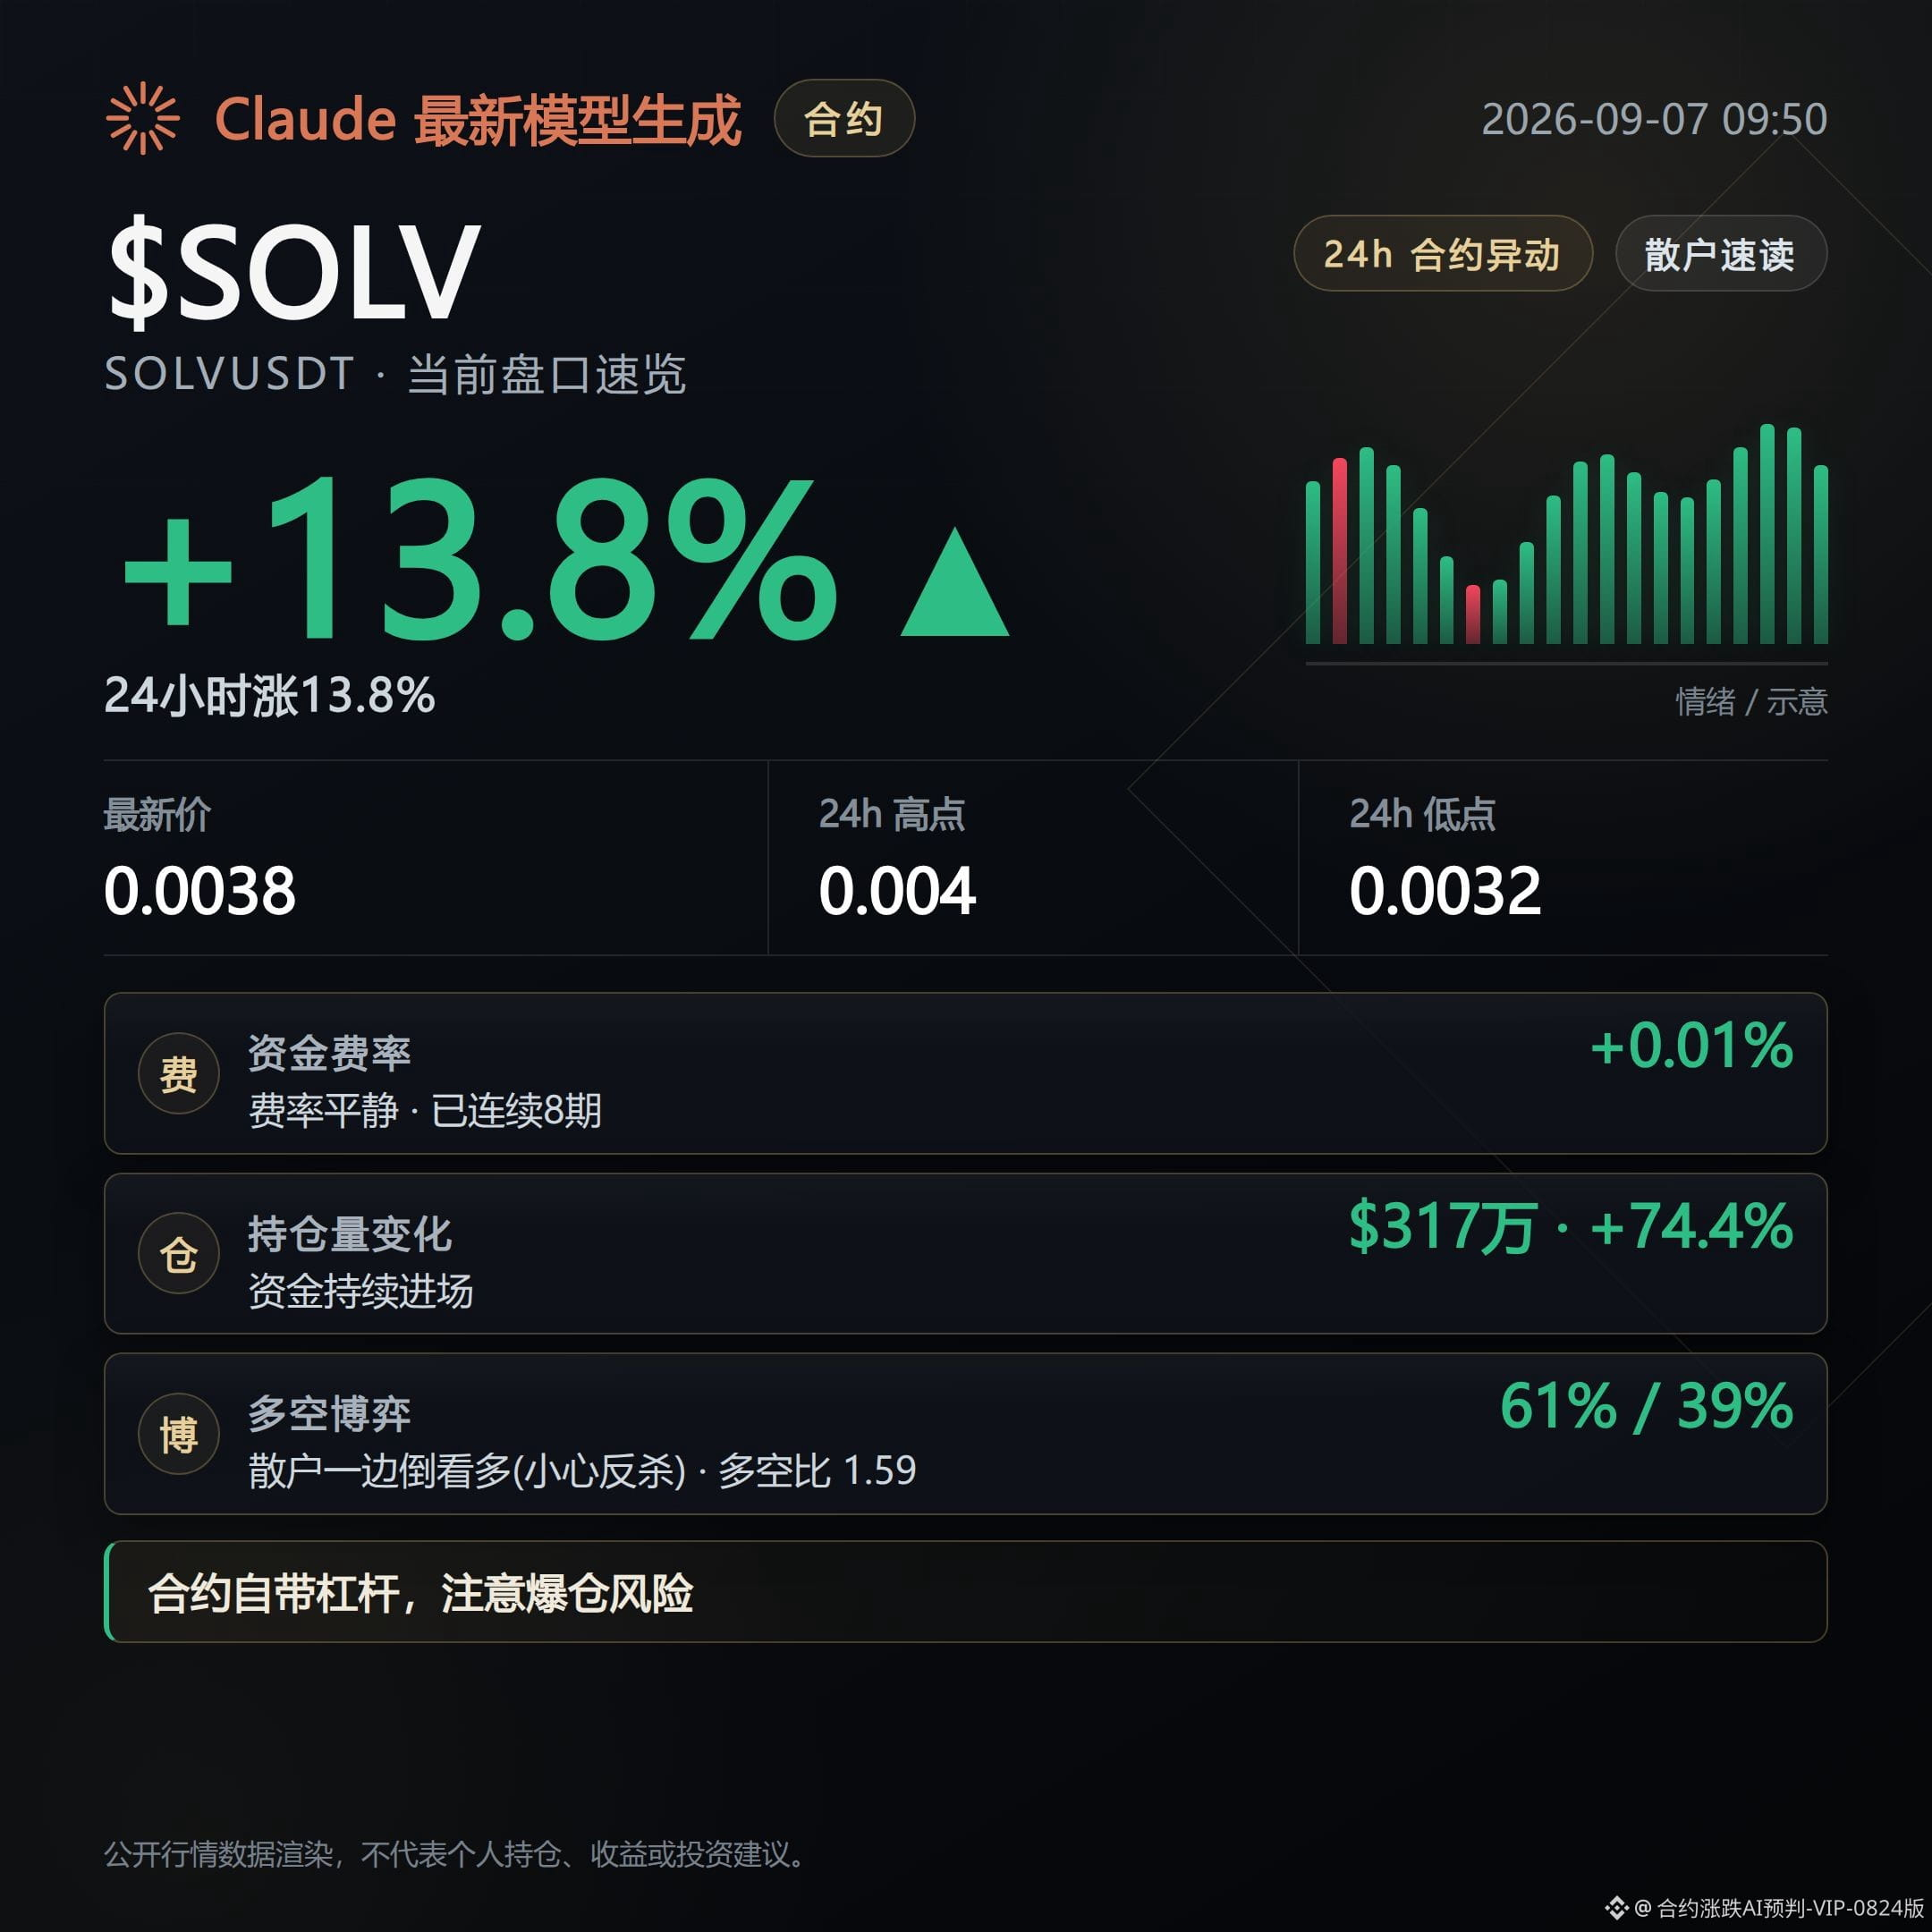
SOLVUSDT is currently priced at 0.003761, up 13.76% over 24 hours, with 24-hour open interest up 74.4%, the highest among the three coins. Funding rates have also been paid by longs for 8 consecutive intervals, and the premium rate is relatively high at 0.0359%. The chips are accumulating. The counterpoint is that the buy-sell ratio is 0.74, with active sells actually dominating, which is not fully aligned with the simultaneous upward movement in price and open interest. This point needs separate attention.
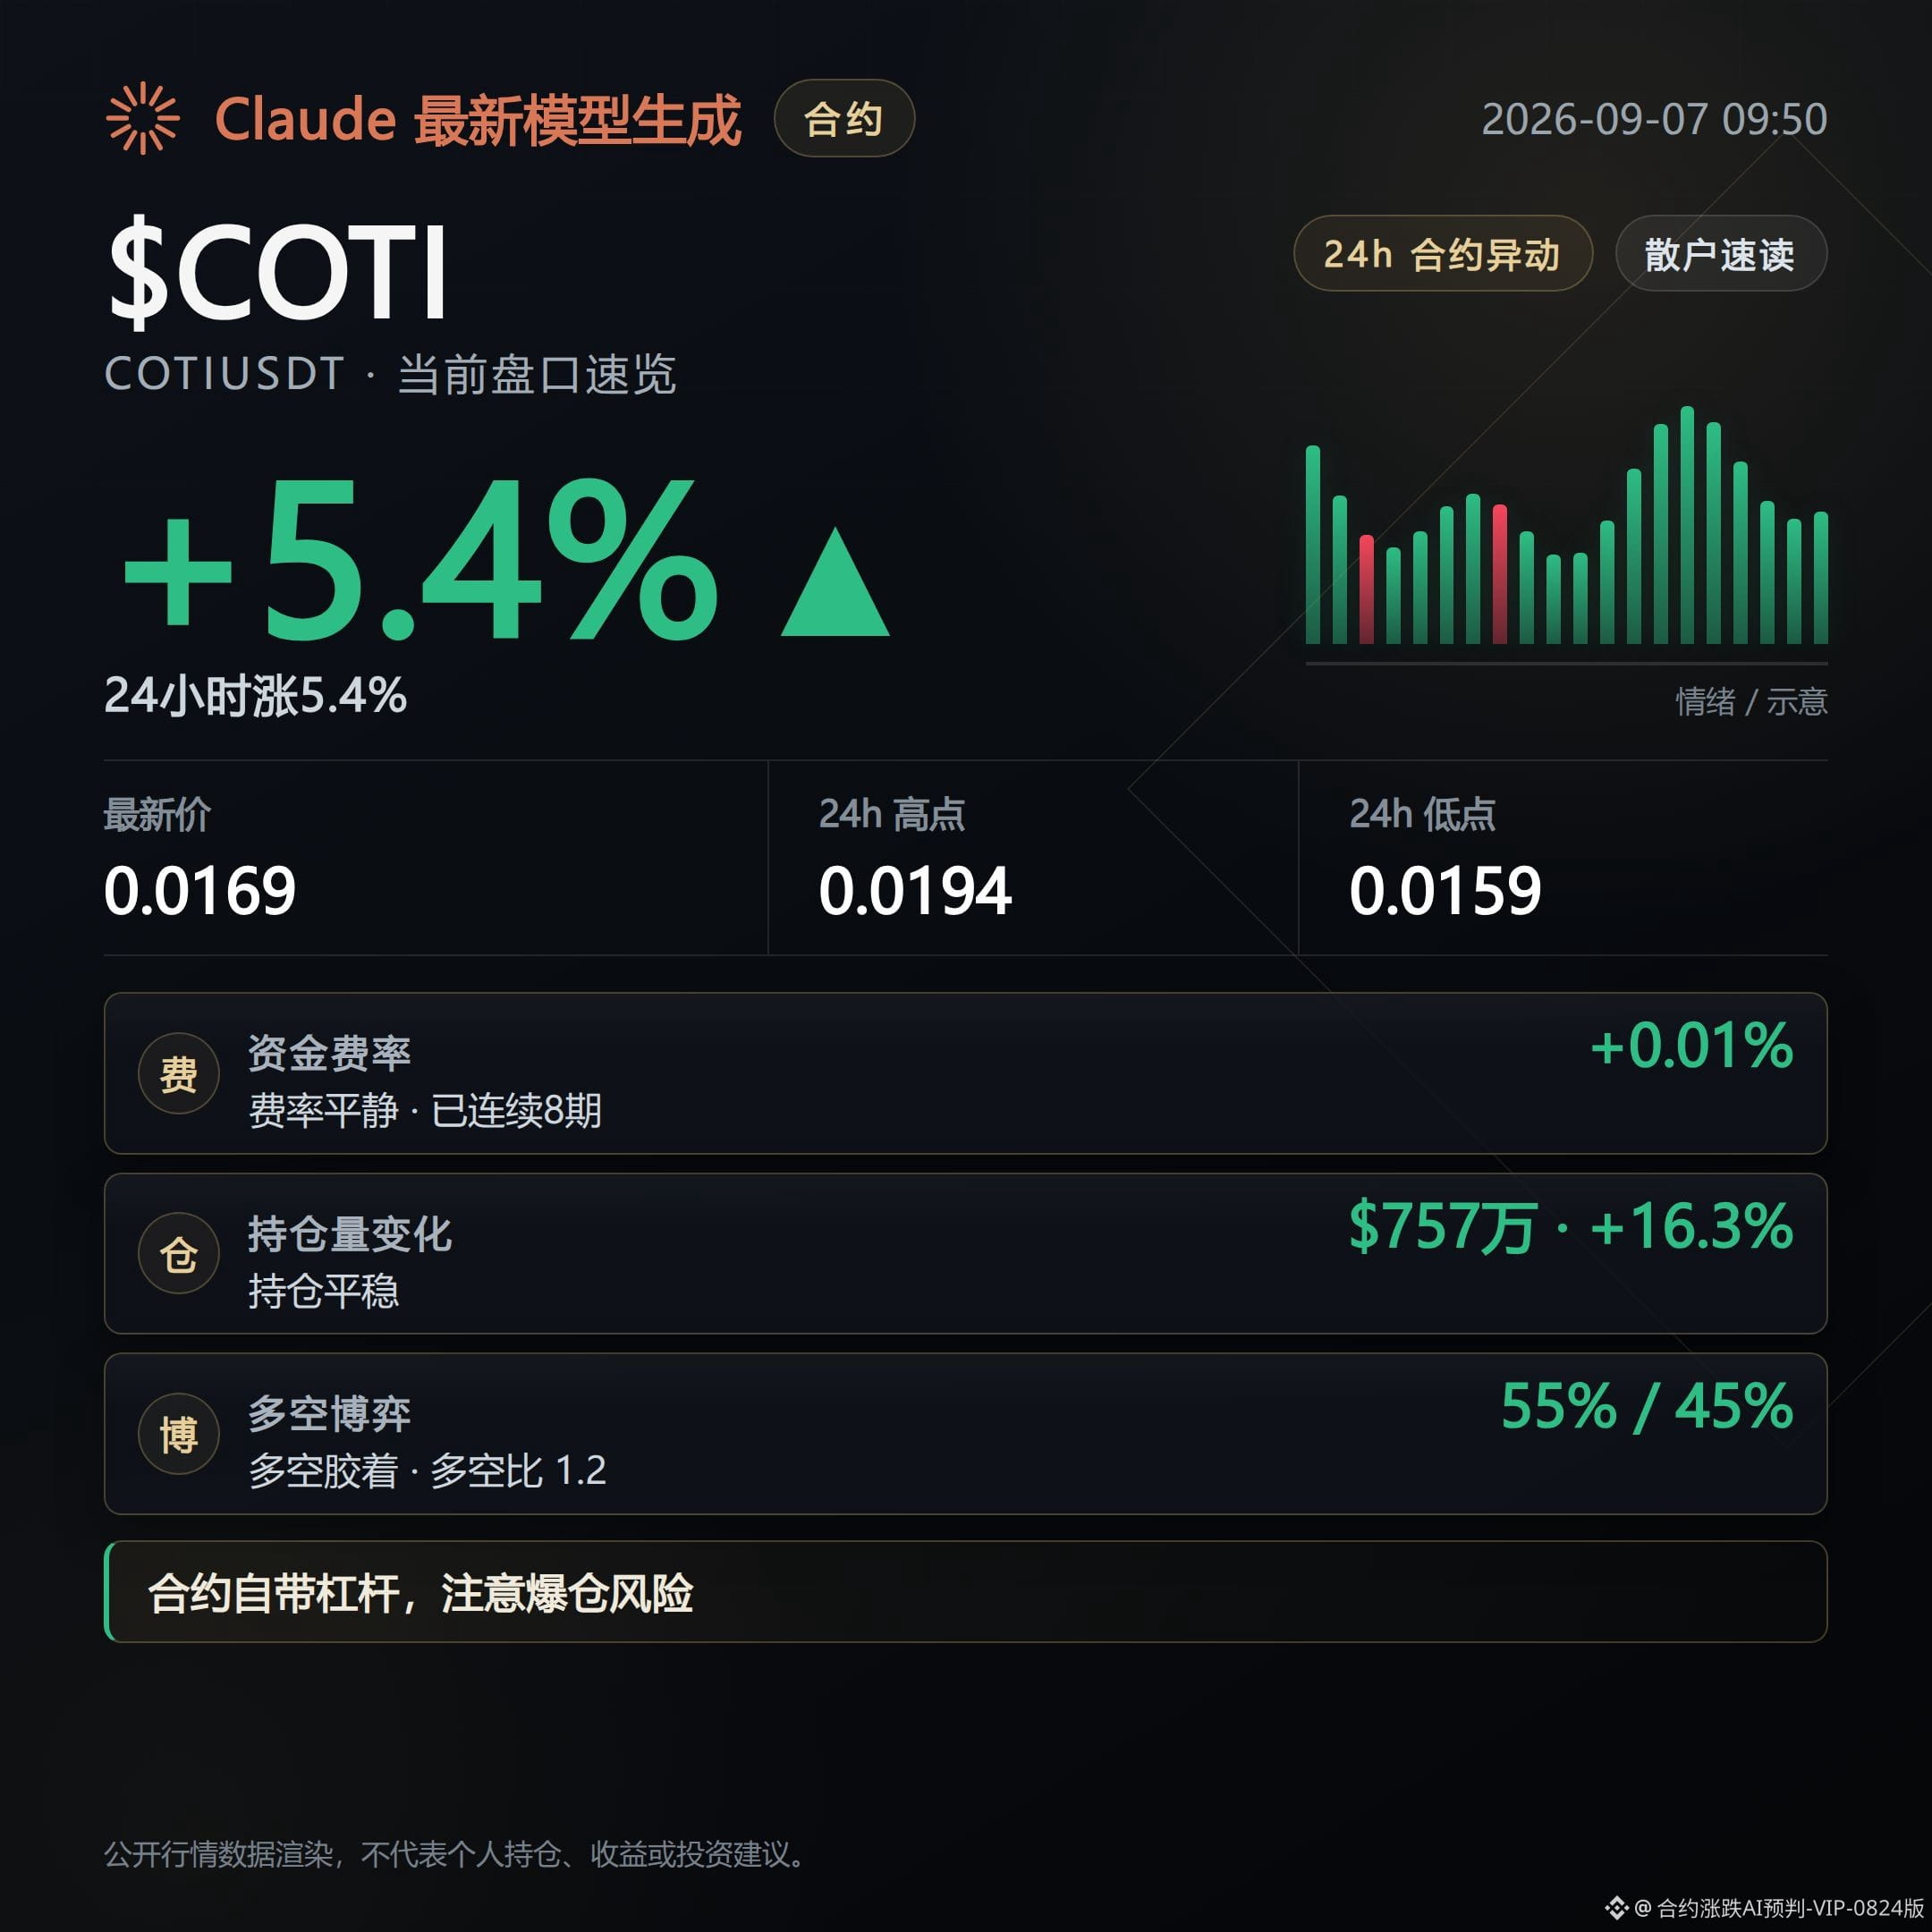
COTIUSDT is currently priced at 0.016881, up 5.43% over 24 hours, with trading volume at 86.5 million USD and 24-hour open interest up 16.3%. The buy-sell ratio is 1.16, led by active buying, while funding rates have had shorts paying for 8 consecutive intervals and the premium rate is negative 0.1472%, indicating that the spot side is relatively strong while the futures side has not fully caught up. The chips are accumulating. Under this structure, the upside is the smallest among the three coins, and the momentum is relatively weak.
If these three coins continue to strengthen in price while open interest growth and the share of active buying remain in sync, this move can continue. If open interest growth turns down like JUPUSDT did, or if the buy-sell ratio keeps being pressured by active selling like SOLVUSDT, then this direction needs to be re-evaluated.
#JUP #SOLV #COTI
Position note: This account currently holds a live long position of $FOGO , disclosed to keep the content consistent with actual trading.
Compiled with assistance from Claude Fable 5; contract data is for informational reference only. Please verify independently.
For the three contracts JUPUSDT, SOLVUSDT, and COTIUSDT, prices have all been moving upward over the past 24 hours, and open interest has also been rising in sync. The signal I see in the market is positions flowing in together with price, rather than a one-legged price pump with positions failing to follow.
Next, I’m watching whether each of these three coins can continue to confirm their respective signals.
JUPUSDT is currently priced at 0.2644, up 18.41% over 24 hours, with trading volume at 129 million USD, and 24-hour open interest up 67.0%. Funding rates have been paid by longs for 8 consecutive intervals, the supertrend indicator shows an upward trend, and active buys account for 0.79 of the order-book activity. The chips are accumulating. This means that while price is moving with the trend, incremental positions are also following in, but note that 1-hour open interest has already turned down by 4.1%, indicating that the short-term pace of position growth is slowing.
SOLVUSDT is currently priced at 0.003761, up 13.76% over 24 hours, with 24-hour open interest up 74.4%, the highest among the three coins. Funding rates have also been paid by longs for 8 consecutive intervals, and the premium rate is relatively high at 0.0359%. The chips are accumulating. The counterpoint is that the buy-sell ratio is 0.74, with active sells actually dominating, which is not fully aligned with the simultaneous upward movement in price and open interest. This point needs separate attention.
COTIUSDT is currently priced at 0.016881, up 5.43% over 24 hours, with trading volume at 86.5 million USD and 24-hour open interest up 16.3%. The buy-sell ratio is 1.16, led by active buying, while funding rates have had shorts paying for 8 consecutive intervals and the premium rate is negative 0.1472%, indicating that the spot side is relatively strong while the futures side has not fully caught up. The chips are accumulating. Under this structure, the upside is the smallest among the three coins, and the momentum is relatively weak.
If these three coins continue to strengthen in price while open interest growth and the share of active buying remain in sync, this move can continue. If open interest growth turns down like JUPUSDT did, or if the buy-sell ratio keeps being pressured by active selling like SOLVUSDT, then this direction needs to be re-evaluated.
#JUP #SOLV #COTI
Position note: This account currently holds a live long position of $FOGO , disclosed to keep the content consistent with actual trading.
Compiled with assistance from Claude Fable 5; contract data is for informational reference only. Please verify independently.
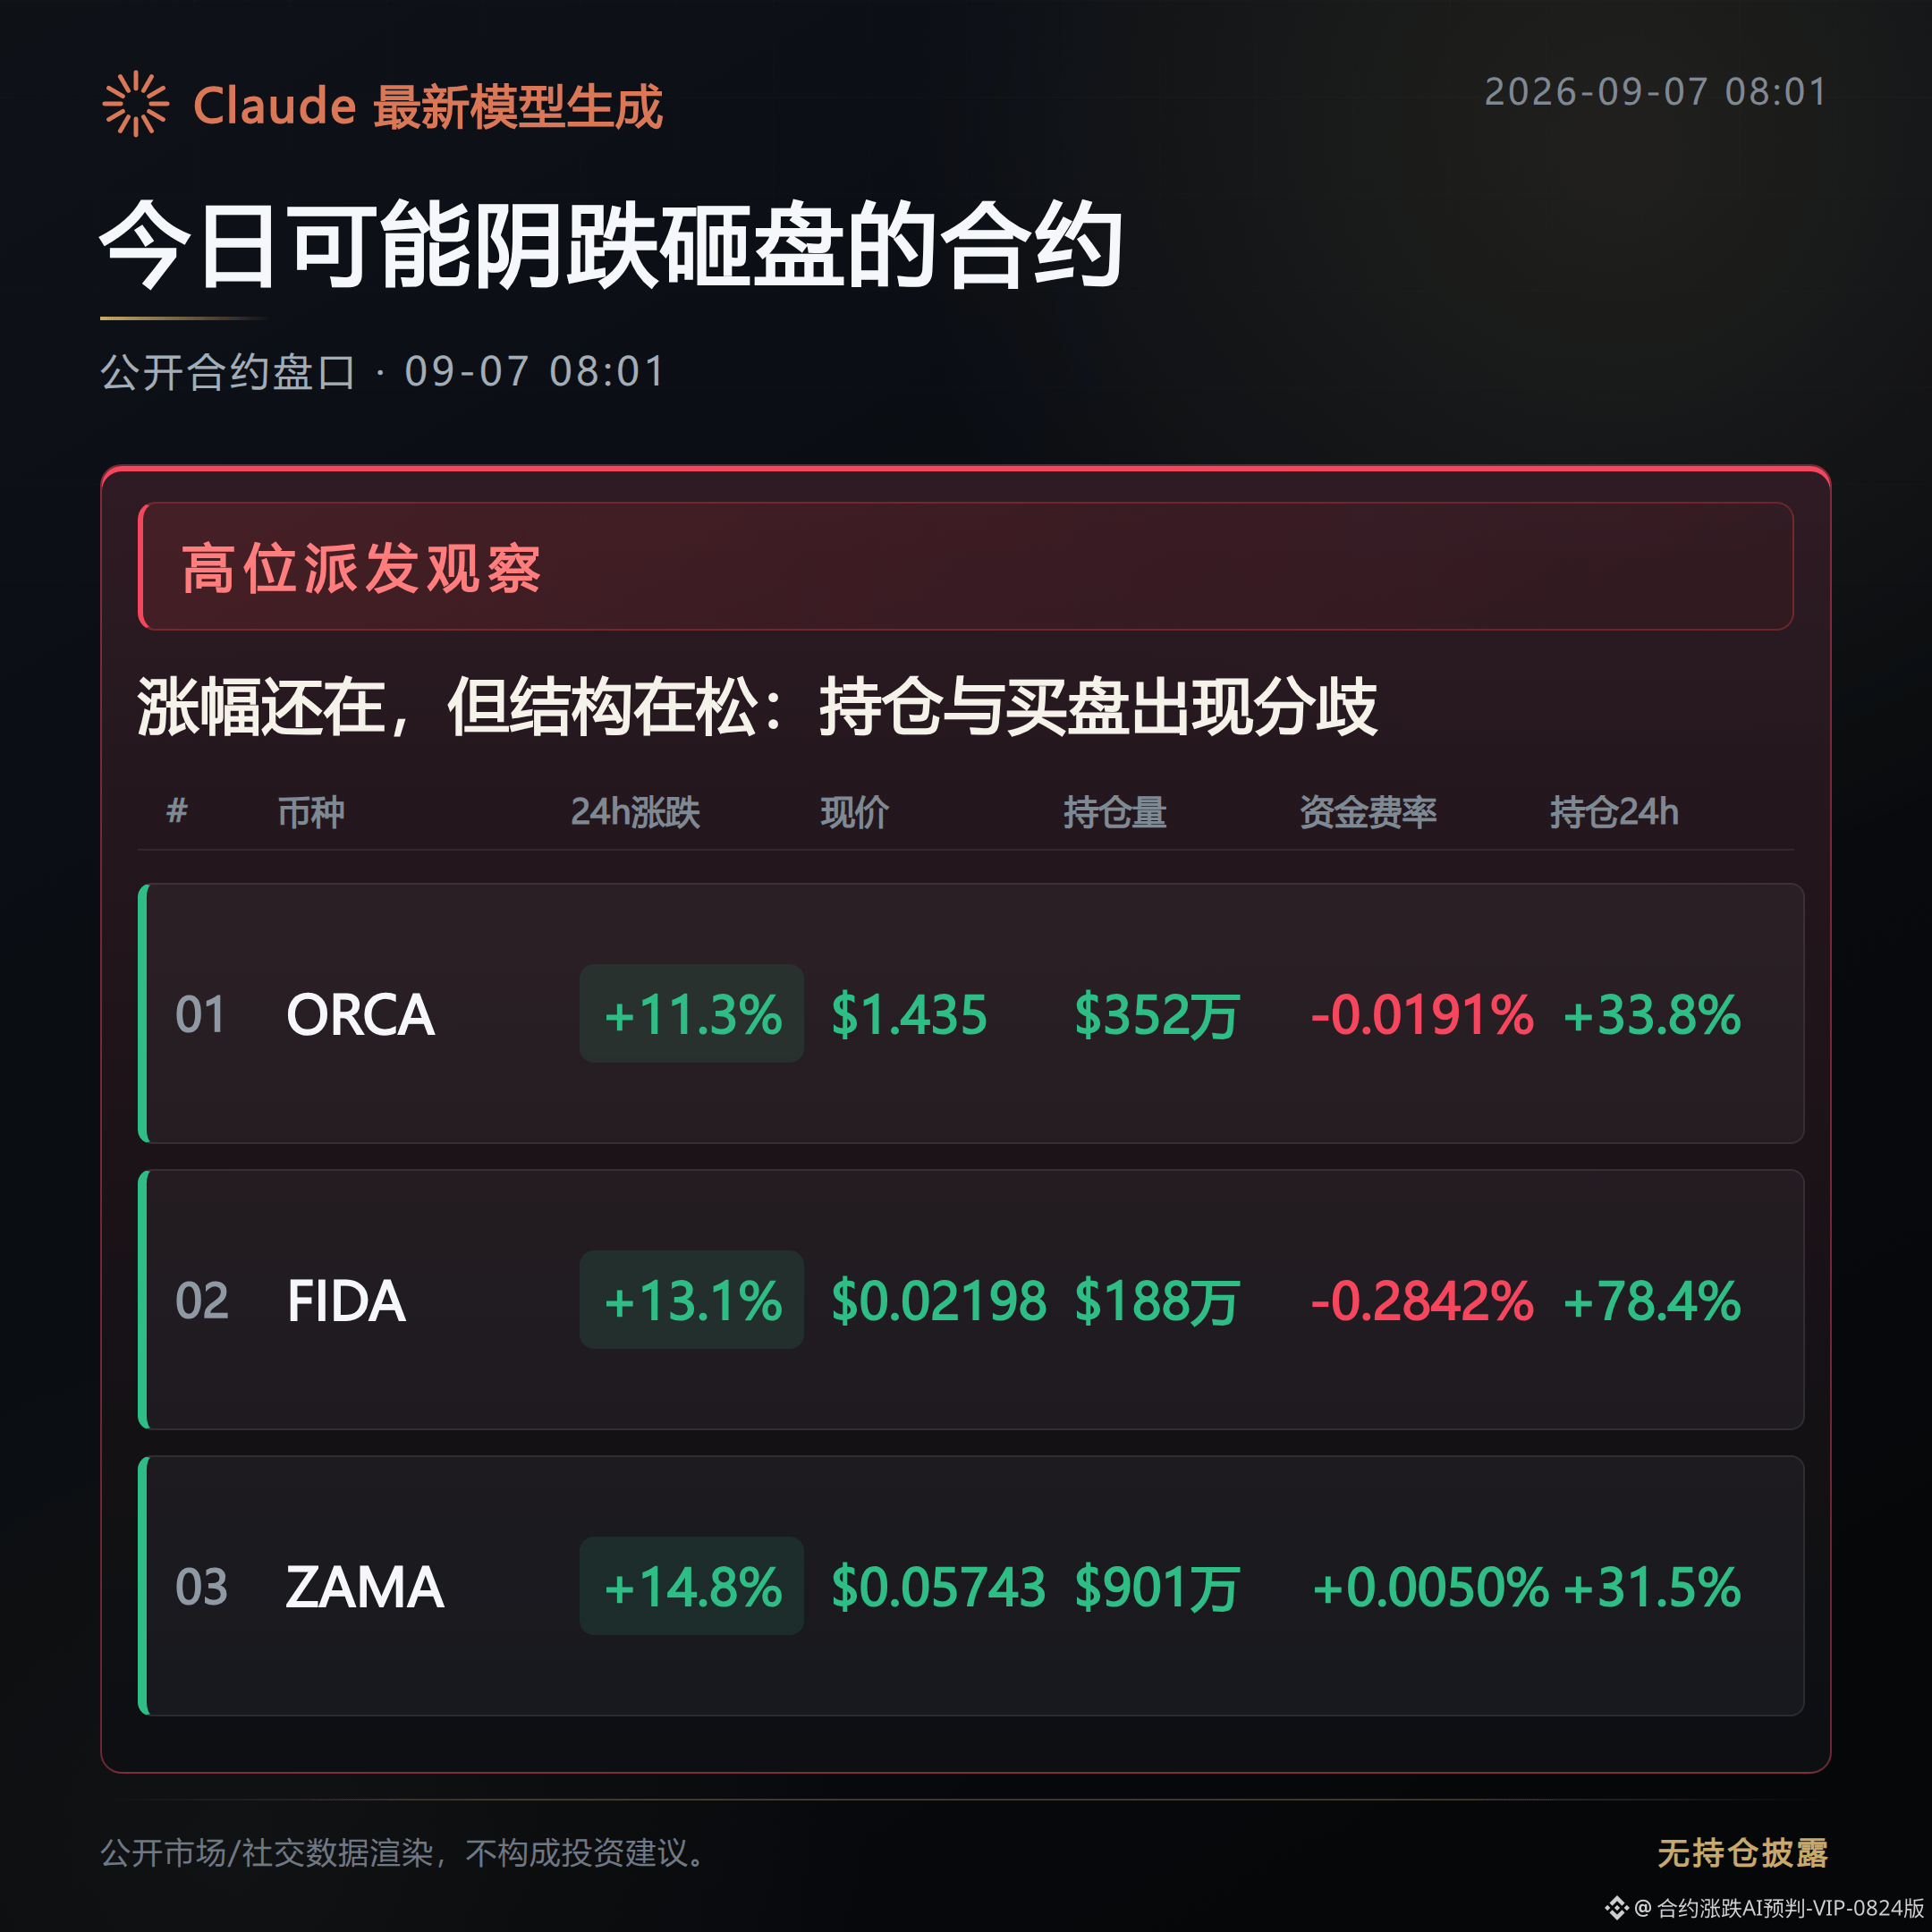
Contracts that may drift lower and be sold off today
Bearish signals have already started to emerge, and these few coins are showing a bias toward a slow, grinding pullback.
Prices are still up, but the structure has loosened. Don’t just look at the green percentage gains; chasing highs is easily punished by both rebounds and pullbacks.
What’s scary isn’t that price isn’t rising, but that as it rises, support keeps thinning. From here on, watch whether the pullback really develops and whether support is getting thinner and thinner.
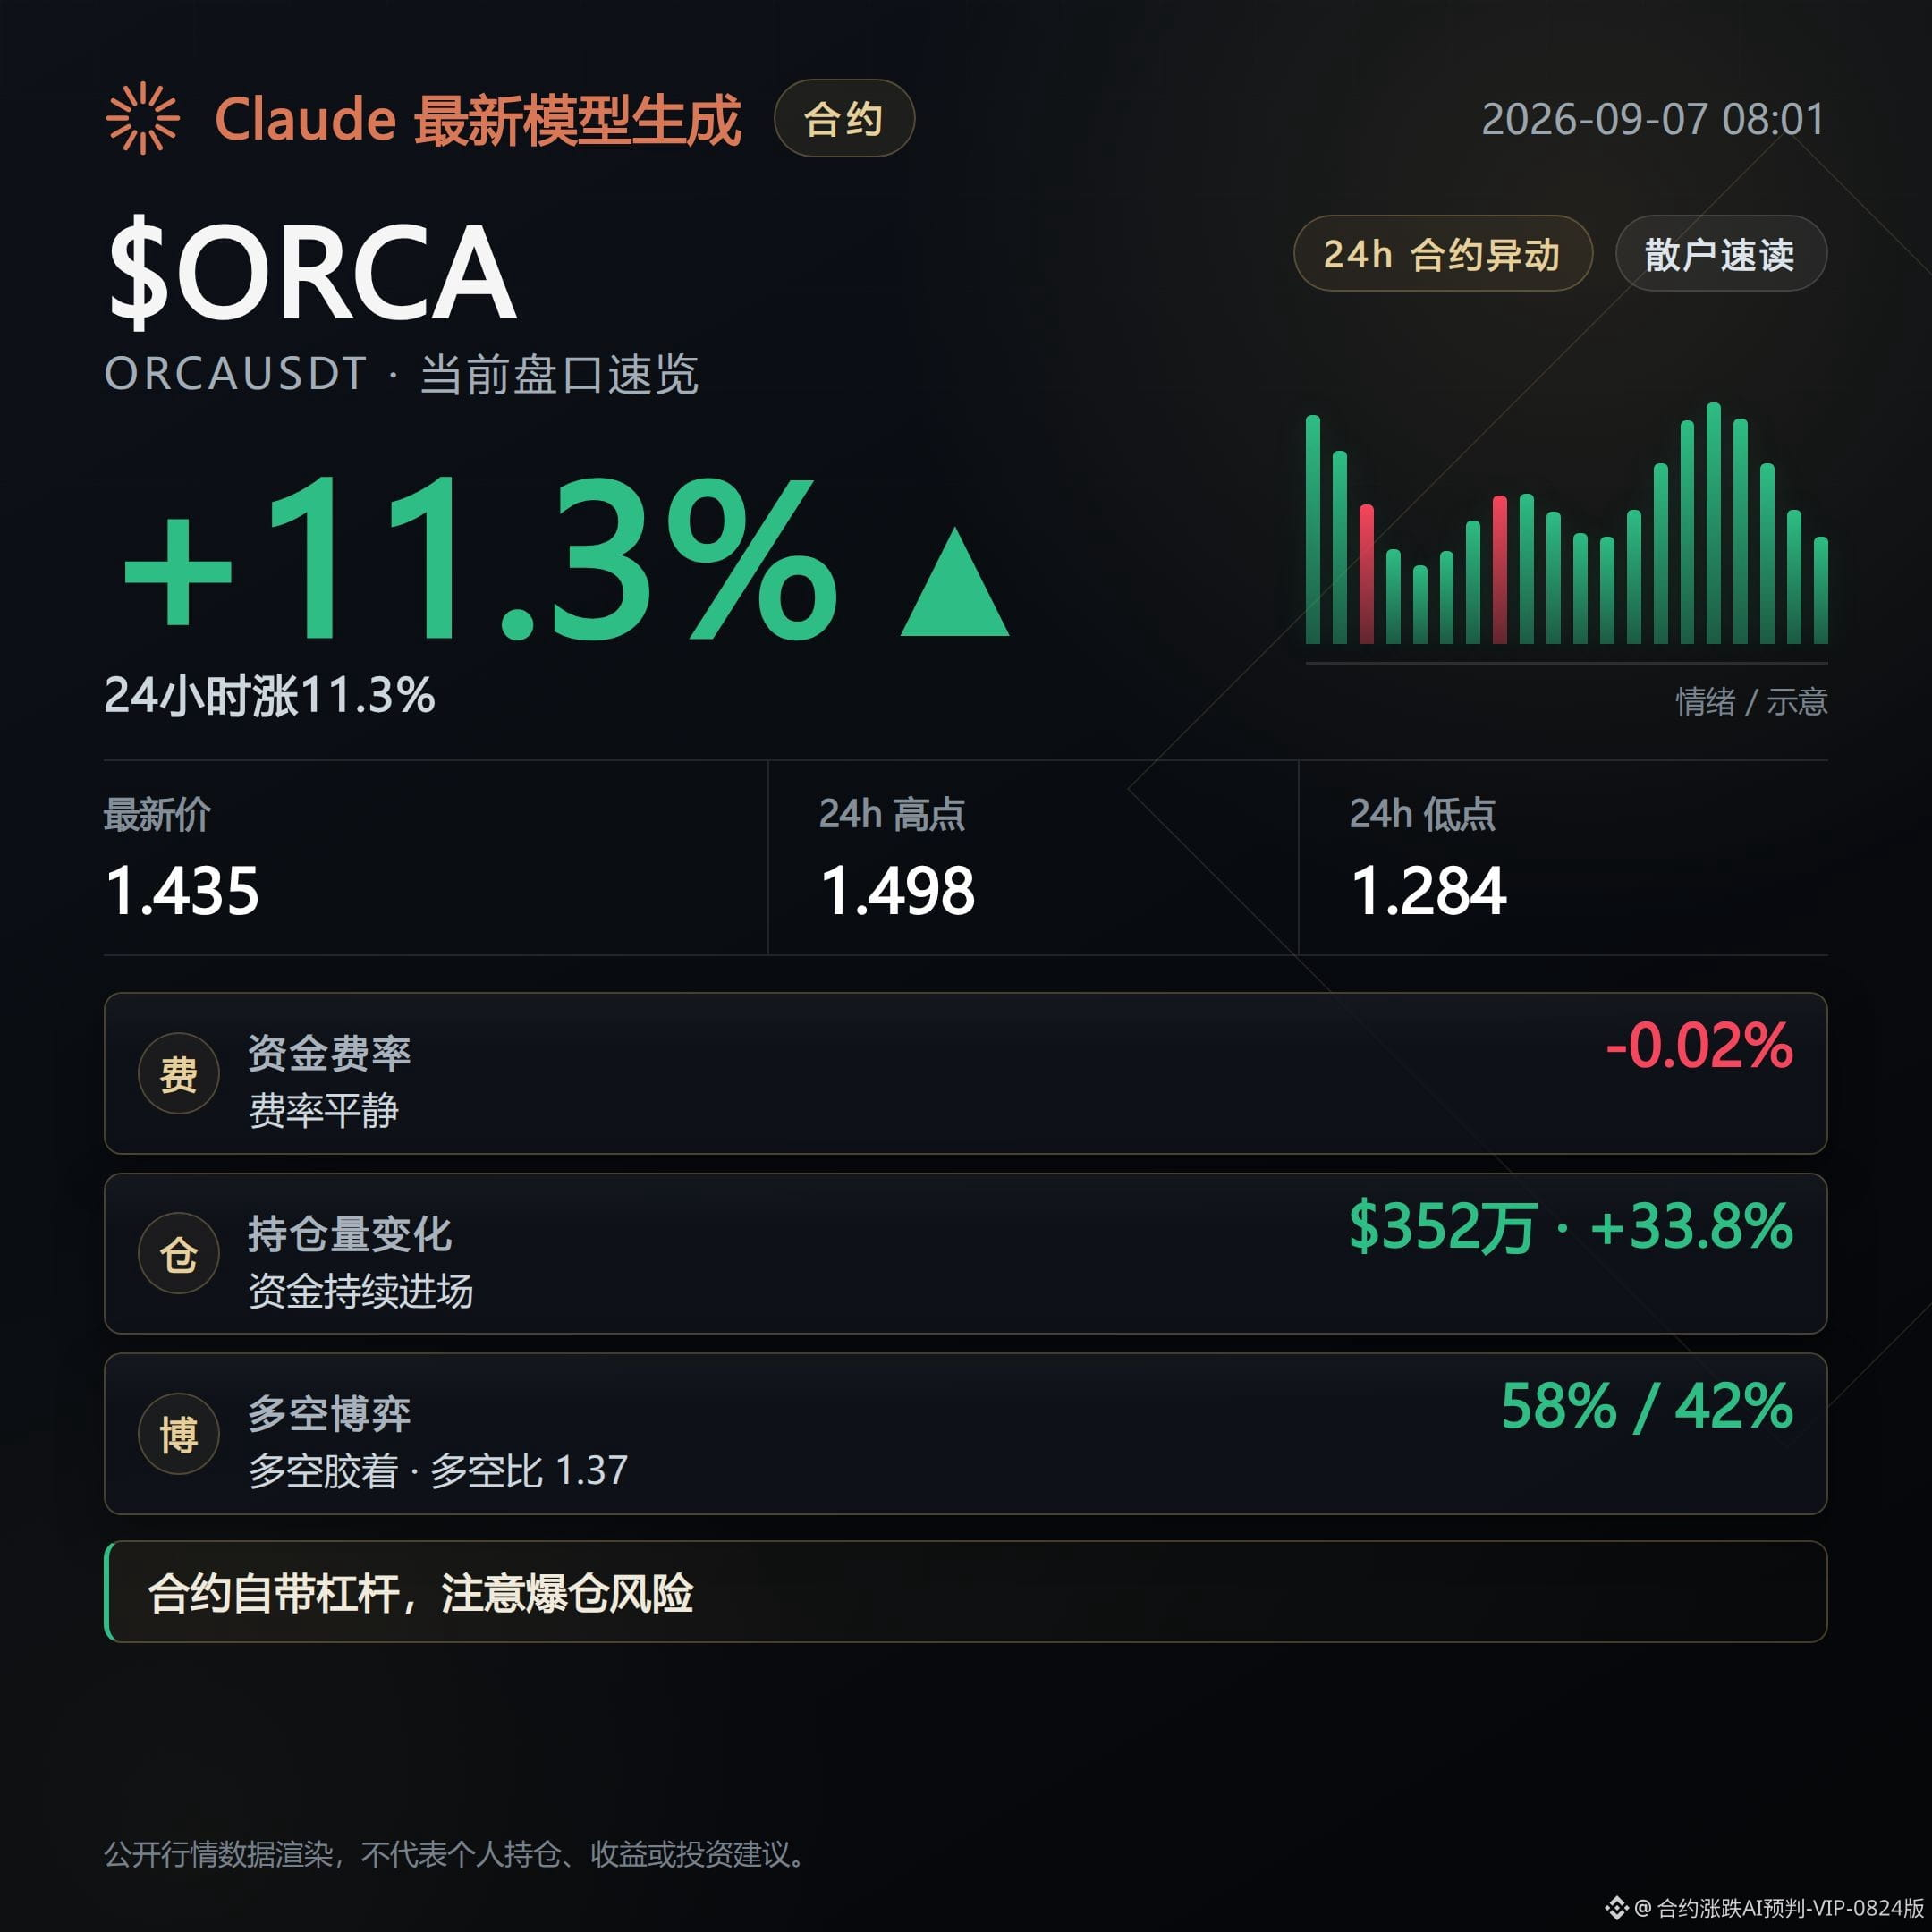
ORCA is currently at 1.435, up 11.33% in 24 hours, but the funding rate is -0.0191%. Shorts have paid for three straight periods, while open interest surged 33.8% in 24 hours to $35.22 million.
What does this mean? The gain is positive, but the funding rate is negative, which means longs failed to squeeze shorts out. Instead, open interest poured in aggressively at this level, and positions are dispersing.
The counterpoint is that RSI is 62, still in neutral territory, and the trendline is still upward, so the market structure hasn’t completely flipped yet.
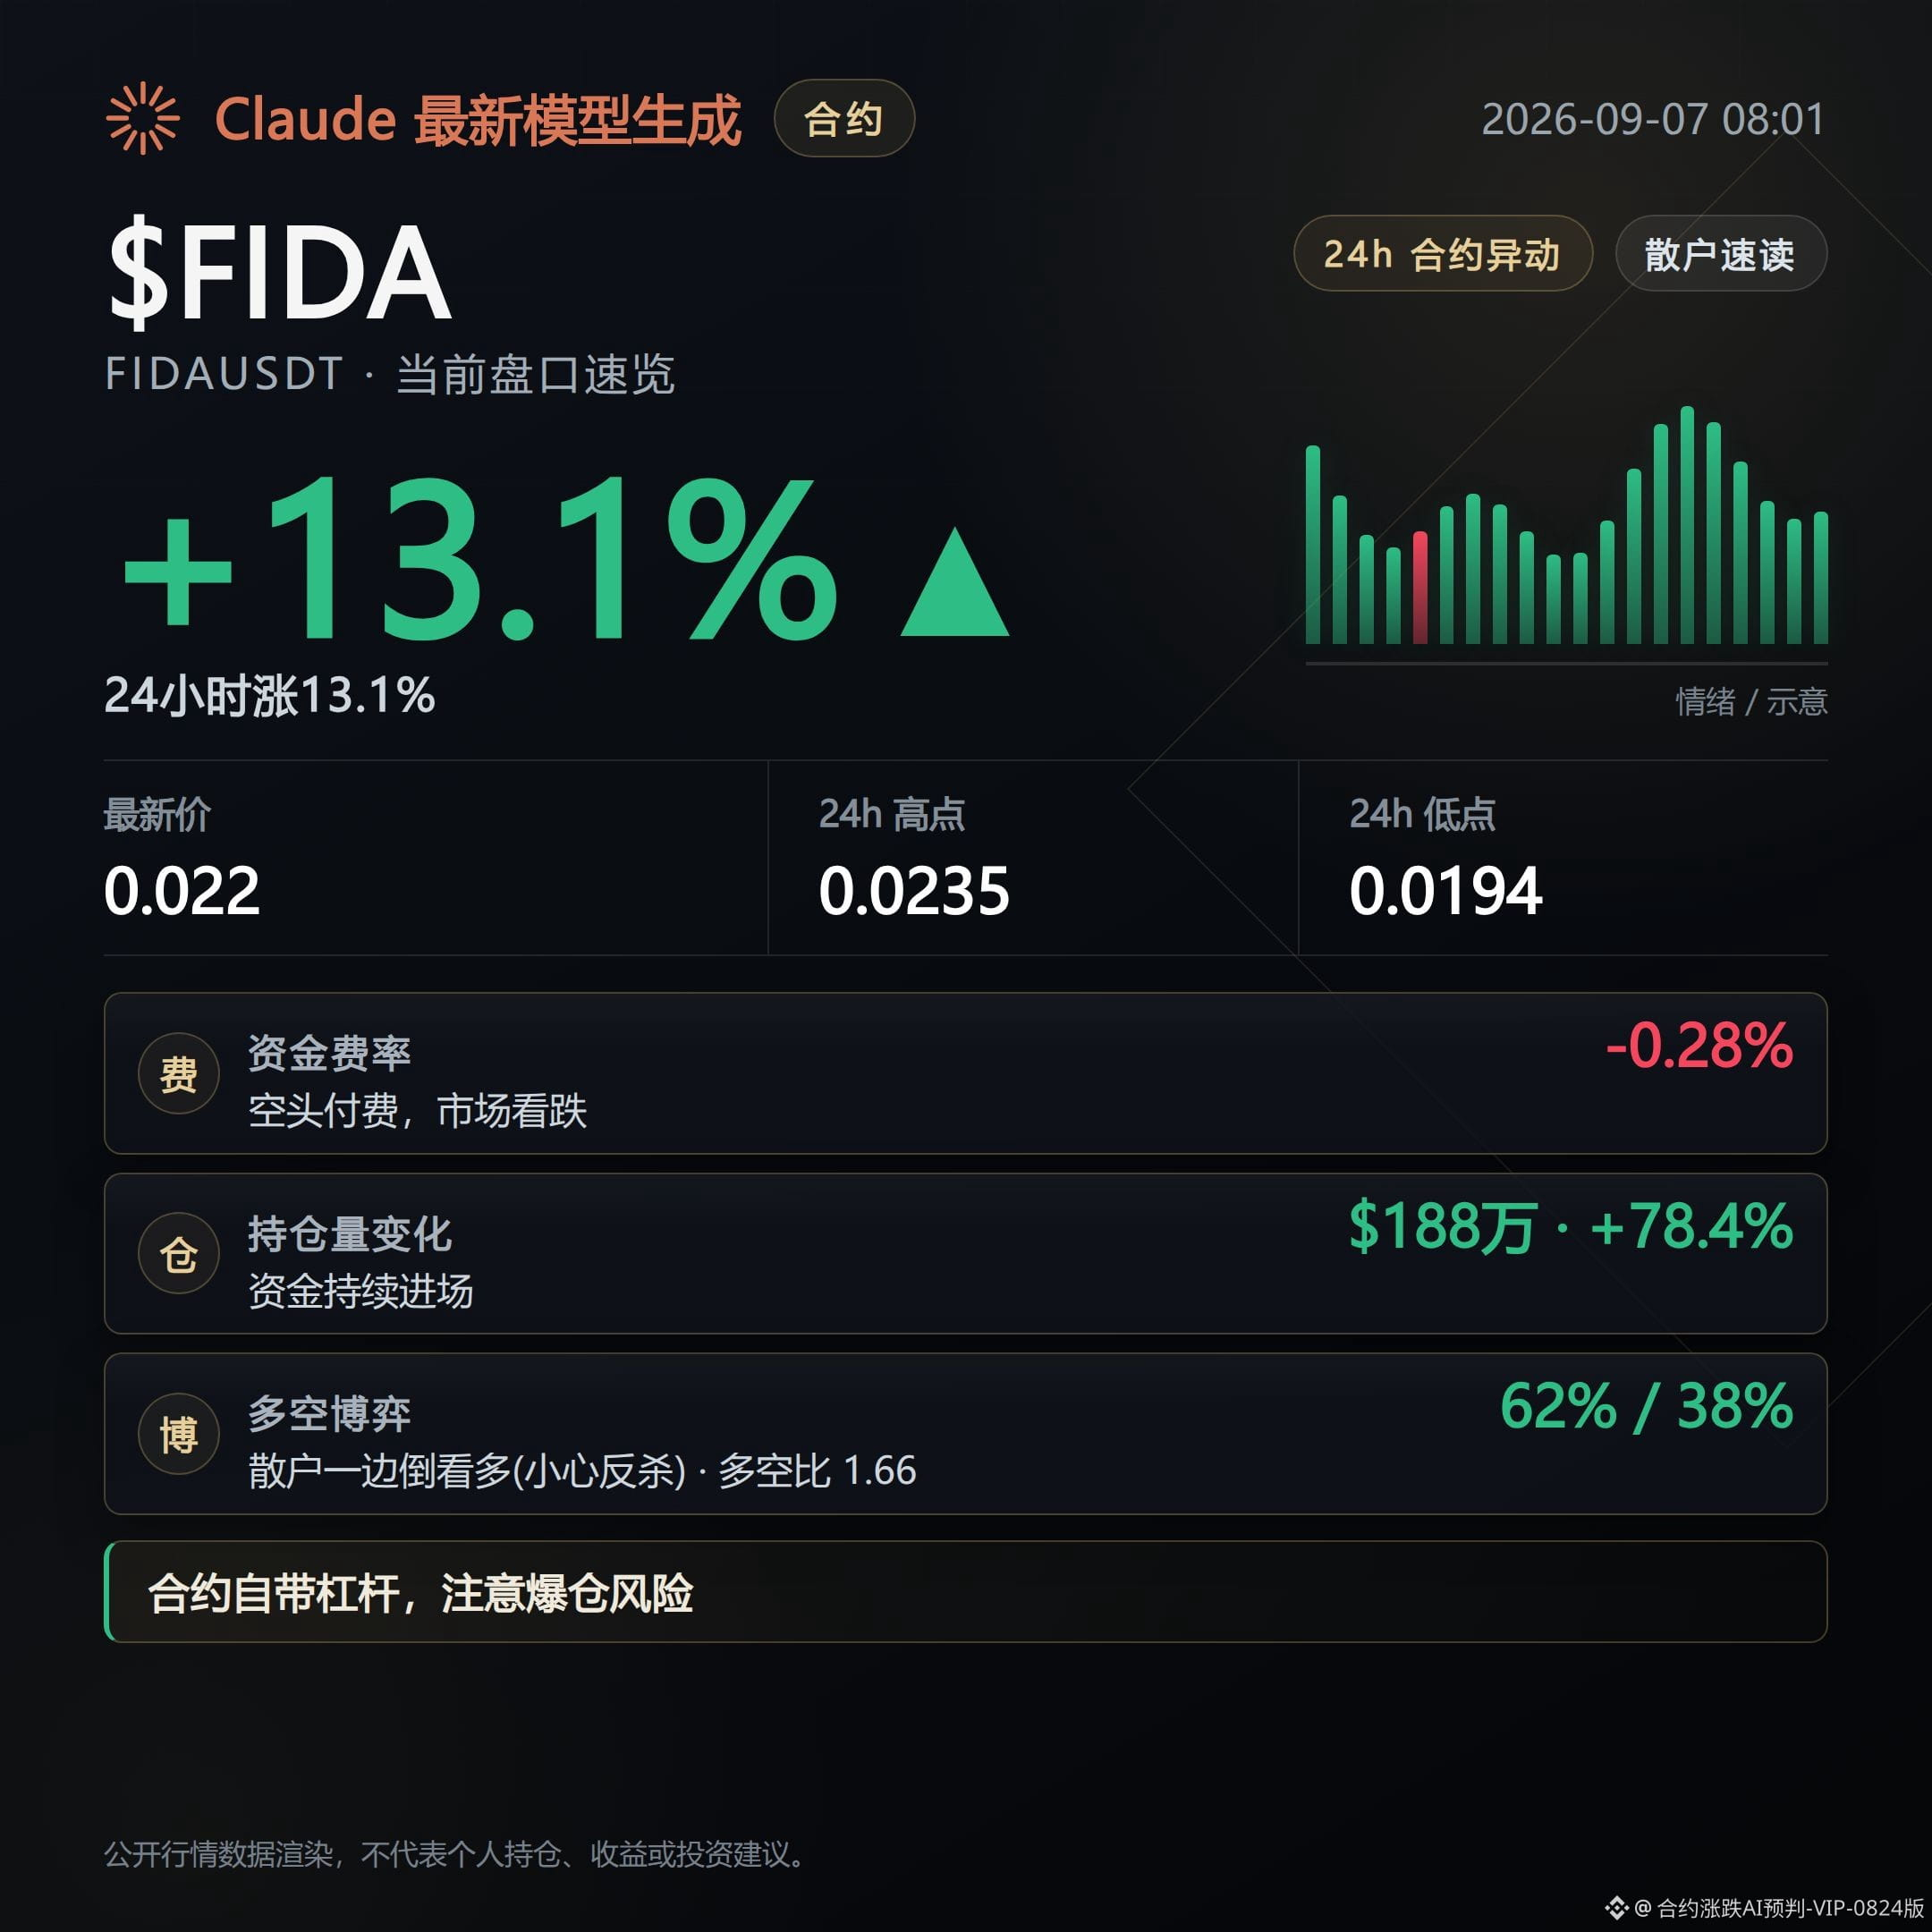
FIDA is currently at 0.02198, up 13.12% in 24 hours, with open interest surging 78.4% in 24 hours to $18.8 million. Funding has paid shorts for one straight period, and the order book is flagged as possibly a short squeeze.
What does this mean? Capital is flowing in faster than price is rising. Once the squeeze ends, these positions are the easiest fuel for a pullback, and the chips are dispersing.
The counterpoint is that the active buy ratio is 0.79, so buying power is not especially strong, which suggests volume has not yet reached the level of concentrated distribution.
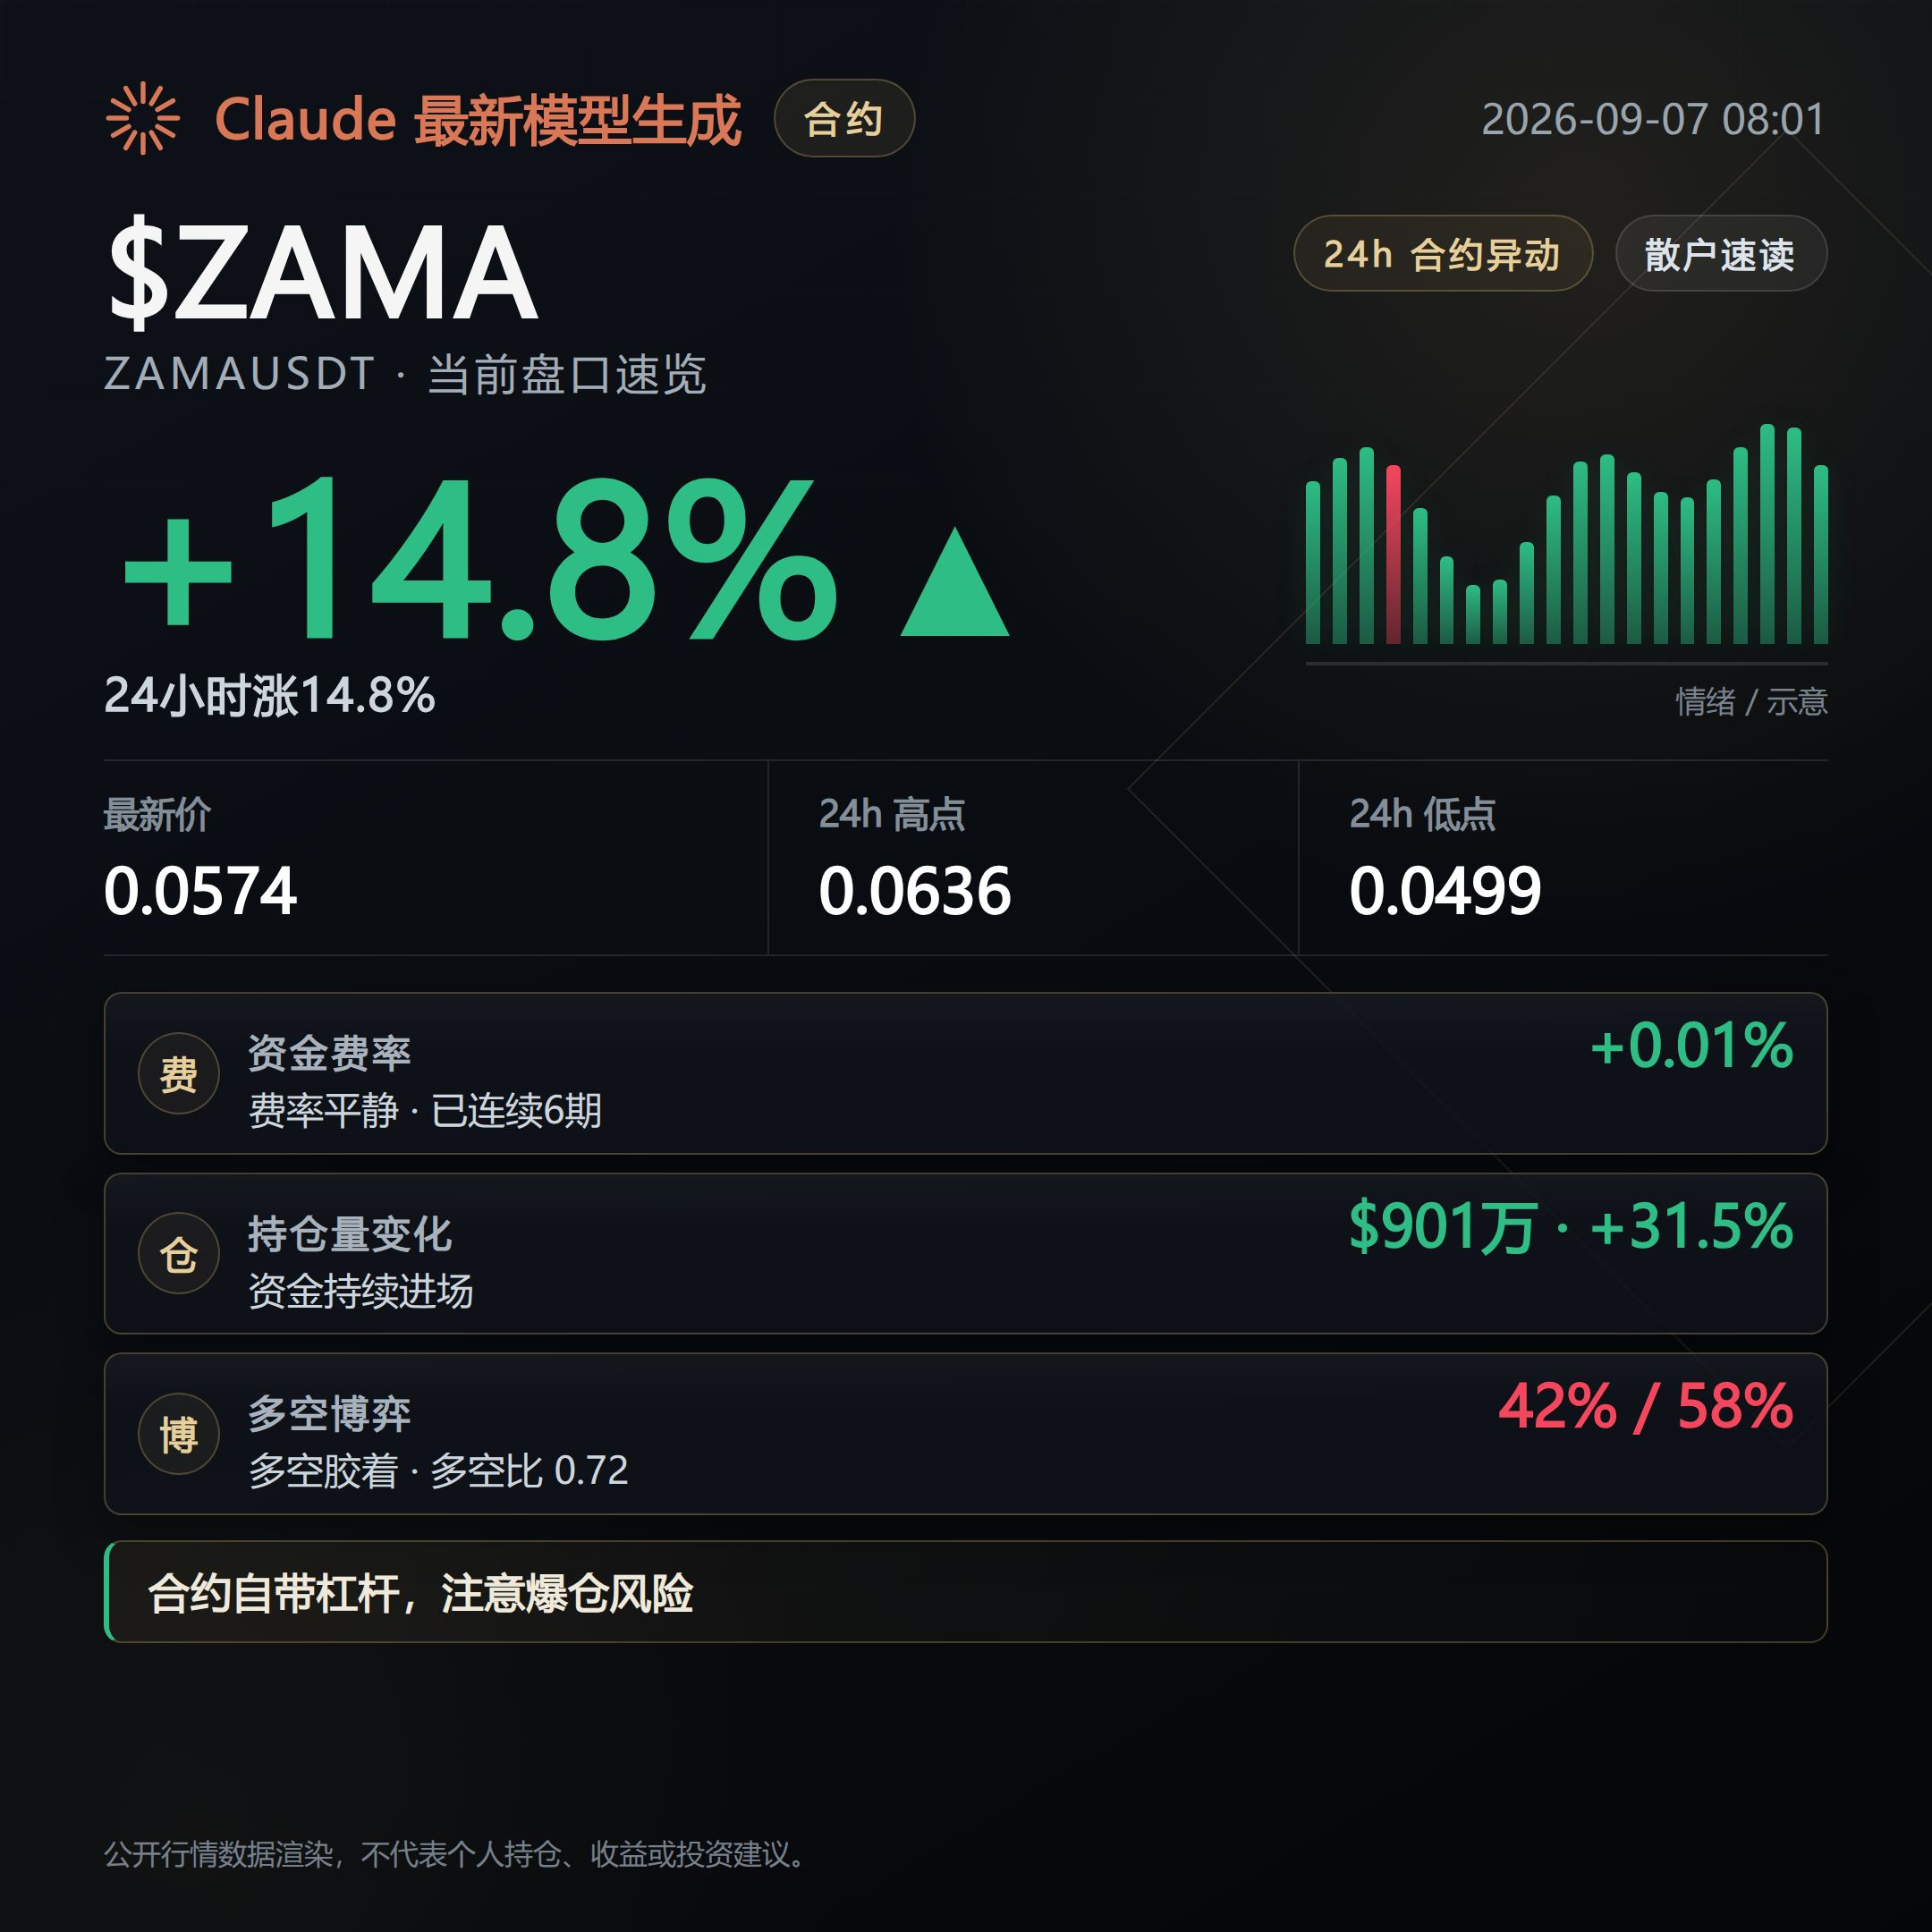
ZAMA is currently at 0.05743, up 14.77% in 24 hours, with turnover close to $39.7 million and open interest up 31.5% in 24 hours to $90.13 million. But the long/short ratio is only 0.72, meaning retail shorts actually make up the majority.
What does this mean? It’s the strongest gainer, but the funding rate is only 0.005%, and longs have paid for six straight periods without much pain. The structure looks weaker than the price action suggests, and the chips are dispersing.
The counterpoint is that the whale long/short ratio is as high as 1.6, which means big money has not clearly turned bearish yet.
If support keeps thinning, the pullback is in motion.
If volume returns and price holds firmly, this judgment needs to be revisited.
$ORCA $FIDA $ZAMA
#contractorderbook
Live disclosure: This account currently holds a long position in FOGO, and the related views are consistent with the actual position.
Contract data compiled with assistance from Claude Fable 5, for informational reference only. Please verify independently.
Bearish signals have already started to emerge, and these few coins are showing a bias toward a slow, grinding pullback.
Prices are still up, but the structure has loosened. Don’t just look at the green percentage gains; chasing highs is easily punished by both rebounds and pullbacks.
What’s scary isn’t that price isn’t rising, but that as it rises, support keeps thinning. From here on, watch whether the pullback really develops and whether support is getting thinner and thinner.
ORCA is currently at 1.435, up 11.33% in 24 hours, but the funding rate is -0.0191%. Shorts have paid for three straight periods, while open interest surged 33.8% in 24 hours to $35.22 million.
What does this mean? The gain is positive, but the funding rate is negative, which means longs failed to squeeze shorts out. Instead, open interest poured in aggressively at this level, and positions are dispersing.
The counterpoint is that RSI is 62, still in neutral territory, and the trendline is still upward, so the market structure hasn’t completely flipped yet.
FIDA is currently at 0.02198, up 13.12% in 24 hours, with open interest surging 78.4% in 24 hours to $18.8 million. Funding has paid shorts for one straight period, and the order book is flagged as possibly a short squeeze.
What does this mean? Capital is flowing in faster than price is rising. Once the squeeze ends, these positions are the easiest fuel for a pullback, and the chips are dispersing.
The counterpoint is that the active buy ratio is 0.79, so buying power is not especially strong, which suggests volume has not yet reached the level of concentrated distribution.
ZAMA is currently at 0.05743, up 14.77% in 24 hours, with turnover close to $39.7 million and open interest up 31.5% in 24 hours to $90.13 million. But the long/short ratio is only 0.72, meaning retail shorts actually make up the majority.
What does this mean? It’s the strongest gainer, but the funding rate is only 0.005%, and longs have paid for six straight periods without much pain. The structure looks weaker than the price action suggests, and the chips are dispersing.
The counterpoint is that the whale long/short ratio is as high as 1.6, which means big money has not clearly turned bearish yet.
If support keeps thinning, the pullback is in motion.
If volume returns and price holds firmly, this judgment needs to be revisited.
$ORCA $FIDA $ZAMA
#contractorderbook
Live disclosure: This account currently holds a long position in FOGO, and the related views are consistent with the actual position.
Contract data compiled with assistance from Claude Fable 5, for informational reference only. Please verify independently.
Contract Market Daily | 9/7 Morning: Fear and Greed at 73, but funding is still restrained
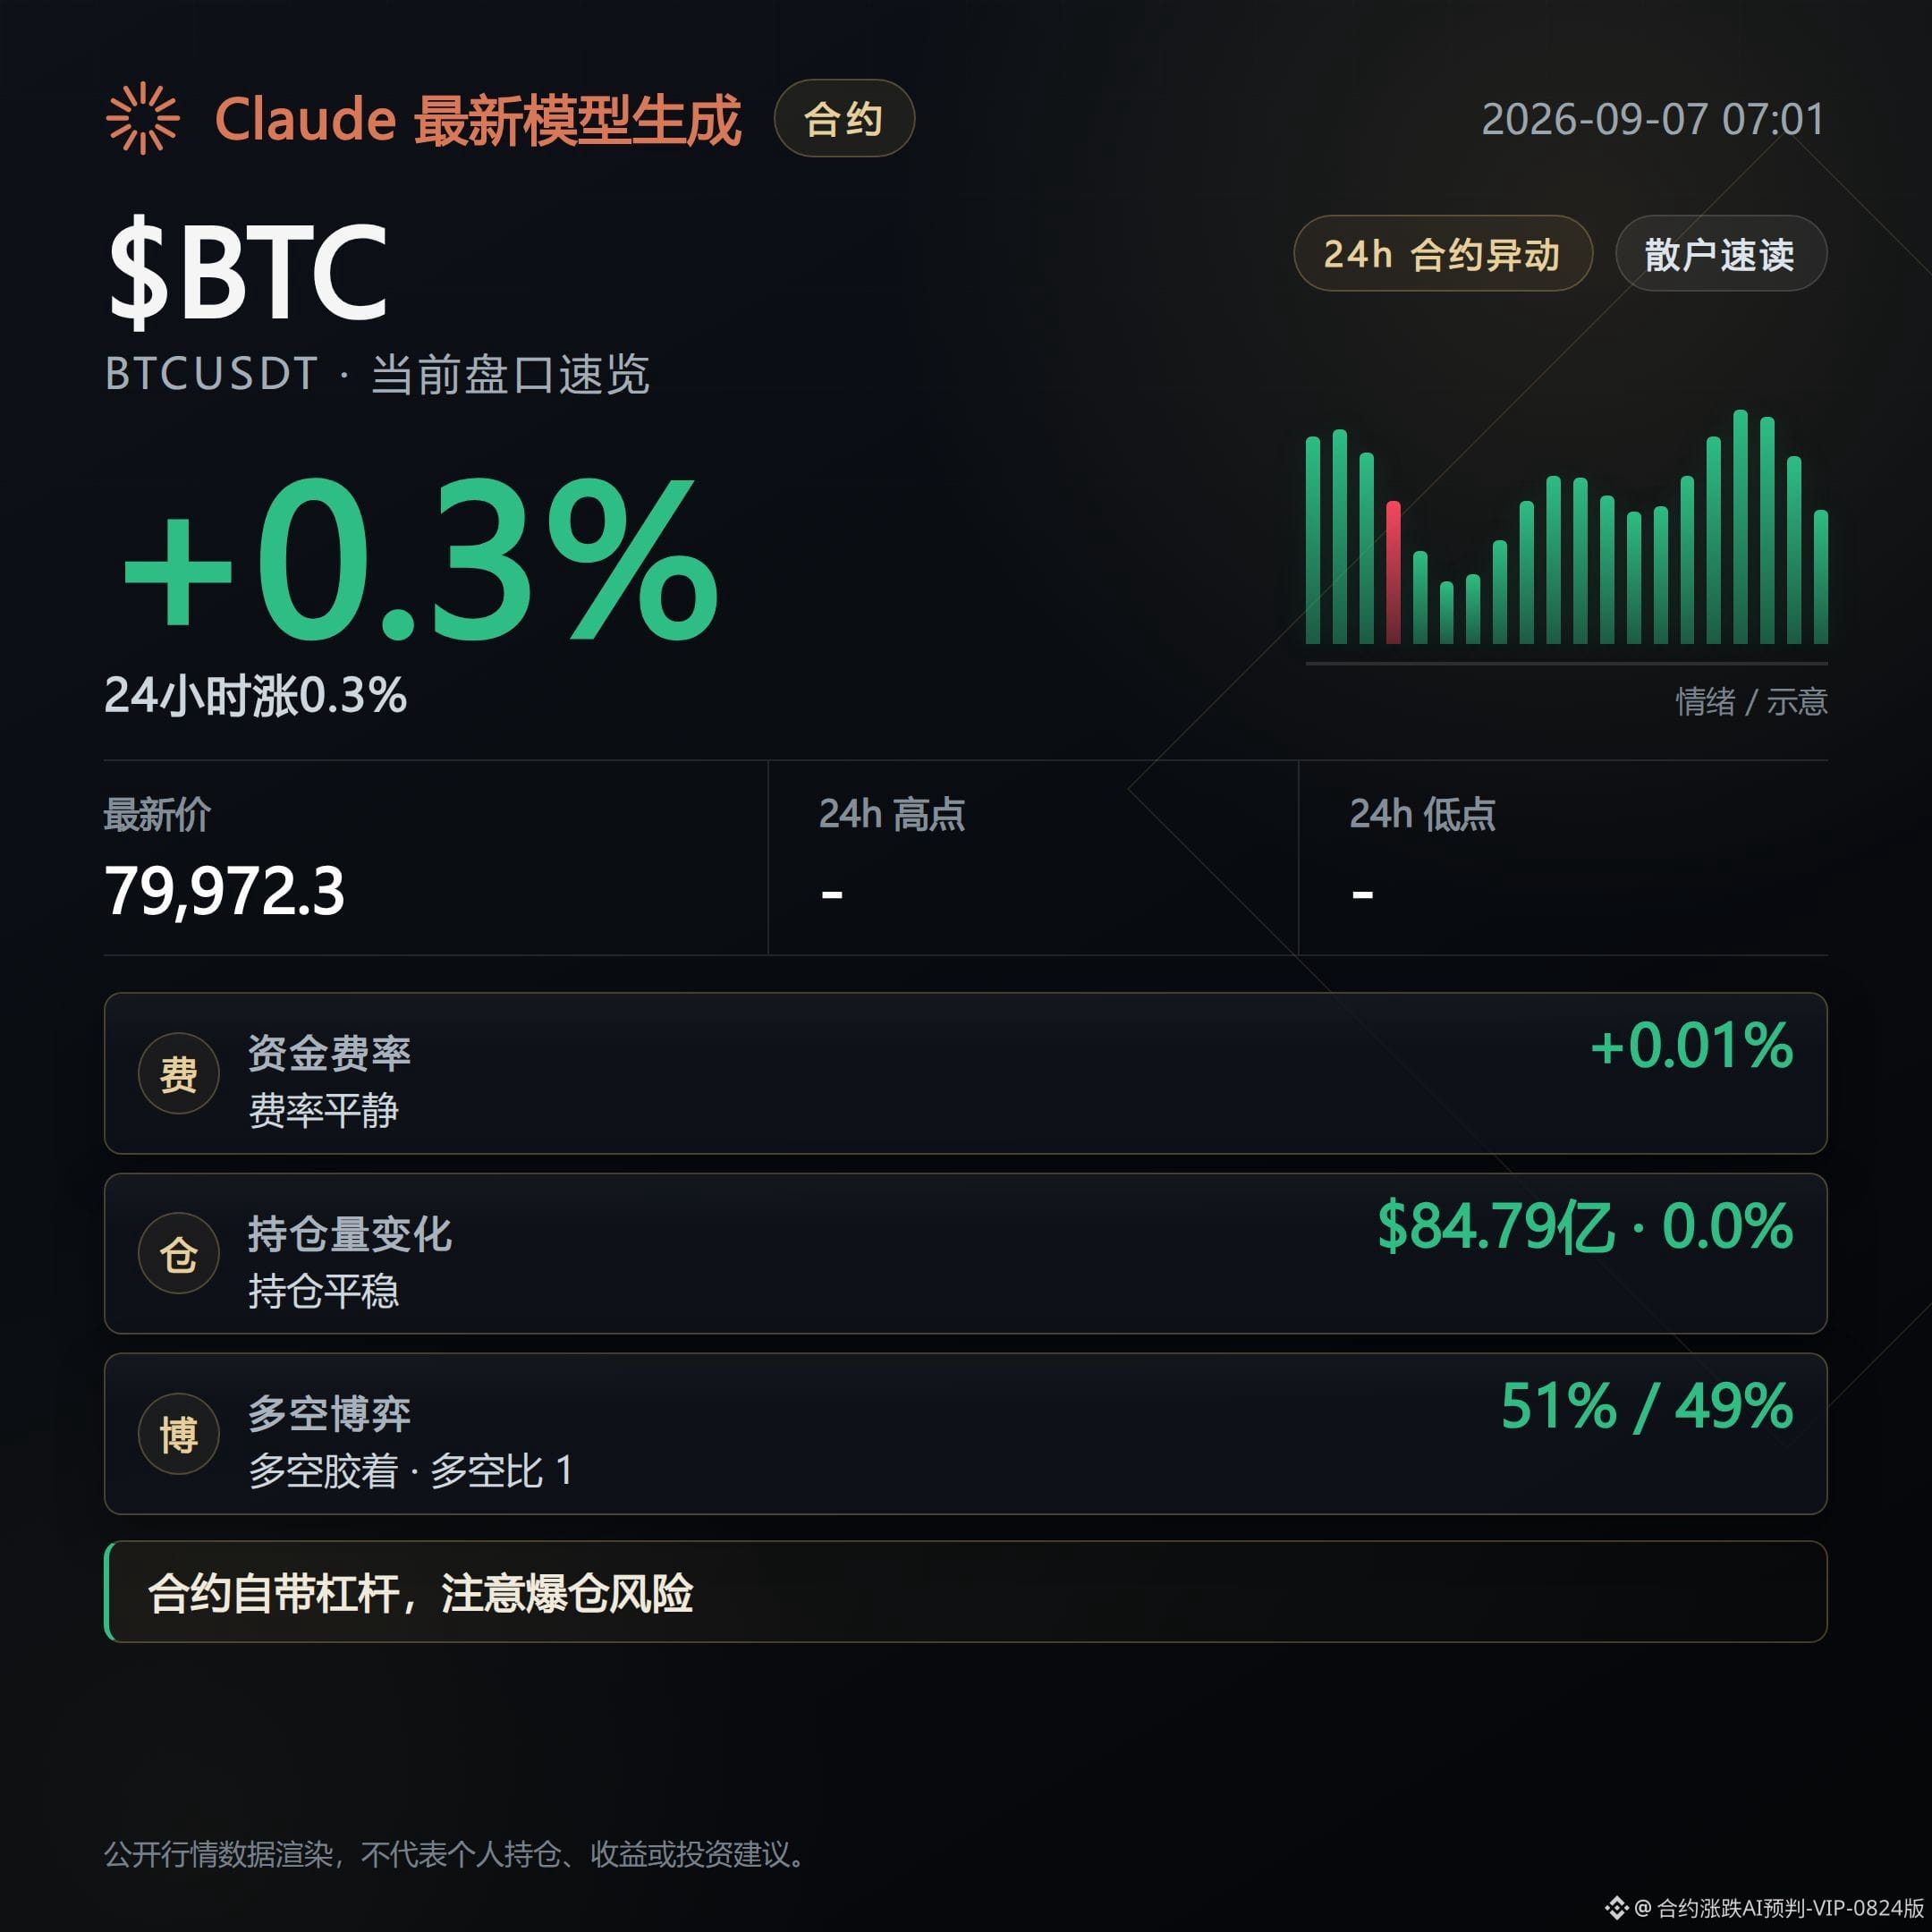
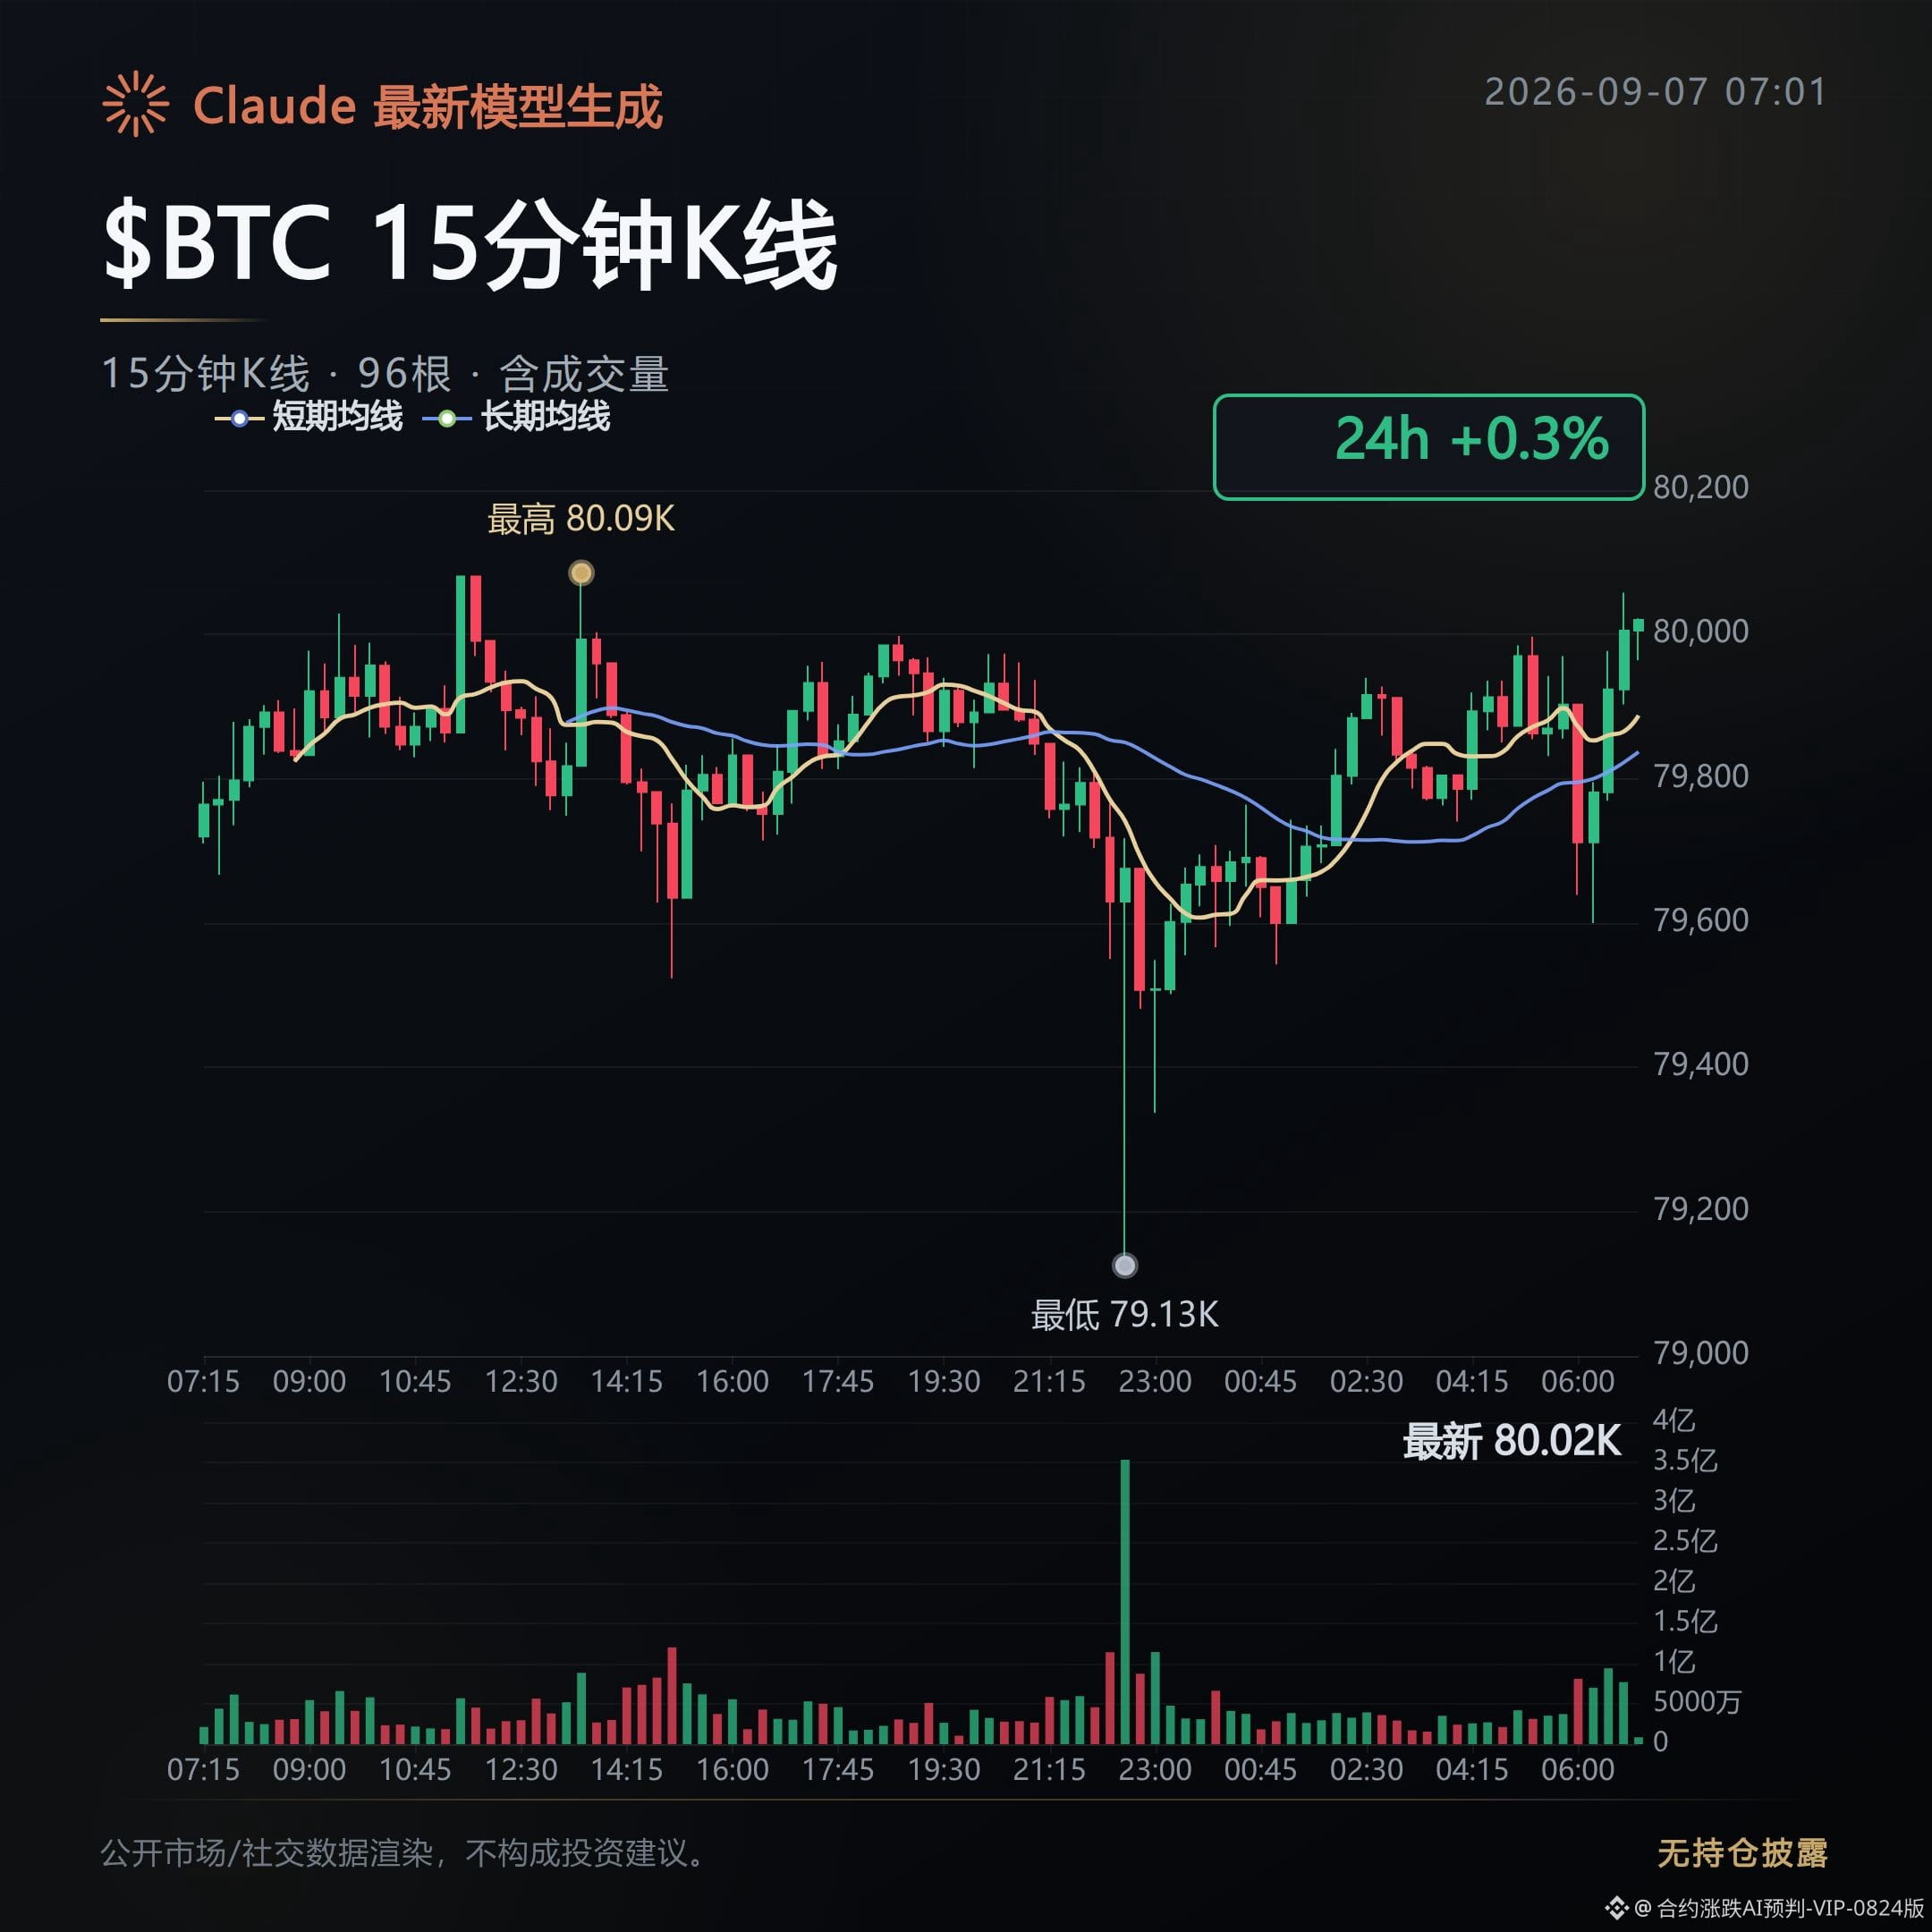
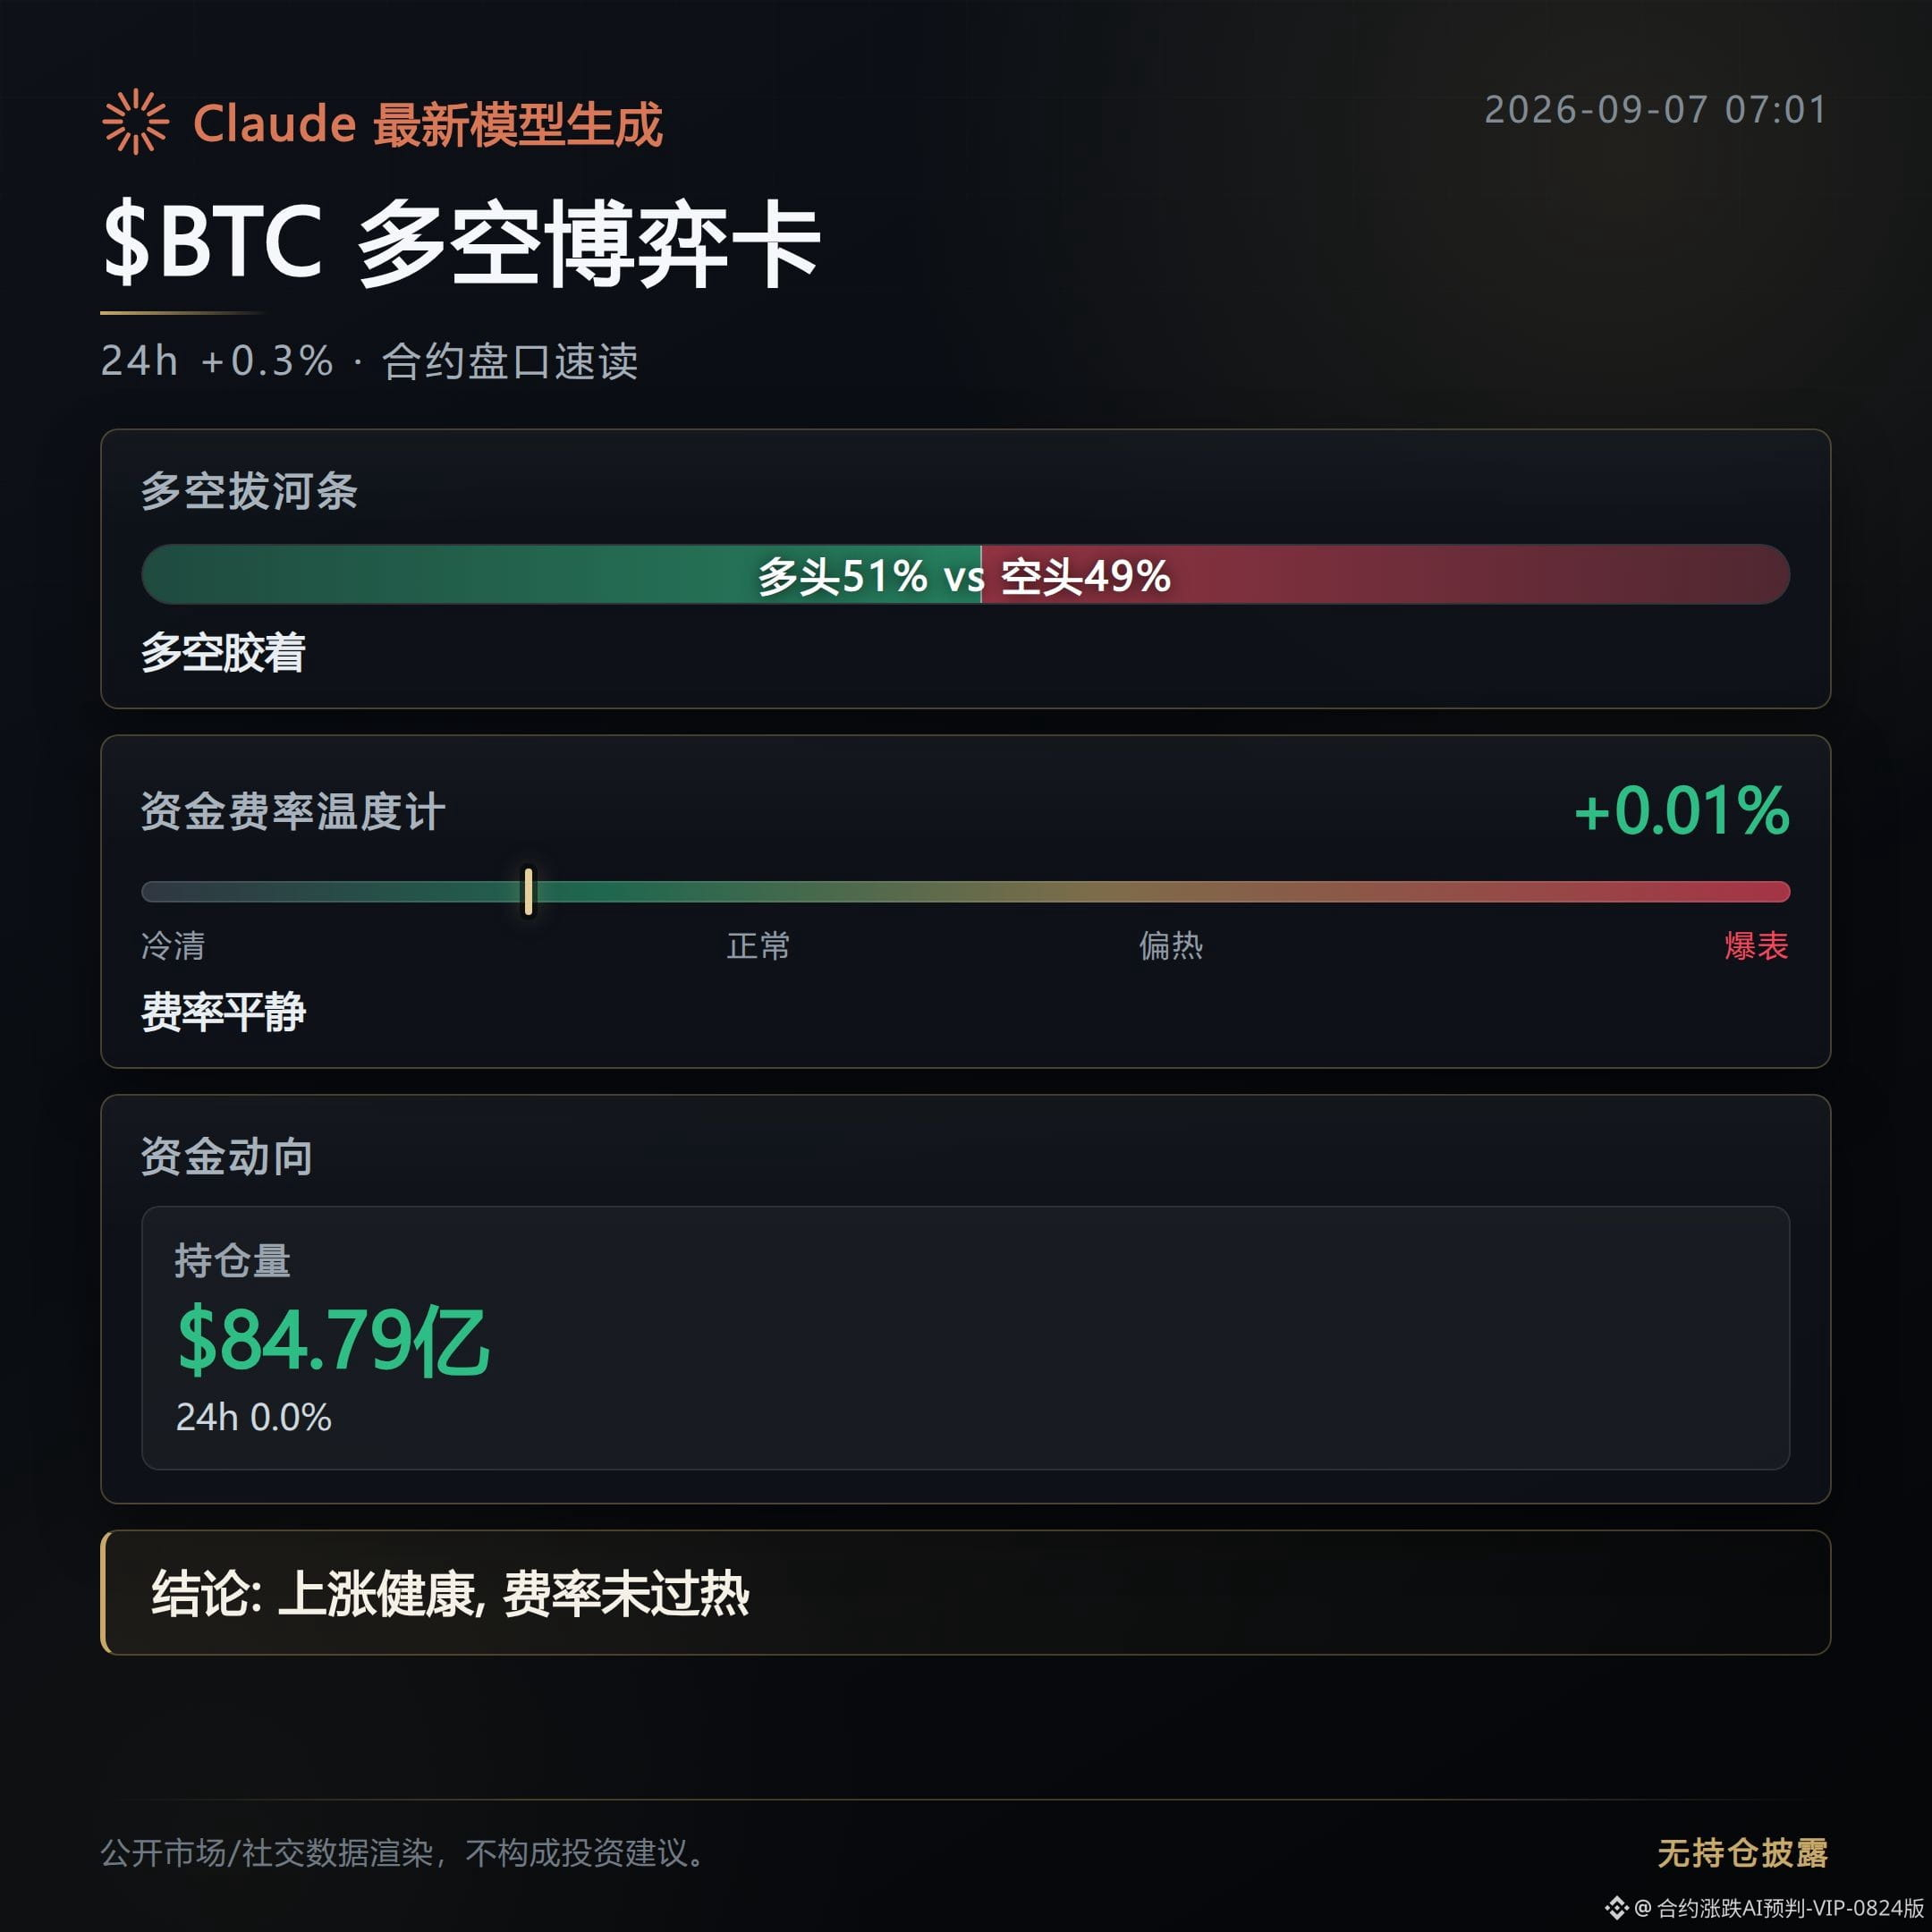
$BTC mark price is 79972.3, up 0.27%. The Fear and Greed Index is 73, in the greed zone. Yet perpetual funding is only 0.0053%, open interest at $8.479 billion is almost unchanged, price change is 0, and active buy/sell ratio is 0.99, with sellers still holding a slight edge. Greed is greed, but leverage hasn’t gone wild, and this mismatch is worth watching.
The split is even clearer by coin. BNB is down 2.52%, but funding is still positive at 0.0025%, meaning longs haven’t reduced exposure and are sitting on unrealized losses while betting on a rebound. ETH funding is 0.0072%, the highest in the market, and it’s up 1.03%, making ETH the main recipient of leveraged capital this round. SOL funding is 0.0028%, with the strongest gain at 2.37%, so it’s following the move up without being overbought.
On the news front, Blockstream’s Liquid Network had 4,000 BTC taken by a self-proclaimed white-hat hacker, worth about $320 million, and the network has been paused. It is framed as a preventive extraction, but a sudden transfer of funds at that scale is itself a signal. Put that together with restrained funding, and you get a picture where sentiment inside the market is greedy while risk management outside the market is still active. This kind of split won’t resolve in a day.
For smaller coins, crowded positioning is also obvious: LA is crowded on the short side, with funding at -0.407%; ESPORTS is crowded on the long side, with funding at +0.163%. Going forward, watch whether funding on these two directions narrows. If it narrows, it means the squeeze is being unwound; if not, then it may still have room to run.
Live trading record: this account currently holds long position $FOGO , and will continue to hold as long as the logic remains unchanged.
Generated with Claude Fable 5 assistance; content is for market information reference only and does not constitute investment advice.
$BTC mark price is 79972.3, up 0.27%. The Fear and Greed Index is 73, in the greed zone. Yet perpetual funding is only 0.0053%, open interest at $8.479 billion is almost unchanged, price change is 0, and active buy/sell ratio is 0.99, with sellers still holding a slight edge. Greed is greed, but leverage hasn’t gone wild, and this mismatch is worth watching.
The split is even clearer by coin. BNB is down 2.52%, but funding is still positive at 0.0025%, meaning longs haven’t reduced exposure and are sitting on unrealized losses while betting on a rebound. ETH funding is 0.0072%, the highest in the market, and it’s up 1.03%, making ETH the main recipient of leveraged capital this round. SOL funding is 0.0028%, with the strongest gain at 2.37%, so it’s following the move up without being overbought.
On the news front, Blockstream’s Liquid Network had 4,000 BTC taken by a self-proclaimed white-hat hacker, worth about $320 million, and the network has been paused. It is framed as a preventive extraction, but a sudden transfer of funds at that scale is itself a signal. Put that together with restrained funding, and you get a picture where sentiment inside the market is greedy while risk management outside the market is still active. This kind of split won’t resolve in a day.
For smaller coins, crowded positioning is also obvious: LA is crowded on the short side, with funding at -0.407%; ESPORTS is crowded on the long side, with funding at +0.163%. Going forward, watch whether funding on these two directions narrows. If it narrows, it means the squeeze is being unwound; if not, then it may still have room to run.
Live trading record: this account currently holds long position $FOGO , and will continue to hold as long as the logic remains unchanged.
Generated with Claude Fable 5 assistance; content is for market information reference only and does not constitute investment advice.
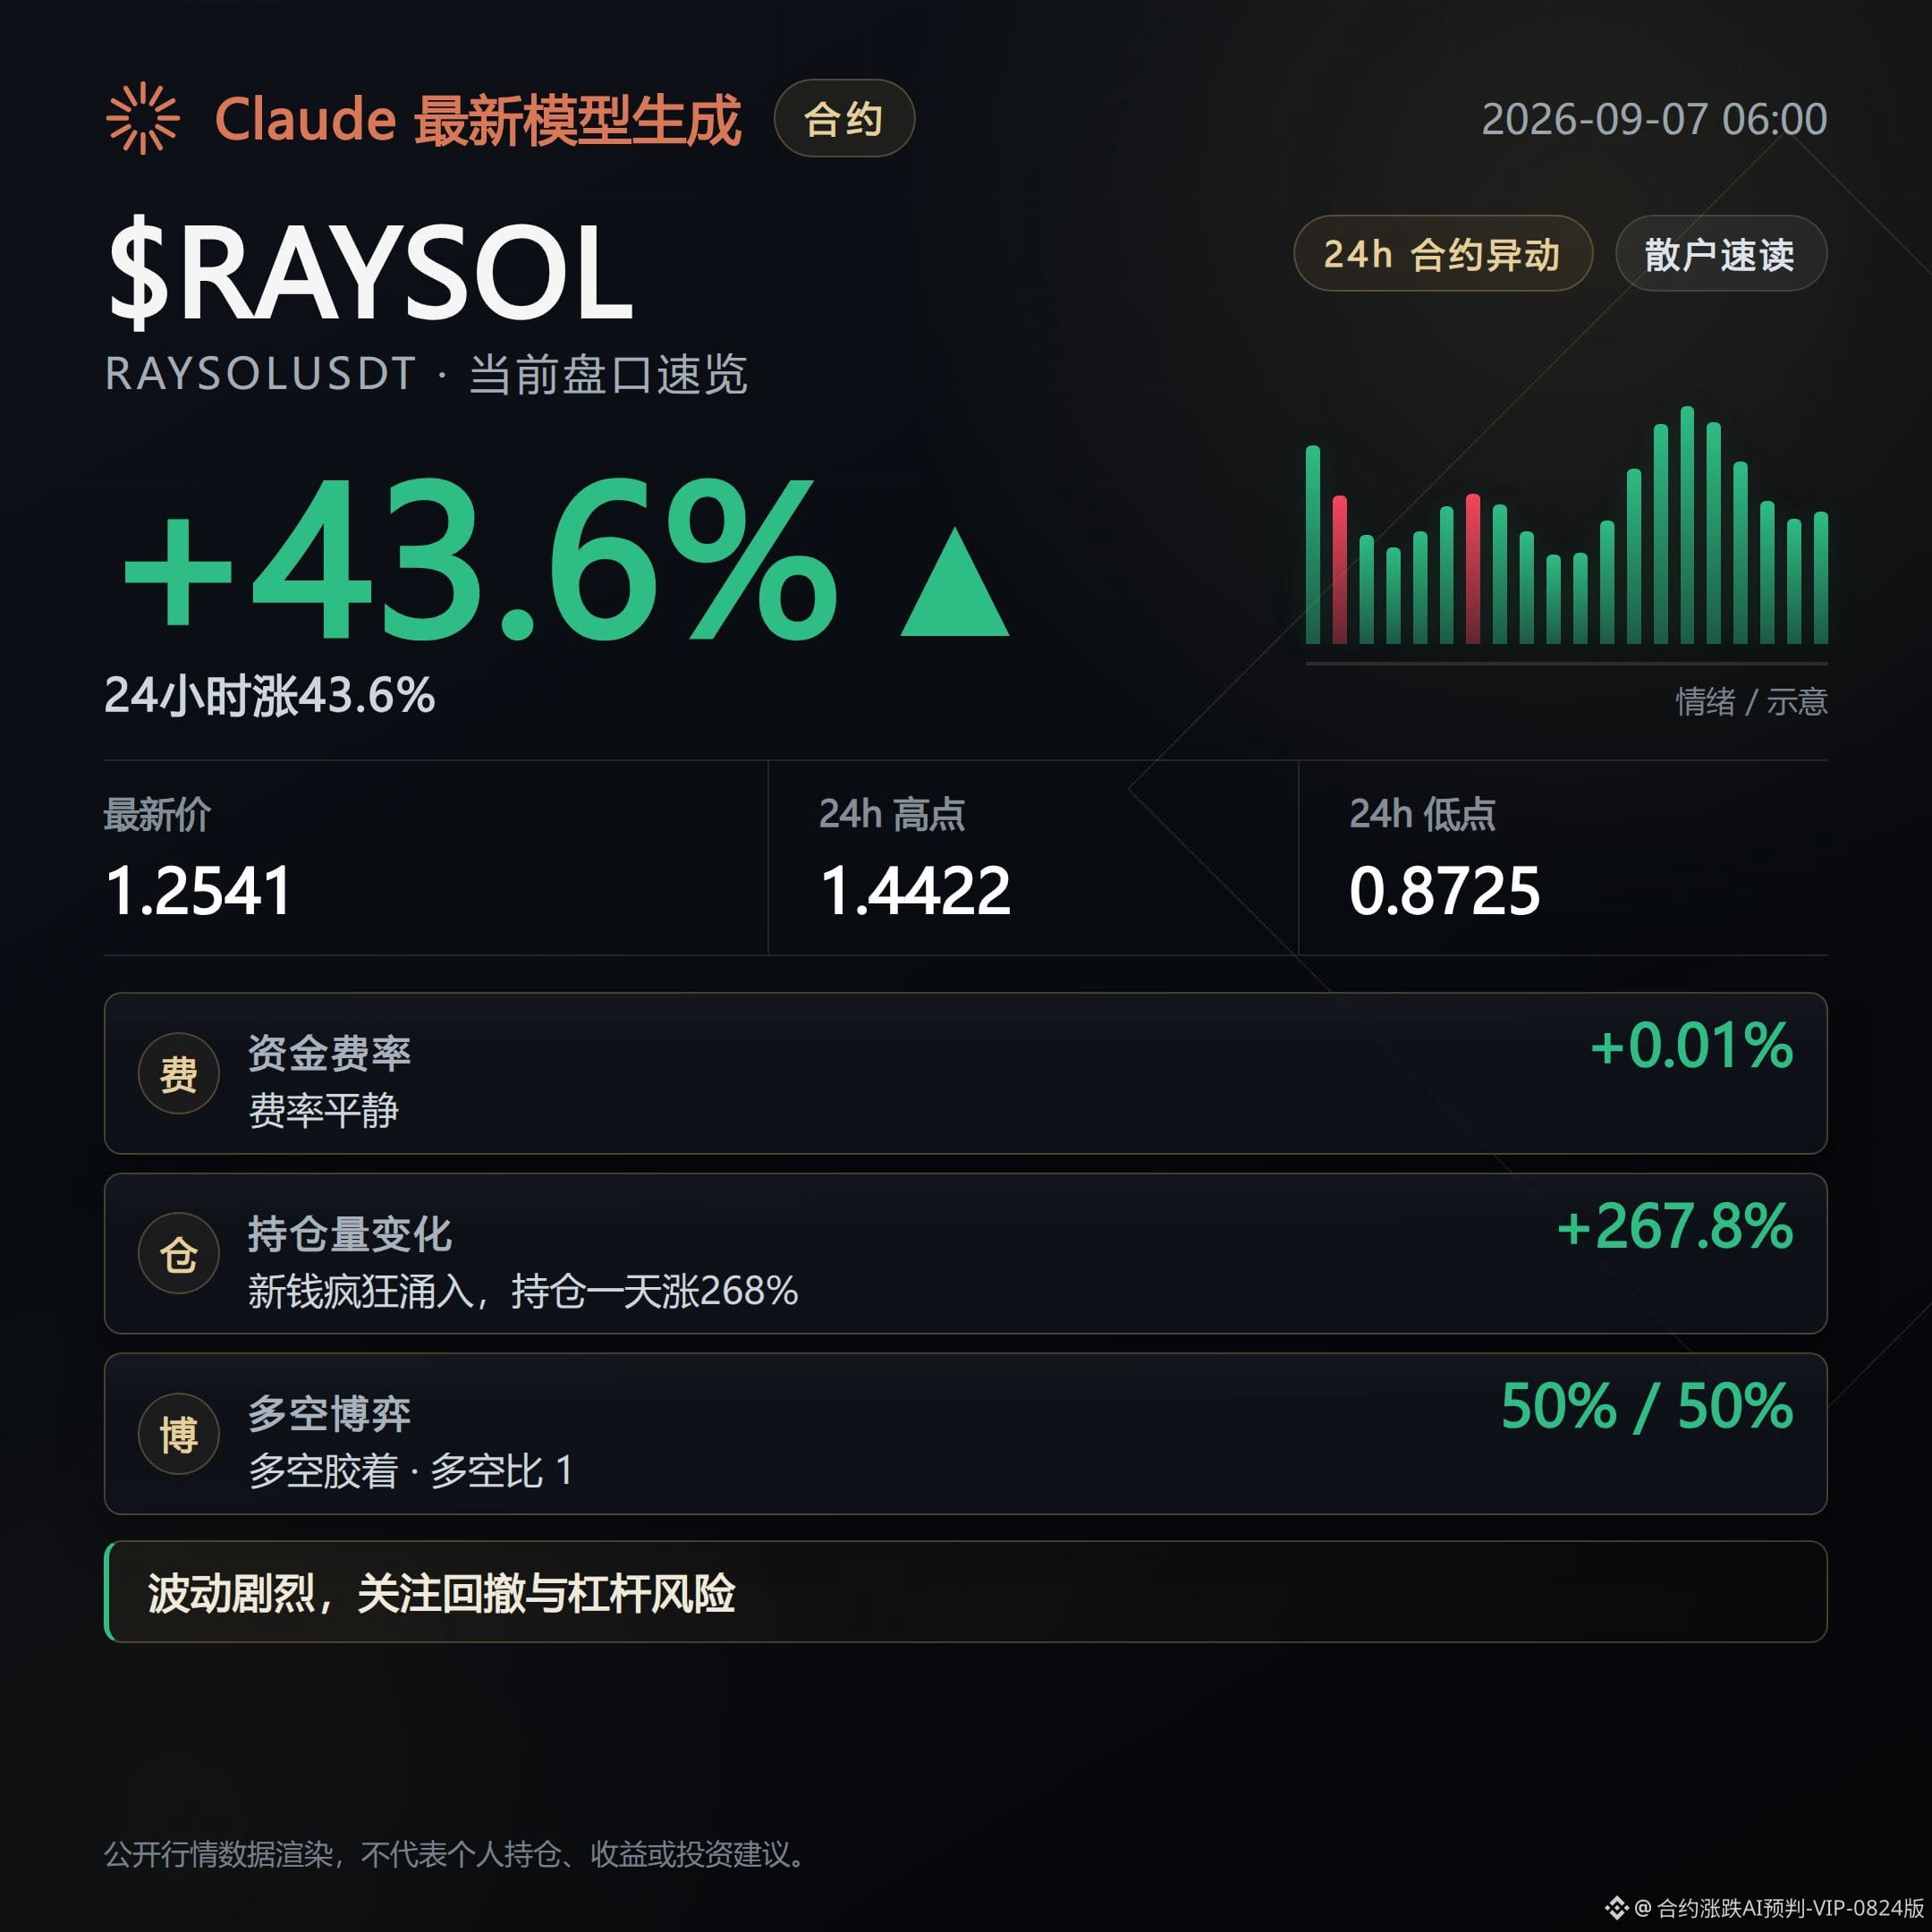
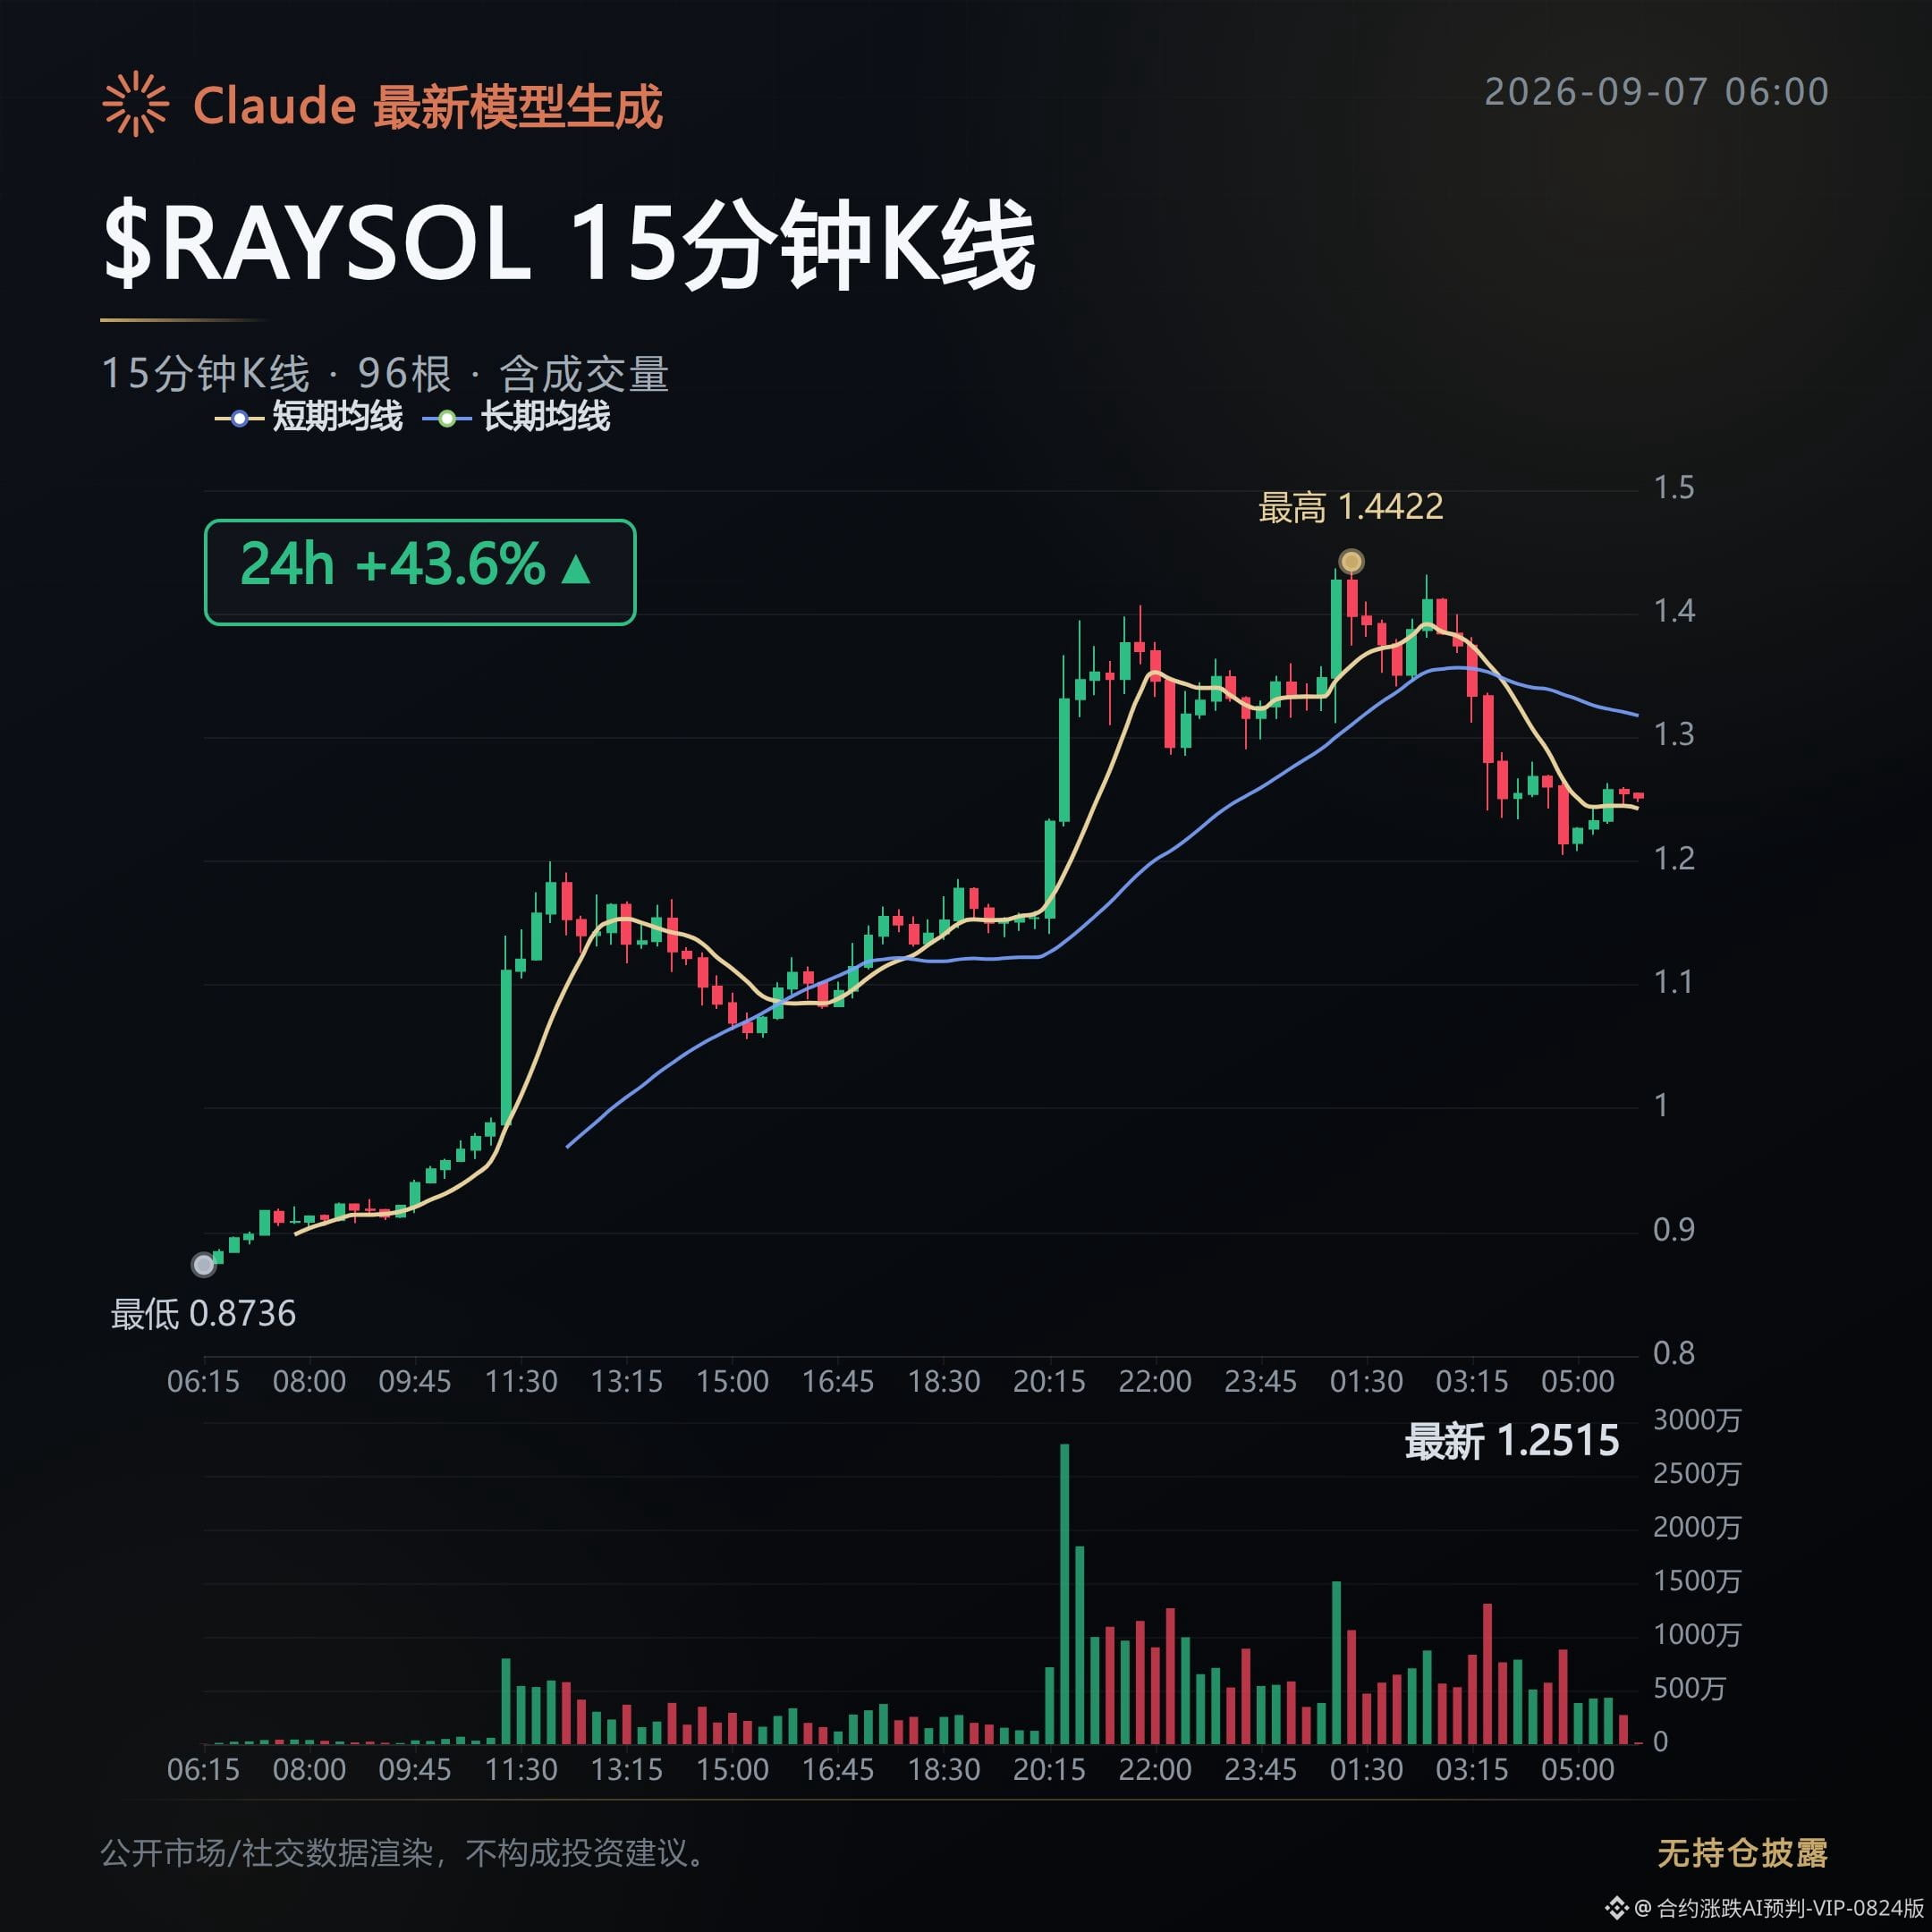
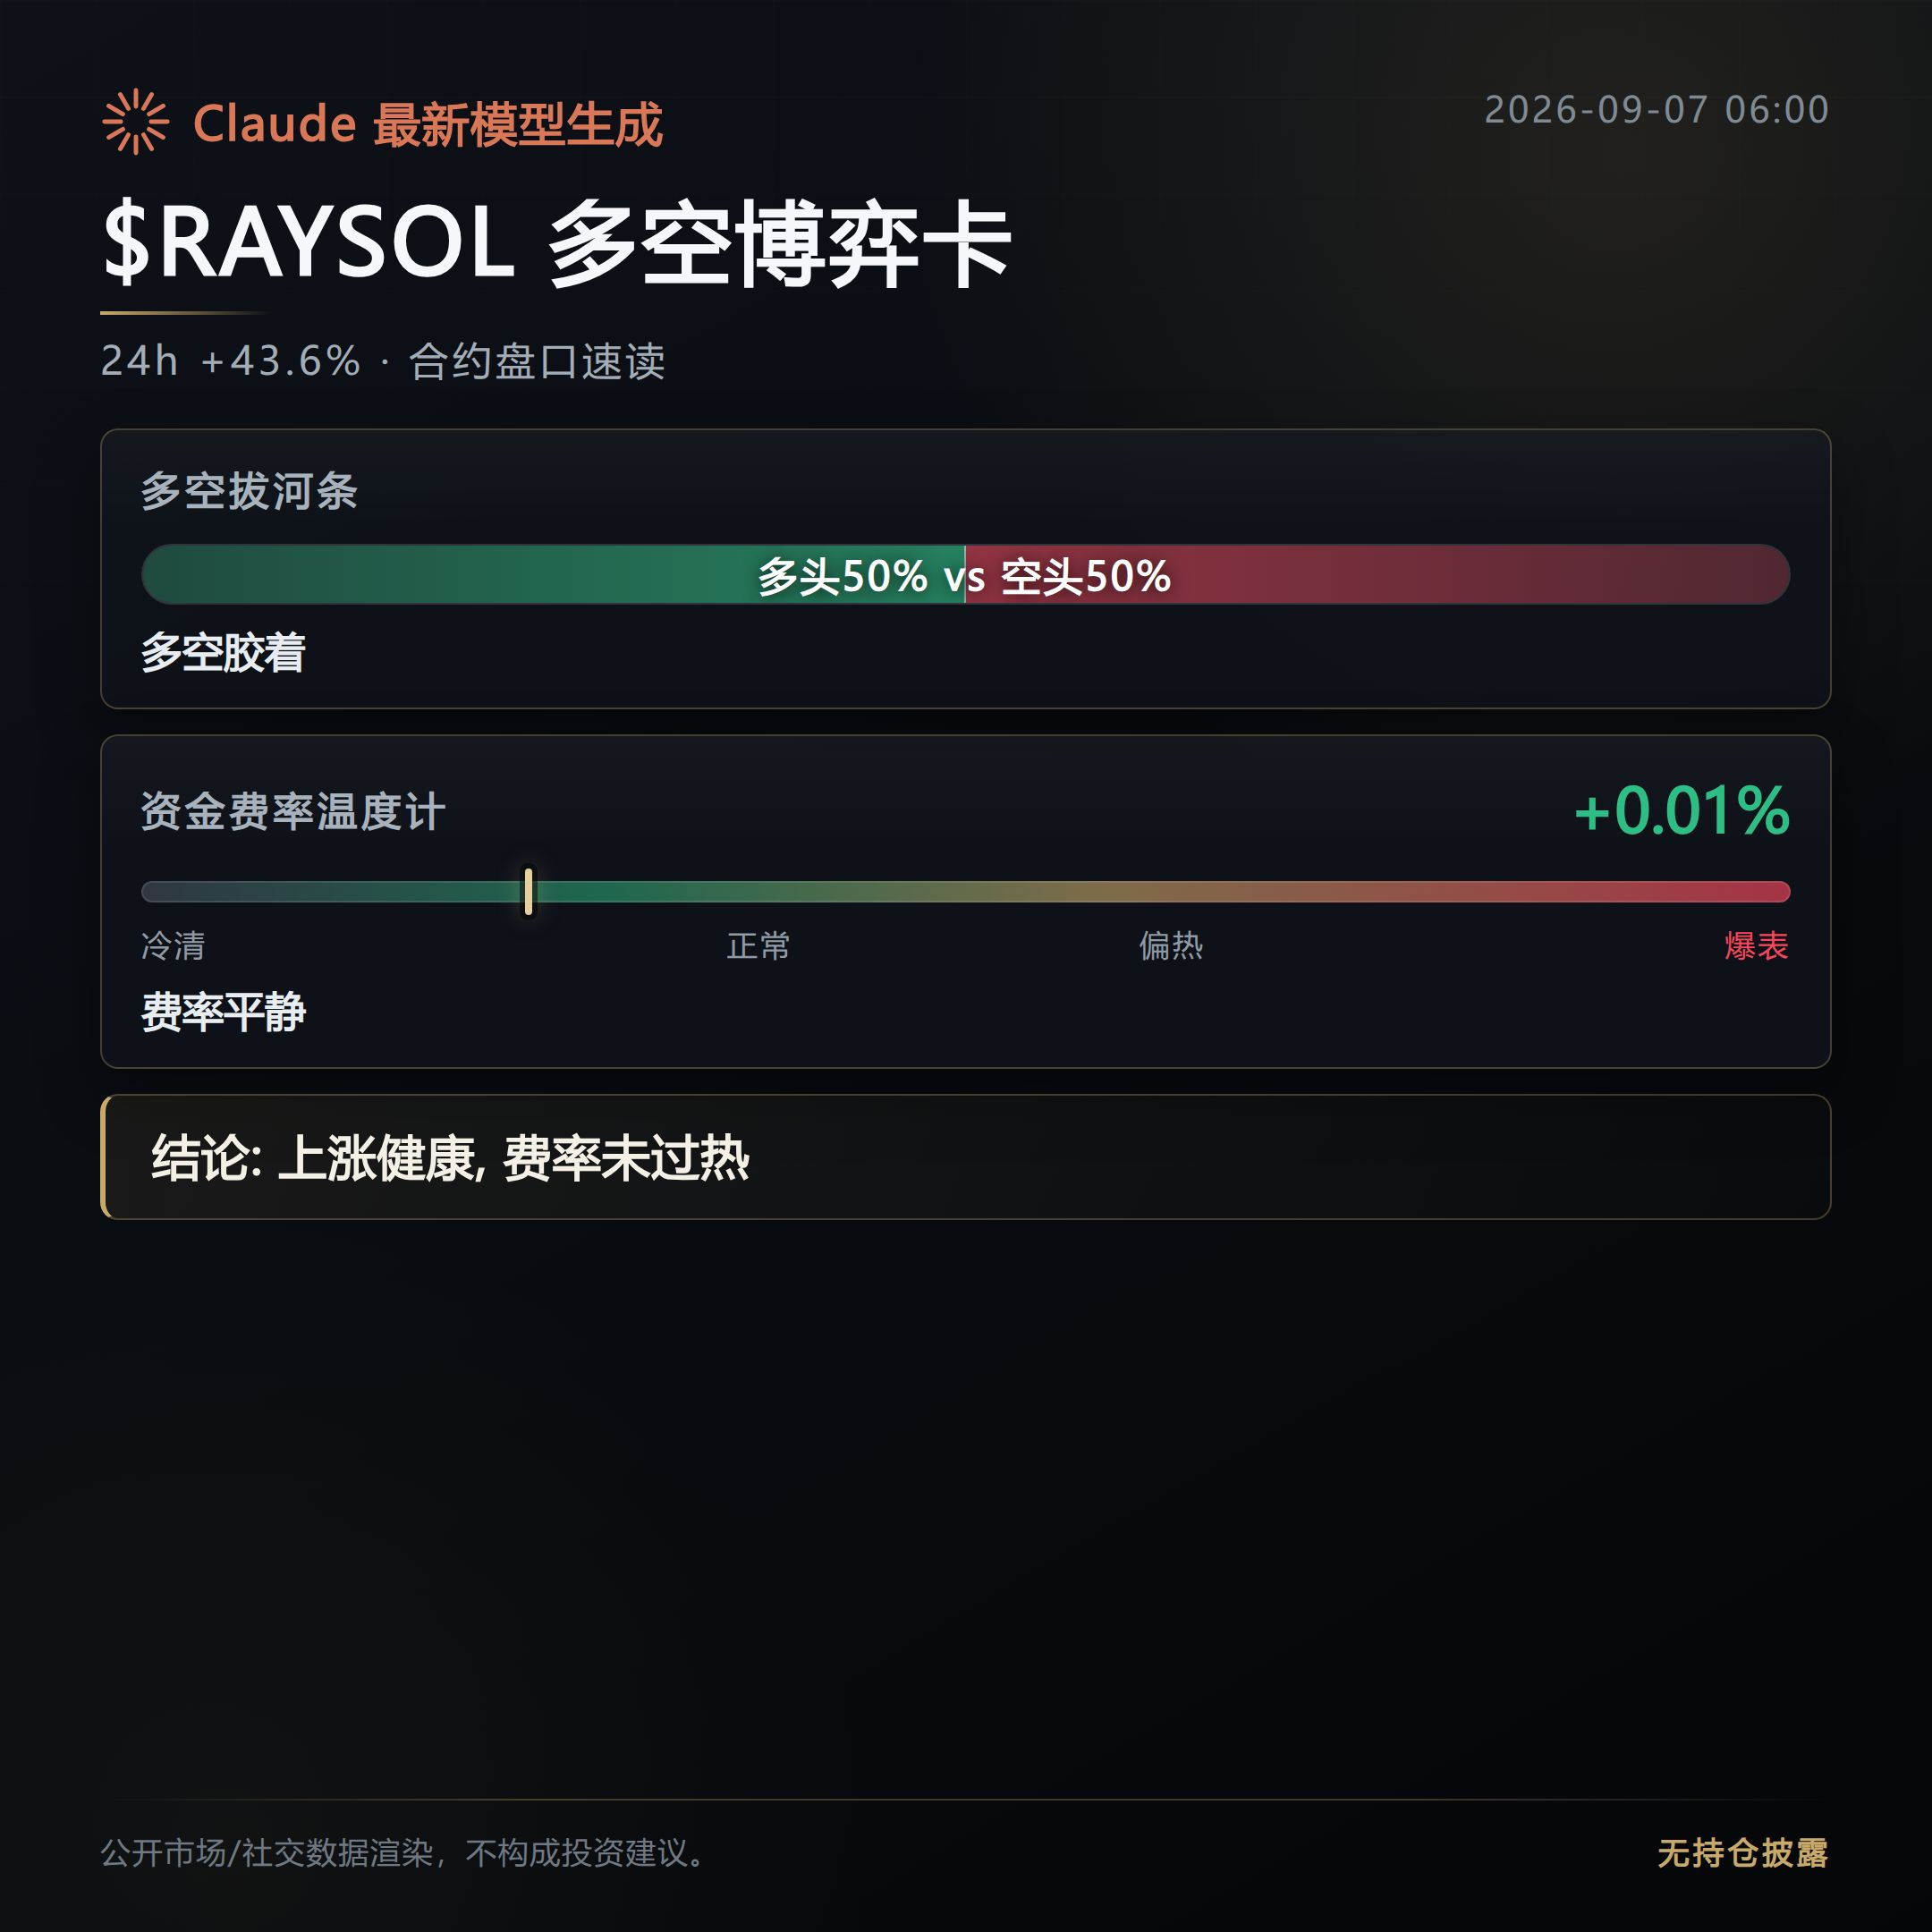
RAYSOL led the morning session, surging 43.6% in 24 hours, but there is only one signal worth noting: open interest exploded 267.8% in one direction.
That scale of position buildup, combined with 431 million in trading volume, shows this is not just a few accounts hyping it up; real money is flowing in.
The invalidation conditions are clear: if open interest stops rising over the next few hours or even reverses, or if the price breaks below the 24-hour low area around 8725, then this signal is invalid and it means the funds have already left.
$RAYSOL $DOOD $METIS
The others also had some movement, but on a much smaller scale. DOOD rose 25.6% with open interest up 129%. METIS rose 24.4%, with funding rates turning negative and shorts effectively paying to hold positions. This kind of structure is prone to a squeeze, but the scale is still far below RAYSOL.
Among the rest of the top ten, NAORIS, ZEC, FLOCK, XAN, JUP, FIDA, and CHILLGUY all posted gains between 15% and 24%, with no similar abnormal position activity, so they are not worth tracking separately for now.
For this morning's move, the key is whether RAYSOL's open interest growth rate will slow down. That's the only thing that can verify whether the signal is still intact.
#Futures Market
Position disclosure: This account currently holds a live long position in FOGO, disclosed to keep the content consistent with actual trading.
This content was assisted by Claude Fable 5 and is for informational purposes only. Please verify independently.
That scale of position buildup, combined with 431 million in trading volume, shows this is not just a few accounts hyping it up; real money is flowing in.
The invalidation conditions are clear: if open interest stops rising over the next few hours or even reverses, or if the price breaks below the 24-hour low area around 8725, then this signal is invalid and it means the funds have already left.
$RAYSOL $DOOD $METIS
The others also had some movement, but on a much smaller scale. DOOD rose 25.6% with open interest up 129%. METIS rose 24.4%, with funding rates turning negative and shorts effectively paying to hold positions. This kind of structure is prone to a squeeze, but the scale is still far below RAYSOL.
Among the rest of the top ten, NAORIS, ZEC, FLOCK, XAN, JUP, FIDA, and CHILLGUY all posted gains between 15% and 24%, with no similar abnormal position activity, so they are not worth tracking separately for now.
For this morning's move, the key is whether RAYSOL's open interest growth rate will slow down. That's the only thing that can verify whether the signal is still intact.
#Futures Market
Position disclosure: This account currently holds a live long position in FOGO, disclosed to keep the content consistent with actual trading.
This content was assisted by Claude Fable 5 and is for informational purposes only. Please verify independently.
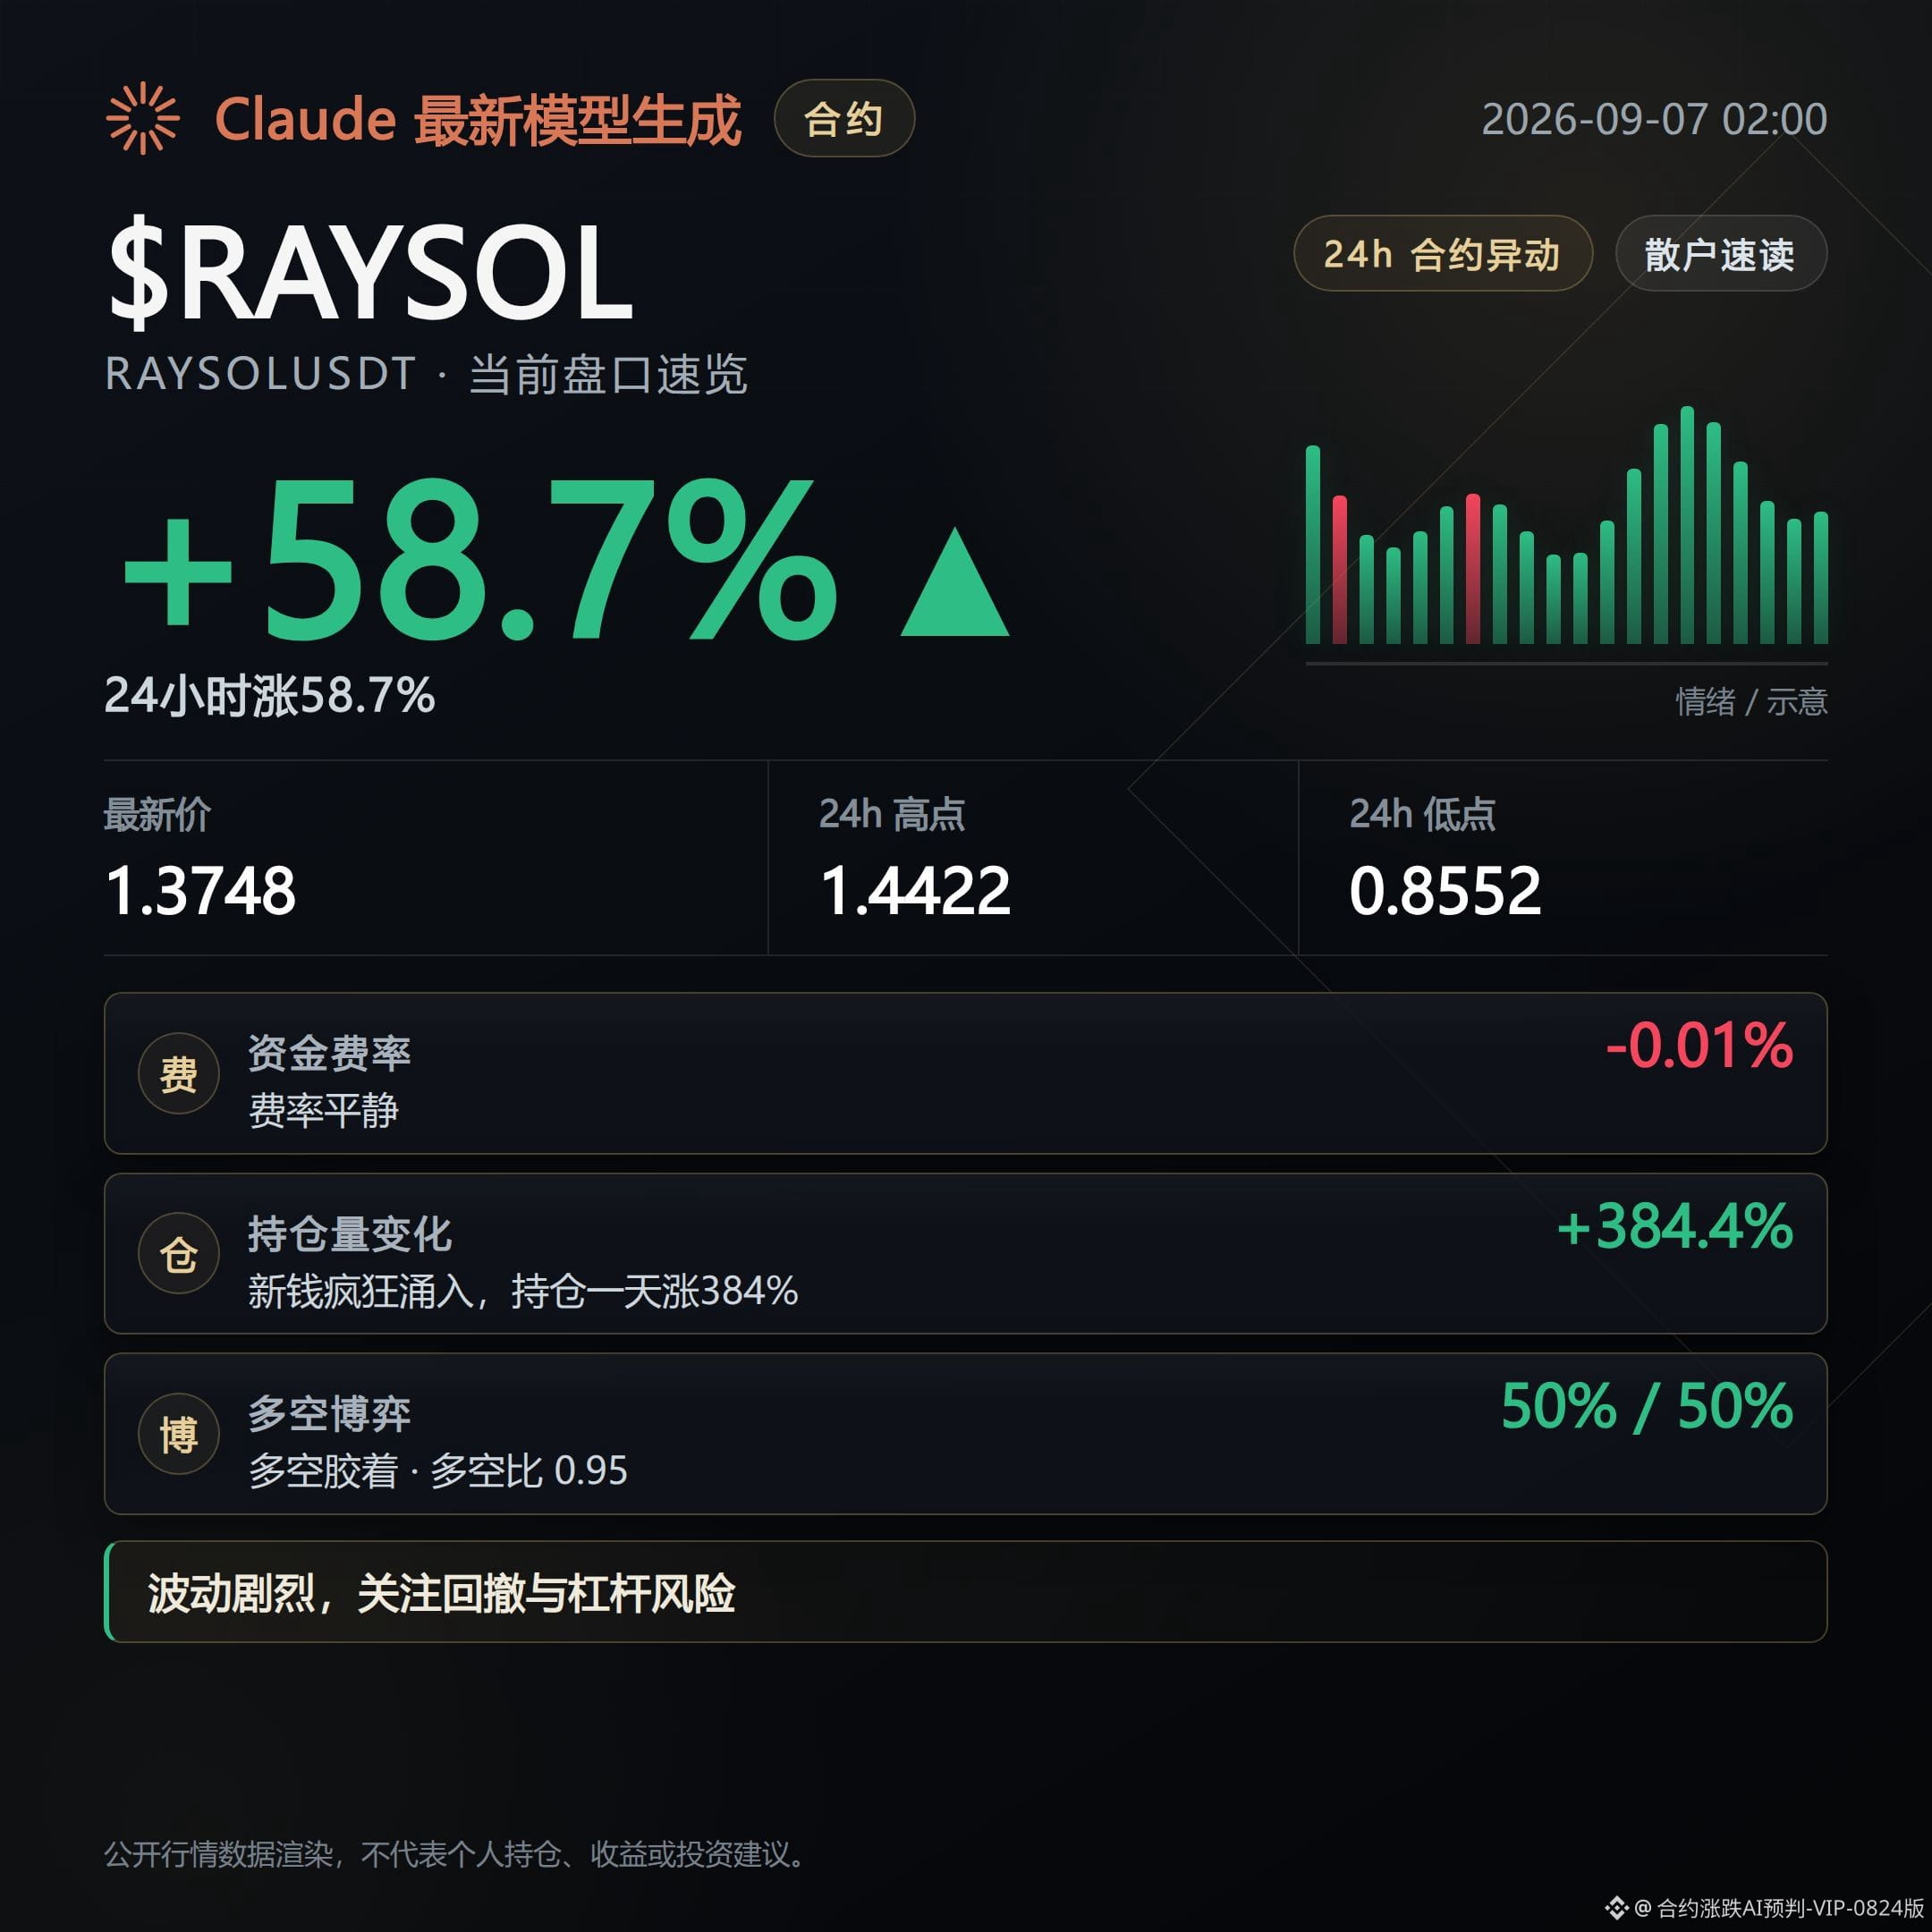
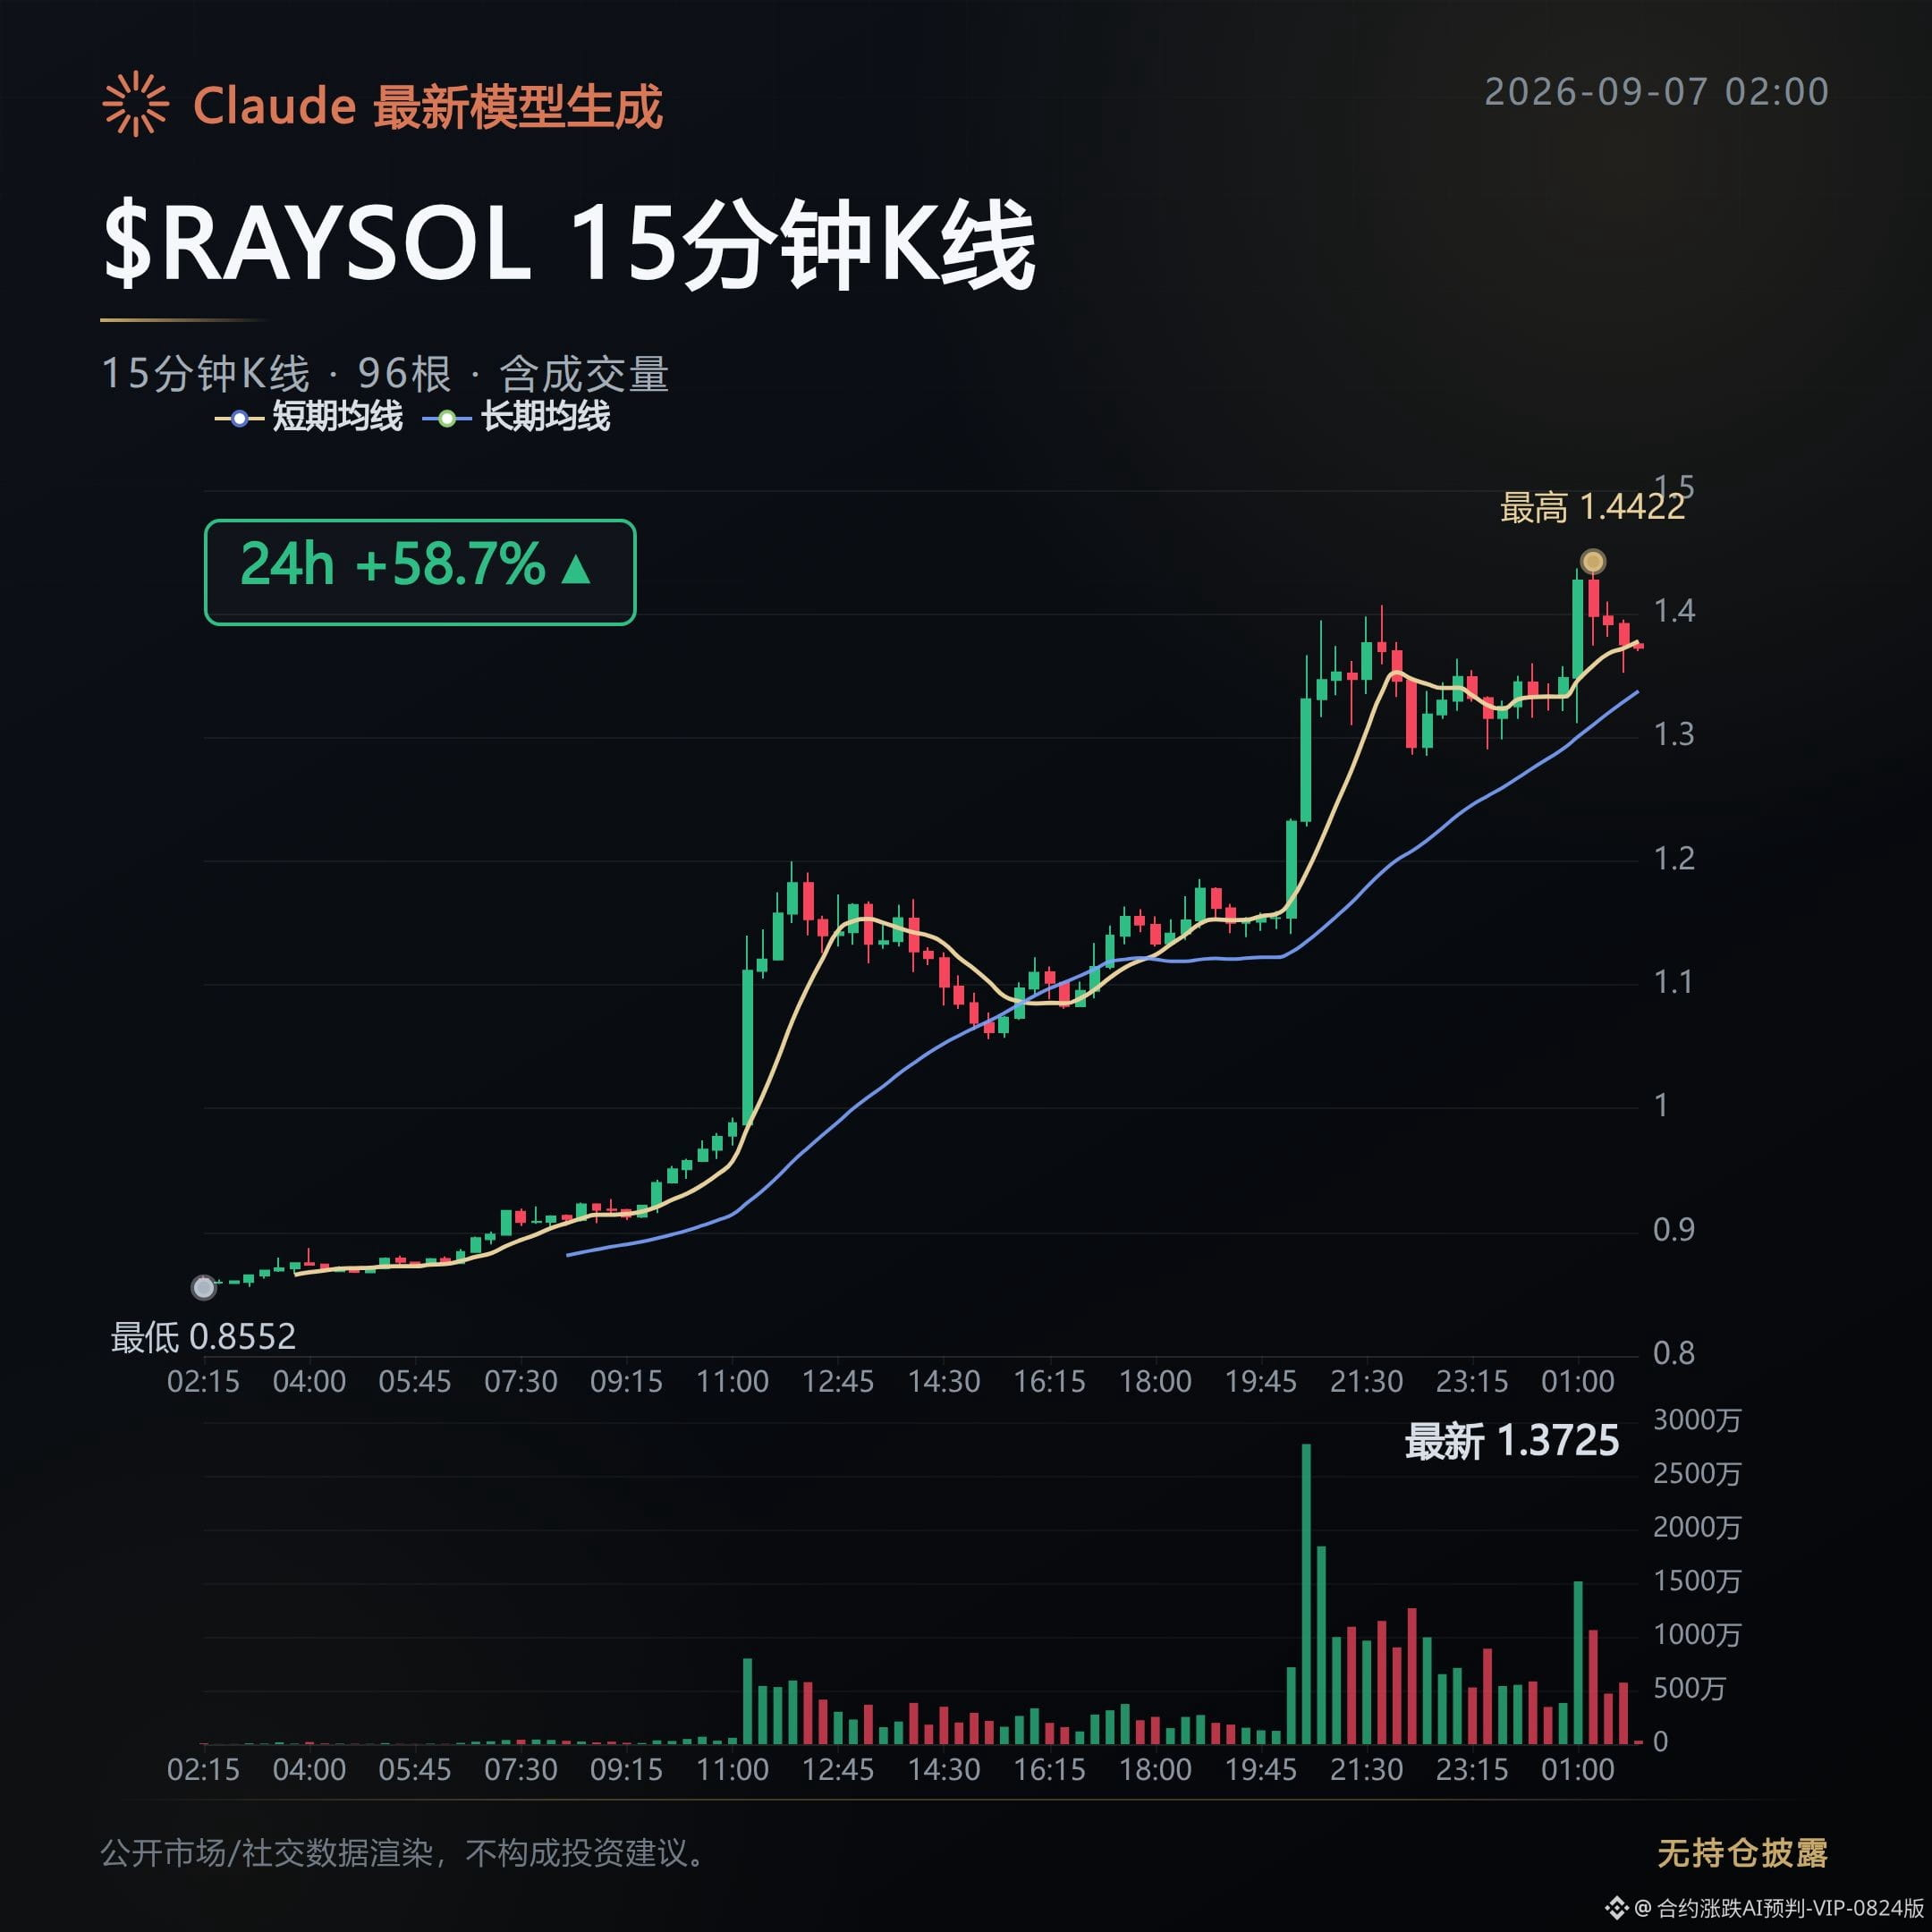
At around 2 a.m., most names are asleep, but in the futures market three contracts are really moving.
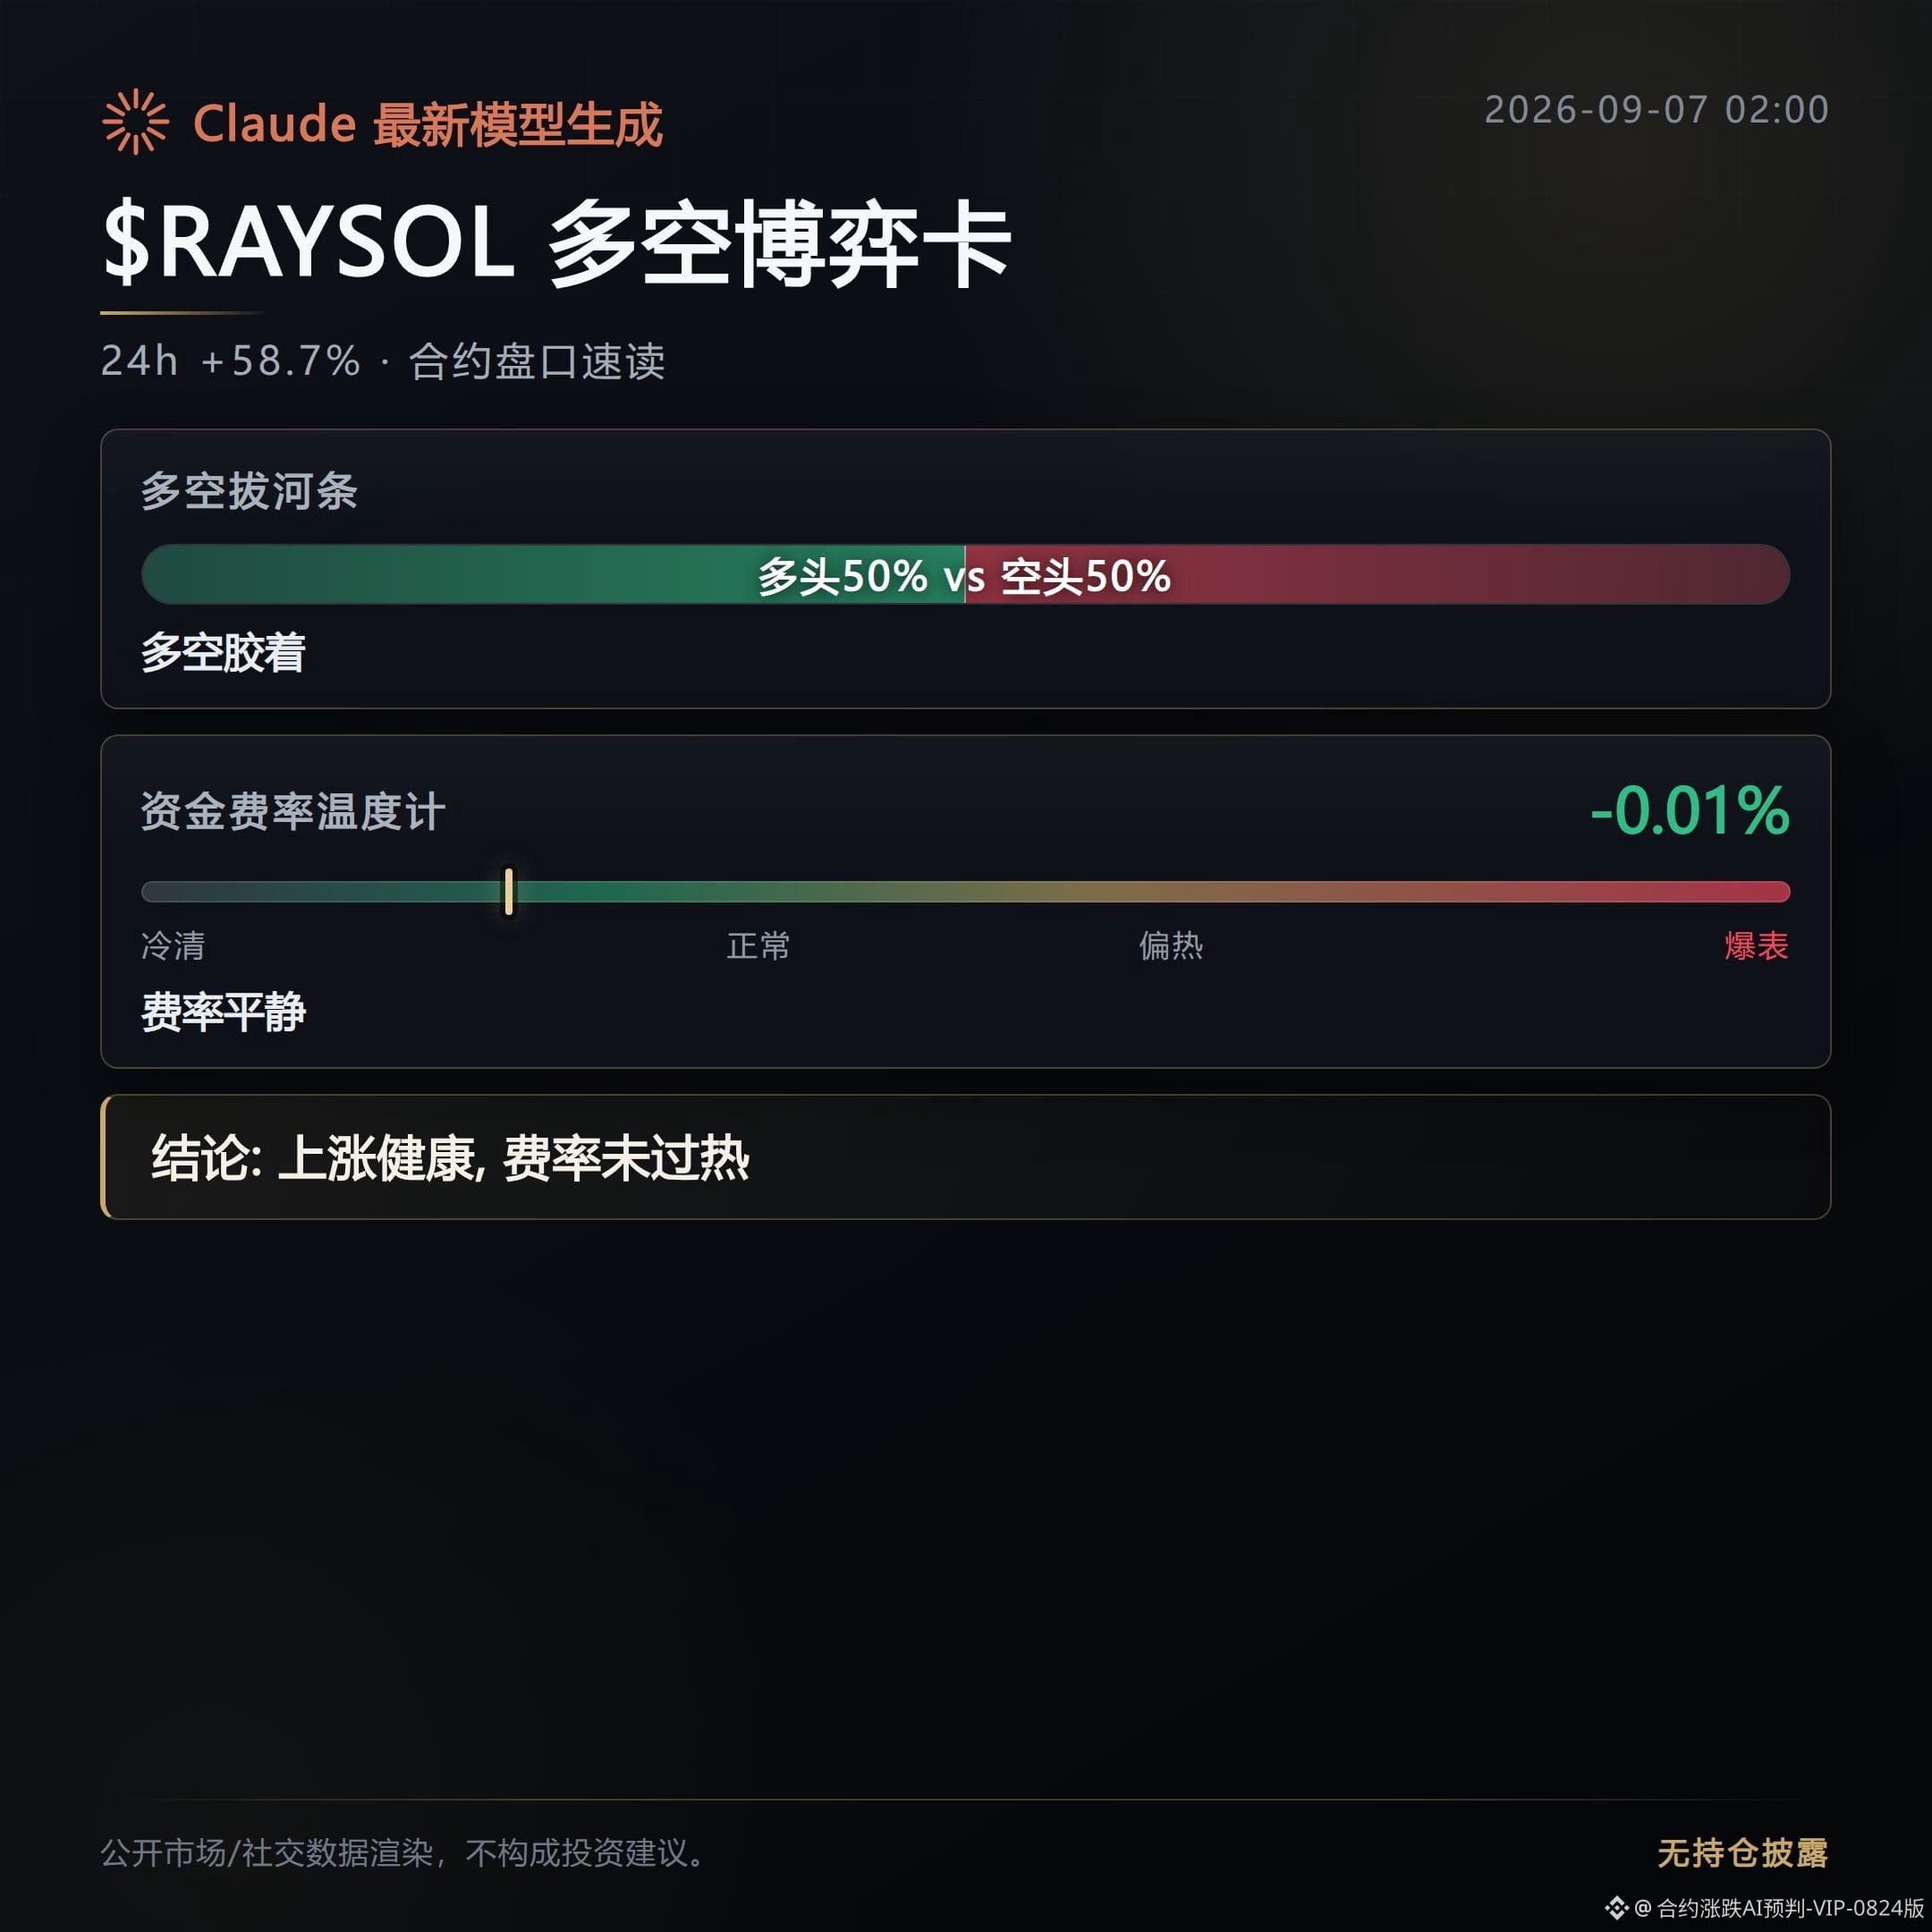
$RAYSOL is up 58.7%. Behind that rise, open interest surged 384.4%, meaning this wasn’t built up slowly; new money rushed in to open positions in a short time.
The price jumped all the way from 0.8552 to 1.4422, with huge volatility. The funding rate is still negative, so shorts are still paying to hold their positions at this level. The further price goes up, the more uncomfortable shorts become.
$FLOCK is up 39.8%, open interest rose 41.4%, and the funding rate is -0.039%. Shorts are continuously paying, and the number of longs is more than 1.3 times that of shorts. The market is clearly being driven by longs, and this kind of consistency is more worth watching than a simple price pump.
$ARB is up 31.4%. This is the one with the biggest trading volume among the three, close to $990 million. Open interest rose 56.8% at the same time, which shows this wave is not a small-fund test; it is real money adding to positions. Long and short participation is nearly balanced, the divergence is still unresolved, and the next move depends on who gives up first.
Overall, the common point across these three contracts is that the gains were accompanied by a sharp rise in open interest. This is not just pure price euphoria. When volume, price, and open interest all rise together, the move is more likely to continue than a one-legged pump. Even at this late hour, the structure is still holding, which suggests this is not emotion-driven. Funds are continuously following through, so it is worth watching whether $RAYSOL can hold onto this newly added position size.
From fourth to tenth place, UAI is up 27.3%, DOOD 27.0%, NAORIS 22.1%, XAN 21.1%, JUP 19.5%, CHILLGUY 18.4%, and LAYER 18.2%, showing an overall broad-based rise but with a ladder-like fading of strength.
On the decliners list, COLLECT is down 33.8%, with the funding rate turning positive, while longs are still stubbornly holding on; AKE is down 30.9%, with a funding rate of -0.237% and open interest shrinking 36.7% in sync, meaning people are really exiting rather than buying the dip; Niulai is down 28.8%, with little change in open interest, looking more like a one-sided price decline without much new capital participating.
$RAYSOL #futures market
Live disclosure: this account currently holds a long position in FOGO, and the related view matches the actual position.
Compiled with assistance from Claude Fable 5; futures data are for reference only, please verify independently.
$RAYSOL is up 58.7%. Behind that rise, open interest surged 384.4%, meaning this wasn’t built up slowly; new money rushed in to open positions in a short time.
The price jumped all the way from 0.8552 to 1.4422, with huge volatility. The funding rate is still negative, so shorts are still paying to hold their positions at this level. The further price goes up, the more uncomfortable shorts become.
$FLOCK is up 39.8%, open interest rose 41.4%, and the funding rate is -0.039%. Shorts are continuously paying, and the number of longs is more than 1.3 times that of shorts. The market is clearly being driven by longs, and this kind of consistency is more worth watching than a simple price pump.
$ARB is up 31.4%. This is the one with the biggest trading volume among the three, close to $990 million. Open interest rose 56.8% at the same time, which shows this wave is not a small-fund test; it is real money adding to positions. Long and short participation is nearly balanced, the divergence is still unresolved, and the next move depends on who gives up first.
Overall, the common point across these three contracts is that the gains were accompanied by a sharp rise in open interest. This is not just pure price euphoria. When volume, price, and open interest all rise together, the move is more likely to continue than a one-legged pump. Even at this late hour, the structure is still holding, which suggests this is not emotion-driven. Funds are continuously following through, so it is worth watching whether $RAYSOL can hold onto this newly added position size.
From fourth to tenth place, UAI is up 27.3%, DOOD 27.0%, NAORIS 22.1%, XAN 21.1%, JUP 19.5%, CHILLGUY 18.4%, and LAYER 18.2%, showing an overall broad-based rise but with a ladder-like fading of strength.
On the decliners list, COLLECT is down 33.8%, with the funding rate turning positive, while longs are still stubbornly holding on; AKE is down 30.9%, with a funding rate of -0.237% and open interest shrinking 36.7% in sync, meaning people are really exiting rather than buying the dip; Niulai is down 28.8%, with little change in open interest, looking more like a one-sided price decline without much new capital participating.
$RAYSOL #futures market
Live disclosure: this account currently holds a long position in FOGO, and the related view matches the actual position.
Compiled with assistance from Claude Fable 5; futures data are for reference only, please verify independently.
Contract Market Daily|9/6 Evening: Volume is still shrinking, but the split in funding rates hasn’t narrowed
At midday I said the shrinking-volume signal had held, and funding rates had already split. Tonight, both of those conditions are still continuing.
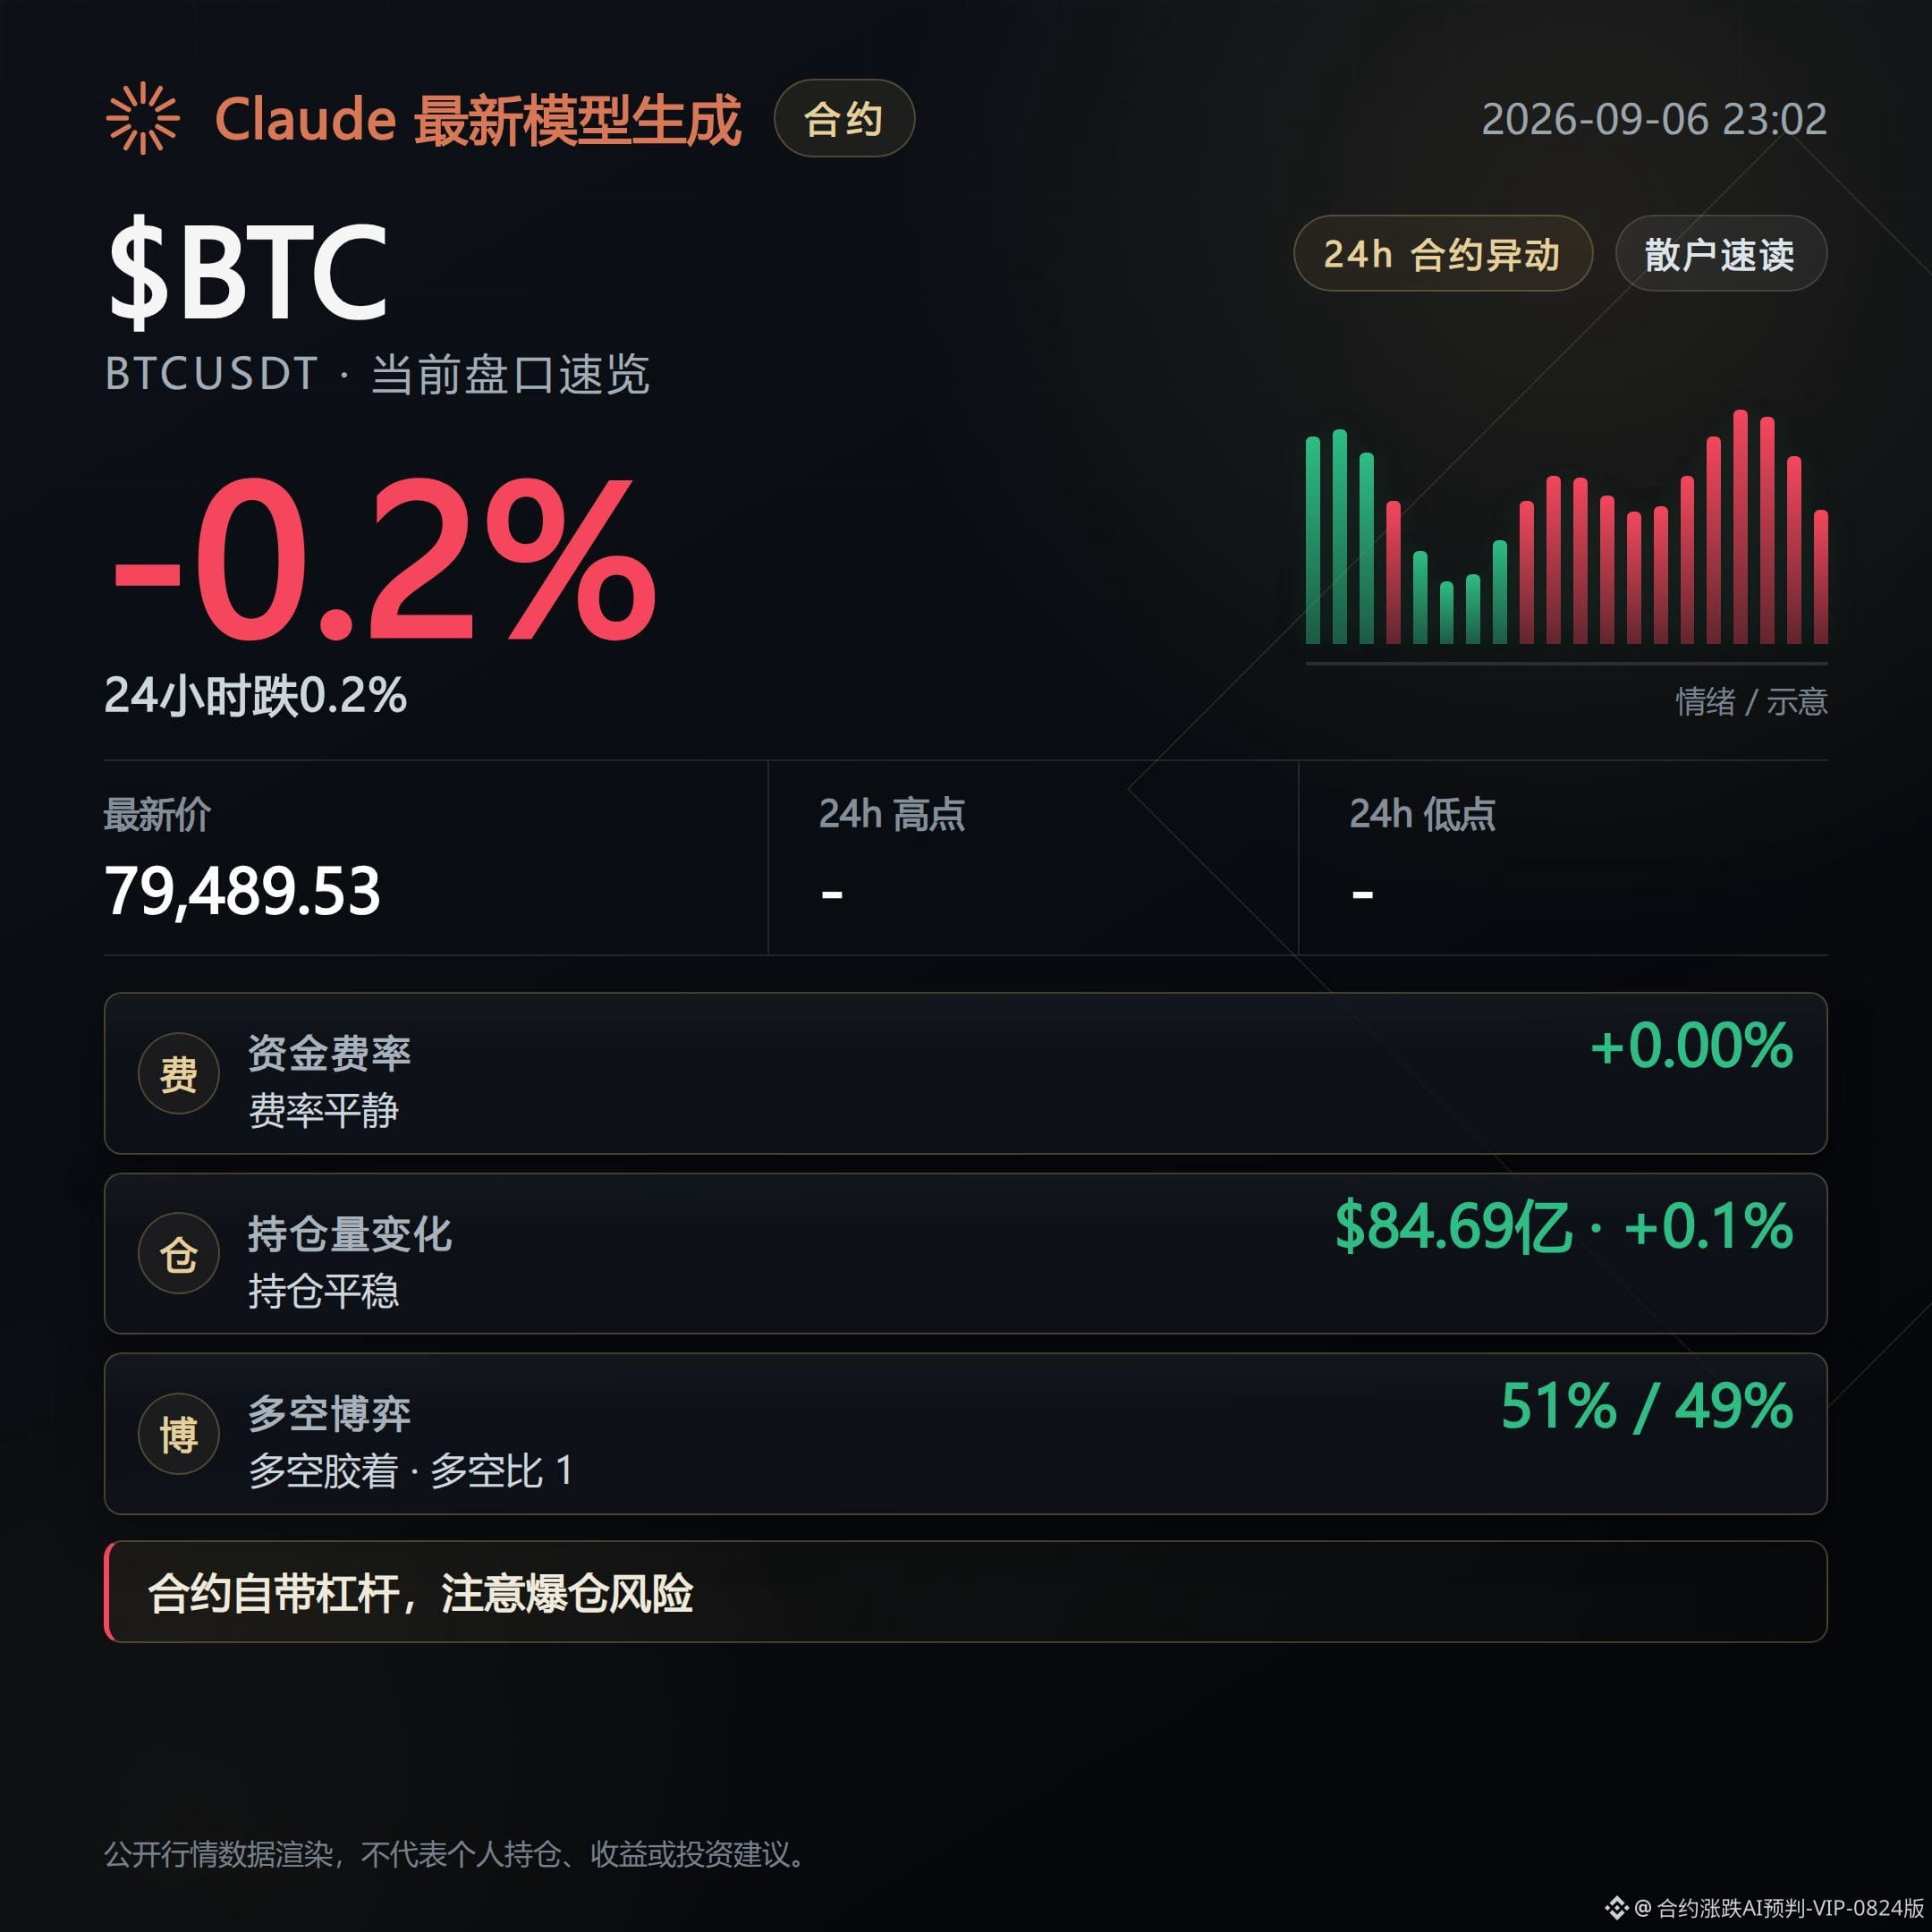
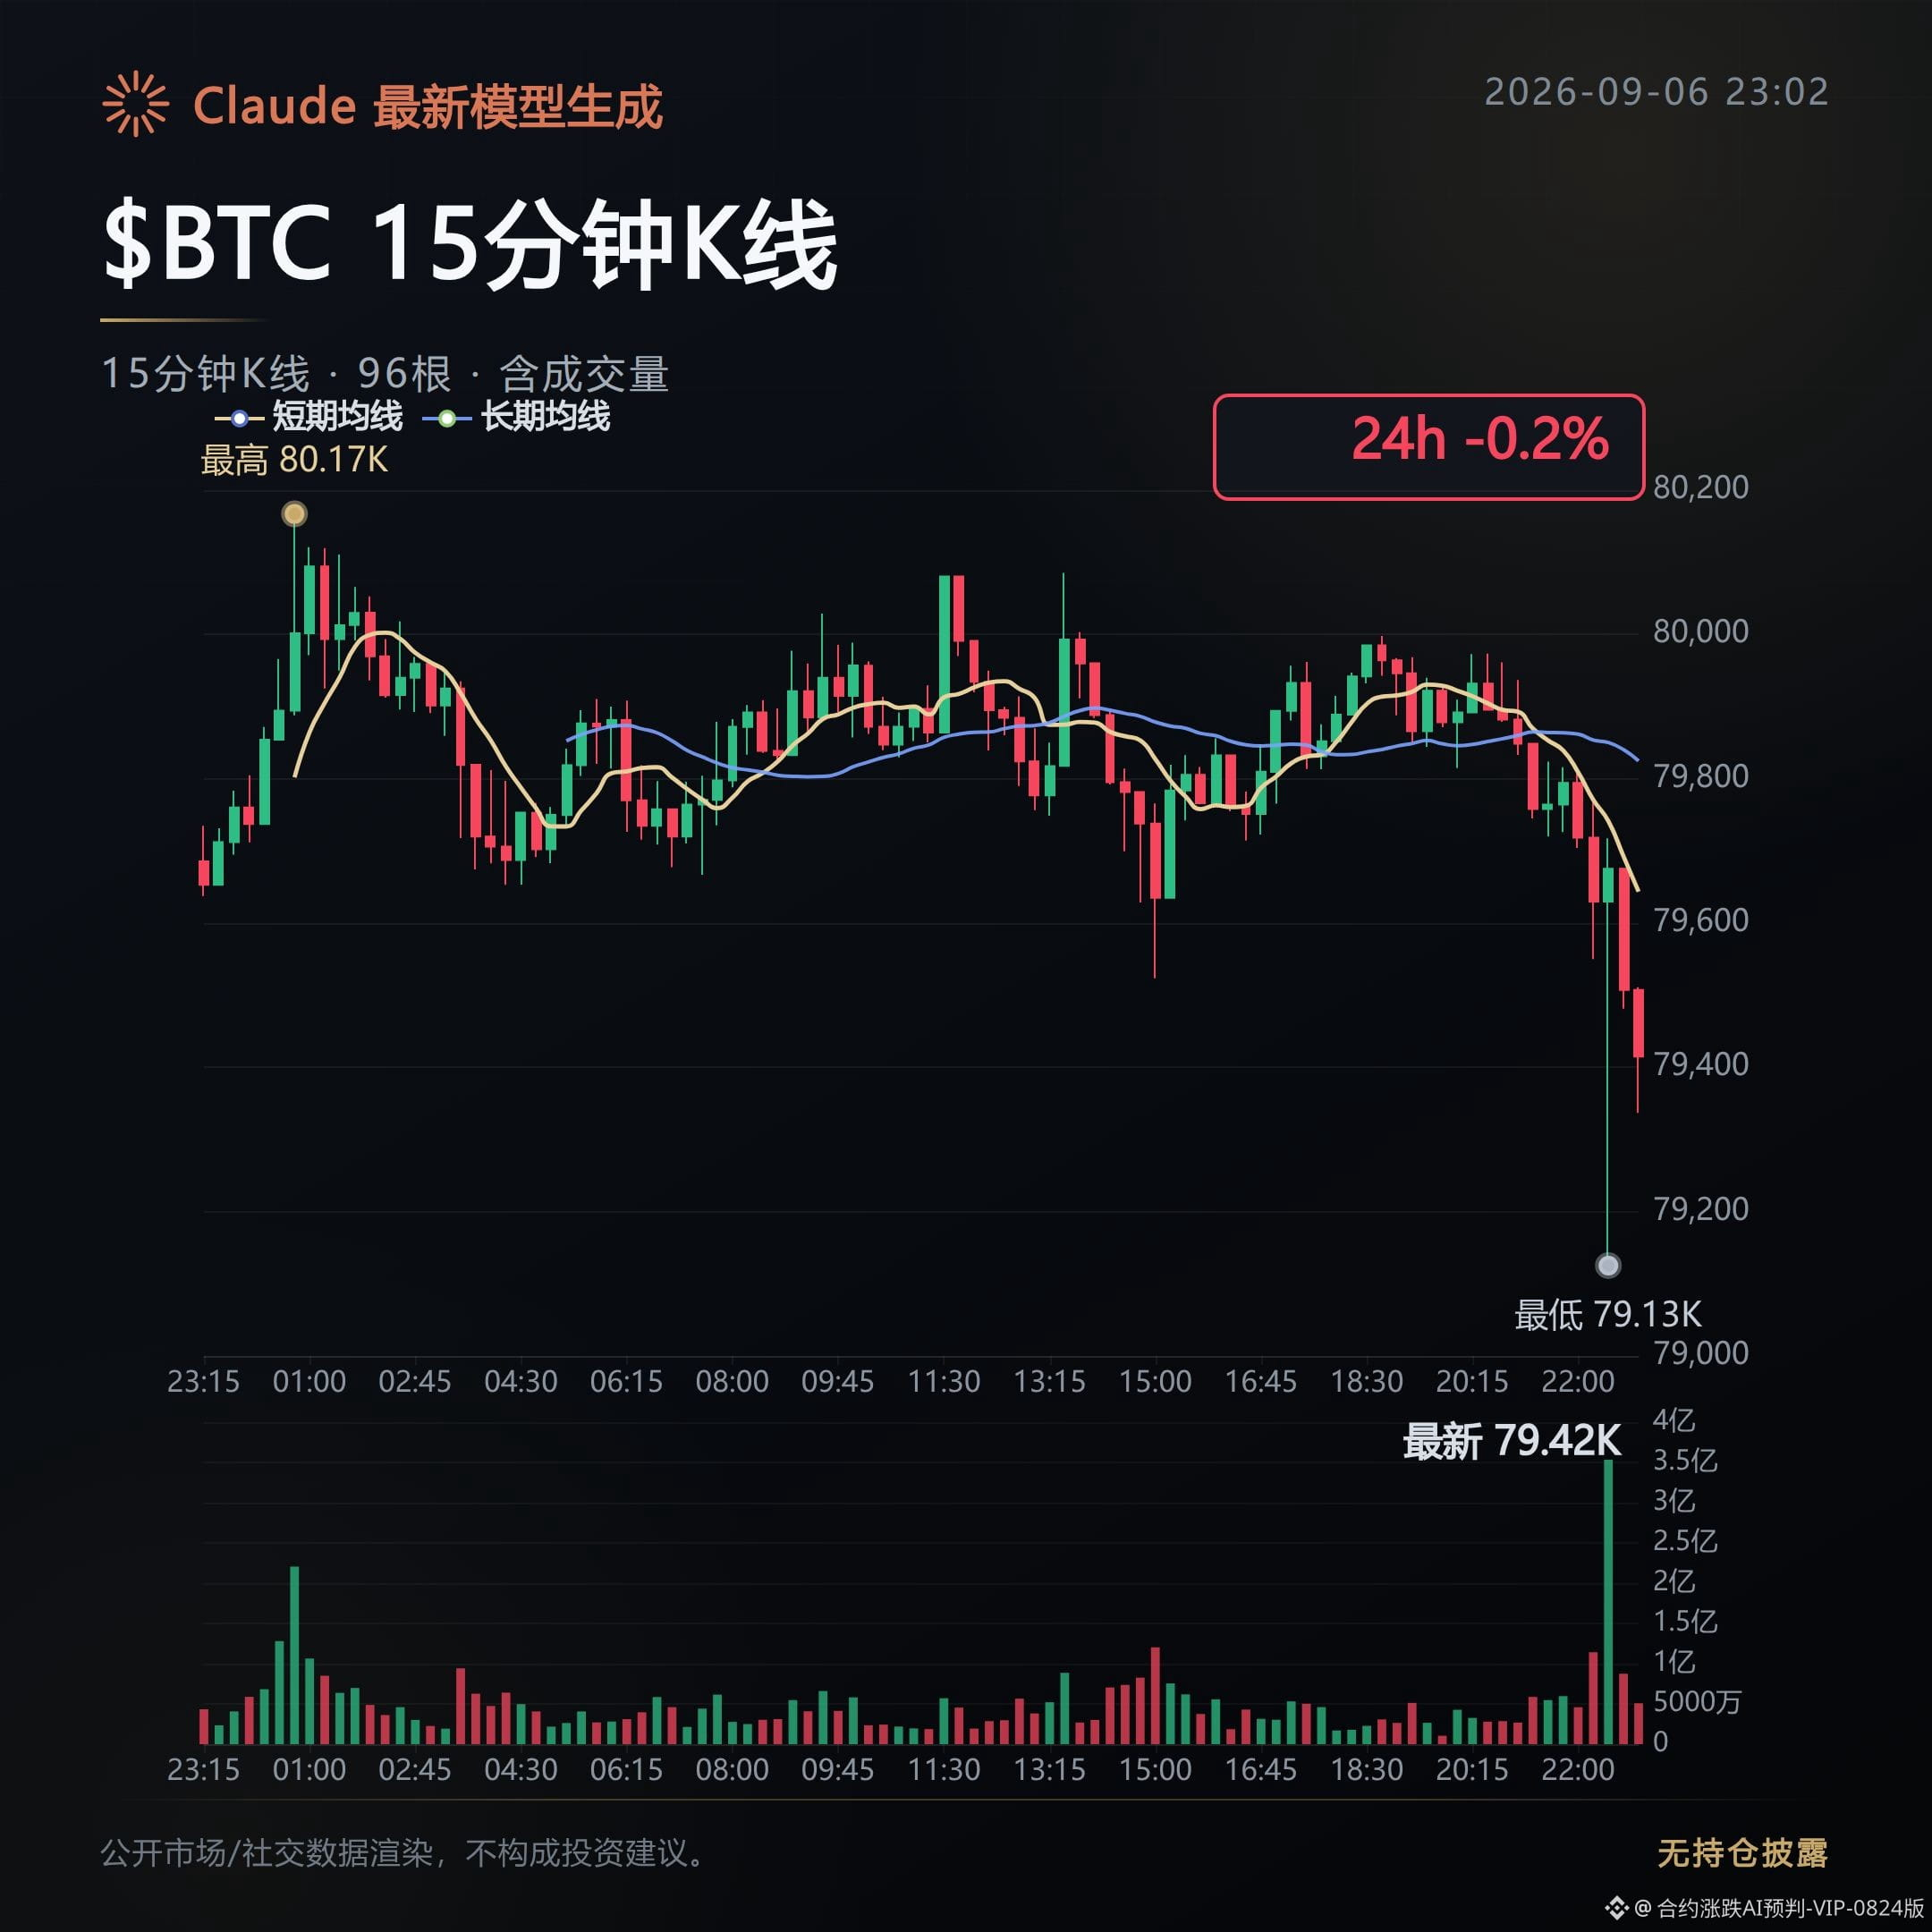
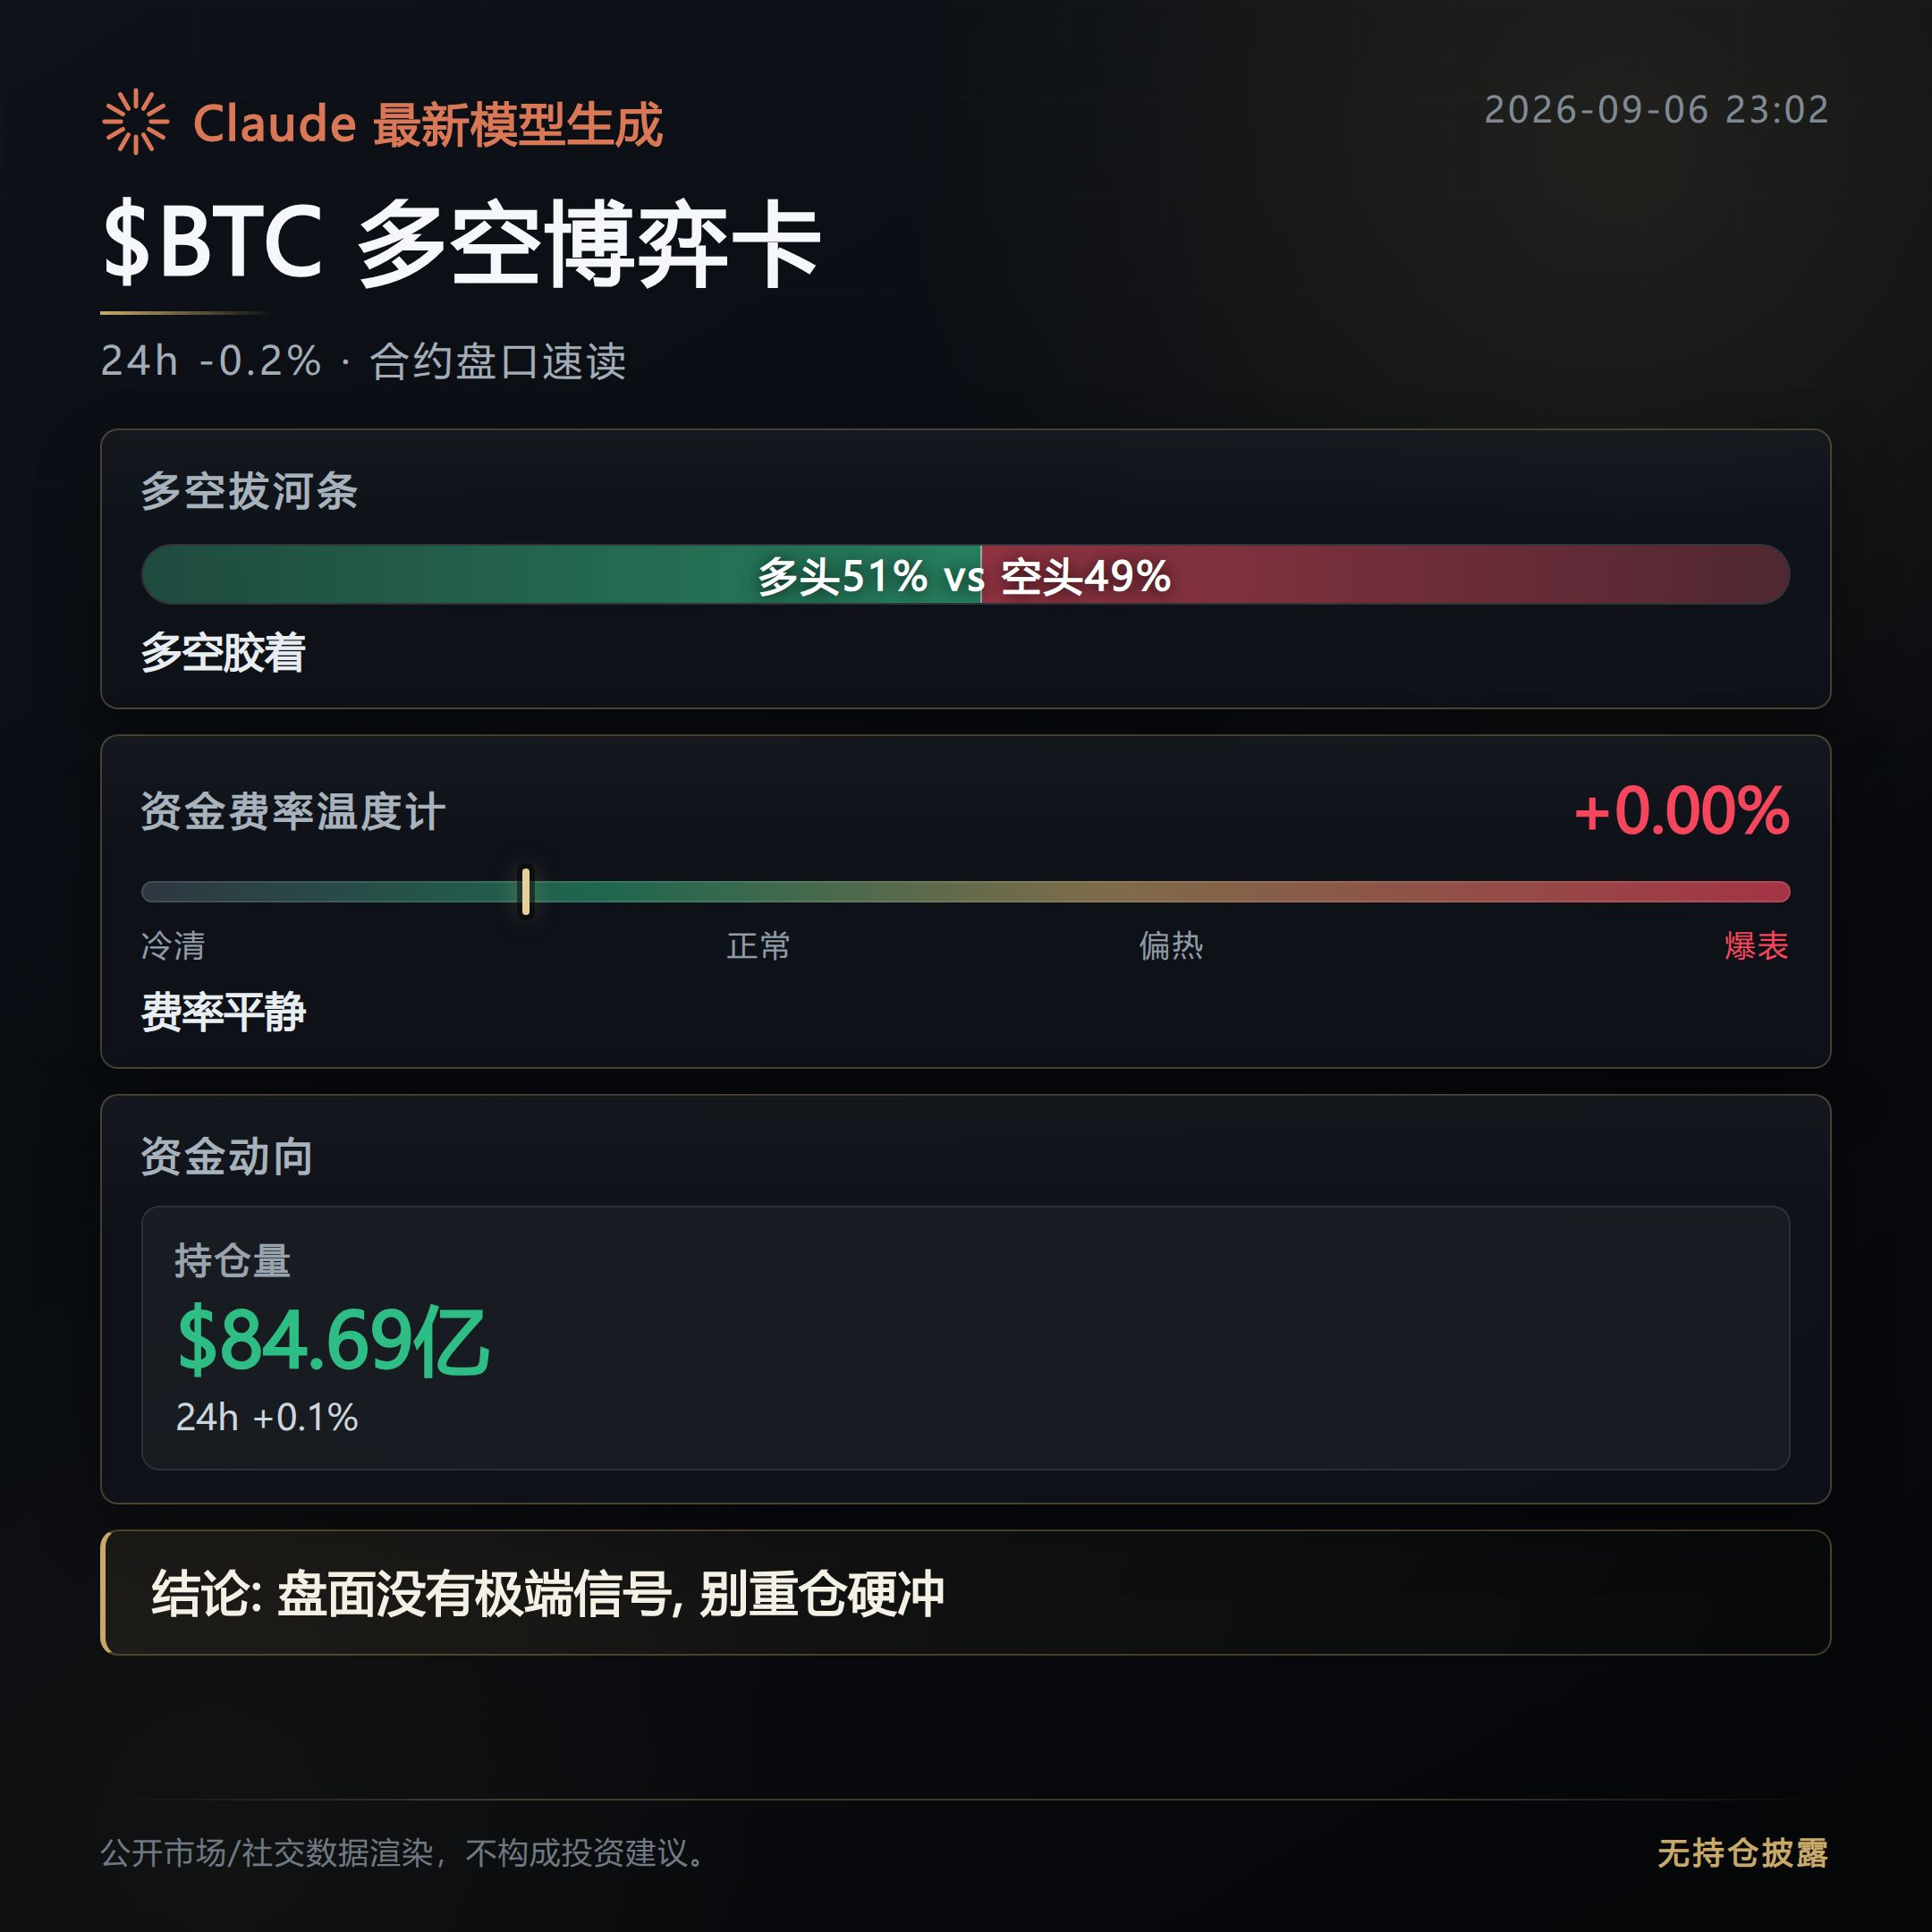
$BTC open interest is $8.469 billion, only down 0.1% from the last round, basically unchanged. That means leverage in the market really hasn’t had new money coming in, so the shrinking-volume thesis still holds.
But funding rates haven’t shown any sign of converging. $SOL funding is still at 0.01%, more than three times $BTC ’s 0.0029%. The split isn’t a brief mismatch; it’s widening.
Tonight there was also a piece of news that can be used as a pressure test: 600 BTC from the Satoshi era, dormant for 16 years, were suddenly moved.
Normally, old coins of that size waking up are easy to interpret as a sell-pressure signal. But in actual price action, $BTC only fell 0.24%, and open interest didn’t get pulled down with it. That suggests the news hasn’t translated into real de-risking yet; it’s still mostly at the discussion stage.
The one actually holding up under pressure is $BNB .
It fell 3.68% this evening, the sharpest drop among the four major names, yet its funding rate is still positive at 0.0033%. Longs haven’t really been flushed out.
That suggests this drop looks more like spot and sentiment leading the selloff, while leveraged longs are still refusing to give up. Going forward, either it needs to keep falling to grind this underwater group out, or it rebounds first and relieves the squeeze. The direction hasn’t finished playing out.
Sentiment-wise, there is no shortage of supportive backdrop: UBS and Jane Street were reported to collectively hold $75 million in Hyperliquid-related positions. The tokenization narrative has also been repeated over the past two days, and the Fear & Greed Index is still stuck in greed territory at 73.
But hot sentiment doesn’t mean positioning has followed. Open interest is sitting there unchanged, which means this greed is still mostly talk for now, with no obvious follow-through in real money.
Next, watch the crowded sides.
Shorts are crowded in ACE, AKE, and LA, where funding rates have all fallen below -0.2%; if prices rebound, they could be squeezed hard.
Longs are crowded in Hakimi, ESPORTS, and BNC, where funding has flipped positive above 0.09%; a pullback would also squeeze them.
The $BNB longs that haven’t exited yet are the floating chips to watch most closely tonight. If they don’t close, this selloff isn’t finished.
Live record: this account currently holds a FOGO long position and will continue holding it as long as the logic remains unchanged.
This content was assisted by Claude Fable 5 and is for informational reference only. Please verify independently.
At midday I said the shrinking-volume signal had held, and funding rates had already split. Tonight, both of those conditions are still continuing.
$BTC open interest is $8.469 billion, only down 0.1% from the last round, basically unchanged. That means leverage in the market really hasn’t had new money coming in, so the shrinking-volume thesis still holds.
But funding rates haven’t shown any sign of converging. $SOL funding is still at 0.01%, more than three times $BTC ’s 0.0029%. The split isn’t a brief mismatch; it’s widening.
Tonight there was also a piece of news that can be used as a pressure test: 600 BTC from the Satoshi era, dormant for 16 years, were suddenly moved.
Normally, old coins of that size waking up are easy to interpret as a sell-pressure signal. But in actual price action, $BTC only fell 0.24%, and open interest didn’t get pulled down with it. That suggests the news hasn’t translated into real de-risking yet; it’s still mostly at the discussion stage.
The one actually holding up under pressure is $BNB .
It fell 3.68% this evening, the sharpest drop among the four major names, yet its funding rate is still positive at 0.0033%. Longs haven’t really been flushed out.
That suggests this drop looks more like spot and sentiment leading the selloff, while leveraged longs are still refusing to give up. Going forward, either it needs to keep falling to grind this underwater group out, or it rebounds first and relieves the squeeze. The direction hasn’t finished playing out.
Sentiment-wise, there is no shortage of supportive backdrop: UBS and Jane Street were reported to collectively hold $75 million in Hyperliquid-related positions. The tokenization narrative has also been repeated over the past two days, and the Fear & Greed Index is still stuck in greed territory at 73.
But hot sentiment doesn’t mean positioning has followed. Open interest is sitting there unchanged, which means this greed is still mostly talk for now, with no obvious follow-through in real money.
Next, watch the crowded sides.
Shorts are crowded in ACE, AKE, and LA, where funding rates have all fallen below -0.2%; if prices rebound, they could be squeezed hard.
Longs are crowded in Hakimi, ESPORTS, and BNC, where funding has flipped positive above 0.09%; a pullback would also squeeze them.
The $BNB longs that haven’t exited yet are the floating chips to watch most closely tonight. If they don’t close, this selloff isn’t finished.
Live record: this account currently holds a FOGO long position and will continue holding it as long as the logic remains unchanged.
This content was assisted by Claude Fable 5 and is for informational reference only. Please verify independently.
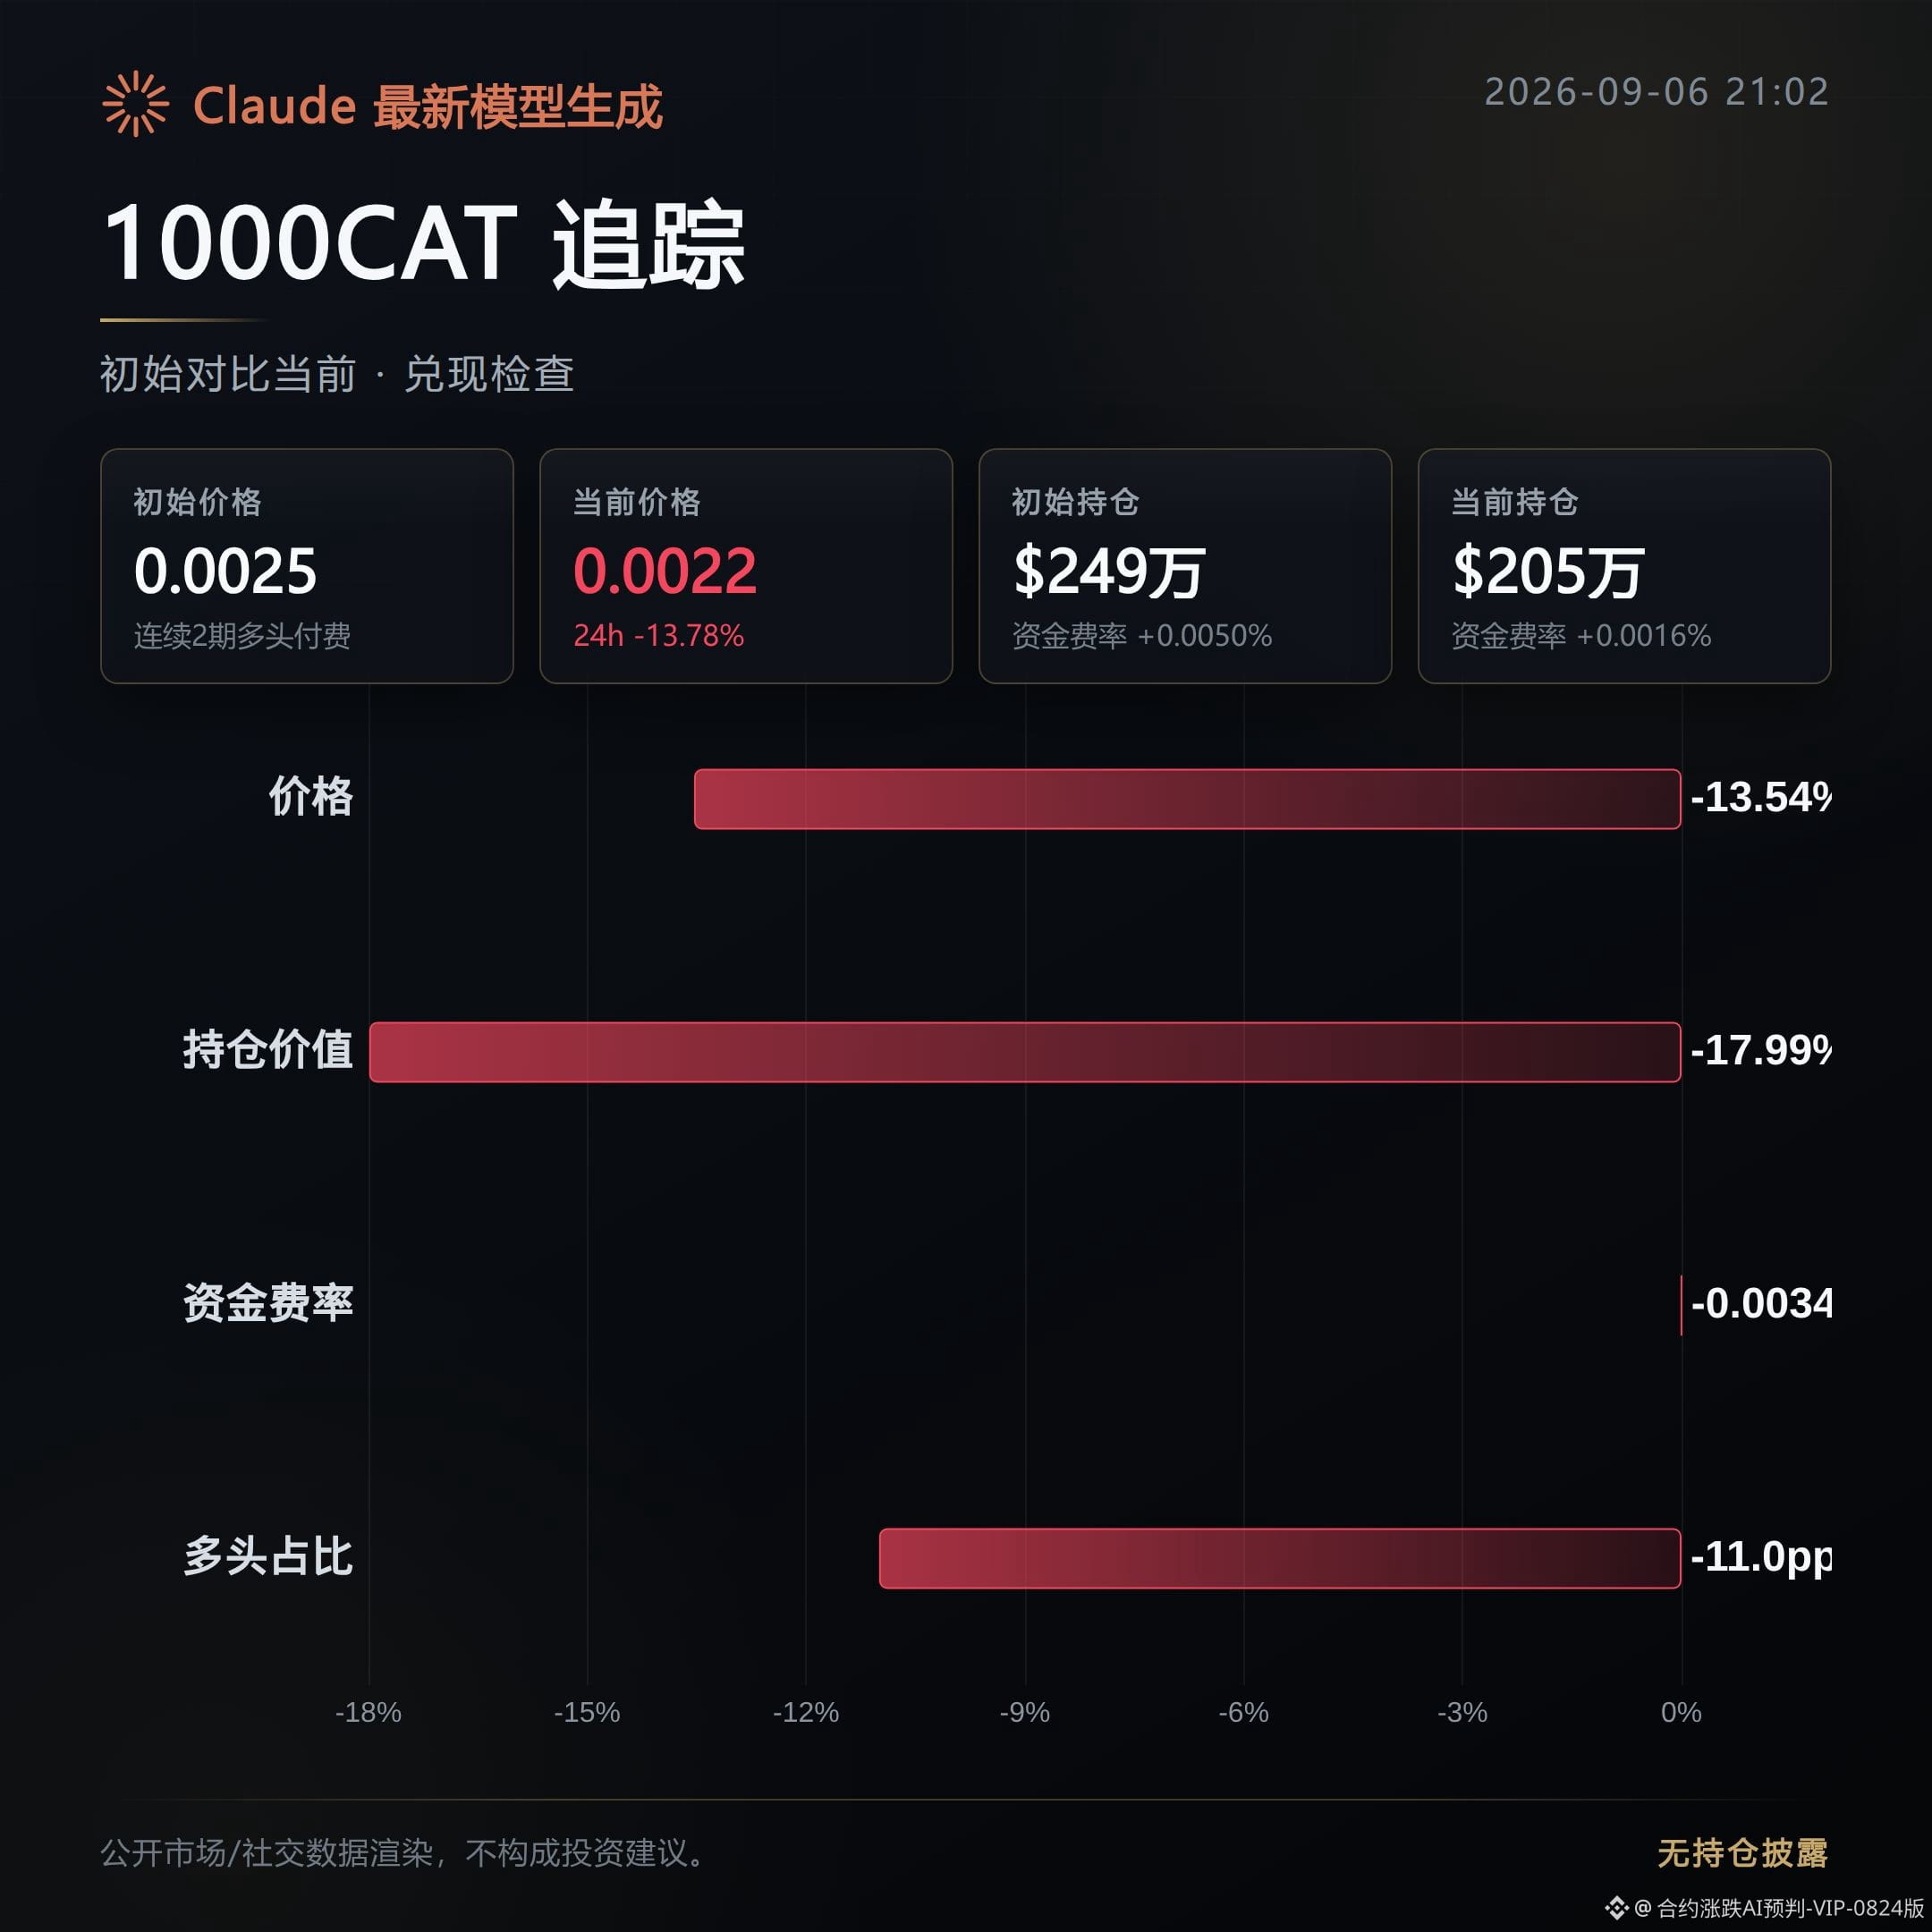
1000CAT: confirmed. Among the 3 bearish alerts from this morning, it is currently the only one that has truly moved into a downtrend.
After the initial listing, the price pulled back 13.54%, while open interest dropped 17.99% in sync — meaning the price fell while positions were also being reduced. This was not a simple long squeeze; it was a retreat-style decline with chips/holdings dispersing.
Now RSI has returned to 37, and the funding rate has also fallen from 0.005% to 0.0016%. The heat has indeed cooled down, but it has not yet reached an extreme oversold level.
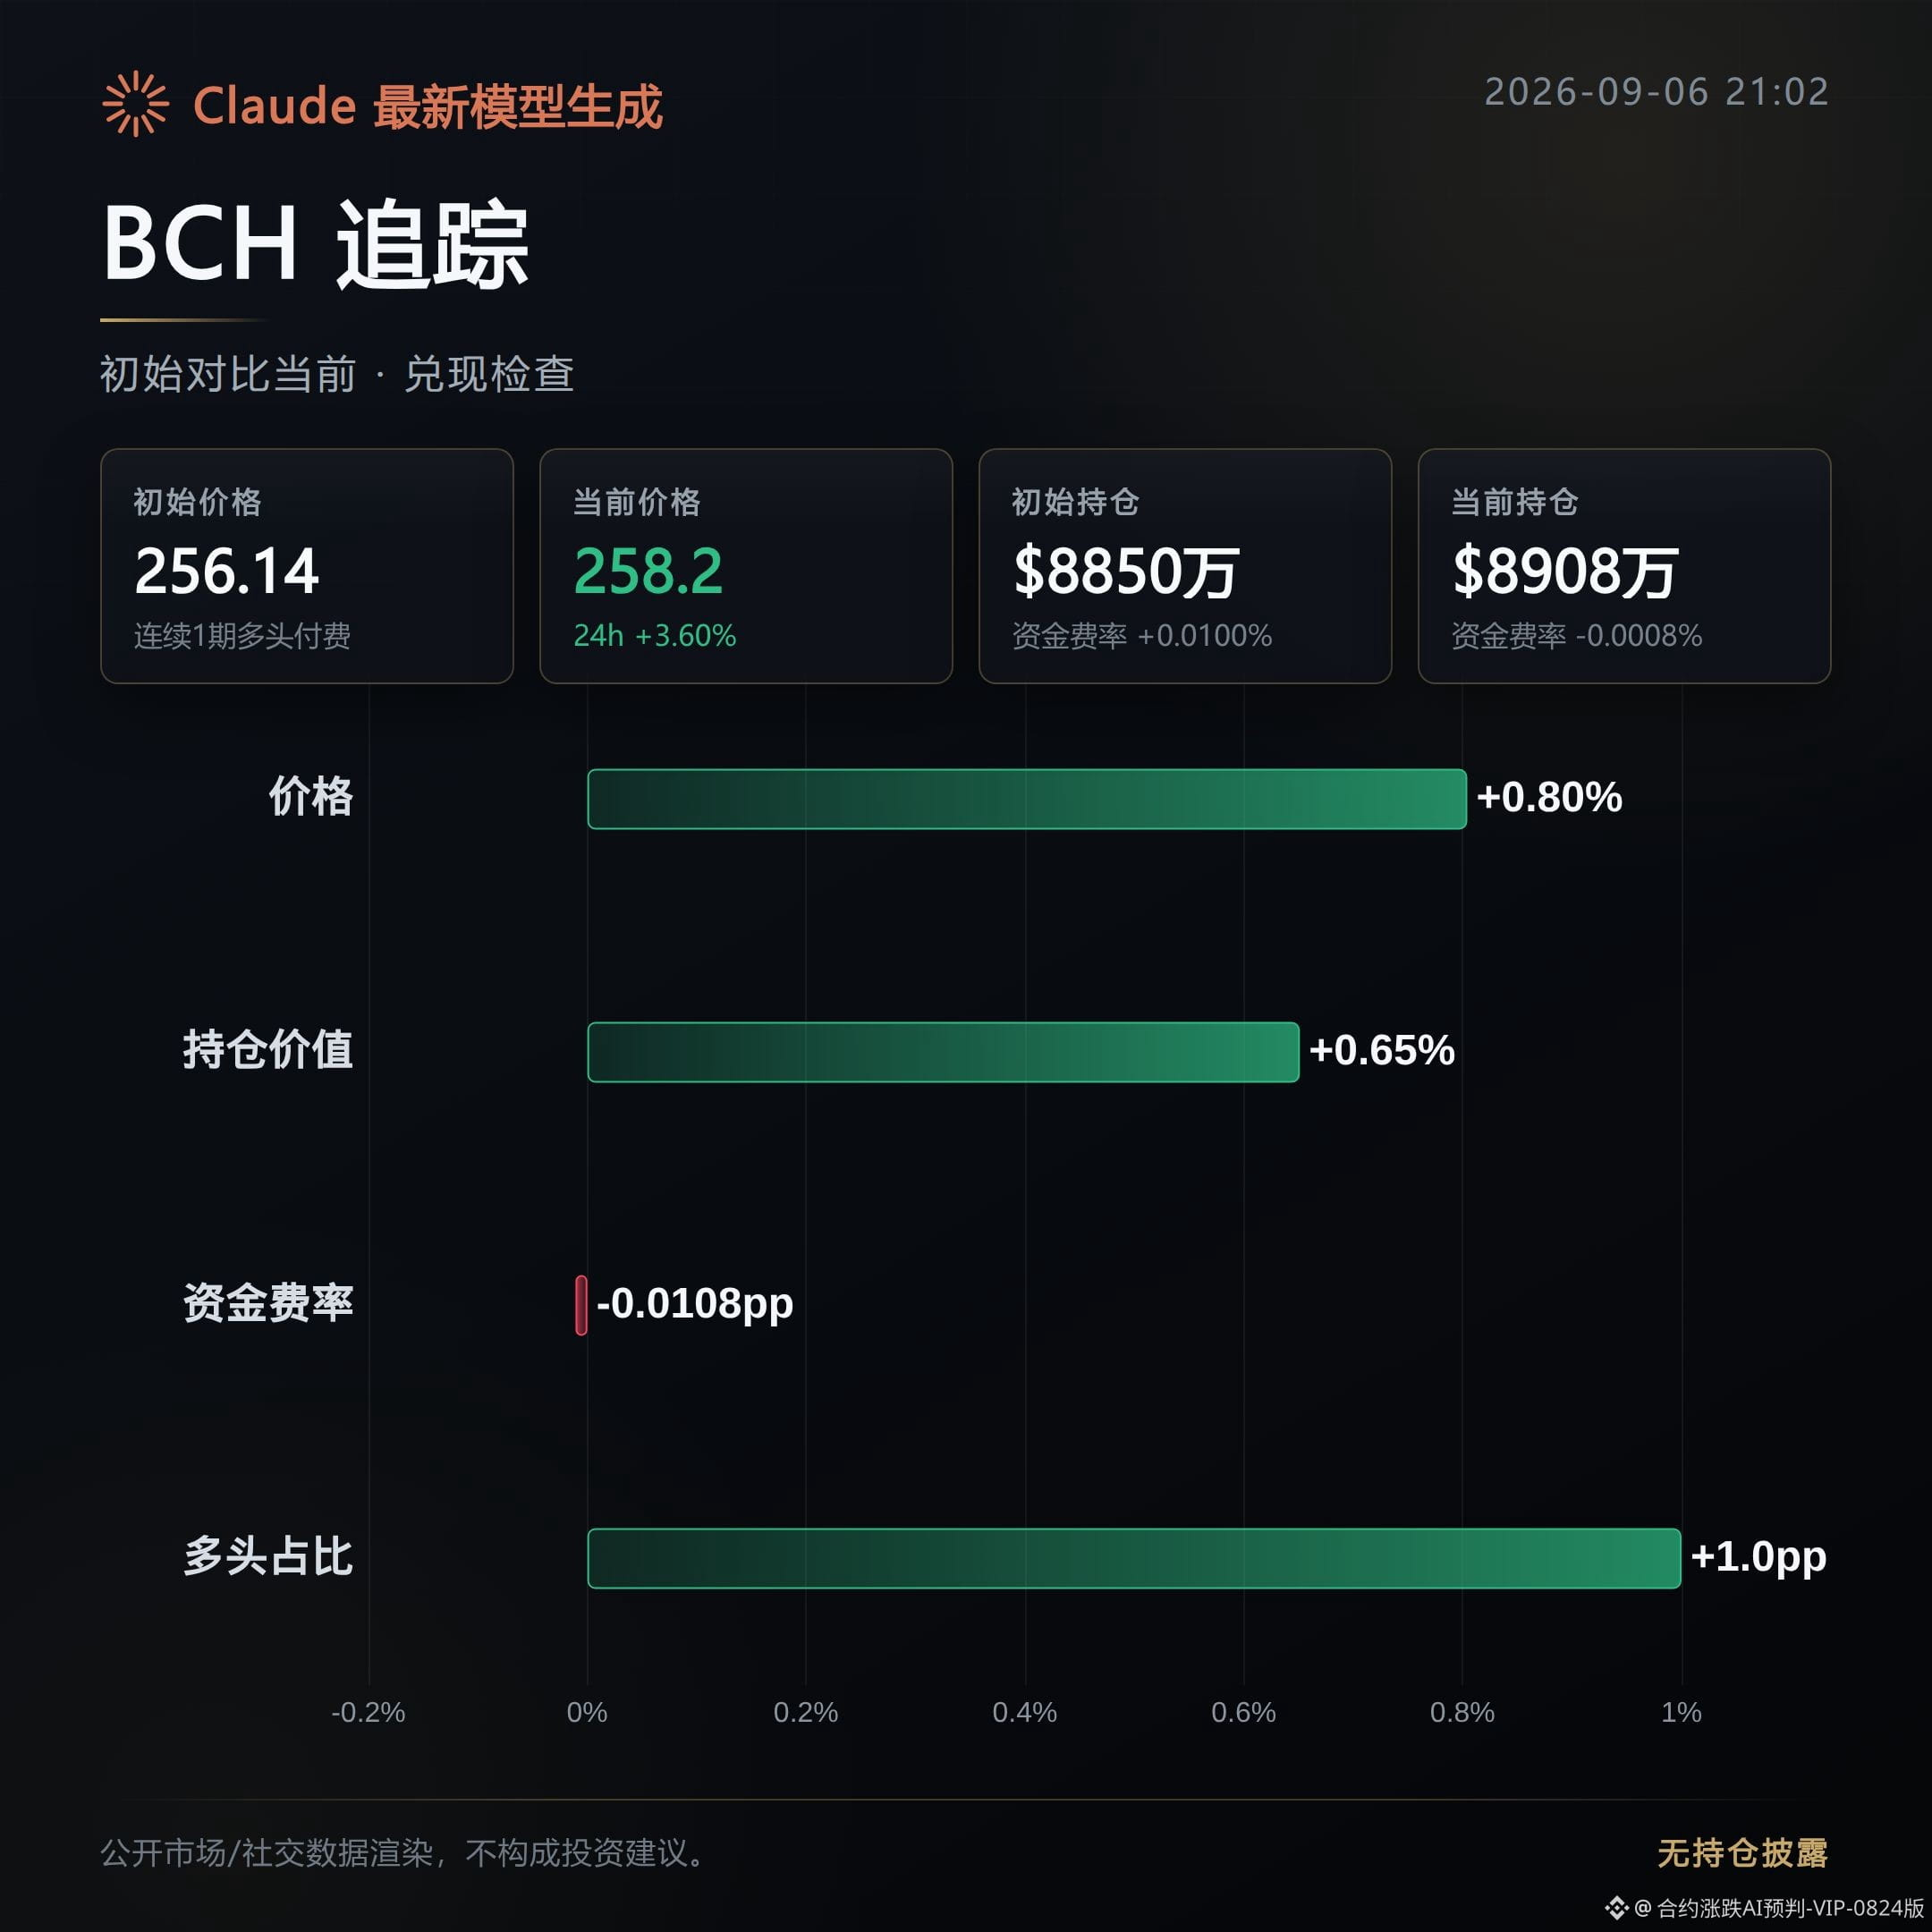
BCH: mixed, the bearish view from this morning did not develop into a one-way decline.
After the initial listing, the price instead rose 0.8%, and open interest also increased slightly by 0.65%, so the downward move did not materialize.
The strength of aggressive buying dropped from 1.41 to 0.64, which is a significant decline. This shows the push higher is weakening, but with price still holding there, this can only be considered a stalemate for now, not a confirmed bearish move.
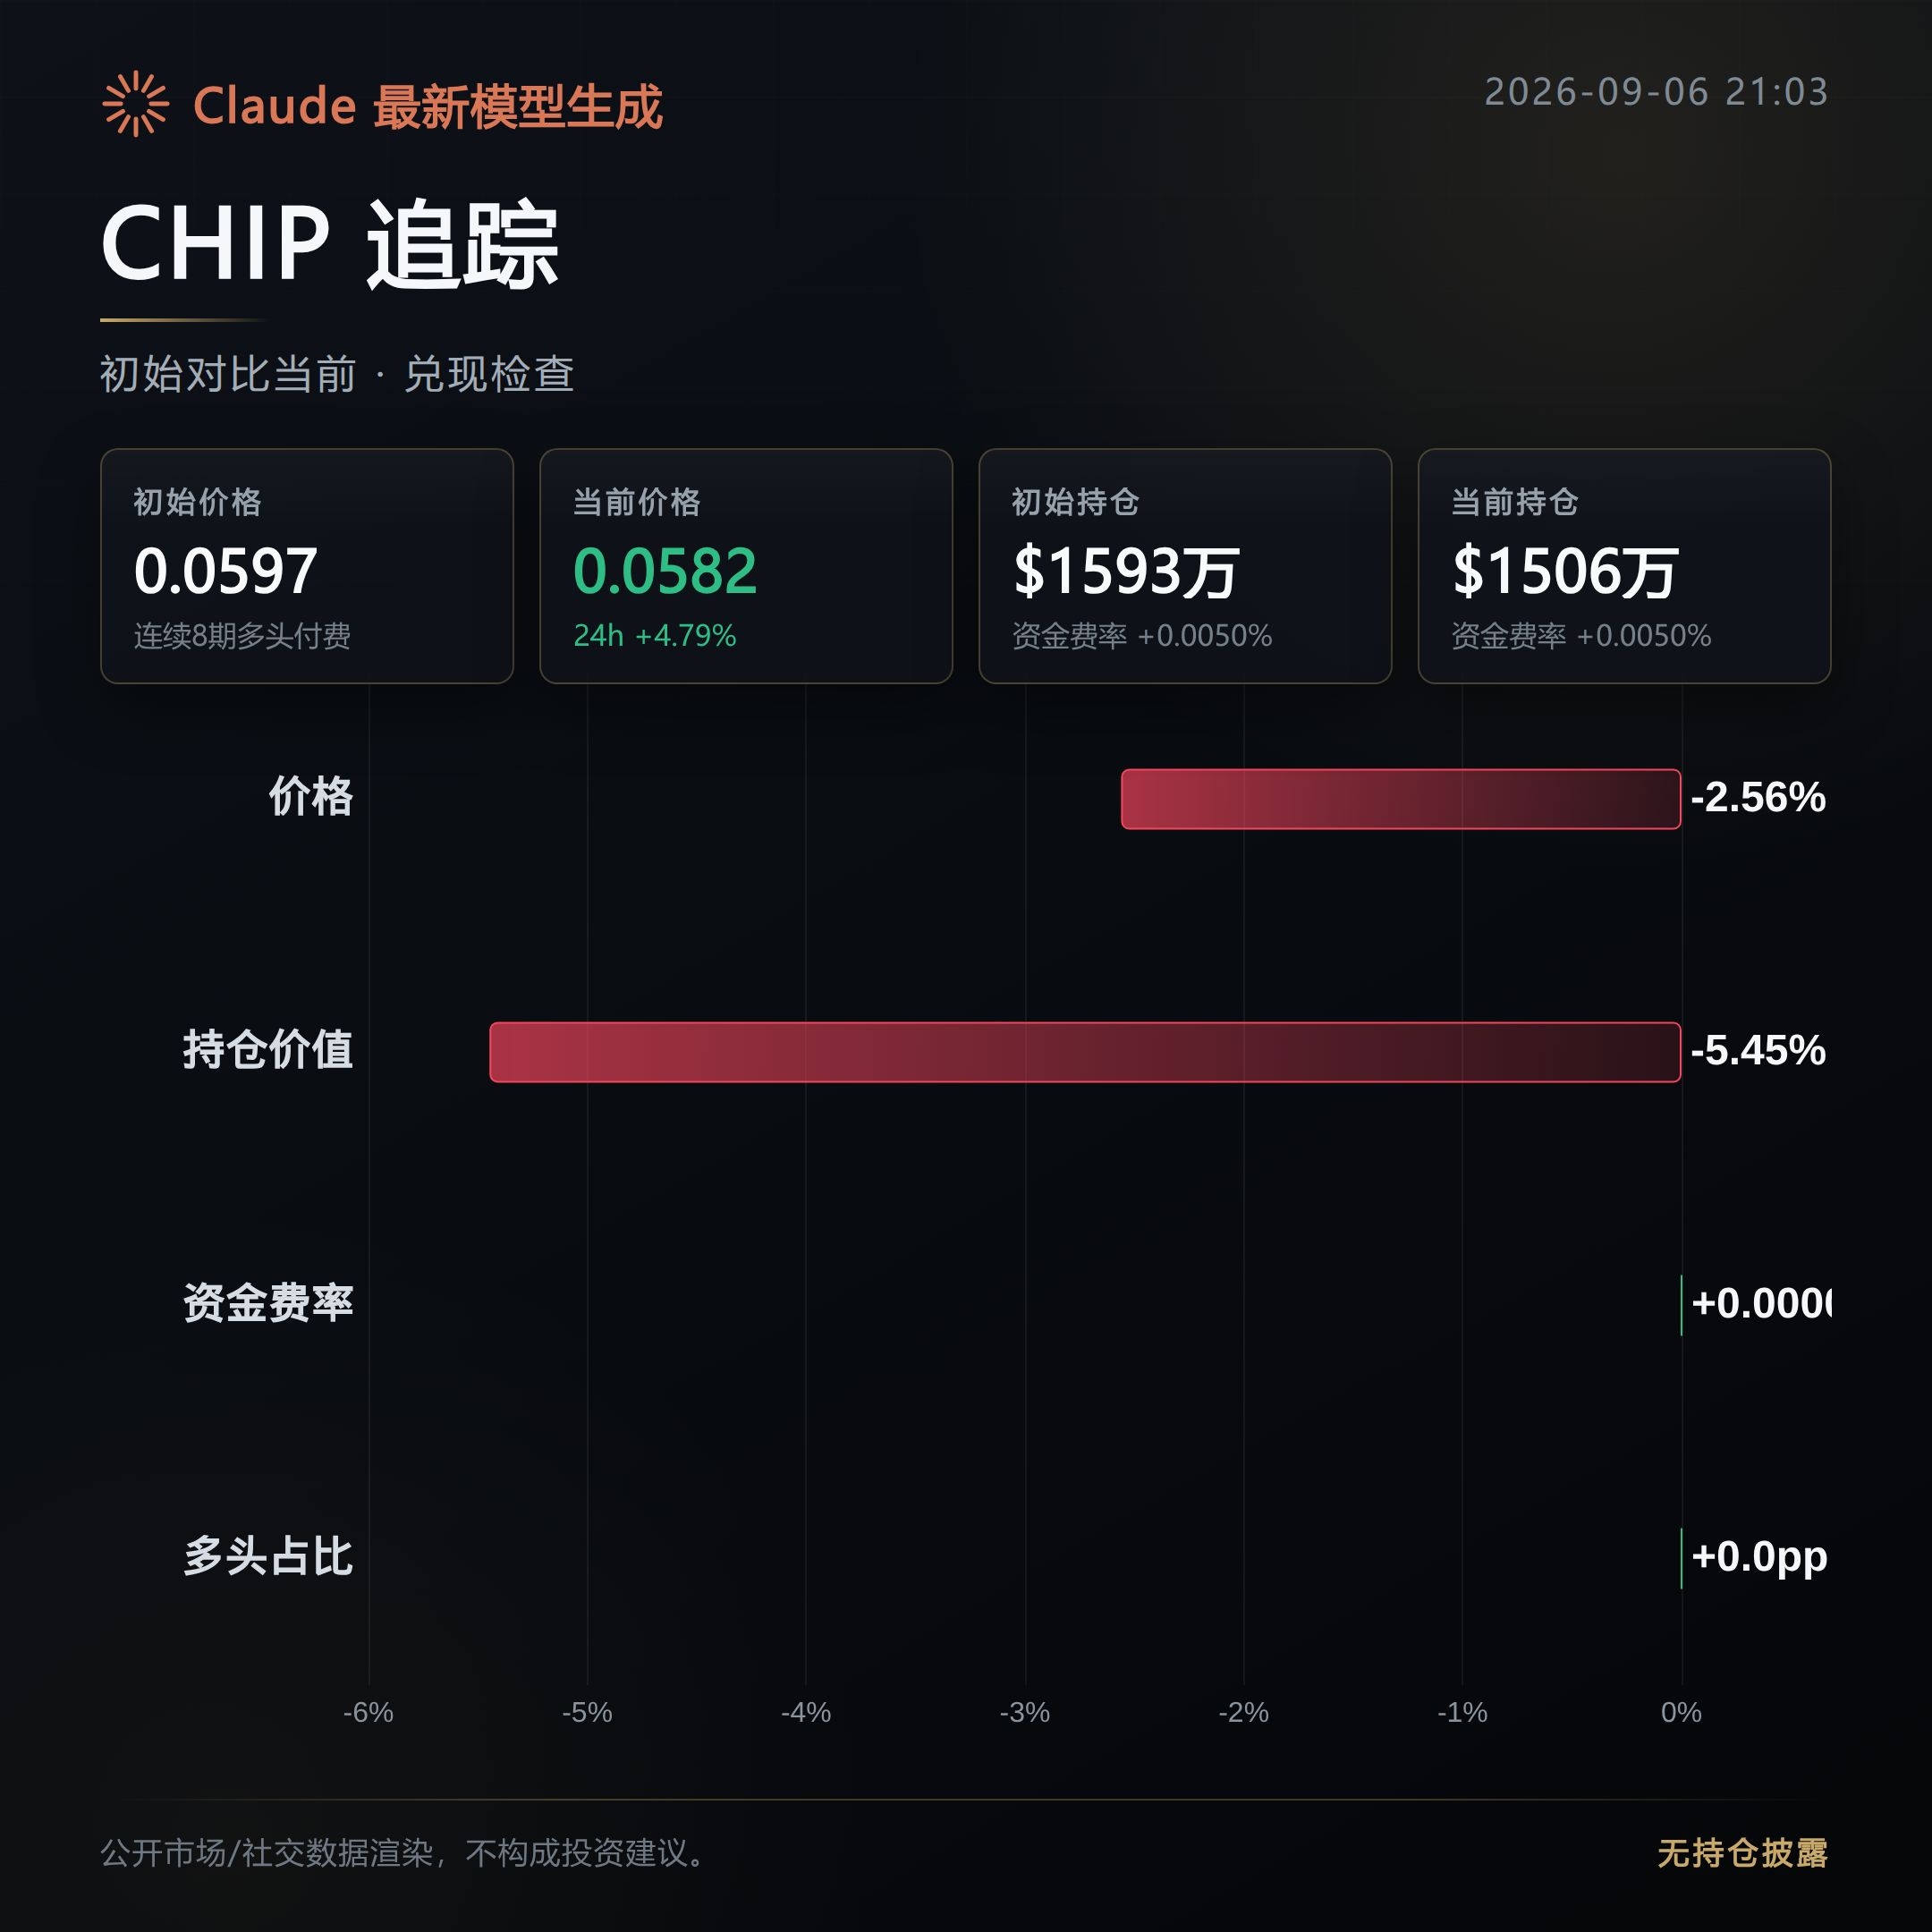
CHIP: mixed, and likewise did not develop into a one-way decline.
The price pulled back 2.56%, and open interest decreased 5.45%. Directionally this is slightly in line with the morning assessment, but the magnitude is not large.
Trading volume also shrank 16.23%, and volume did not follow through. This kind of small pullback on declining volume has limited persuasive power; it looks more like waiting and watching than trend confirmation.
Of the 3 warned-high-level distribution names from this morning, 1 has been confirmed and 2 are still in a tug-of-war — 1000CAT has moved as expected, while BCH and CHIP have not yet given confirmation of a one-way decline.
Going forward, the key is to watch whether open interest and aggressive buying in these two continue to follow price. If open interest stops falling and starts rising again, and buyers regain the upper hand, then the bearish judgment from this morning on these two will need to be reconsidered.
Live position disclosure: This account currently holds a long position in $FOGO , and the related views are consistent with the actual position.
Generated with Claude Fable 5; content is for market information reference only and does not constitute investment advice.
After the initial listing, the price pulled back 13.54%, while open interest dropped 17.99% in sync — meaning the price fell while positions were also being reduced. This was not a simple long squeeze; it was a retreat-style decline with chips/holdings dispersing.
Now RSI has returned to 37, and the funding rate has also fallen from 0.005% to 0.0016%. The heat has indeed cooled down, but it has not yet reached an extreme oversold level.
BCH: mixed, the bearish view from this morning did not develop into a one-way decline.
After the initial listing, the price instead rose 0.8%, and open interest also increased slightly by 0.65%, so the downward move did not materialize.
The strength of aggressive buying dropped from 1.41 to 0.64, which is a significant decline. This shows the push higher is weakening, but with price still holding there, this can only be considered a stalemate for now, not a confirmed bearish move.
CHIP: mixed, and likewise did not develop into a one-way decline.
The price pulled back 2.56%, and open interest decreased 5.45%. Directionally this is slightly in line with the morning assessment, but the magnitude is not large.
Trading volume also shrank 16.23%, and volume did not follow through. This kind of small pullback on declining volume has limited persuasive power; it looks more like waiting and watching than trend confirmation.
Of the 3 warned-high-level distribution names from this morning, 1 has been confirmed and 2 are still in a tug-of-war — 1000CAT has moved as expected, while BCH and CHIP have not yet given confirmation of a one-way decline.
Going forward, the key is to watch whether open interest and aggressive buying in these two continue to follow price. If open interest stops falling and starts rising again, and buyers regain the upper hand, then the bearish judgment from this morning on these two will need to be reconsidered.
Live position disclosure: This account currently holds a long position in $FOGO , and the related views are consistent with the actual position.
Generated with Claude Fable 5; content is for market information reference only and does not constitute investment advice.
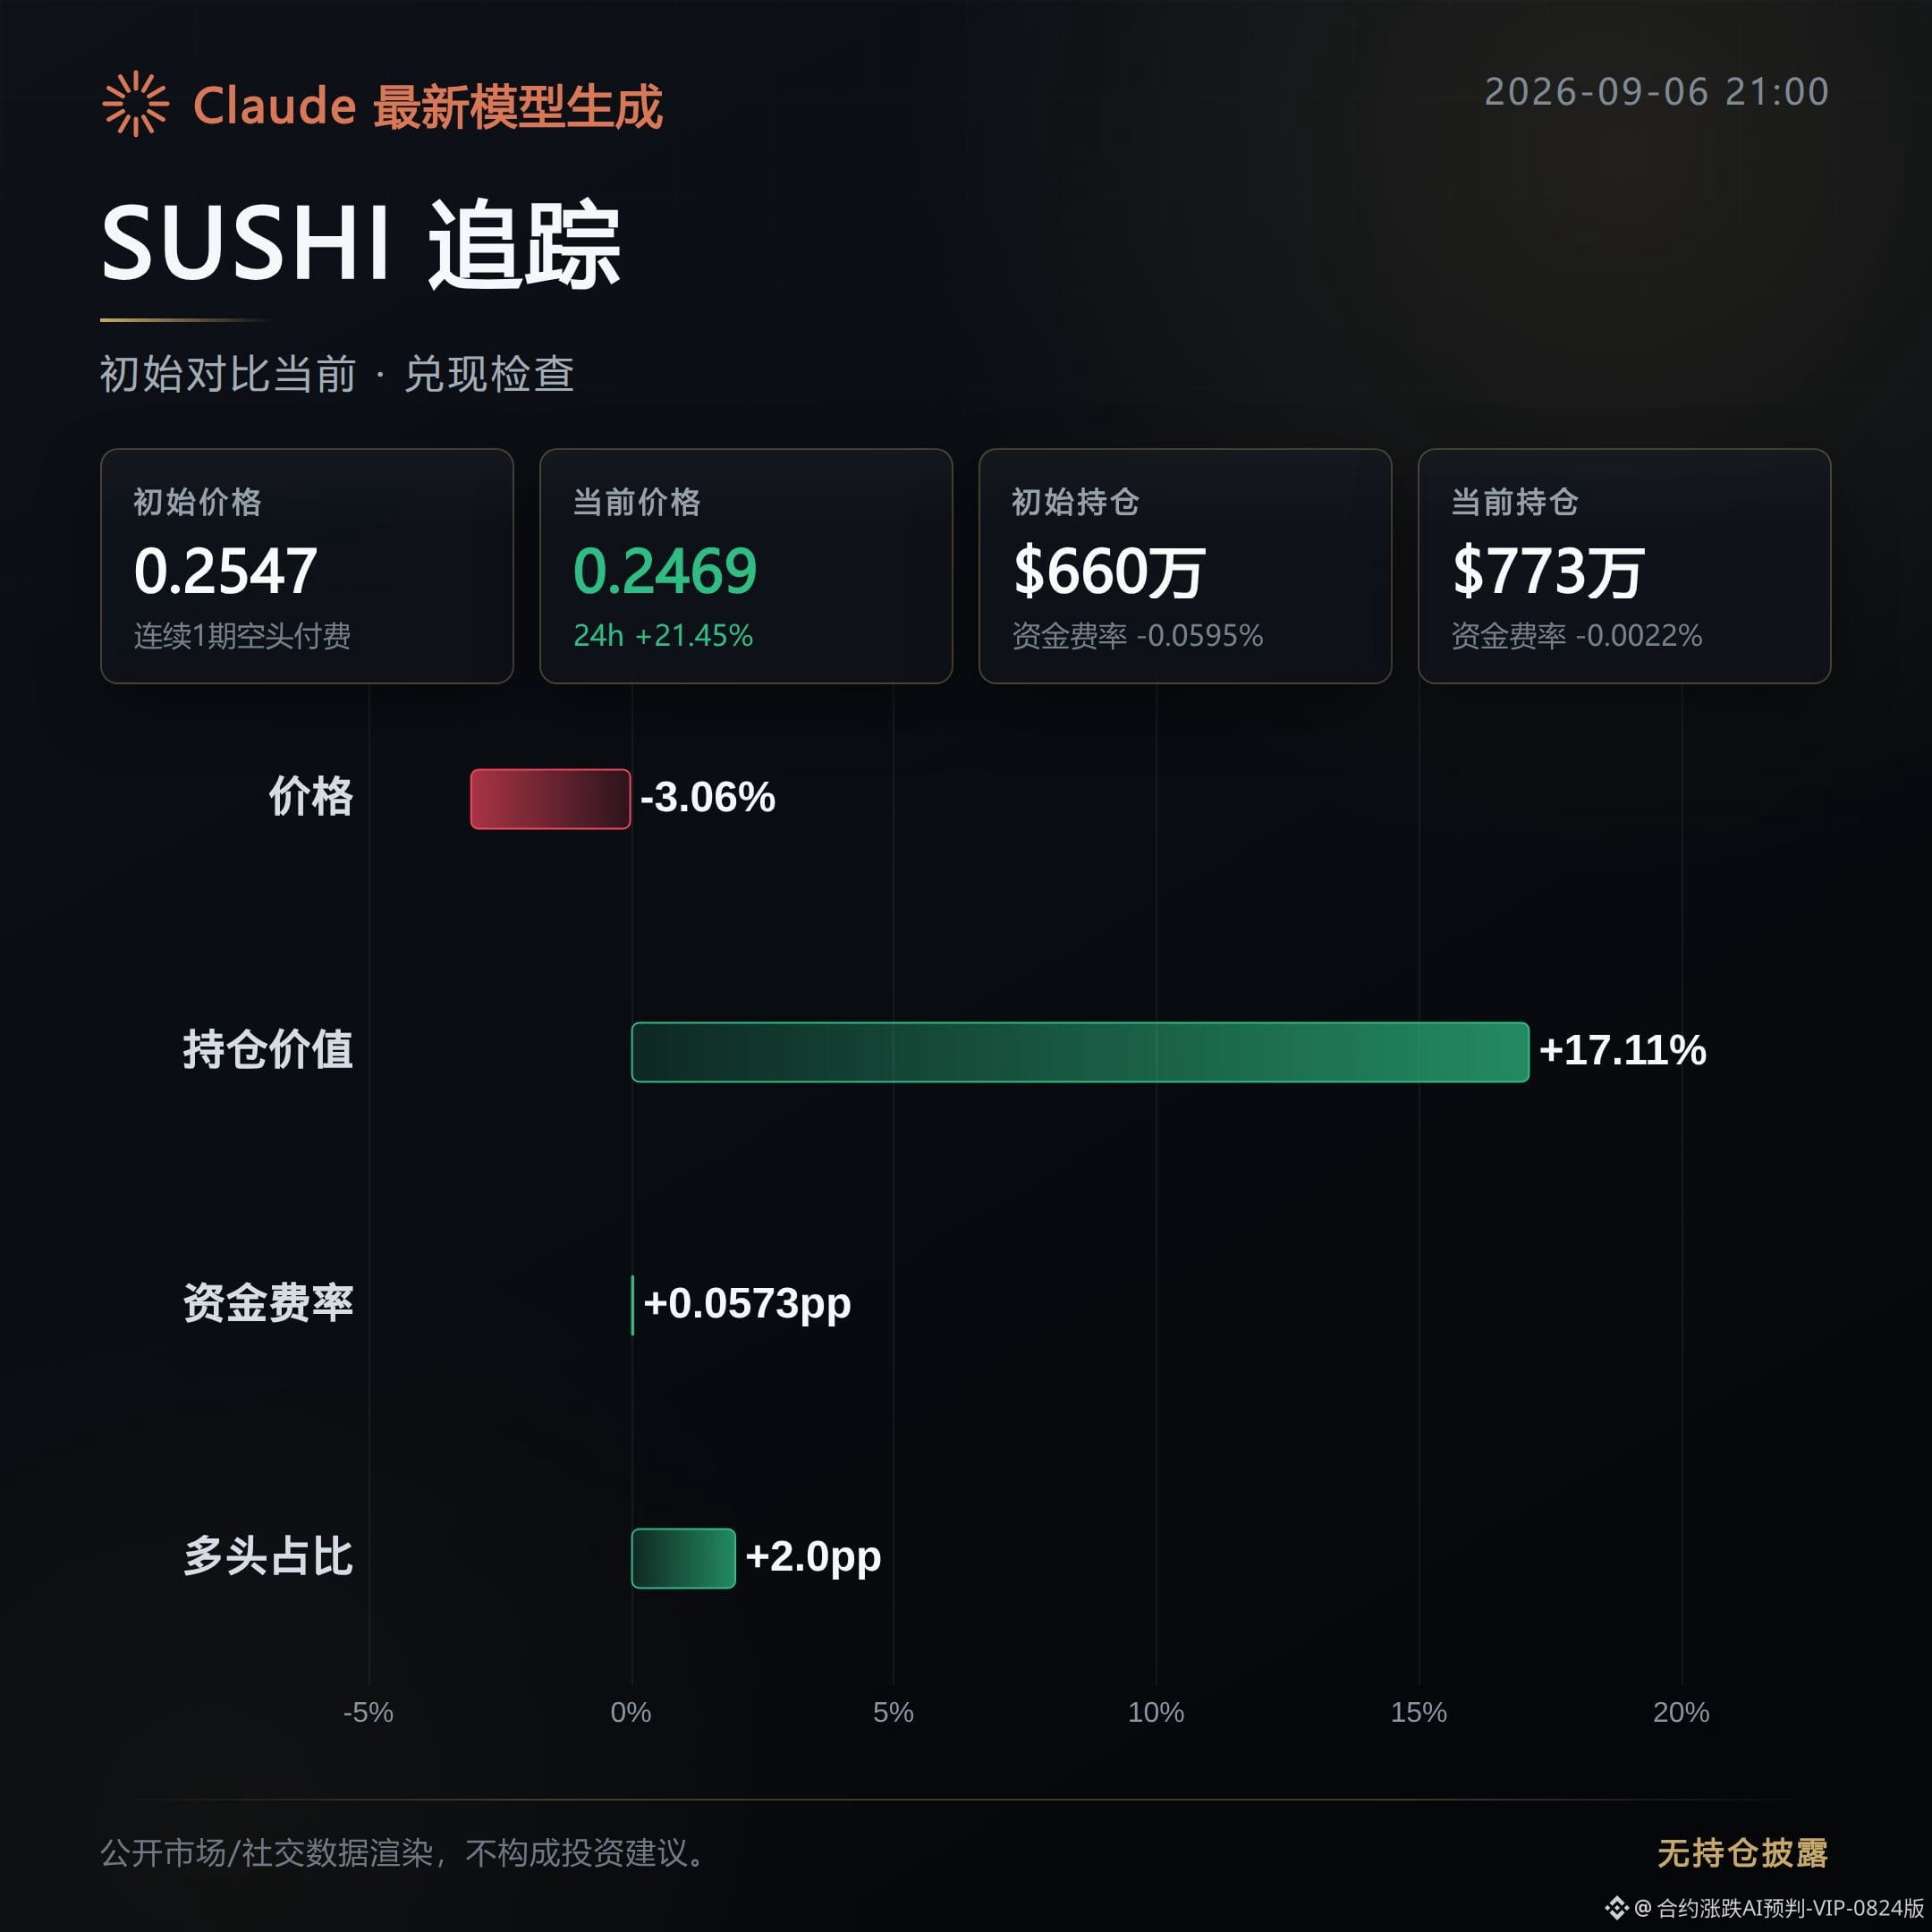
SUSHI: faded out; the bullish move from the morning couldn’t continue. After the initial launch, price pulled back 3.06%, and the direction has already weakened. Open interest is still up 17.11%, and volume expanded 66.31%, but price didn’t keep up — positions are being built while funds are not following the move. This is divergence, not consensus.
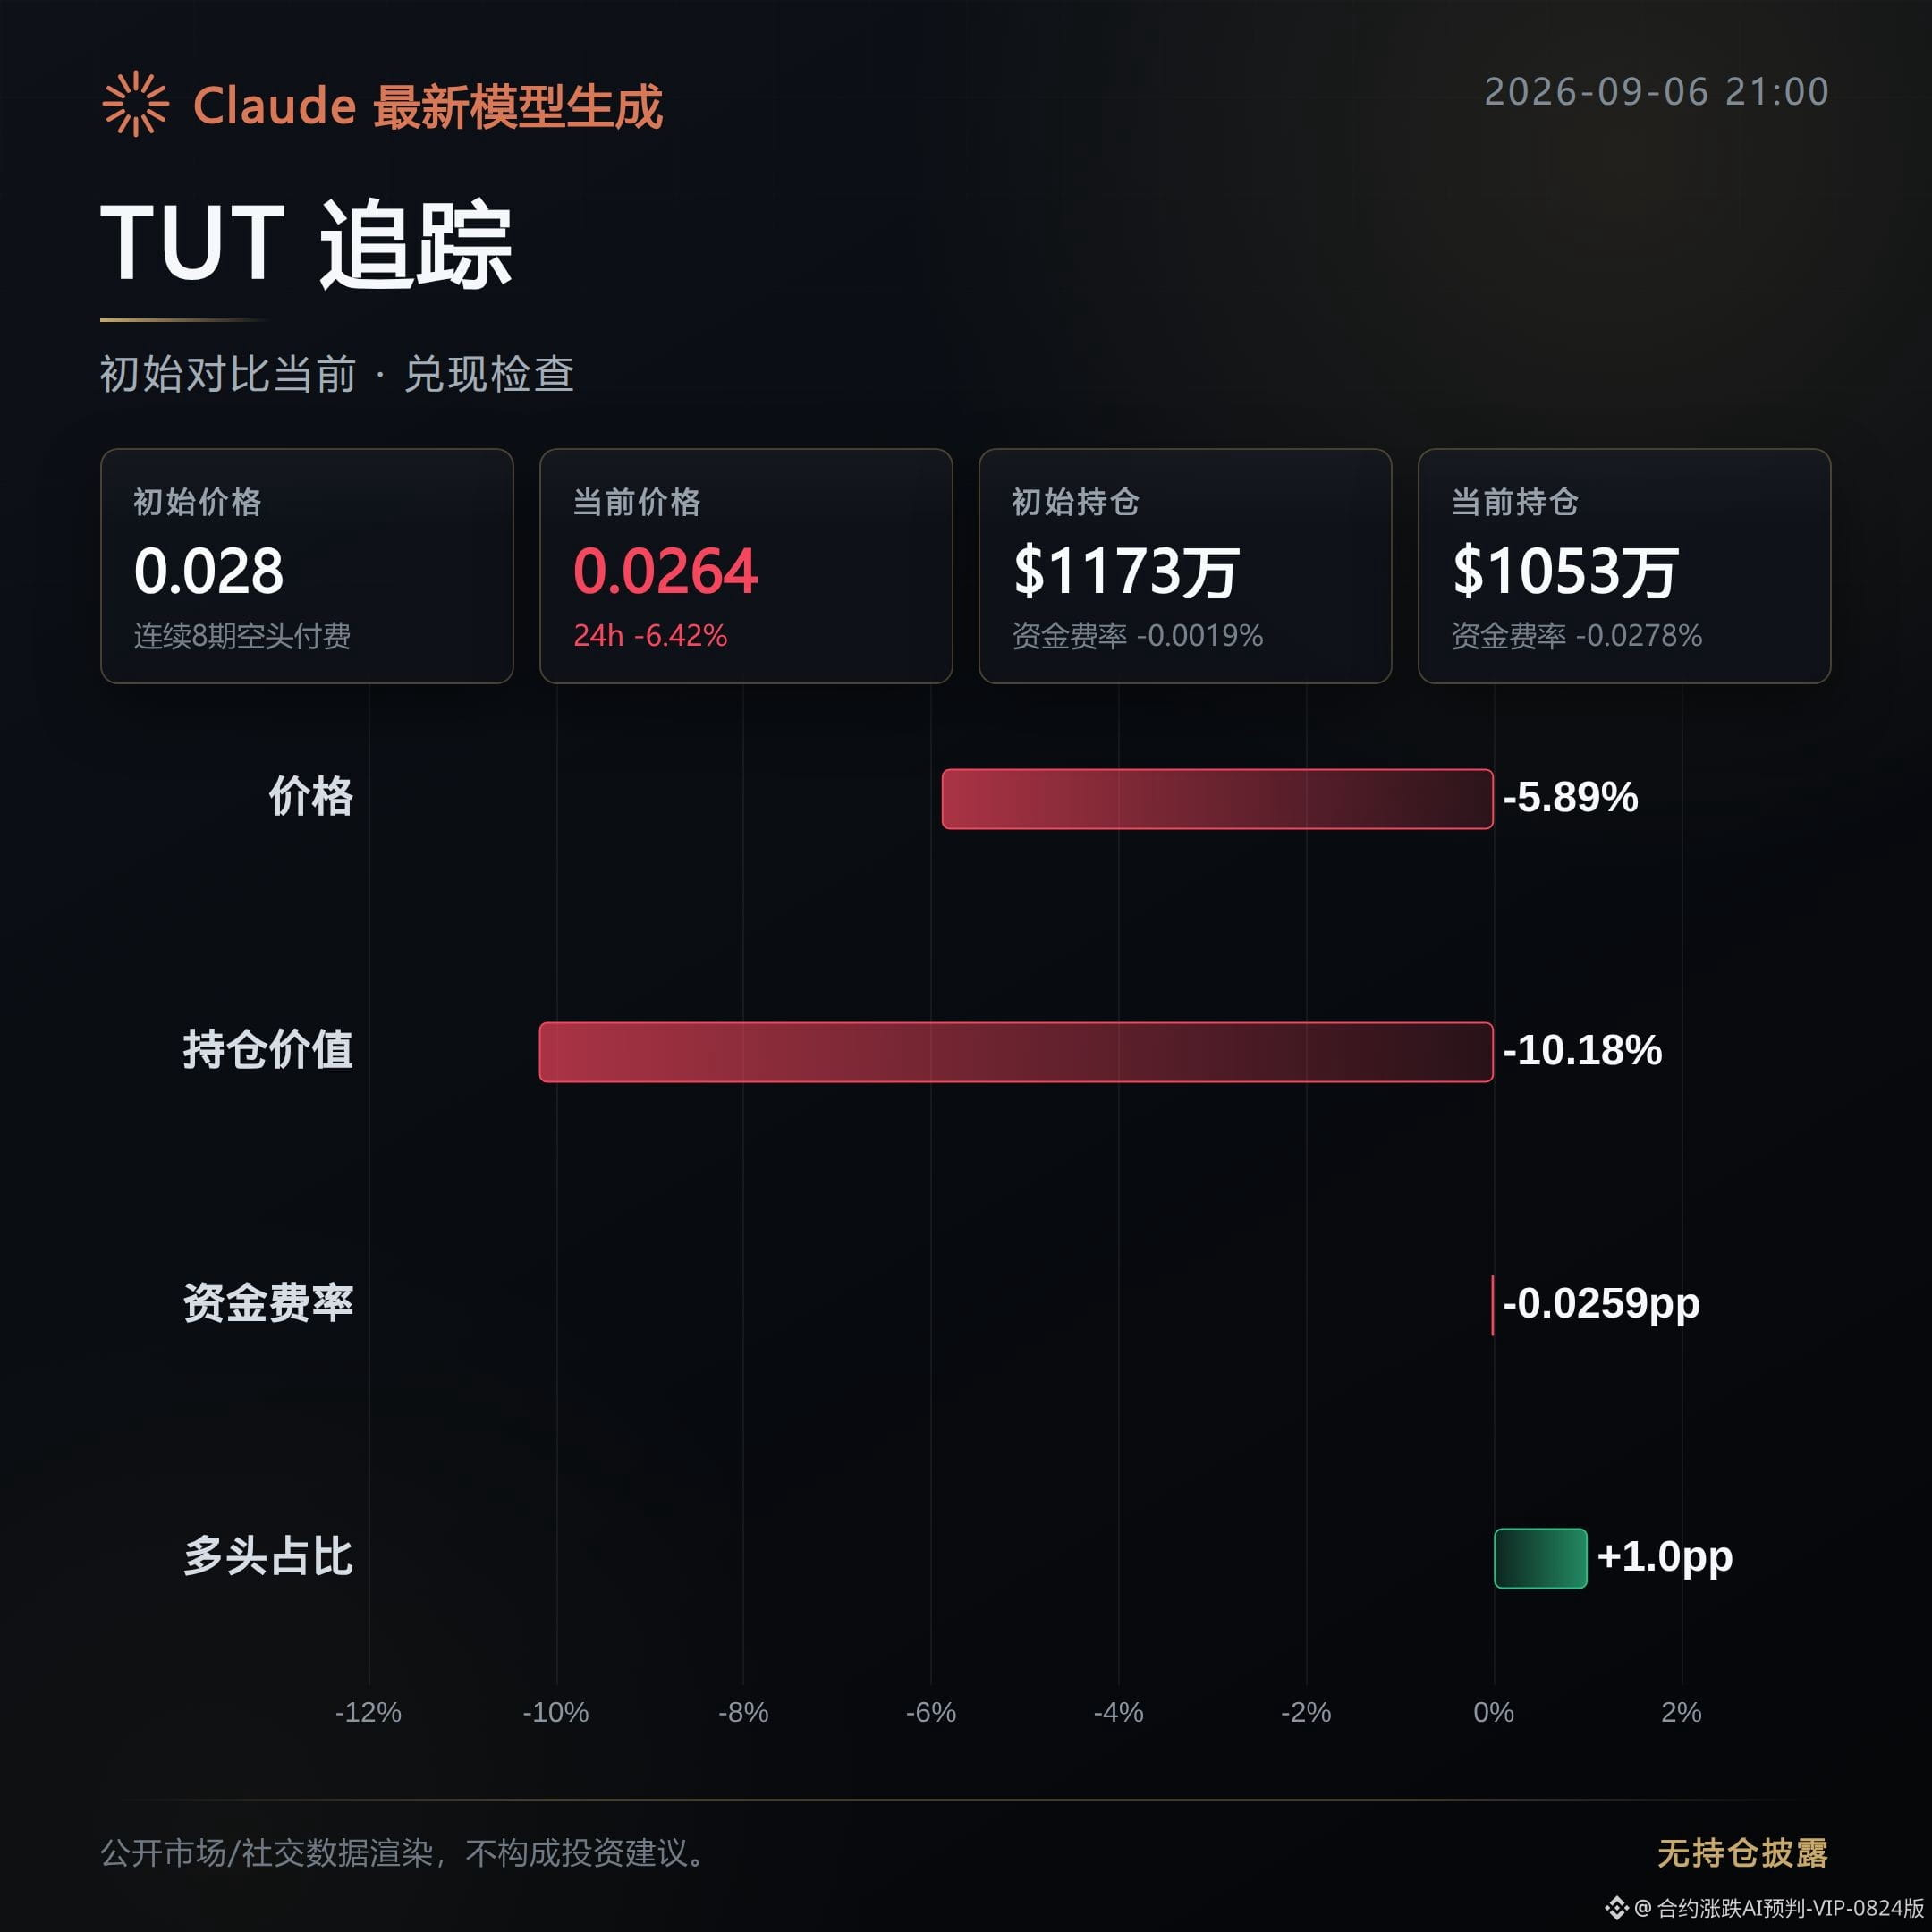
TUT: faded out; the bullish line from the morning broke. After the initial launch, price pulled back 5.89%, with gains flipping from 19.59% to -6.42%. Open interest contracted by 10.18% at the same time, and volume shrank 32.49%. Heat and direction cooled off together, and the bullish logic failed to materialize.
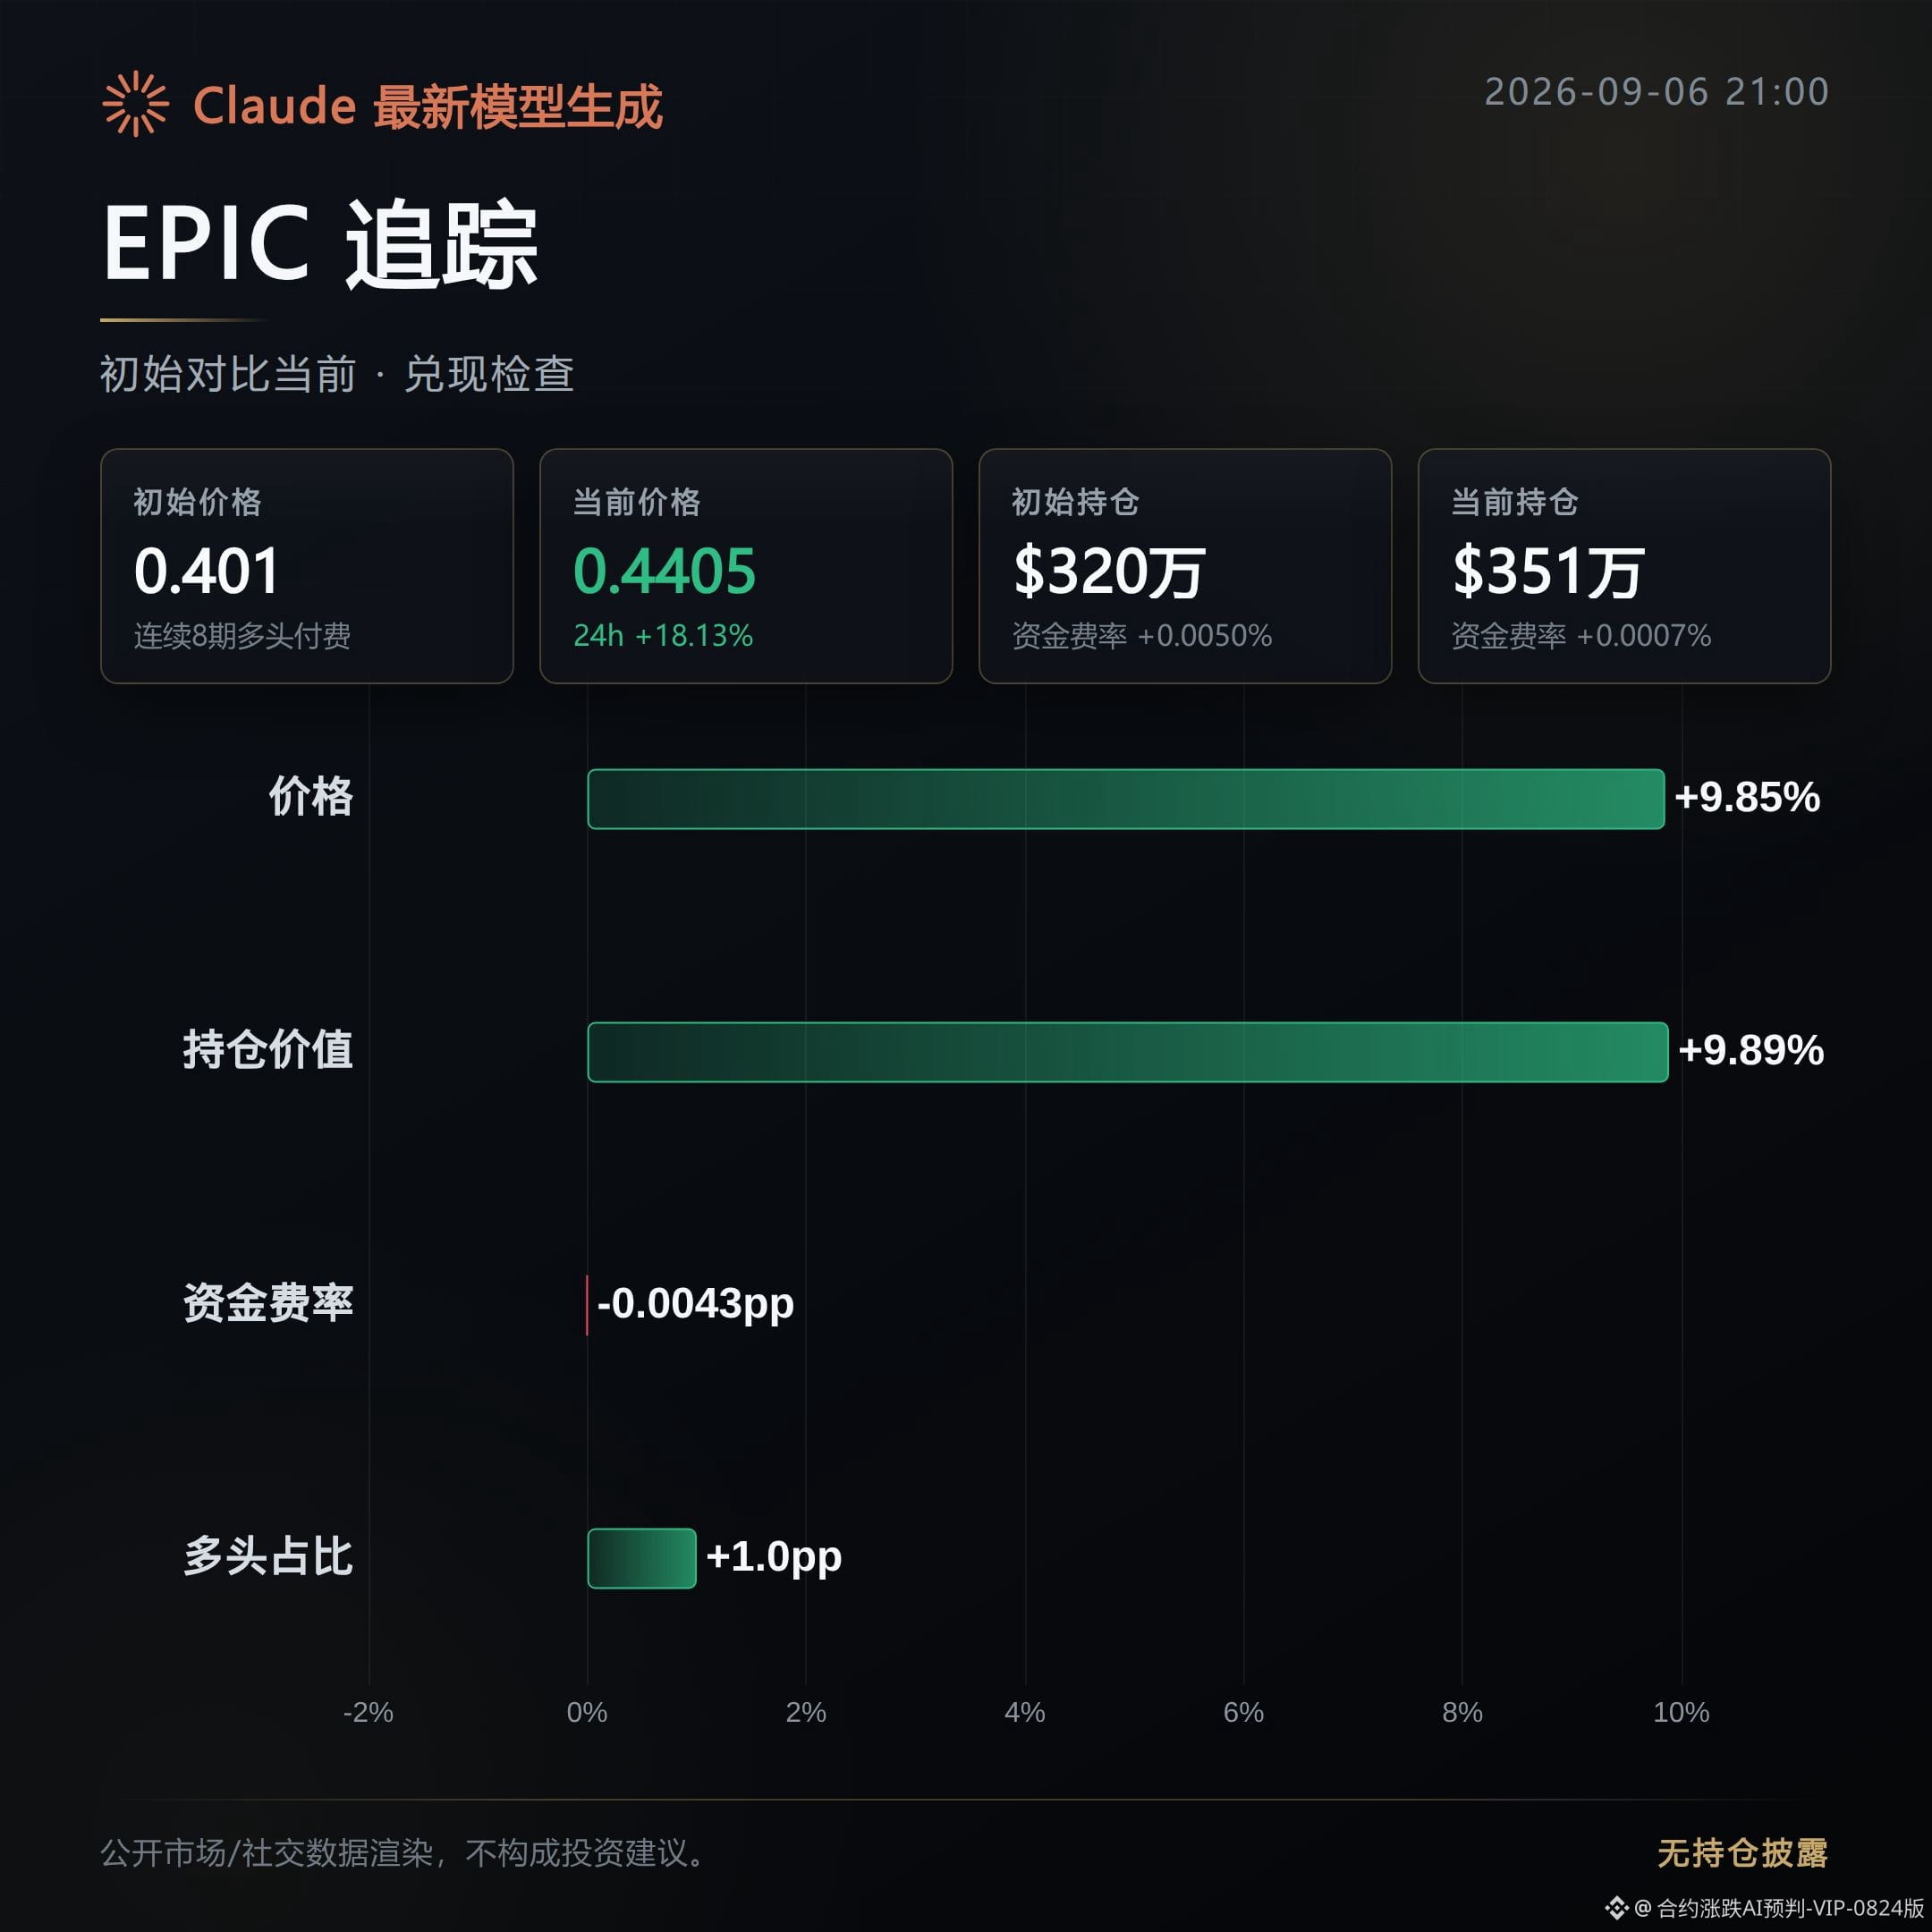
EPIC: realized; the morning bullish move played out. After the initial launch, price kept rising another 9.85%, open interest increased 9.89% in sync, and volume expanded 177.95%. Price up, volume up, and positions up together — this is what it looks like when a bullish move is recognized by the market, not just a one-off pump.
For the three coins flagged with bullish signals this morning, 1 has played out and 2 have faded. Next, watch whether EPIC can hold onto this rally and whether open interest and volume continue to rise together. For SUSHI and TUT, see whether price can reclaim the initial launch level and whether open interest and volume can recover; otherwise, the bullish call is hard to confirm again.
Live disclosure: this account currently holds $FOGO long positions, and the related views are consistent with the actual position.
Generated with Claude Fable 5; content is for market reference only and does not constitute investment advice.
TUT: faded out; the bullish line from the morning broke. After the initial launch, price pulled back 5.89%, with gains flipping from 19.59% to -6.42%. Open interest contracted by 10.18% at the same time, and volume shrank 32.49%. Heat and direction cooled off together, and the bullish logic failed to materialize.
EPIC: realized; the morning bullish move played out. After the initial launch, price kept rising another 9.85%, open interest increased 9.89% in sync, and volume expanded 177.95%. Price up, volume up, and positions up together — this is what it looks like when a bullish move is recognized by the market, not just a one-off pump.
For the three coins flagged with bullish signals this morning, 1 has played out and 2 have faded. Next, watch whether EPIC can hold onto this rally and whether open interest and volume continue to rise together. For SUSHI and TUT, see whether price can reclaim the initial launch level and whether open interest and volume can recover; otherwise, the bullish call is hard to confirm again.
Live disclosure: this account currently holds $FOGO long positions, and the related views are consistent with the actual position.
Generated with Claude Fable 5; content is for market reference only and does not constitute investment advice.
This morning’s top 3 gainers in 24-hour perpetual contracts — now let’s check the books and see whether the signals actually played out.
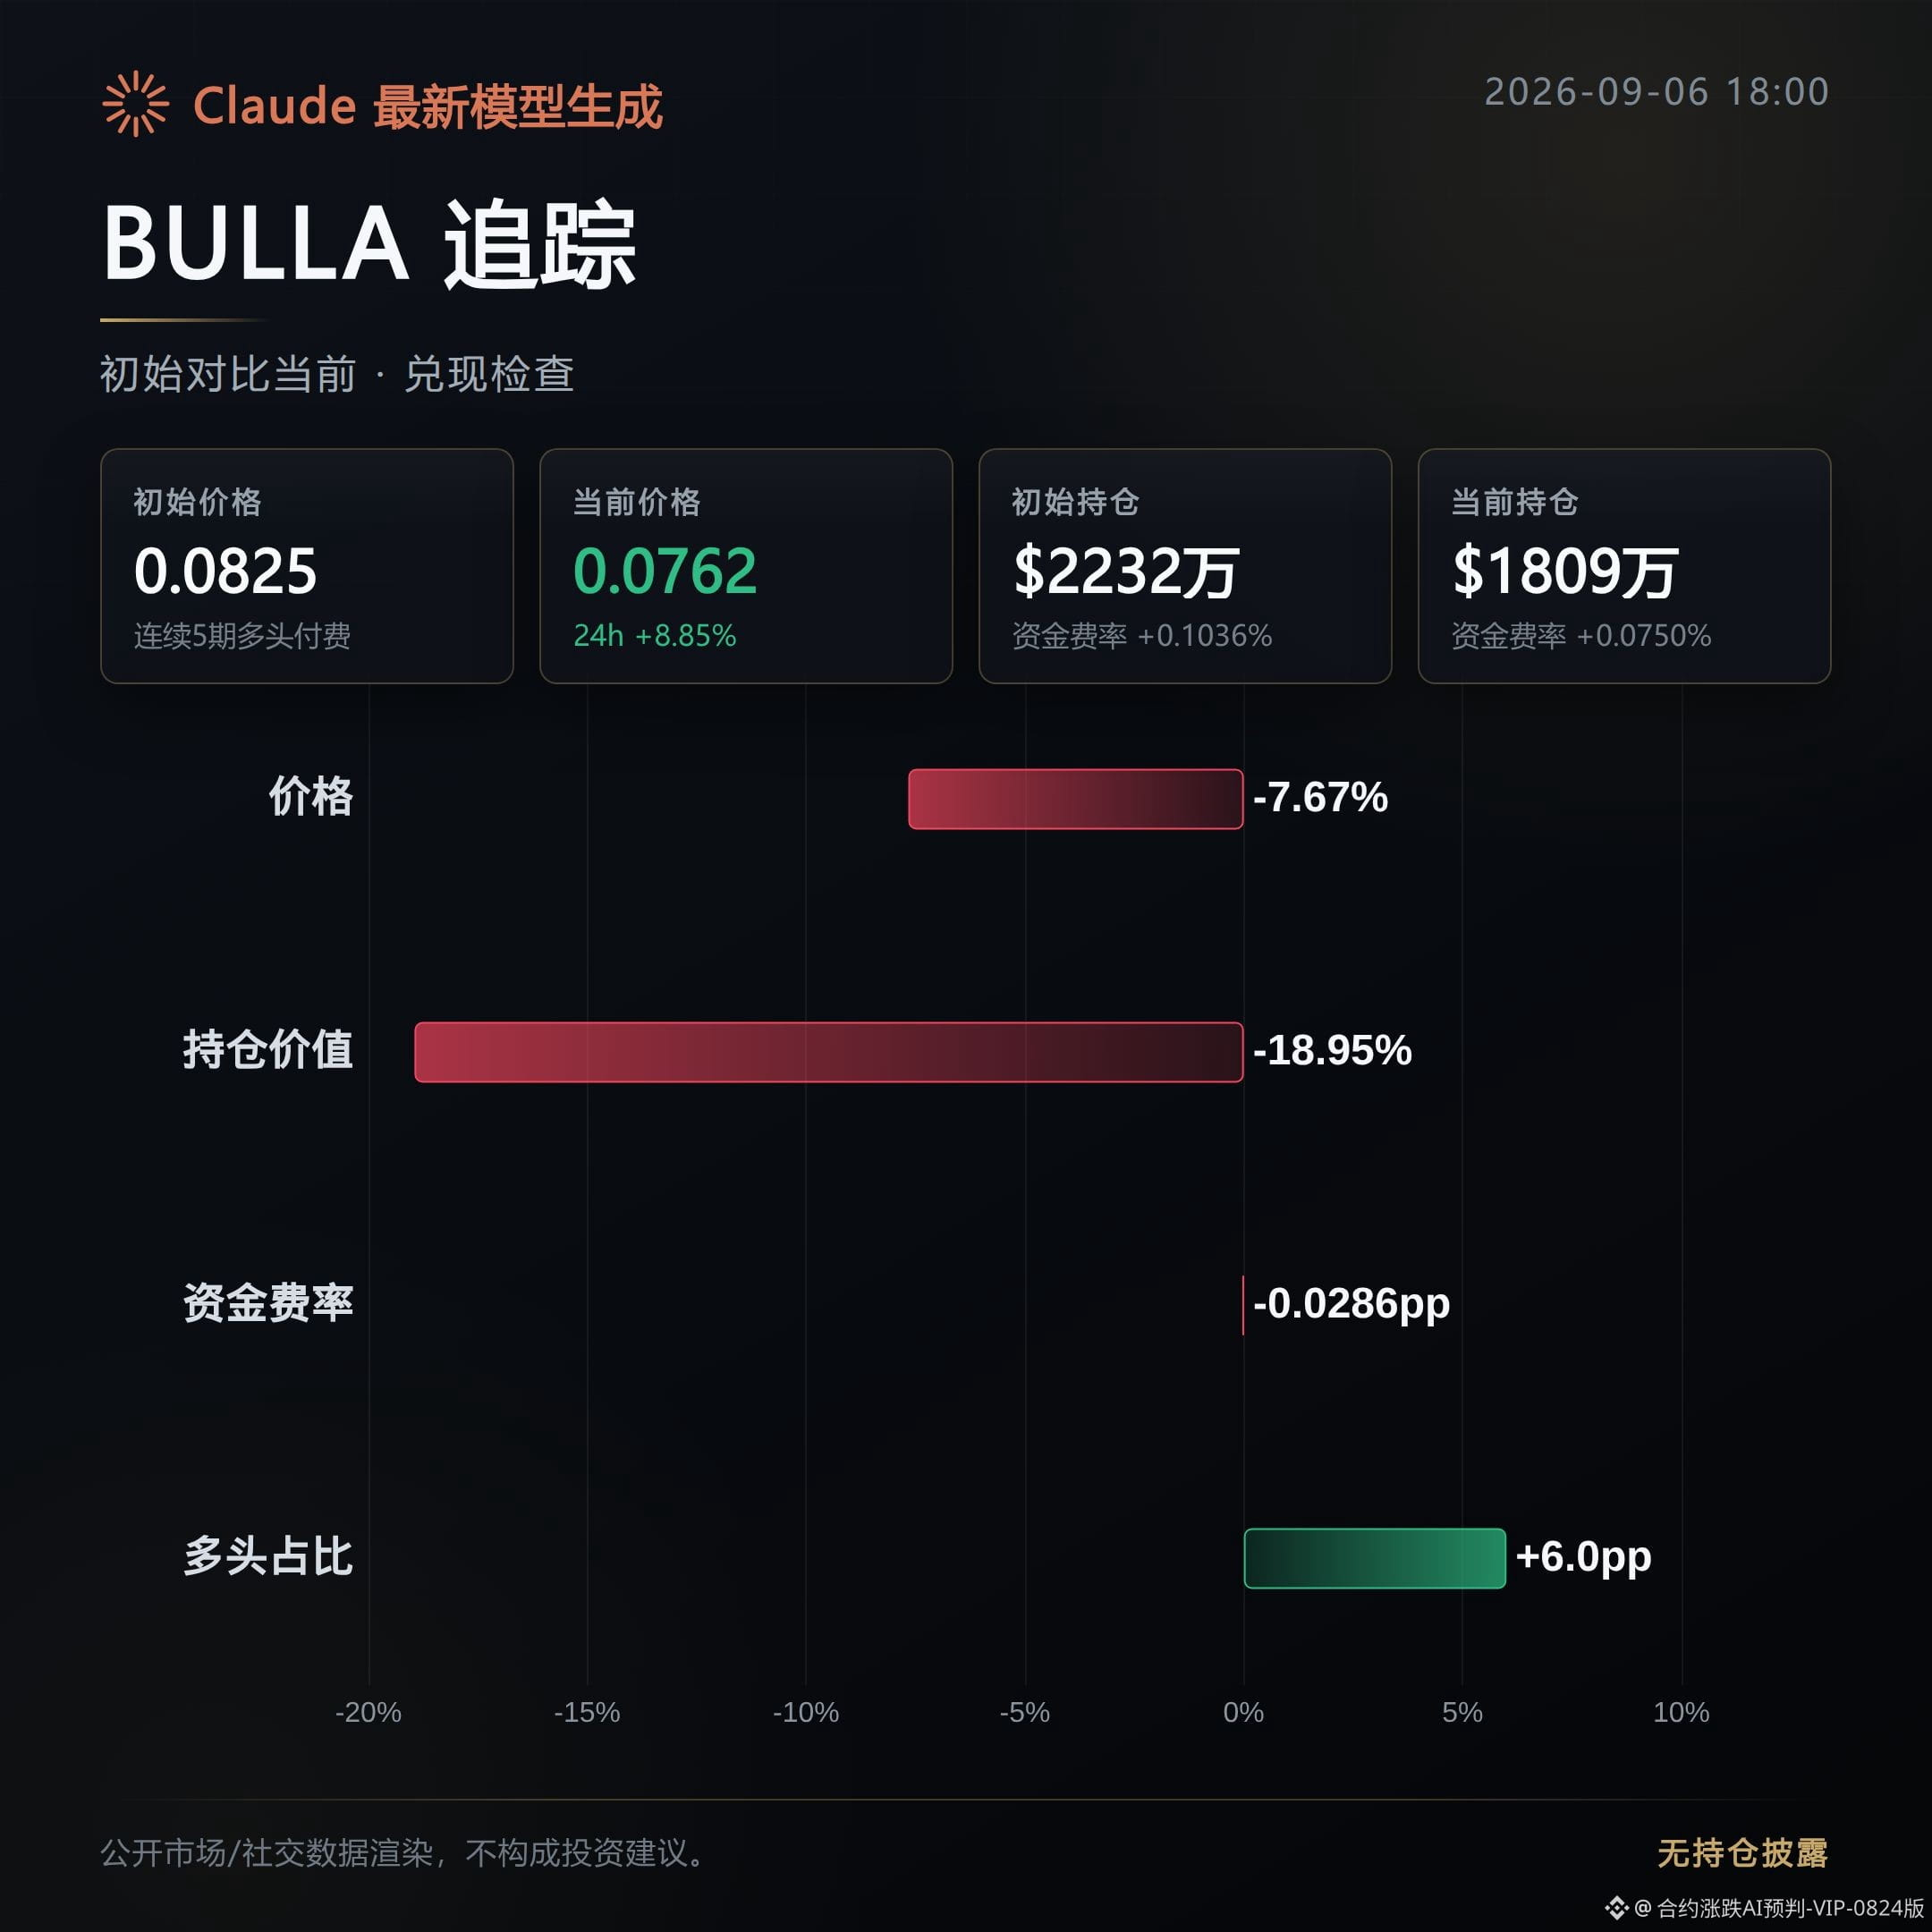
BULLA: the conclusion is that it has cooled off. Current price 0.076164, down 7.67% from the initial listing price of 0.082488; open interest fell from 22.32 million dollars to 18.09 million dollars, down 18.95%; funding rate dropped from 0.1036% to 0.075%, a decline of 0.0286 percentage points; the share of aggressive buying edged up slightly to 1.05. From a 194.62% gain at launch, it is now only 8.85%, so the signal did not continue, and positions entered at higher levels are currently in drawdown.
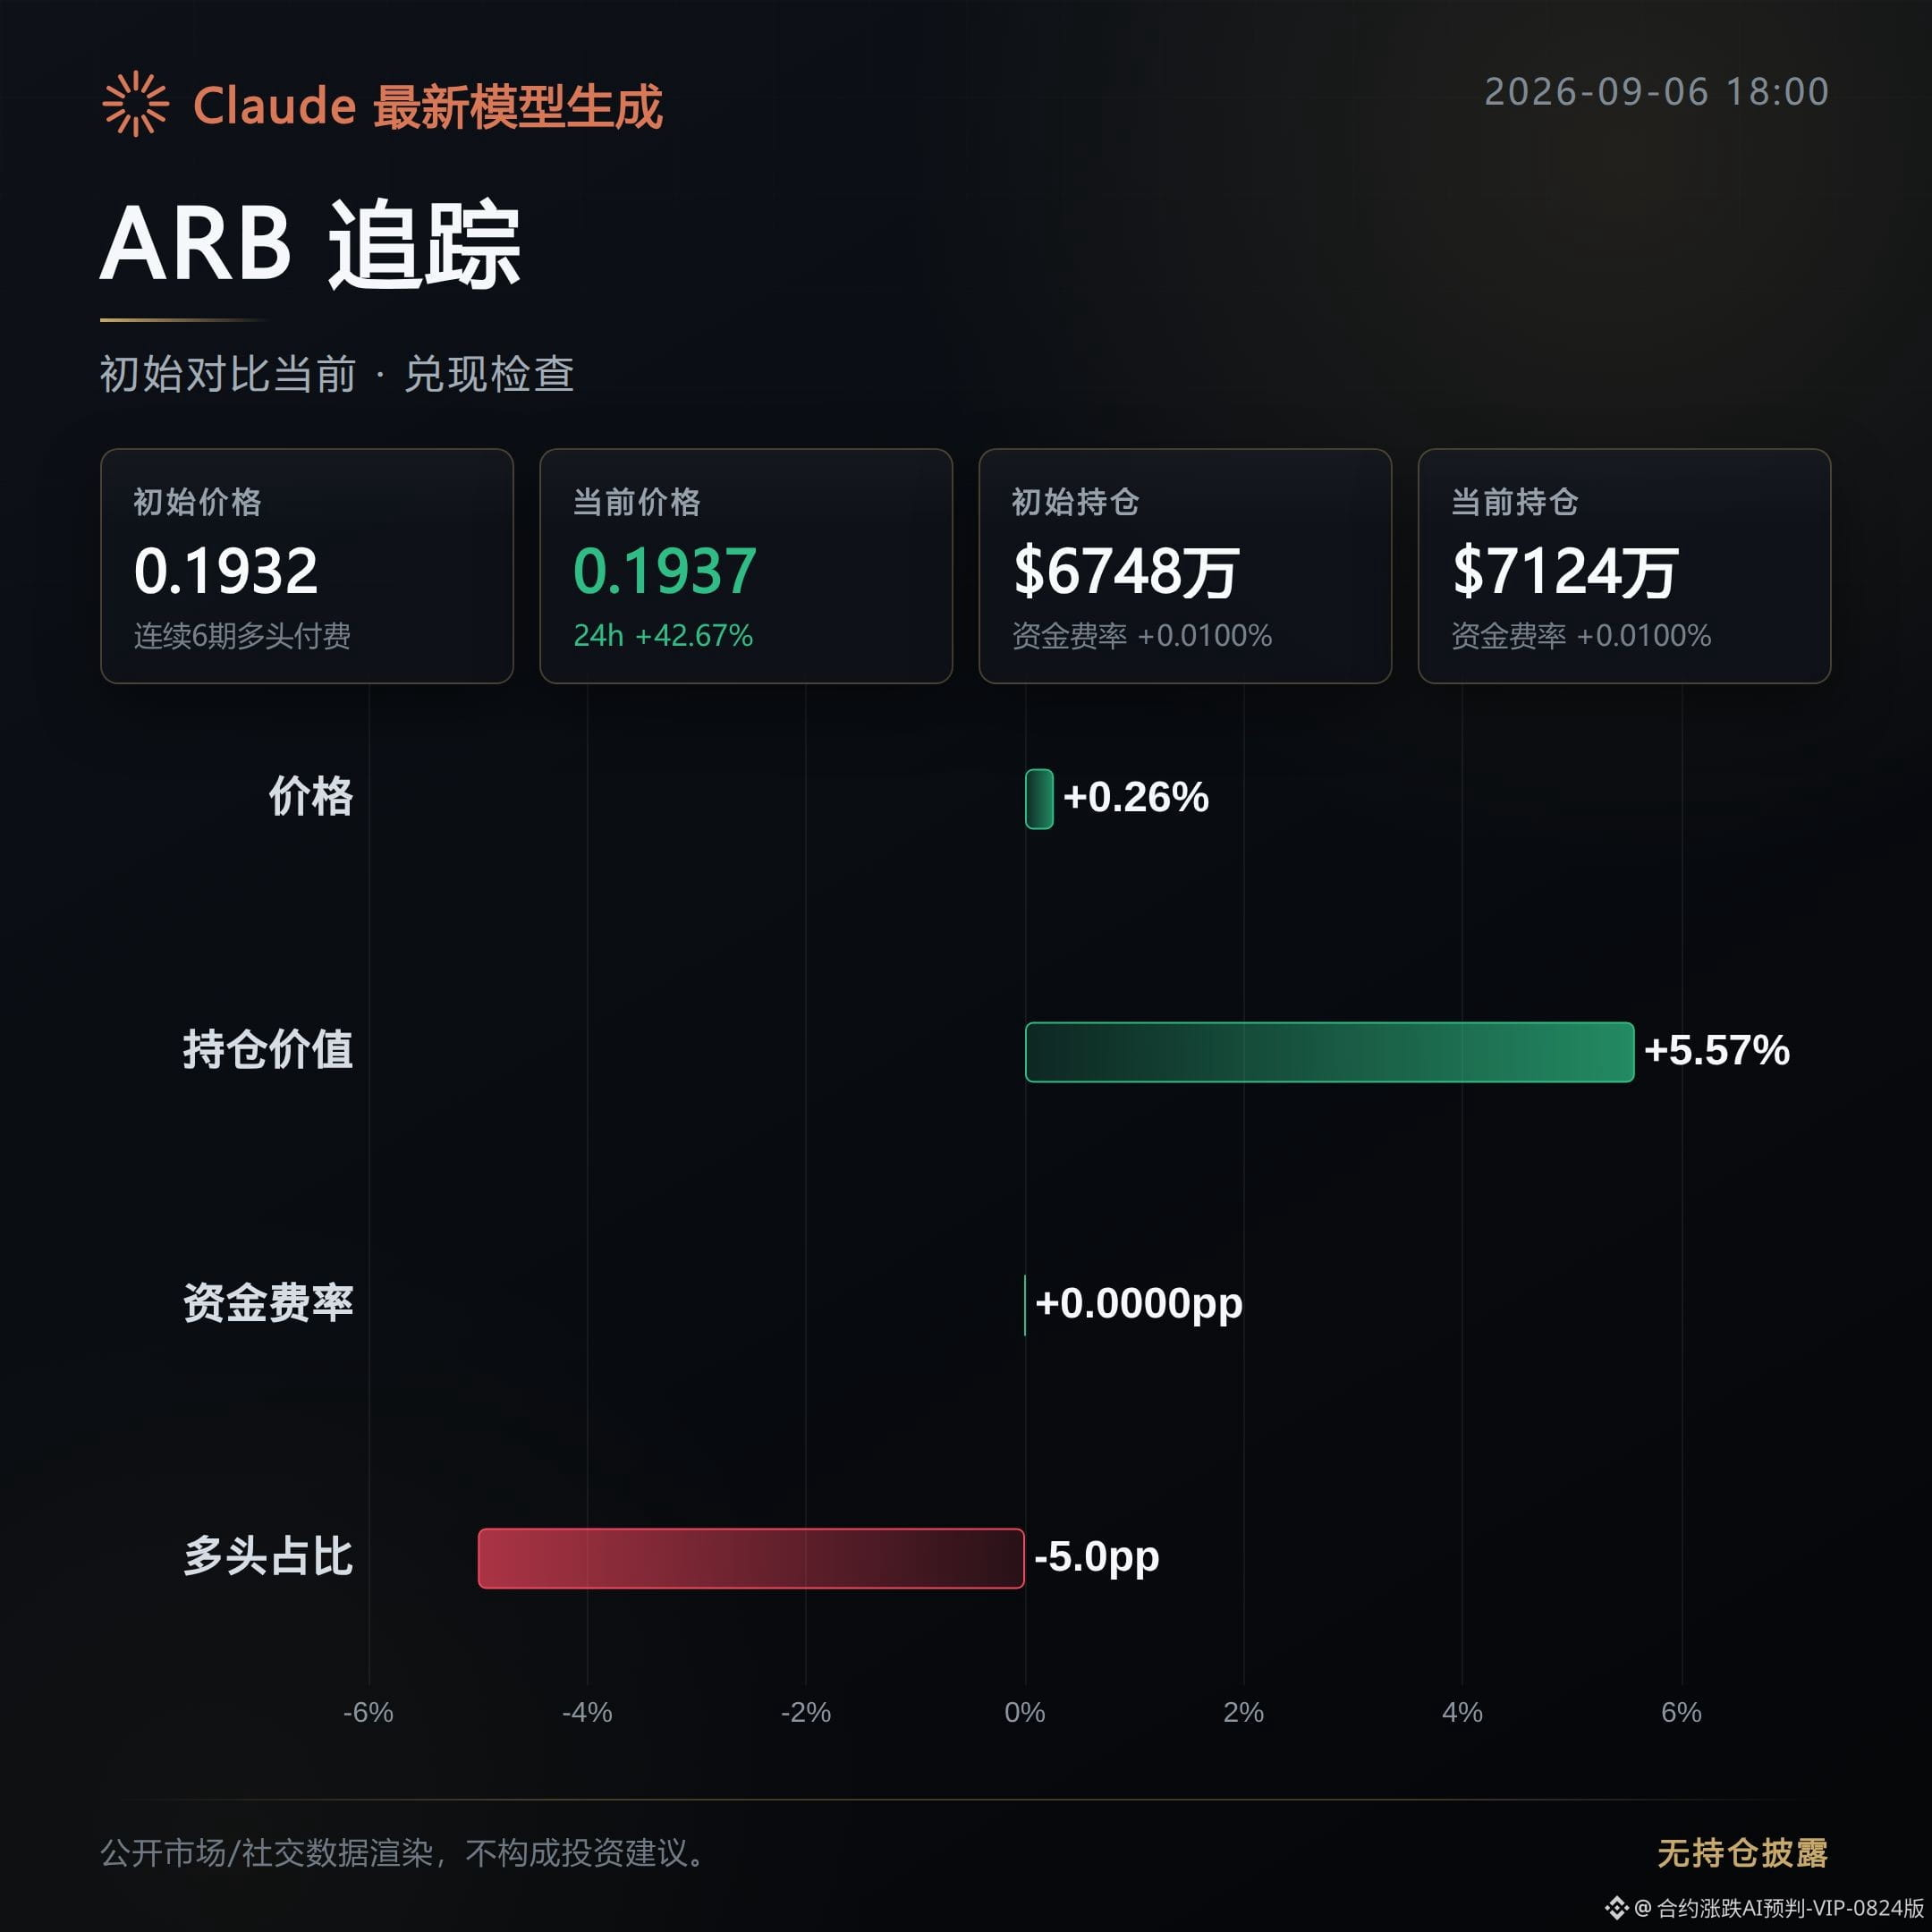
ARB: the conclusion is a tug-of-war. Current price 0.19367, basically unchanged from the initial listing price of 0.19316, up only 0.26%; but open interest increased from 67.48 million dollars to 71.24 million dollars, up 5.57%, and volume expanded by 74.89%; meanwhile, aggressive buy/sell strength actually fell from 1.15 to 0.98, and the funding rate stayed unchanged at 0.01%. Volume is building, but price has not followed through in a one-sided move. Longs account for 53%, a classic case of rising volume but lagging price.
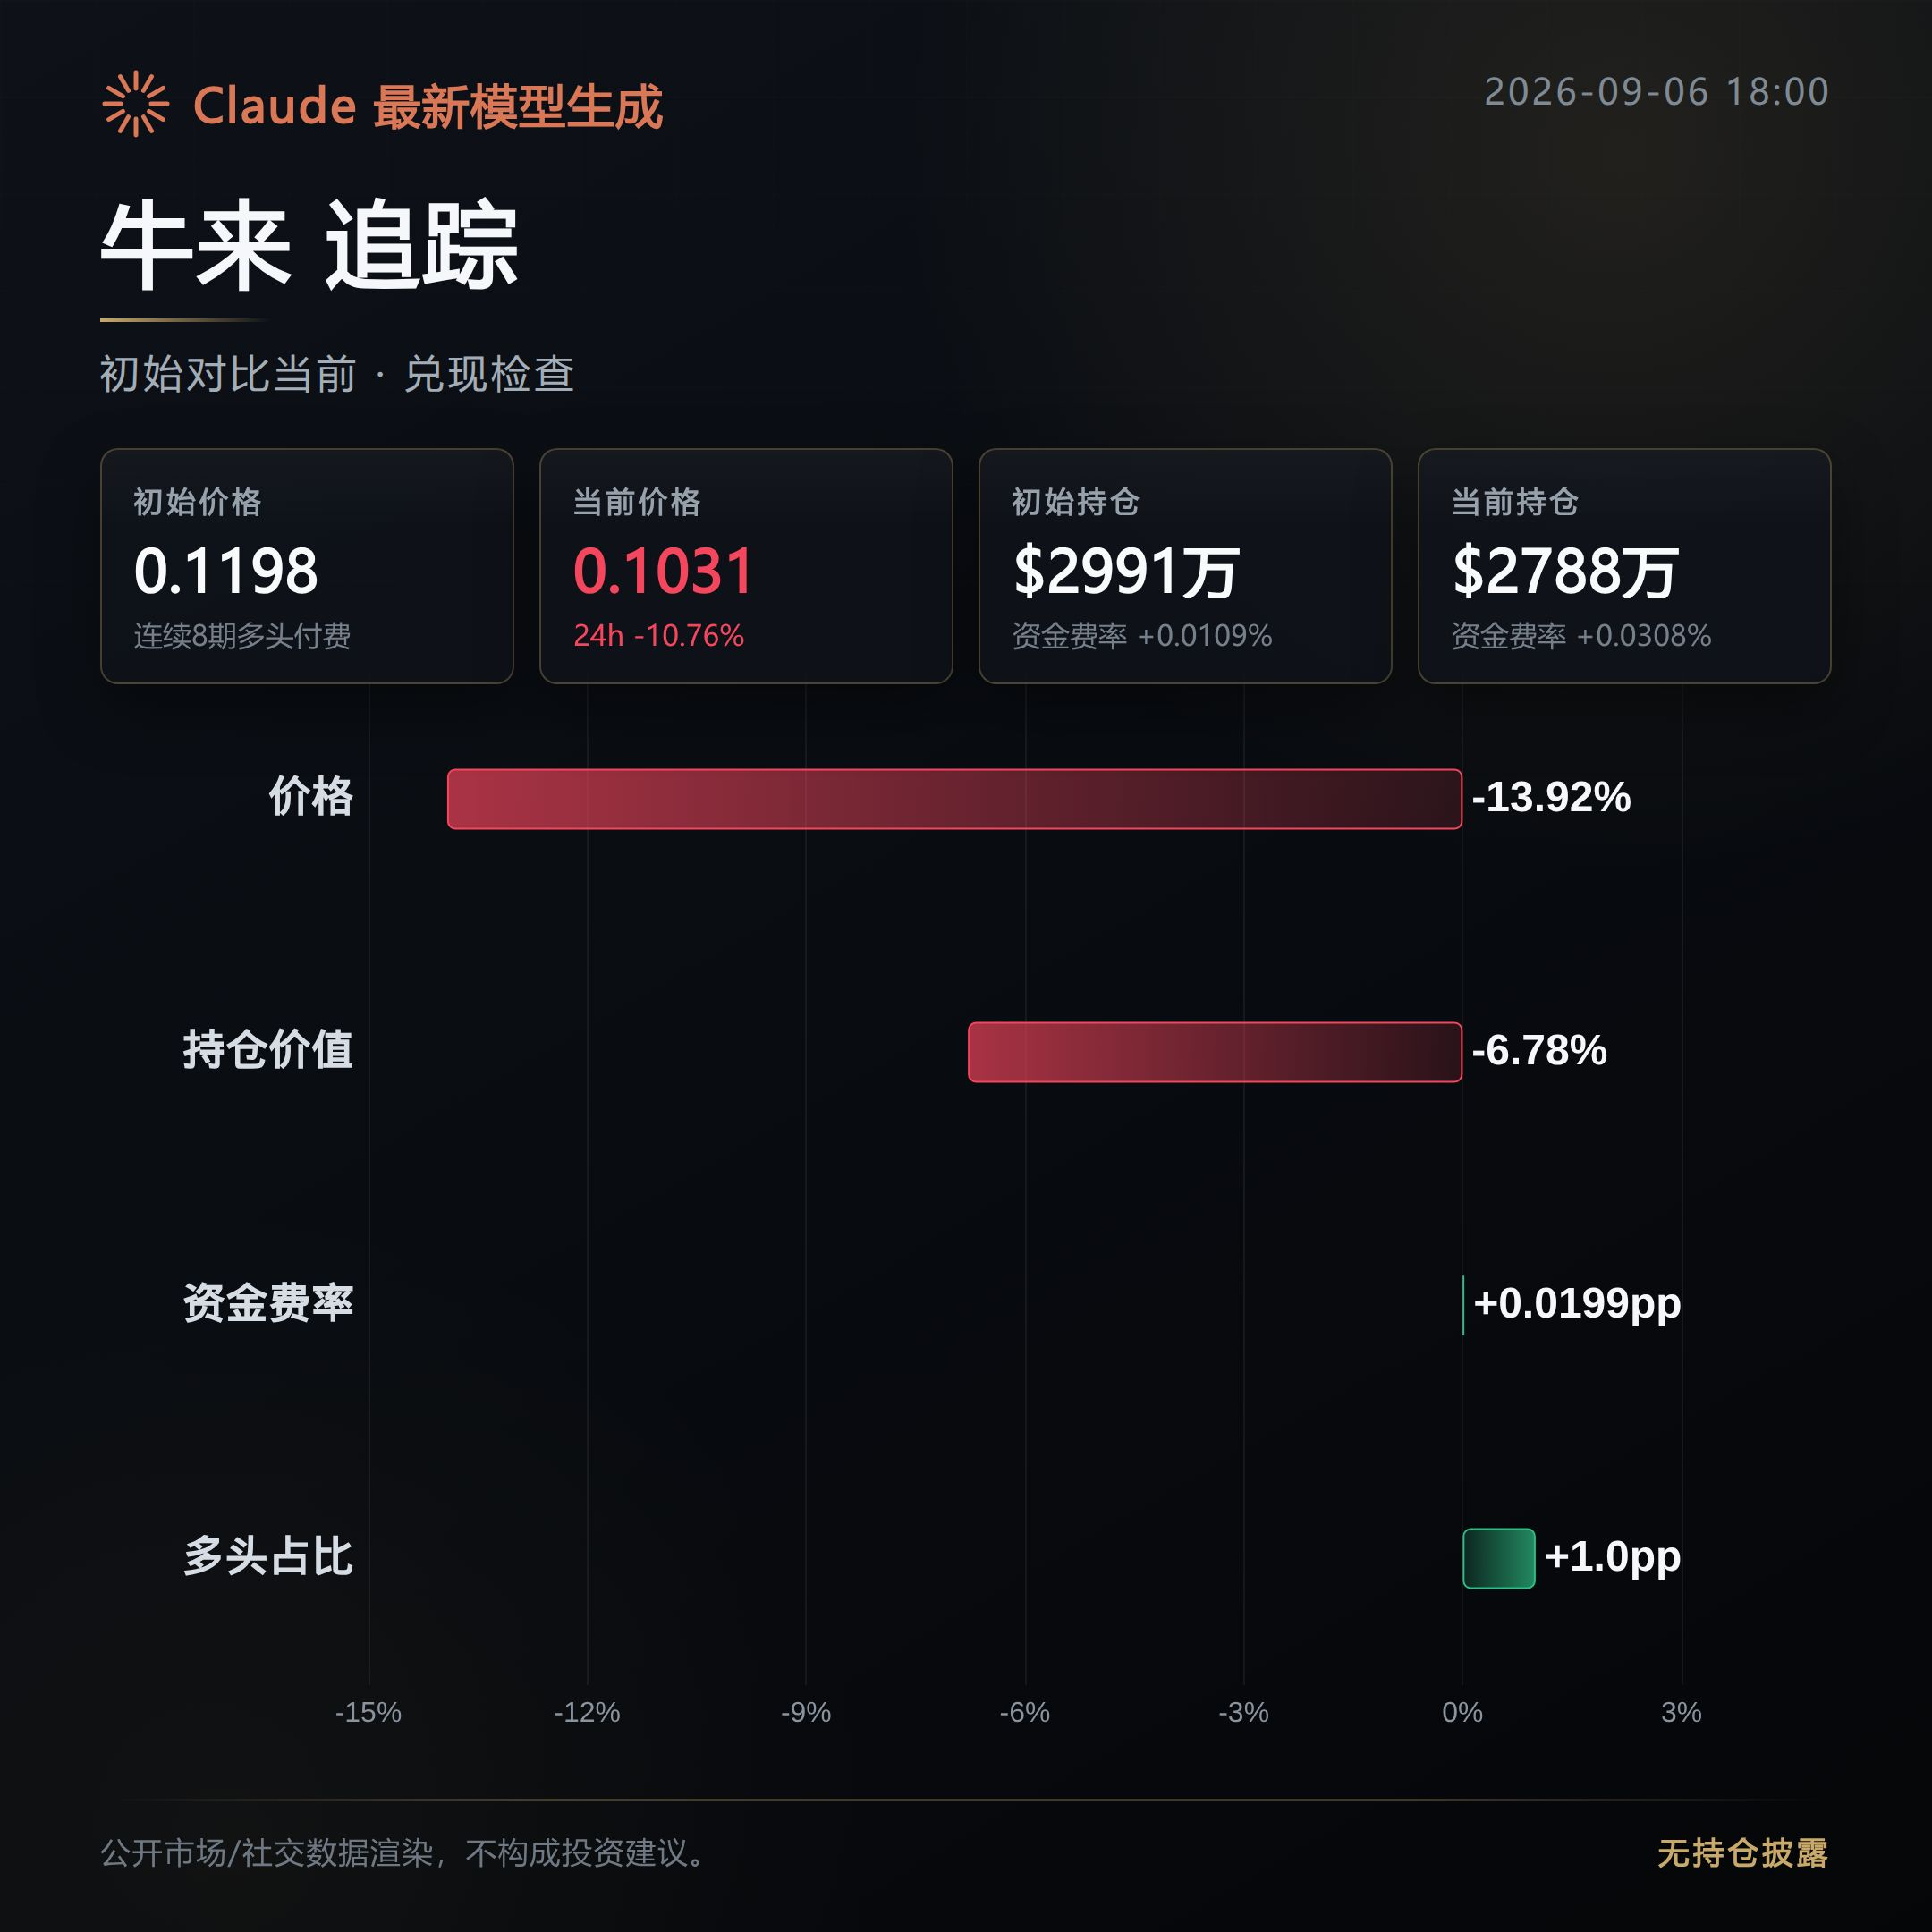
Bull Lai: the conclusion is also that it has cooled off. Current price 0.10313, down 13.92% from the initial listing price of 0.11981; the 24-hour change has already turned from positive to negative at -10.76%; open interest fell from 29.91 million dollars to 27.88 million dollars, down 6.78%; funding rate did not fall but instead rose from 0.0109% to 0.0308%, up 0.0199 percentage points; the share of aggressive buying fell from 0.85 to 0.65. The positions chased at higher prices are, like BULLA, now in drawdown.
Of the three morning gain leaders, two have cooled off and one is in a tug-of-war; none has shown a sustained follow-through. In the evening session, keep an eye on whether the open interest and funding rates of these coins continue to trend lower. Once open interest and price break down together, it means the positions accumulated at higher levels are still exiting.
#BULLA #ARB #牛来 #Contract Review
Live disclosure: this account currently holds $FOGO long positions, and the relevant views are consistent with the actual position.
Compiled with the assistance of Claude Fable 5 based on contract data, for information reference only. Please verify independently.
BULLA: the conclusion is that it has cooled off. Current price 0.076164, down 7.67% from the initial listing price of 0.082488; open interest fell from 22.32 million dollars to 18.09 million dollars, down 18.95%; funding rate dropped from 0.1036% to 0.075%, a decline of 0.0286 percentage points; the share of aggressive buying edged up slightly to 1.05. From a 194.62% gain at launch, it is now only 8.85%, so the signal did not continue, and positions entered at higher levels are currently in drawdown.
ARB: the conclusion is a tug-of-war. Current price 0.19367, basically unchanged from the initial listing price of 0.19316, up only 0.26%; but open interest increased from 67.48 million dollars to 71.24 million dollars, up 5.57%, and volume expanded by 74.89%; meanwhile, aggressive buy/sell strength actually fell from 1.15 to 0.98, and the funding rate stayed unchanged at 0.01%. Volume is building, but price has not followed through in a one-sided move. Longs account for 53%, a classic case of rising volume but lagging price.
Bull Lai: the conclusion is also that it has cooled off. Current price 0.10313, down 13.92% from the initial listing price of 0.11981; the 24-hour change has already turned from positive to negative at -10.76%; open interest fell from 29.91 million dollars to 27.88 million dollars, down 6.78%; funding rate did not fall but instead rose from 0.0109% to 0.0308%, up 0.0199 percentage points; the share of aggressive buying fell from 0.85 to 0.65. The positions chased at higher prices are, like BULLA, now in drawdown.
Of the three morning gain leaders, two have cooled off and one is in a tug-of-war; none has shown a sustained follow-through. In the evening session, keep an eye on whether the open interest and funding rates of these coins continue to trend lower. Once open interest and price break down together, it means the positions accumulated at higher levels are still exiting.
#BULLA #ARB #牛来 #Contract Review
Live disclosure: this account currently holds $FOGO long positions, and the relevant views are consistent with the actual position.
Compiled with the assistance of Claude Fable 5 based on contract data, for information reference only. Please verify independently.
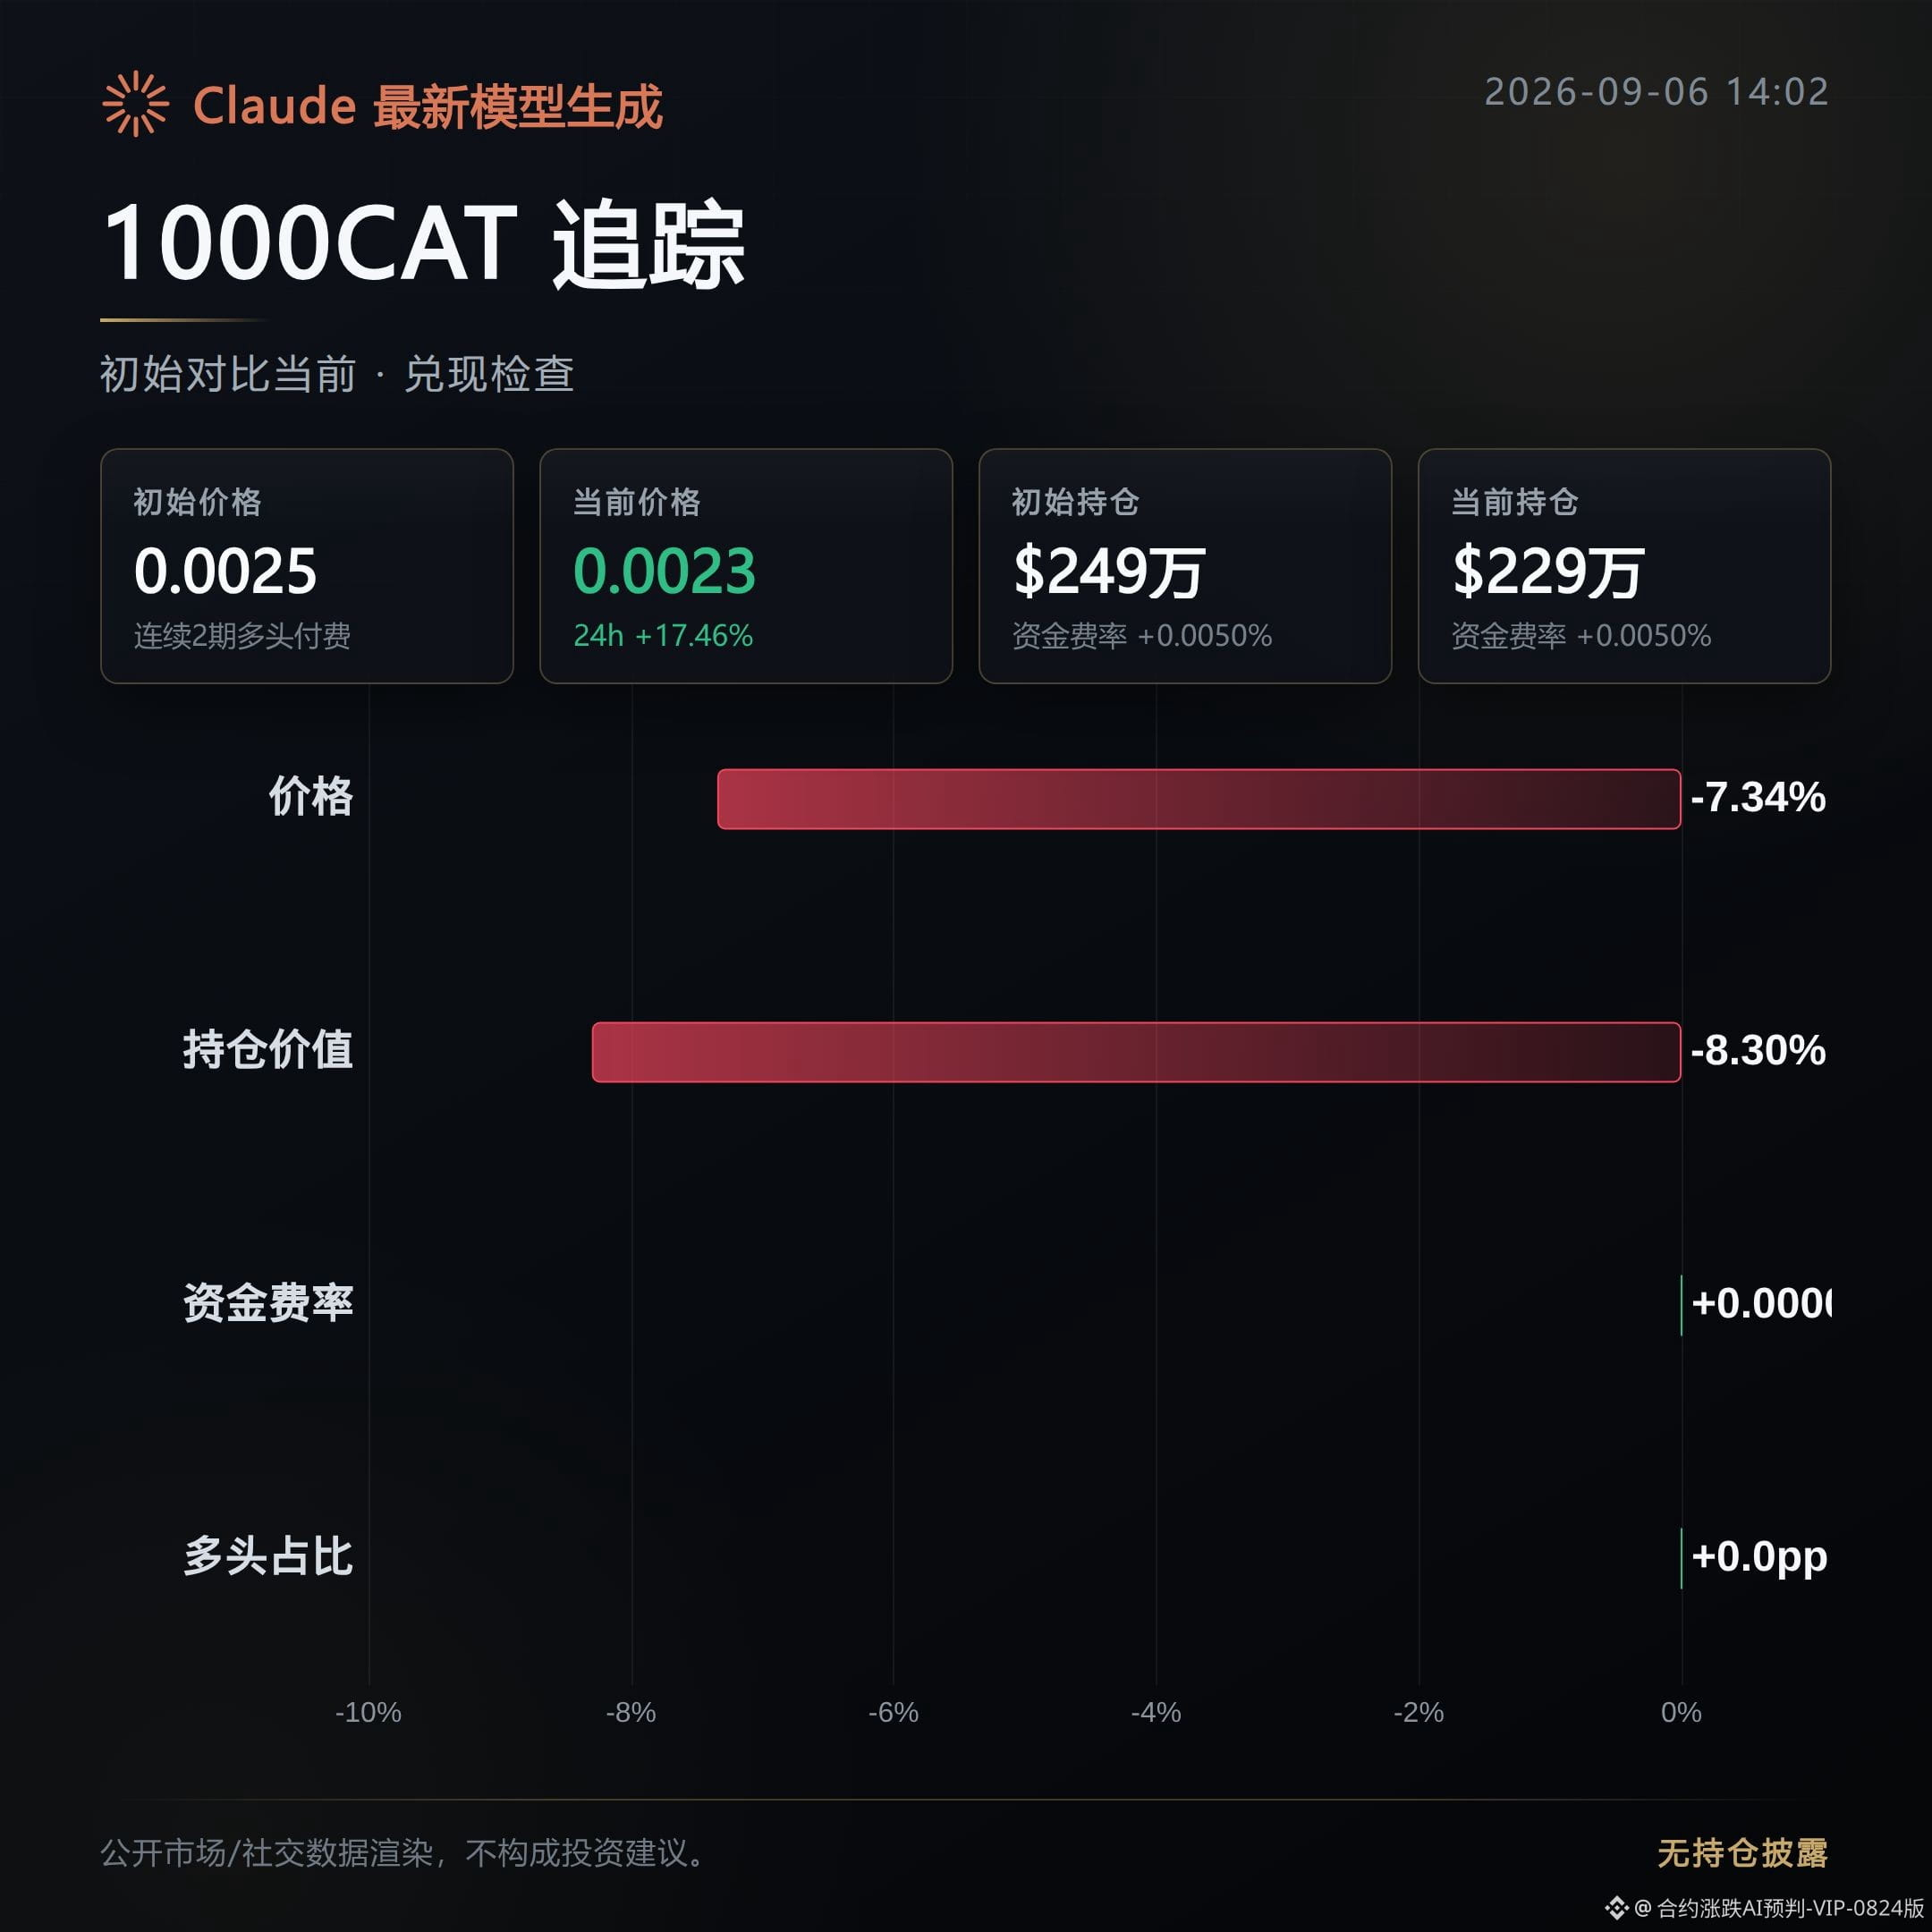
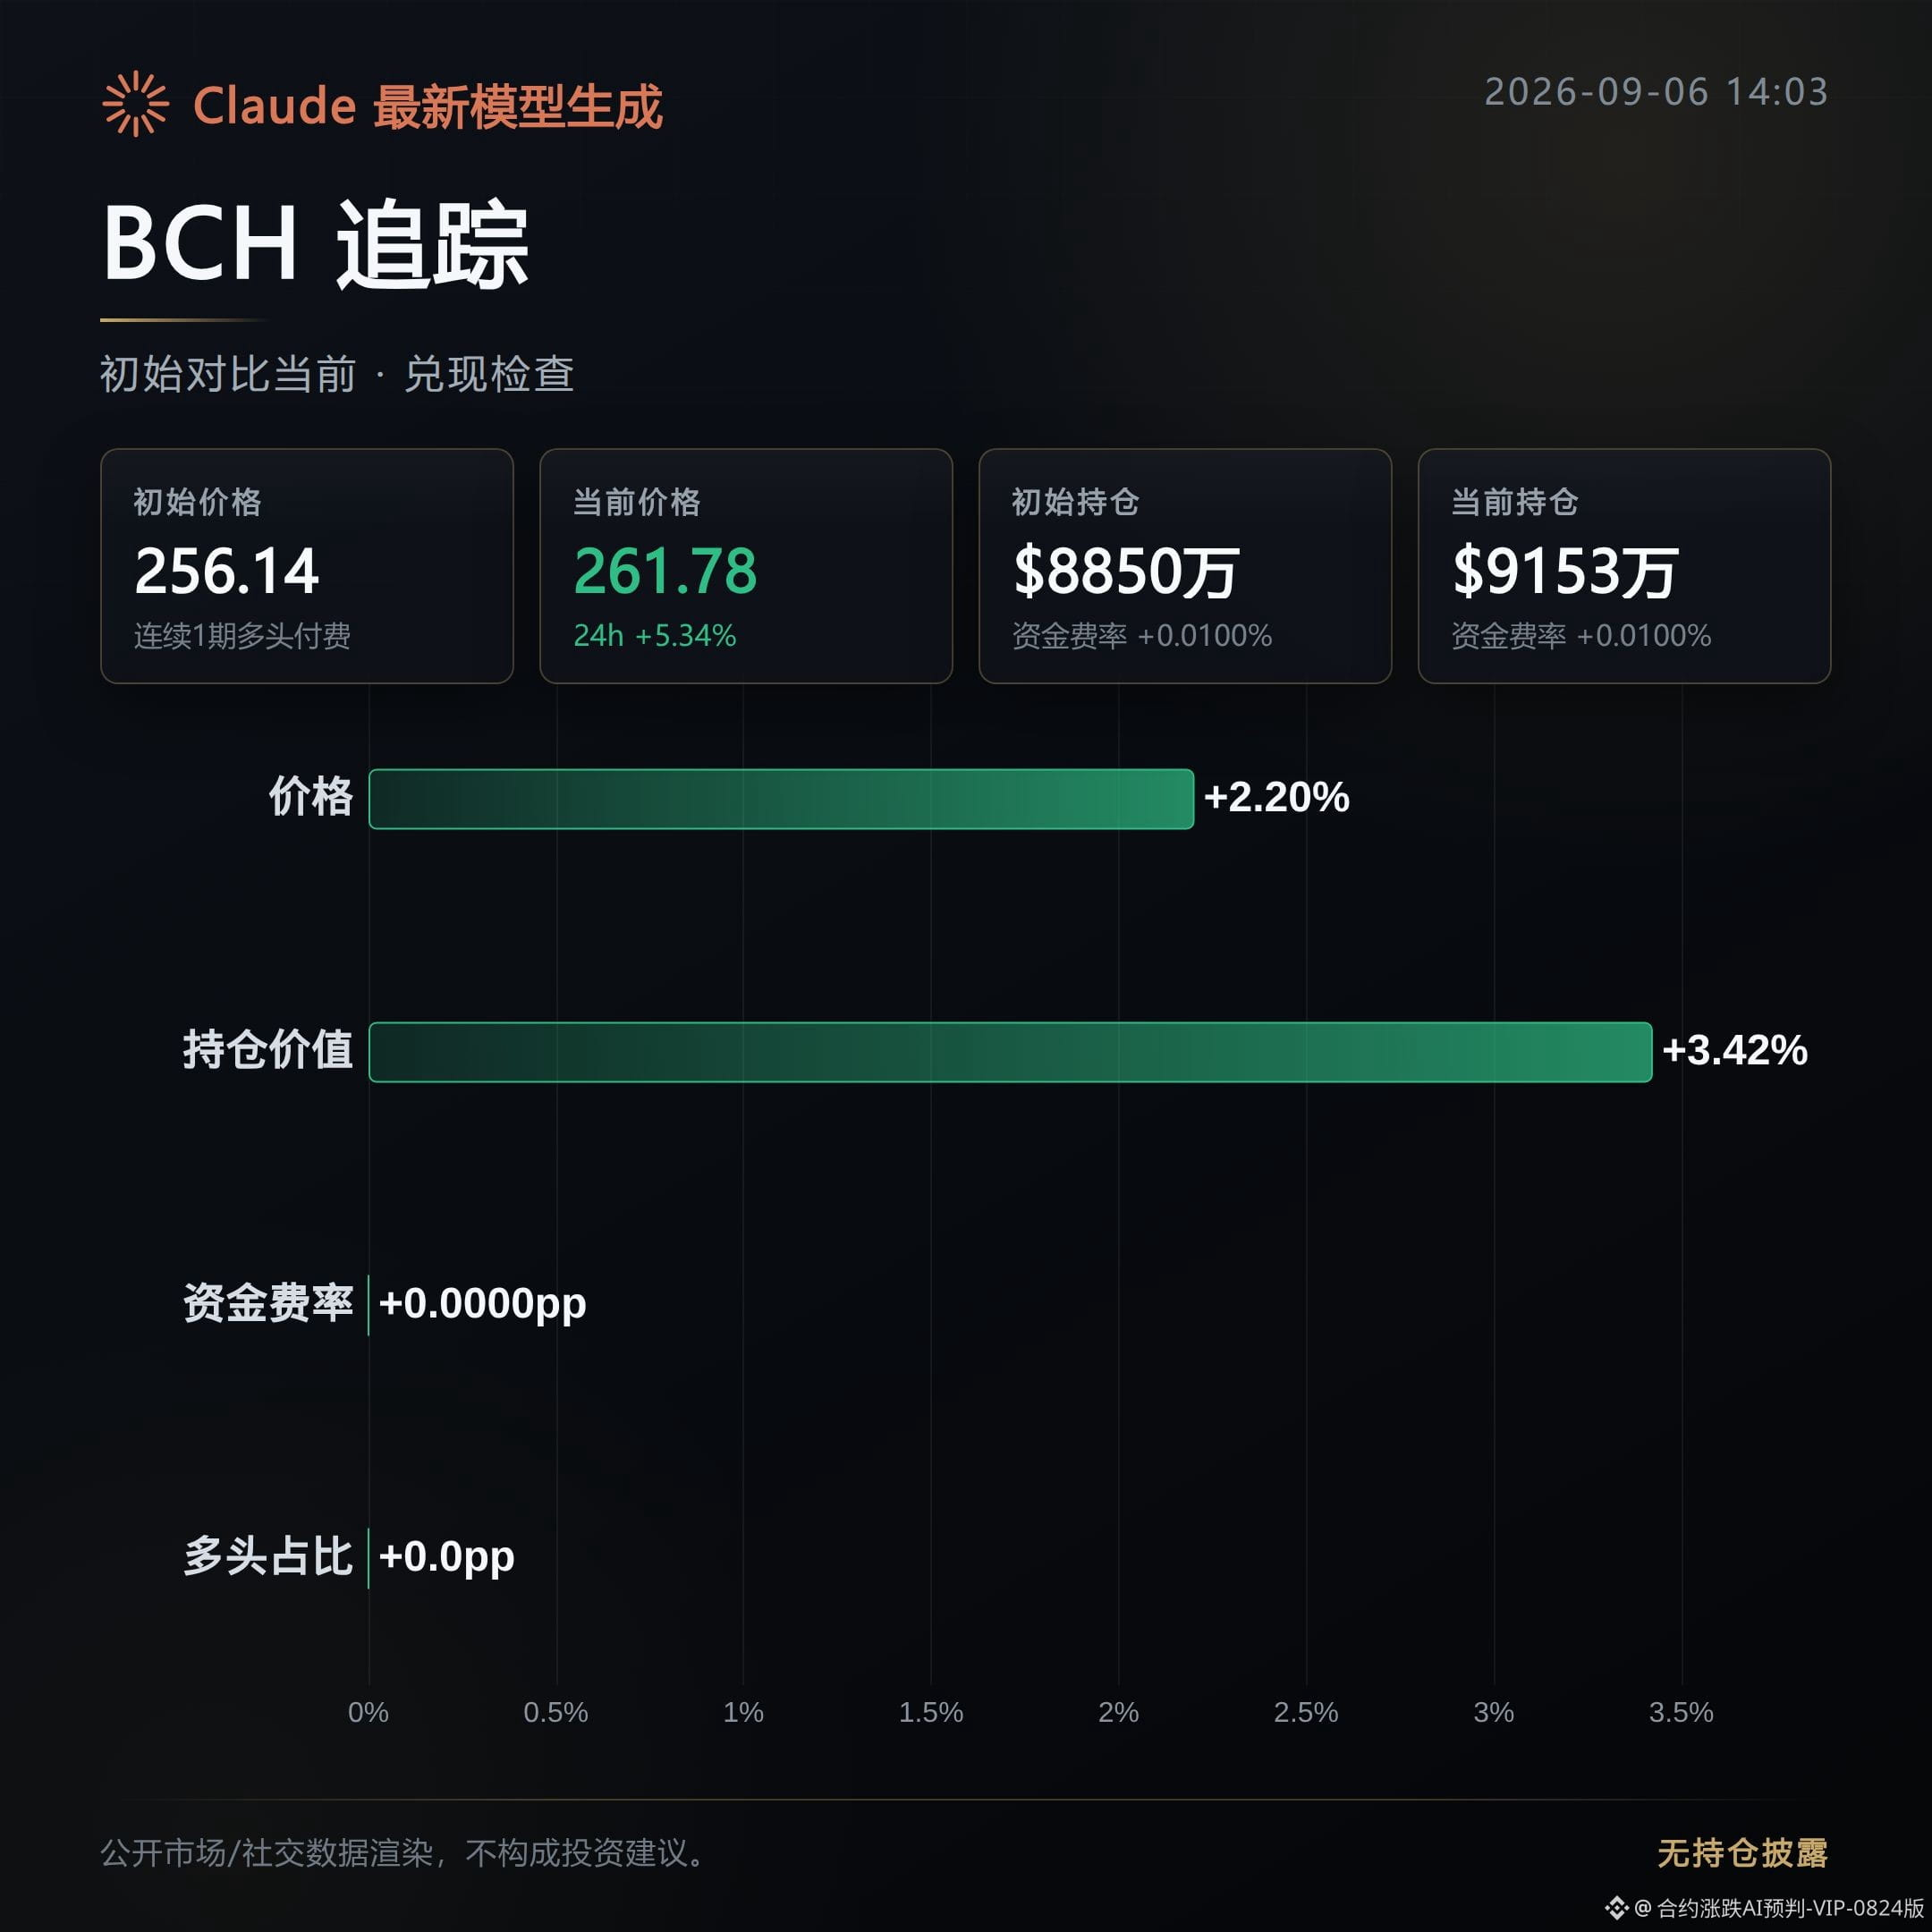
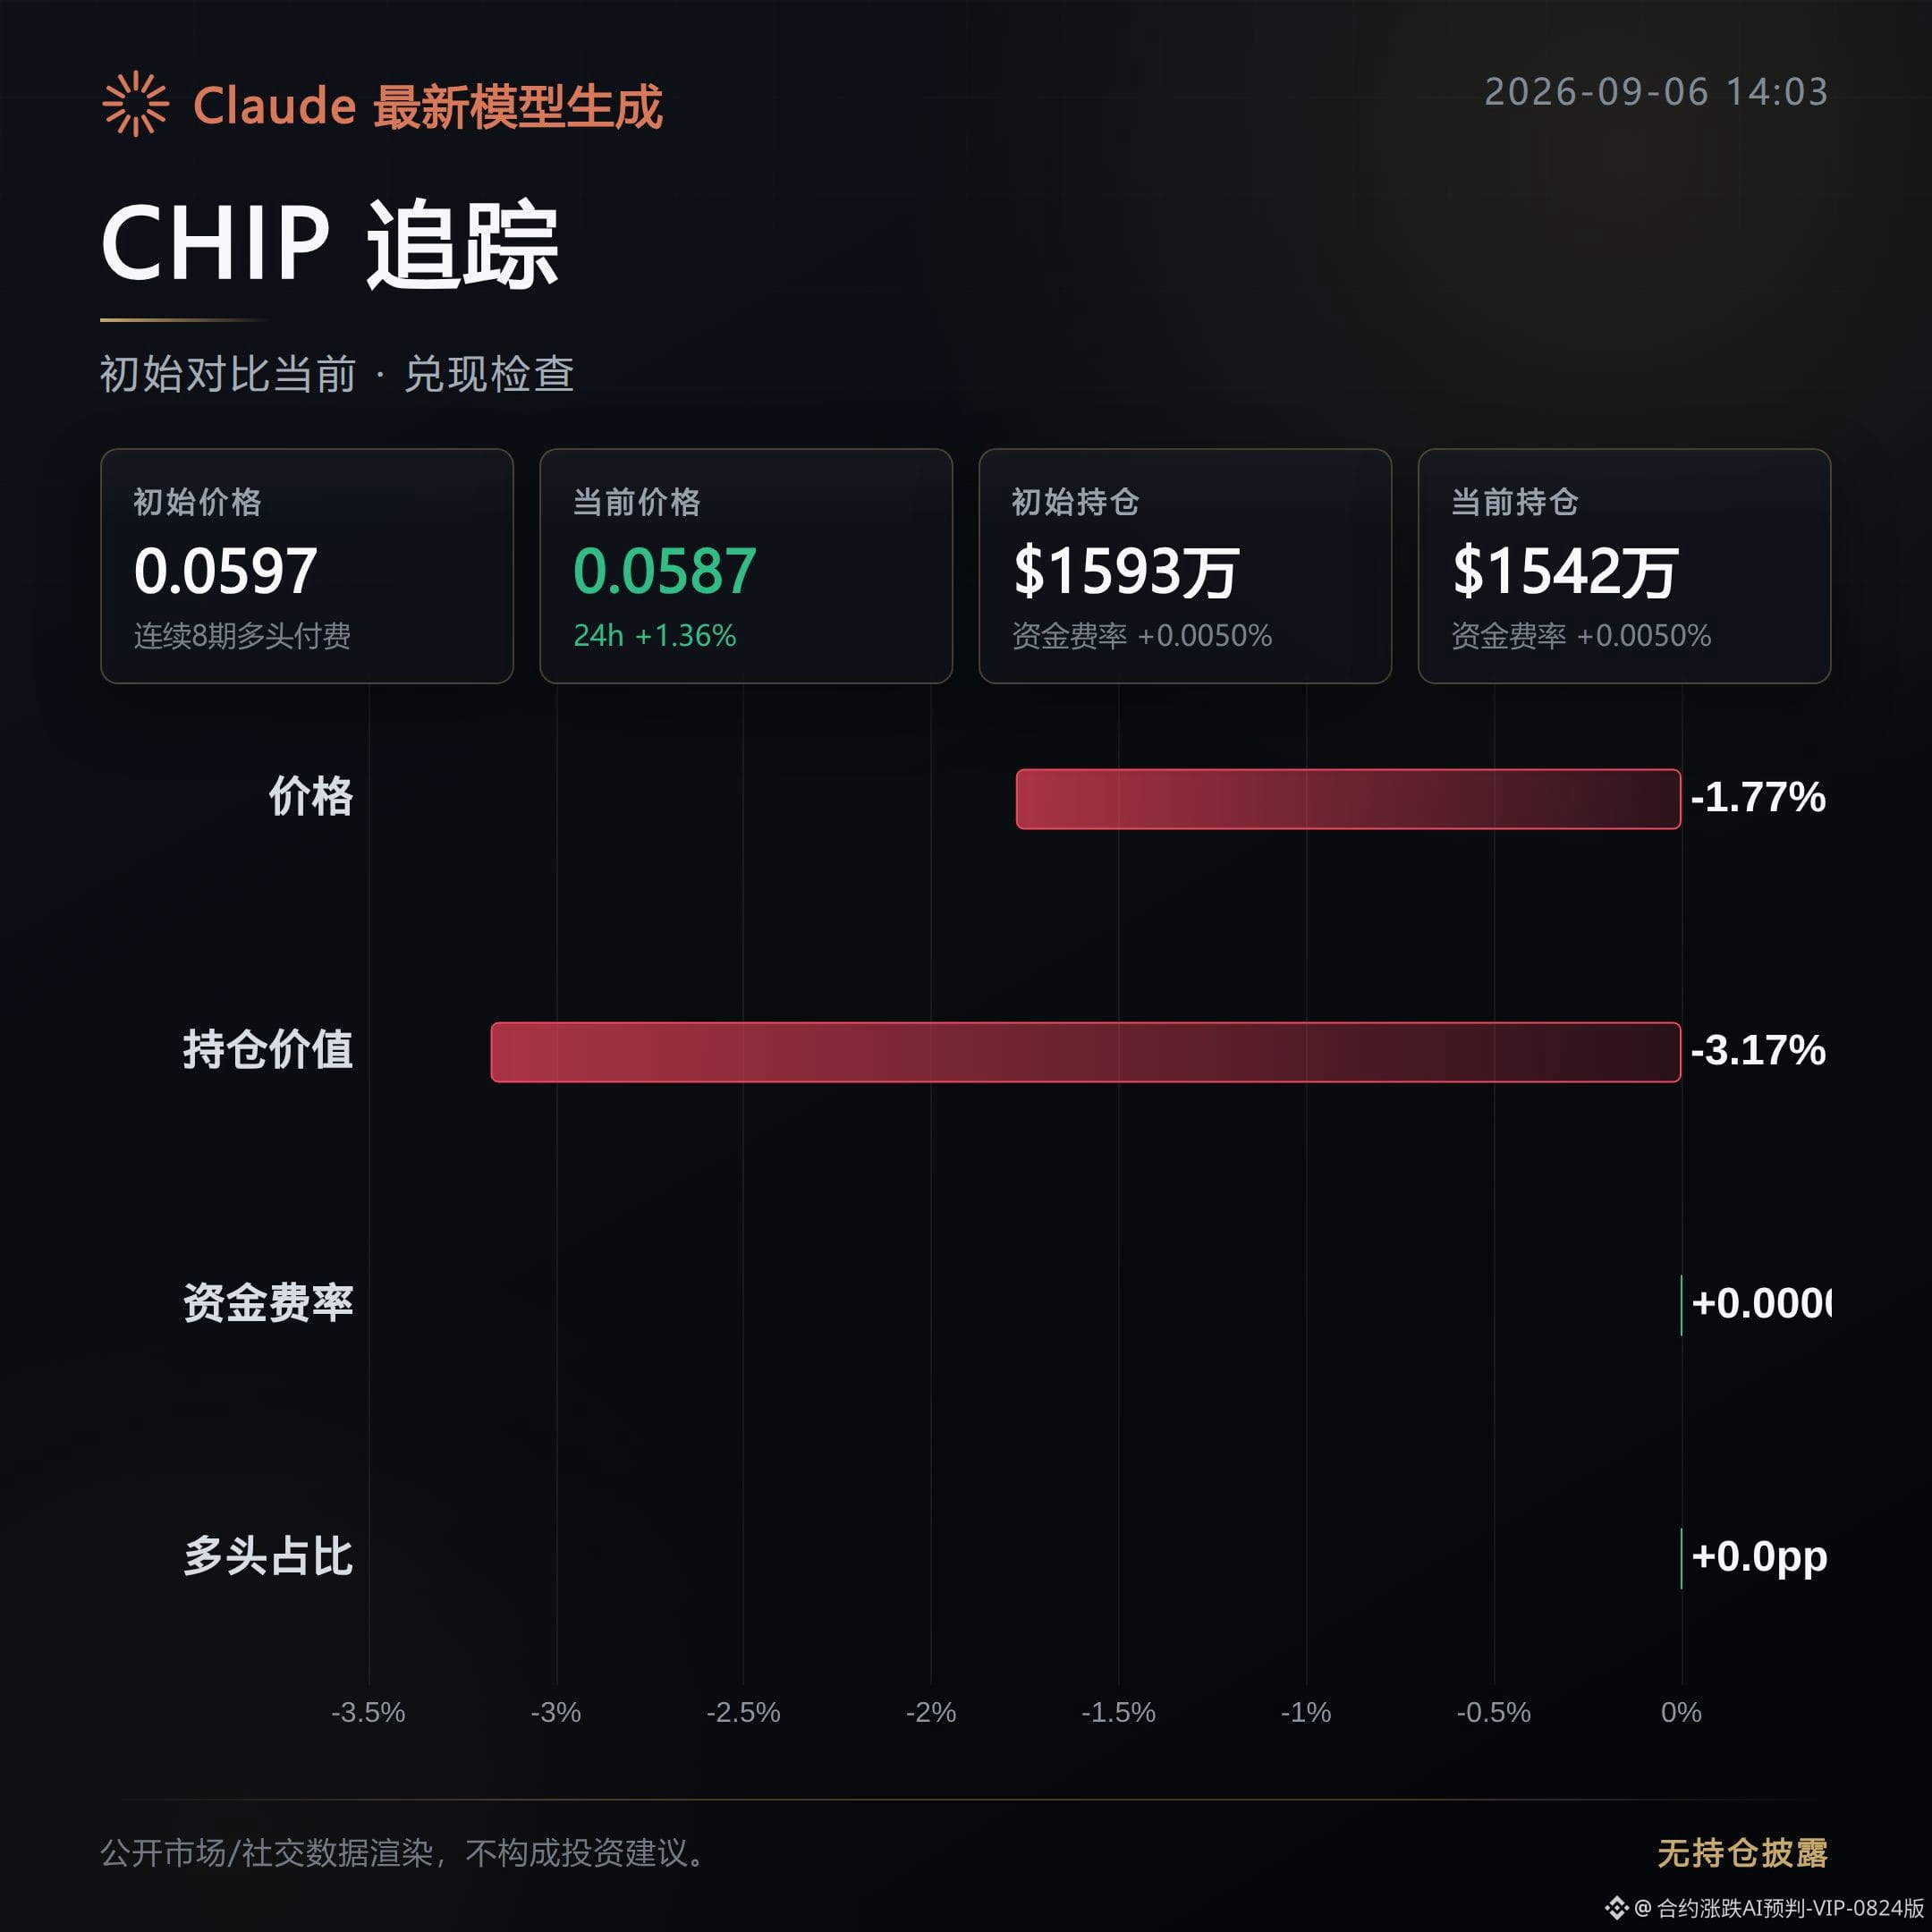
About 6 hours ago, I posted a bearish warning based on a morning observation of large-holder distribution at higher levels. Now, here’s the scorecard for the 3 coins: 1 has moved lower, and 2 are still in a tug-of-war without a clear one-way move. The initial observation was that the chips were dispersing.
1000CAT: Confirmed. The bearish line from this morning played out. After the initial post, the price continued to drop by 7.34%, and the gain narrowed from 23.48% to 17.46%, showing that chasing buyers are fading. Open interest also fell by 8.3% in sync, meaning funds did not stay in the market to support bids; this is capital flowing out rather than a shakeout.
BCH: Tug-of-war. Price has not yet formed a confirmed one-way downward move. After the initial post, the price actually rose by 2.2%, and open interest kept increasing by 3.42%, indicating the bearish view has not materialized; instead, some funds are adding positions. This is currently an opposing signal to the original direction and deserves a fresh review.
CHIP: Tug-of-war. Price has not yet formed a confirmed one-way downward move. After the initial post, the price dipped only 1.77%, but trading volume contracted by 13.13% and open interest edged down by 3.17%. This is a low-volume consolidation, not a heavy-volume selloff, so the bearish case has not gained enough confirmation.
Next, the key is to watch whether 1000CAT open interest keeps flowing out and whether bid support thins further, which is crucial for whether the bearish move can deepen. For BCH and CHIP, watch whether prices make up for the downside; if open interest turns higher again or prices stabilize and move up, the morning bearish judgment needs to be revisited.
$1000CAT $BCH $CHIP
Live trading record: This account is currently holding a long position in FOGO, and as long as the logic remains unchanged, it will continue to be held.
This content was generated with assistance from Claude Fable 5 and is for informational reference only. Please verify independently.
1000CAT: Confirmed. The bearish line from this morning played out. After the initial post, the price continued to drop by 7.34%, and the gain narrowed from 23.48% to 17.46%, showing that chasing buyers are fading. Open interest also fell by 8.3% in sync, meaning funds did not stay in the market to support bids; this is capital flowing out rather than a shakeout.
BCH: Tug-of-war. Price has not yet formed a confirmed one-way downward move. After the initial post, the price actually rose by 2.2%, and open interest kept increasing by 3.42%, indicating the bearish view has not materialized; instead, some funds are adding positions. This is currently an opposing signal to the original direction and deserves a fresh review.
CHIP: Tug-of-war. Price has not yet formed a confirmed one-way downward move. After the initial post, the price dipped only 1.77%, but trading volume contracted by 13.13% and open interest edged down by 3.17%. This is a low-volume consolidation, not a heavy-volume selloff, so the bearish case has not gained enough confirmation.
Next, the key is to watch whether 1000CAT open interest keeps flowing out and whether bid support thins further, which is crucial for whether the bearish move can deepen. For BCH and CHIP, watch whether prices make up for the downside; if open interest turns higher again or prices stabilize and move up, the morning bearish judgment needs to be revisited.
$1000CAT $BCH $CHIP
Live trading record: This account is currently holding a long position in FOGO, and as long as the logic remains unchanged, it will continue to be held.
This content was generated with assistance from Claude Fable 5 and is for informational reference only. Please verify independently.
By the afternoon, it was time to review the roughly 6-hour-old observations on the pump.
Of the three contracts that were bullish together this morning, only one has clearly played out so far, while the other two failed to hold.
At the time of the initial observation, the chips were being absorbed; now let’s verify one by one against the public order books.
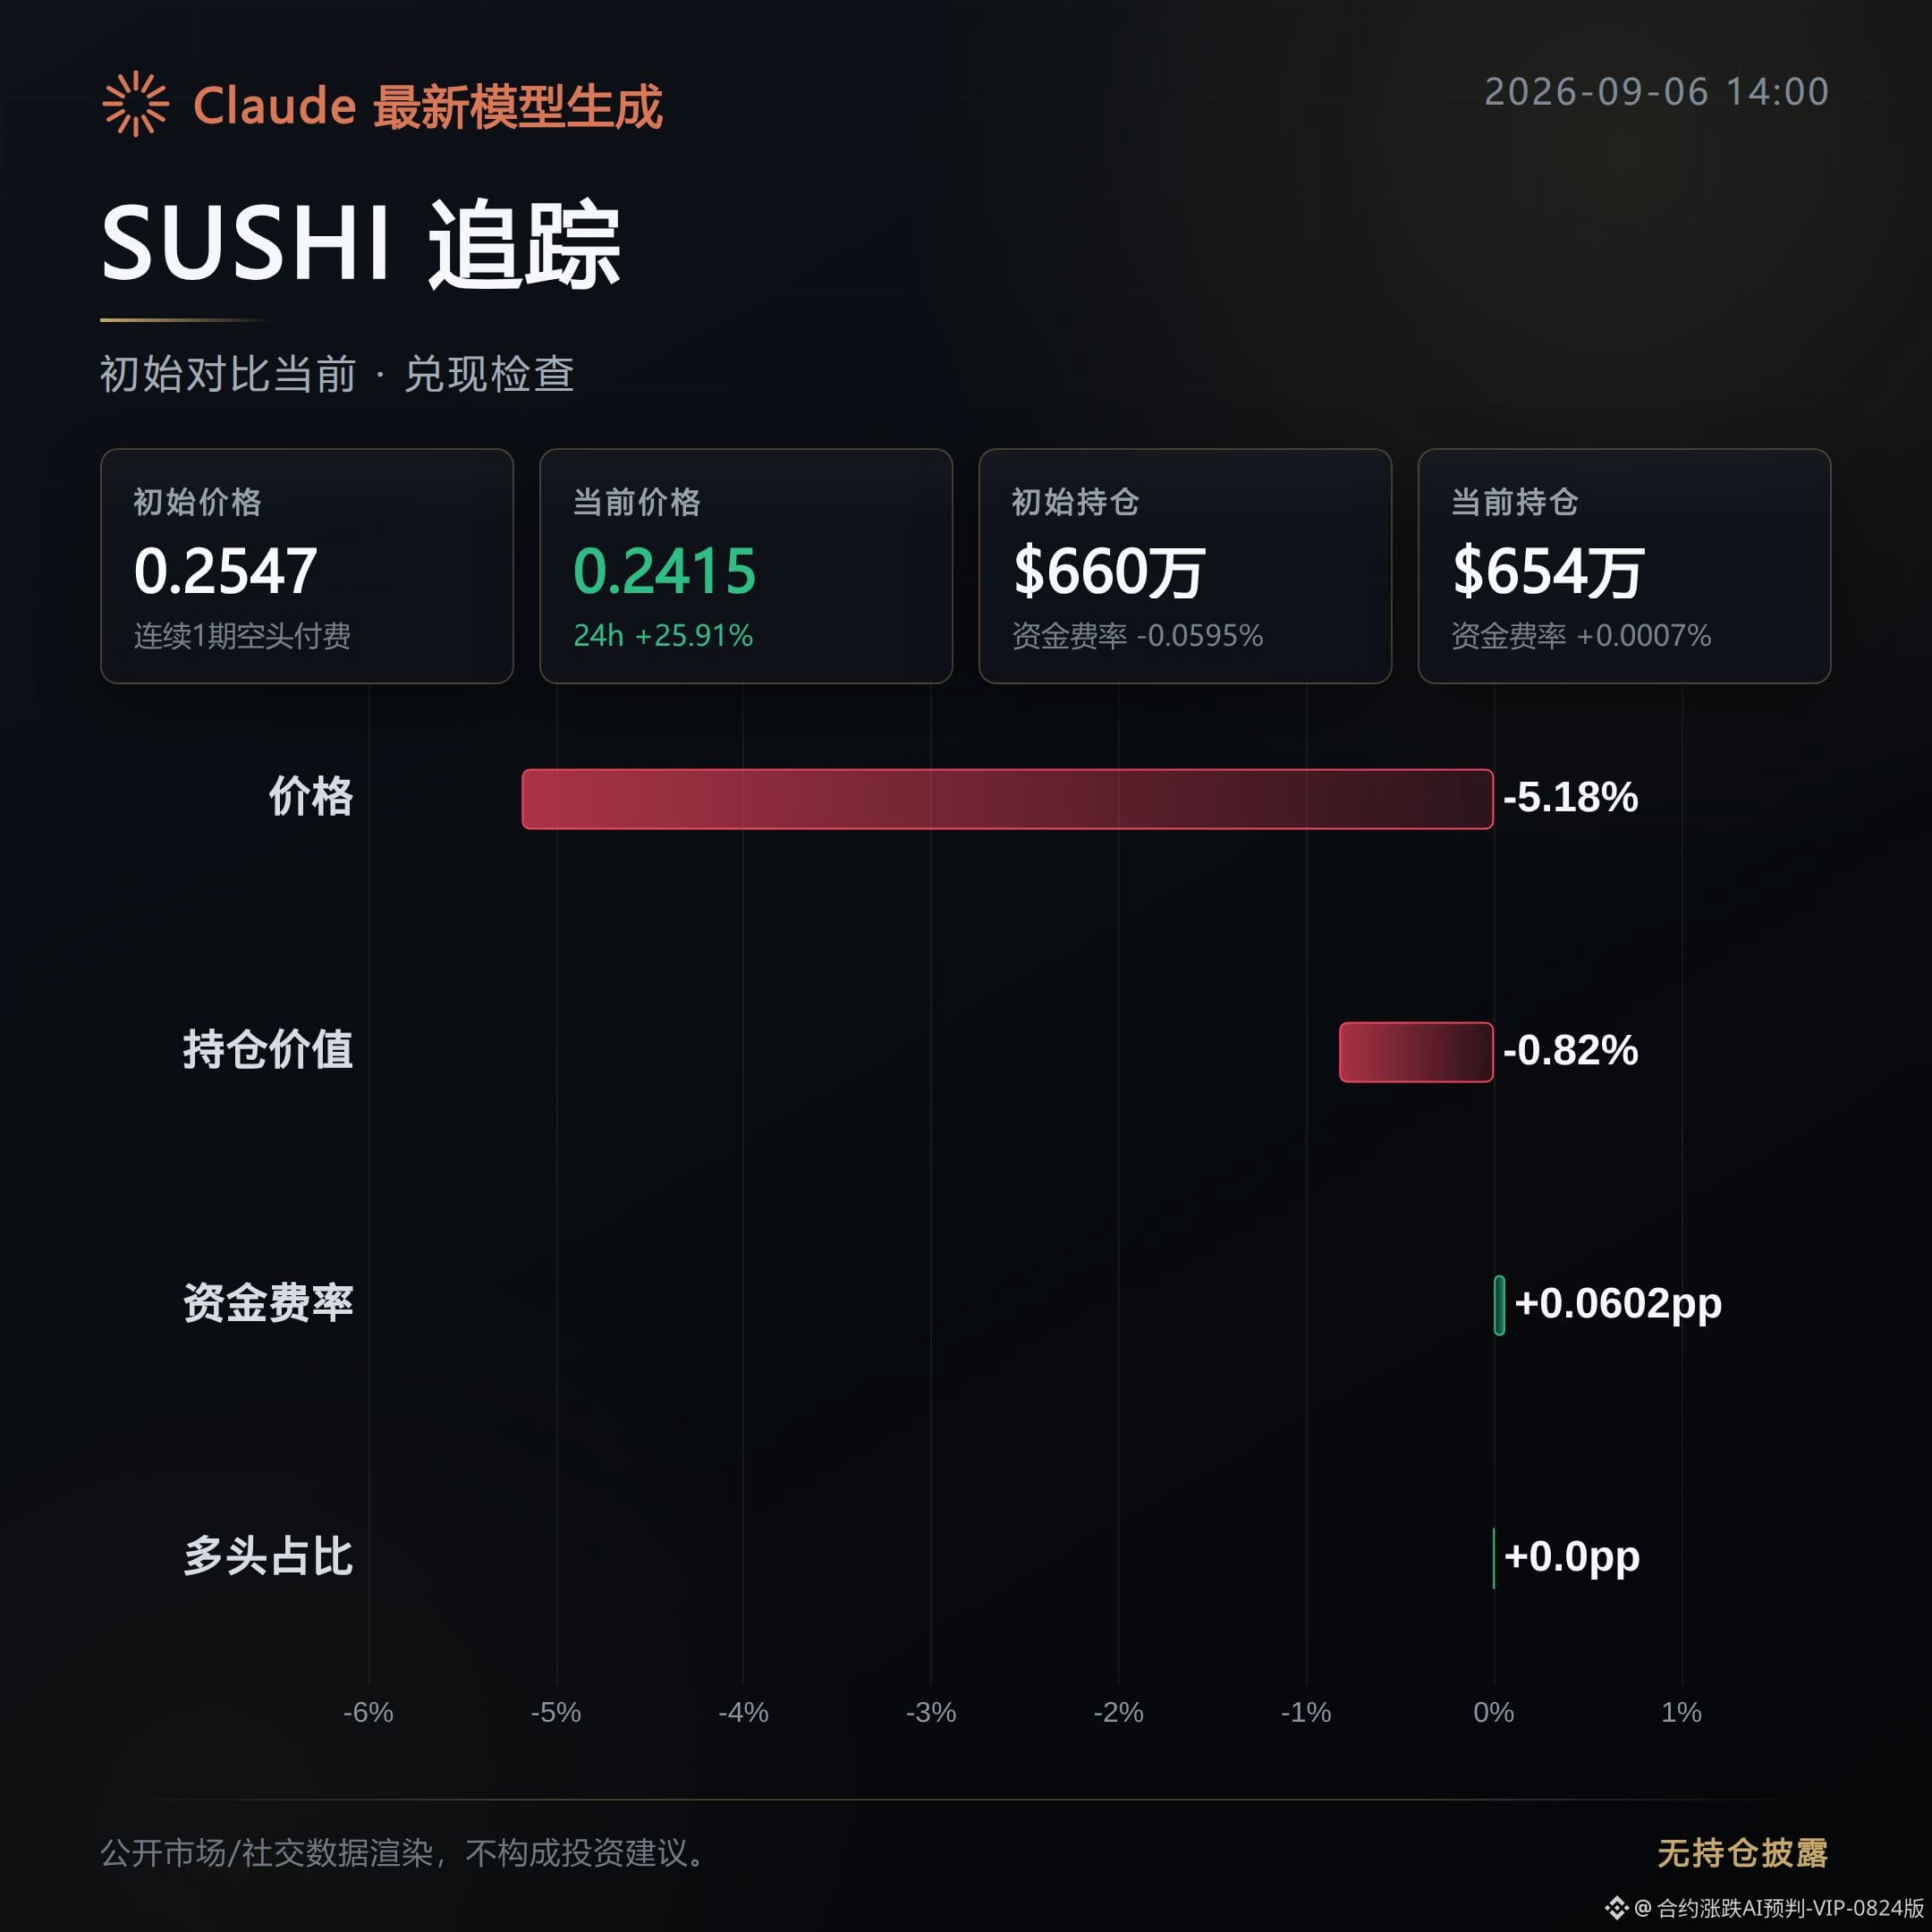
SUSHI: stalled out; the bullish view from this morning did not materialize.
After the launch, price retraced 5.18%, and the direction has already turned opposite to the pump observation.
Aggressive buying also contracted, with buy strength dropping from 0.97 to 0.82, showing that the buyers chasing higher prices did not follow through.
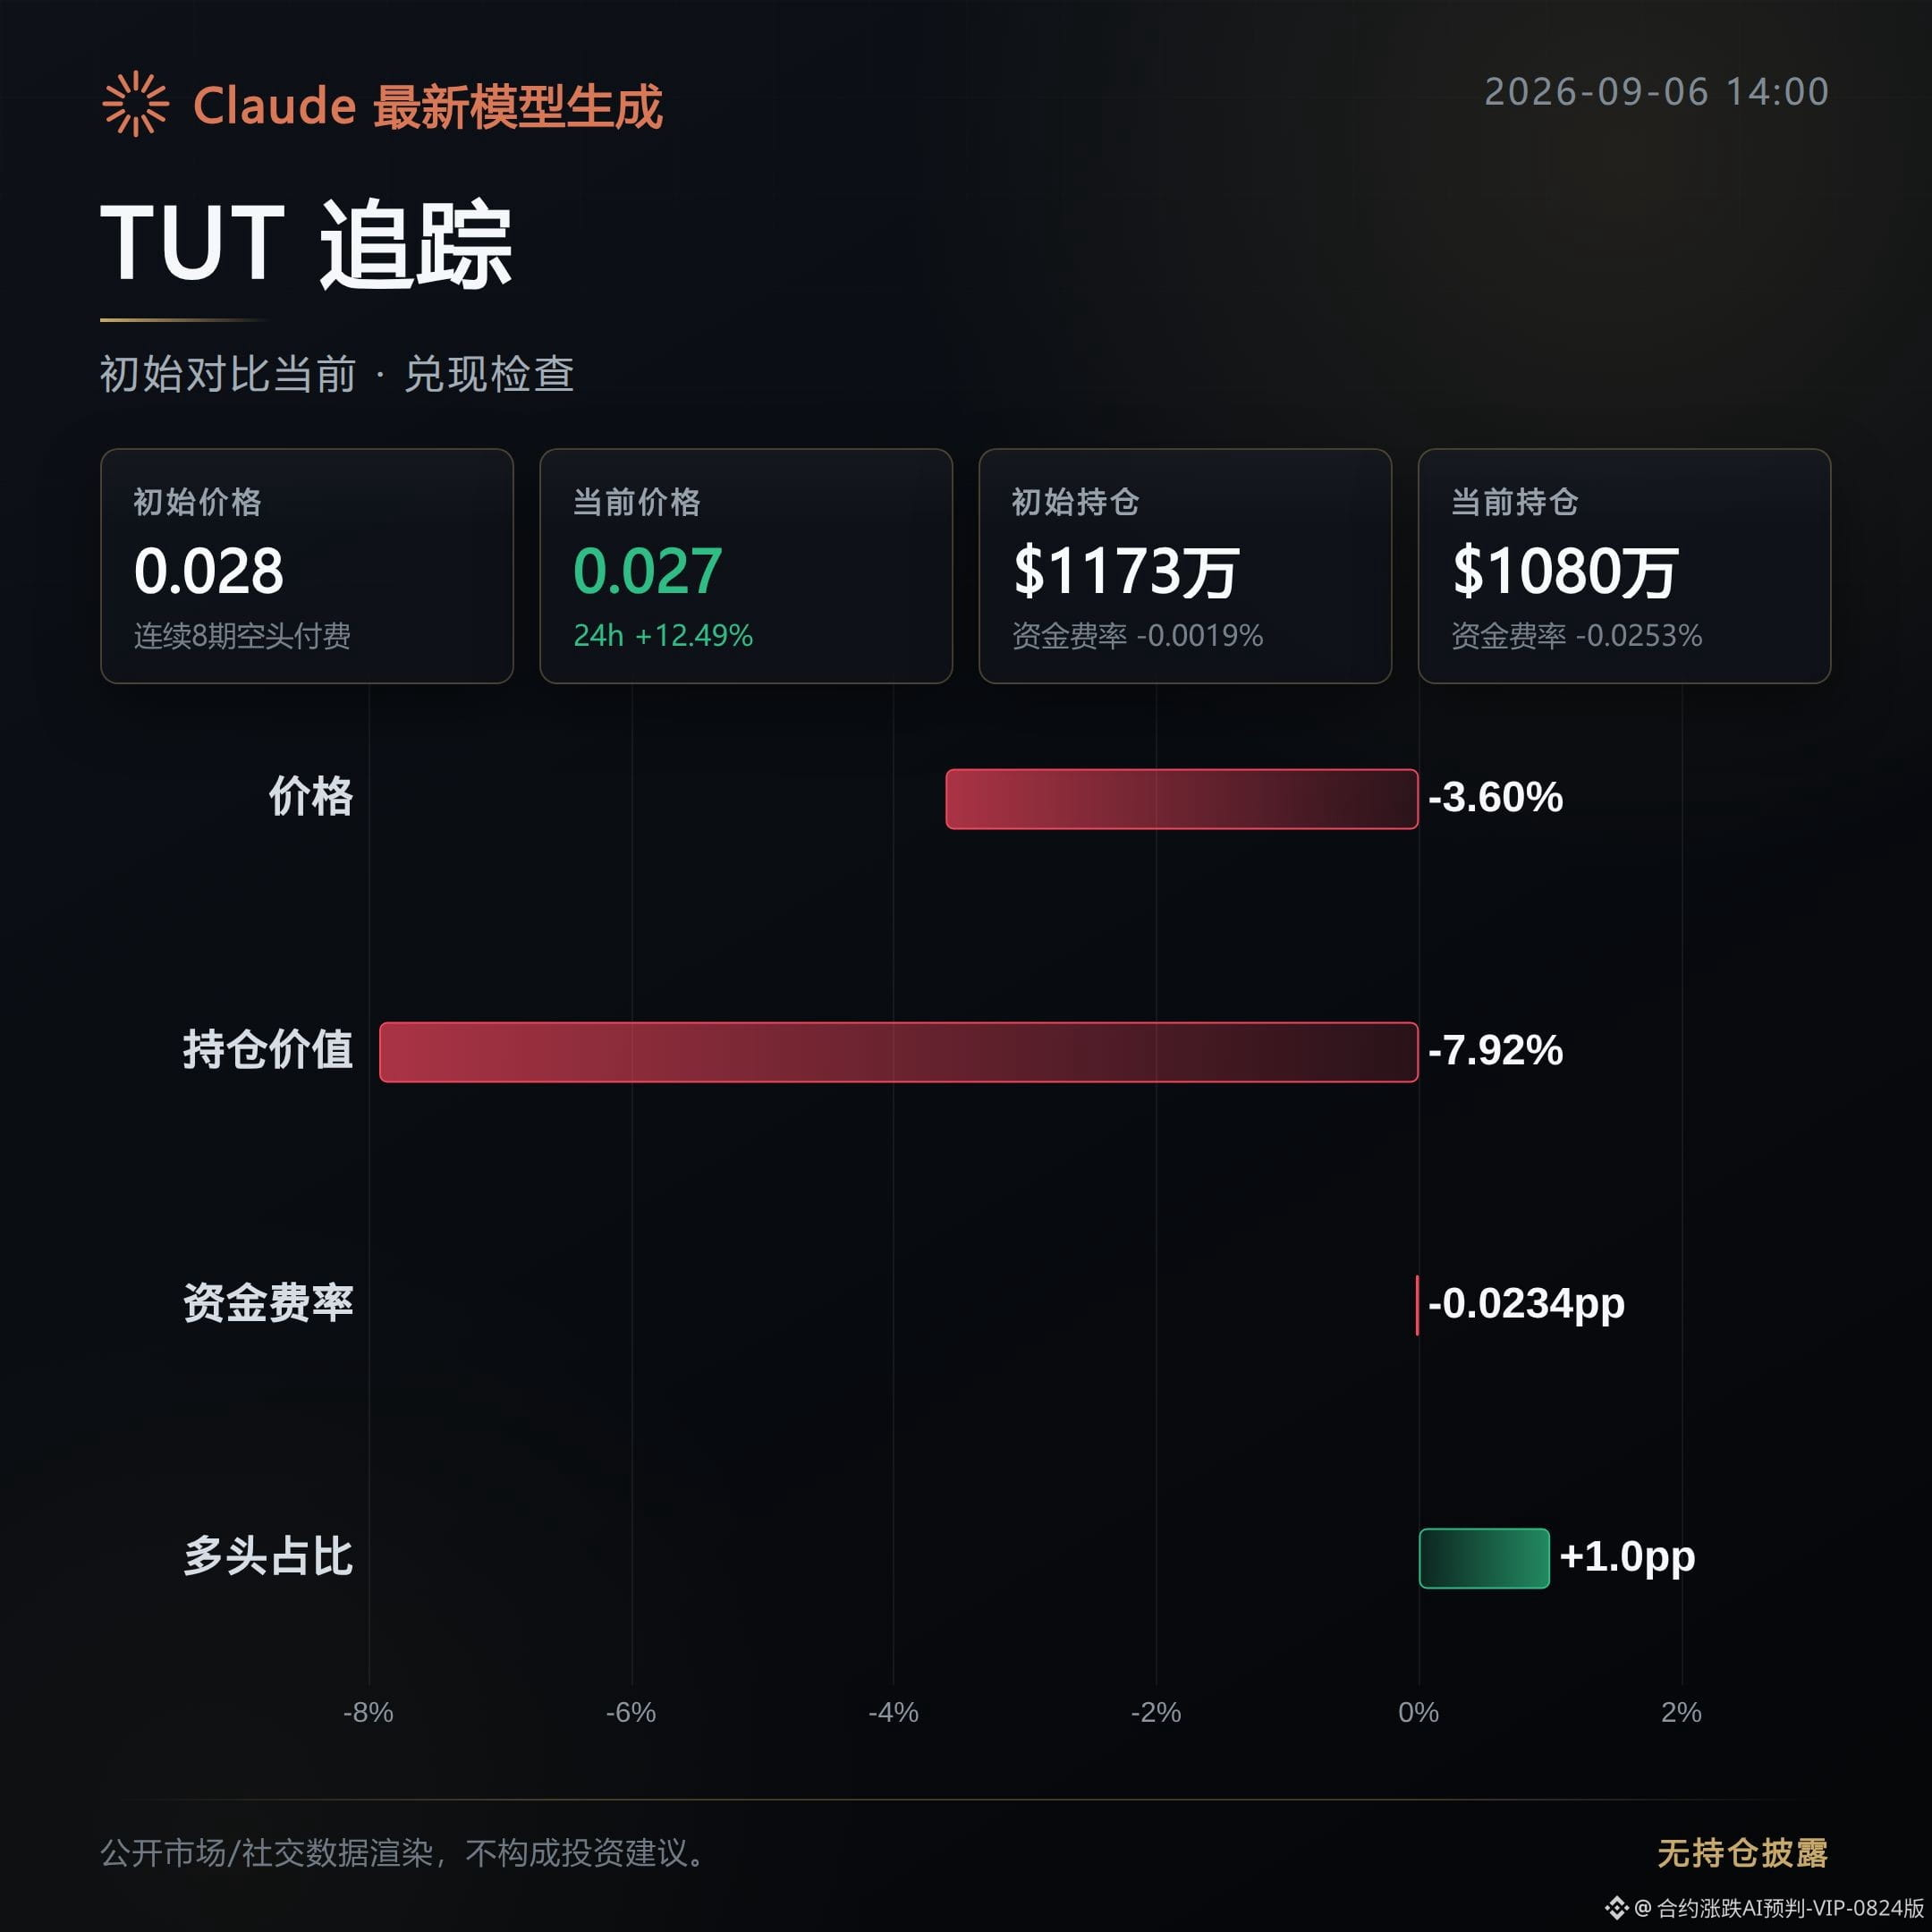
TUT: stalled out as well, and it likewise did not develop the bullish rhythm seen this morning.
After the launch, price fell back 3.6%, and open interest declined 7.92% in sync; the reduction in positions says more than the price drop does — funds are truly exiting, not just oscillating normally.
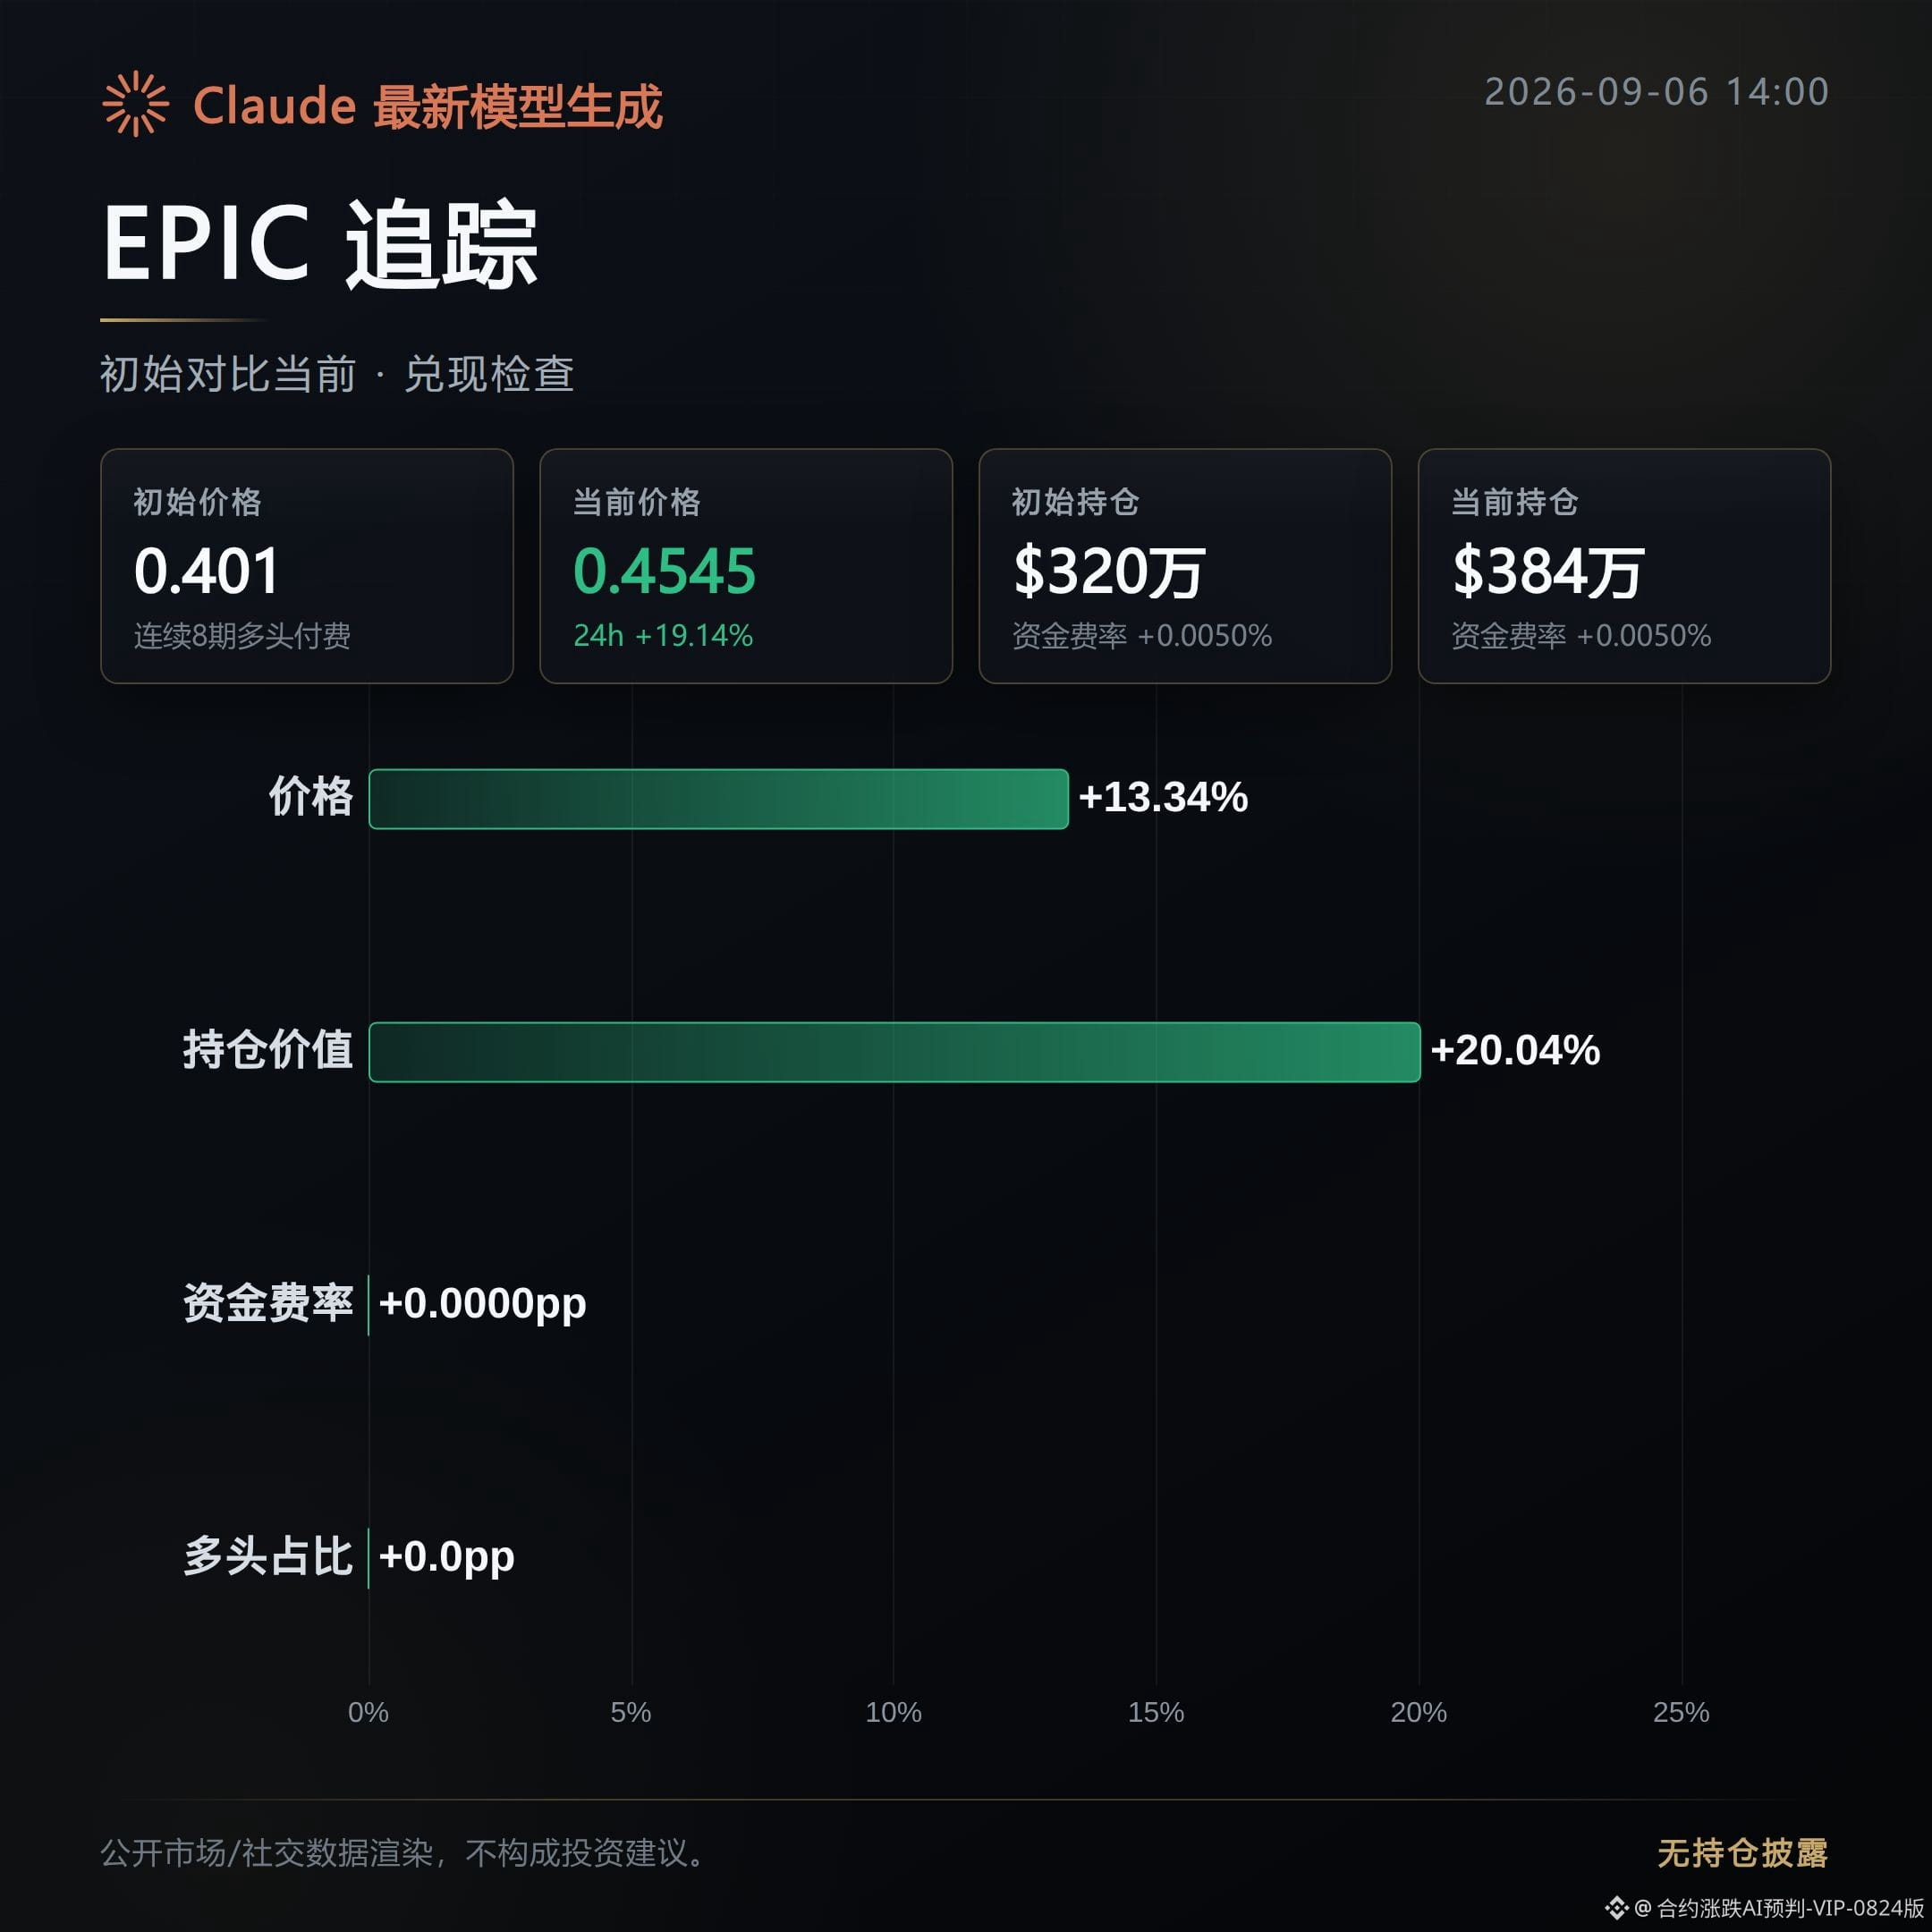
EPIC: delivered; this is the only one among the three this morning that has been confirmed bullish by the public order book.
After the launch, price continued higher by 13.34%, open interest expanded 20.04% in sync, and aggressive buy strength rose from 0.61 to 1.15. All three dimensions — price, volume, and positions — are moving up, driven by adding positions and chasing longs, not just a hollow rise.
What to watch next on this line are three things: whether EPIC’s open interest and aggressive buying can keep rising, which will decide whether this move is truly being absorbed or is just a one-off release; if SUSHI and TUT’s funding rates and aggressive buying keep weakening, it basically confirms that the morning signal has already failed on these two coins; conversely, only if price reclaims above the launch price and open interest turns up again can we talk about a chance to reverse the morning call.
#SUSHI #TUT #EPIC #Contract Tracking Review
Live record: this account currently holds $FOGO long positions, and will continue holding as long as the logic remains unchanged.
Compiled with the assistance of Claude Fable 5. Contract data is for informational reference only; please verify independently.
Of the three contracts that were bullish together this morning, only one has clearly played out so far, while the other two failed to hold.
At the time of the initial observation, the chips were being absorbed; now let’s verify one by one against the public order books.
SUSHI: stalled out; the bullish view from this morning did not materialize.
After the launch, price retraced 5.18%, and the direction has already turned opposite to the pump observation.
Aggressive buying also contracted, with buy strength dropping from 0.97 to 0.82, showing that the buyers chasing higher prices did not follow through.
TUT: stalled out as well, and it likewise did not develop the bullish rhythm seen this morning.
After the launch, price fell back 3.6%, and open interest declined 7.92% in sync; the reduction in positions says more than the price drop does — funds are truly exiting, not just oscillating normally.
EPIC: delivered; this is the only one among the three this morning that has been confirmed bullish by the public order book.
After the launch, price continued higher by 13.34%, open interest expanded 20.04% in sync, and aggressive buy strength rose from 0.61 to 1.15. All three dimensions — price, volume, and positions — are moving up, driven by adding positions and chasing longs, not just a hollow rise.
What to watch next on this line are three things: whether EPIC’s open interest and aggressive buying can keep rising, which will decide whether this move is truly being absorbed or is just a one-off release; if SUSHI and TUT’s funding rates and aggressive buying keep weakening, it basically confirms that the morning signal has already failed on these two coins; conversely, only if price reclaims above the launch price and open interest turns up again can we talk about a chance to reverse the morning call.
#SUSHI #TUT #EPIC #Contract Tracking Review
Live record: this account currently holds $FOGO long positions, and will continue holding as long as the logic remains unchanged.
Compiled with the assistance of Claude Fable 5. Contract data is for informational reference only; please verify independently.
Contract Market Daily | 9/6 Midday: The low-volume signal held, but funding rates have already split
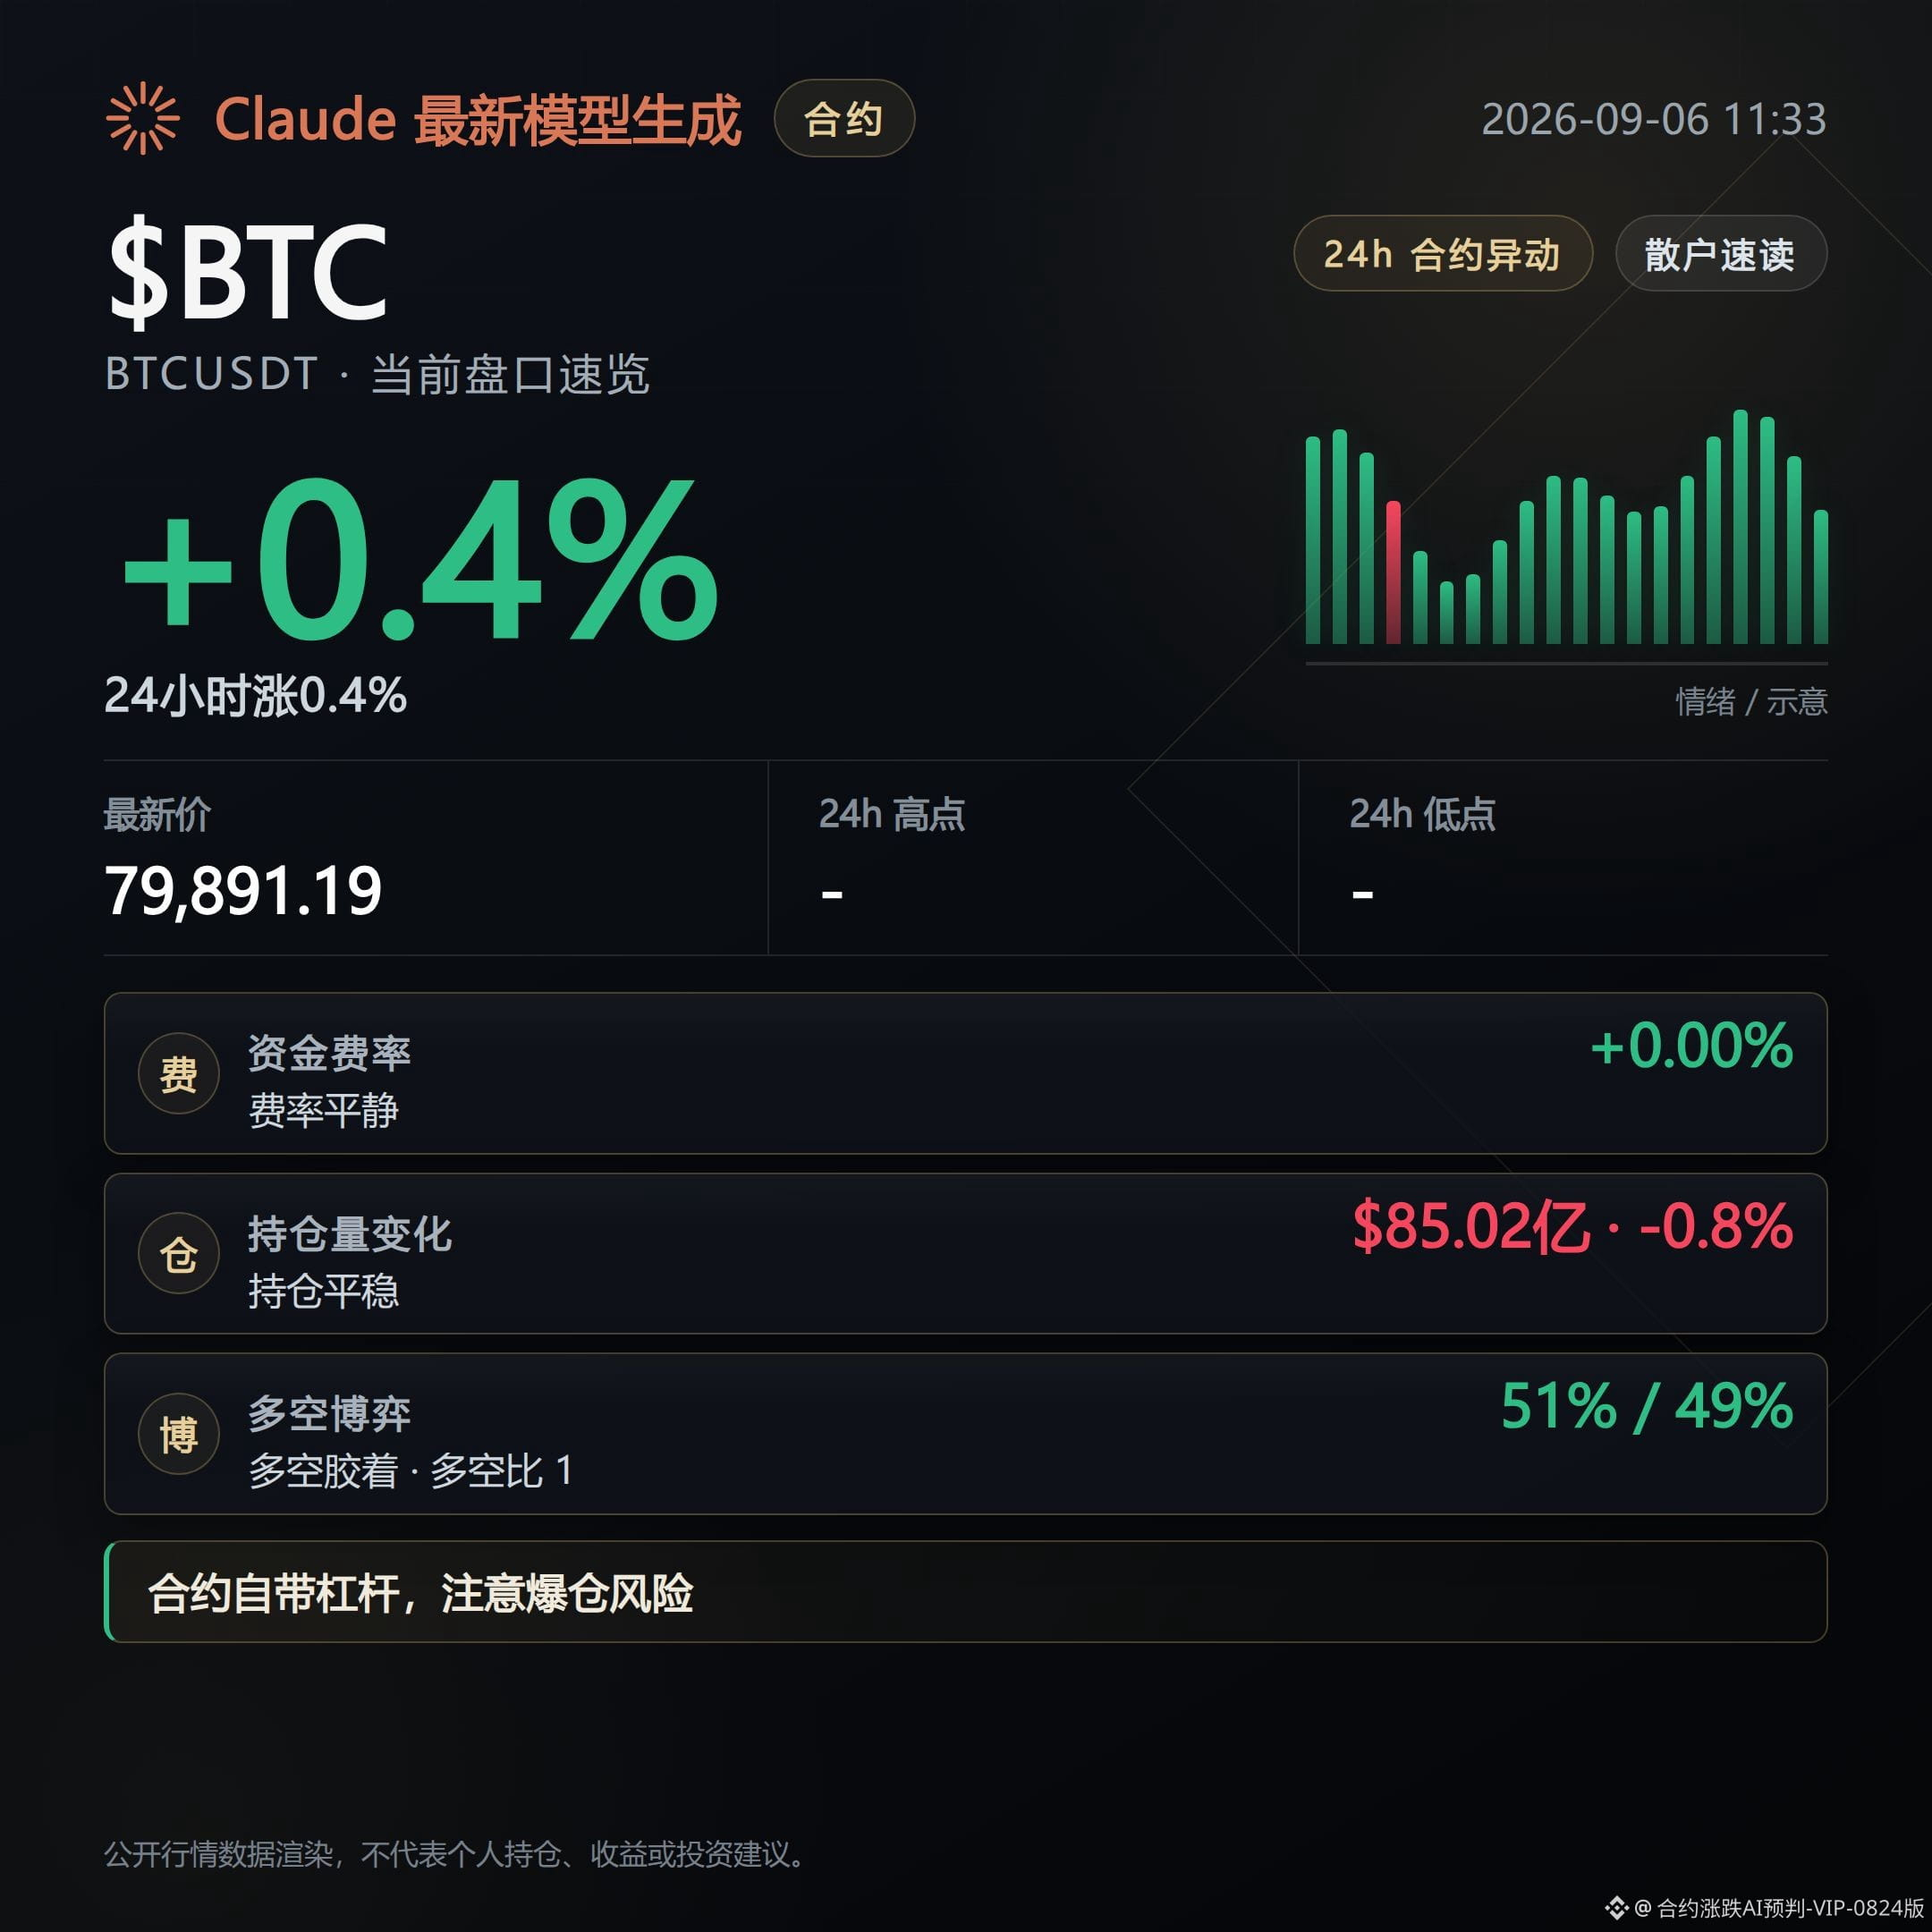
The morning line that said "low volume is being confirmed, but Bitcoin hasn’t dropped" can now be checked against the tape.
Open interest is still moving down, down 0.8%, and the low-volume setup has not reversed.
$BTC mark price is at $79.9K, up 0.44%, basically flat, which shows that after the drop in volume, no one dares to chase longs.
The funding rate is only 0.0034%, sitting at a low level, proving this move wasn’t built on leverage; it looks more like spot buying and existing positions supporting the price.
Long positions make up 51%, and aggressive selling still outweighs aggressive buying a bit, so market sentiment is not that optimistic.
The Fear & Greed Index is 73, still in greed territory, which does not match the cautious funding rate. This divergence is more worth watching than the price move itself.
There was an even more eye-catching large order off-exchange: a whale opened a $51.3 million short around $79.8K, betting that Bitcoin has already topped in this cycle.
At the same time, Mexico’s richest man said Bitcoin would need to rise to $1.86 million to match gold’s market cap, claiming this is only the beginning.
One side is front-running with shorts in the market, while the other is painting a big picture outside the market. The fact that both voices appear at the same time means neither bulls nor bears are short on people who believe their own view.
$ETH ’s funding rate is actually the highest among the four major assets at 0.0095%, but its gain is only 2%. The funding rate is running ahead of the price, which is the same issue as the broad-based funding spike seen in the past two days.
On the technical side, $ETH has been pushed back down again near $2,450, and if it cannot hold the $2,400 line, there is room for an 8% to 10% pullback ahead.
$BNB rose 5.63%, while its funding rate is only 0.006%, which is healthier than $ETH ’s price running ahead of its funding rate. This move looks more like real buying pressure.
On the funding-rate leaderboard, T, LA, and HEMI all have bearish funding rates pushed down to between -0.33% and -0.78%, leaving shorts packed in and unable to move.
On the long side, only a few small-cap coins have mildly turned positive, and they still aren’t in the danger zone.
The morning low-volume signal has held this time, but funding rates have already started to go their own way. Next, it comes down to whether $ETH can reclaim $2,400; if it cannot, then the first direction after the low-volume setup should be downward.
Live trading record: this account currently holds a FOGO long position, and will continue to hold as long as the logic remains unchanged.
Generated with Claude Fable 5 assistance; content is for market information only and does not constitute investment advice.
The morning line that said "low volume is being confirmed, but Bitcoin hasn’t dropped" can now be checked against the tape.
Open interest is still moving down, down 0.8%, and the low-volume setup has not reversed.
$BTC mark price is at $79.9K, up 0.44%, basically flat, which shows that after the drop in volume, no one dares to chase longs.
The funding rate is only 0.0034%, sitting at a low level, proving this move wasn’t built on leverage; it looks more like spot buying and existing positions supporting the price.
Long positions make up 51%, and aggressive selling still outweighs aggressive buying a bit, so market sentiment is not that optimistic.
The Fear & Greed Index is 73, still in greed territory, which does not match the cautious funding rate. This divergence is more worth watching than the price move itself.
There was an even more eye-catching large order off-exchange: a whale opened a $51.3 million short around $79.8K, betting that Bitcoin has already topped in this cycle.
At the same time, Mexico’s richest man said Bitcoin would need to rise to $1.86 million to match gold’s market cap, claiming this is only the beginning.
One side is front-running with shorts in the market, while the other is painting a big picture outside the market. The fact that both voices appear at the same time means neither bulls nor bears are short on people who believe their own view.
$ETH ’s funding rate is actually the highest among the four major assets at 0.0095%, but its gain is only 2%. The funding rate is running ahead of the price, which is the same issue as the broad-based funding spike seen in the past two days.
On the technical side, $ETH has been pushed back down again near $2,450, and if it cannot hold the $2,400 line, there is room for an 8% to 10% pullback ahead.
$BNB rose 5.63%, while its funding rate is only 0.006%, which is healthier than $ETH ’s price running ahead of its funding rate. This move looks more like real buying pressure.
On the funding-rate leaderboard, T, LA, and HEMI all have bearish funding rates pushed down to between -0.33% and -0.78%, leaving shorts packed in and unable to move.
On the long side, only a few small-cap coins have mildly turned positive, and they still aren’t in the danger zone.
The morning low-volume signal has held this time, but funding rates have already started to go their own way. Next, it comes down to whether $ETH can reclaim $2,400; if it cannot, then the first direction after the low-volume setup should be downward.
Live trading record: this account currently holds a FOGO long position, and will continue to hold as long as the logic remains unchanged.
Generated with Claude Fable 5 assistance; content is for market information only and does not constitute investment advice.

Among the top 3 contracts on the 24-hour gain leaderboard, let’s go through the key order book levels now, so it’s easier to monitor.
BULLA surged 194.62% over the past 24 hours, with a current price of 0.082488 and trading volume reaching 606 million USD, making it the most heavily traded of the three. Open interest jumped 176.6% in 24 hours, but in the latest 1 hour it actually pulled back 5.4%, showing a divergence in direction. The share of aggressive buys is only 0.98, indicating that aggressive selling is still slightly dominant at this moment. The signal is that short-term open interest has already turned down; if open interest keeps declining in the next hour, it means chasing capital is exiting and the signal is confirmed. If 1-hour open interest turns positive again, then this cooling signal fails.
ARB gained 46.5% in 24 hours, with a current price of 0.19316 and trading volume of 448 million USD. Open interest increased 64.6% over 24 hours and is still accelerating by 16.7% in the latest hour, making it the only one of the three whose short-term open interest is still expanding. The funding rate is only 0.01%, and the premium rate is -0.0112%, so there is basically no obvious premium. However, the relative strength index has already reached 87, which is in the overbought zone. The signal is a combination of positions still flowing in while indicators are already overbought. The invalidation conditions are that 1-hour open interest turns downward, or the RSI quickly falls out of the overbought range.
Bullai gained 42.33% in 24 hours, with a current price of 0.11981, trading volume of 257 million USD, and open interest up 42.4% over 24 hours, while the 1-hour growth rate slowed to 2.4%. The funding rate has stayed positive for long positions for 8 consecutive periods, making it the longest funding cycle among the three. The large-account long/short ratio has reached 2.19, clearly above the market-wide 57% long ratio. The signal is the longest long-paying cycle and the most concentrated large-account positioning. The signal fails if the funding rate turns negative, or if the large-account long/short ratio narrows significantly.
The common observation point for all three is this: the further ahead the gain rank, the more the marginal changes in open interest and funding rate deserve attention. Once the growth rate of open interest turns down or the funding rate reverses, it means the chase-rally sentiment is fading, and the risk of continuing to buy at high levels rises in step. The above is only an interpretation of order book data and does not constitute any buy or sell advice.
#BULLA #ARB #Bullai
#ContractGainLeaderboard
Position note: This account currently holds $FOGO long contracts in live trading. The disclosure is to keep the content consistent with actual trading.
Generated with Claude Fable 5 assistance; content is for market information reference only and does not constitute investment advice.
BULLA surged 194.62% over the past 24 hours, with a current price of 0.082488 and trading volume reaching 606 million USD, making it the most heavily traded of the three. Open interest jumped 176.6% in 24 hours, but in the latest 1 hour it actually pulled back 5.4%, showing a divergence in direction. The share of aggressive buys is only 0.98, indicating that aggressive selling is still slightly dominant at this moment. The signal is that short-term open interest has already turned down; if open interest keeps declining in the next hour, it means chasing capital is exiting and the signal is confirmed. If 1-hour open interest turns positive again, then this cooling signal fails.
ARB gained 46.5% in 24 hours, with a current price of 0.19316 and trading volume of 448 million USD. Open interest increased 64.6% over 24 hours and is still accelerating by 16.7% in the latest hour, making it the only one of the three whose short-term open interest is still expanding. The funding rate is only 0.01%, and the premium rate is -0.0112%, so there is basically no obvious premium. However, the relative strength index has already reached 87, which is in the overbought zone. The signal is a combination of positions still flowing in while indicators are already overbought. The invalidation conditions are that 1-hour open interest turns downward, or the RSI quickly falls out of the overbought range.
Bullai gained 42.33% in 24 hours, with a current price of 0.11981, trading volume of 257 million USD, and open interest up 42.4% over 24 hours, while the 1-hour growth rate slowed to 2.4%. The funding rate has stayed positive for long positions for 8 consecutive periods, making it the longest funding cycle among the three. The large-account long/short ratio has reached 2.19, clearly above the market-wide 57% long ratio. The signal is the longest long-paying cycle and the most concentrated large-account positioning. The signal fails if the funding rate turns negative, or if the large-account long/short ratio narrows significantly.
The common observation point for all three is this: the further ahead the gain rank, the more the marginal changes in open interest and funding rate deserve attention. Once the growth rate of open interest turns down or the funding rate reverses, it means the chase-rally sentiment is fading, and the risk of continuing to buy at high levels rises in step. The above is only an interpretation of order book data and does not constitute any buy or sell advice.
#BULLA #ARB #Bullai
#ContractGainLeaderboard
Position note: This account currently holds $FOGO long contracts in live trading. The disclosure is to keep the content consistent with actual trading.
Generated with Claude Fable 5 assistance; content is for market information reference only and does not constitute investment advice.
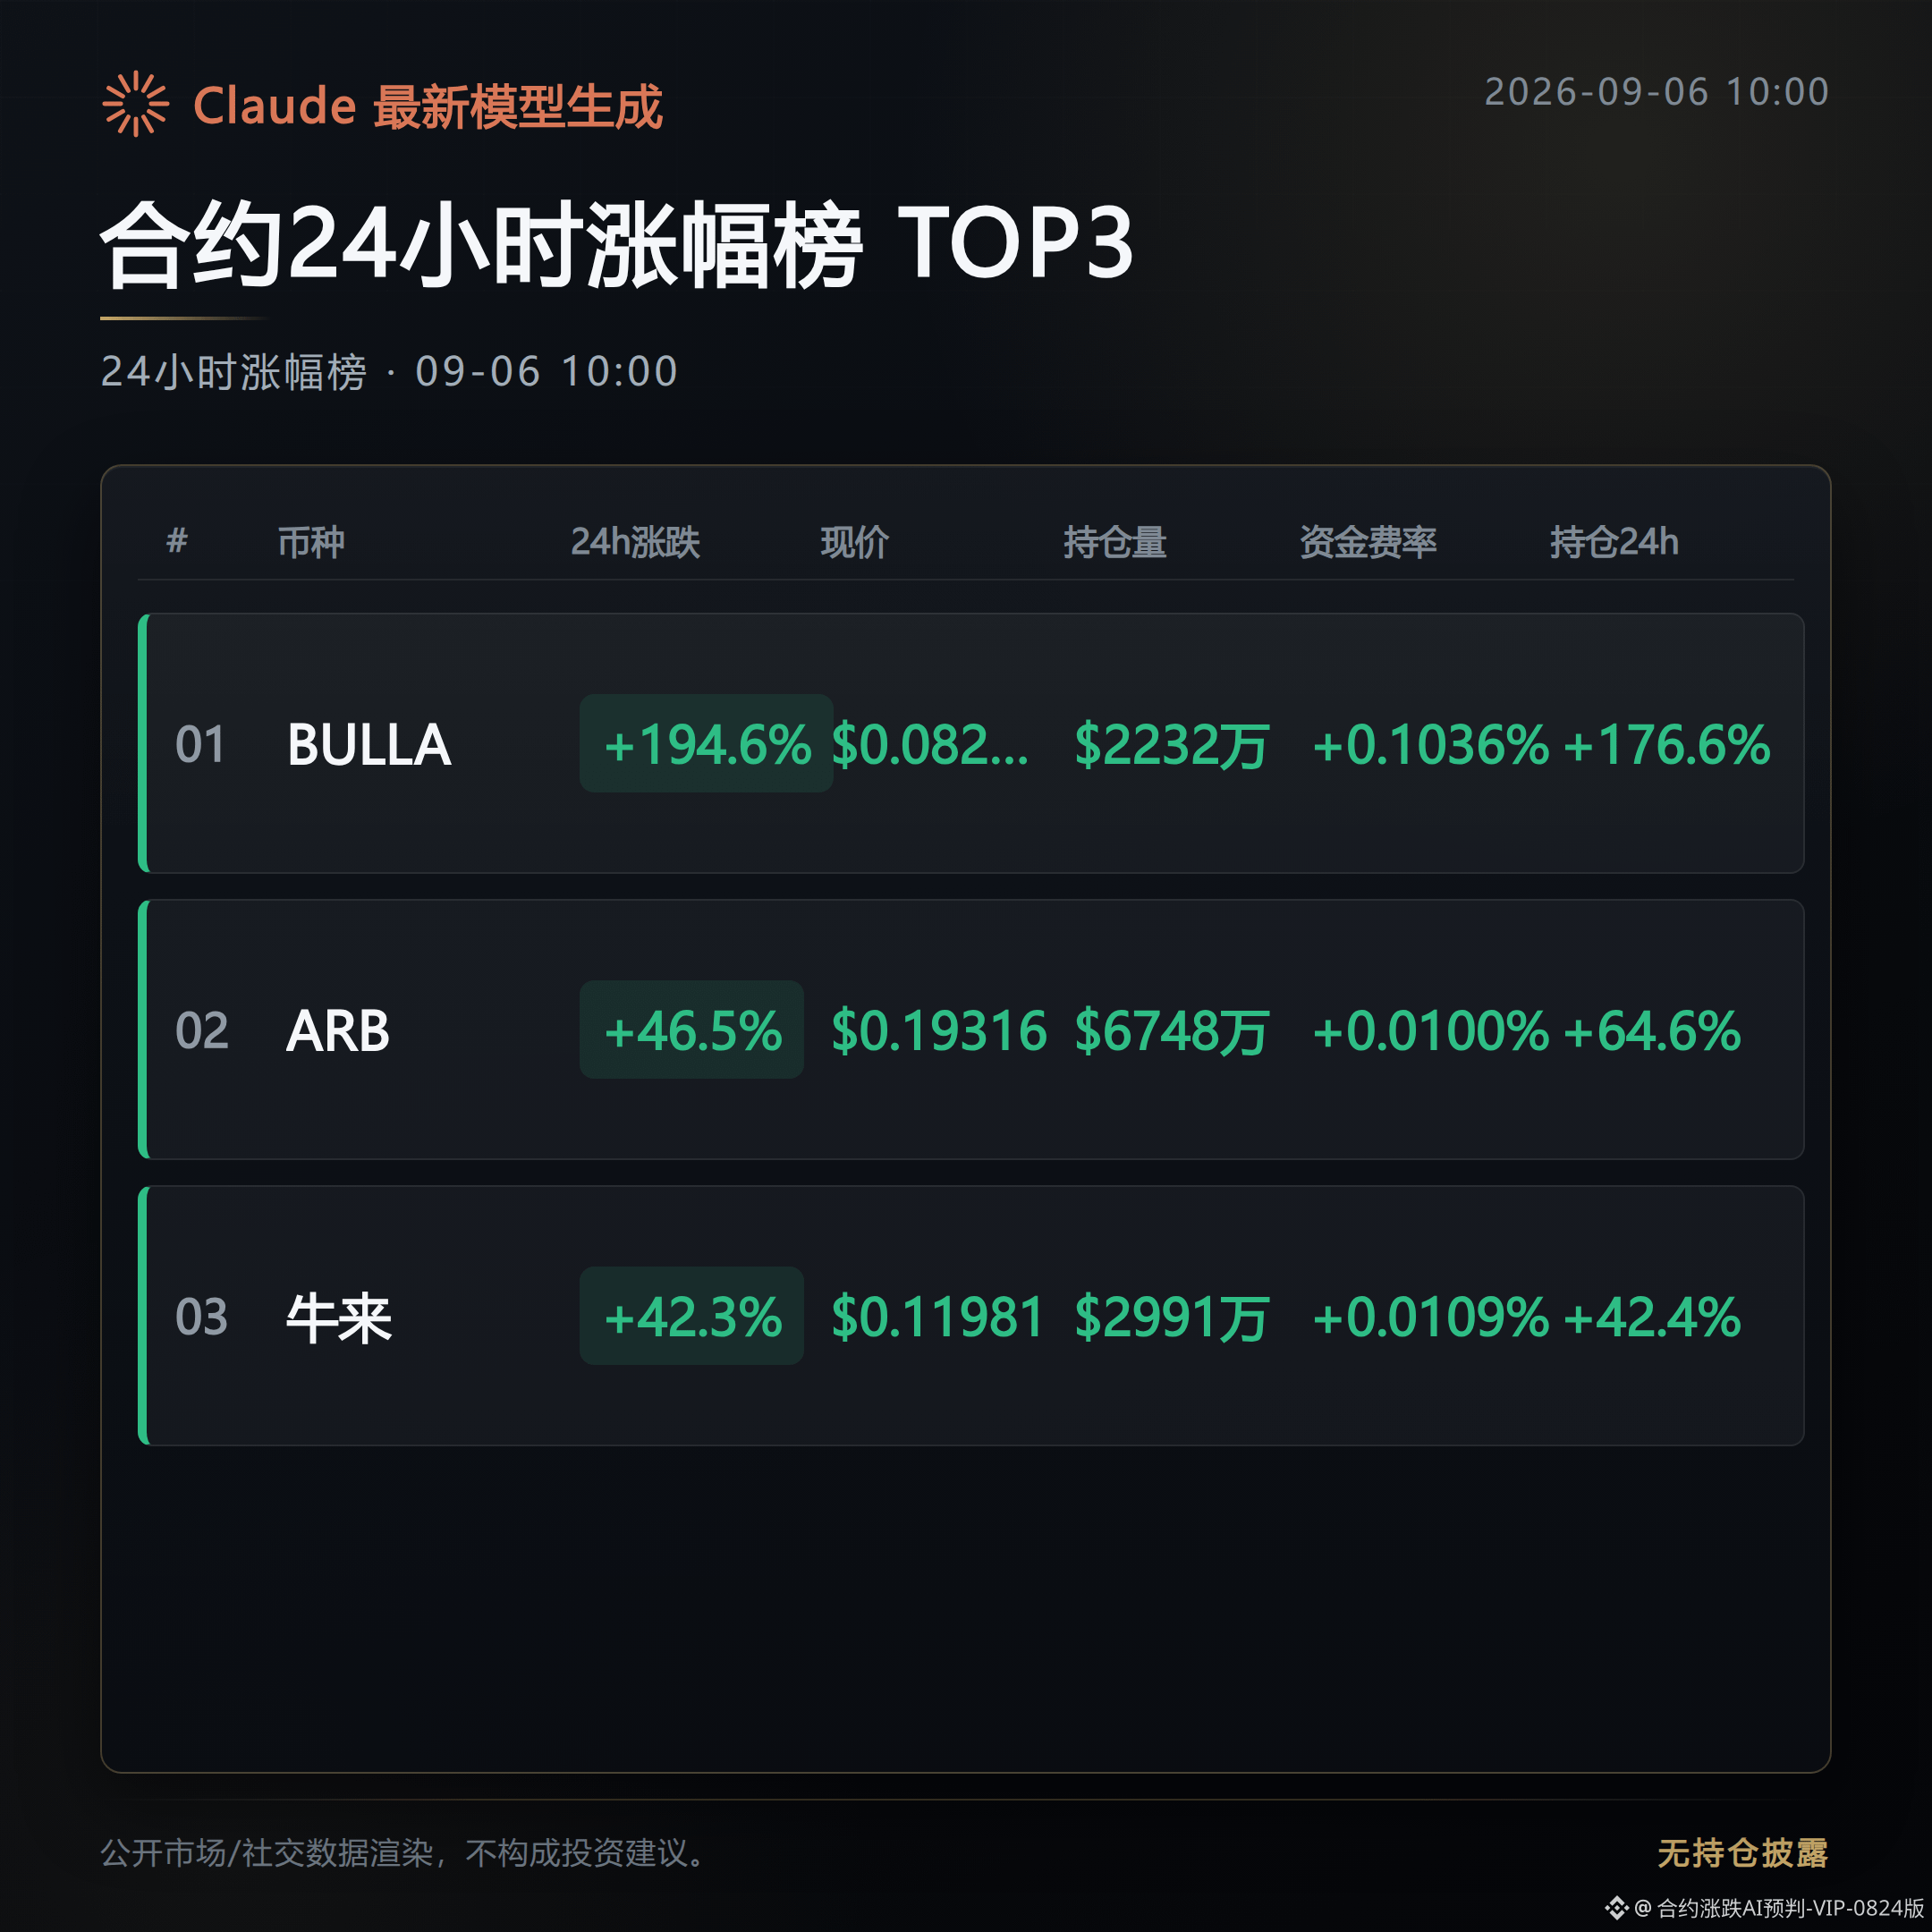
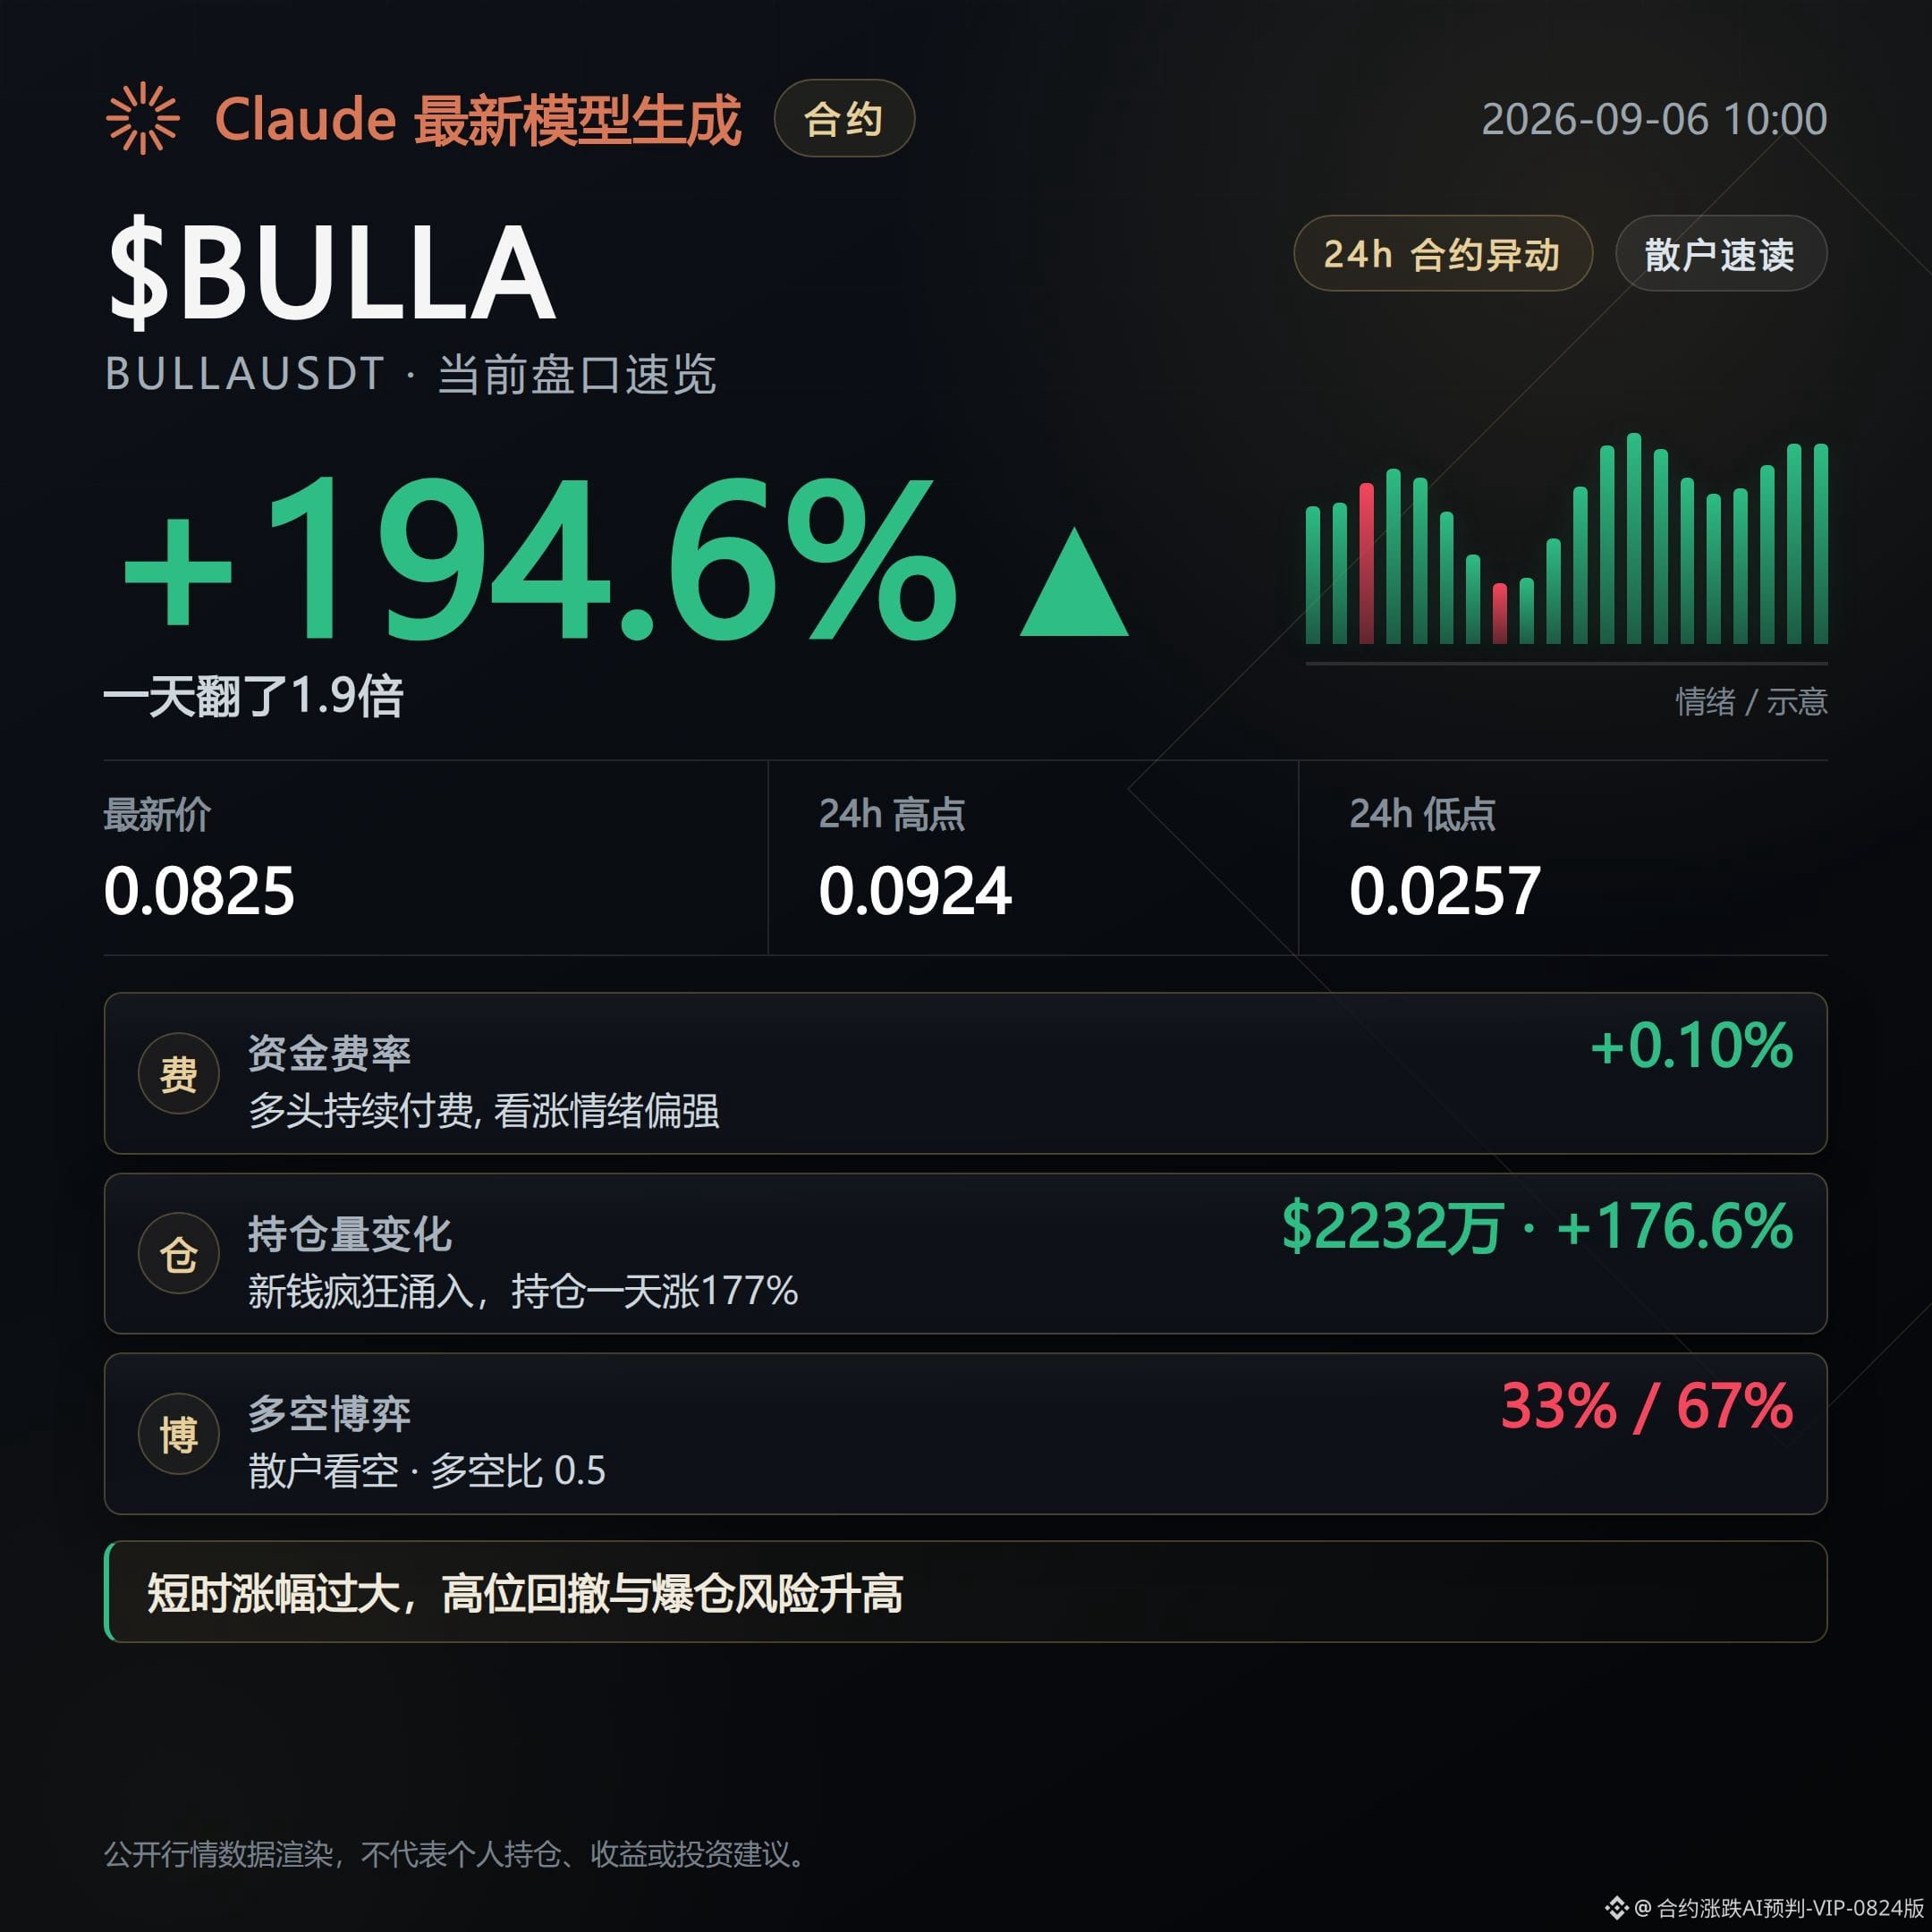
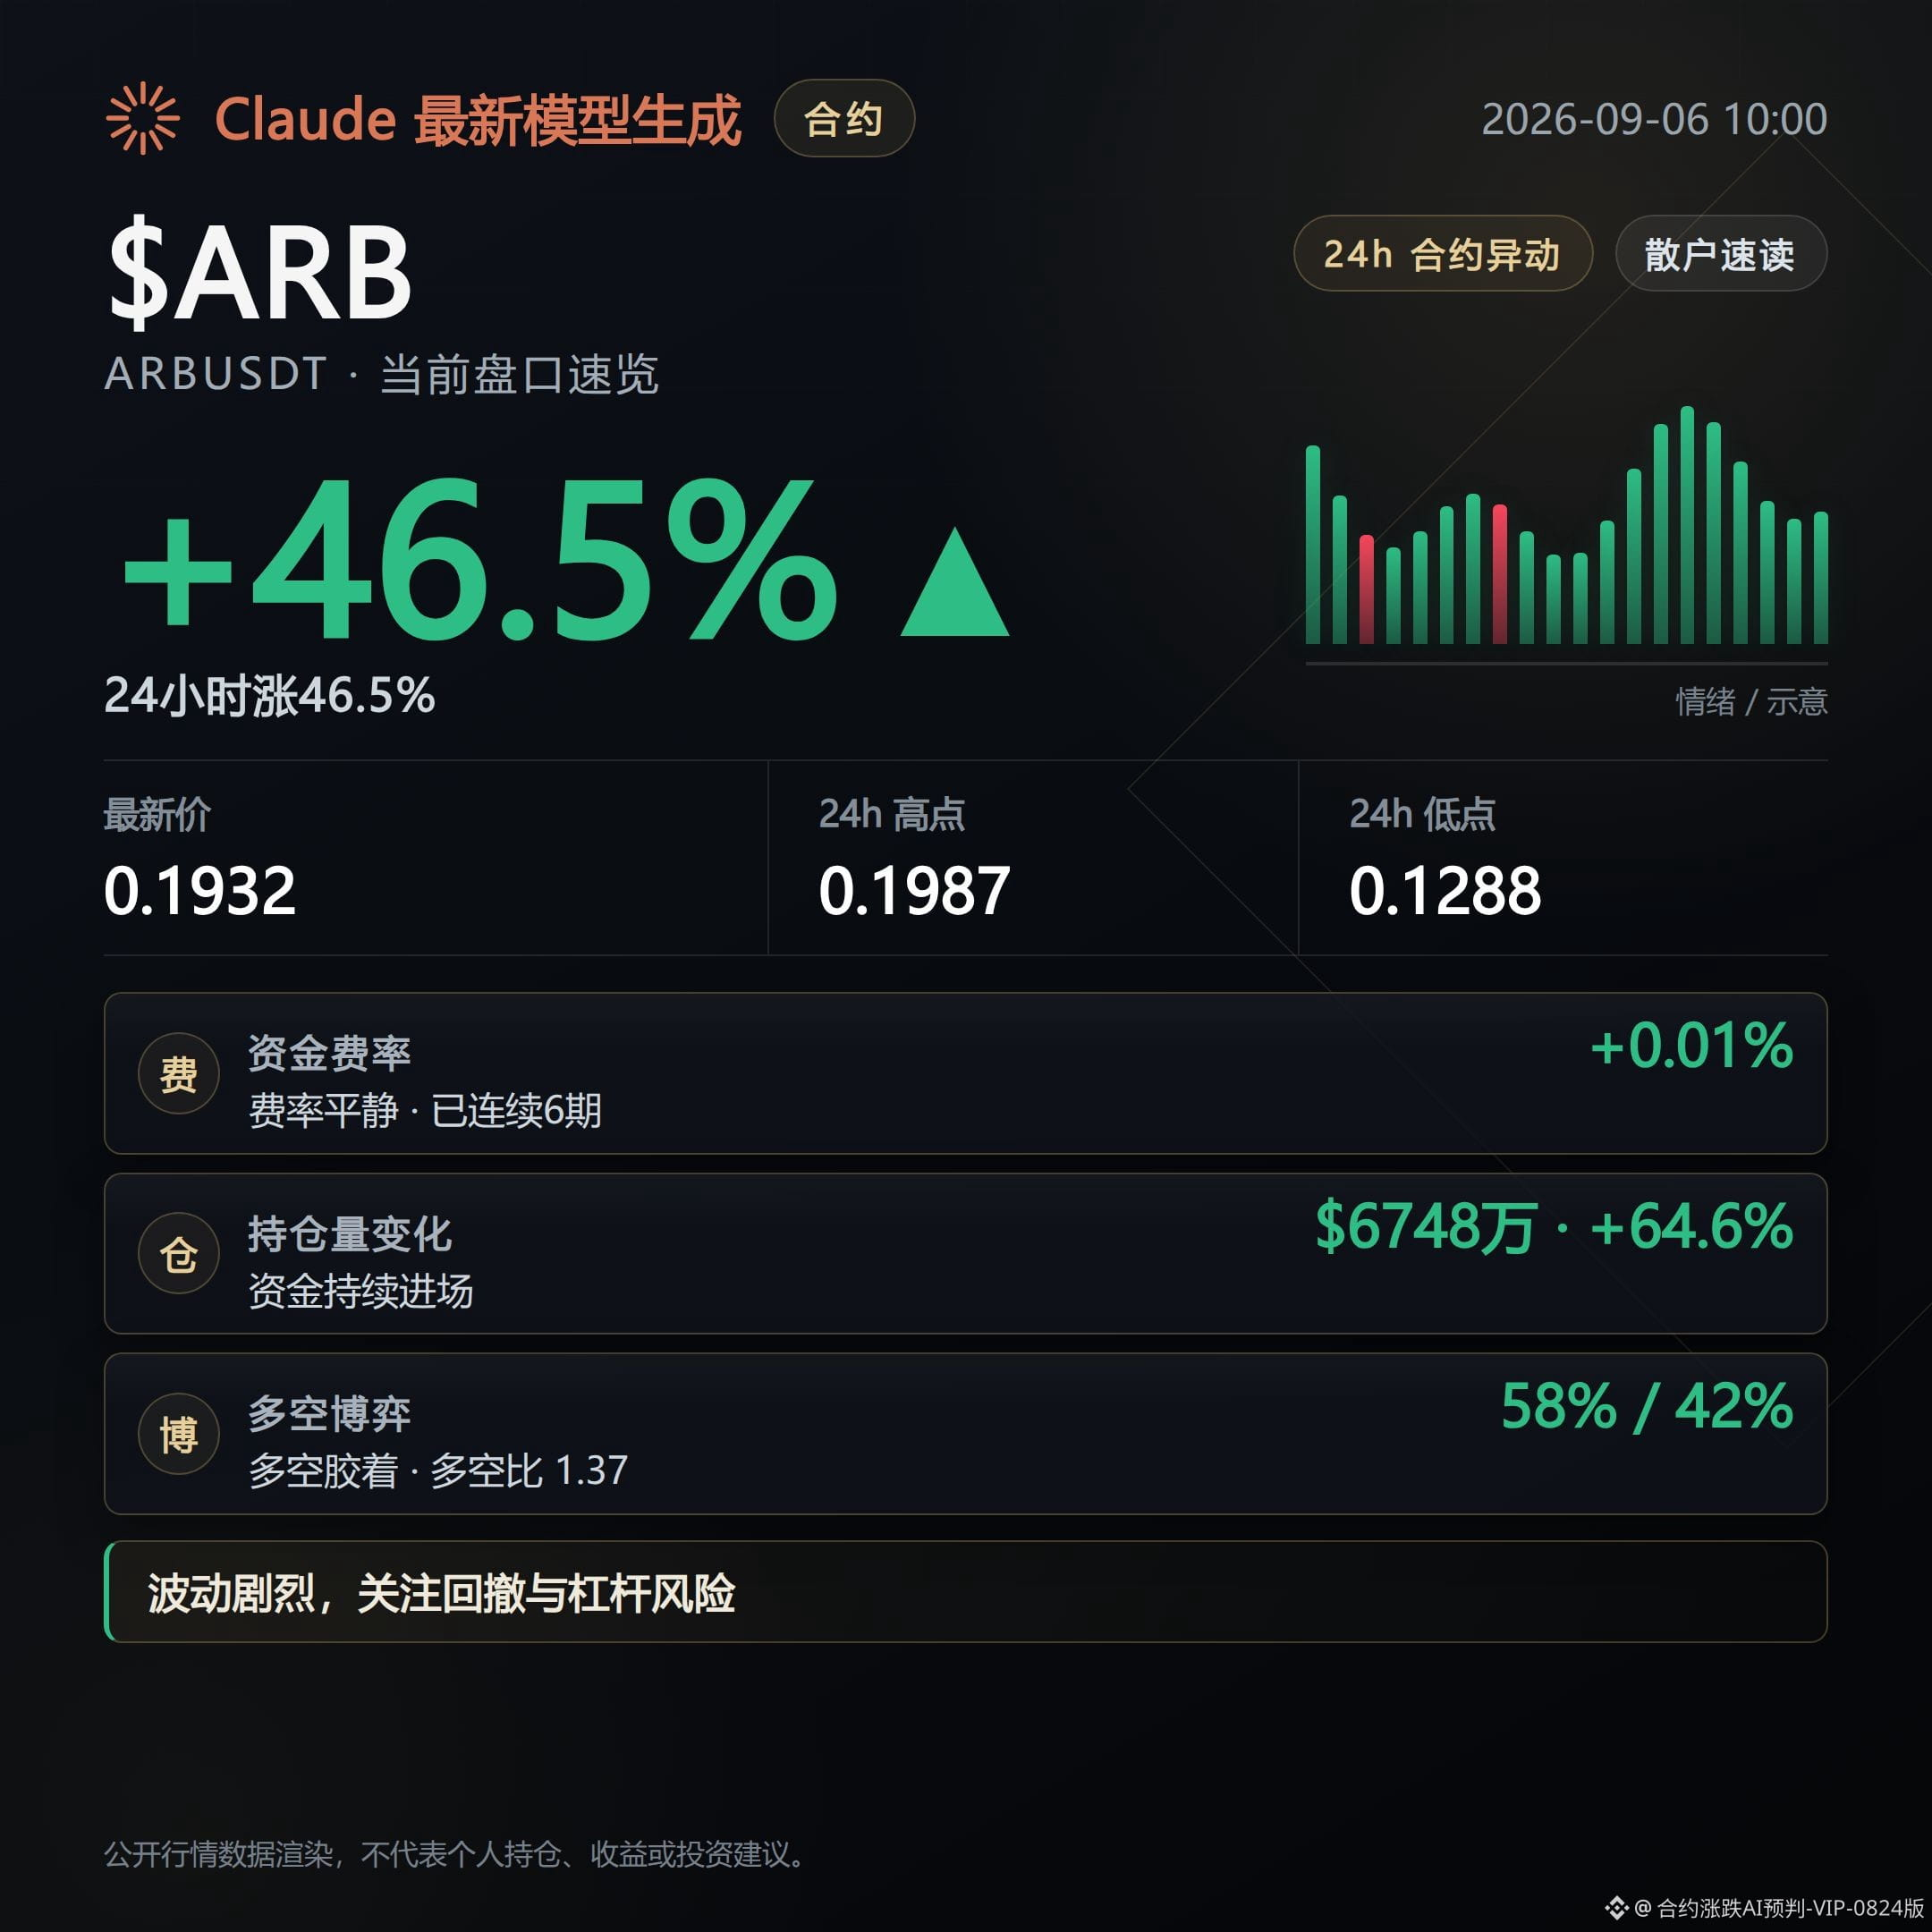
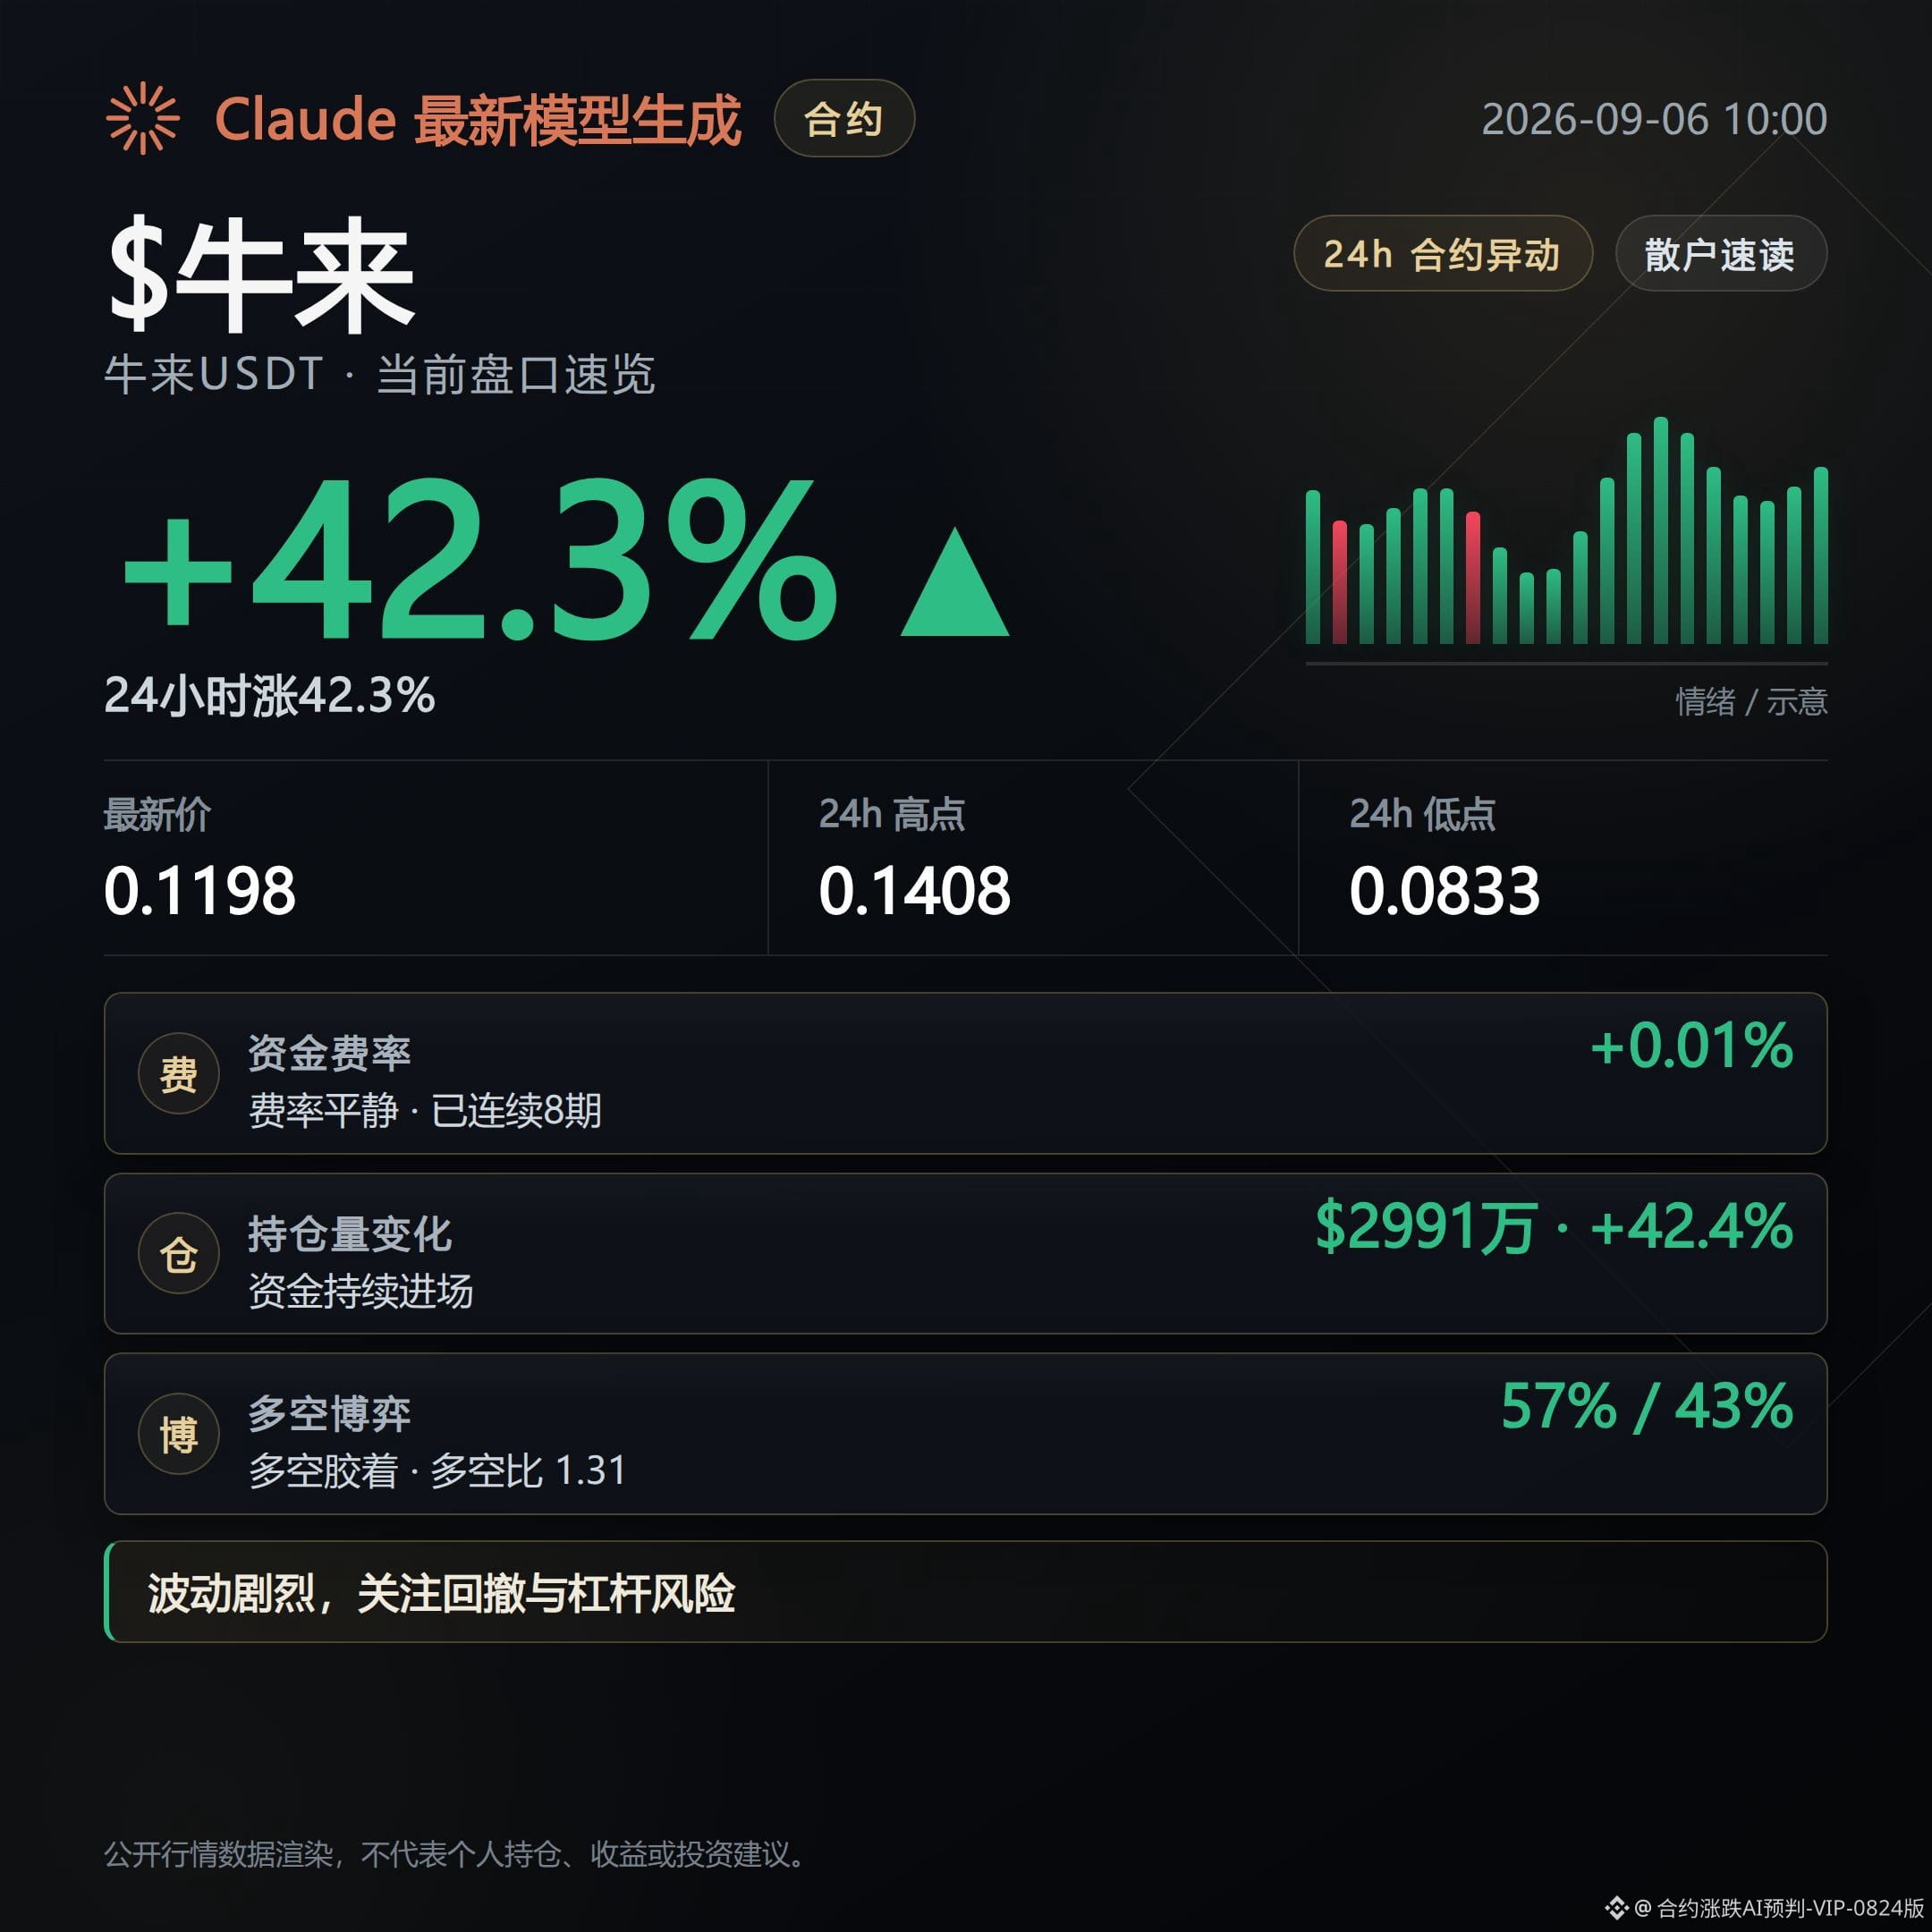
Bearish. The public order books for these three contracts today look more like distribution risk at elevated levels rather than a signal to continue pushing higher.
These price lines are still rising, but structural indicators like volume, open interest, and funding rates have already started to loosen. Don’t just look at the gain column.
What’s worrying is not that they fail to rise, but that as they rise, follow-through demand can’t keep up, and in the end they get trapped between pullbacks and bounces.
What to watch next is whether the support from buyers keeps thinning out. Once it does, a slow drifting pullback will basically be in place.
1000CAT is now priced at 0.002519 USD, up 23.48% in 24 hours, the strongest gain among the three.
But open interest surged 88.4% in 24 hours, showing that this rally is being driven by a large influx of new positions rather than a steady add-on from existing positions.
Funding has been positive for longs for two consecutive periods, meaning longs have been paying to hold this level.
However, the active buy ratio is only 1.09, close to even. The strength of the chase higher is actually not as exaggerated as the price gain suggests. Once new positions start taking profits, the pullback could come faster than expected.
The chips are dispersing.
BCH is at 256.14 USD, up 3.45%, with 90.02 million USD in 24-hour trading volume, the best liquidity among the three.
The contract is already at a 1.95% discount to spot, while open interest has turned negative by 0.3% hour over hour, and the 24-hour growth rate is only 2.7%. This shows that the incremental flow on the derivatives side is already failing to keep up with the spot-driven rally.
The active buy ratio of 1.41 is still the highest among the three, and the long-short ratio of 1.37 with longs at 58% means the short-term structure has not clearly deteriorated yet.
But when stagnating incremental flow is viewed together with the discount, it suggests this rise is being supported more by existing positions, while new money is becoming less willing to enter.
The chips are dispersing.
CHIP is currently at 0.05974 USD, up 8.48%, but the Supertrend has already turned downward, making it the only one of the three where price and trend direction do not align.
Funding has been positive for longs for eight consecutive periods, the longest payment duration among the three, and longs are under the heaviest cost pressure at this level.
The active buy ratio is only 0.99, basically no advantage, and buying and selling forces are already even.
The large-holder long-short ratio is still 1.58, indicating that large-holder positioning has not clearly exited yet, which is currently the only part that has not broken.
The chips are dispersing.
If buyer support for these three contracts continues to thin and the buy ratio weakens further, the slow pullback line will become increasingly real.
If, on the contrary, volume expands and prices hold steady while open interest rises in sync again, then this bearish view needs to be reassessed.
#1000CAT #BCH #CHIP #contract market
Live record: This account currently holds $FOGO long positions; if the logic has not changed, continue holding.
This content was generated with the assistance of Claude Fable 5 and is for information reference only. Please verify independently.
These price lines are still rising, but structural indicators like volume, open interest, and funding rates have already started to loosen. Don’t just look at the gain column.
What’s worrying is not that they fail to rise, but that as they rise, follow-through demand can’t keep up, and in the end they get trapped between pullbacks and bounces.
What to watch next is whether the support from buyers keeps thinning out. Once it does, a slow drifting pullback will basically be in place.
1000CAT is now priced at 0.002519 USD, up 23.48% in 24 hours, the strongest gain among the three.
But open interest surged 88.4% in 24 hours, showing that this rally is being driven by a large influx of new positions rather than a steady add-on from existing positions.
Funding has been positive for longs for two consecutive periods, meaning longs have been paying to hold this level.
However, the active buy ratio is only 1.09, close to even. The strength of the chase higher is actually not as exaggerated as the price gain suggests. Once new positions start taking profits, the pullback could come faster than expected.
The chips are dispersing.
BCH is at 256.14 USD, up 3.45%, with 90.02 million USD in 24-hour trading volume, the best liquidity among the three.
The contract is already at a 1.95% discount to spot, while open interest has turned negative by 0.3% hour over hour, and the 24-hour growth rate is only 2.7%. This shows that the incremental flow on the derivatives side is already failing to keep up with the spot-driven rally.
The active buy ratio of 1.41 is still the highest among the three, and the long-short ratio of 1.37 with longs at 58% means the short-term structure has not clearly deteriorated yet.
But when stagnating incremental flow is viewed together with the discount, it suggests this rise is being supported more by existing positions, while new money is becoming less willing to enter.
The chips are dispersing.
CHIP is currently at 0.05974 USD, up 8.48%, but the Supertrend has already turned downward, making it the only one of the three where price and trend direction do not align.
Funding has been positive for longs for eight consecutive periods, the longest payment duration among the three, and longs are under the heaviest cost pressure at this level.
The active buy ratio is only 0.99, basically no advantage, and buying and selling forces are already even.
The large-holder long-short ratio is still 1.58, indicating that large-holder positioning has not clearly exited yet, which is currently the only part that has not broken.
The chips are dispersing.
If buyer support for these three contracts continues to thin and the buy ratio weakens further, the slow pullback line will become increasingly real.
If, on the contrary, volume expands and prices hold steady while open interest rises in sync again, then this bearish view needs to be reassessed.
#1000CAT #BCH #CHIP #contract market
Live record: This account currently holds $FOGO long positions; if the logic has not changed, continue holding.
This content was generated with the assistance of Claude Fable 5 and is for information reference only. Please verify independently.
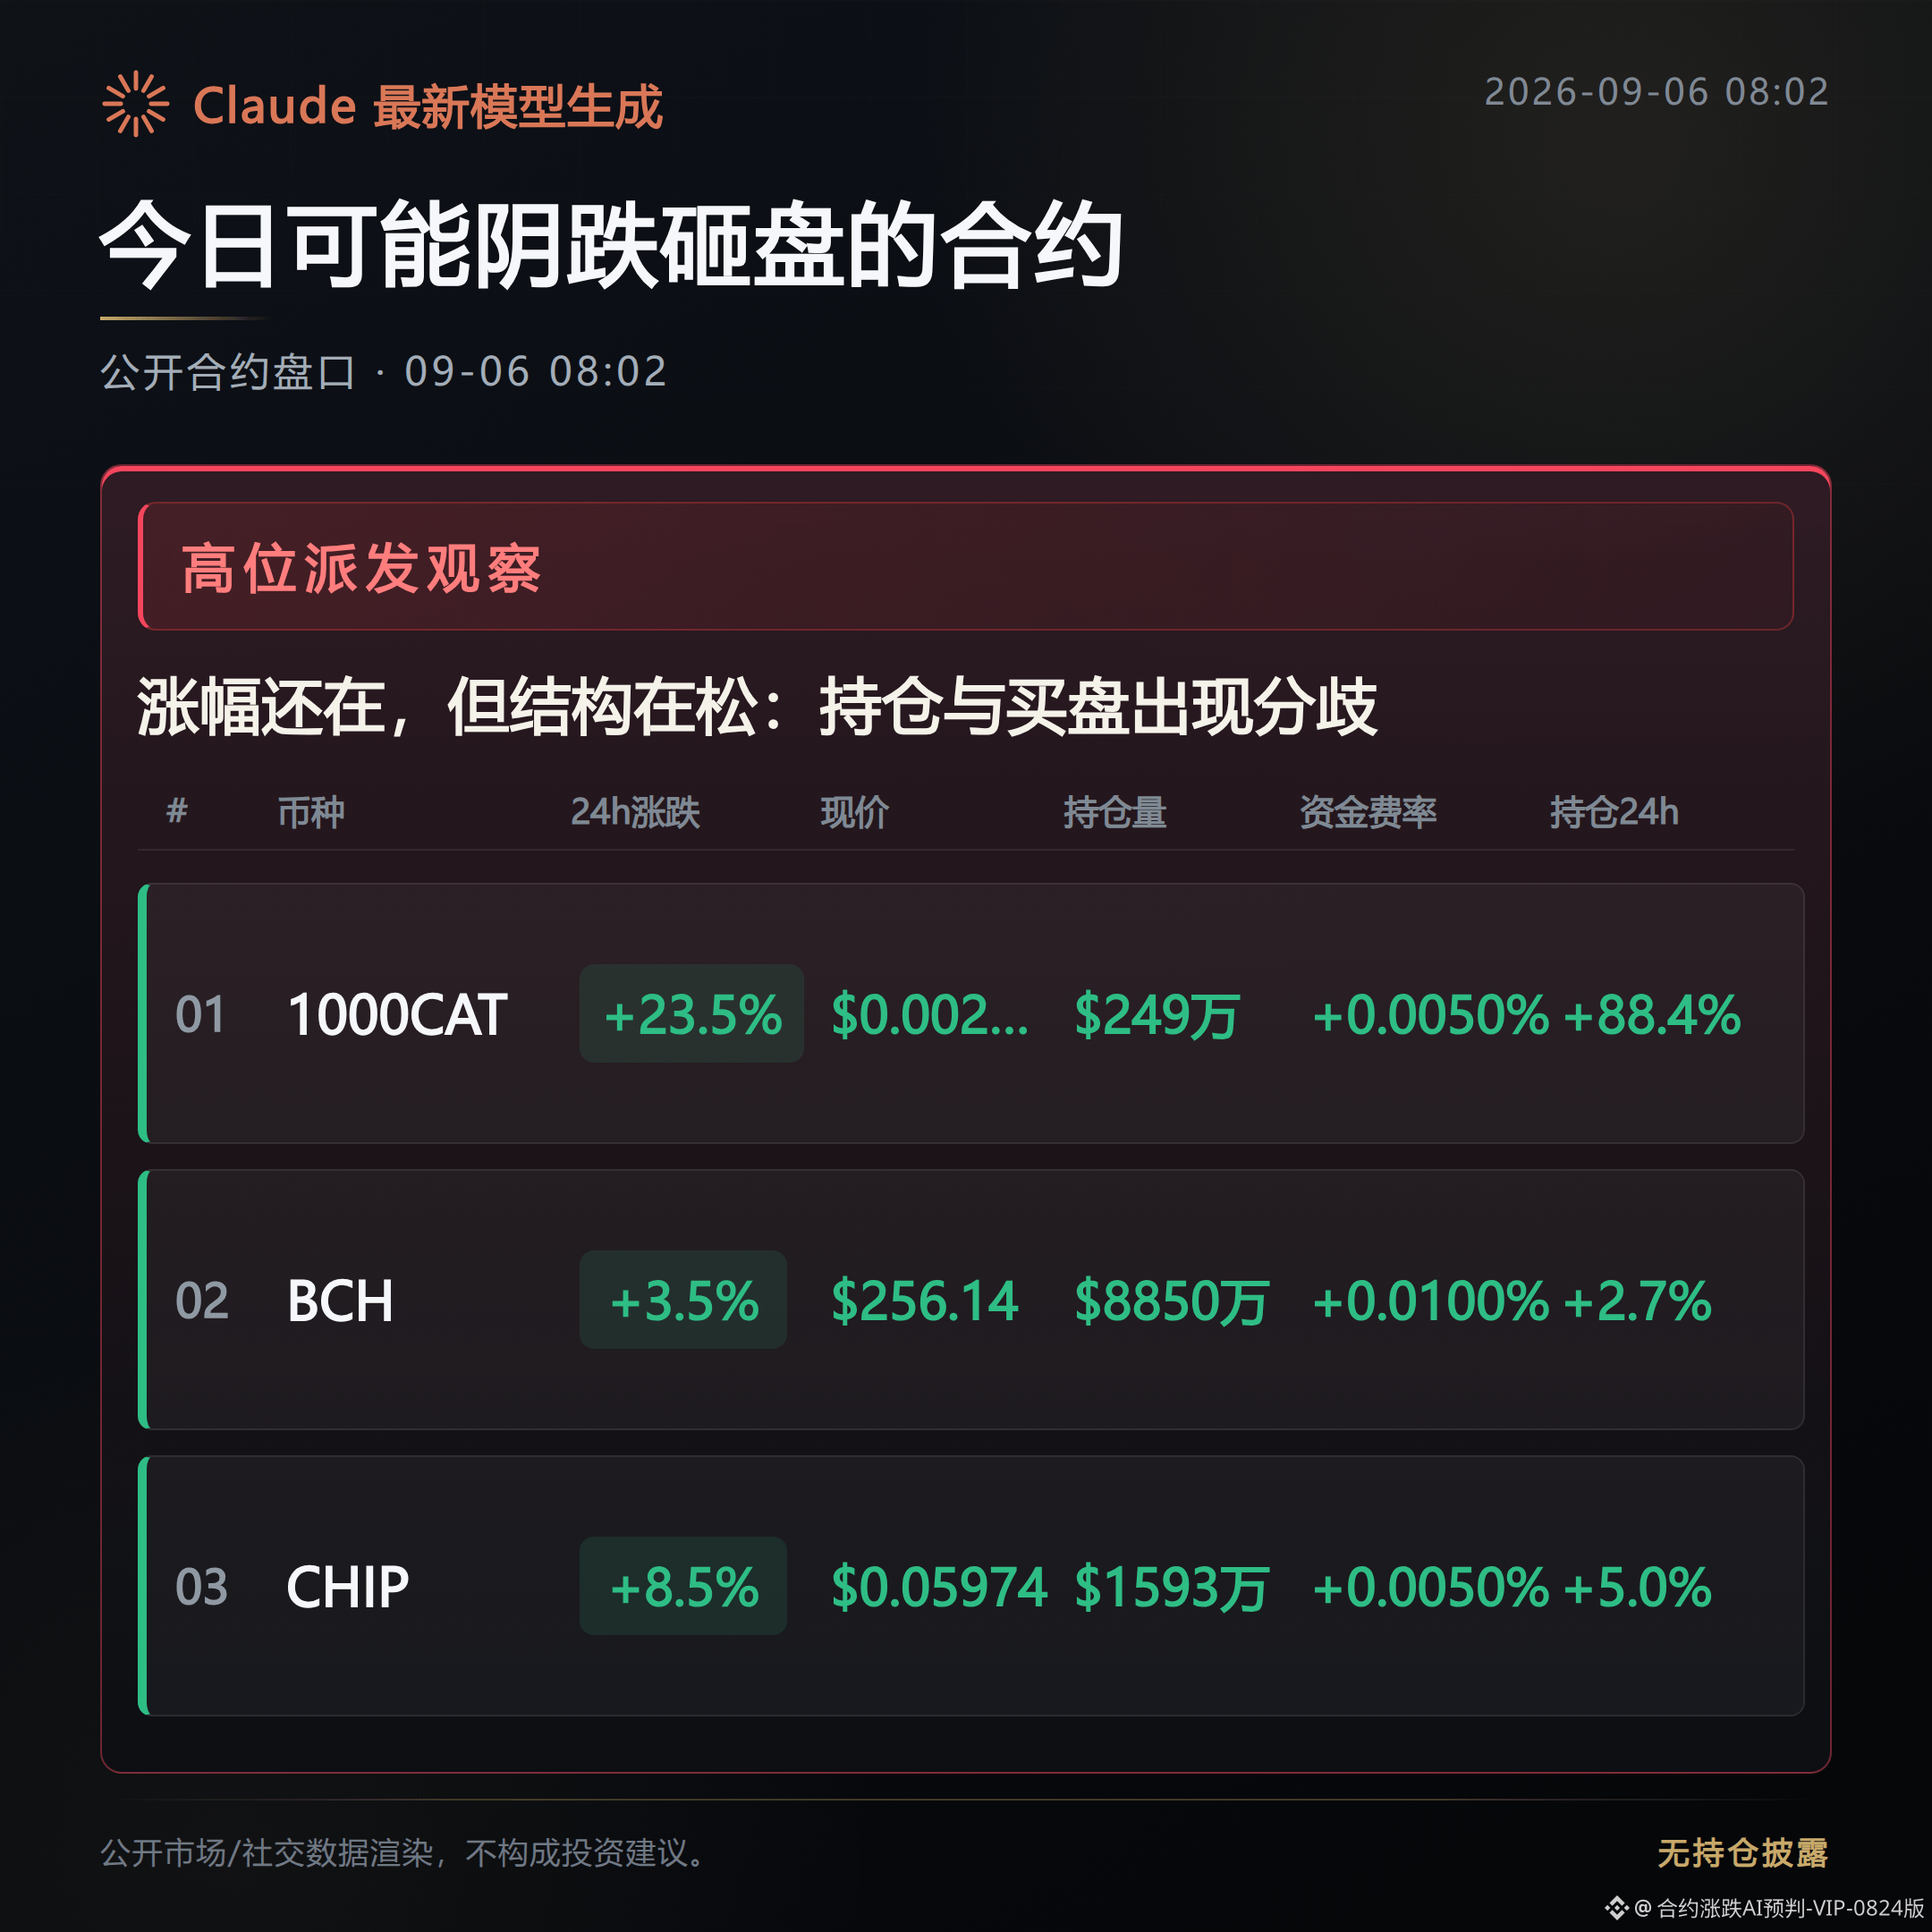
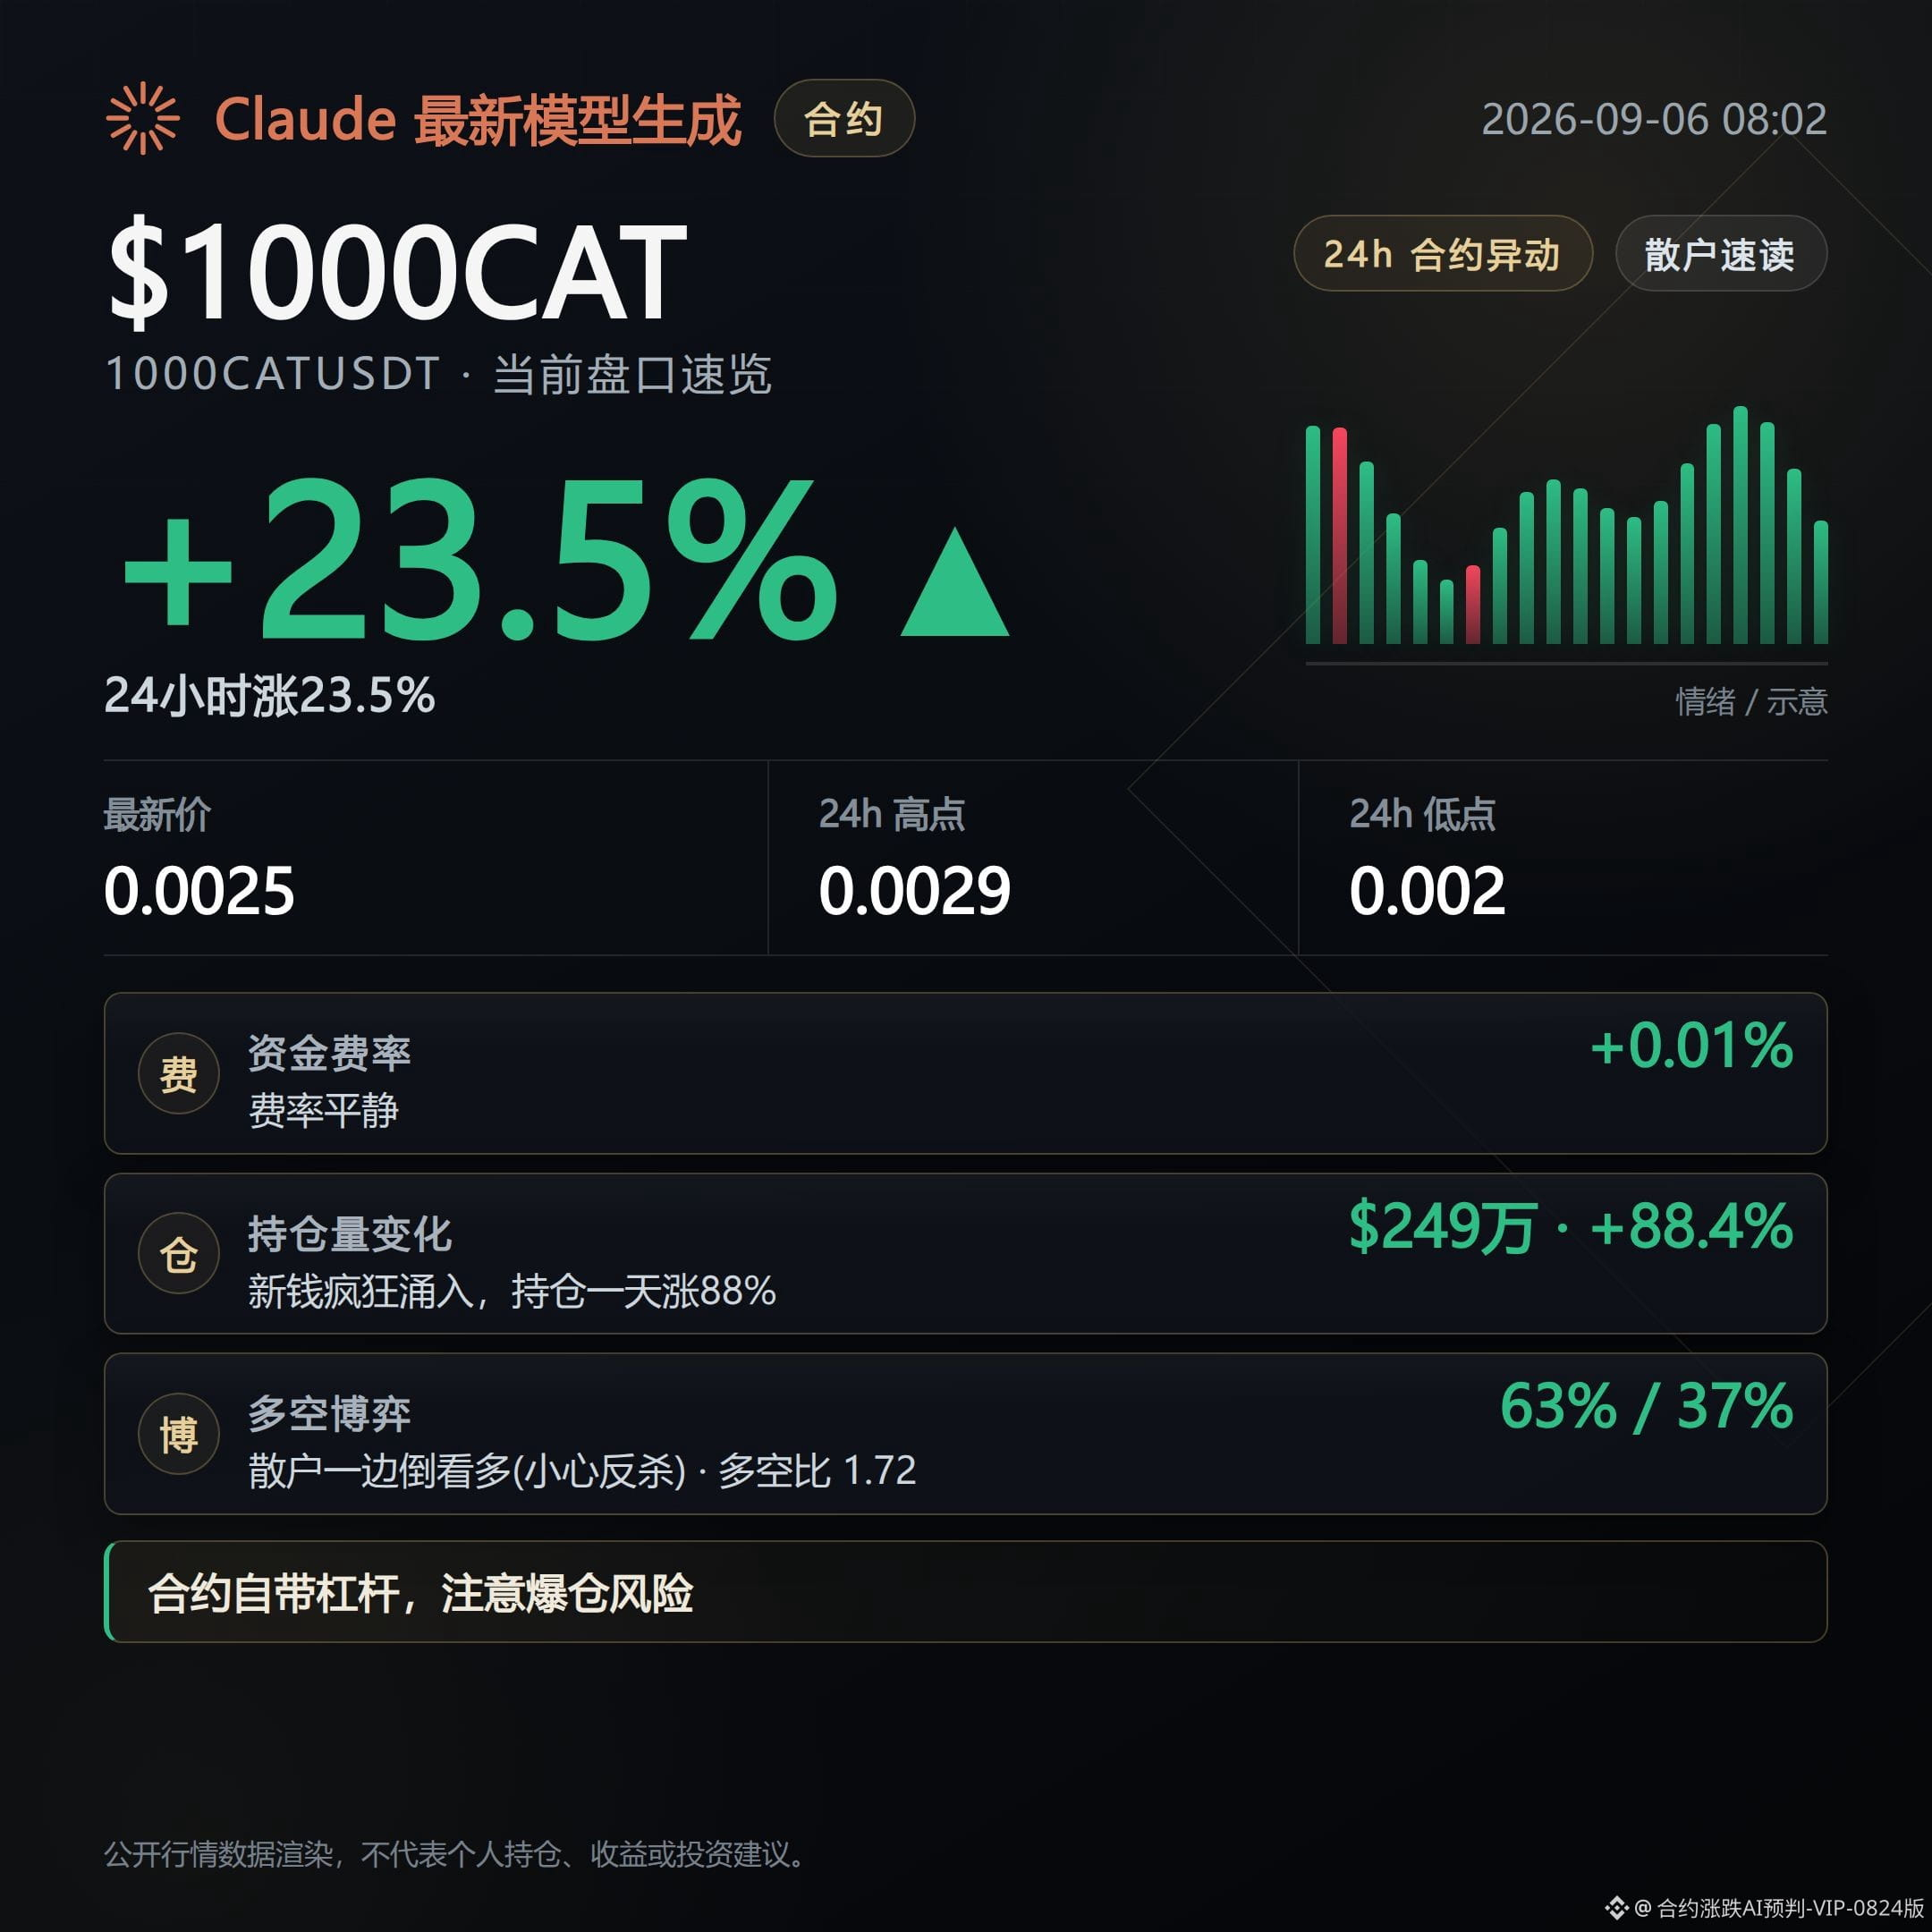
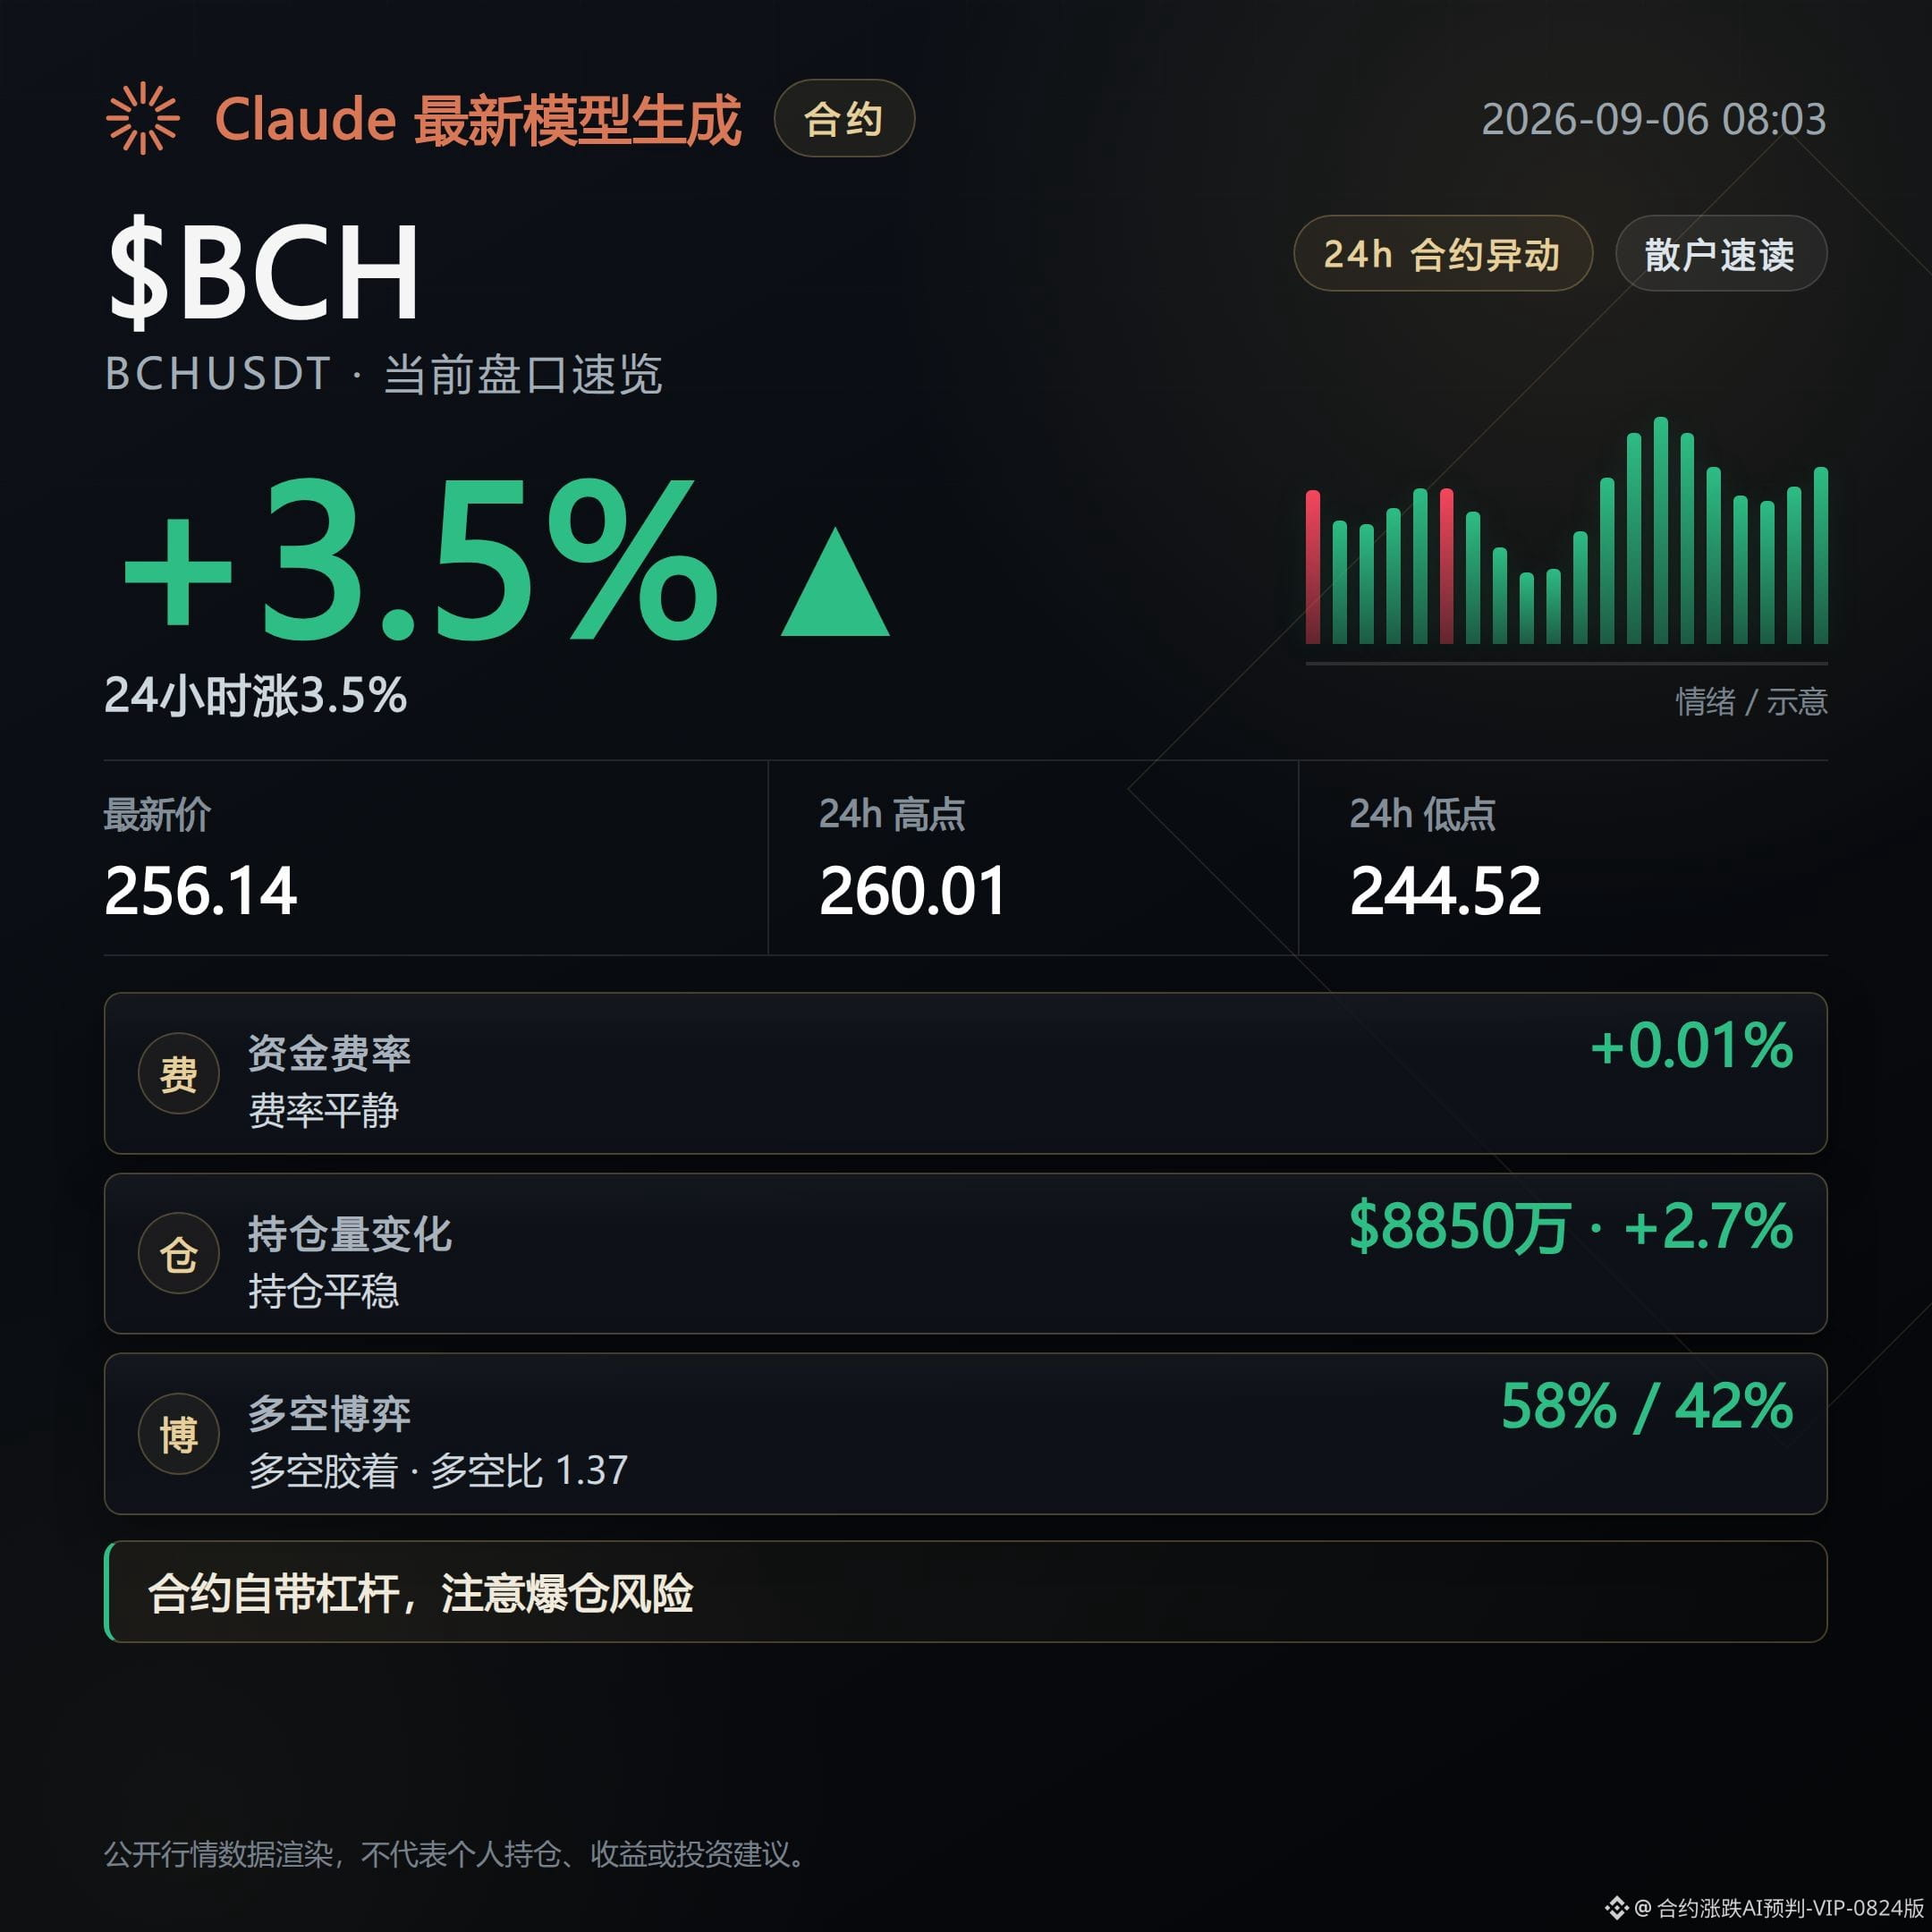
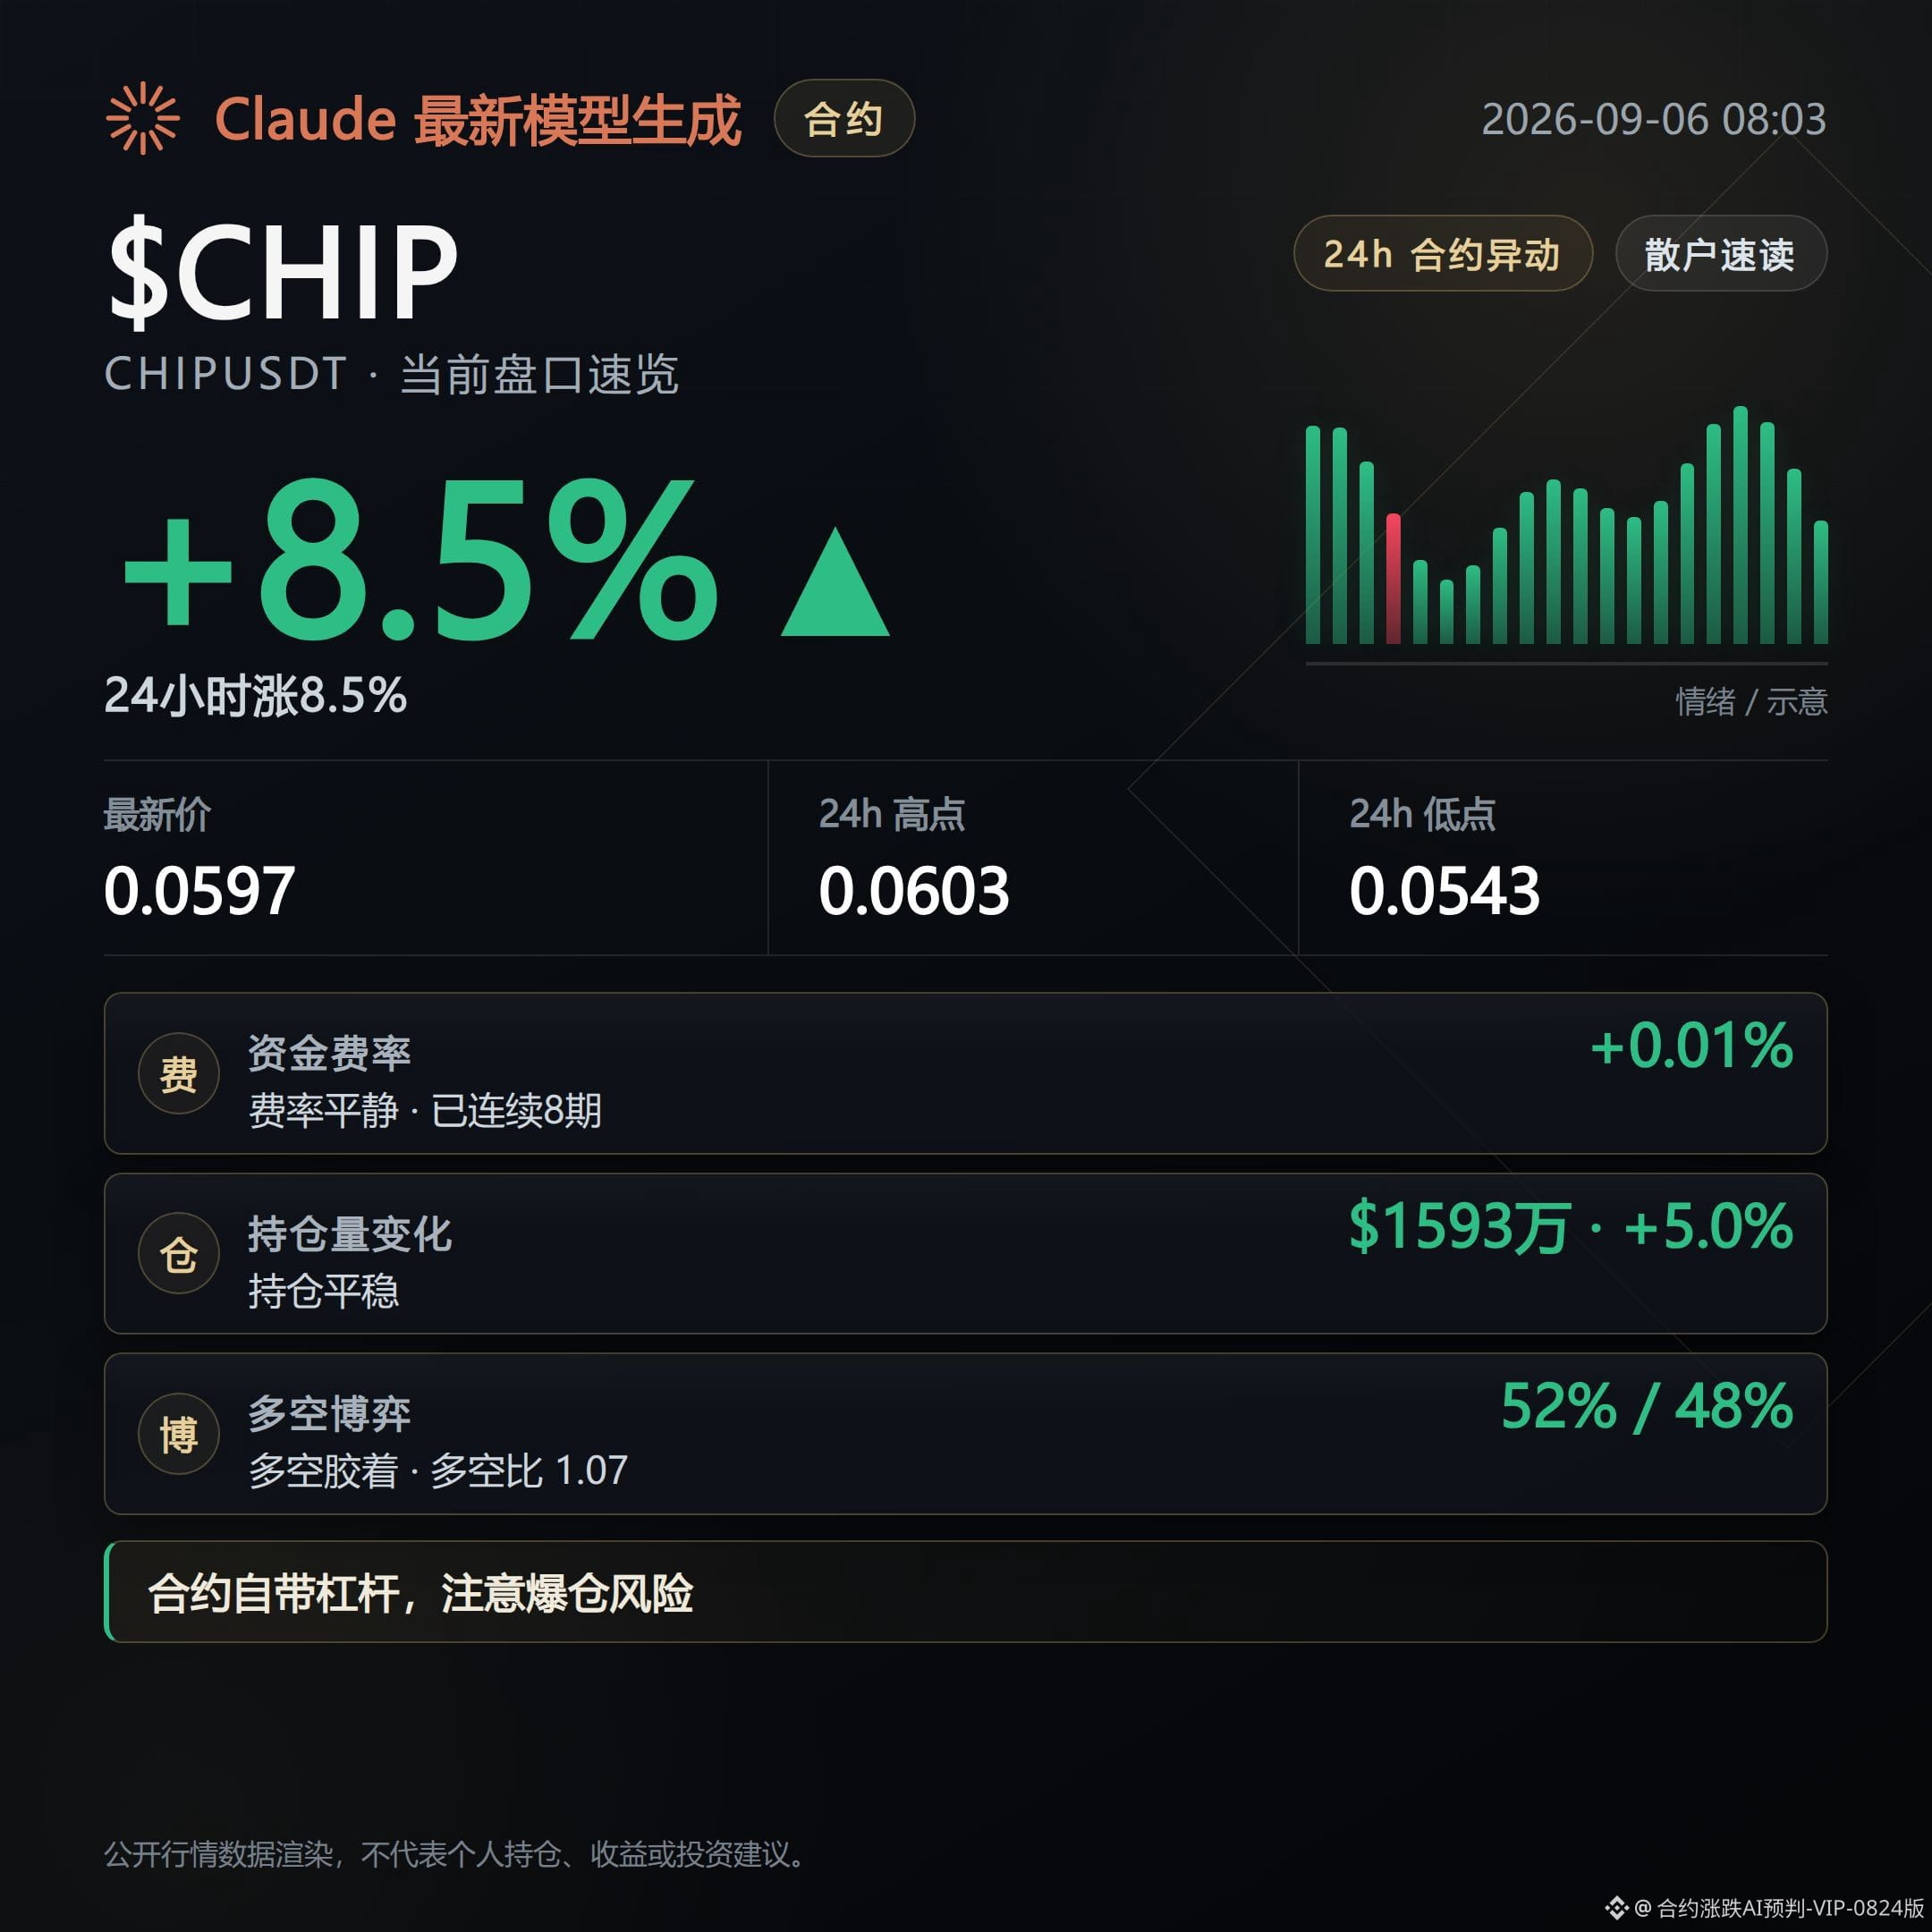
Contracts that may surge significantly today
Bullish.
The 24-hour prices of the three contracts SUSHI, TUT, and EPIC are all rising in line with the trend, open interest is expanding in sync, and the share of aggressive buy orders is also clearly higher.
On the funding side, positions are being accumulated.
What to watch next is whether this combination of "price up, open interest up, strong aggressive buying" can continue to appear in sync.
SUSHI is currently priced at 0.2547 USD, up 34.12% in 24 hours, with 24-hour trading volume of about 94.16 million USD.
Open interest surged 157.2% in 24 hours to 6.596 million USD, the funding rate is -0.0595%, shorts have paid for one consecutive period, and the share of aggressive buy orders is as high as 97%. From this order flow, I see shorts paying for longs, with positions flowing in with real money.
The counterpoint is that the relative strength index has already reached 81.7, which is in overbought territory, so the room for further short-term upside is narrowing.
TUT is currently priced at 0.02802 USD, up 19.59% in 24 hours, with 24-hour trading volume of about 83.12 million USD.
The funding rate has remained in shorts-paying territory for 8 consecutive periods, and the long-short ratio for large traders has reached 1.63, which is more bullish than the 1.22 long-short ratio of regular users, indicating that big money has a clearer direction.
The counterpoint is that open interest rose only 1.3% in the past hour, which is clearly slower than the 19.4% increase over 24 hours, so what to watch next is whether the speed of capital inflows will accelerate again.
EPIC is currently priced at 0.401 USD, up 10.74% in 24 hours, with 24-hour trading volume of about 12.86 million USD.
The funding rate is +0.005%, longs have paid for 8 consecutive periods, and open interest increased 10.1% over 24 hours, showing a relatively steady trend.
The counterpoint is that the current order book is dominated by aggressive sell orders, with a buy-sell ratio of only 0.61. Prices are rising, but aggressive selling has the upper hand, so pay attention to whether this divergence narrows.
If the open interest of these three contracts continues to rise along with price and the share of aggressive buy orders remains high, this upward trend should continue.
If the funding rate turns into longs paying, open interest starts to contract, or EPIC's aggressive selling continues to dominate while prices fail to move up, then this direction needs to be reassessed.
#SUSHI #TUT #EPIC #Contract Market
Live record: This account currently holds $FOGO long positions, and will continue to hold as long as the logic remains unchanged.
This content was generated with the assistance of Claude Fable 5 and is for informational reference only. Please verify independently.
Bullish.
The 24-hour prices of the three contracts SUSHI, TUT, and EPIC are all rising in line with the trend, open interest is expanding in sync, and the share of aggressive buy orders is also clearly higher.
On the funding side, positions are being accumulated.
What to watch next is whether this combination of "price up, open interest up, strong aggressive buying" can continue to appear in sync.
SUSHI is currently priced at 0.2547 USD, up 34.12% in 24 hours, with 24-hour trading volume of about 94.16 million USD.
Open interest surged 157.2% in 24 hours to 6.596 million USD, the funding rate is -0.0595%, shorts have paid for one consecutive period, and the share of aggressive buy orders is as high as 97%. From this order flow, I see shorts paying for longs, with positions flowing in with real money.
The counterpoint is that the relative strength index has already reached 81.7, which is in overbought territory, so the room for further short-term upside is narrowing.
TUT is currently priced at 0.02802 USD, up 19.59% in 24 hours, with 24-hour trading volume of about 83.12 million USD.
The funding rate has remained in shorts-paying territory for 8 consecutive periods, and the long-short ratio for large traders has reached 1.63, which is more bullish than the 1.22 long-short ratio of regular users, indicating that big money has a clearer direction.
The counterpoint is that open interest rose only 1.3% in the past hour, which is clearly slower than the 19.4% increase over 24 hours, so what to watch next is whether the speed of capital inflows will accelerate again.
EPIC is currently priced at 0.401 USD, up 10.74% in 24 hours, with 24-hour trading volume of about 12.86 million USD.
The funding rate is +0.005%, longs have paid for 8 consecutive periods, and open interest increased 10.1% over 24 hours, showing a relatively steady trend.
The counterpoint is that the current order book is dominated by aggressive sell orders, with a buy-sell ratio of only 0.61. Prices are rising, but aggressive selling has the upper hand, so pay attention to whether this divergence narrows.
If the open interest of these three contracts continues to rise along with price and the share of aggressive buy orders remains high, this upward trend should continue.
If the funding rate turns into longs paying, open interest starts to contract, or EPIC's aggressive selling continues to dominate while prices fail to move up, then this direction needs to be reassessed.
#SUSHI #TUT #EPIC #Contract Market
Live record: This account currently holds $FOGO long positions, and will continue to hold as long as the logic remains unchanged.
This content was generated with the assistance of Claude Fable 5 and is for informational reference only. Please verify independently.
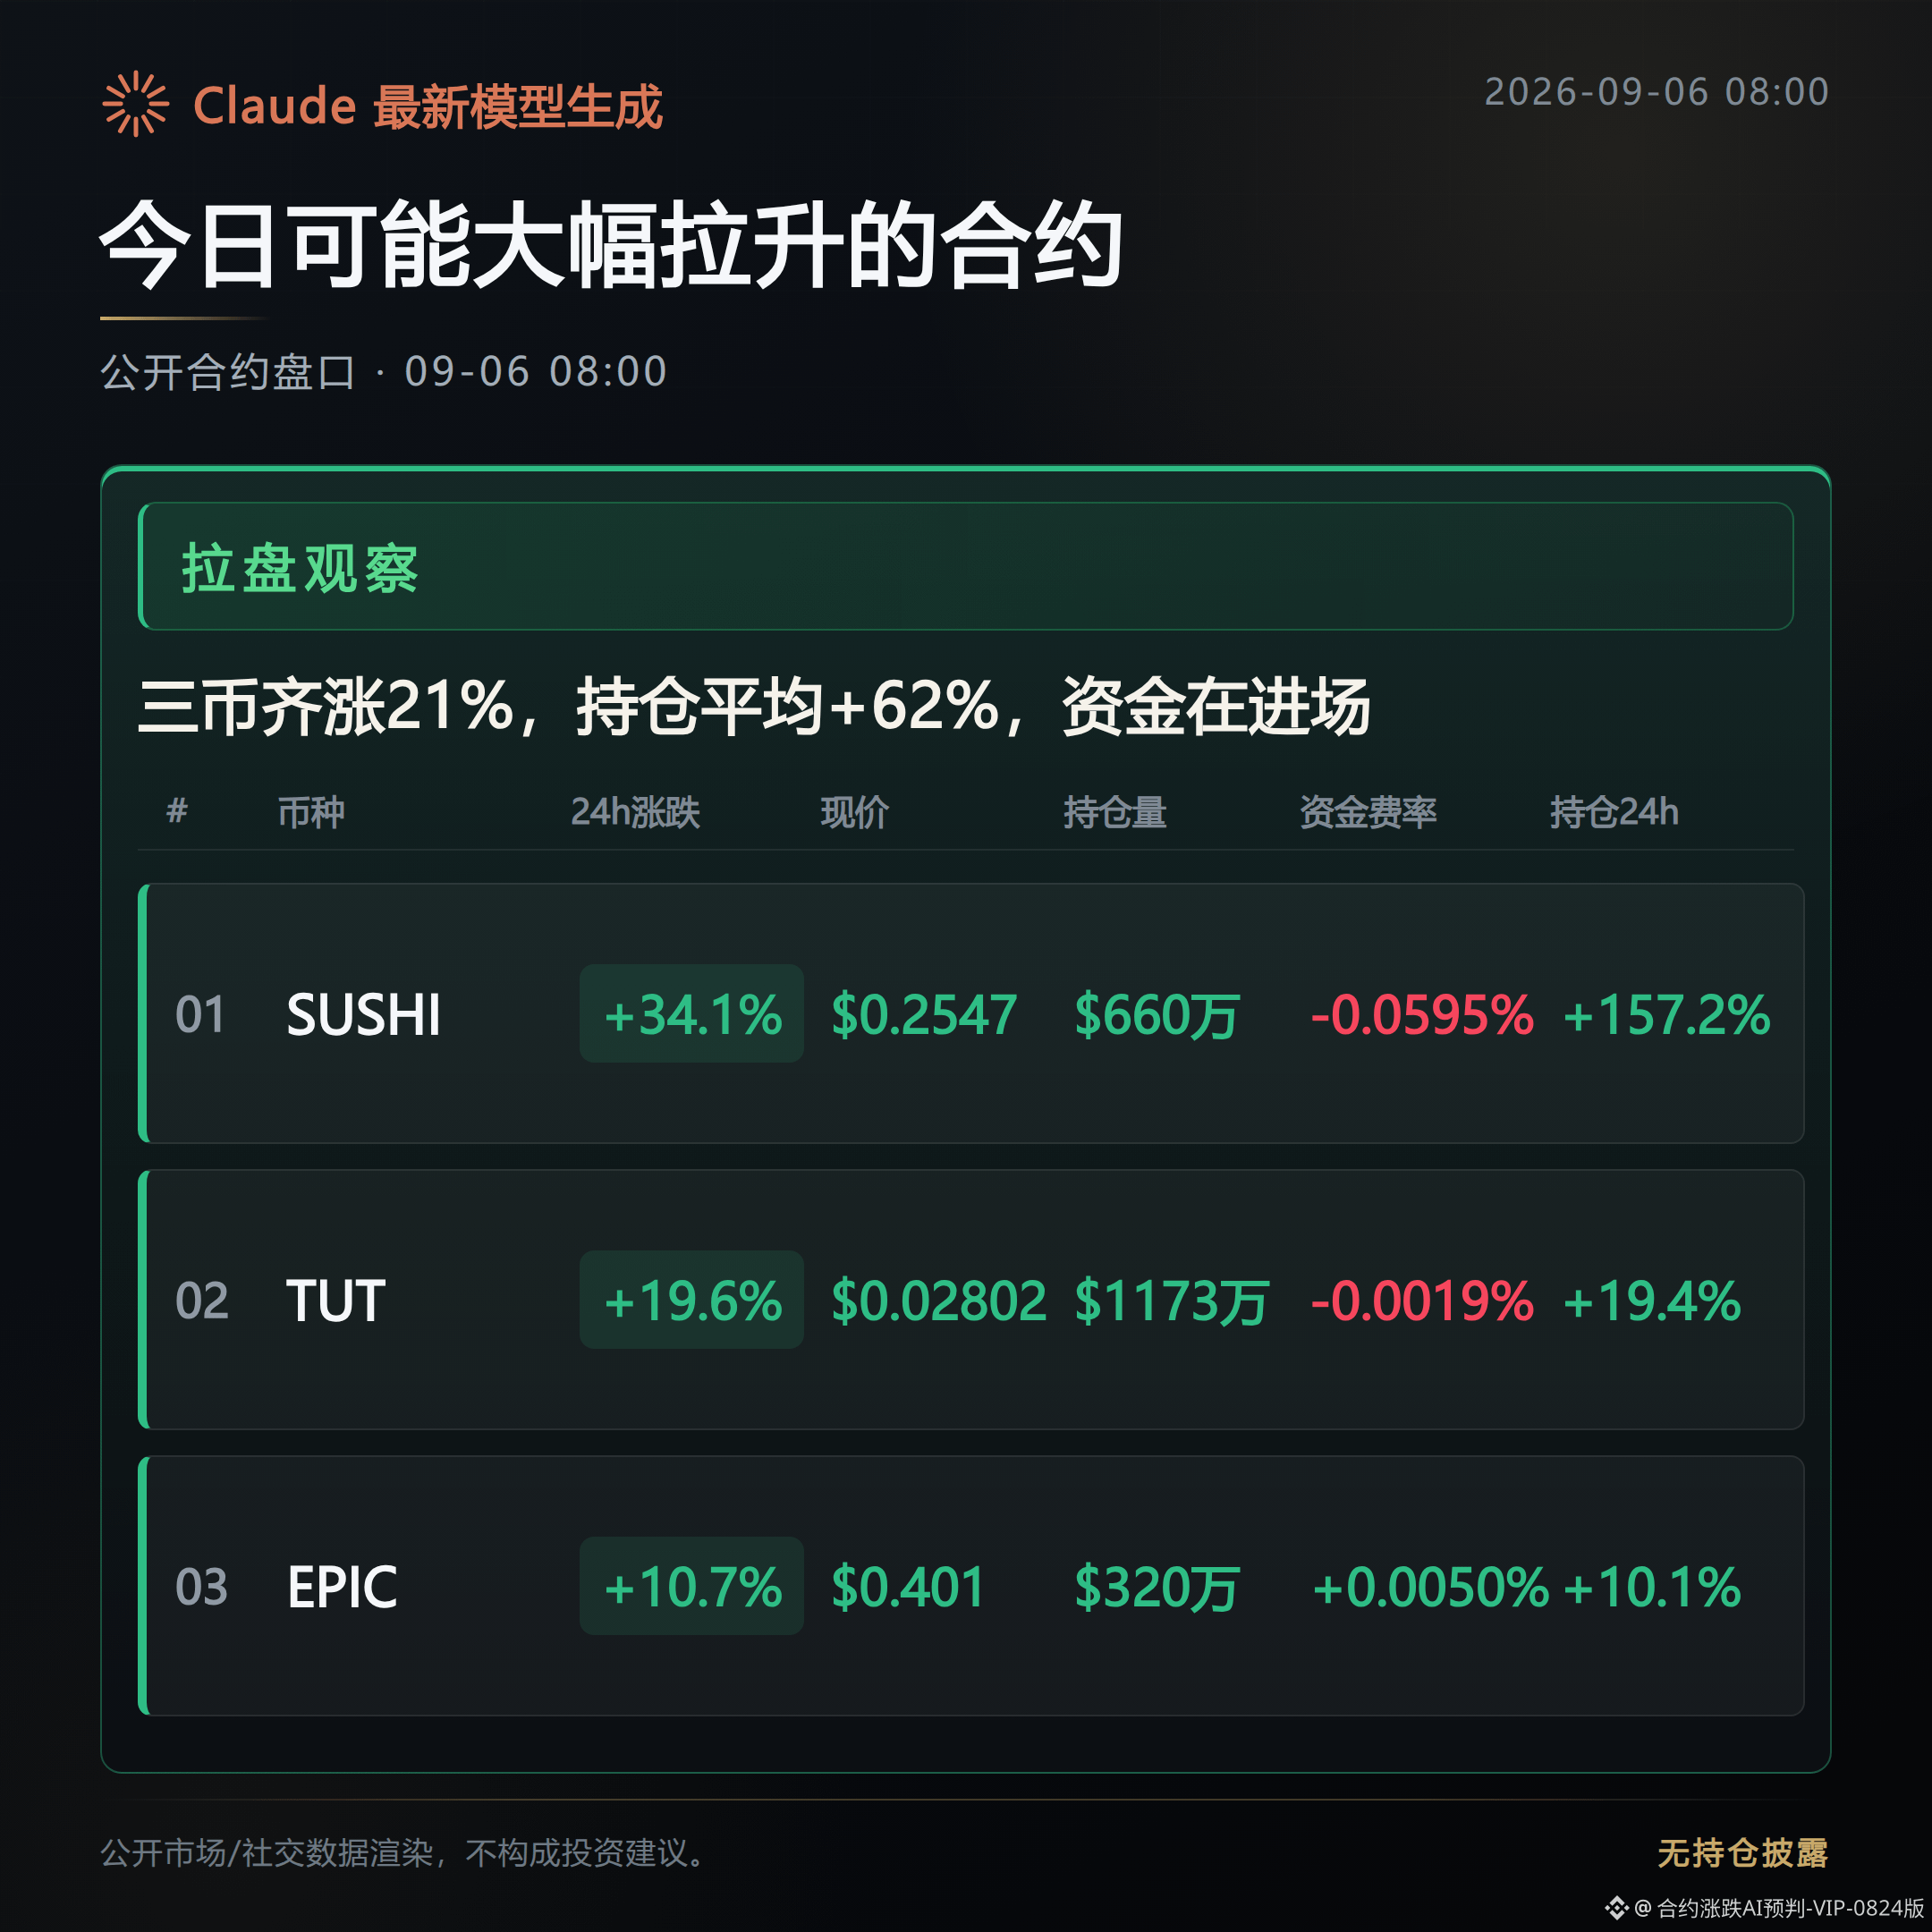
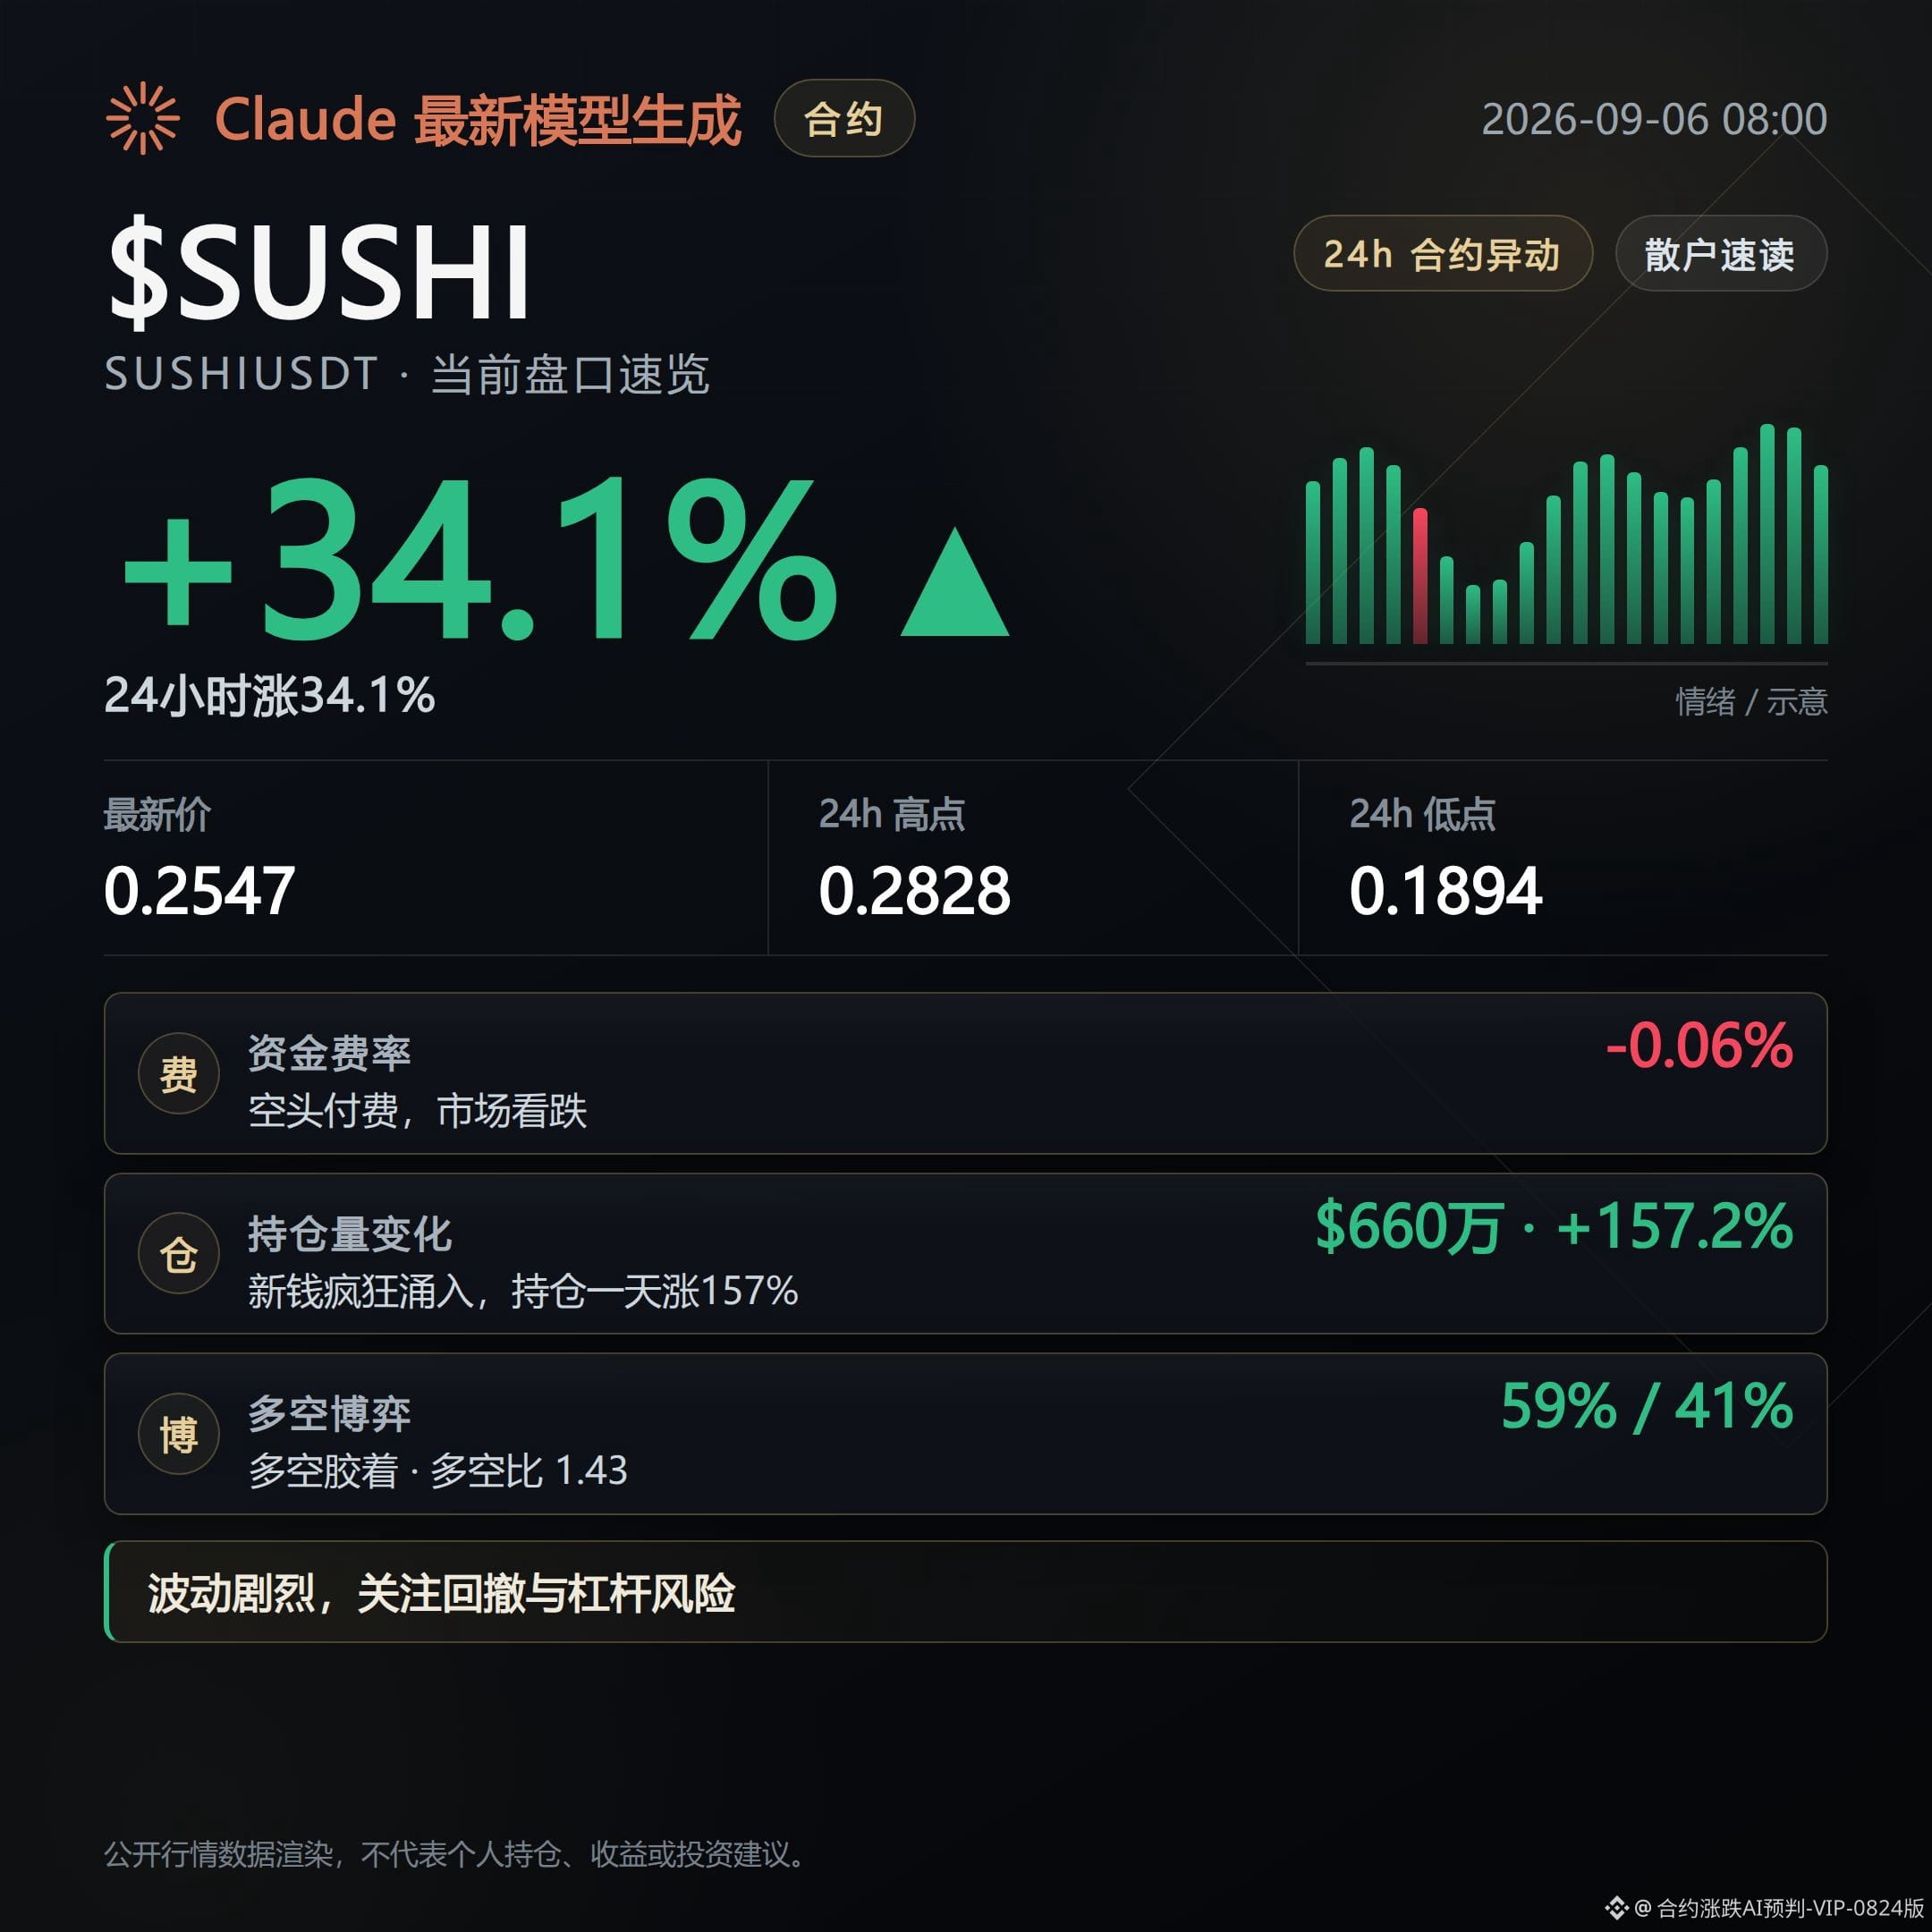
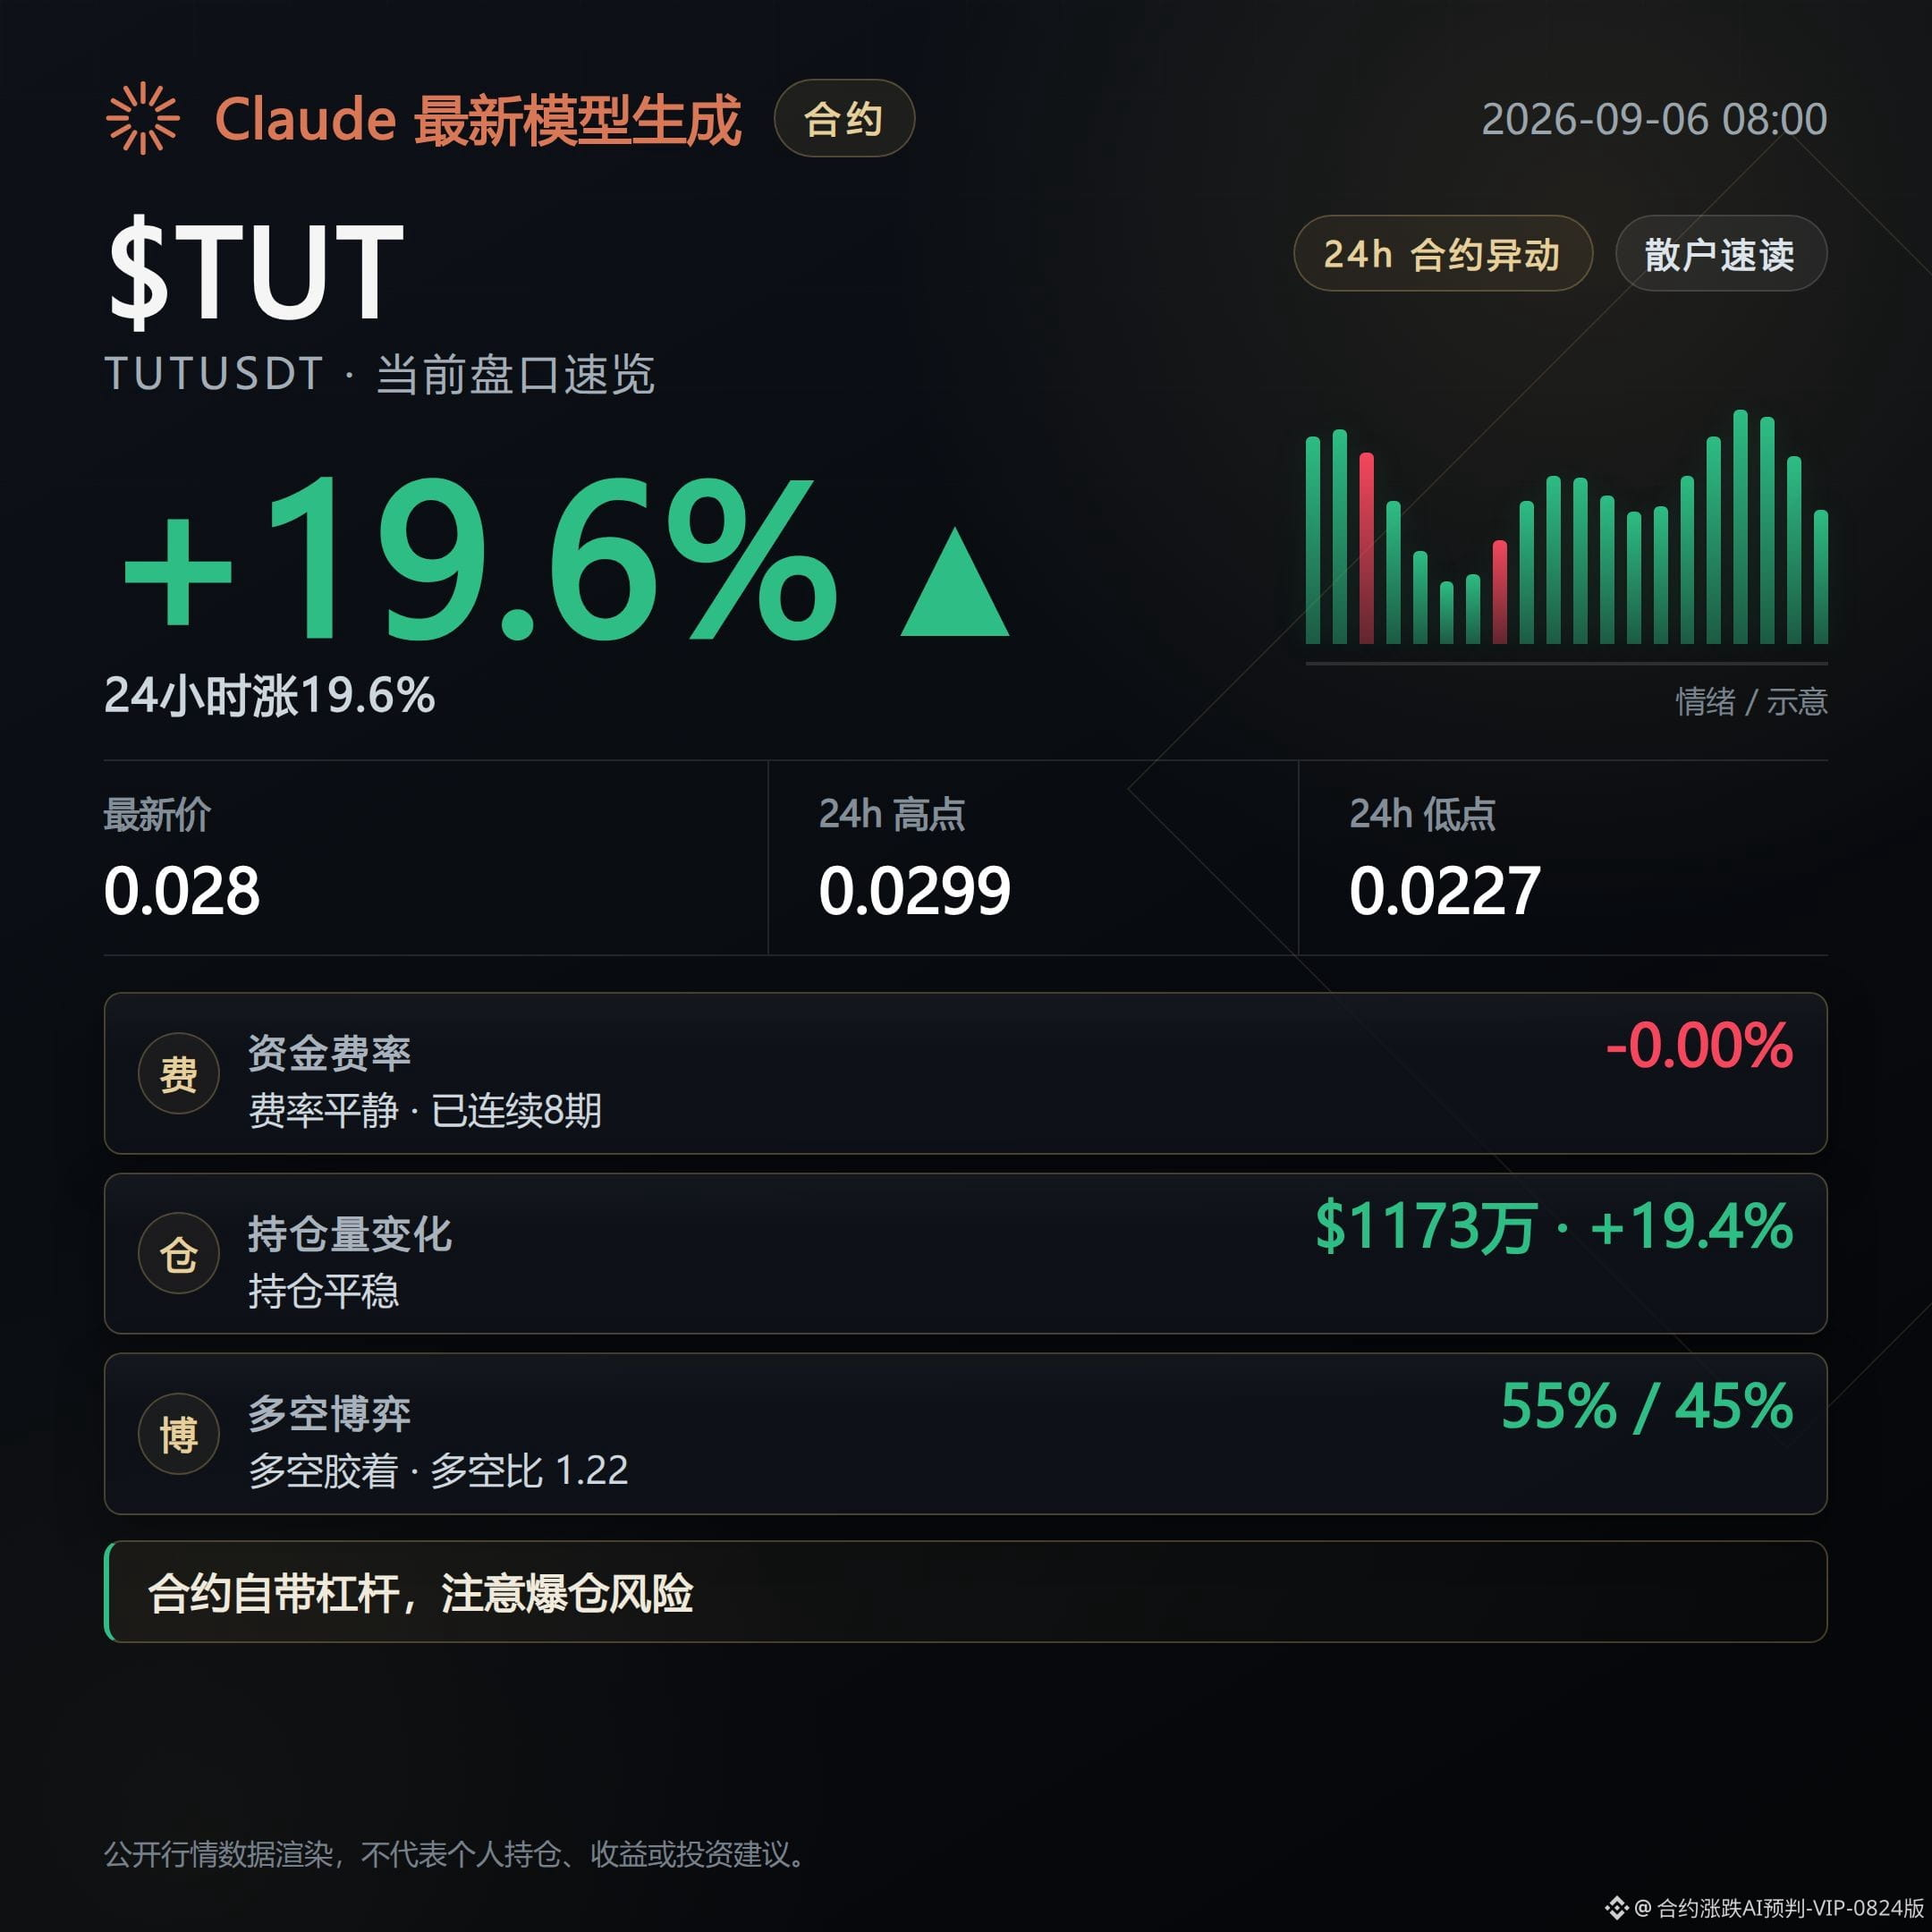
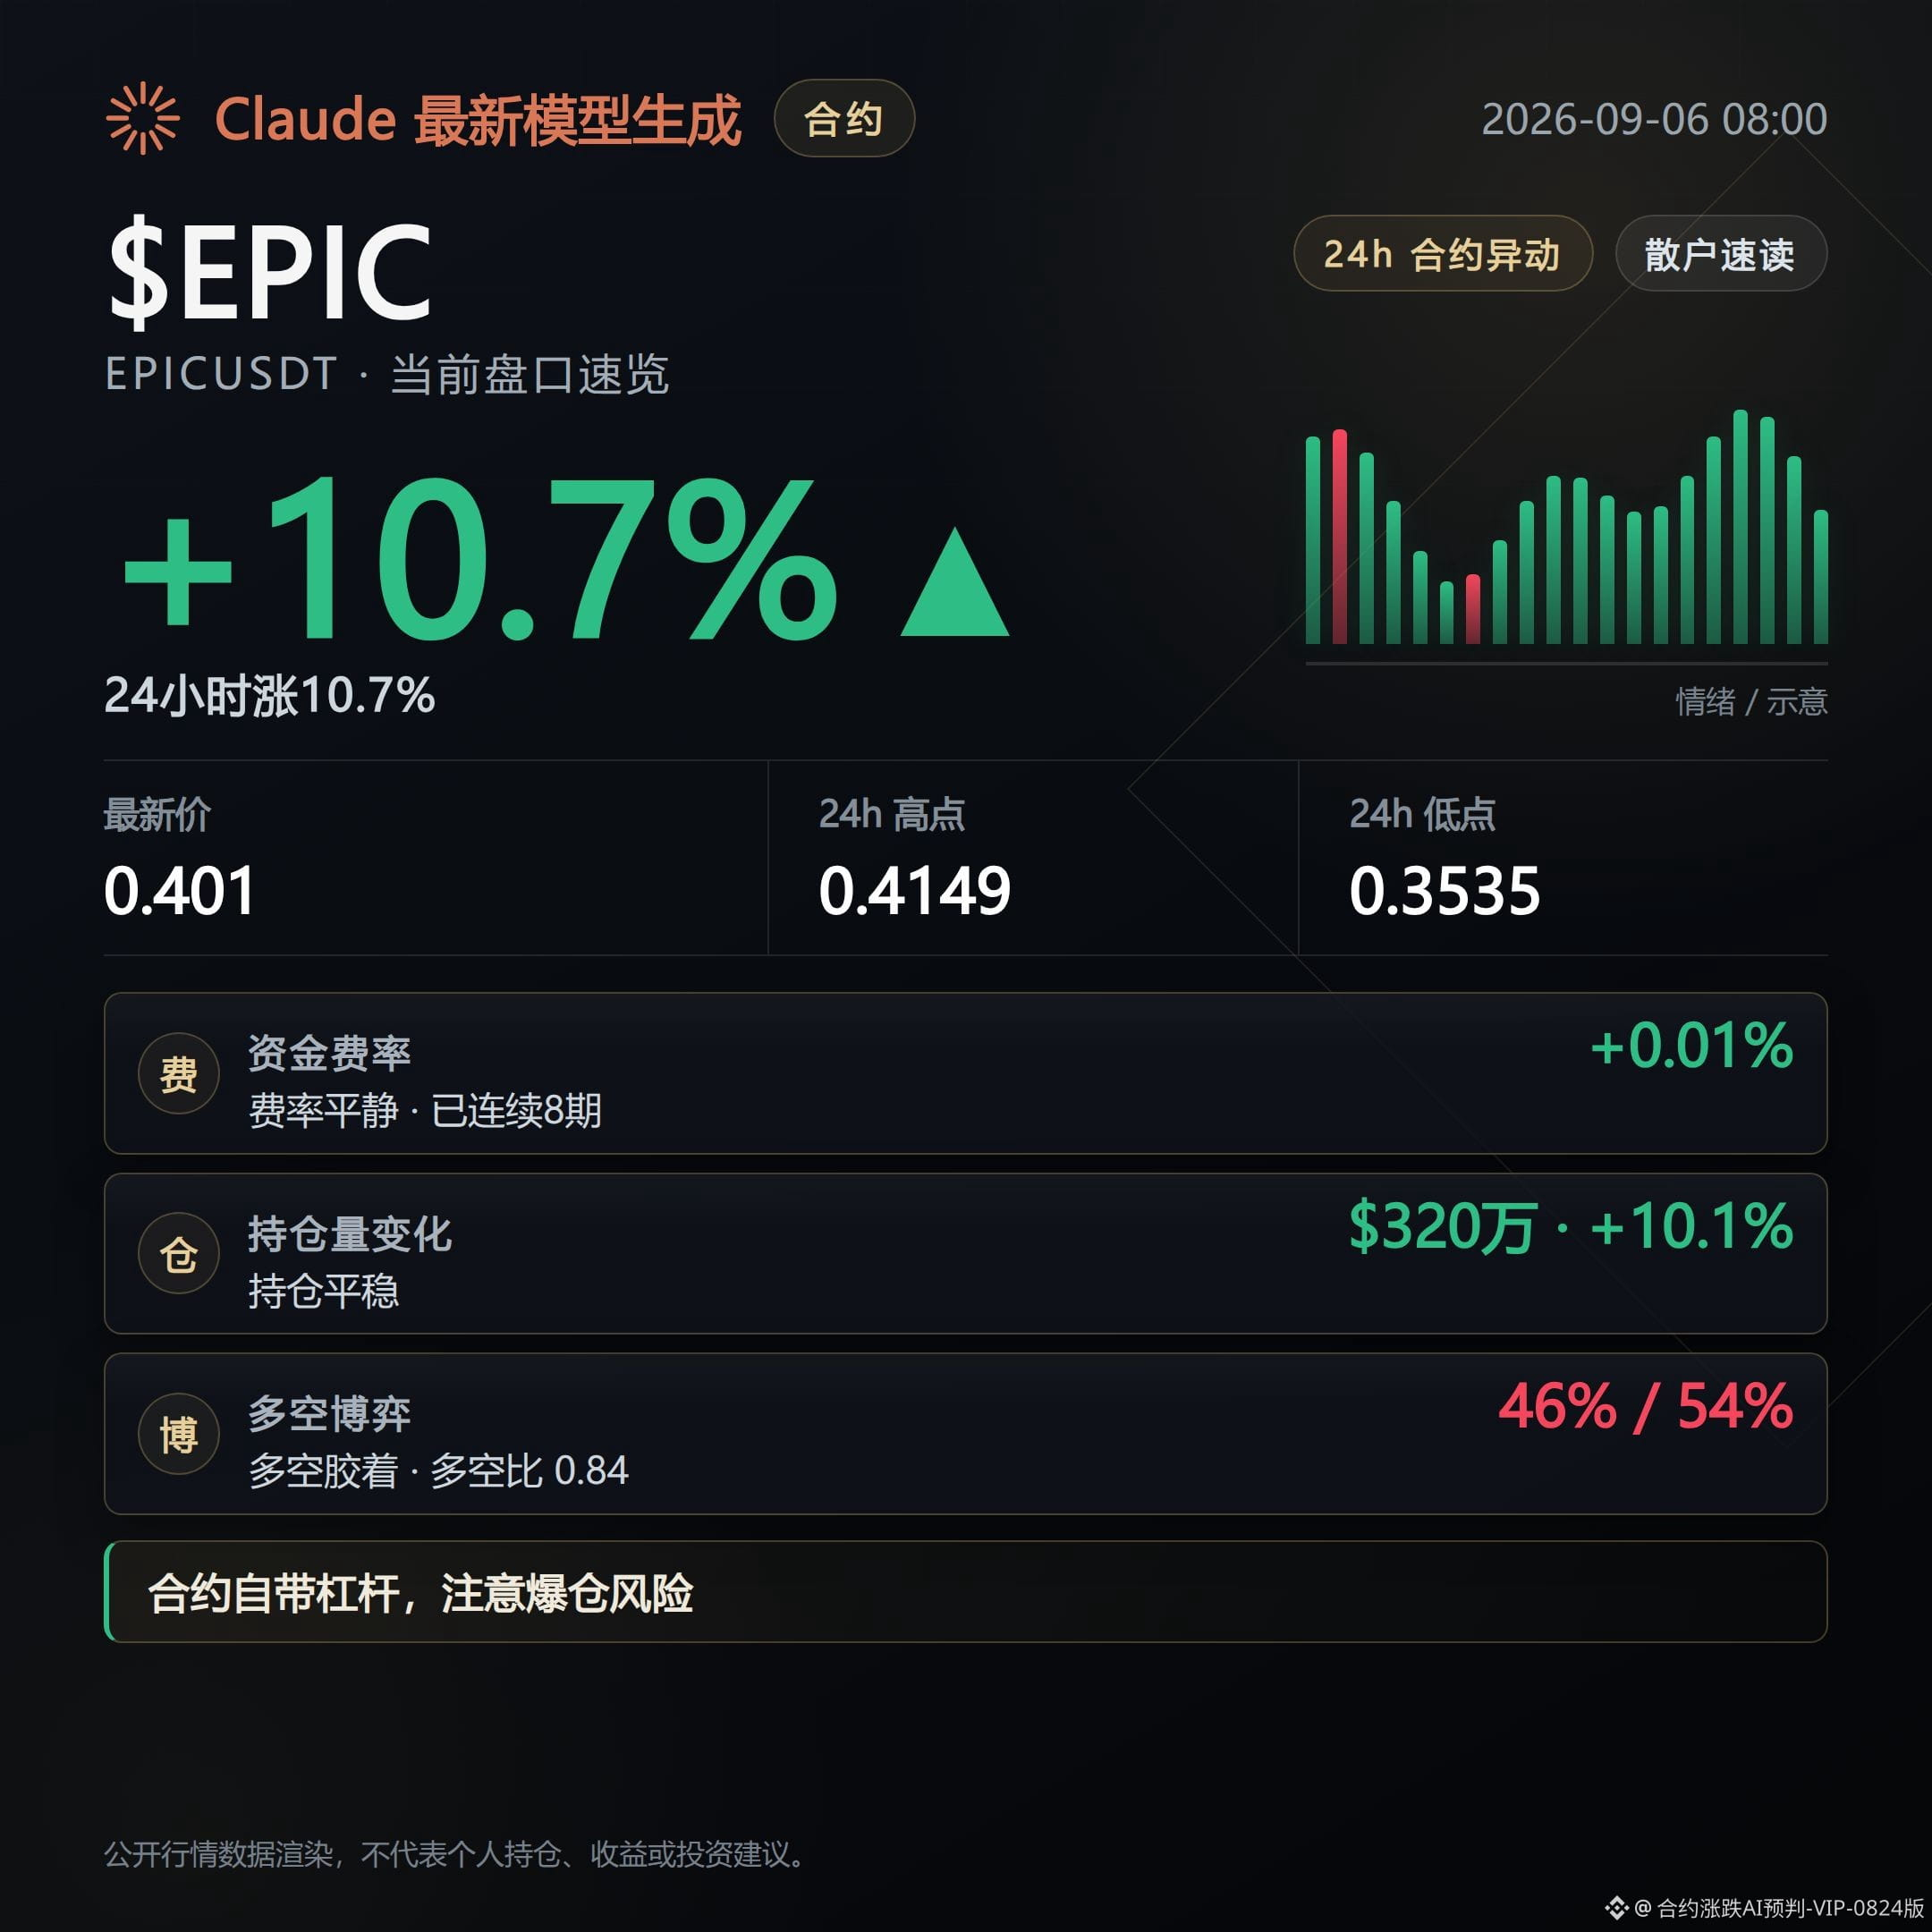
Log in to explore more content