In the first part of the Binance Blog Trader Series featuring Markos Katsanos, we explore the relationship between Bitcoin and other cryptocurrencies and traditional assets.
Read the Introduction of the Binance Blog Trader Series Here.
Key Takeaways
- Bitcoin correlations with other cryptocurrencies were strong before, compared to the current market. As altcoins mature, they begin to decouple from Bitcoin. This means that the crypto market can possibly become a regular market and serve as an alternative to foreign exchanges.
- Because cryptocurrencies are a lot more volatile than conventional assets, the correlation of returns will be weaker.
- When designing a regression model to predict one cryptocurrency based on its correlation with another, it would be better to use daily returns for short term predictions and asset prices for longer-term predictions.
- Recently, the correlation with the stock market has become so noteworthy that Bitcoin and the S&P 500 have begun showing an uncanny resemblance even during intraday trading.
The views and opinions of Markos Katsanos do not necessarily reflect those of the Binance blog, Binance, or its divisions and affiliates. Please exercise due diligence when reading this.
Read the Introduction of the Binance Blog Trader Series Here.
Introduction
“Paper money eventually returns to its intrinsic value - zero.” - Voltaire, 1729
I am not a Bitcoin enthusiast, but the most compelling argument for owning Bitcoin or other cryptocurrencies is the unprecedented expansion of the global money supply, an expansion that has accelerated during the recent pandemic. The dramatic increase in debt will sooner or later devalue the purchasing power of fiat currencies and undermine investors’ confidence in the international monetary system. In recent months, the U.S. Federal Reserve has expanded its balance sheet from $4.1 trillion in February 2020 to over $6.9 trillion by the middle of May 2020—at a rate of about $30 million every minute with no end in sight. In addition, the ECB boosted its pandemic emergency purchase program to €1.35B and extended the PEPP (Pandemic Emergency Purchase Program) to at least the end of June 2021. The unprecedented expansion of every form of money, combined with the recent bitcoin halving are the main reasons for the sharp bitcoin rally in recent weeks.
Bitcoin: Halving, Gold Comparisons, and More
Bitcoin, like gold, cannot be printed. This is because Bitcoin was designed to have a fixed supply of 21 million coins, over 87% of which have already been produced. While it is true that the large majority of bitcoins have already been mined, the timeline is a bit more complicated: Block rewards are granted for verifying transactions on the Bitcoin network, and anyone with a suitable computer can participate in the process in order to earn the block reward. The process of transaction verification is called mining, and there are fixed block rewards for solving each block of transactions. In order to limit the supply of bitcoins, block rewards get halved after every 210,000 blocks are mined. When Bitcoin was launched back in 2009, the mining reward was 25 BTC, which was halved back in 2016 to 12.5 BTC and then to 6.25 on May 12, 2020. Mining rewards will continue to halve until the final bitcoin has been mined. This means that the reward for miners will get smaller over time, and it will also take progressively longer to reach the final bitcoin. Bitcoin halving has the potential to push prices up, as lower supply with steady demand usually leads to higher prices. The first two bitcoin halvings were each preceded by a more than 250% run-up, followed by an extreme rally (see Figure 1 below). In previous halvings, the price of bitcoin started rallying about 12 months ahead of the halving.
The pre-halving rally was very brief and less aggressive (compared with previous halvings), probably because it coincided with the pandemic, when even gold, the most reliable safe haven, felt the sting of the market. Both of them, however, recovered nicely to their pre-crisis levels by the end of April. In any case, it will be very interesting to see what will happen after the recent halving–and also before the next halving–which is expected in the beginning of May 2024.
The Bitcoin market has matured a great deal since 2016, buoyed in large part by the availability of Bitcoin futures and options in the CME in December 2017, which has generated growing institutional participation. Currently, the Open Interest in CME's BTC futures is 9,940 contracts, up 100% compared to the same period in 2019, which indicates strong participation of institutions that want exposure to the cryptocurrency.
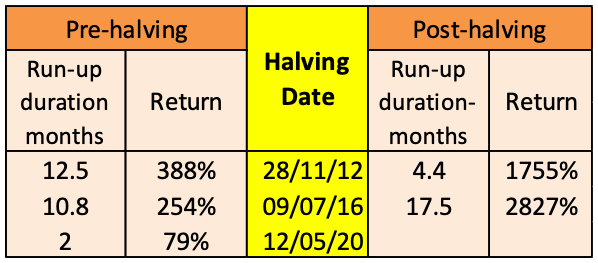
Figure 1. In the first two columns, you can see the pre-halving rally duration and return. The middle column displays the halving dates, while in the last two columns, you see the post-halving rally duration and return. The pre- and post-duration rallies are calculated from the nearest local chart bottoms and tops, respectively.
Currently, you have to pay 5.4 ounces of gold for one single bitcoin. Since March of 2018 this ratio has been relatively stable (see Figure 2) with bitcoin fluctuating from a low of 2.8 in April of 2019 to a maximum of 7.8 in July 2019.
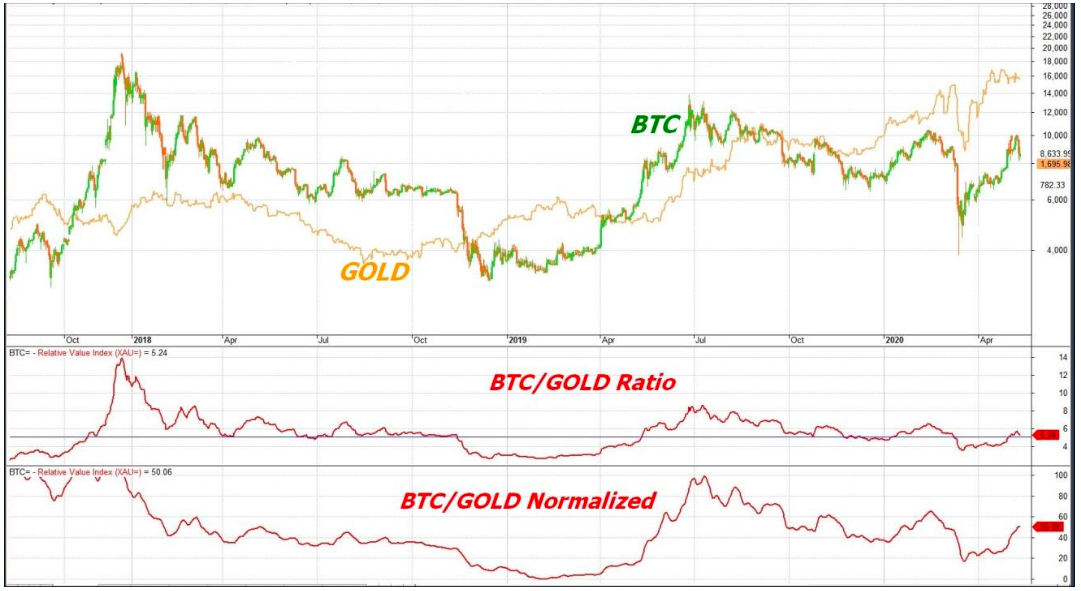
Figure 2. Daily chart of the BTC/USD and Gold cash prices superimposed in orange, from the beginning of August 2017 until the beginning of May 2020.
The ratio of BTC to gold is depicted in the middle window. Notice that since March 2018, the BTC to gold ratio fluctuated around 5 (the blue horizontal line). In the bottom window you can see the same ratio normalized from 0-100. Values over 50 indicate that Bitcoin is overvalued (in relation to gold), while values under 50 suggest that it is undervalued.
Although Bitcoin has no intrinsic value as such, the cost of mining new bitcoins is substantial as it requires a lot of computing power. Costs can vary wildly depending on electricity rates. According to research conducted by Elite Fixtures, the cost of mining a bitcoin varies significantly around the world, from as little as $531 in Venezuela to an eye-watering$26,170 in South Korea. Venezuela came in as the cheapest nation as their electricity rates are heavily subsidized by the government. Trinidad, Tobago, Uzbekistan, Ukraine, and Myanmar round out the rest of the five least expensive nations. The United States came in as the 41st cheapest country for mining at $4,758.
Major Cryptocurrencies Included in the Study
Although commonly associated with Bitcoin, blockchain technology has many other applications that go beyond digital currencies. In fact, today, Bitcoin is only one of several hundred applications that use blockchain technology.
Bitcoin and Ethereum are often compared to each other because they both use blockchain technology, but the two were designed with different vision and goals. Bitcoin is a cryptocurrency intended as an alternative to the fiat currencies, while Ethereum is a multipurpose platform. With Ethereum, developers can build their own blockchain-based programs, called dapps (decentralized applications), which can run on the network and automatically carry out tasks when certain conditions are met. Ether is the cryptocurrency used to pay to run programs on the Ethereum network.
Ethereum (ETH)
Ethereum was launched in July 2015 with an initial offering of 60 million ether, which raised around $18.5 million. Additional ether is released via a mining process, similar to Bitcoin’s. The parties that want to validate the transaction or smart contract will also pay a fee (called the gas price) in order to have it completed and added to the blockchain. The reward per block was initially 5 ETH per block. This was reduced to 3 ETH on the 16th of October 2017 and again to 2 ETH on the 16th of January 2019. The rewards are thus reduced each time by a third, hence the “thirdening.”
Bitcoin Cash (BCH)
Bitcoin Cash (BCH) is a cryptocurrency with its own blockchain created on August 2017, from a fork of Bitcoin. The technical difference between Bitcoin Cash and Bitcoin is that Bitcoin Cash allows larger blocks in its blockchain than Bitcoin, which in theory allows it to process more transactions per second. Bitcoin Cash has also cheaper transfer fees (around $0.20 per transaction). The first BCH halving occurred on the 8th of April 2020 when Bitcoin cash reached 630,000 blocks, thus reducing the mining reward from 12.5 to 6.25 BCH. The next halving is expected in April 2024.
Litecoin (LTC)
Litecoin (LTC) was an early bitcoin spinoff that launched in October 2011. When it comes to technical details, Litecoin is nearly identical to Bitcoin, differing primarily by having a decreased block generation time (2.5 minutes as opposed to 10 minutes for Bitcoin) and different hashing algorithm. Like with Bitcoin, the reward is halved after every 840,000 blocks are mined (approximately every 4 years). The block reward was initially 50 LTC and will keep on halving until the block reward per block becomes zero. The current reward is 12.5 LTC. The first halving event occurred on the 25th of August, 2015, the second on the 5th of August, 2019, and the third halving, according to litecoinblockhalf.com, is expected on the 6th of August 2023.
Ripple (XRP)
Ripple (XRP) is a real-time gross settlement system, currency exchange, and remittance network created by Ripple Labs Inc., a US-based technology company. Released in 2012, Ripple is built upon a distributed open source protocol and supports tokens representing fiat currency, cryptocurrency, commodities, or other units of value such as frequent flier miles or mobile minutes.
The ledger employs the decentralized native cryptocurrency known as XRP, which as of April 2020 was the third-largest coin by market capitalization.
BNB
BNB is the native token of the BNB Chain. It supports multiple utilities on the Binance Exchange, which includes paying for сomissions with a significant discount (up to 50%) on exchange fees, listing fees, and any other fees on the Binance Exchange. The token was established with a total supply of 200 million, but Binance has institutionalized a quarterly token burn that will continue until 50% of the total BNB supply (100 million) is burned.

Correlation Analysis Between Assets
In the table in Figure 3 below, you can see the correlation matrix between BTC/USD and the S&P 500 (SPX), the Nasdaq (NDX), Gold, and the main five altcoins: Ether (ETH), Bitcoin Cash (BCH), Litecoin (LTC), BNB, and XRP. Bitcoin data for the last seven-year period from April 2013 until the end of April 2020 was used because earlier Bitcoin trading was very thin and the data unreliable. The other altcoins started trading later than Bitcoin, so the correlations reflect only the latest 4.1 years period for ETH, 2.3 years for BCH, 3.7 years for LTC, 2.5 years for BNB, and 3 years for XRP.
In a previous study that will be published in the Technical Analysis of Stocks and Commodities magazine, I included more traditional assets like the Shanghai Composite, Crude Oil, the VIX, Treasury notes and the main four Forex pairs that are used to purchase bitcoins (the Chinese Yuan, the Japanese Yen, the Korean Won and the Dollar Index), but the correlations were rather weak or non-existent so I am not going to waste any digital ink with them.
Generally, assets with a correlation above 0.5 or below -0.5 are considered to have strong positive/negative correlations. On the other hand, correlations between +/-0 .10 indicate a lack of linear relationship between two variables. To calculate the daily correlation, I used Spearman’s nonparametric method as the assumptions of the Pearson correlation (absence of outliers, normality, linearity, and homoscedasticity) were markedly violated. In Figure 4, you can see more recent correlations during the 2 year period until the end of April 2020. Notice that while early Bitcoin correlations with other crypto coins were strong across the board (see Figure 3), as the altcoins matured, they started decoupling from Bitcoin (see Figure 4). This indicates that the Crypto market can possibly become a regular market, alternative to the foreign exchange.
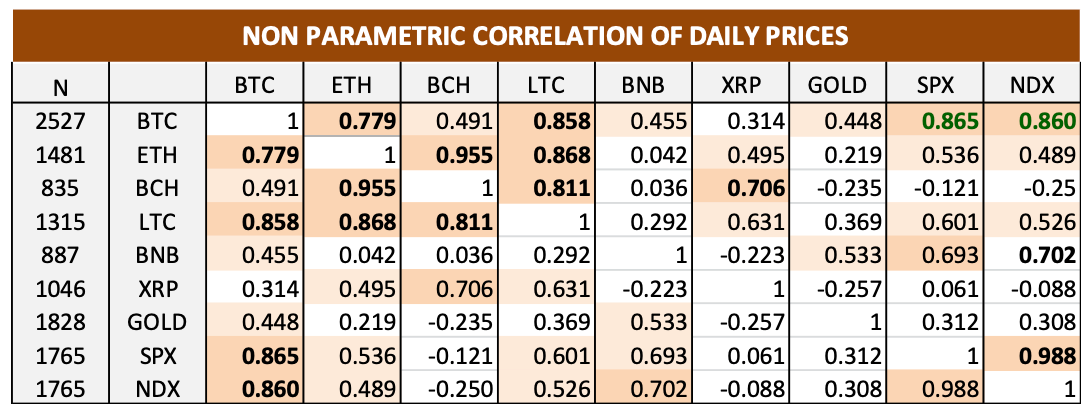
Figure 3. Spearman’s rho nonparametric correlation between the BTC/USD, Ether (ETH), Bitcoin Cash (BCH), Litecoin (LTC), BNB, XRP, London Gold cash prices, the S&P 500, and the Nasdaq 100 (NDX). Strong correlations are highlighted in orange and very strong in bold. The correlations were calculated pairwise using all available data from 28/4/2013 until 1/5/2020 including weekends. In the first column you can see the number of data used for each. Only Bitcoin data were available for the entire period. Data for ETH were available since 10/3/16, for BCH since 18/1/18, for LTC since 24/8/16, for BNB since 9/11/17 and for XRP since 20/5/17. All data were provided by Thompson Reuters Datalink and investing.com (cryptocurrencies).
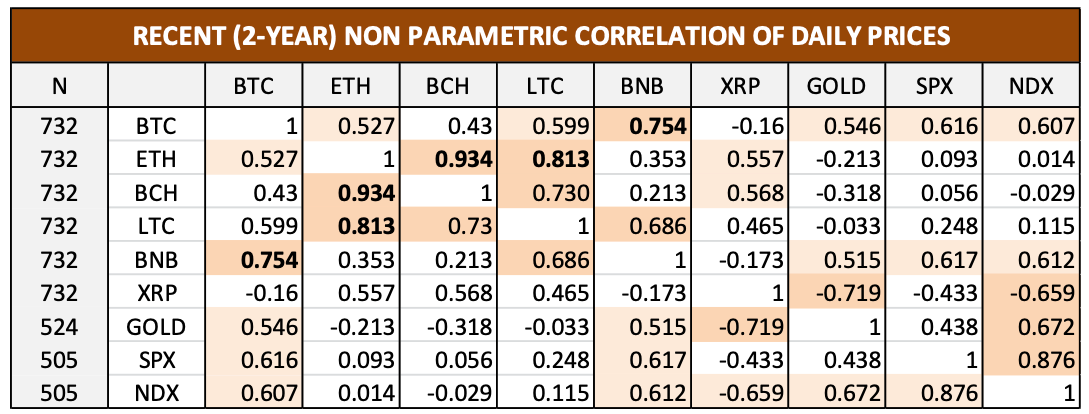
Figure 4. Spearman’s rho nonparametric correlation for the most recent 2 year period from 1/5/18 until 1/5/20. Data for cryptocurrencies included weekends. Each correlation was computed for all cases that do not have missing values for this specific pair of variables (pairwise).
Correlations on Returns
In the tables in Figures 5, 6, and 7, you can see the correlation of one-, two-, and five-day returns. Directionally, all of them are still following the same trend with price correlations (positively or negatively correlated), but while correlations of returns between cryptocurrencies were stronger, the correlations between cryptocurrencies and stocks or gold were considerably weaker.
People often ask me why the correlation of returns is different from that of absolute prices and whether they should use prices or returns in a regression model. The answer is that it depends on what you want to use the analysis for. In general, if you are trying to see how the variations in one time series influence another's variations, then use returns. On the other hand, if you are interested in how the trend of one variable correlates with the trend of another, then use absolute price levels.
In our case, because cryptocurrencies are a lot more volatile than conventional assets, the correlation of returns will be weaker. For example, during the second week of March 2020, Bitcoin declined by 29% while the S&P 500 declined as well, but only by 1.5%. The correlation of prices was moderately strong (0.45) but the correlation of daily returns was negative (-0.15), even though they were still following the same trend directionally (hence, positively correlated). Another reason for the disparity of absolute price and return correlations are lagged effects before the variation in one variable is transmitted to the other.
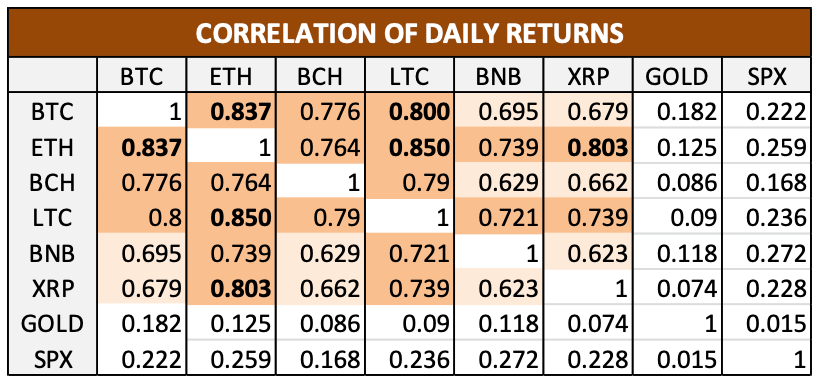
Figure 5. Pearson’s correlation of daily % returns (percent changes) between the assets described in Figure 3 above, for the two year period from 1/5/18 until the end of April 2020. In calculating the returns only business days were considered (weekends were excluded.) The correlations were computed for 505 data pairs. Notice the strong correlation between all cryptocurrencies.
For further research on correlation coefficients of daily returns you may refer to previous work from Binance Research.
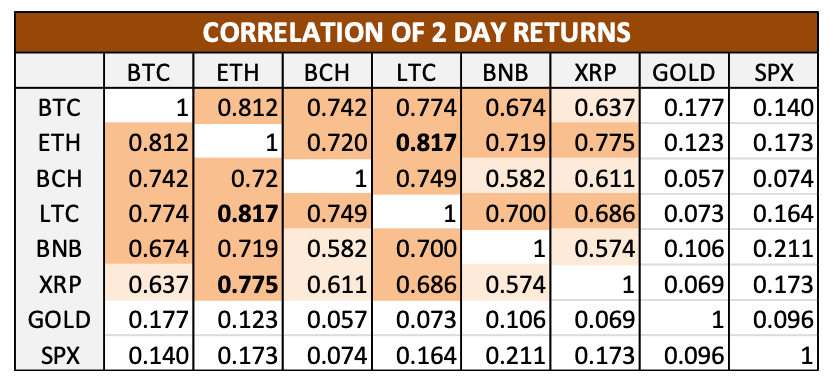
Figure 6. Pearson’s correlation of 2 day % returns for the two year period from 1/5/18 until the end of April 2020. In calculating the returns only business days were considered and the correlations were computed for the remaining 503 available data pairwise. Correlations between all cryptocurrencies were stronger across the board.
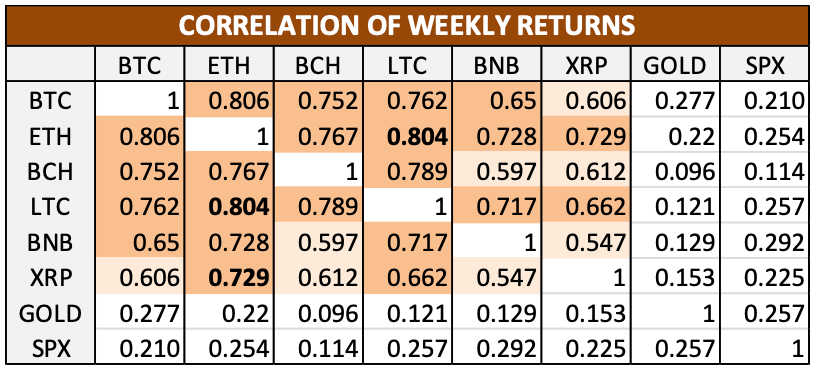
Figure 7. Pearson’s correlation of weekly % returns for the two year period from 1/5/18 until the end of April 2020. In calculating the returns only business days were considered. Correlations between cryptocurrencies and conventional assets were noticeably stronger than the corresponding 2-day return correlation in Figure 6 above.
Correlations in Returns Across Multiple Days
In the graph in Figure 8, you can see how the correlation of returns between Bitcoin, ETH, XRP, the S&P 500, and gold varied for 1-40 day returns. The correlation of cryptocurrencies like the ETH or XRP peaked for one-day returns and then, in the case of ETH, remained fairly constant (red line) but declined considerably in the case of XRP (in blue) for longer returns. This is because the correlation of prices between the BTC and ETH (and hence the trend) was considerably stronger. On the other hand, the correlation between Bitcoin and the S&P 500 (green line) peaked for 25-30 day returns suggesting a stronger long term directional trend relationship. The correlation with Gold was also stronger for 10-day returns or more.
Thus, in designing a regression model to predict one cryptocurrency based on its correlation with another, it would be better to use daily returns for short term predictions and prices for longer-term.
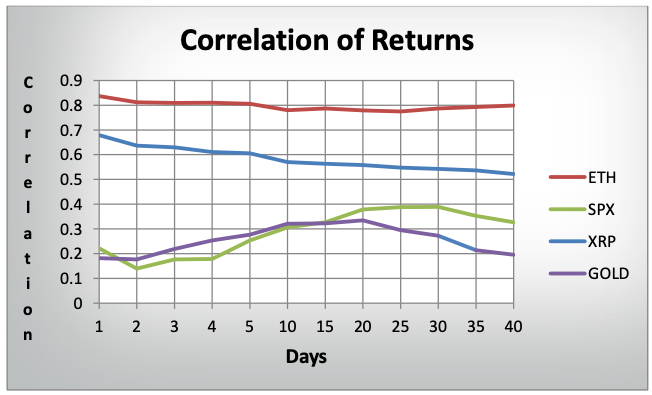
Figure 8. Pearson’s correlation of 1-40 day returns) between BTC and Ether, Ripple XRP, S&P500, and Gold for the two year period from 1/5/18 until the end of April 2020. Notice that correlations between BTC and XRP or ETH were stronger for daily returns while correlations between BTC and GLD or SPX peaked for 20-25 day returns.
Another thing to consider in a correlation analysis is the variability of correlations over time. Notice in the chart in Figure 9 that while early Bitcoin correlations fluctuated considerably over time, sometimes alternating from negative to positive, correlations started becoming more stable and reliable as Bitcoin matured. Since the beginning of 2017, the correlation with stocks (2nd window pane in blue) dipped briefly–only once going below zero–while the correlation with LTC (4th window pane in green) remained positive from the middle of 2017 until today.
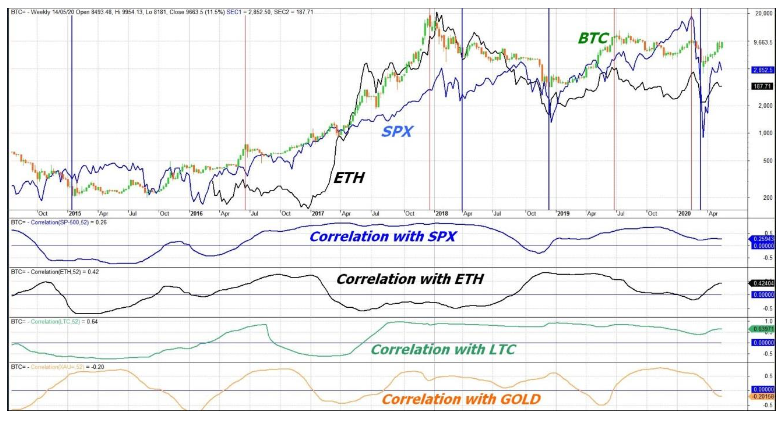
Figure 9. Weekly chart of the BTC/USD, the S&P 500 (in blue), and Ether (ETH) in black from 2015 until the beginning of May 2020.

Leading-Lagging Correlations
A time series with a strong correlation with another doesn’t mean that this is the best to use in order to predict future values of the other. This can only be determined by the leading/lagging correlation analysis. In Figures 10 and 11, you can see the correlation of two- and 20-day returns between Bitcoin, gold, the S&P 500, and four other cryptocurrencies. The lag values in the first column indicate the duration in days by which Bitcoin leads or lags the other. A higher correlation with positive lags indicates that Bitcoin is leading, whereas higher correlation with negative lags indicates that Bitcoin is lagging the other asset. In the graph in Figure 12, you can see the leading/lagging weekly return correlations.
The results were certainly a surprise. I expected Bitcoin to lead all other cryptocurrencies and lag the S&P 500 and gold, but the analysis indicated that the opposite is true with Bitcoin leading the S&P 500 and lagging all cryptocurrencies except for the Ether. The relationship with gold was a little more complicated. Short and up to 5 day lags indicated a Bitcoin lead but this reversed for higher-order lags (see Figure 11).
The weekly correlations with other cryptocurrencies tended to decrease exponentially after the first and until the 5th day (see figure 12). After that and for more than 7 day lags, the correlation reversed direction and started to increase.
The lead/lag relationship with the SPX had the opposite trend: The correlation increased for positive lags up the 3rd day and decreased after that, turning negative for right or more lags.
To confirm these rather unexpected results, I identified four tops and bottoms in the composite chart of Bitcoin, SPX (in blue), and ETH (in black) in the chart in Figure 9 above, and drew red and blue vertical lines at the tops and bottoms respectively. As you can see the SPX lagged Bitcoin in 3 out of four tops and bottoms. The fourth top, in February of 2020 was coincident. In the case of Ether, the results were inconclusive. The ETH lagged Bitcoin only half the times at tops and was coincident at 2 out of 3 bottoms. The lag was, however, more apparent at important tops. Notice the 3 week ETH lag during the December 2017 top.
Yearly (52-week) correlations with the SPX, ETH, Litecoin (LTC), and Gold are depicted at the bottom. Tops are indicated with vertical red lines and bottoms with blue lines. Notice how Bitcoin leads the S&P 500 at tops and bottoms.
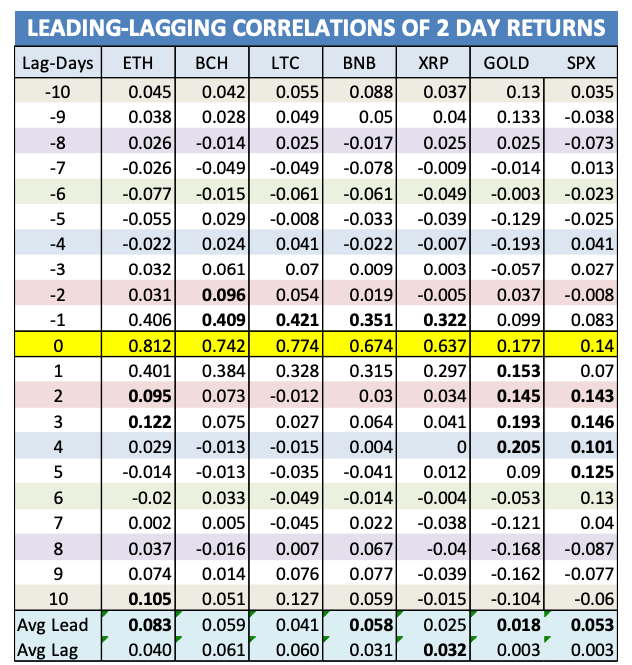
Figure 10. Correlation of 2-day % returns (changes) between Bitcoin and the symbols described in Figure 3 above, for the last two years until the end of April 2020. Higher correlations for negative lags indicate that Bitcoin lags the corresponding asset and higher correlations for positive lags indicate that Bitcoin leads. In this case, Bitcoin leads the Ether, Gold, and SPX and lags slightly the BCH, LTC, and BNB.
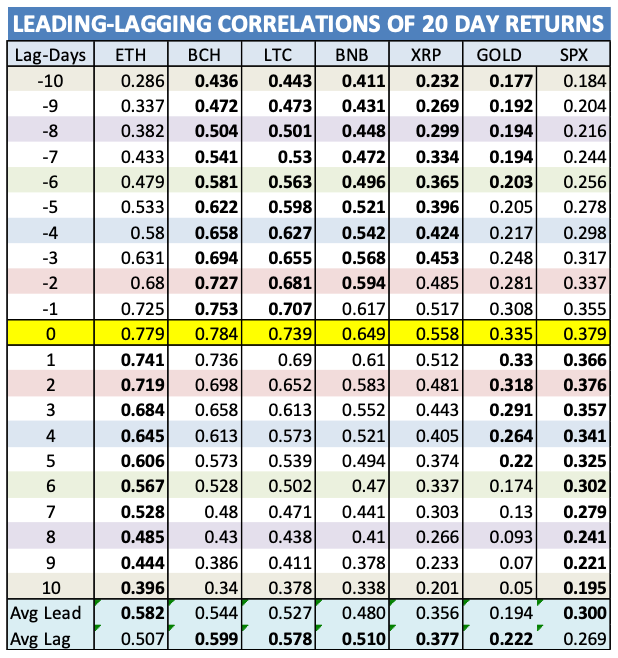
Figure 11. Correlation of 20-day returns between Bitcoin and the symbols described in Figure 3 above, for the last two years until the end of April 2020. Higher correlations for negative lags indicate that Bitcoin lags the corresponding asset and higher correlations for positive lags indicate that Bitcoin leads. In this case, Bitcoin leads Ether, Gold, and SPX, and lags the BCH, LTC, BNB, and XRP. Correlations have strengthened considerably from the corresponding 2-day returns and especially the correlation with conventional assets like Gold and stocks (SPX).
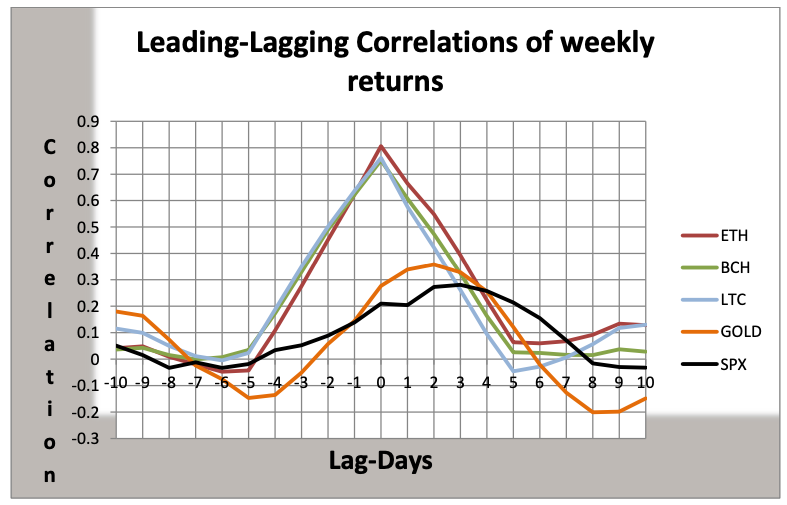
Figure 12. Correlation of weekly returns between Bitcoin and the S&P 500 Index (black line), Gold (orange line), Ether, Bitcoin Cash, and Litecoin for 1 to 10-day lag or lead. Higher correlations for negative values on the X-axis indicate that Bitcoin lags the other assets and higher correlations for positive values on the X-axis that indicate that Bitcoin leads. In this case, the correlations were higher for positive lags indicating that it is leading the Ether, Gold, and SPX and lagging BCH and LTC. The correlations were calculated for the 2 year period from the end of April 2018 until the end of April 2020.
Autocorrelations of Returns
In the table in Figure 13, you can see the autocorrelation of 1-40 day Bitcoin returns over successive and up to 20-day lags. Autocorrelation is basically the study of the correlation between a time series and a lagged version of itself. But what good is it?
Autocorrelations can be useful in choosing the appropriate strategy and selecting robust indicator parameters in a technical trading system.
In this case, the autocorrelations were strong for 5-day returns or higher, suggesting strong trending tendencies which can be exploited by using trend indicators (for example moving averages) or a trend based method in a trading system. The best indicator parameters and time horizon can be selected from the autocorrelation table. In this case a 30-40 day channel breakout system looks promising as the correlation is significant (>0.5) for up to 17 days lag.
More sophisticated traders can also use an Auto-Regressive Integrated Moving Average (ARIMA) model to predict likely bitcoin prices in the near future.
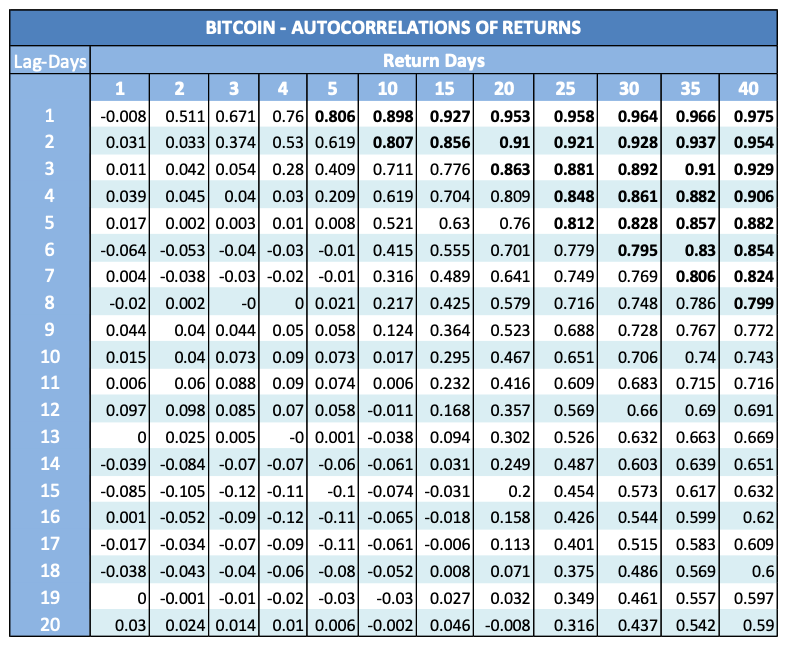
Figure 13. Bitcoin correlation with a lagged version of itself (autocorrelation) of 1-40 day returns for the last two years until the end of April 2020. Autocorrelations are stronger than the corresponding autocorrelations of conventional assets (not shown) suggesting strong trends. Notice that the longer the return the stronger the correlation for higher-order lags. A correlation peak appears around 30-day returns after which correlations improve only marginally.
Intraday Correlations Between Bitcoin and S&P 500
Recently, the correlation with the stock market has become so noteworthy that Bitcoin and the S&P 500 have begun showing an uncanny resemblance even intraday.
In the 15-minute intraday chart in Figure 14 you can see that the May 2020 Bitcoin futures contract (BTCK0) tagged the Emini SP-500 (ESM0 black line) very closely. The correlation broke down only once on 5/5/20 when Bitcoin failed to keep up with the stock rally after the announcement of the emergency FDA approval of Remdesivir for the treatment of Covid-19.
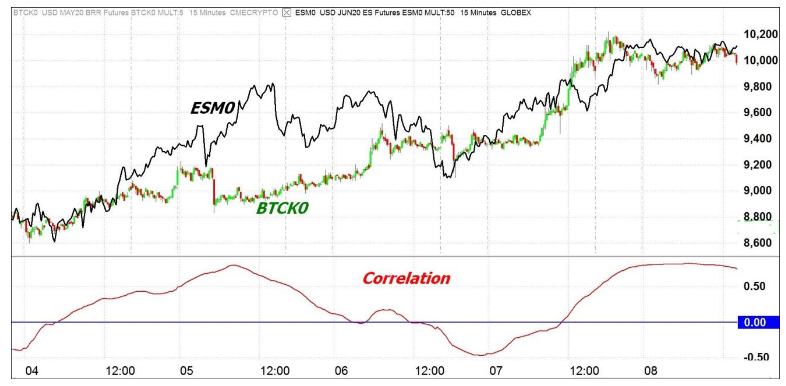
Figure 14. Intraday 15-minute chart of Bitcoin Futures May 2020 (BTCK0) contract and the E-mini SP 500 (ESM0) superimposed in black for the week from 4/5/20 until 8/5/2020. In the bottom window, you can see the 180 bar (2 trading day) correlation. Notice the strong correlation (>0.75) on the 5th and 8th of May.
Prelude to Trading Tips
Before divulging any strategies I should point out, for the benefit of traders that are not familiar with cryptocurrencies, that these are highly volatile assets, far more than the traditional stocks or forex that you are accustomed to trading. You should therefore revise trading rules, such as stops or profit targets based on percentages.
According to the statistics in Figure 15, cryptocurrencies are 1.5 times more volatile than Bitcoin and 6.5 times more than traditional assets such as the S&P 500 or gold. Another thing to consider is that Asian markets are a key driver of cryptocurrency prices, which means a lot of it happens after the US market closes. That makes it hard for the short-term US-based traders to take a position in BTC/USD or Bitcoin futures overnight, because the trade can rapidly go against them.
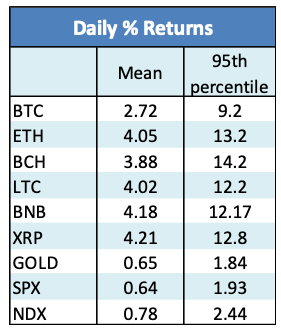
Figure 15. Daily absolute percent returns (changes) statistics for the last 7 year period from 2013 to 2020. The 95th percentile is the value that is exceeded only 5% of the time.
In the second part of this article, I will present two trading strategies for trading cryptocurrencies. Within a developed simulation environment algorithms, the cryptos are put to the test, and conclusions are drawn regarding both the prediction accuracy and the test procedure as such. The first is basically a trend following system, enhanced by adding Intermarket conditions. The second is mainly a divergence system that exploits the strong cross-correlation between cryptocurrencies.
To be continued…