
0xSignal BNB
383 Posts

0xSignal BNB
Report
Block User
Signal over noise. 📡Making Money 1st.
RWA x Memecoins | On-Chain Intel Before Hype.
Micro-cap scout | Data doesn't lie. | Web3 Research Analyst 🔬
Open Trade
Frequent Trader
7.6 Months
46 Following
117 Followers
649 Liked
Posts
Portfolio
All
Quotes
PINNED
·
--
Bullish
Partly True
Guys, nobody's talking about this one. 👀
While everyone's glued to ETH's price action, something quieter has been happening with LINK for a month straight.
Four weeks in a row. Positive net inflows into Chainlink's spot ETF products. Every single week, without a break.
Meanwhile LINK's price? Basically just... sitting there. Consolidating.
That's the part that caught my attention.
Usually when the price is flat, it means nobody cares. But here, real institutional money has been quietly accumulating in the background the entire time — around $145M+ cumulative, and still building into September.
That's not retail hype. ETF flows are slow, deliberate, institutional money — the kind that doesn't chase green candles, it builds positions while nobody's watching.
Add to that: Chainlink's oracle infrastructure is now part of the Coinbase/Base tokenized-stocks push — real-world equities settling on-chain need reliable price feeds, and that's literally Chainlink's job.
So you've got steady inflows + a genuine utility expansion, happening at the same time the chart looks "boring."
That combination — quiet accumulation + flat price + expanding real use case — is usually the phase nobody writes about. By the time it's obvious, it's not early anymore.
I'm not calling a breakout. I'm just pointing at what the flow data actually shows versus what the price chart shows — and right now, those two things disagree.
What would change my mind: if those inflows start reversing, or if the tokenized-stocks integration stalls without real usage behind it.
What I'm watching: whether the ETF inflow streak holds into a 5th, 6th week — and whether price eventually starts reflecting it.
Not financial advice, just numbers I found interesting. DYOR.
Anyone else tracking LINK's flow data, or is this genuinely flying under the radar? 👇
#LINK #Chainlink #CryptoETF
Guys, nobody's talking about this one. 👀
While everyone's glued to ETH's price action, something quieter has been happening with LINK for a month straight.
Four weeks in a row. Positive net inflows into Chainlink's spot ETF products. Every single week, without a break.
Meanwhile LINK's price? Basically just... sitting there. Consolidating.
That's the part that caught my attention.
Usually when the price is flat, it means nobody cares. But here, real institutional money has been quietly accumulating in the background the entire time — around $145M+ cumulative, and still building into September.
That's not retail hype. ETF flows are slow, deliberate, institutional money — the kind that doesn't chase green candles, it builds positions while nobody's watching.
Add to that: Chainlink's oracle infrastructure is now part of the Coinbase/Base tokenized-stocks push — real-world equities settling on-chain need reliable price feeds, and that's literally Chainlink's job.
So you've got steady inflows + a genuine utility expansion, happening at the same time the chart looks "boring."
That combination — quiet accumulation + flat price + expanding real use case — is usually the phase nobody writes about. By the time it's obvious, it's not early anymore.
I'm not calling a breakout. I'm just pointing at what the flow data actually shows versus what the price chart shows — and right now, those two things disagree.
What would change my mind: if those inflows start reversing, or if the tokenized-stocks integration stalls without real usage behind it.
What I'm watching: whether the ETF inflow streak holds into a 5th, 6th week — and whether price eventually starts reflecting it.
Not financial advice, just numbers I found interesting. DYOR.
Anyone else tracking LINK's flow data, or is this genuinely flying under the radar? 👇
#LINK #Chainlink #CryptoETF
While everyone's glued to ETH's price action, something quieter has been happening with LINK for a month straight.
Four weeks in a row. Positive net inflows into Chainlink's spot ETF products. Every single week, without a break.
Meanwhile LINK's price? Basically just... sitting there. Consolidating.
That's the part that caught my attention.
Usually when the price is flat, it means nobody cares. But here, real institutional money has been quietly accumulating in the background the entire time — around $145M+ cumulative, and still building into September.
That's not retail hype. ETF flows are slow, deliberate, institutional money — the kind that doesn't chase green candles, it builds positions while nobody's watching.
Add to that: Chainlink's oracle infrastructure is now part of the Coinbase/Base tokenized-stocks push — real-world equities settling on-chain need reliable price feeds, and that's literally Chainlink's job.
So you've got steady inflows + a genuine utility expansion, happening at the same time the chart looks "boring."
That combination — quiet accumulation + flat price + expanding real use case — is usually the phase nobody writes about. By the time it's obvious, it's not early anymore.
I'm not calling a breakout. I'm just pointing at what the flow data actually shows versus what the price chart shows — and right now, those two things disagree.
What would change my mind: if those inflows start reversing, or if the tokenized-stocks integration stalls without real usage behind it.
What I'm watching: whether the ETF inflow streak holds into a 5th, 6th week — and whether price eventually starts reflecting it.
Not financial advice, just numbers I found interesting. DYOR.
Anyone else tracking LINK's flow data, or is this genuinely flying under the radar? 👇
#LINK #Chainlink #CryptoETF

2
208
PINNED
·
--
Article
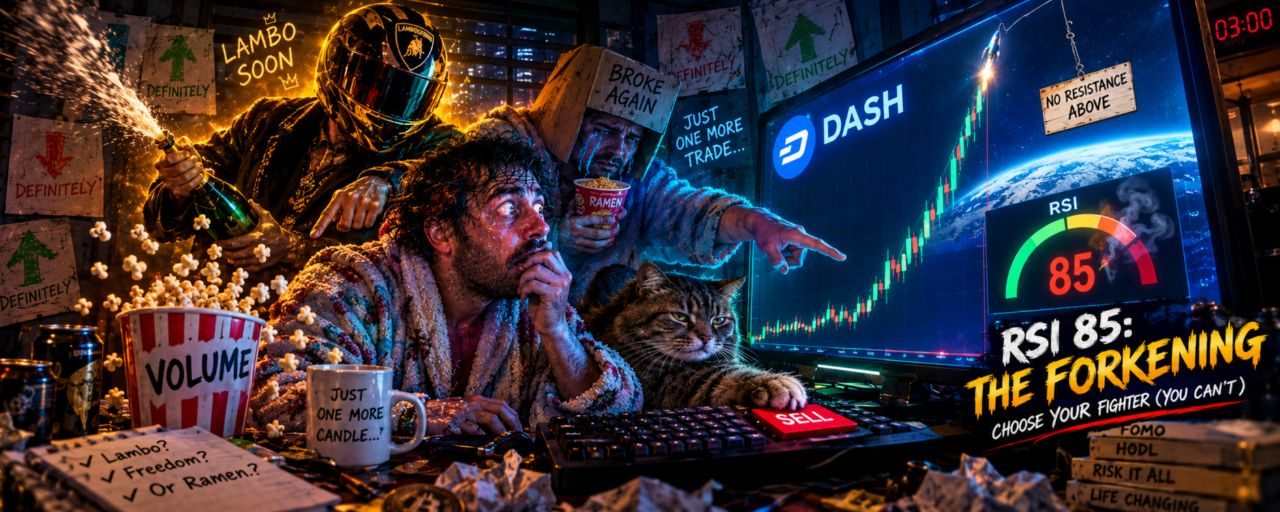
DASH Is At 85 RSI With Nothing Above It. That's Not a Green Light — It's a Fork.Everyone chasing $DASH right now is reading the breakout as confirmation. I'm reading the RSI print as a question the chart hasn't answered yet.
An RSI near 85 with no immediate resistance overhead is one of the more binary setups in crypto. It doesn't tell you the direction of the next move. It tells you the current move is stretched further than usual, and stretched moves resolve one of two ways — they extend violently because there's nothing structurally in the way, or they snap because there's nothing structurally holding them up either. Same fact, two opposite outcomes, and the fact alone doesn't pick one.
The setup
FACT: DASH's RSI is printing near 85, per coverage — a level well into overbought territory by standard technical thresholds.
FACT: No immediate resistance level is currently identified above the current price.
INTERPRETATION: The absence of resistance means there's no obvious price ceiling forcing a pullback on technical grounds alone. That's the bull case for extension. But it also means there's no established support structure recently tested on the way up — the move has outrun the levels that would normally validate it. That's the bear case for a fast reversion.
There is no confirmed HYPOTHESIS on which way this resolves. Anyone telling you RSI at 85 is definitionally about to reverse, or definitionally about to keep running, is stating a rule of thumb as if it were a law. It isn't. Overbought conditions can persist for extended periods in strong trends, and they can also be the exact moment before a sharp mean reversion. The RSI level is a fact about stretch, not a forecast about direction.
Why the obvious read is incomplete
The standard reflex to a high RSI is "overbought, due for a pullback." That reflex exists because it's often right — most extreme RSI prints do eventually mean-revert. But "eventually" is doing a lot of work in that sentence. Extended RSI in an asset with genuinely fresh catalyst-driven demand can keep climbing well past what looks unsustainable, especially with no resistance forcing sellers to defend a level.
The market's possible blind spot isn't "DASH is overbought" — everyone can see that. The blind spot is treating overbought as a timing signal on its own, when it's really a volatility-and-magnitude signal. It tells you the next move is likely to be large. It doesn't tell you which way.
BEFORE → CHANGE → NOW → NEXT
BEFORE: DASH trading within a more typical range, RSI not flagged as extreme.
CHANGE: Price extension pushes RSI to ~85 with no resistance level identified above current price.
CURRENT STATE: Stretched technical condition, unresolved directionally, elevated volatility risk in either direction.
POSSIBLE NEXT: Continuation — RSI stays elevated or climbs further as the move extends with no ceiling to stop it, common when a fresh catalyst or momentum wave is still building. Or reversion — a sharp pullback as the extended move runs out of new buyers and profit-taking hits without any support level established to catch it.
The thesis, stated carefully
The evidence suggests DASH is at a genuine inflection point where the next move — in either direction — is likely to be sharp rather than gradual, given the combination of extreme RSI and the absence of overhead resistance. This is not a call that DASH will pump or dump. It's a statement that the current setup has low odds of just drifting sideways.
The bullish continuation case weakens if volume starts declining while price keeps grinding higher — a sign the move is running on thinner and thinner participation. The bearish reversion case weakens if price holds current levels for several sessions without a pullback, which would suggest the extension is being absorbed rather than chased.
What confirms which side wins
Not the RSI number itself — watch what happens to volume alongside it. Rising volume with rising price into further overbought territory favors continuation. Flat or declining volume at these levels, especially alongside any signs of stalling candles, favors a snap-back.
What I'm watching next
Not whether DASH goes up or down from here. I'm watching whether volume expands or contracts as RSI stays pinned near this level over the next few sessions — that's what separates an overbought market that's about to run further from one that's about to give it all back.
#DASH #RSIAlert #Overbought #CryptoVolatility #TechnicalAnalysis
DASH Is At 85 RSI With Nothing Above It. That's Not a Green Light — It's a Fork.
Everyone chasing $DASH right now is reading the breakout as confirmation. I'm reading the RSI print as a question the chart hasn't answered yet.
An RSI near 85 with no immediate resistance overhead is one of the more binary setups in crypto. It doesn't tell you the direction of the next move. It tells you the current move is stretched further than usual, and stretched moves resolve one of two ways — they extend violently because there's nothing structurally in the way, or they snap because there's nothing structurally holding them up either. Same fact, two opposite outcomes, and the fact alone doesn't pick one.
The setup
FACT: DASH's RSI is printing near 85, per coverage — a level well into overbought territory by standard technical thresholds.
FACT: No immediate resistance level is currently identified above the current price.
INTERPRETATION: The absence of resistance means there's no obvious price ceiling forcing a pullback on technical grounds alone. That's the bull case for extension. But it also means there's no established support structure recently tested on the way up — the move has outrun the levels that would normally validate it. That's the bear case for a fast reversion.
There is no confirmed HYPOTHESIS on which way this resolves. Anyone telling you RSI at 85 is definitionally about to reverse, or definitionally about to keep running, is stating a rule of thumb as if it were a law. It isn't. Overbought conditions can persist for extended periods in strong trends, and they can also be the exact moment before a sharp mean reversion. The RSI level is a fact about stretch, not a forecast about direction.
Why the obvious read is incomplete
The standard reflex to a high RSI is "overbought, due for a pullback." That reflex exists because it's often right — most extreme RSI prints do eventually mean-revert. But "eventually" is doing a lot of work in that sentence. Extended RSI in an asset with genuinely fresh catalyst-driven demand can keep climbing well past what looks unsustainable, especially with no resistance forcing sellers to defend a level.
The market's possible blind spot isn't "DASH is overbought" — everyone can see that. The blind spot is treating overbought as a timing signal on its own, when it's really a volatility-and-magnitude signal. It tells you the next move is likely to be large. It doesn't tell you which way.
BEFORE → CHANGE → NOW → NEXT
BEFORE: DASH trading within a more typical range, RSI not flagged as extreme.
CHANGE: Price extension pushes RSI to ~85 with no resistance level identified above current price.
CURRENT STATE: Stretched technical condition, unresolved directionally, elevated volatility risk in either direction.
POSSIBLE NEXT: Continuation — RSI stays elevated or climbs further as the move extends with no ceiling to stop it, common when a fresh catalyst or momentum wave is still building. Or reversion — a sharp pullback as the extended move runs out of new buyers and profit-taking hits without any support level established to catch it.
The thesis, stated carefully
The evidence suggests DASH is at a genuine inflection point where the next move — in either direction — is likely to be sharp rather than gradual, given the combination of extreme RSI and the absence of overhead resistance. This is not a call that DASH will pump or dump. It's a statement that the current setup has low odds of just drifting sideways.
The bullish continuation case weakens if volume starts declining while price keeps grinding higher — a sign the move is running on thinner and thinner participation. The bearish reversion case weakens if price holds current levels for several sessions without a pullback, which would suggest the extension is being absorbed rather than chased.
What confirms which side wins
Not the RSI number itself — watch what happens to volume alongside it. Rising volume with rising price into further overbought territory favors continuation. Flat or declining volume at these levels, especially alongside any signs of stalling candles, favors a snap-back.
What I'm watching next
Not whether DASH goes up or down from here. I'm watching whether volume expands or contracts as RSI stays pinned near this level over the next few sessions — that's what separates an overbought market that's about to run further from one that's about to give it all back.
#DASH #RSIAlert #Overbought #CryptoVolatility #TechnicalAnalysis
An RSI near 85 with no immediate resistance overhead is one of the more binary setups in crypto. It doesn't tell you the direction of the next move. It tells you the current move is stretched further than usual, and stretched moves resolve one of two ways — they extend violently because there's nothing structurally in the way, or they snap because there's nothing structurally holding them up either. Same fact, two opposite outcomes, and the fact alone doesn't pick one.
The setup
FACT: DASH's RSI is printing near 85, per coverage — a level well into overbought territory by standard technical thresholds.
FACT: No immediate resistance level is currently identified above the current price.
INTERPRETATION: The absence of resistance means there's no obvious price ceiling forcing a pullback on technical grounds alone. That's the bull case for extension. But it also means there's no established support structure recently tested on the way up — the move has outrun the levels that would normally validate it. That's the bear case for a fast reversion.
There is no confirmed HYPOTHESIS on which way this resolves. Anyone telling you RSI at 85 is definitionally about to reverse, or definitionally about to keep running, is stating a rule of thumb as if it were a law. It isn't. Overbought conditions can persist for extended periods in strong trends, and they can also be the exact moment before a sharp mean reversion. The RSI level is a fact about stretch, not a forecast about direction.
Why the obvious read is incomplete
The standard reflex to a high RSI is "overbought, due for a pullback." That reflex exists because it's often right — most extreme RSI prints do eventually mean-revert. But "eventually" is doing a lot of work in that sentence. Extended RSI in an asset with genuinely fresh catalyst-driven demand can keep climbing well past what looks unsustainable, especially with no resistance forcing sellers to defend a level.
The market's possible blind spot isn't "DASH is overbought" — everyone can see that. The blind spot is treating overbought as a timing signal on its own, when it's really a volatility-and-magnitude signal. It tells you the next move is likely to be large. It doesn't tell you which way.
BEFORE → CHANGE → NOW → NEXT
BEFORE: DASH trading within a more typical range, RSI not flagged as extreme.
CHANGE: Price extension pushes RSI to ~85 with no resistance level identified above current price.
CURRENT STATE: Stretched technical condition, unresolved directionally, elevated volatility risk in either direction.
POSSIBLE NEXT: Continuation — RSI stays elevated or climbs further as the move extends with no ceiling to stop it, common when a fresh catalyst or momentum wave is still building. Or reversion — a sharp pullback as the extended move runs out of new buyers and profit-taking hits without any support level established to catch it.
The thesis, stated carefully
The evidence suggests DASH is at a genuine inflection point where the next move — in either direction — is likely to be sharp rather than gradual, given the combination of extreme RSI and the absence of overhead resistance. This is not a call that DASH will pump or dump. It's a statement that the current setup has low odds of just drifting sideways.
The bullish continuation case weakens if volume starts declining while price keeps grinding higher — a sign the move is running on thinner and thinner participation. The bearish reversion case weakens if price holds current levels for several sessions without a pullback, which would suggest the extension is being absorbed rather than chased.
What confirms which side wins
Not the RSI number itself — watch what happens to volume alongside it. Rising volume with rising price into further overbought territory favors continuation. Flat or declining volume at these levels, especially alongside any signs of stalling candles, favors a snap-back.
What I'm watching next
Not whether DASH goes up or down from here. I'm watching whether volume expands or contracts as RSI stays pinned near this level over the next few sessions — that's what separates an overbought market that's about to run further from one that's about to give it all back.
#DASH #RSIAlert #Overbought #CryptoVolatility #TechnicalAnalysis
2
4
1.9k
·
--
MARSCOIN's Price Isn't Even Its Own
MARSCOIN is a meme token — no team, no product. It's up 288% in 7 days off Binance's futures and spot listings.
But 59% of its liquidity is paired against SPCXB, a tokenized SpaceX stock proxy that's speculative in its own right. If SPCXB drops, MARSCOIN can lose value with nothing happening to MARSCOIN itself — most traders miss this because they're only watching MARSCOIN's own chart.
One more trap: "Marscoin" and "MARSCOIN" are two different assets on different chains. Send to the wrong address, and it's gone.
Buy MARSCOIN, and you're carrying two speculative risks at once — a connection the chart never shows.
MARSCOIN's Price Isn't Even Its Own
MARSCOIN is a meme token — no team, no product. It's up 288% in 7 days off Binance's futures and spot listings.
But 59% of its liquidity is paired against SPCXB, a tokenized SpaceX stock proxy that's speculative in its own right. If SPCXB drops, MARSCOIN can lose value with nothing happening to MARSCOIN itself — most traders miss this because they're only watching MARSCOIN's own chart.
One more trap: "Marscoin" and "MARSCOIN" are two different assets on different chains. Send to the wrong address, and it's gone.
Buy MARSCOIN, and you're carrying two speculative risks at once — a connection the chart never shows.
MARSCOIN is a meme token — no team, no product. It's up 288% in 7 days off Binance's futures and spot listings.
But 59% of its liquidity is paired against SPCXB, a tokenized SpaceX stock proxy that's speculative in its own right. If SPCXB drops, MARSCOIN can lose value with nothing happening to MARSCOIN itself — most traders miss this because they're only watching MARSCOIN's own chart.
One more trap: "Marscoin" and "MARSCOIN" are two different assets on different chains. Send to the wrong address, and it's gone.
Buy MARSCOIN, and you're carrying two speculative risks at once — a connection the chart never shows.
1
261
·
--
$MTL
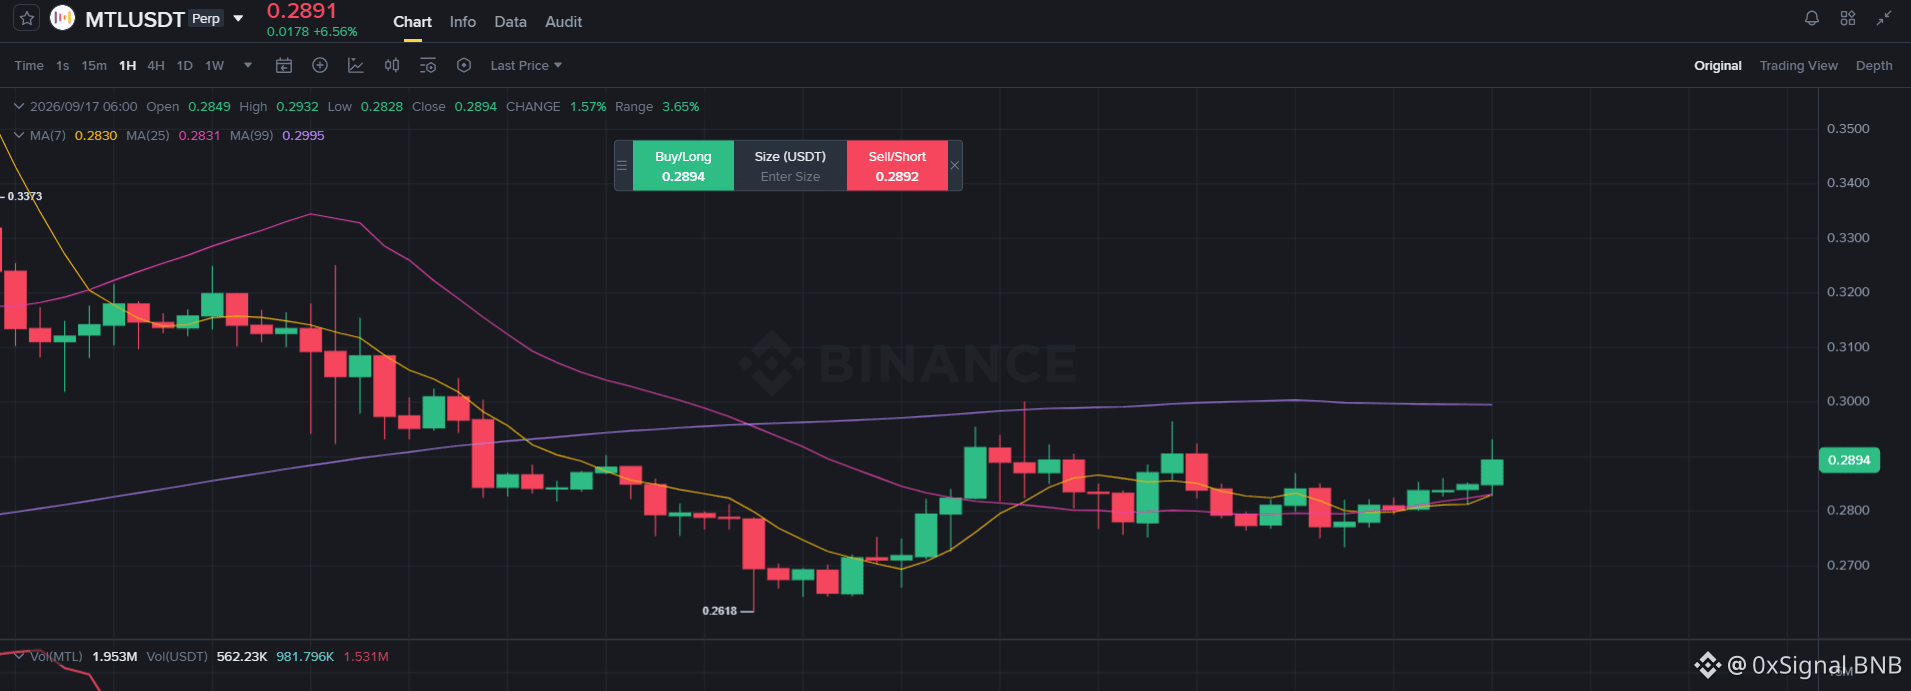
$MTL is -0.70% on the 1H screen. The current snapshot alone doesn't provide enough verified chart structure to responsibly manufacture support, resistance, or a precise ladder.
Neutral — wait for confirmation
Entry: Chart confirmation required
TP1: Nearest confirmed resistance
TP2: Next resistance
TP3: Optional
SL: Above/below confirmed swing level
Invalidation: No trade until a clear structure forms.
$MTL
{future}(MTLUSDT)
$MTL
$MTL is -0.70% on the 1H screen. The current snapshot alone doesn't provide enough verified chart structure to responsibly manufacture support, resistance, or a precise ladder.
Neutral — wait for confirmation
Entry: Chart confirmation required
TP1: Nearest confirmed resistance
TP2: Next resistance
TP3: Optional
SL: Above/below confirmed swing level
Invalidation: No trade until a clear structure forms.
$MTL
$MTL is -0.70% on the 1H screen. The current snapshot alone doesn't provide enough verified chart structure to responsibly manufacture support, resistance, or a precise ladder.
Neutral — wait for confirmation
Entry: Chart confirmation required
TP1: Nearest confirmed resistance
TP2: Next resistance
TP3: Optional
SL: Above/below confirmed swing level
Invalidation: No trade until a clear structure forms.
$MTL
1
198
·
--
$IOST
{future}(IOSTUSDT)
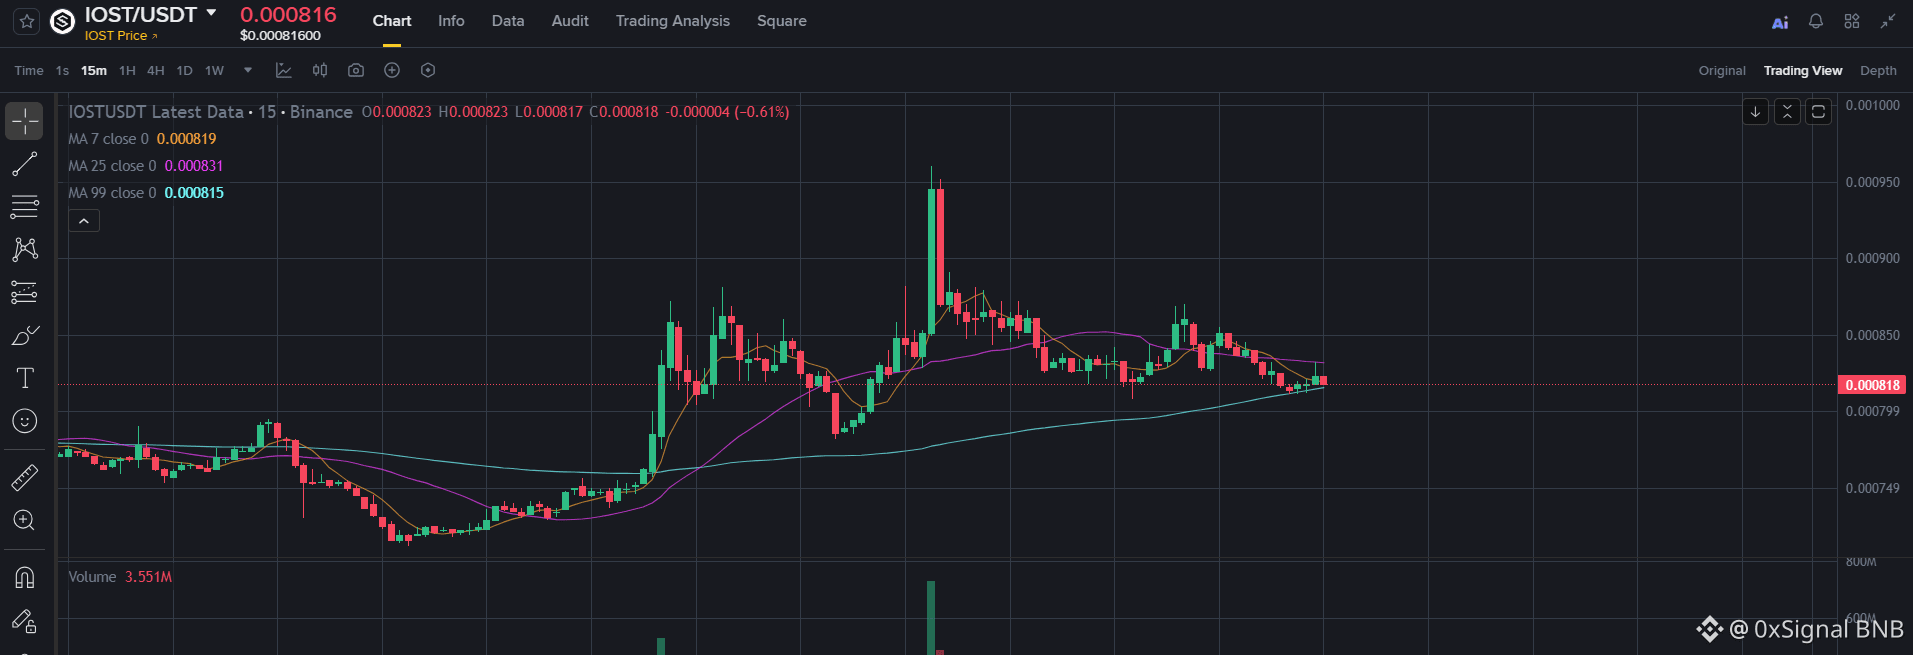
$IOST is -0.85% on the 1H screen. Recent analysis identifies $0.00070 as the key support and $0.00065 as the next downside level.
Bearish / Neutral — wait for confirmation
Entry: $0.00081 - $0.00083 only if rejection confirms
TP1: $0.00078
TP2: $0.00073
TP3: $0.00070
SL: $0.00085
Invalidation: A clean reclaim above $0.00085 would weaken the short thesis.
$IOST
$IOST
$IOST is -0.85% on the 1H screen. Recent analysis identifies $0.00070 as the key support and $0.00065 as the next downside level.
Bearish / Neutral — wait for confirmation
Entry: $0.00081 - $0.00083 only if rejection confirms
TP1: $0.00078
TP2: $0.00073
TP3: $0.00070
SL: $0.00085
Invalidation: A clean reclaim above $0.00085 would weaken the short thesis.
$IOST
$IOST is -0.85% on the 1H screen. Recent analysis identifies $0.00070 as the key support and $0.00065 as the next downside level.
Bearish / Neutral — wait for confirmation
Entry: $0.00081 - $0.00083 only if rejection confirms
TP1: $0.00078
TP2: $0.00073
TP3: $0.00070
SL: $0.00085
Invalidation: A clean reclaim above $0.00085 would weaken the short thesis.
$IOST
2
345
·
--

Sulaiman 零号猎人
·
--
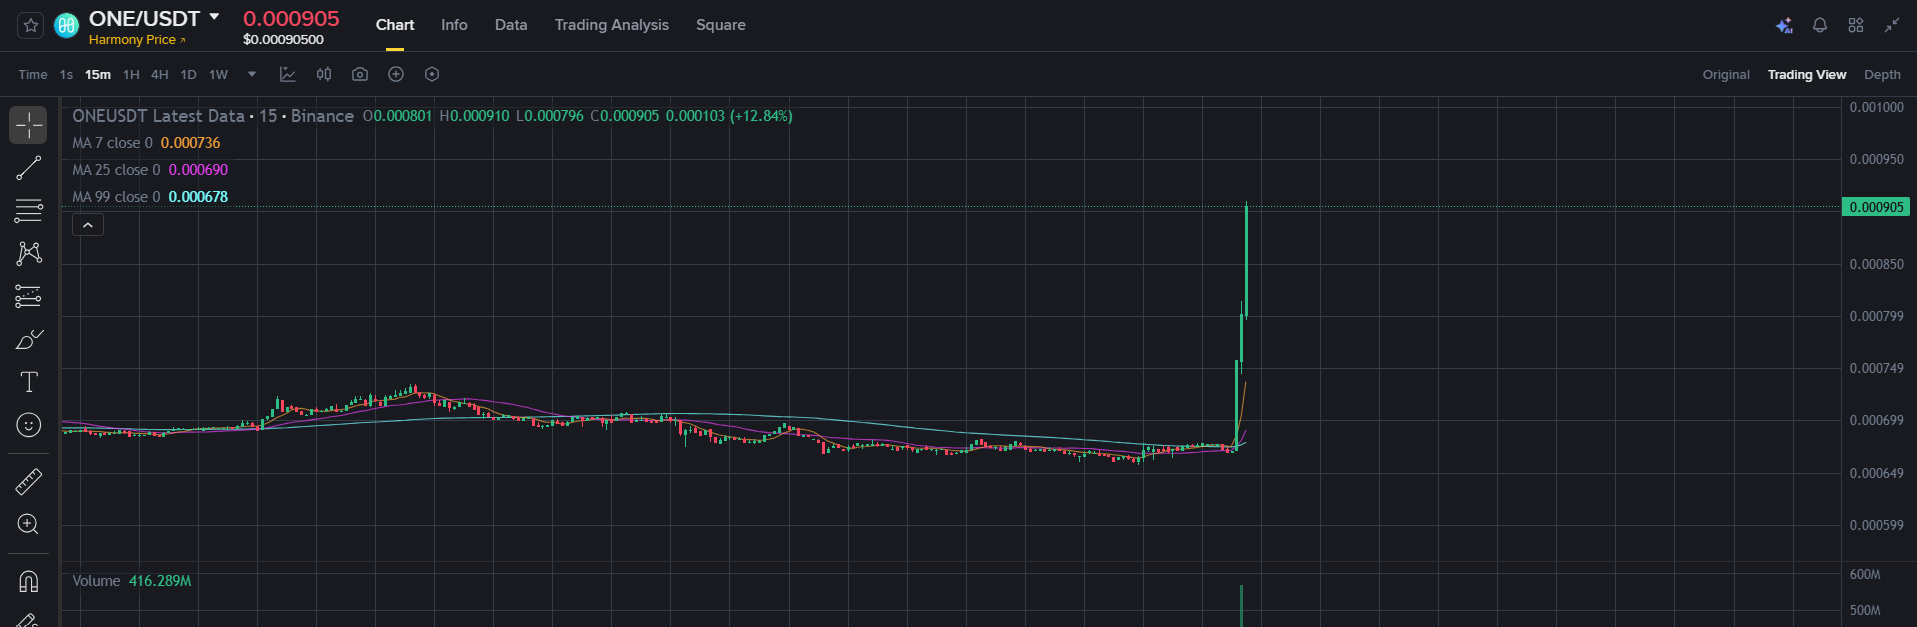
$ONE is showing strong 1H momentum at $0.000858, but the move needs to prove it can reclaim and hold the recent breakdown area. Recent analysis identified $0.000662 as important support and $0.000630 as the next downside level.
Bullish setup — only after confirmation
Entry: $0.00084 - $0.00087
TP1: $0.00090
TP2: $0.00095
TP3: $0.00100
SL: $0.00080
Invalidation: A sustained move back below $0.00080 weakens the momentum setup.
$ONE #One #HarmonyOne
Bullish setup — only after confirmation
Entry: $0.00084 - $0.00087
TP1: $0.00090
TP2: $0.00095
TP3: $0.00100
SL: $0.00080
Invalidation: A sustained move back below $0.00080 weakens the momentum setup.
$ONE #One #HarmonyOne
2
218
·
--
$ORDI
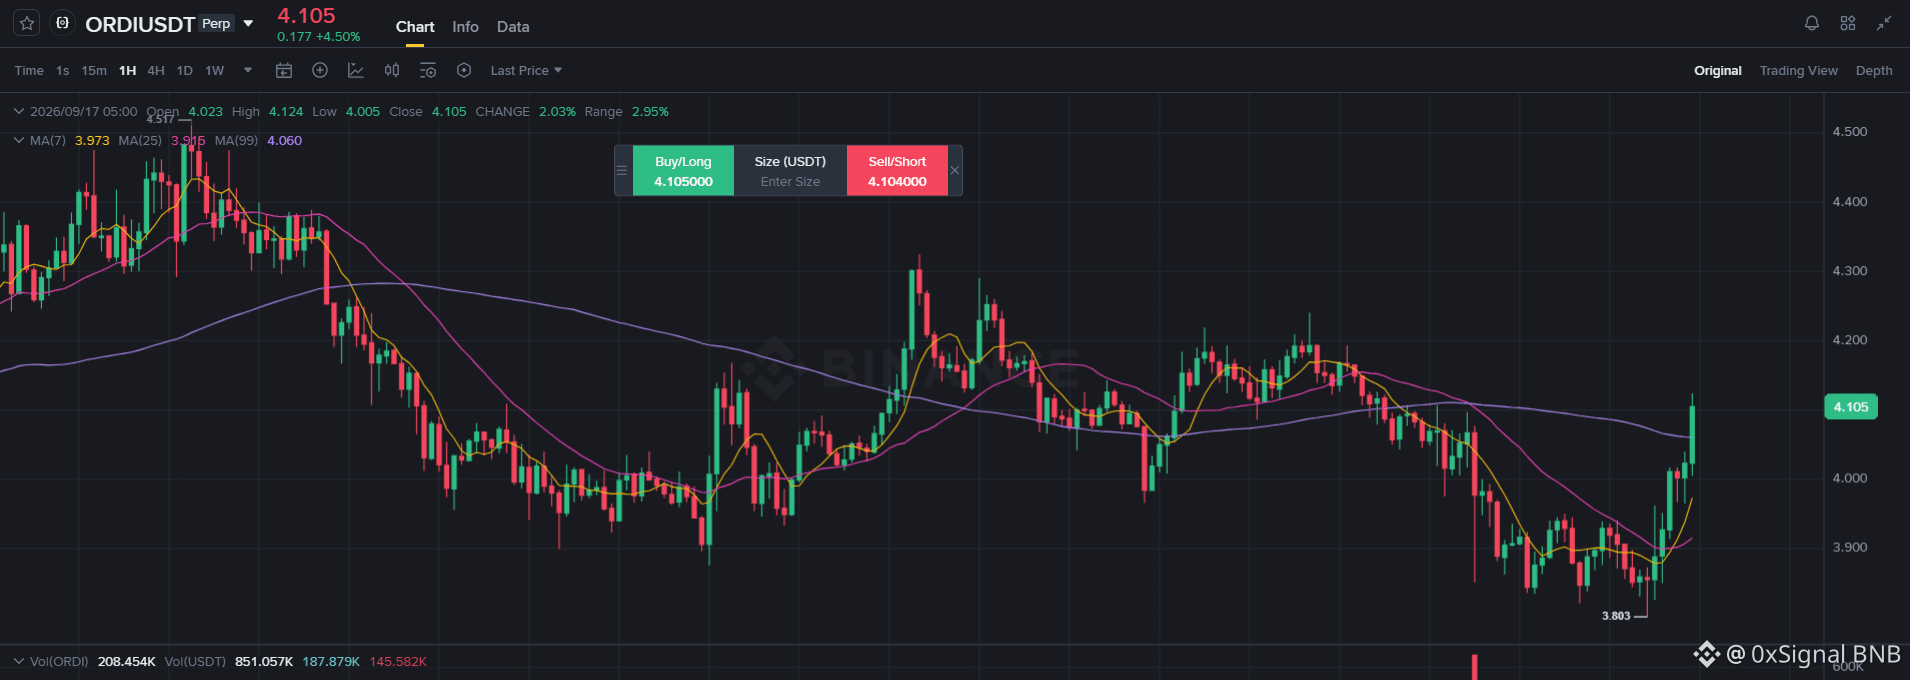
$ORDI is +2.78% on the 1H screen at $4.10. Recent data shows the token has been trading in a volatile range around the $4 area, so reclaiming nearby resistance matters more than chasing the current candle.
Neutral — wait for confirmation
Entry: $4.05 - $4.15
TP1: $4.30
TP2: $4.50
TP3: $4.70
SL: $3.90
Invalidation: A break below $3.90 would weaken the continuation thesis.
$ORDI
{future}(ORDIUSDT)
$ORDI
$ORDI is +2.78% on the 1H screen at $4.10. Recent data shows the token has been trading in a volatile range around the $4 area, so reclaiming nearby resistance matters more than chasing the current candle.
Neutral — wait for confirmation
Entry: $4.05 - $4.15
TP1: $4.30
TP2: $4.50
TP3: $4.70
SL: $3.90
Invalidation: A break below $3.90 would weaken the continuation thesis.
$ORDI
$ORDI is +2.78% on the 1H screen at $4.10. Recent data shows the token has been trading in a volatile range around the $4 area, so reclaiming nearby resistance matters more than chasing the current candle.
Neutral — wait for confirmation
Entry: $4.05 - $4.15
TP1: $4.30
TP2: $4.50
TP3: $4.70
SL: $3.90
Invalidation: A break below $3.90 would weaken the continuation thesis.
$ORDI
2
249
·
--
$JTO
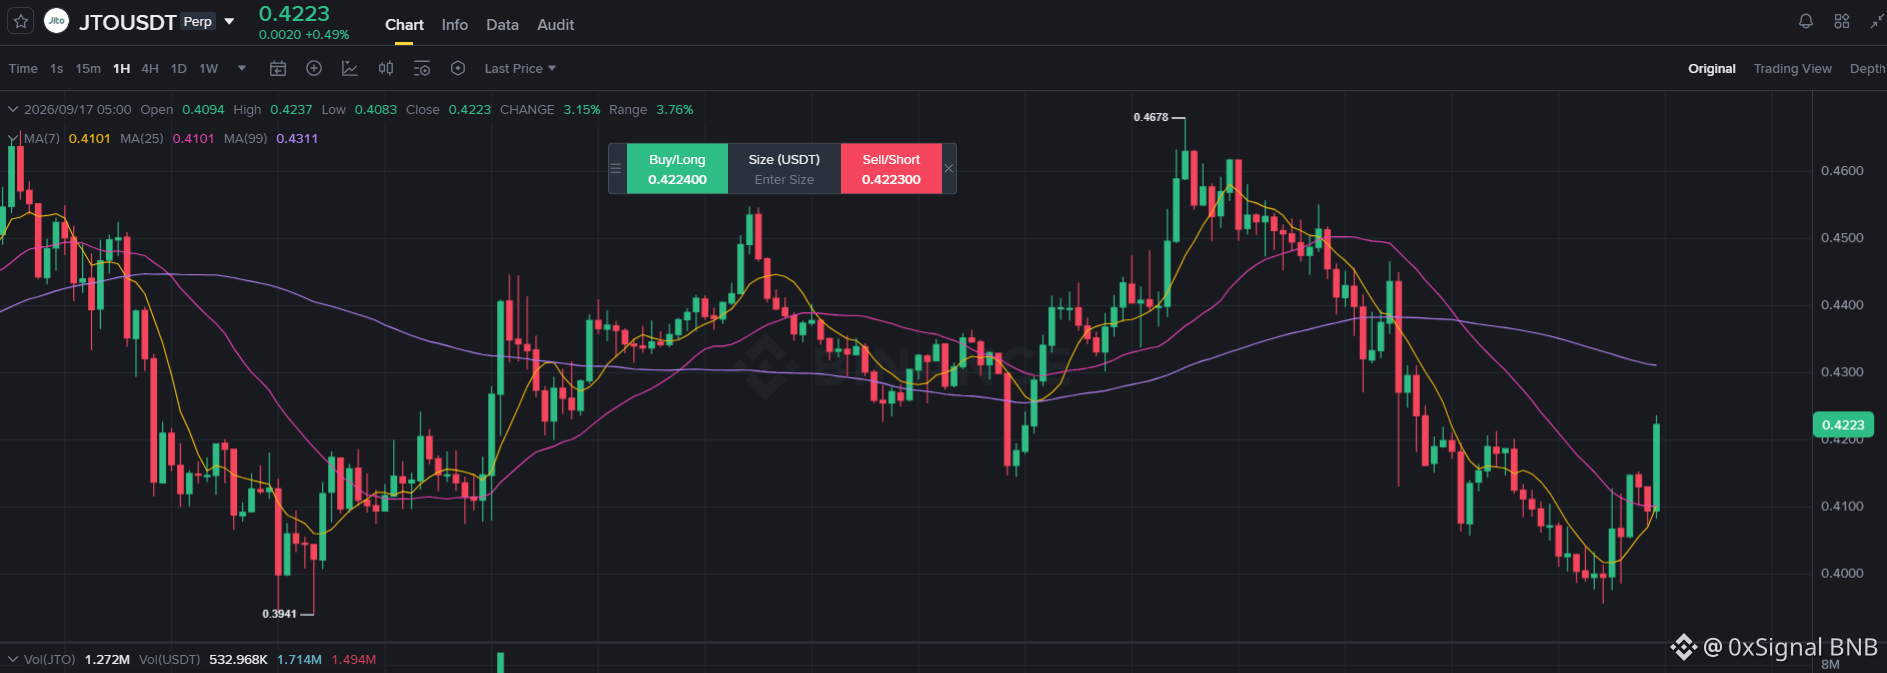
$JTO is +3.06% on the 1H screen. Recent analysis identified $0.44 as support, $0.46-$0.47 as resistance, and $0.50 as a potential extension if momentum continues.
Bullish setup — confirmation required
Entry: $0.445 - $0.455
TP1: $0.470
TP2: $0.485
TP3: $0.500
SL: $0.430
Invalidation: A sustained move below $0.43 would weaken the setup.
$JTO
{future}(JTOUSDT)
$JTO
$JTO is +3.06% on the 1H screen. Recent analysis identified $0.44 as support, $0.46-$0.47 as resistance, and $0.50 as a potential extension if momentum continues.
Bullish setup — confirmation required
Entry: $0.445 - $0.455
TP1: $0.470
TP2: $0.485
TP3: $0.500
SL: $0.430
Invalidation: A sustained move below $0.43 would weaken the setup.
$JTO
$JTO is +3.06% on the 1H screen. Recent analysis identified $0.44 as support, $0.46-$0.47 as resistance, and $0.50 as a potential extension if momentum continues.
Bullish setup — confirmation required
Entry: $0.445 - $0.455
TP1: $0.470
TP2: $0.485
TP3: $0.500
SL: $0.430
Invalidation: A sustained move below $0.43 would weaken the setup.
$JTO
1
102
·
--
$ENA
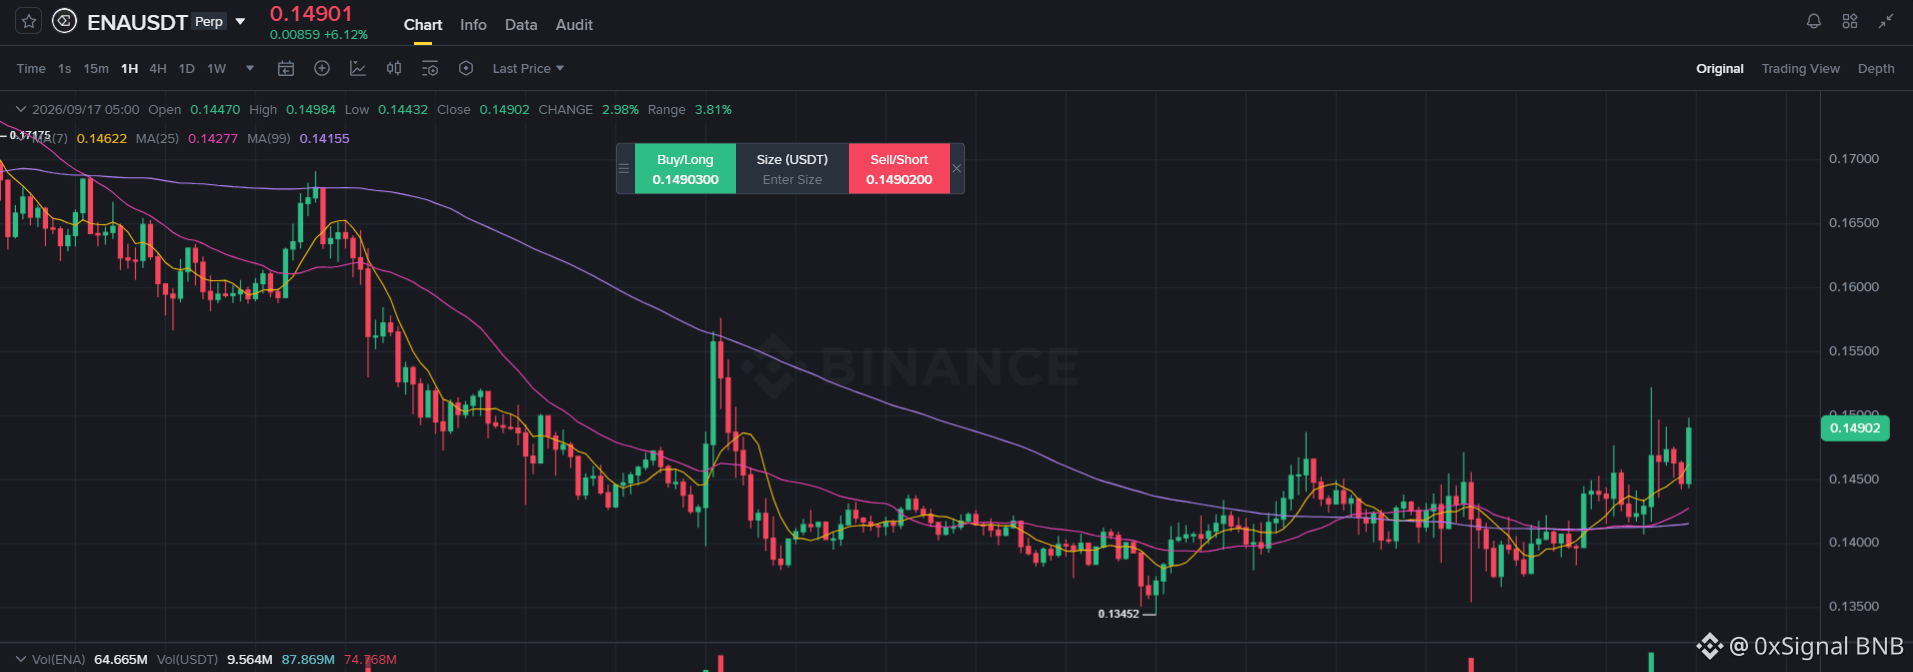
$ENA is +3.11% on the 1H screen and is holding relatively well compared with the broader altcoin market. Recent analysis identifies $0.138-$0.137 as demand and $0.144-$0.145 as nearby resistance.
Bullish setup — only above confirmation
Entry: $0.141 - $0.143
TP1: $0.145
TP2: $0.149
TP3: $0.153
SL: $0.137
Invalidation: A decisive loss of $0.137 breaks the setup.
$ENA
{future}(ENAUSDT)
$ENA
$ENA is +3.11% on the 1H screen and is holding relatively well compared with the broader altcoin market. Recent analysis identifies $0.138-$0.137 as demand and $0.144-$0.145 as nearby resistance.
Bullish setup — only above confirmation
Entry: $0.141 - $0.143
TP1: $0.145
TP2: $0.149
TP3: $0.153
SL: $0.137
Invalidation: A decisive loss of $0.137 breaks the setup.
$ENA
$ENA is +3.11% on the 1H screen and is holding relatively well compared with the broader altcoin market. Recent analysis identifies $0.138-$0.137 as demand and $0.144-$0.145 as nearby resistance.
Bullish setup — only above confirmation
Entry: $0.141 - $0.143
TP1: $0.145
TP2: $0.149
TP3: $0.153
SL: $0.137
Invalidation: A decisive loss of $0.137 breaks the setup.
$ENA
1
194
·
--
$OP
{future}(OPUSDT)
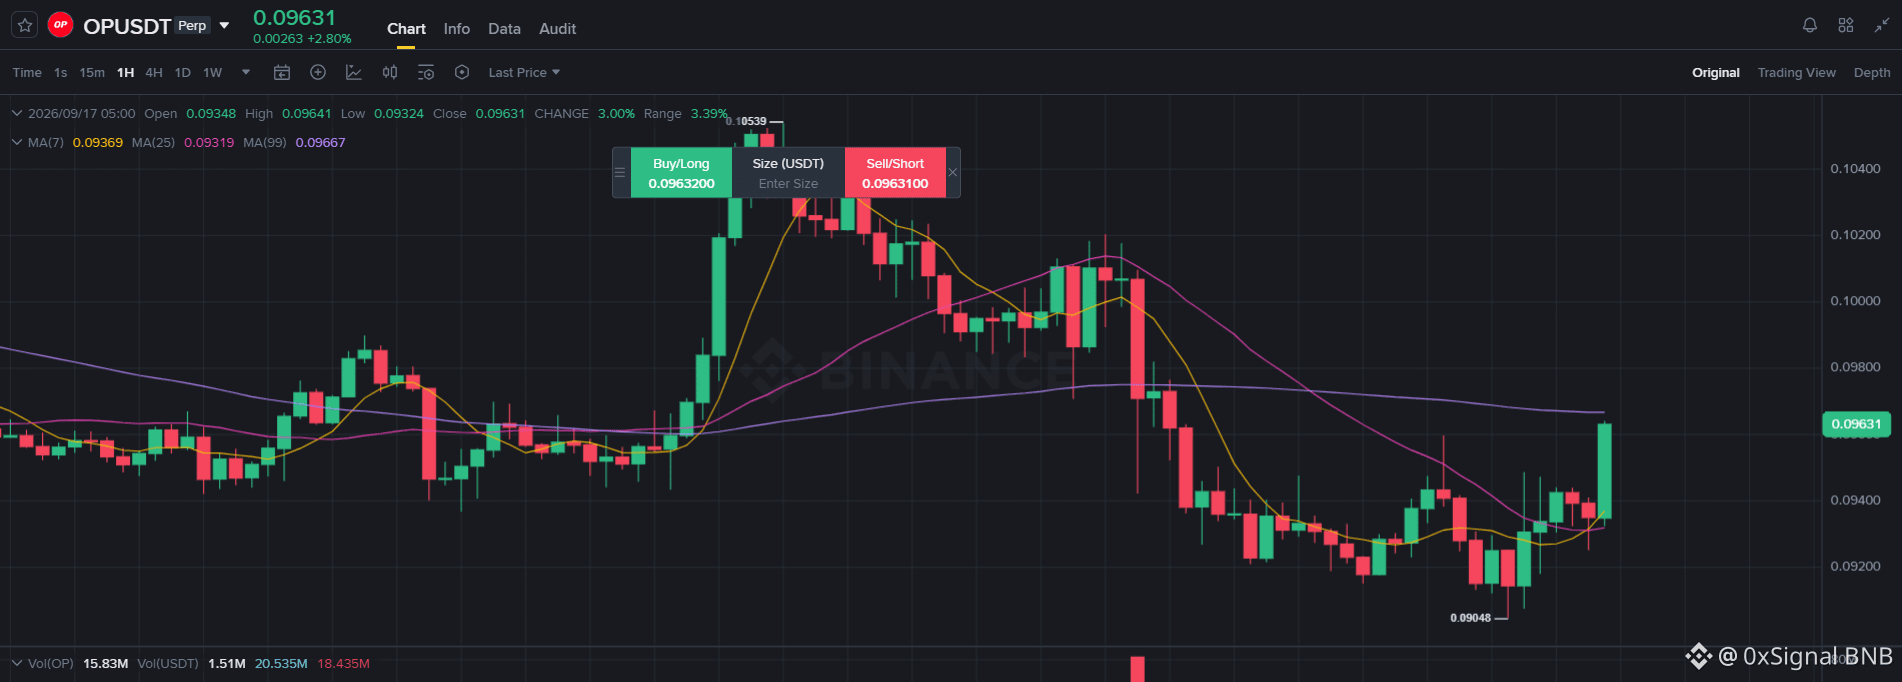
$OP is green on the 1H screen, but the recent 24H structure remains weak. Recent technical analysis places important support around $0.0898, with $0.0808 as the next downside level.
Neutral — wait for confirmation
Entry: $0.094 - $0.097
TP1: $0.100
TP2: $0.104
TP3: $0.108
SL: $0.089
Invalidation: A break below $0.089 would cancel the recovery setup.
$OP
$OP
$OP is green on the 1H screen, but the recent 24H structure remains weak. Recent technical analysis places important support around $0.0898, with $0.0808 as the next downside level.
Neutral — wait for confirmation
Entry: $0.094 - $0.097
TP1: $0.100
TP2: $0.104
TP3: $0.108
SL: $0.089
Invalidation: A break below $0.089 would cancel the recovery setup.
$OP
$OP is green on the 1H screen, but the recent 24H structure remains weak. Recent technical analysis places important support around $0.0898, with $0.0808 as the next downside level.
Neutral — wait for confirmation
Entry: $0.094 - $0.097
TP1: $0.100
TP2: $0.104
TP3: $0.108
SL: $0.089
Invalidation: A break below $0.089 would cancel the recovery setup.
$OP
1
305
·
--
A big green candle can make you feel like you’re already late.
That feeling is exactly what makes people chase moves.
The problem is that price movement alone doesn’t explain *why* the move is happening. Without understanding the context, entering simply because something is moving can turn excitement into regret.
Try asking three questions first:
What caused the move?
Is the reason still active?
What would confirm it?
A moving asset deserves attention. It doesn’t automatically deserve an entry.
Do you usually chase the candle or wait for confirmation?
A big green candle can make you feel like you’re already late.
That feeling is exactly what makes people chase moves.
The problem is that price movement alone doesn’t explain *why* the move is happening. Without understanding the context, entering simply because something is moving can turn excitement into regret.
Try asking three questions first:
What caused the move?
Is the reason still active?
What would confirm it?
A moving asset deserves attention. It doesn’t automatically deserve an entry.
Do you usually chase the candle or wait for confirmation?
That feeling is exactly what makes people chase moves.
The problem is that price movement alone doesn’t explain *why* the move is happening. Without understanding the context, entering simply because something is moving can turn excitement into regret.
Try asking three questions first:
What caused the move?
Is the reason still active?
What would confirm it?
A moving asset deserves attention. It doesn’t automatically deserve an entry.
Do you usually chase the candle or wait for confirmation?
4
·
--
XRP just moved 2.4x BTC's drop and 3.9x ETH's weekly decline — in a market where shorts are now paying longs to stay short.
XRP is trading as the crypto market's leverage gauge right now, and the crowded-short setup looks more interesting than the selloff itself.
Down ~8-11% to ~$1.28 after the CLARITY Act failed Senate cloture 49-50. Funding hit -0.0094%, the most negative since June 28. XRP ETF inflows hit $0 on Sept 11.
Extreme negative funding has historically preceded short squeezes — this is a crowded downside bet, not a clean trend.
I'd watch whether a Hyperliquid whale (99% win rate) extends or closes their $1.36M XRP long after today's FOMC decision.
If funding flips positive post-Fed, does this turn into a squeeze?
#XRP #CryptoMarkets #FOMC
XRP just moved 2.4x BTC's drop and 3.9x ETH's weekly decline — in a market where shorts are now paying longs to stay short.
XRP is trading as the crypto market's leverage gauge right now, and the crowded-short setup looks more interesting than the selloff itself.
Down ~8-11% to ~$1.28 after the CLARITY Act failed Senate cloture 49-50. Funding hit -0.0094%, the most negative since June 28. XRP ETF inflows hit $0 on Sept 11.
Extreme negative funding has historically preceded short squeezes — this is a crowded downside bet, not a clean trend.
I'd watch whether a Hyperliquid whale (99% win rate) extends or closes their $1.36M XRP long after today's FOMC decision.
If funding flips positive post-Fed, does this turn into a squeeze?
#XRP #CryptoMarkets #FOMC
XRP is trading as the crypto market's leverage gauge right now, and the crowded-short setup looks more interesting than the selloff itself.
Down ~8-11% to ~$1.28 after the CLARITY Act failed Senate cloture 49-50. Funding hit -0.0094%, the most negative since June 28. XRP ETF inflows hit $0 on Sept 11.
Extreme negative funding has historically preceded short squeezes — this is a crowded downside bet, not a clean trend.
I'd watch whether a Hyperliquid whale (99% win rate) extends or closes their $1.36M XRP long after today's FOMC decision.
If funding flips positive post-Fed, does this turn into a squeeze?
#XRP #CryptoMarkets #FOMC
1
53
·
--
BNB — THE ASSET SEC "FORGOT"
Congress just killed America's biggest crypto bill. Bitcoin fell 4%, XRP fell 8%. Everyone's writing the same headline. Nobody's asking: if regulators already decided which coins are "safe," why isn't BNB on that list?
Back in March 2026, the SEC and CFTC jointly named 16 assets as digital commodities — legally outside SEC jurisdiction: BTC, ETH, SOL, XRP, DOGE, ADA, AVAX, LINK, DOT, HBAR, LTC, BCH, SHIB, XLM, XTZ, APT. BNB isn't there.
The CLARITY Act would've made that list permanent law. It failed 49–50 in the Senate on September 15. But the SEC's version never needed Congress — it's still standing, still moving (a new rule proposal is open for comment until October 20), and it still excludes BNB.
The market sold everything together on the vote, as if regulation is one flat story. It isn't. 16 assets already have quiet federal cover. BNB doesn't — and that gap was set in March, not this week.
Not a buy/sell call. Just a fact almost nobody connected.
BNB — THE ASSET SEC "FORGOT"
Congress just killed America's biggest crypto bill. Bitcoin fell 4%, XRP fell 8%. Everyone's writing the same headline. Nobody's asking: if regulators already decided which coins are "safe," why isn't BNB on that list?
Back in March 2026, the SEC and CFTC jointly named 16 assets as digital commodities — legally outside SEC jurisdiction: BTC, ETH, SOL, XRP, DOGE, ADA, AVAX, LINK, DOT, HBAR, LTC, BCH, SHIB, XLM, XTZ, APT. BNB isn't there.
The CLARITY Act would've made that list permanent law. It failed 49–50 in the Senate on September 15. But the SEC's version never needed Congress — it's still standing, still moving (a new rule proposal is open for comment until October 20), and it still excludes BNB.
The market sold everything together on the vote, as if regulation is one flat story. It isn't. 16 assets already have quiet federal cover. BNB doesn't — and that gap was set in March, not this week.
Not a buy/sell call. Just a fact almost nobody connected.
Congress just killed America's biggest crypto bill. Bitcoin fell 4%, XRP fell 8%. Everyone's writing the same headline. Nobody's asking: if regulators already decided which coins are "safe," why isn't BNB on that list?
Back in March 2026, the SEC and CFTC jointly named 16 assets as digital commodities — legally outside SEC jurisdiction: BTC, ETH, SOL, XRP, DOGE, ADA, AVAX, LINK, DOT, HBAR, LTC, BCH, SHIB, XLM, XTZ, APT. BNB isn't there.
The CLARITY Act would've made that list permanent law. It failed 49–50 in the Senate on September 15. But the SEC's version never needed Congress — it's still standing, still moving (a new rule proposal is open for comment until October 20), and it still excludes BNB.
The market sold everything together on the vote, as if regulation is one flat story. It isn't. 16 assets already have quiet federal cover. BNB doesn't — and that gap was set in March, not this week.
Not a buy/sell call. Just a fact almost nobody connected.
1
381
·
--
$GUN
$GUN is trading at $0.0025, down 6.02% over the last 24H.
34.91% of the supply is unlocked, while 10,555,398 GUN is scheduled for release.
Next Unlock: Sep 16, 2026 — 13:00 UTC
Unlock Value: $26,388.50
With negative 24H momentum and a relatively low unlocked percentage, the price reaction around this scheduled event will be worth watching.
$GUN
$GUN
$GUN is trading at $0.0025, down 6.02% over the last 24H.
34.91% of the supply is unlocked, while 10,555,398 GUN is scheduled for release.
Next Unlock: Sep 16, 2026 — 13:00 UTC
Unlock Value: $26,388.50
With negative 24H momentum and a relatively low unlocked percentage, the price reaction around this scheduled event will be worth watching.
$GUN
$GUN is trading at $0.0025, down 6.02% over the last 24H.
34.91% of the supply is unlocked, while 10,555,398 GUN is scheduled for release.
Next Unlock: Sep 16, 2026 — 13:00 UTC
Unlock Value: $26,388.50
With negative 24H momentum and a relatively low unlocked percentage, the price reaction around this scheduled event will be worth watching.
$GUN
1
263
·
--
$RED
$RED is trading at $0.1342, down 4.69% over the last 24H.
51.43% of the supply is unlocked, with 1,037,826 RED scheduled for the next release.
Next Unlock: Sep 16, 2026 — 11:30 UTC
Unlock Value: $139,276.35
The scheduled release has a larger value than several others on this list, so the market reaction around the event deserves attention.
$RED
{future}(REDUSDT)
$RED
$RED is trading at $0.1342, down 4.69% over the last 24H.
51.43% of the supply is unlocked, with 1,037,826 RED scheduled for the next release.
Next Unlock: Sep 16, 2026 — 11:30 UTC
Unlock Value: $139,276.35
The scheduled release has a larger value than several others on this list, so the market reaction around the event deserves attention.
$RED
$RED is trading at $0.1342, down 4.69% over the last 24H.
51.43% of the supply is unlocked, with 1,037,826 RED scheduled for the next release.
Next Unlock: Sep 16, 2026 — 11:30 UTC
Unlock Value: $139,276.35
The scheduled release has a larger value than several others on this list, so the market reaction around the event deserves attention.
$RED
1
61
·
--
$SENT
$SENT is trading at $0.01534, up 2.06% over the last 24H.
Only 26.03% is unlocked, while the next release contains 7,253,460 SENT.
Next Unlock: Sep 16, 2026 — 11:30 UTC
Unlock Value: $111,268.09
The combination of positive 24H momentum and a low unlocked percentage makes the supply event an important watch point.
$SENT
{future}(SENTUSDT)
$SENT
$SENT is trading at $0.01534, up 2.06% over the last 24H.
Only 26.03% is unlocked, while the next release contains 7,253,460 SENT.
Next Unlock: Sep 16, 2026 — 11:30 UTC
Unlock Value: $111,268.09
The combination of positive 24H momentum and a low unlocked percentage makes the supply event an important watch point.
$SENT
$SENT is trading at $0.01534, up 2.06% over the last 24H.
Only 26.03% is unlocked, while the next release contains 7,253,460 SENT.
Next Unlock: Sep 16, 2026 — 11:30 UTC
Unlock Value: $111,268.09
The combination of positive 24H momentum and a low unlocked percentage makes the supply event an important watch point.
$SENT
78
·
--
$BMT
$BMT is trading at $0.01783, up 0.56% over the last 24H.
74.23% of the supply is unlocked, with 693,187 BMT coming in the next release.
Next Unlock: Sep 16, 2026 — 11:00 UTC
Unlock Value: $12,359.54
Price is holding slightly positive while the upcoming release remains relatively contained, keeping this event worth monitoring.
$BMT
$BMT
$BMT is trading at $0.01783, up 0.56% over the last 24H.
74.23% of the supply is unlocked, with 693,187 BMT coming in the next release.
Next Unlock: Sep 16, 2026 — 11:00 UTC
Unlock Value: $12,359.54
Price is holding slightly positive while the upcoming release remains relatively contained, keeping this event worth monitoring.
$BMT
$BMT is trading at $0.01783, up 0.56% over the last 24H.
74.23% of the supply is unlocked, with 693,187 BMT coming in the next release.
Next Unlock: Sep 16, 2026 — 11:00 UTC
Unlock Value: $12,359.54
Price is holding slightly positive while the upcoming release remains relatively contained, keeping this event worth monitoring.
$BMT
1
145
·
--
$COOKIE
$COOKIE is trading at $0.0098, down 4.85% over the last 24H.
87.32% of the supply is already unlocked, while 469,792 COOKIE is scheduled for release.
Next Unlock: Sep 16, 2026 — 10:00 UTC
Unlock Value: $4,603.97
With most of the supply already unlocked, the key question is whether selling pressure continues after the scheduled release.
$COOKIE
$COOKIE
$COOKIE is trading at $0.0098, down 4.85% over the last 24H.
87.32% of the supply is already unlocked, while 469,792 COOKIE is scheduled for release.
Next Unlock: Sep 16, 2026 — 10:00 UTC
Unlock Value: $4,603.97
With most of the supply already unlocked, the key question is whether selling pressure continues after the scheduled release.
$COOKIE
$COOKIE is trading at $0.0098, down 4.85% over the last 24H.
87.32% of the supply is already unlocked, while 469,792 COOKIE is scheduled for release.
Next Unlock: Sep 16, 2026 — 10:00 UTC
Unlock Value: $4,603.97
With most of the supply already unlocked, the key question is whether selling pressure continues after the scheduled release.
$COOKIE
1
97
·
--
$BABY
$BABY is trading at $0.01079, down 3.14% over the last 24H.
36.32% is already unlocked, with 23,649,500 BABY scheduled for the next release.
Next Unlock: Sep 16, 2026 — 10:00 UTC
Unlock Value: $25,517.81
The release is relatively small, but the current negative momentum makes the reaction around the unlock worth watching.
$BABY
$BABY
$BABY is trading at $0.01079, down 3.14% over the last 24H.
36.32% is already unlocked, with 23,649,500 BABY scheduled for the next release.
Next Unlock: Sep 16, 2026 — 10:00 UTC
Unlock Value: $25,517.81
The release is relatively small, but the current negative momentum makes the reaction around the unlock worth watching.
$BABY
$BABY is trading at $0.01079, down 3.14% over the last 24H.
36.32% is already unlocked, with 23,649,500 BABY scheduled for the next release.
Next Unlock: Sep 16, 2026 — 10:00 UTC
Unlock Value: $25,517.81
The release is relatively small, but the current negative momentum makes the reaction around the unlock worth watching.
$BABY
154
·
--
$INIT
$INIT is trading at $0.06768, down 1.25% over the last 24H.
Only 30.98% of the supply is unlocked, while the next release contains 34,003 INIT.
Next Unlock: Sep 16, 2026 — 09:00 UTC
Unlock Value: $2,301.38
The immediate unlock is small, but the relatively low unlocked percentage keeps future supply releases on the radar.
$INIT
$INIT
$INIT is trading at $0.06768, down 1.25% over the last 24H.
Only 30.98% of the supply is unlocked, while the next release contains 34,003 INIT.
Next Unlock: Sep 16, 2026 — 09:00 UTC
Unlock Value: $2,301.38
The immediate unlock is small, but the relatively low unlocked percentage keeps future supply releases on the radar.
$INIT
$INIT is trading at $0.06768, down 1.25% over the last 24H.
Only 30.98% of the supply is unlocked, while the next release contains 34,003 INIT.
Next Unlock: Sep 16, 2026 — 09:00 UTC
Unlock Value: $2,301.38
The immediate unlock is small, but the relatively low unlocked percentage keeps future supply releases on the radar.
$INIT
111
Log in to explore more content
Join global crypto users on Binance Square
⚡️ Get latest and useful information about crypto.
💬 Trusted by the world’s largest crypto exchange.
👍 Discover real insights from verified creators.
Email / Phone number
Trending Topics
BTCBreaks80K
70,282 views
1,463 Discussing
$BTC
What price is BTC going to hit in 2026?
Spot is sitting at $80,748. 104 days to go
↑ $90k - 58%
↑ $100k - 24%
↓ $70k dip first - 48%
The bull case floating around the floor:
>August had a proper run from $62,275 up to $81,479 — up 31% bottom to top
>The CLARITY Act flopped its Senate cloture vote 49-50 on 15 Sept. BTC was already sliding well before the vote, touched $74,968 in that hour, and won it all back inside three days
>The Fed hiked rates on 16 Sept — first time since July 2023. Spot is currently floating 7.4% above that day's low
>The altcoins are proper outrunning it. 30-day view: SOL up 38%, XRP up 35%, ETH up 32% versus BTC up 23%
>The timeline is still packed with reasons why this ought to break down — and that’s precisely the wall of worry bull markets tend to climb
>The midterms land on 3 Nov, right smack in the middle of this market window
So, what would you put down for a punt at +24% in 104 days?
$ETH
$SOL
#BTCBreaks80K #solonapumping #ETH🔥🔥🔥🔥🔥🔥 #BullMarket📈
Wealthy bloke
·4 Likes
·4.9k views
比特币突破8万
64,974 views
232 Discussing
BuffettBecomesBerkshireChairmanEmeritus
16,965 views
513 Discussing