
合约涨跌AI预判-VIP-0907版
9.3k Posts

合约涨跌AI预判-VIP-0907版
 Square Verified+
Report
Block User
以咨询级视角拆解 AI 趋势、智能工具与商业应用,过滤信息噪音,提炼真正有价值的前沿洞察 | 任何帖子非财务投资建议 | Opinions are my own & Not Financial Advice

Creator Awards 2024

原创之星

Level 1 Creator
Open Trade
Occasional Trader
5.7 Years
0 Following
72.5K+ Followers
691.0K+ Liked
4 Badges
Posts
Portfolio
All
Quotes
Videos
Live
About 4 hours ago, for this set in the morning, the issued warning was a high-level distribution warning (bearish direction). At the time, the observation was: "the chips are dispersed." As of now, tracking across the three coins shows: 1 out of 3 has already gone into realization, with KAT confirming weakness. SAHARA is still tugging back and forth and hasn’t formed a one-sided move. COTI is doing a pullback, with the direction opposite to this morning.
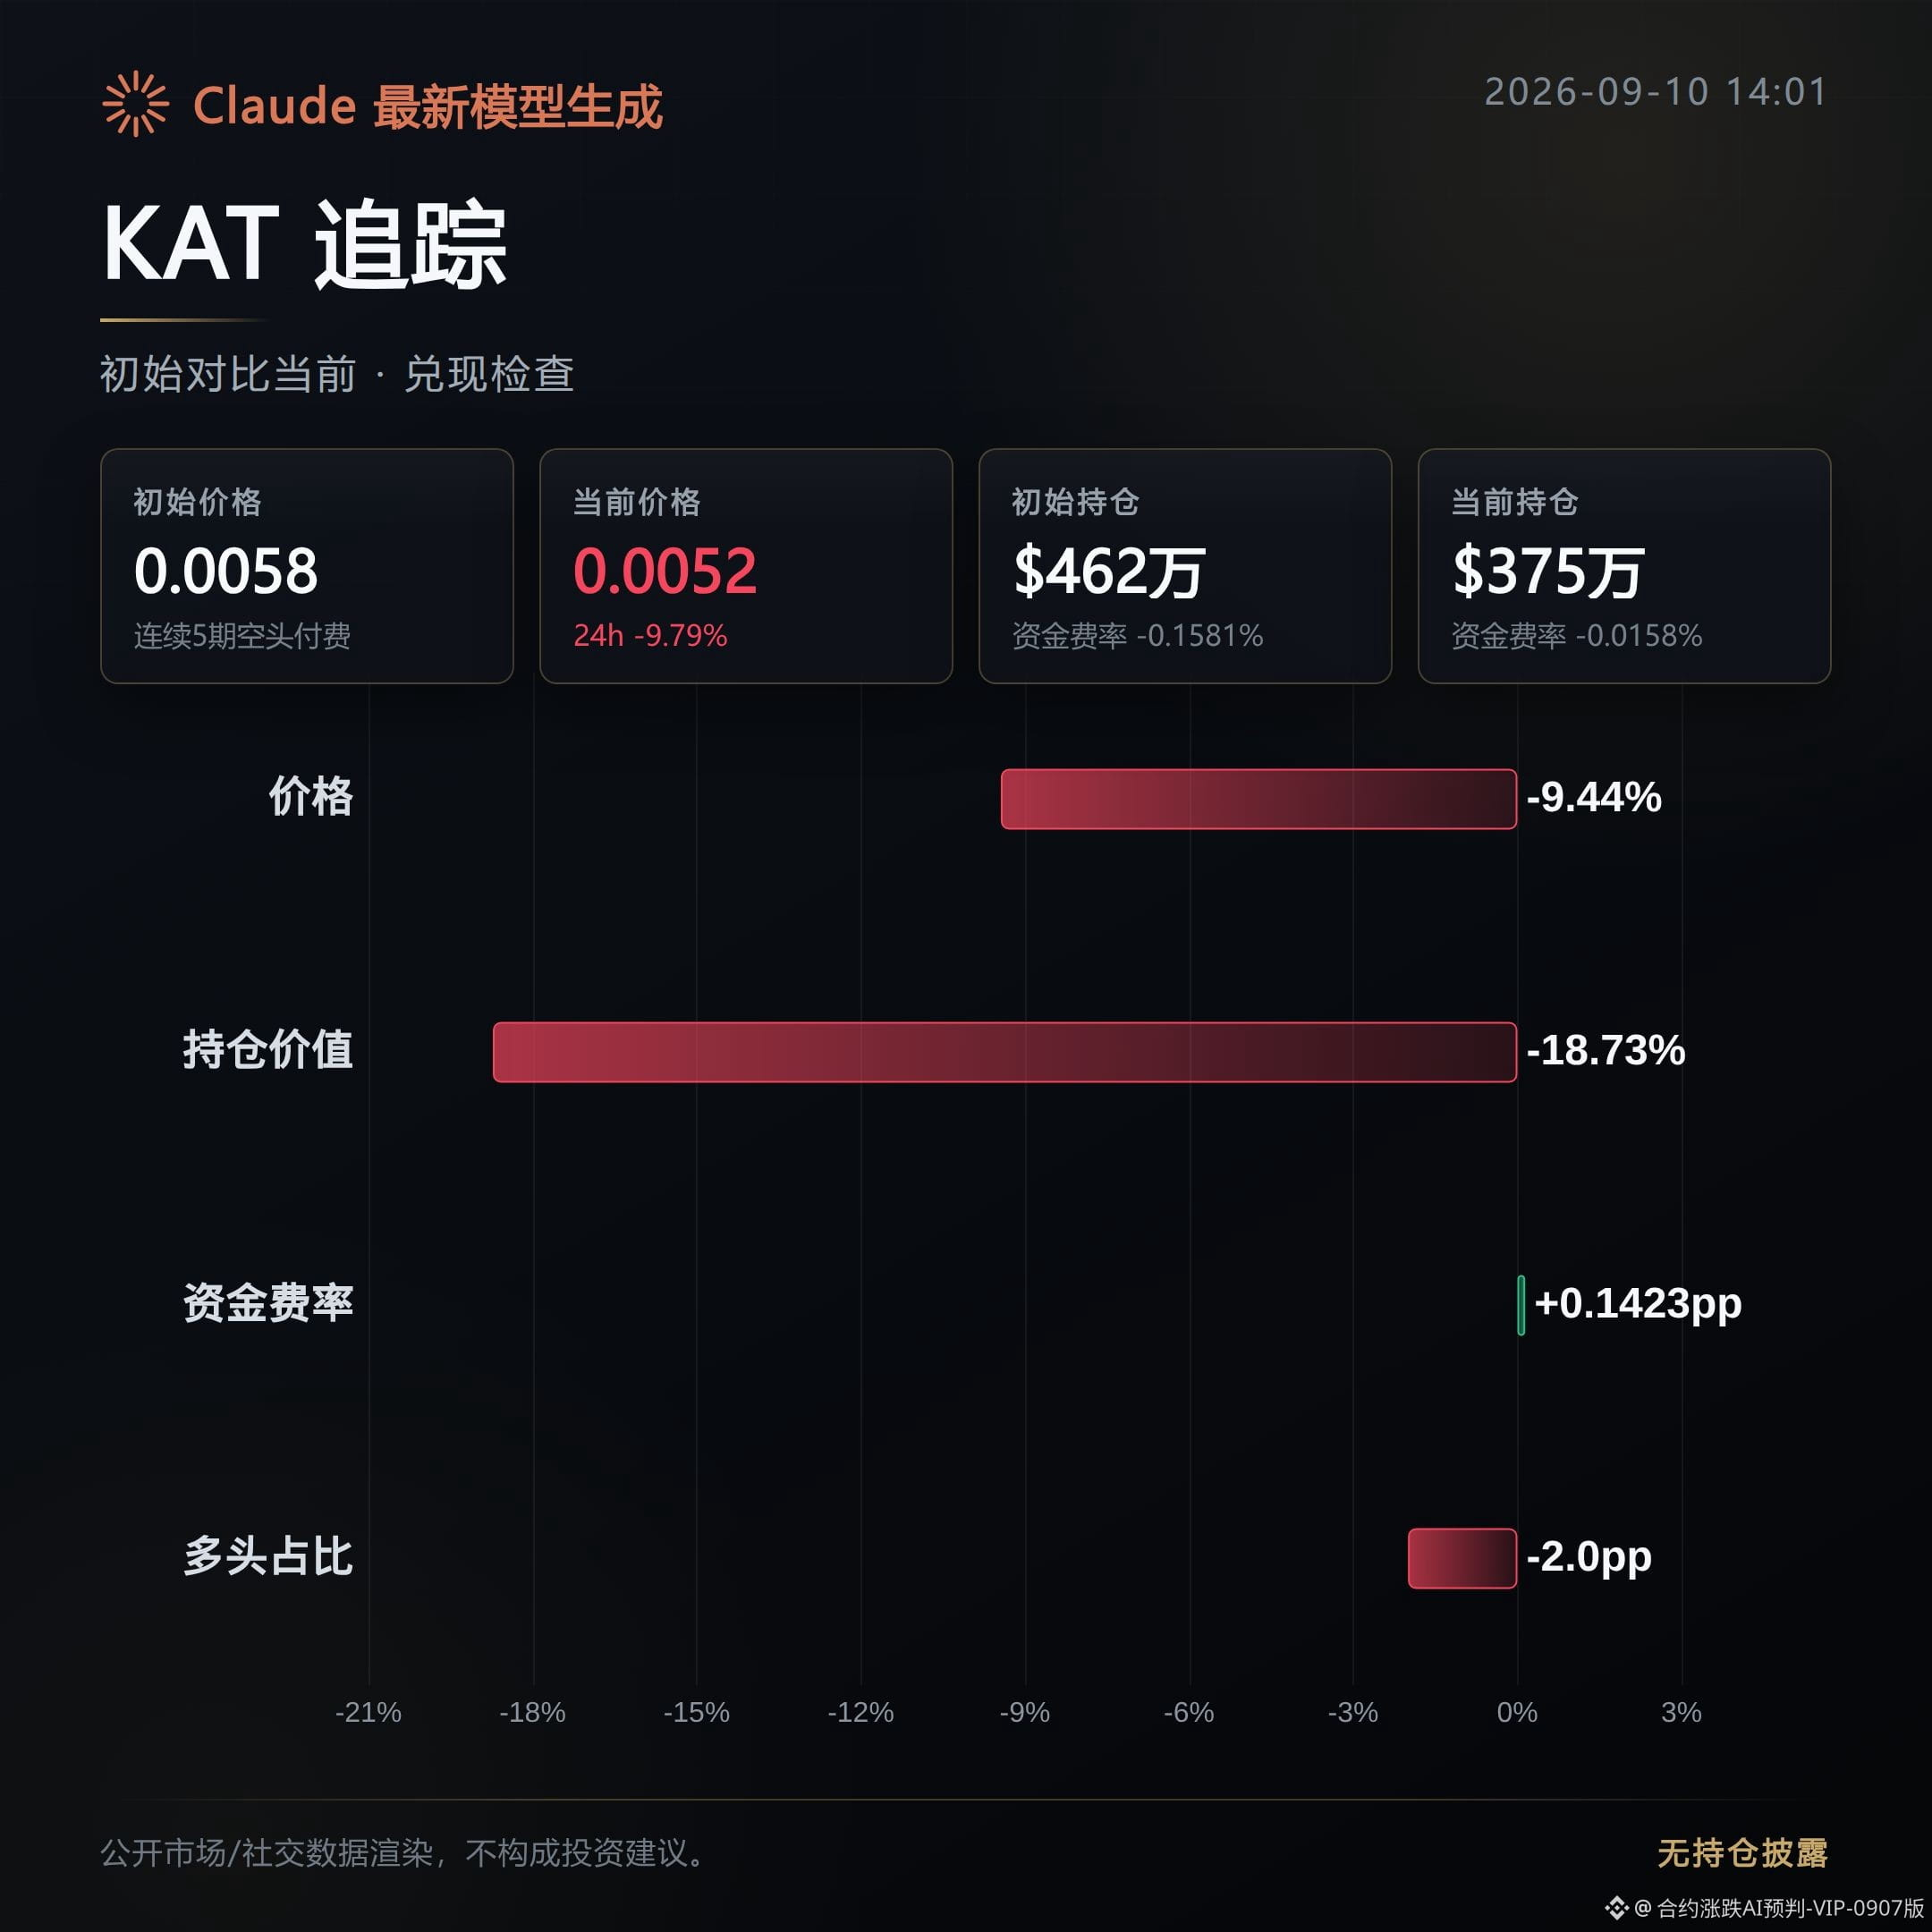
KAT: realization. The morning high-level distribution warning has played out. After the initial drop, the price continued to fall 9.44%, with open interest also declining in sync by 18.73%. The fact that both price and volume contracted together indicates this is not a washout-style fake drop—there are truly people reducing positions and exiting. Trading volume also shrank by 23.74%. The strength of active buy orders fell from 1.0 to 0.74, suggesting support is clearly thinning. Funding rate has turned negative, and bearish sentiment is building.
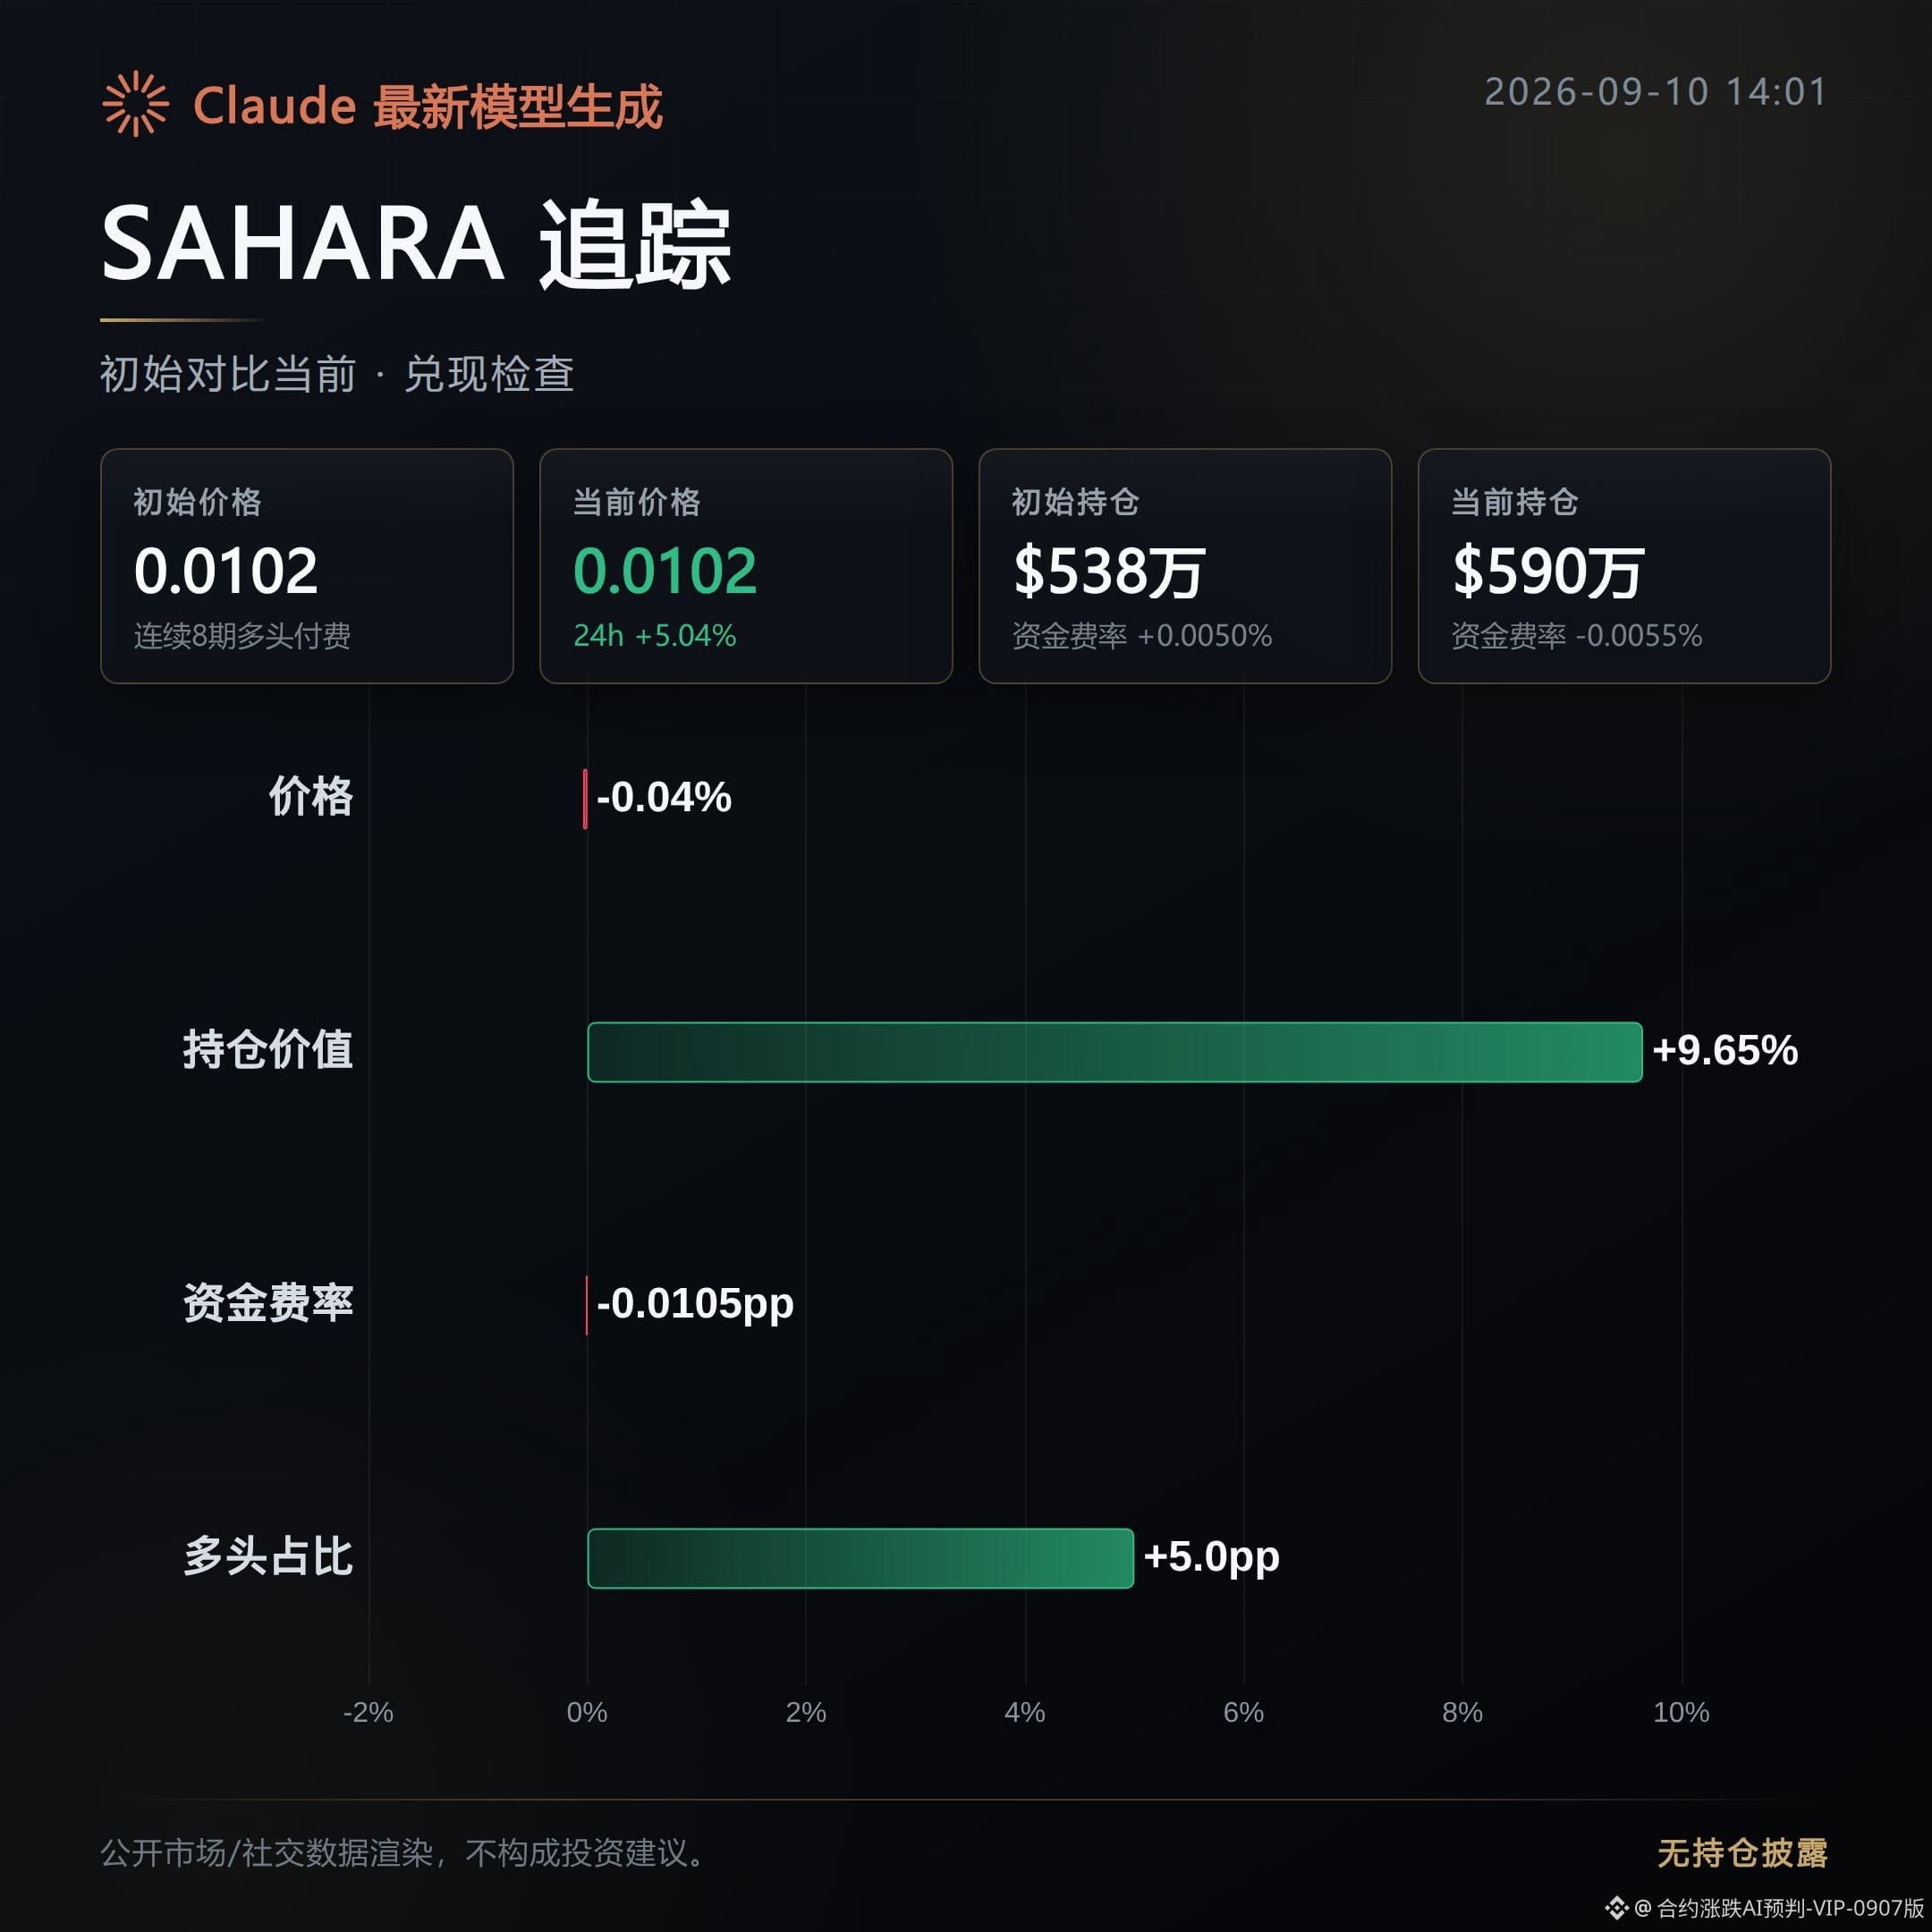
SAHARA: tugging. It hasn’t formed a one-sided decline yet. Price is basically flat (-0.04%), but open interest has risen against the trend by 9.65%, while trading volume increased by 75.13%. This suggests there is capital entering and exiting in the order book; bulls and bears are still in a standoff. The distribution direction hasn’t been validated yet.
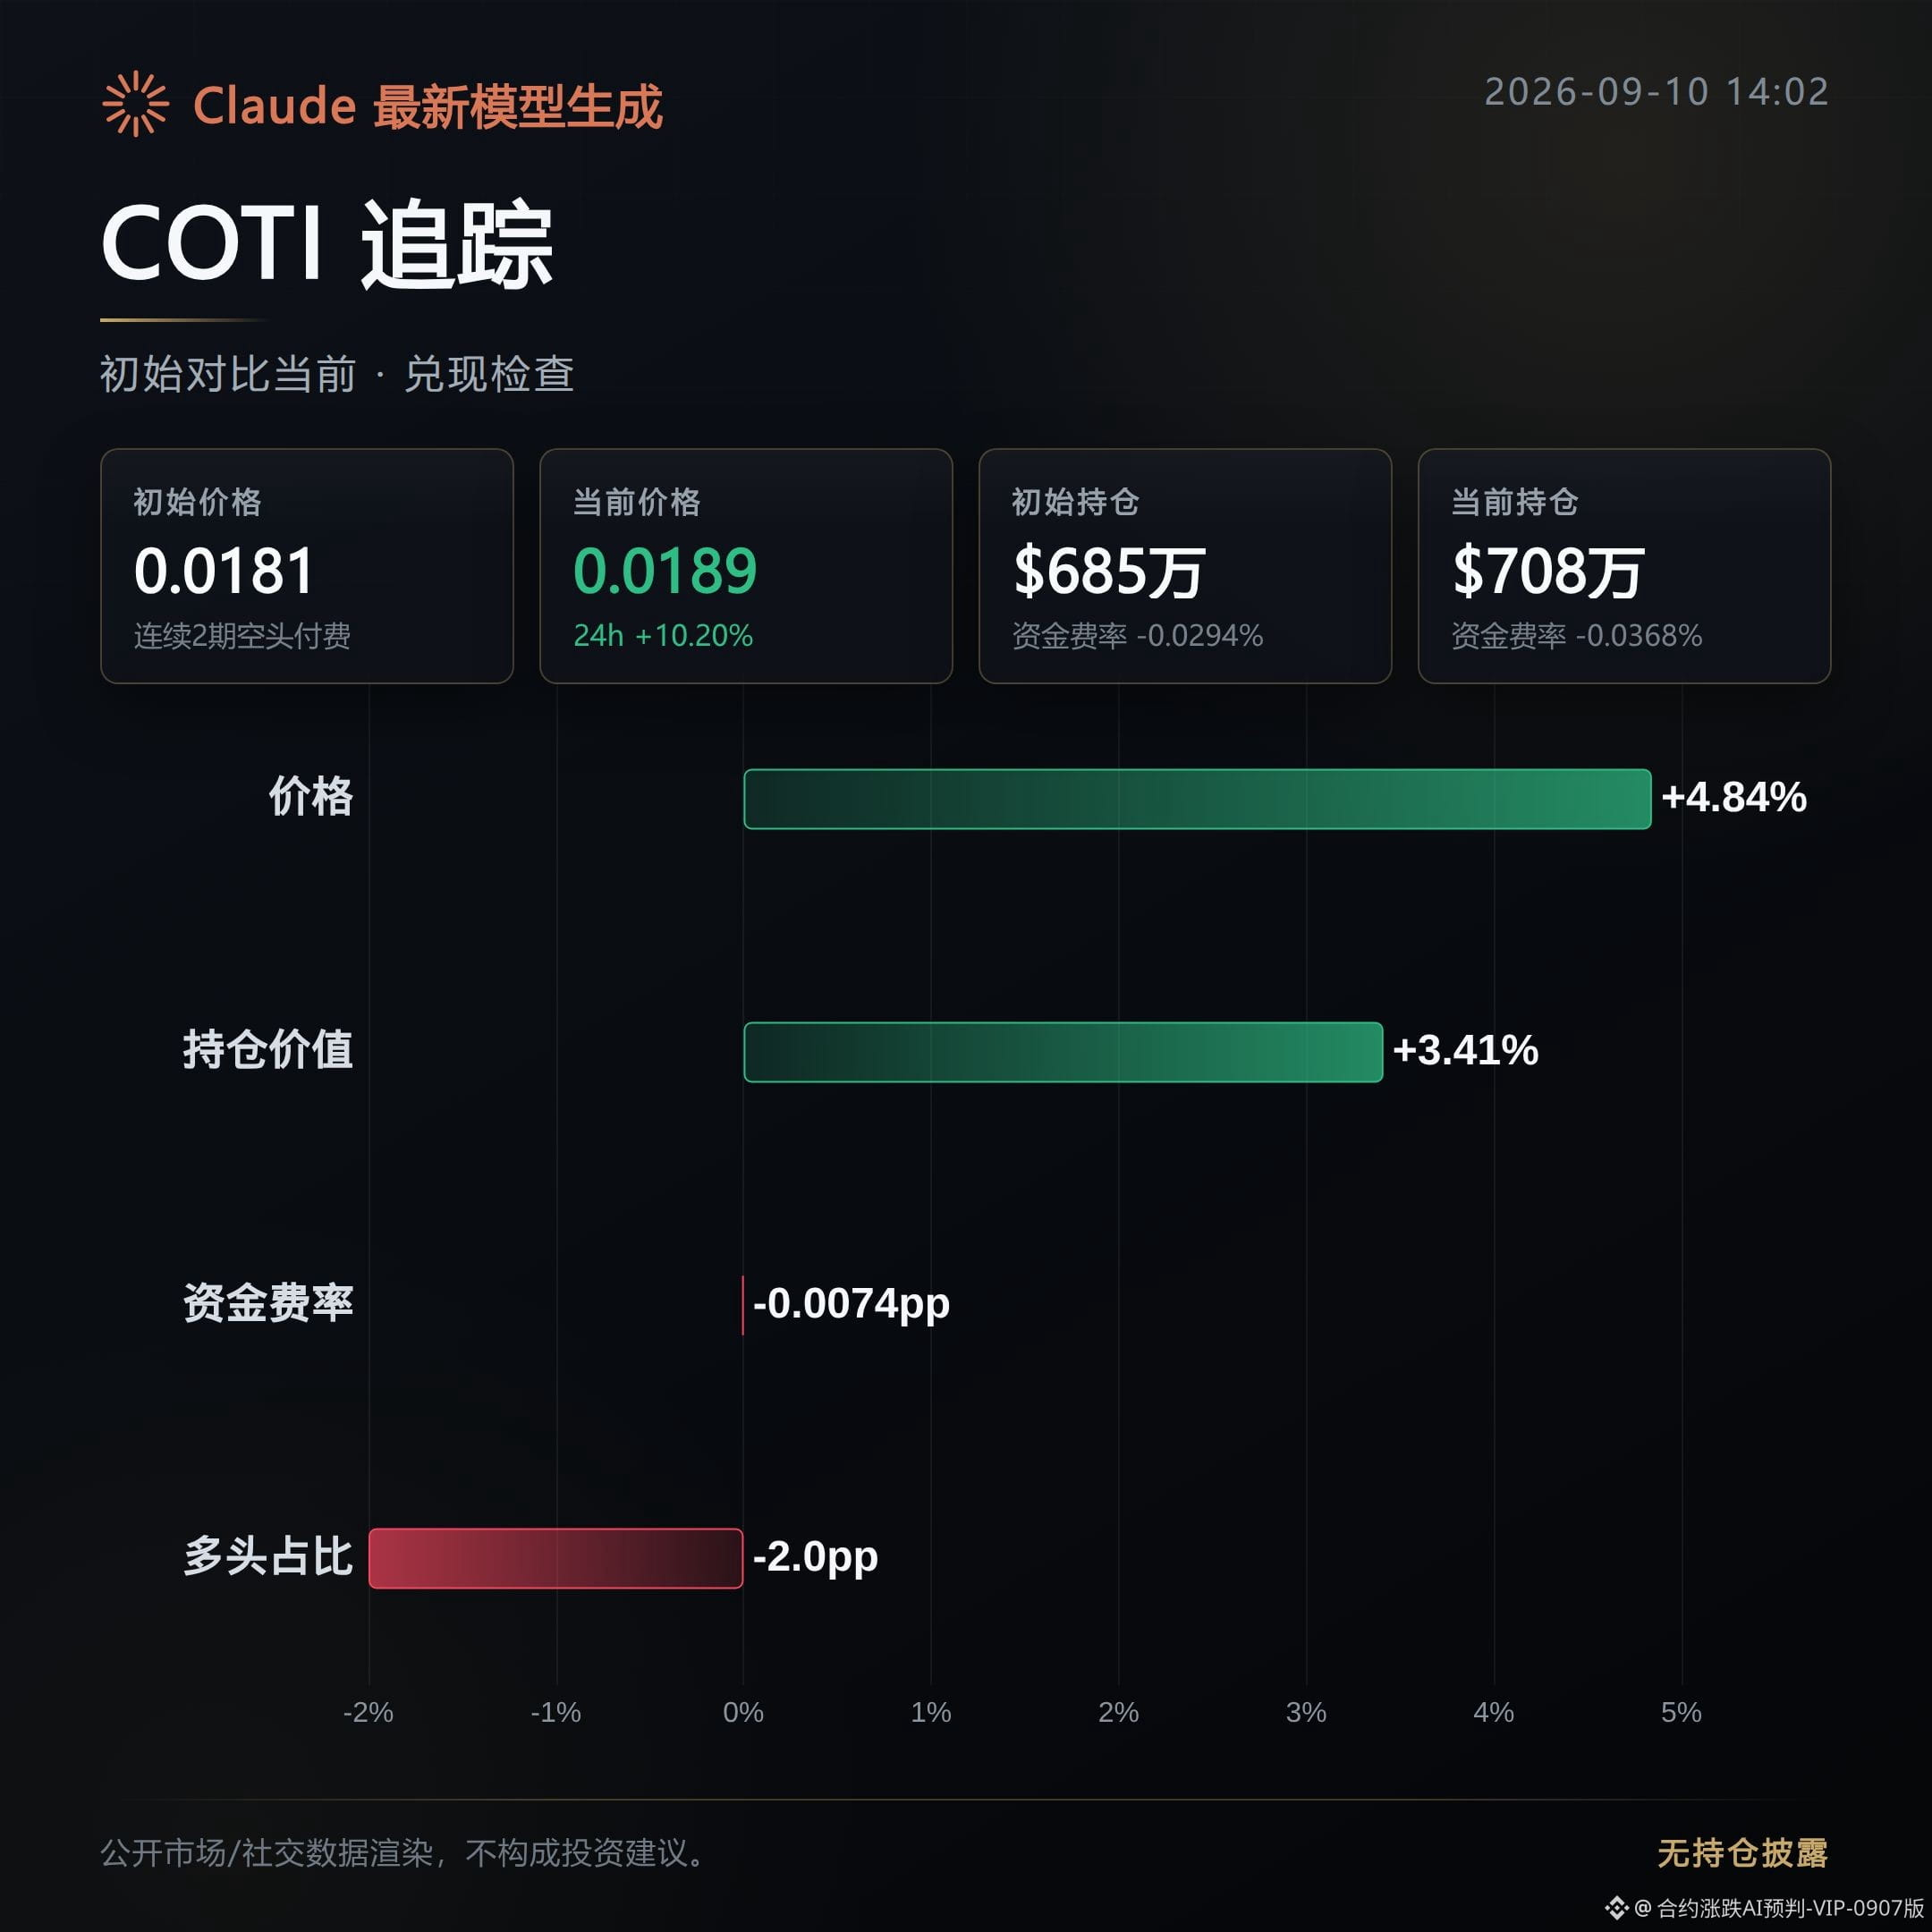
COTI: pullback. The bearish warning from this morning hasn’t played out. After the initial move, instead of dropping, price rose 4.84%. The intraday move from 2.44% widened to 10.2%, and open interest increased in sync. This suggests incremental capital is flowing in; the earlier judgment of strong high-level distribution has been weakened. This isn’t a low-volume, reluctant hold—it’s real buying being absorbed.
What to watch next along this line: For KAT, whether it can continue to push lower with volume and whether the support is continuously thinning—this is key to confirming whether the pullback will continue. For SAHARA, watch whether open interest keeps stacking while price does not break down; once trading volume expands again and price starts to follow the decline, the tug-of-war shifts toward confirmation. For COTI, look the other way: if after the rebound, volume cannot keep up and the funding rate turns downward again, the original distribution signal may have been merely delayed and is worth being brought back into observation.
Live position disclosure: This account currently holds $FOGO long positions. The relevant views match the actual position.
Compiled with assistance from Claude Fable 5 for contract data; for informational reference only—please verify for yourself.
About 4 hours ago, for this set in the morning, the issued warning was a high-level distribution warning (bearish direction). At the time, the observation was: "the chips are dispersed." As of now, tracking across the three coins shows: 1 out of 3 has already gone into realization, with KAT confirming weakness. SAHARA is still tugging back and forth and hasn’t formed a one-sided move. COTI is doing a pullback, with the direction opposite to this morning.
KAT: realization. The morning high-level distribution warning has played out. After the initial drop, the price continued to fall 9.44%, with open interest also declining in sync by 18.73%. The fact that both price and volume contracted together indicates this is not a washout-style fake drop—there are truly people reducing positions and exiting. Trading volume also shrank by 23.74%. The strength of active buy orders fell from 1.0 to 0.74, suggesting support is clearly thinning. Funding rate has turned negative, and bearish sentiment is building.
SAHARA: tugging. It hasn’t formed a one-sided decline yet. Price is basically flat (-0.04%), but open interest has risen against the trend by 9.65%, while trading volume increased by 75.13%. This suggests there is capital entering and exiting in the order book; bulls and bears are still in a standoff. The distribution direction hasn’t been validated yet.
COTI: pullback. The bearish warning from this morning hasn’t played out. After the initial move, instead of dropping, price rose 4.84%. The intraday move from 2.44% widened to 10.2%, and open interest increased in sync. This suggests incremental capital is flowing in; the earlier judgment of strong high-level distribution has been weakened. This isn’t a low-volume, reluctant hold—it’s real buying being absorbed.
What to watch next along this line: For KAT, whether it can continue to push lower with volume and whether the support is continuously thinning—this is key to confirming whether the pullback will continue. For SAHARA, watch whether open interest keeps stacking while price does not break down; once trading volume expands again and price starts to follow the decline, the tug-of-war shifts toward confirmation. For COTI, look the other way: if after the rebound, volume cannot keep up and the funding rate turns downward again, the original distribution signal may have been merely delayed and is worth being brought back into observation.
Live position disclosure: This account currently holds $FOGO long positions. The relevant views match the actual position.
Compiled with assistance from Claude Fable 5 for contract data; for informational reference only—please verify for yourself.
KAT: realization. The morning high-level distribution warning has played out. After the initial drop, the price continued to fall 9.44%, with open interest also declining in sync by 18.73%. The fact that both price and volume contracted together indicates this is not a washout-style fake drop—there are truly people reducing positions and exiting. Trading volume also shrank by 23.74%. The strength of active buy orders fell from 1.0 to 0.74, suggesting support is clearly thinning. Funding rate has turned negative, and bearish sentiment is building.
SAHARA: tugging. It hasn’t formed a one-sided decline yet. Price is basically flat (-0.04%), but open interest has risen against the trend by 9.65%, while trading volume increased by 75.13%. This suggests there is capital entering and exiting in the order book; bulls and bears are still in a standoff. The distribution direction hasn’t been validated yet.
COTI: pullback. The bearish warning from this morning hasn’t played out. After the initial move, instead of dropping, price rose 4.84%. The intraday move from 2.44% widened to 10.2%, and open interest increased in sync. This suggests incremental capital is flowing in; the earlier judgment of strong high-level distribution has been weakened. This isn’t a low-volume, reluctant hold—it’s real buying being absorbed.
What to watch next along this line: For KAT, whether it can continue to push lower with volume and whether the support is continuously thinning—this is key to confirming whether the pullback will continue. For SAHARA, watch whether open interest keeps stacking while price does not break down; once trading volume expands again and price starts to follow the decline, the tug-of-war shifts toward confirmation. For COTI, look the other way: if after the rebound, volume cannot keep up and the funding rate turns downward again, the original distribution signal may have been merely delayed and is worth being brought back into observation.
Live position disclosure: This account currently holds $FOGO long positions. The relevant views match the actual position.
Compiled with assistance from Claude Fable 5 for contract data; for informational reference only—please verify for yourself.
388
About 6 hours ago, I observed this morning’s pull-up; the bullish direction looked favored. The initial call was that the chips were consolidating in a gathering phase.
Now, according to the publicly available order-book reconciliation, none of these three coins has truly broken out: XTZ and STRK are still in a tug-of-war, while PHA has fizzled out and pulled back.
XTZ: Tug-of-war. The price and capital-flow structure have not yet formed a one-sided confirmation. The bullish momentum neither connected nor has it been conclusively disproven.
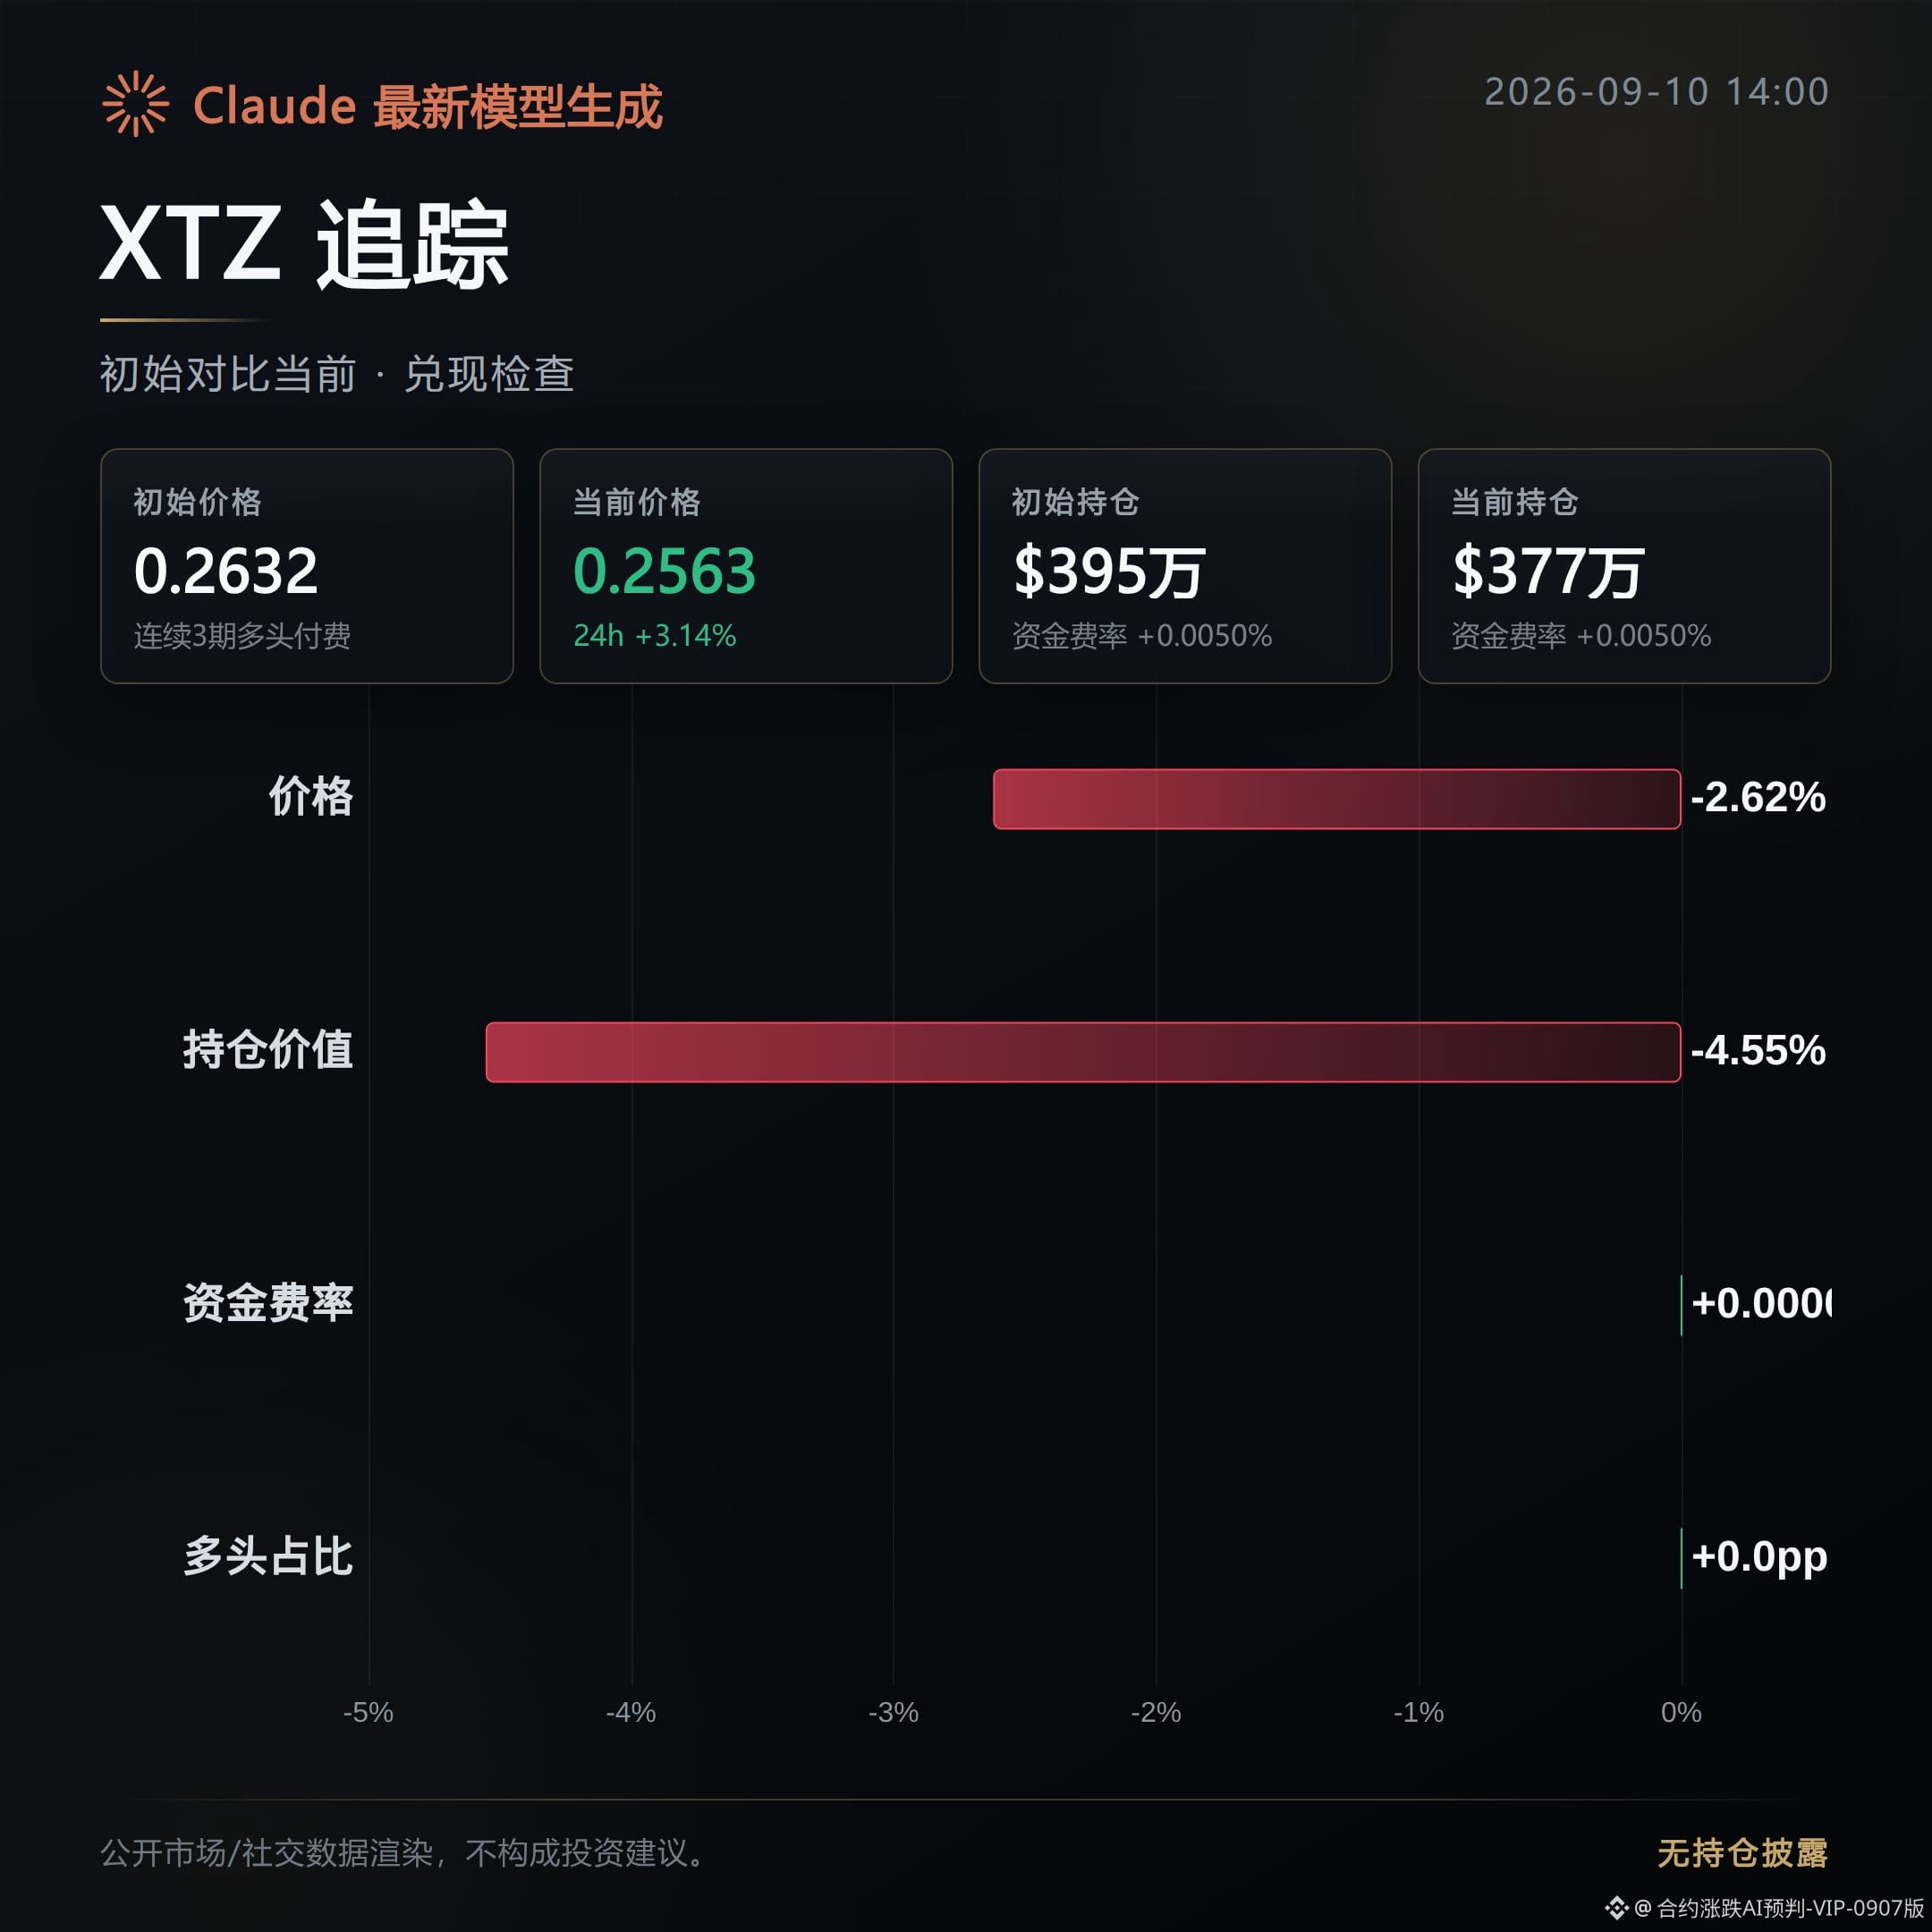
After the initial push, the price dropped 2.62% to 0.2563, and open interest fell in sync by 4.55%, with the gain narrowing from 5.53% to 3.14%.
The long/short ratio shows longs at 62%, but price failed to keep up with the positioning preference—this is still a struggle on the chart.
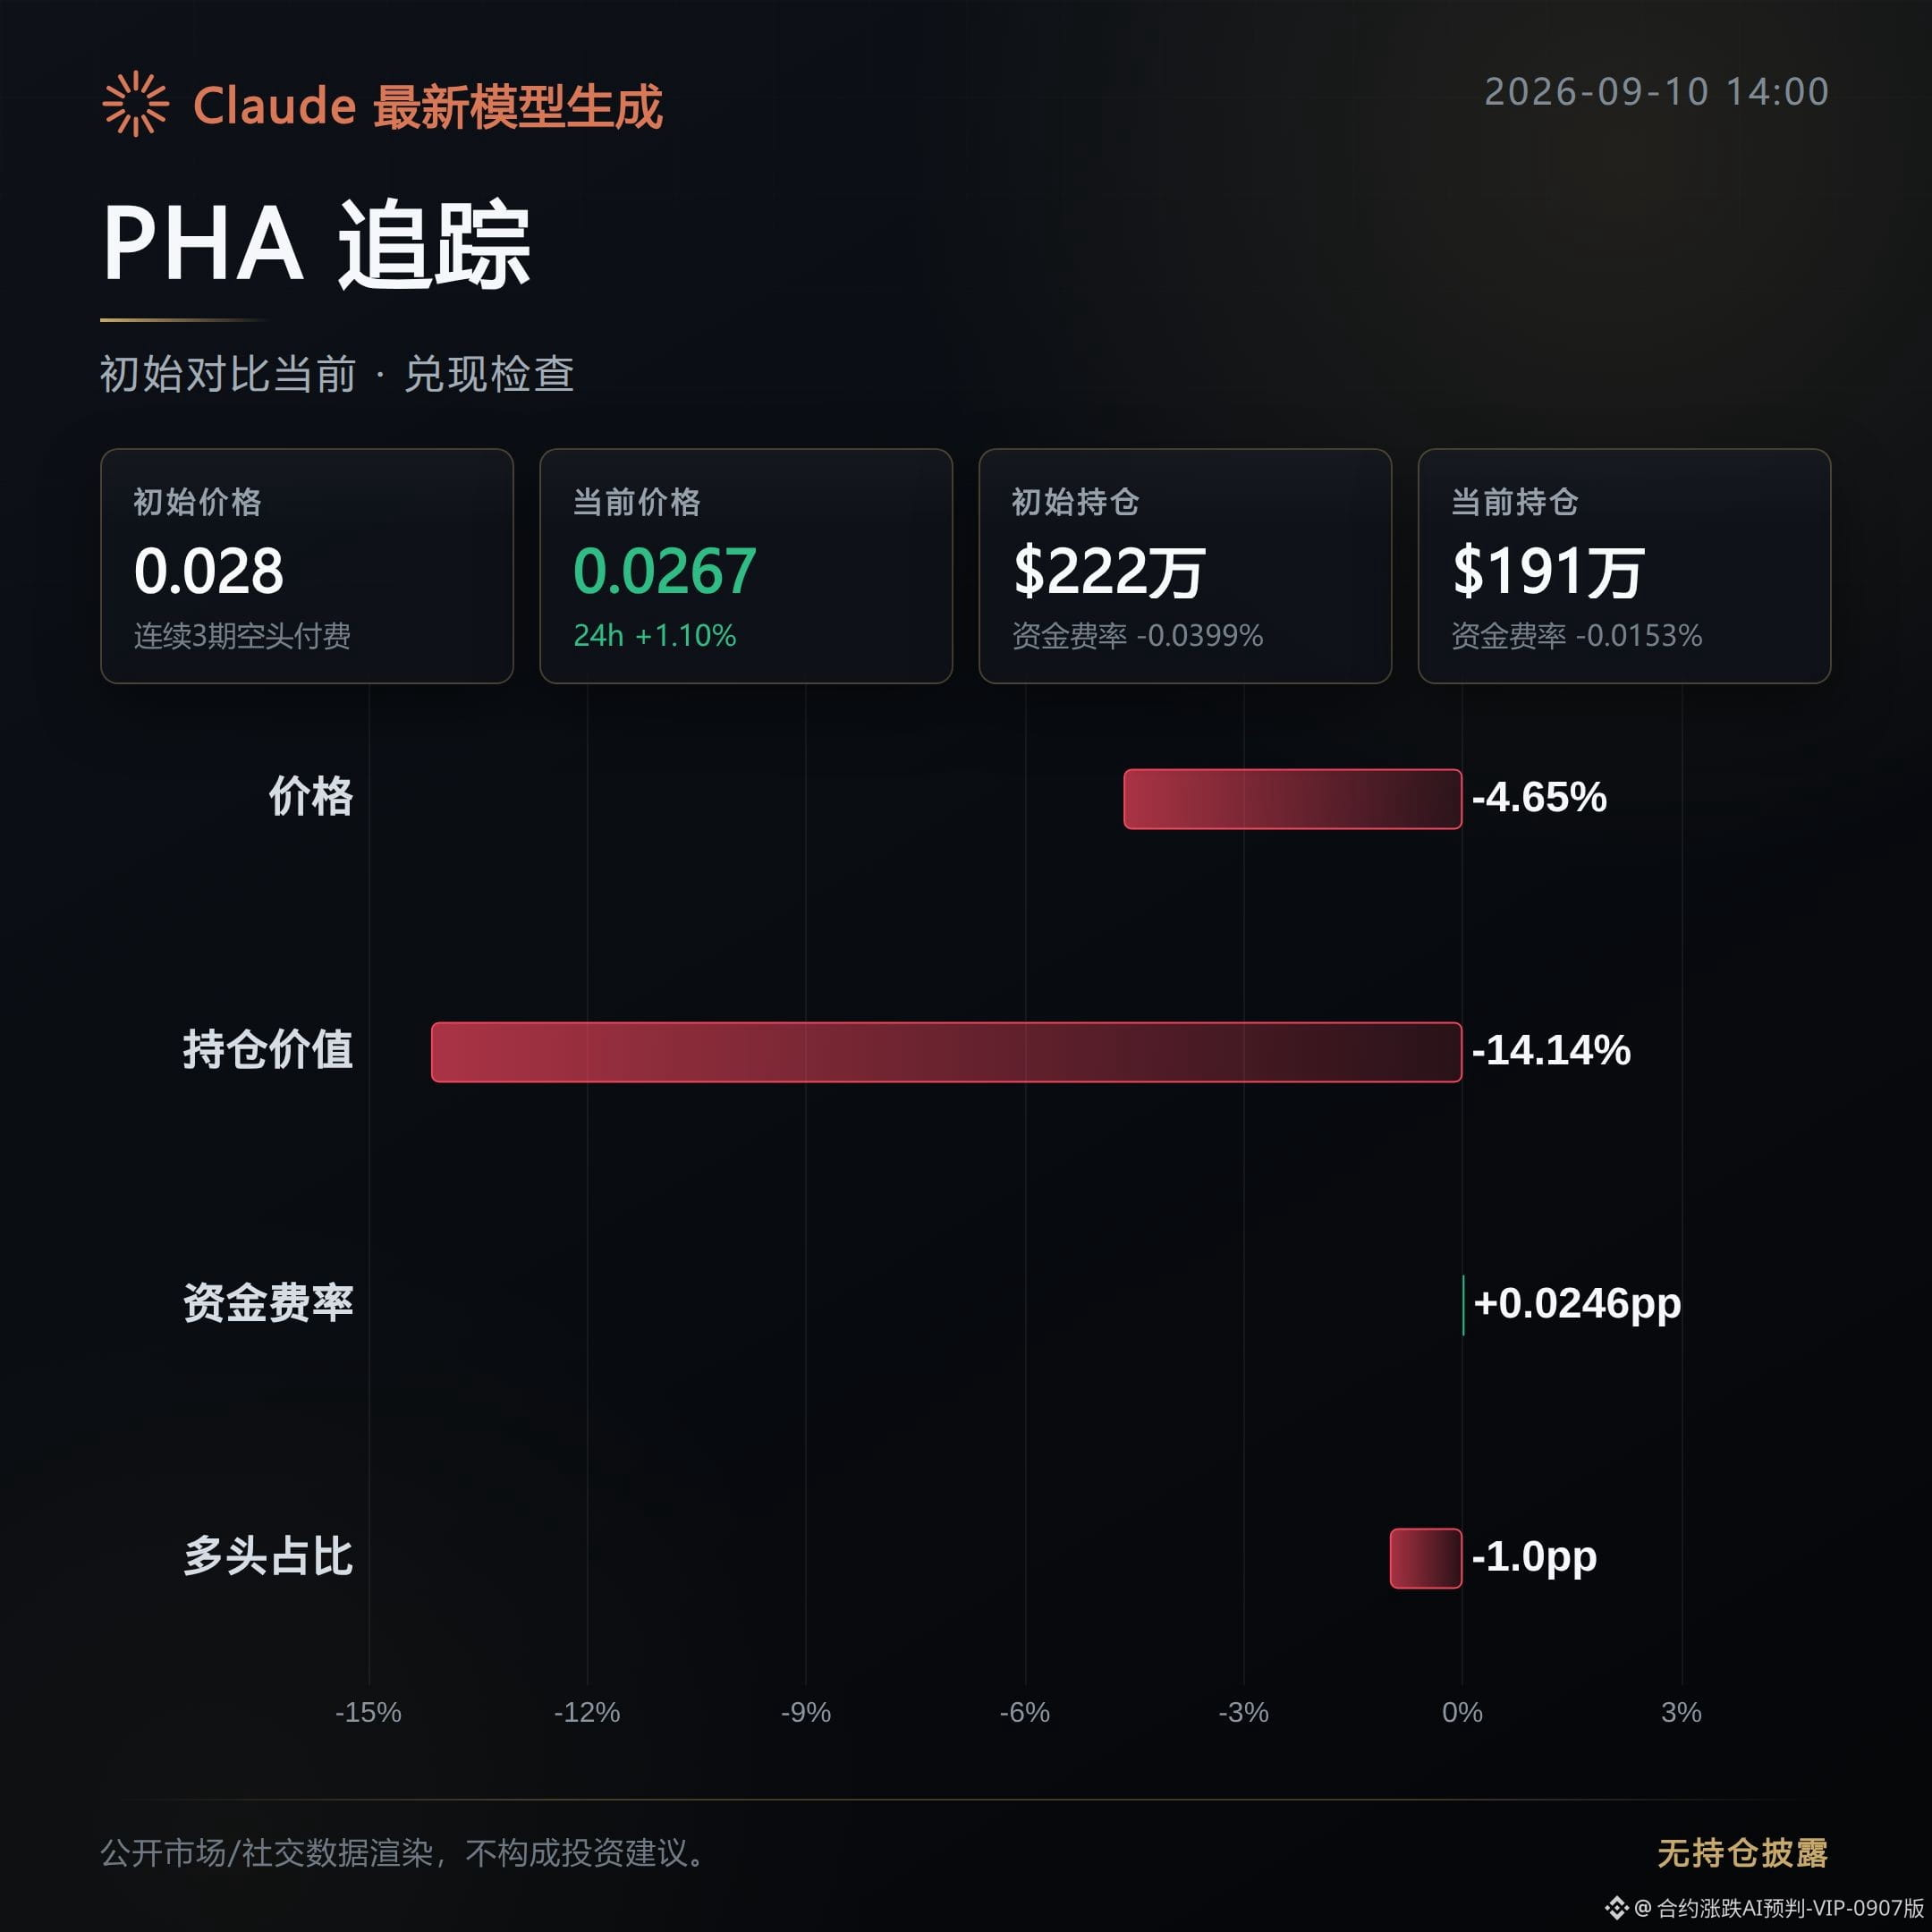
PHA: Fizzled out. The morning bullish view couldn’t be sustained; after the initial push, the price pulled back 4.65%.
More importantly, open interest dropped 14.14%, the largest decline among the three. The gain also narrowed from 7.33% to 1.1%. Although the funding rate has been repaired, it is still negative—shorts are still paying. The heat hasn’t been able to carry over.
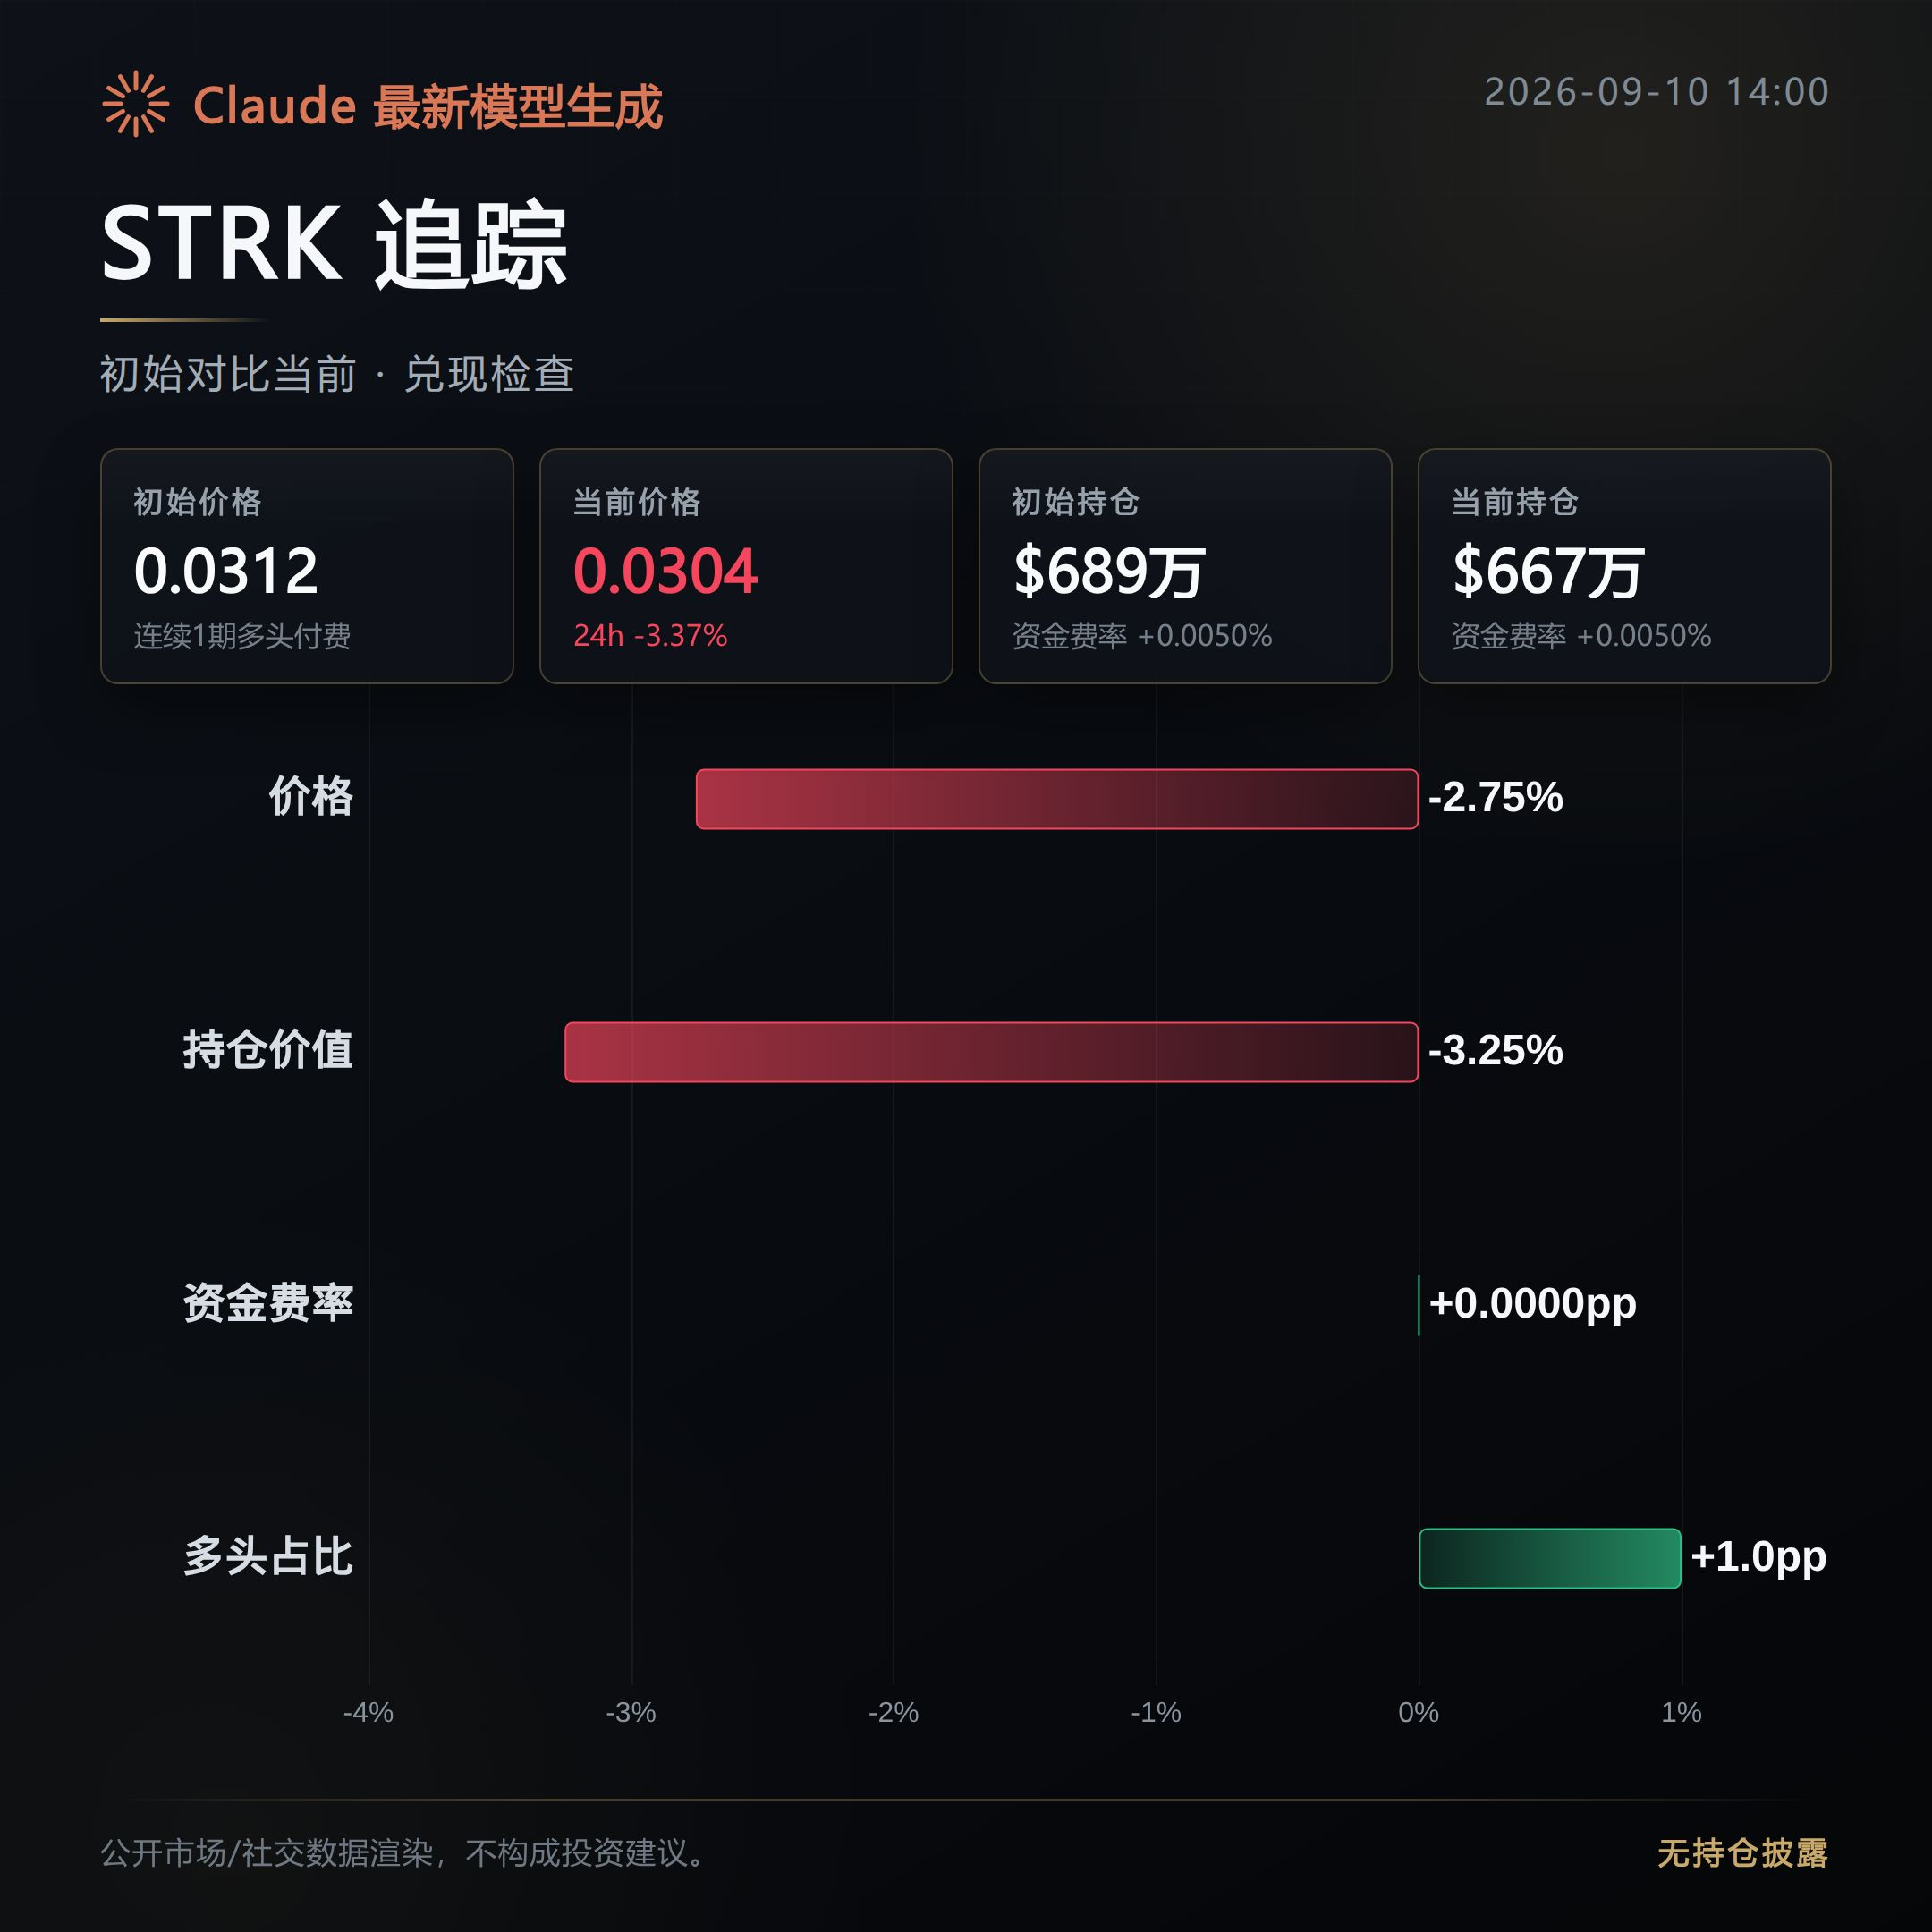
STRK: Tug-of-war. After the initial push, the price fell 2.75%; the gain flipped from 2.36% directly to -3.37%.
The strength of active buy orders dropped from 0.94 to 0.63—buyers are retreating. Open interest also slightly decreased by 3.25%; the direction hasn’t resolved yet.
Next, keep watching whether open interest can stop falling and rebound, and whether active buy pressure will strengthen again. Turning these two indicators positive is a signal for bullish confirmation to be re-established.
If price continues to weaken while open interest keeps sliding, that would be a counter-signal (a disproval) to this bullish move.
#XTZ #PHA #STRK # Contract recap
Live disclosure: This account currently holds $FOGO long positions. The related viewpoints in this post are consistent with the actual positions.
This content is assisted by Claude Fable 5 for generation, for informational reference only—please verify it yourself.
About 6 hours ago, I observed this morning’s pull-up; the bullish direction looked favored. The initial call was that the chips were consolidating in a gathering phase.
Now, according to the publicly available order-book reconciliation, none of these three coins has truly broken out: XTZ and STRK are still in a tug-of-war, while PHA has fizzled out and pulled back.
XTZ: Tug-of-war. The price and capital-flow structure have not yet formed a one-sided confirmation. The bullish momentum neither connected nor has it been conclusively disproven.
After the initial push, the price dropped 2.62% to 0.2563, and open interest fell in sync by 4.55%, with the gain narrowing from 5.53% to 3.14%.
The long/short ratio shows longs at 62%, but price failed to keep up with the positioning preference—this is still a struggle on the chart.
PHA: Fizzled out. The morning bullish view couldn’t be sustained; after the initial push, the price pulled back 4.65%.
More importantly, open interest dropped 14.14%, the largest decline among the three. The gain also narrowed from 7.33% to 1.1%. Although the funding rate has been repaired, it is still negative—shorts are still paying. The heat hasn’t been able to carry over.
STRK: Tug-of-war. After the initial push, the price fell 2.75%; the gain flipped from 2.36% directly to -3.37%.
The strength of active buy orders dropped from 0.94 to 0.63—buyers are retreating. Open interest also slightly decreased by 3.25%; the direction hasn’t resolved yet.
Next, keep watching whether open interest can stop falling and rebound, and whether active buy pressure will strengthen again. Turning these two indicators positive is a signal for bullish confirmation to be re-established.
If price continues to weaken while open interest keeps sliding, that would be a counter-signal (a disproval) to this bullish move.
#XTZ #PHA #STRK # Contract recap
Live disclosure: This account currently holds $FOGO long positions. The related viewpoints in this post are consistent with the actual positions.
This content is assisted by Claude Fable 5 for generation, for informational reference only—please verify it yourself.
Now, according to the publicly available order-book reconciliation, none of these three coins has truly broken out: XTZ and STRK are still in a tug-of-war, while PHA has fizzled out and pulled back.
XTZ: Tug-of-war. The price and capital-flow structure have not yet formed a one-sided confirmation. The bullish momentum neither connected nor has it been conclusively disproven.
After the initial push, the price dropped 2.62% to 0.2563, and open interest fell in sync by 4.55%, with the gain narrowing from 5.53% to 3.14%.
The long/short ratio shows longs at 62%, but price failed to keep up with the positioning preference—this is still a struggle on the chart.
PHA: Fizzled out. The morning bullish view couldn’t be sustained; after the initial push, the price pulled back 4.65%.
More importantly, open interest dropped 14.14%, the largest decline among the three. The gain also narrowed from 7.33% to 1.1%. Although the funding rate has been repaired, it is still negative—shorts are still paying. The heat hasn’t been able to carry over.
STRK: Tug-of-war. After the initial push, the price fell 2.75%; the gain flipped from 2.36% directly to -3.37%.
The strength of active buy orders dropped from 0.94 to 0.63—buyers are retreating. Open interest also slightly decreased by 3.25%; the direction hasn’t resolved yet.
Next, keep watching whether open interest can stop falling and rebound, and whether active buy pressure will strengthen again. Turning these two indicators positive is a signal for bullish confirmation to be re-established.
If price continues to weaken while open interest keeps sliding, that would be a counter-signal (a disproval) to this bullish move.
#XTZ #PHA #STRK # Contract recap
Live disclosure: This account currently holds $FOGO long positions. The related viewpoints in this post are consistent with the actual positions.
This content is assisted by Claude Fable 5 for generation, for informational reference only—please verify it yourself.
229
Contract Order Book Daily Report|9/10 Midday: Greed in sentiment, but positions are shrinking
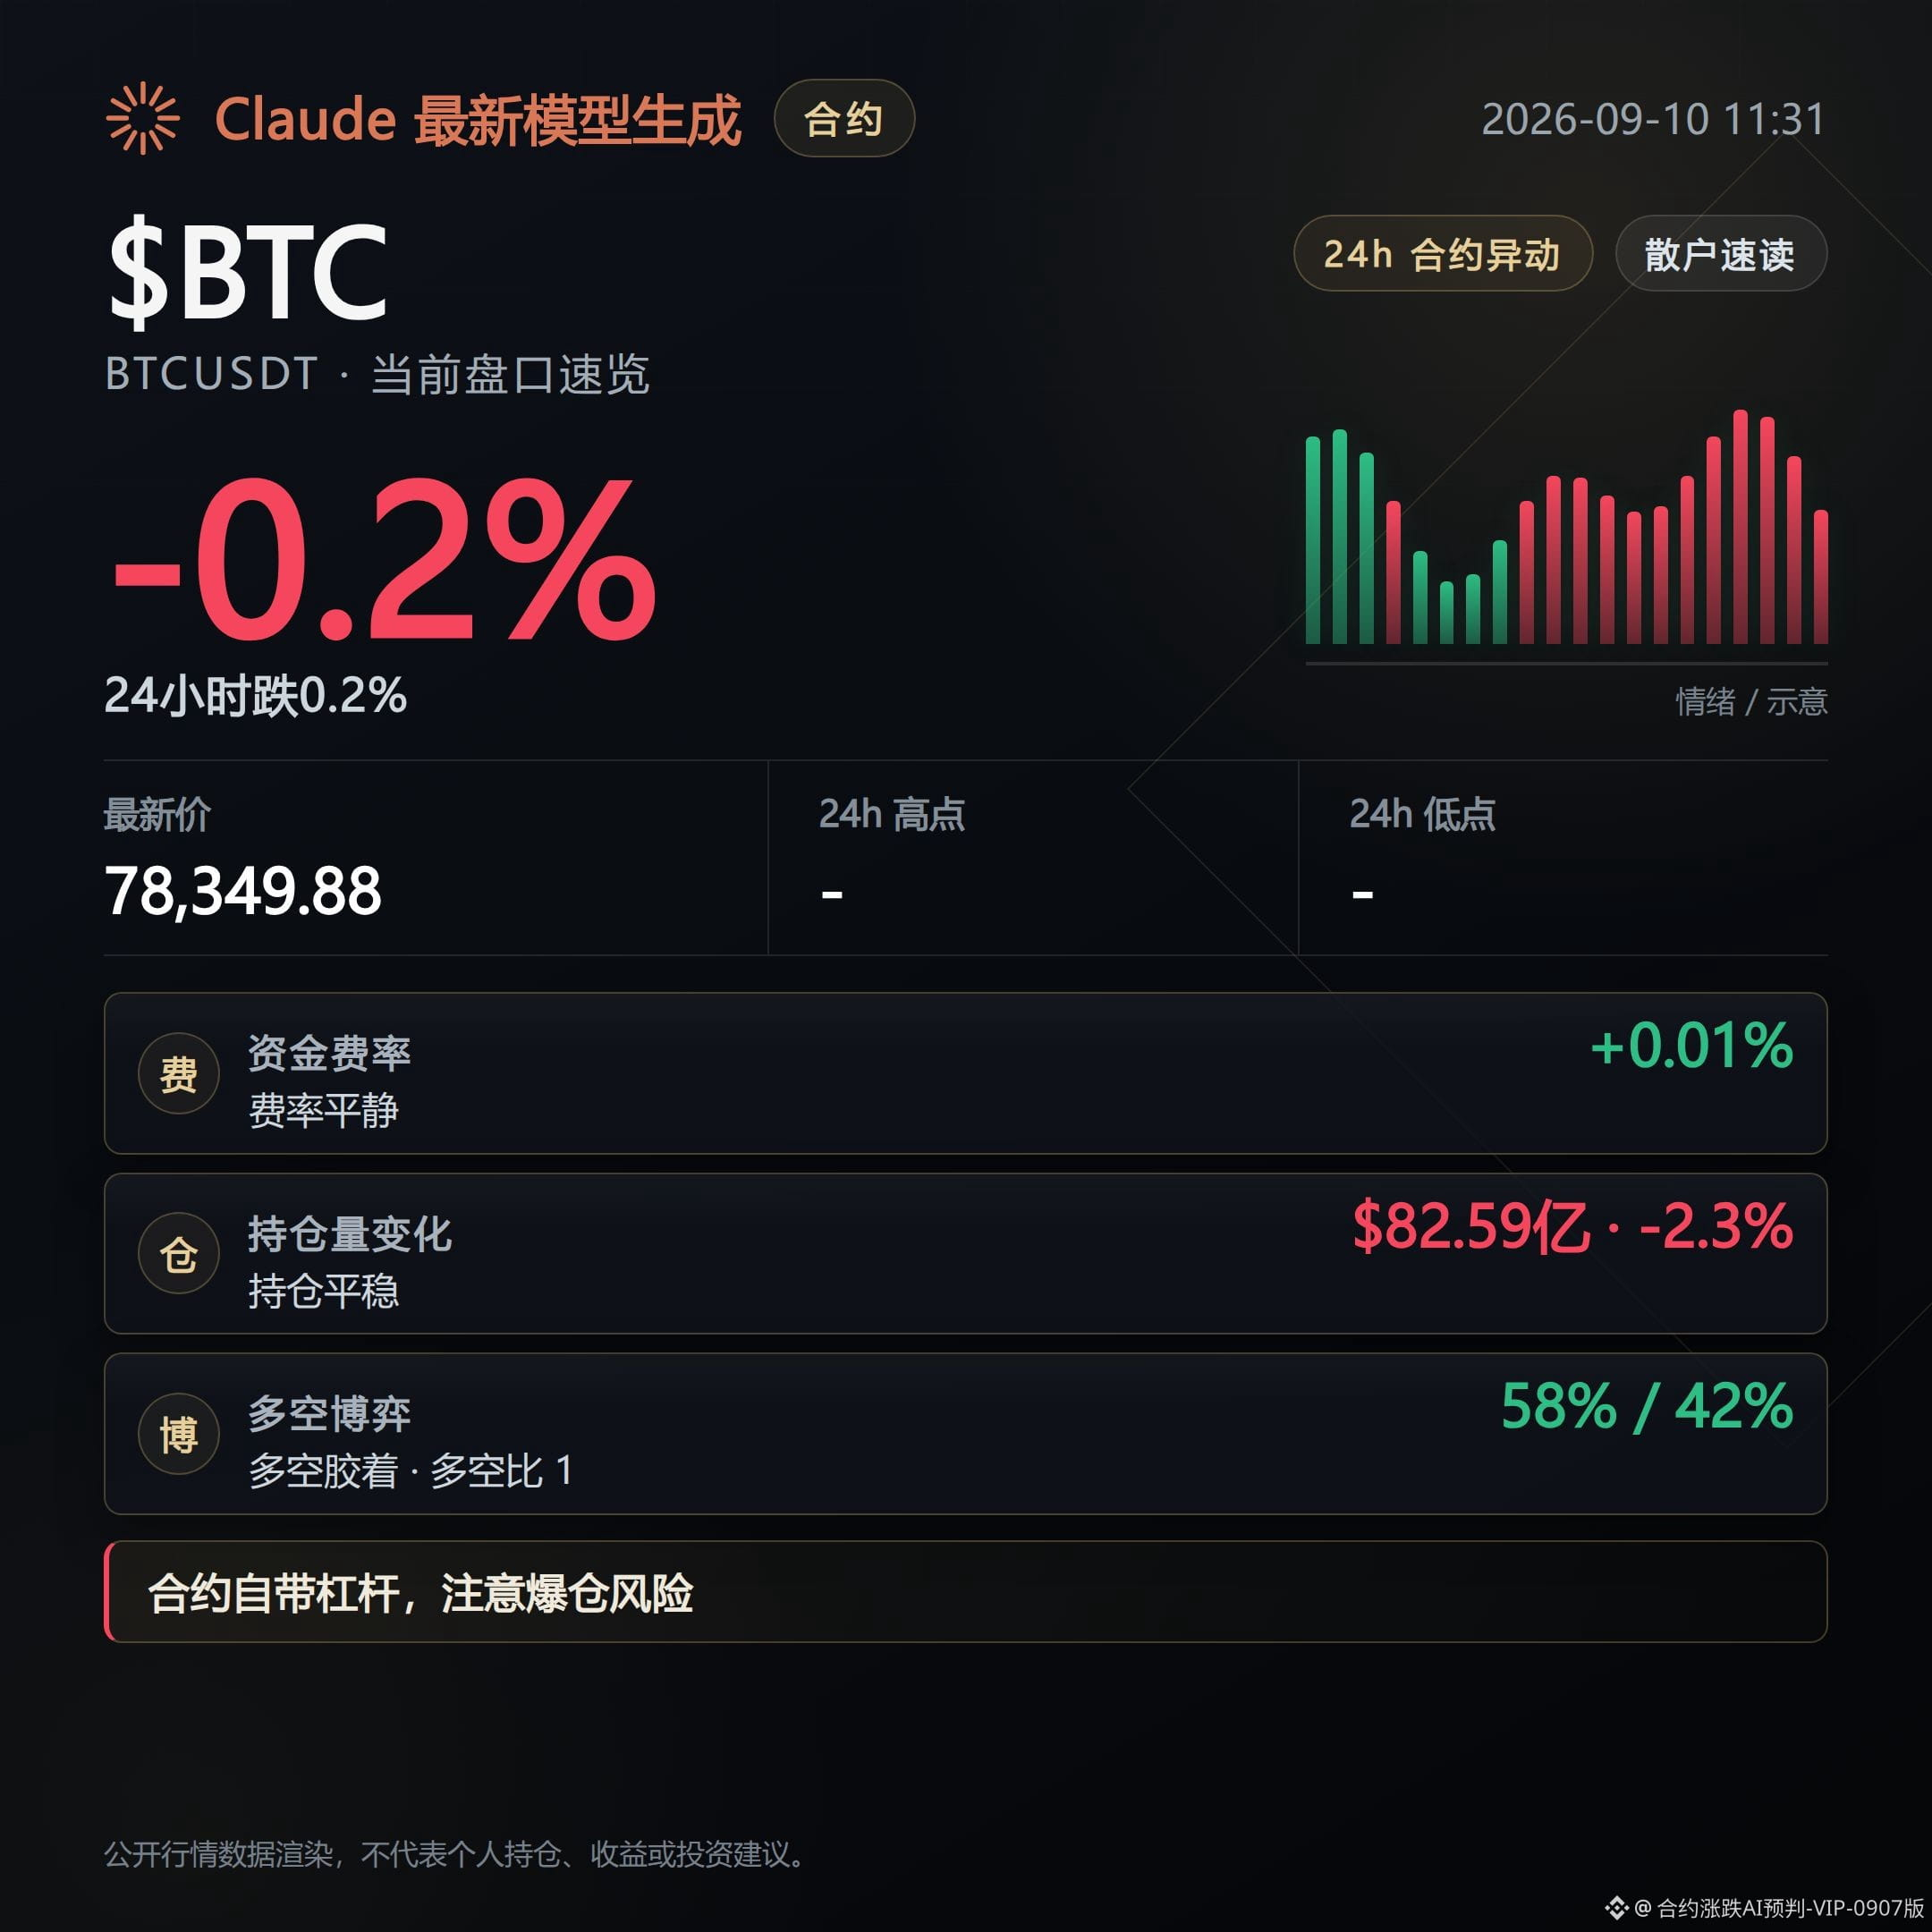
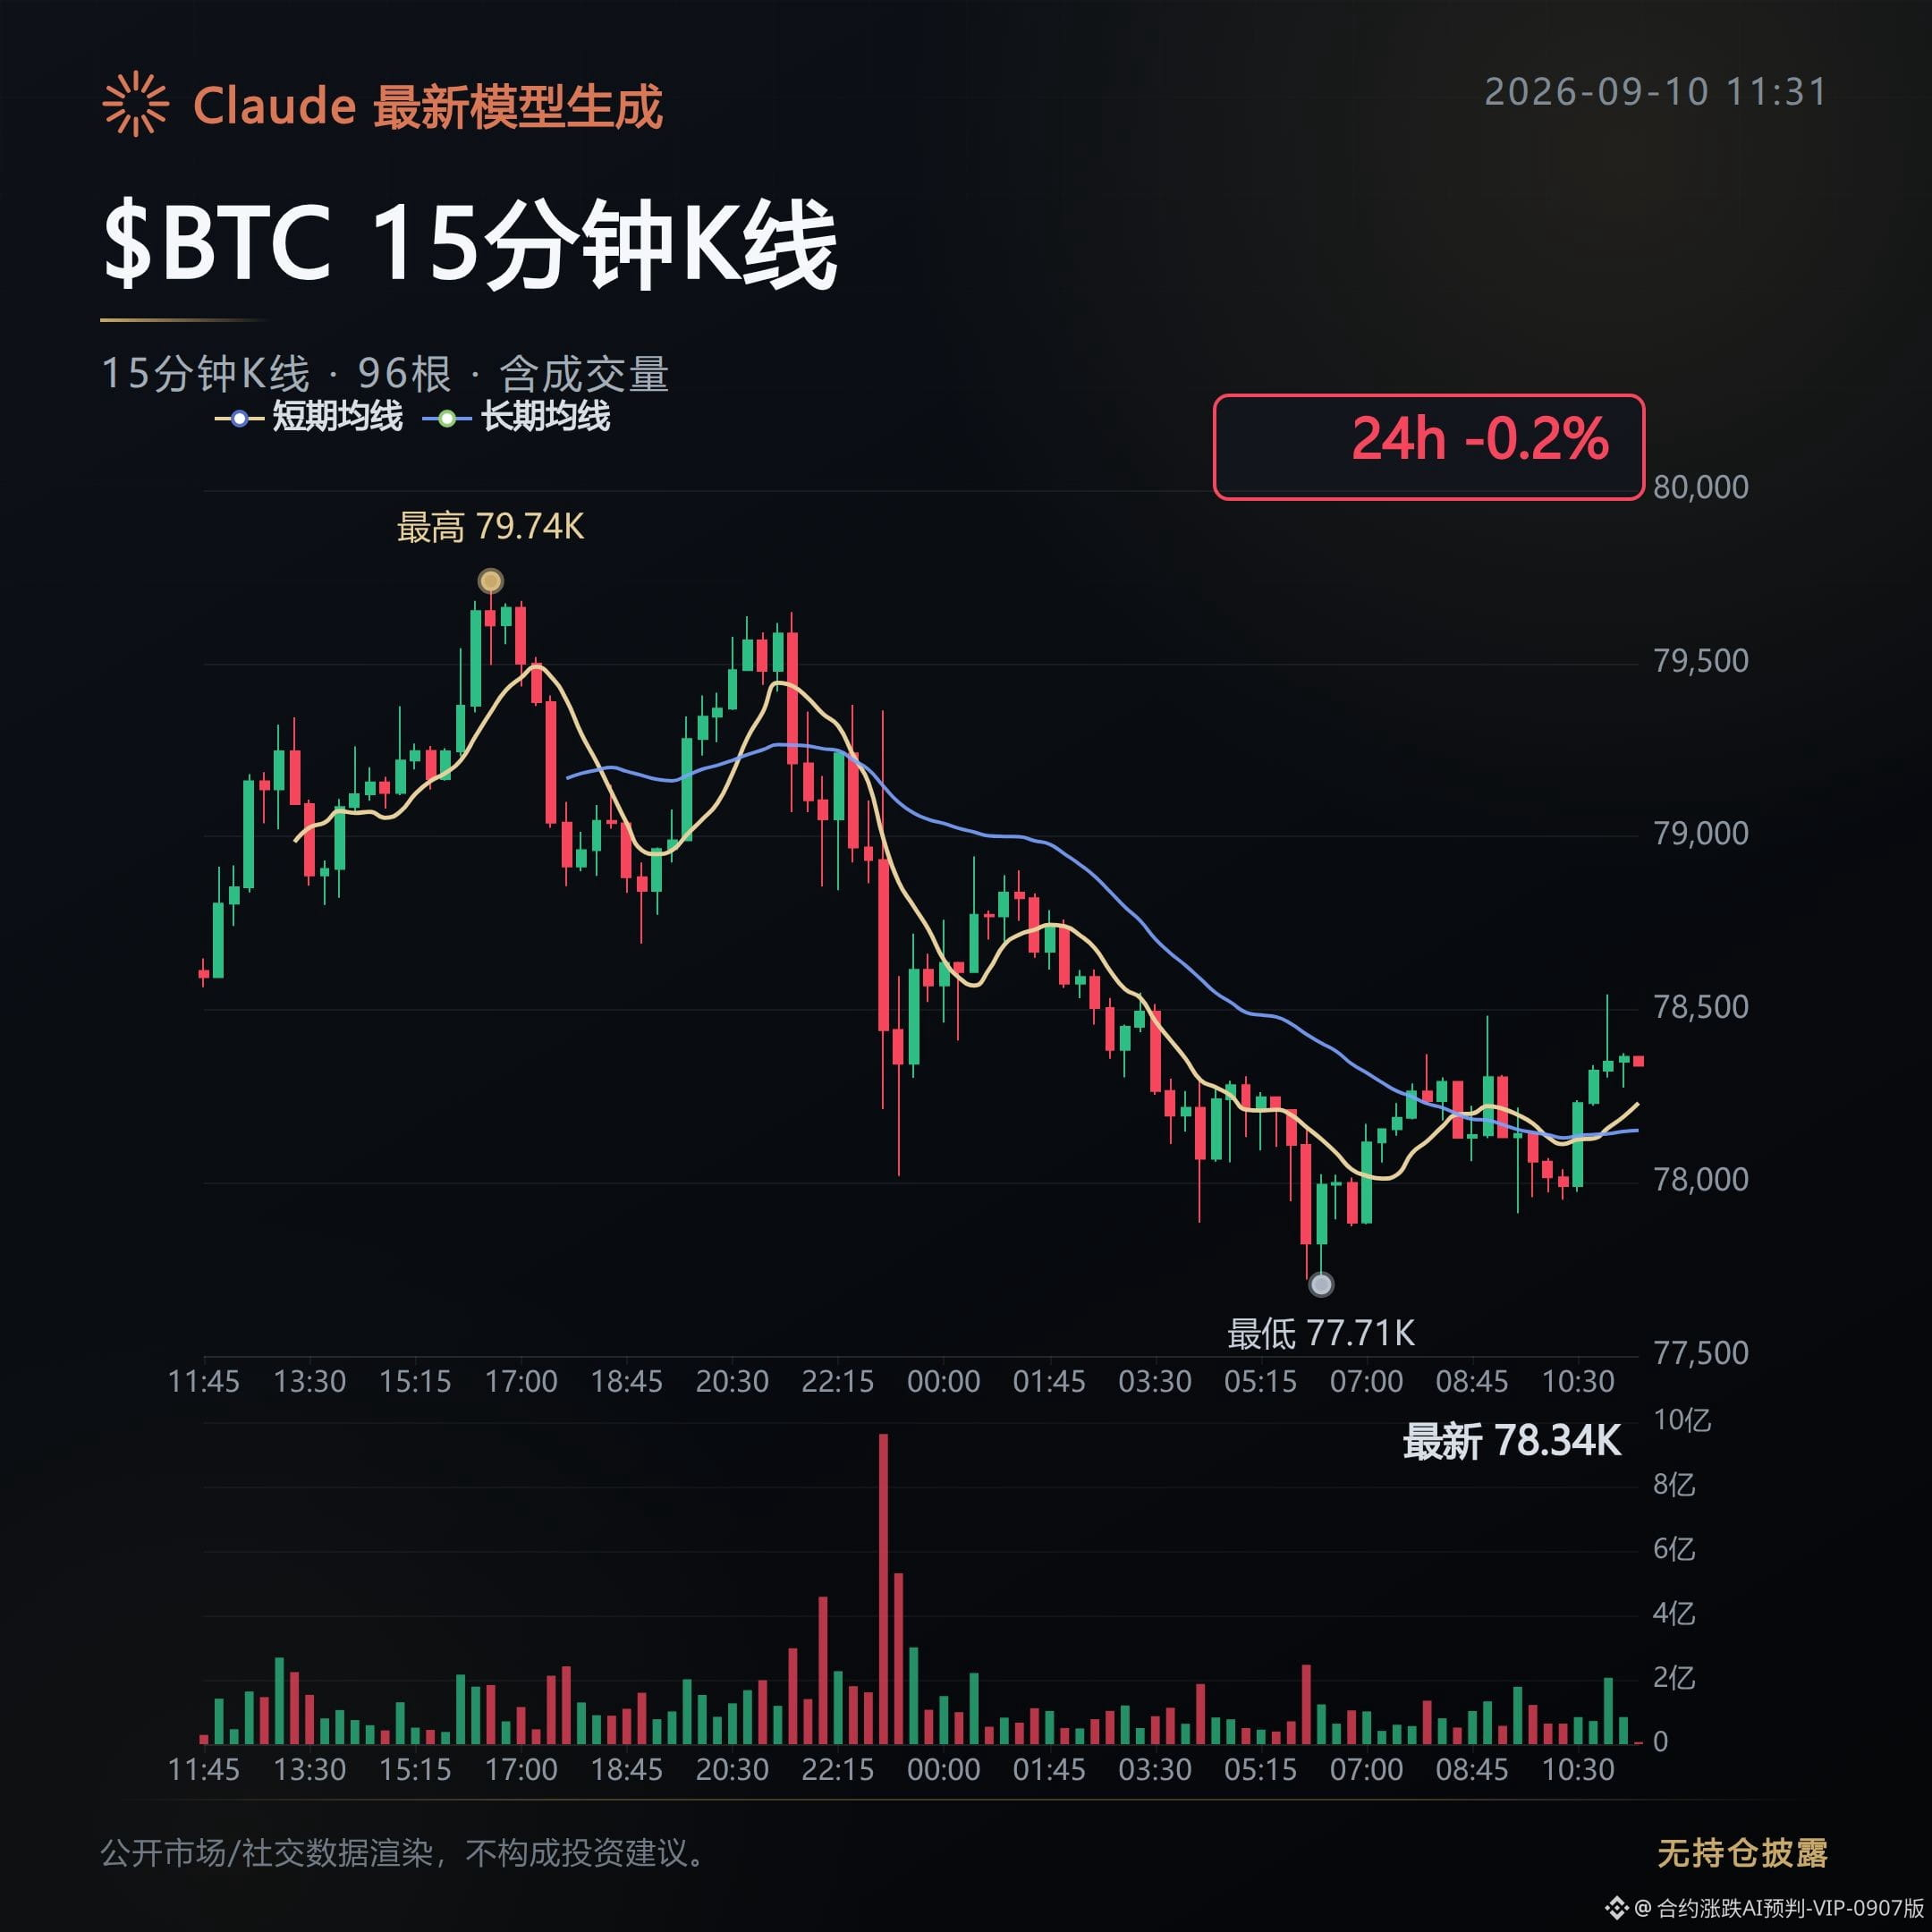
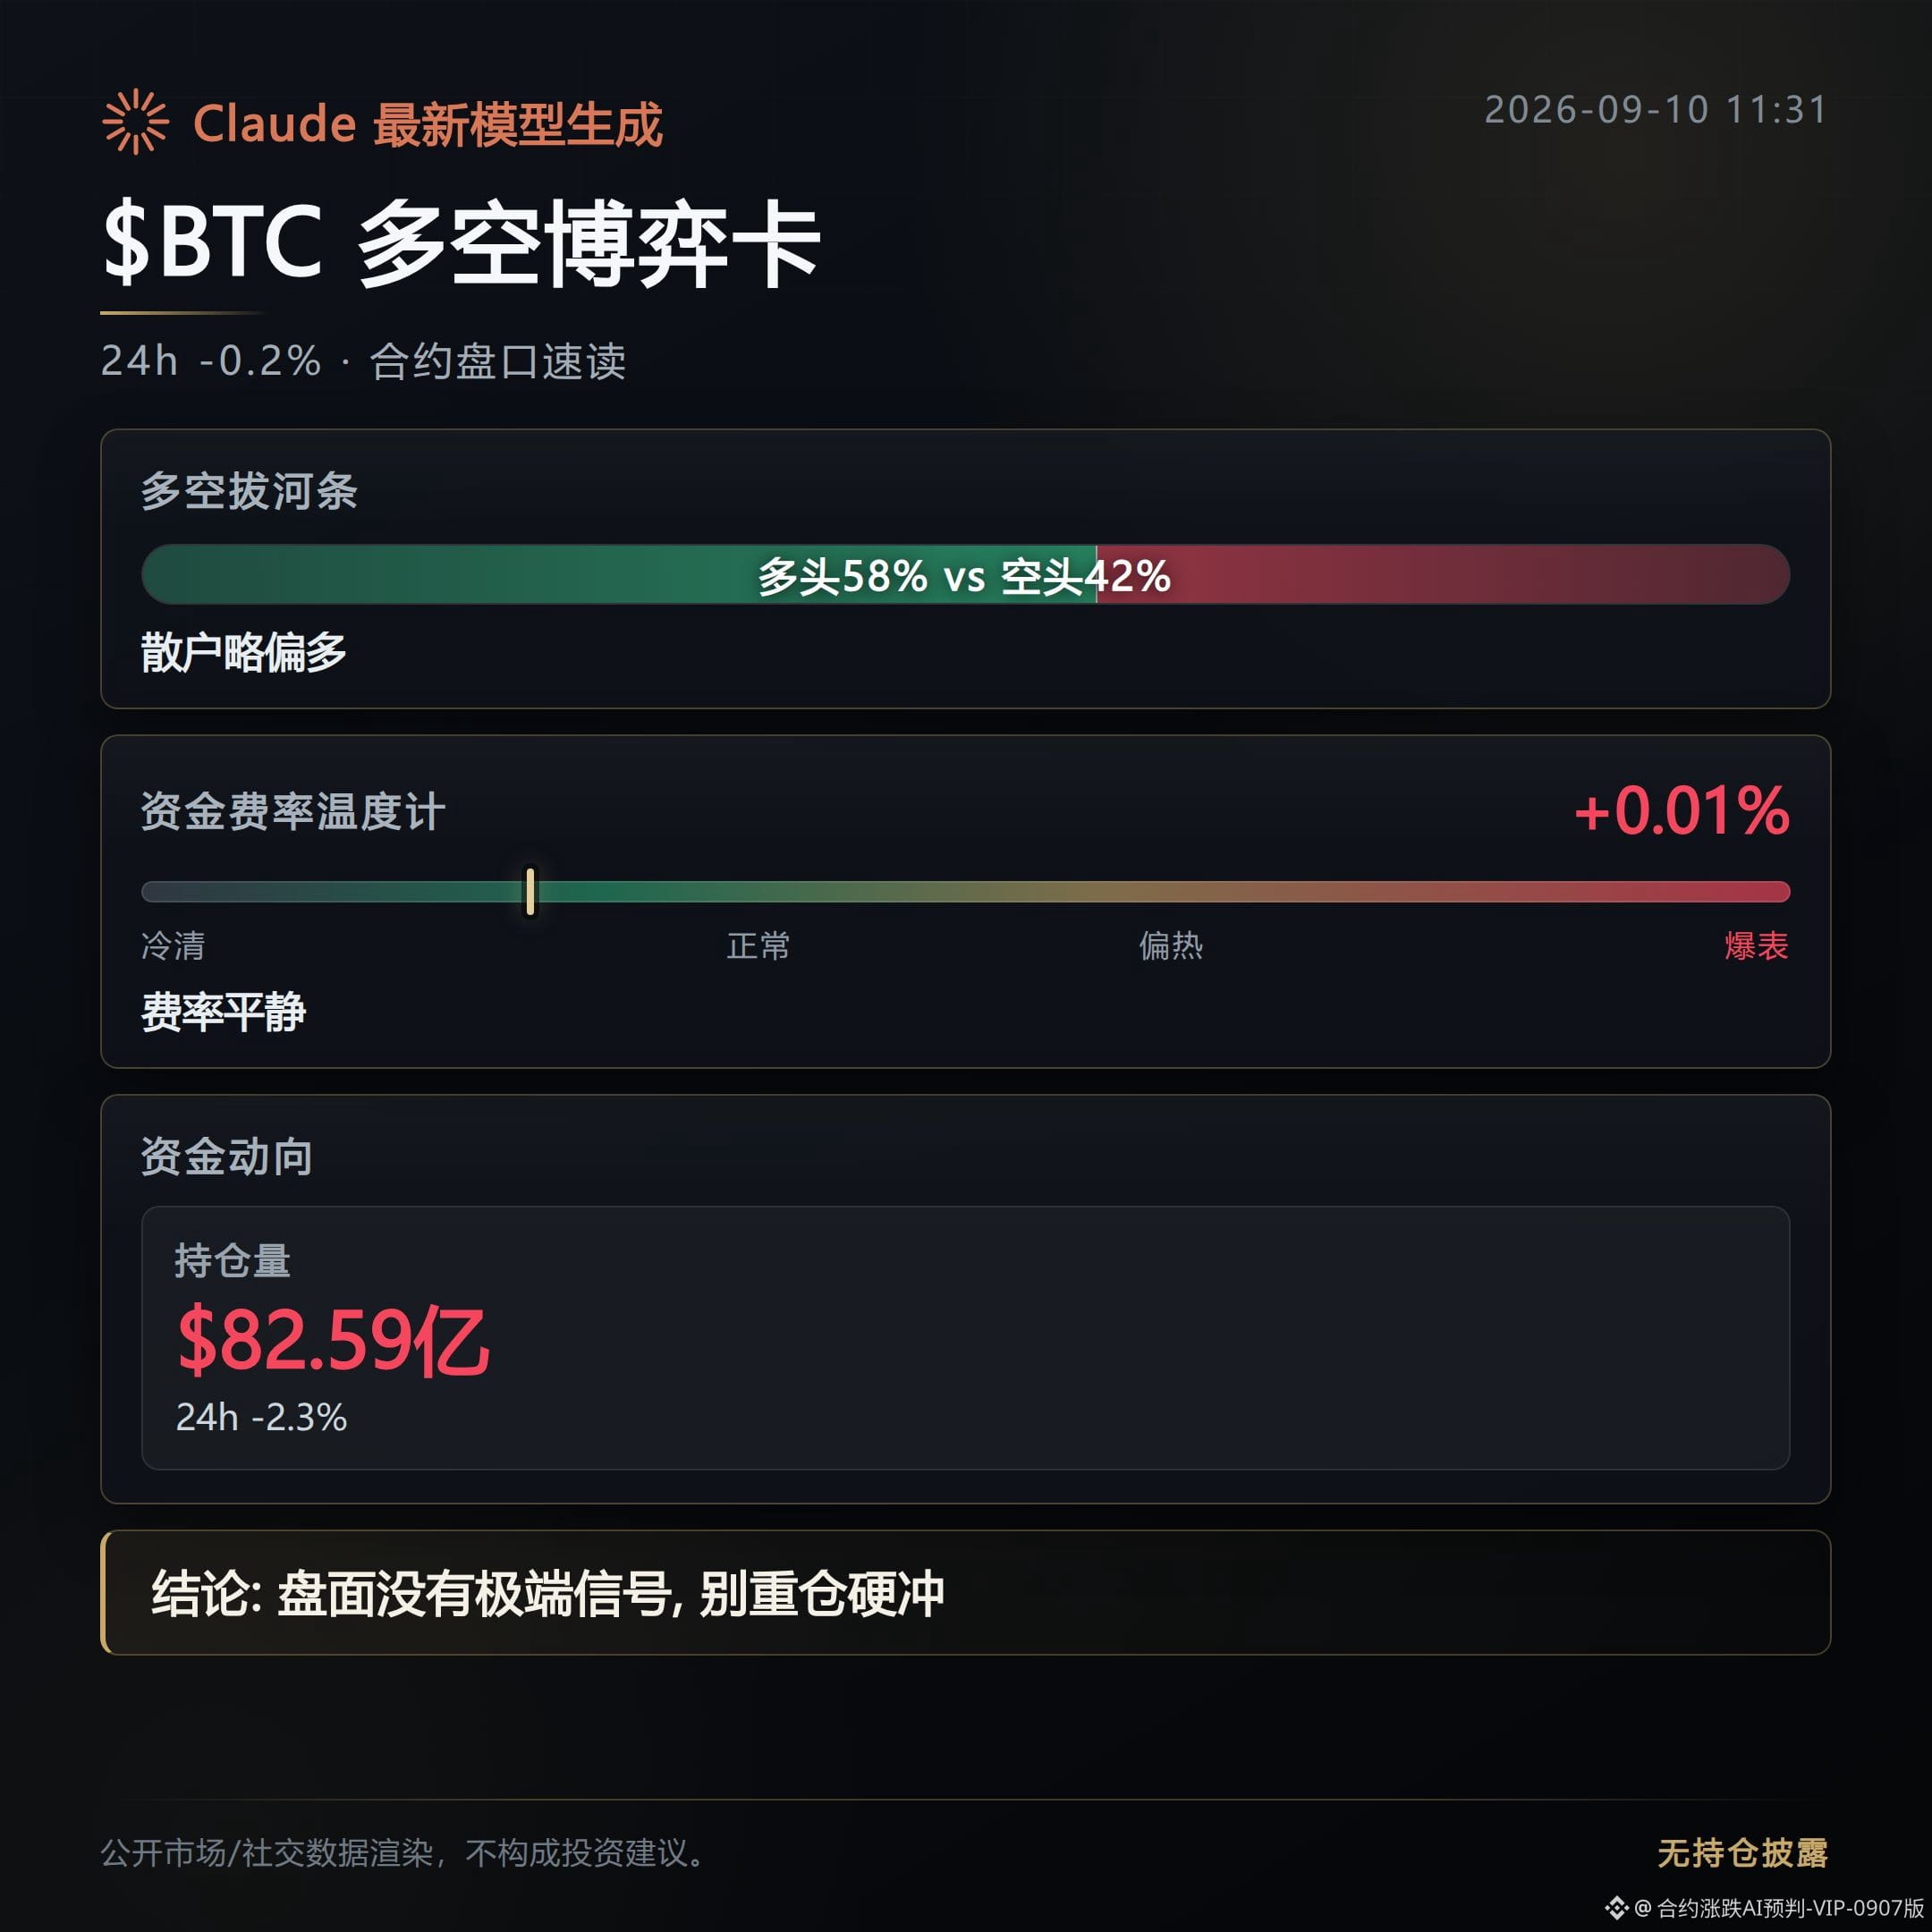
$BTC mark price 78,349.88 USD, down 0.25% over 24 hours; the funding rate of 0.0067% is still positive—longs are still placing buy orders to hold positions.
$ETH is down 0.44%, and its funding rate is also positive at 0.0049%.
$BNB has the largest drop, down 3.21% in 24 hours, but its funding rate is 0—leveraged positions aren’t panicking along with spot.
SOL is down 1.08%; the funding rate has turned negative to -0.009%, meaning shorts are actually paying longs instead.
BTC open interest is 8.259 billion USD, down 2.3% over 24 hours—this is a de-leveraging signal. When price falls, someone chooses to reduce exposure and exit rather than hold on.
Longs’ share is 58%, and the aggressive buy ratio is 0.85, indicating that among those staying, the buyers are still the主动 side.
The Fear & Greed Index is 69, in the greed zone. Price is falling, yet sentiment hasn’t turned pessimistic—this divergence is worth watching.
If greed can’t hold, reducing positions could shift from today’s “deleveraging” to the next “cutting losses.”
Smaller-cap coins show even clearer divergence.
IOST and VTHO funding rates have both dropped to around -1.9%. Shorts are crowded into these coins; once a rebound starts, they may get squeezed and blown up in the opposite direction.
CXMT funding rate is -0.515%, slightly less severe.
Conversely, coins like TEAM and URNM, where longs are crowded, have only just turned the funding rate positive, and the move is within 0.4%—no sign of overheating yet.
On the news front, these past few days have been paving the way for Bitcoin.
U.S. Treasury Secretary Bessent has publicly urged the Senate to pass the Clarity Act for crypto regulation as soon as possible. Block, the company under Dorsey, is also applying for a banking license—aiming to make Bitcoin business “mainstream” and legitimate.
However, looking at the derivatives order book, the leveraged side hasn’t added risk because of this kind of news. Funding rate and open interest are both being kept in check. The market looks more like it’s waiting for the bill to actually land, rather than using leverage to set up positions in advance.
Next, watch two things: First, whether BTC open interest will keep falling. If the Fear & Greed Index stays high but open interest begins to rise, that would indicate leverage is re-entering. Second, once crowded short coins like IOST and VTHO start to rebound, whether it triggers a chain of liquidations.
Live disclosure: This account currently holds FOGO long positions; the relevant views are consistent with the actual holdings.
Assisted by Claude Fable 5; the content is for market information reference only and does not constitute investment advice.
Contract Order Book Daily Report|9/10 Midday: Greed in sentiment, but positions are shrinking
$BTC mark price 78,349.88 USD, down 0.25% over 24 hours; the funding rate of 0.0067% is still positive—longs are still placing buy orders to hold positions.
$ETH is down 0.44%, and its funding rate is also positive at 0.0049%.
$BNB has the largest drop, down 3.21% in 24 hours, but its funding rate is 0—leveraged positions aren’t panicking along with spot.
SOL is down 1.08%; the funding rate has turned negative to -0.009%, meaning shorts are actually paying longs instead.
BTC open interest is 8.259 billion USD, down 2.3% over 24 hours—this is a de-leveraging signal. When price falls, someone chooses to reduce exposure and exit rather than hold on.
Longs’ share is 58%, and the aggressive buy ratio is 0.85, indicating that among those staying, the buyers are still the主动 side.
The Fear & Greed Index is 69, in the greed zone. Price is falling, yet sentiment hasn’t turned pessimistic—this divergence is worth watching.
If greed can’t hold, reducing positions could shift from today’s “deleveraging” to the next “cutting losses.”
Smaller-cap coins show even clearer divergence.
IOST and VTHO funding rates have both dropped to around -1.9%. Shorts are crowded into these coins; once a rebound starts, they may get squeezed and blown up in the opposite direction.
CXMT funding rate is -0.515%, slightly less severe.
Conversely, coins like TEAM and URNM, where longs are crowded, have only just turned the funding rate positive, and the move is within 0.4%—no sign of overheating yet.
On the news front, these past few days have been paving the way for Bitcoin.
U.S. Treasury Secretary Bessent has publicly urged the Senate to pass the Clarity Act for crypto regulation as soon as possible. Block, the company under Dorsey, is also applying for a banking license—aiming to make Bitcoin business “mainstream” and legitimate.
However, looking at the derivatives order book, the leveraged side hasn’t added risk because of this kind of news. Funding rate and open interest are both being kept in check. The market looks more like it’s waiting for the bill to actually land, rather than using leverage to set up positions in advance.
Next, watch two things: First, whether BTC open interest will keep falling. If the Fear & Greed Index stays high but open interest begins to rise, that would indicate leverage is re-entering. Second, once crowded short coins like IOST and VTHO start to rebound, whether it triggers a chain of liquidations.
Live disclosure: This account currently holds FOGO long positions; the relevant views are consistent with the actual holdings.
Assisted by Claude Fable 5; the content is for market information reference only and does not constitute investment advice.
$BTC mark price 78,349.88 USD, down 0.25% over 24 hours; the funding rate of 0.0067% is still positive—longs are still placing buy orders to hold positions.
$ETH is down 0.44%, and its funding rate is also positive at 0.0049%.
$BNB has the largest drop, down 3.21% in 24 hours, but its funding rate is 0—leveraged positions aren’t panicking along with spot.
SOL is down 1.08%; the funding rate has turned negative to -0.009%, meaning shorts are actually paying longs instead.
BTC open interest is 8.259 billion USD, down 2.3% over 24 hours—this is a de-leveraging signal. When price falls, someone chooses to reduce exposure and exit rather than hold on.
Longs’ share is 58%, and the aggressive buy ratio is 0.85, indicating that among those staying, the buyers are still the主动 side.
The Fear & Greed Index is 69, in the greed zone. Price is falling, yet sentiment hasn’t turned pessimistic—this divergence is worth watching.
If greed can’t hold, reducing positions could shift from today’s “deleveraging” to the next “cutting losses.”
Smaller-cap coins show even clearer divergence.
IOST and VTHO funding rates have both dropped to around -1.9%. Shorts are crowded into these coins; once a rebound starts, they may get squeezed and blown up in the opposite direction.
CXMT funding rate is -0.515%, slightly less severe.
Conversely, coins like TEAM and URNM, where longs are crowded, have only just turned the funding rate positive, and the move is within 0.4%—no sign of overheating yet.
On the news front, these past few days have been paving the way for Bitcoin.
U.S. Treasury Secretary Bessent has publicly urged the Senate to pass the Clarity Act for crypto regulation as soon as possible. Block, the company under Dorsey, is also applying for a banking license—aiming to make Bitcoin business “mainstream” and legitimate.
However, looking at the derivatives order book, the leveraged side hasn’t added risk because of this kind of news. Funding rate and open interest are both being kept in check. The market looks more like it’s waiting for the bill to actually land, rather than using leverage to set up positions in advance.
Next, watch two things: First, whether BTC open interest will keep falling. If the Fear & Greed Index stays high but open interest begins to rise, that would indicate leverage is re-entering. Second, once crowded short coins like IOST and VTHO start to rebound, whether it triggers a chain of liquidations.
Live disclosure: This account currently holds FOGO long positions; the relevant views are consistent with the actual holdings.
Assisted by Claude Fable 5; the content is for market information reference only and does not constitute investment advice.
353
Top 3 on the 24H Contract Gainers List · In-depth breakdown
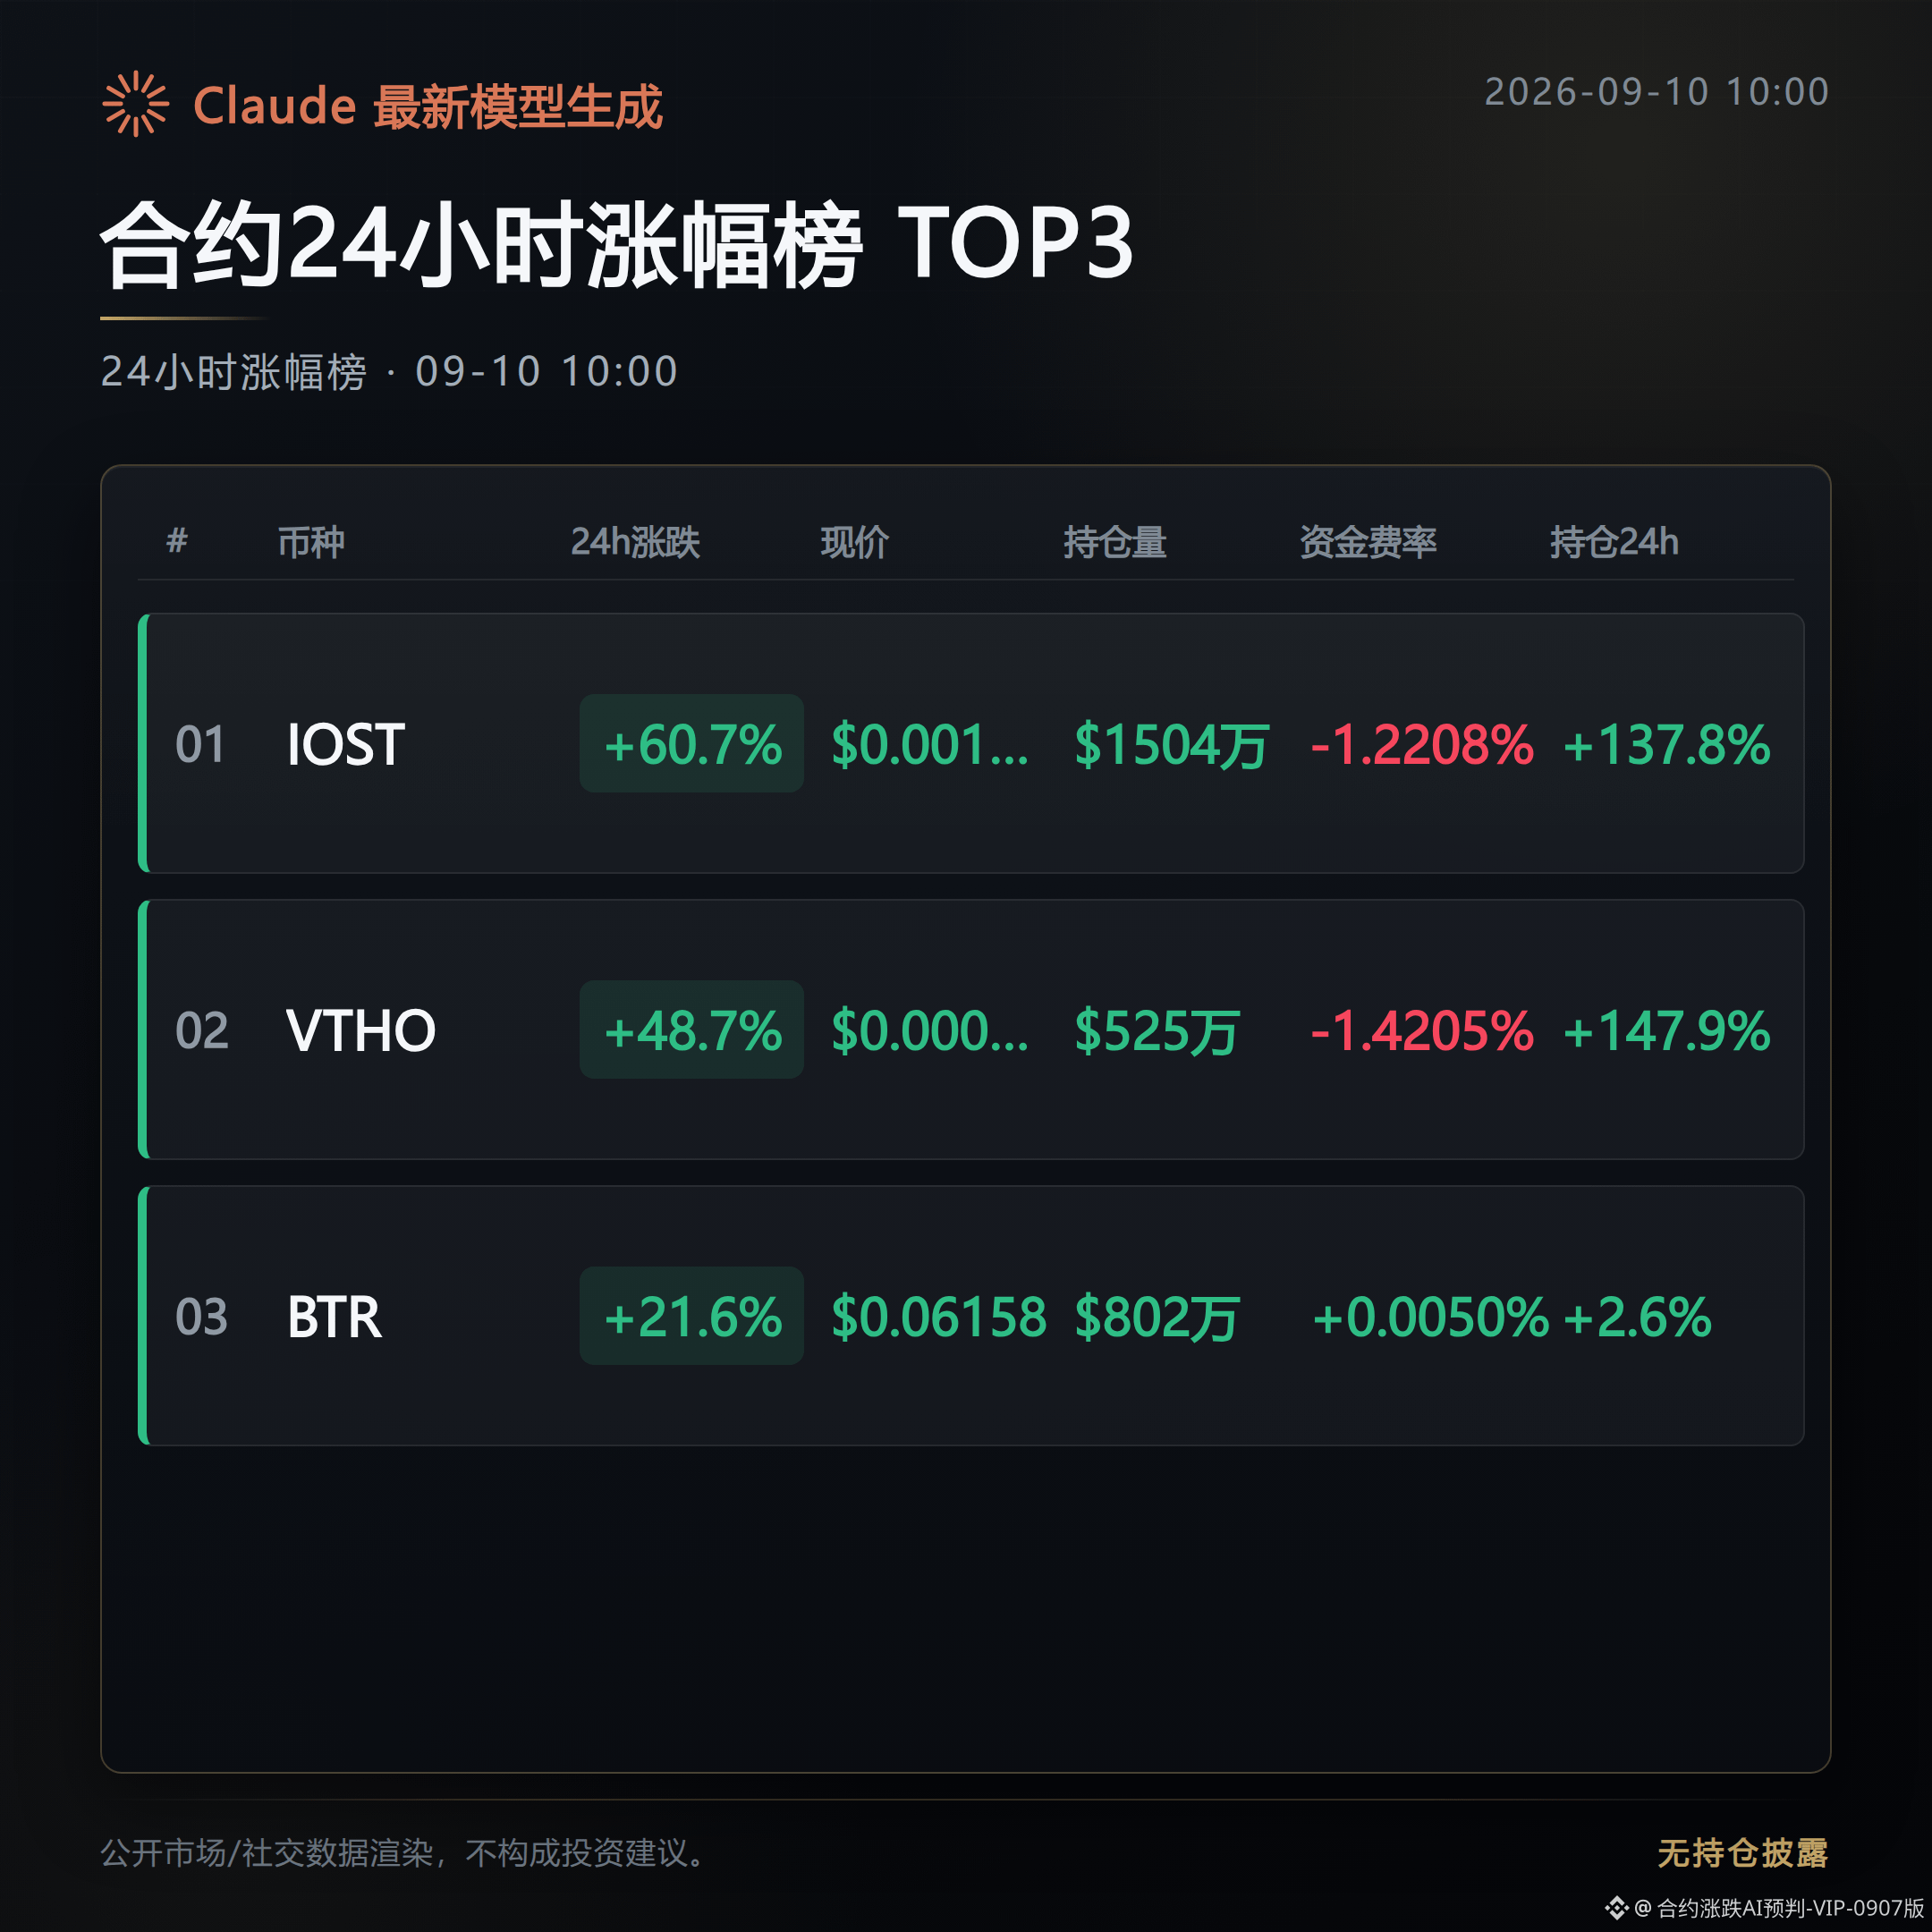
The current top three on Binance’s 24-hour contract gainers list are IOST, VTHO, and BTR.
The funding rates, changes in open interest, and the long/short positioning structure of the three contracts form different combinations, making them suitable to cross-check directly against the order book.
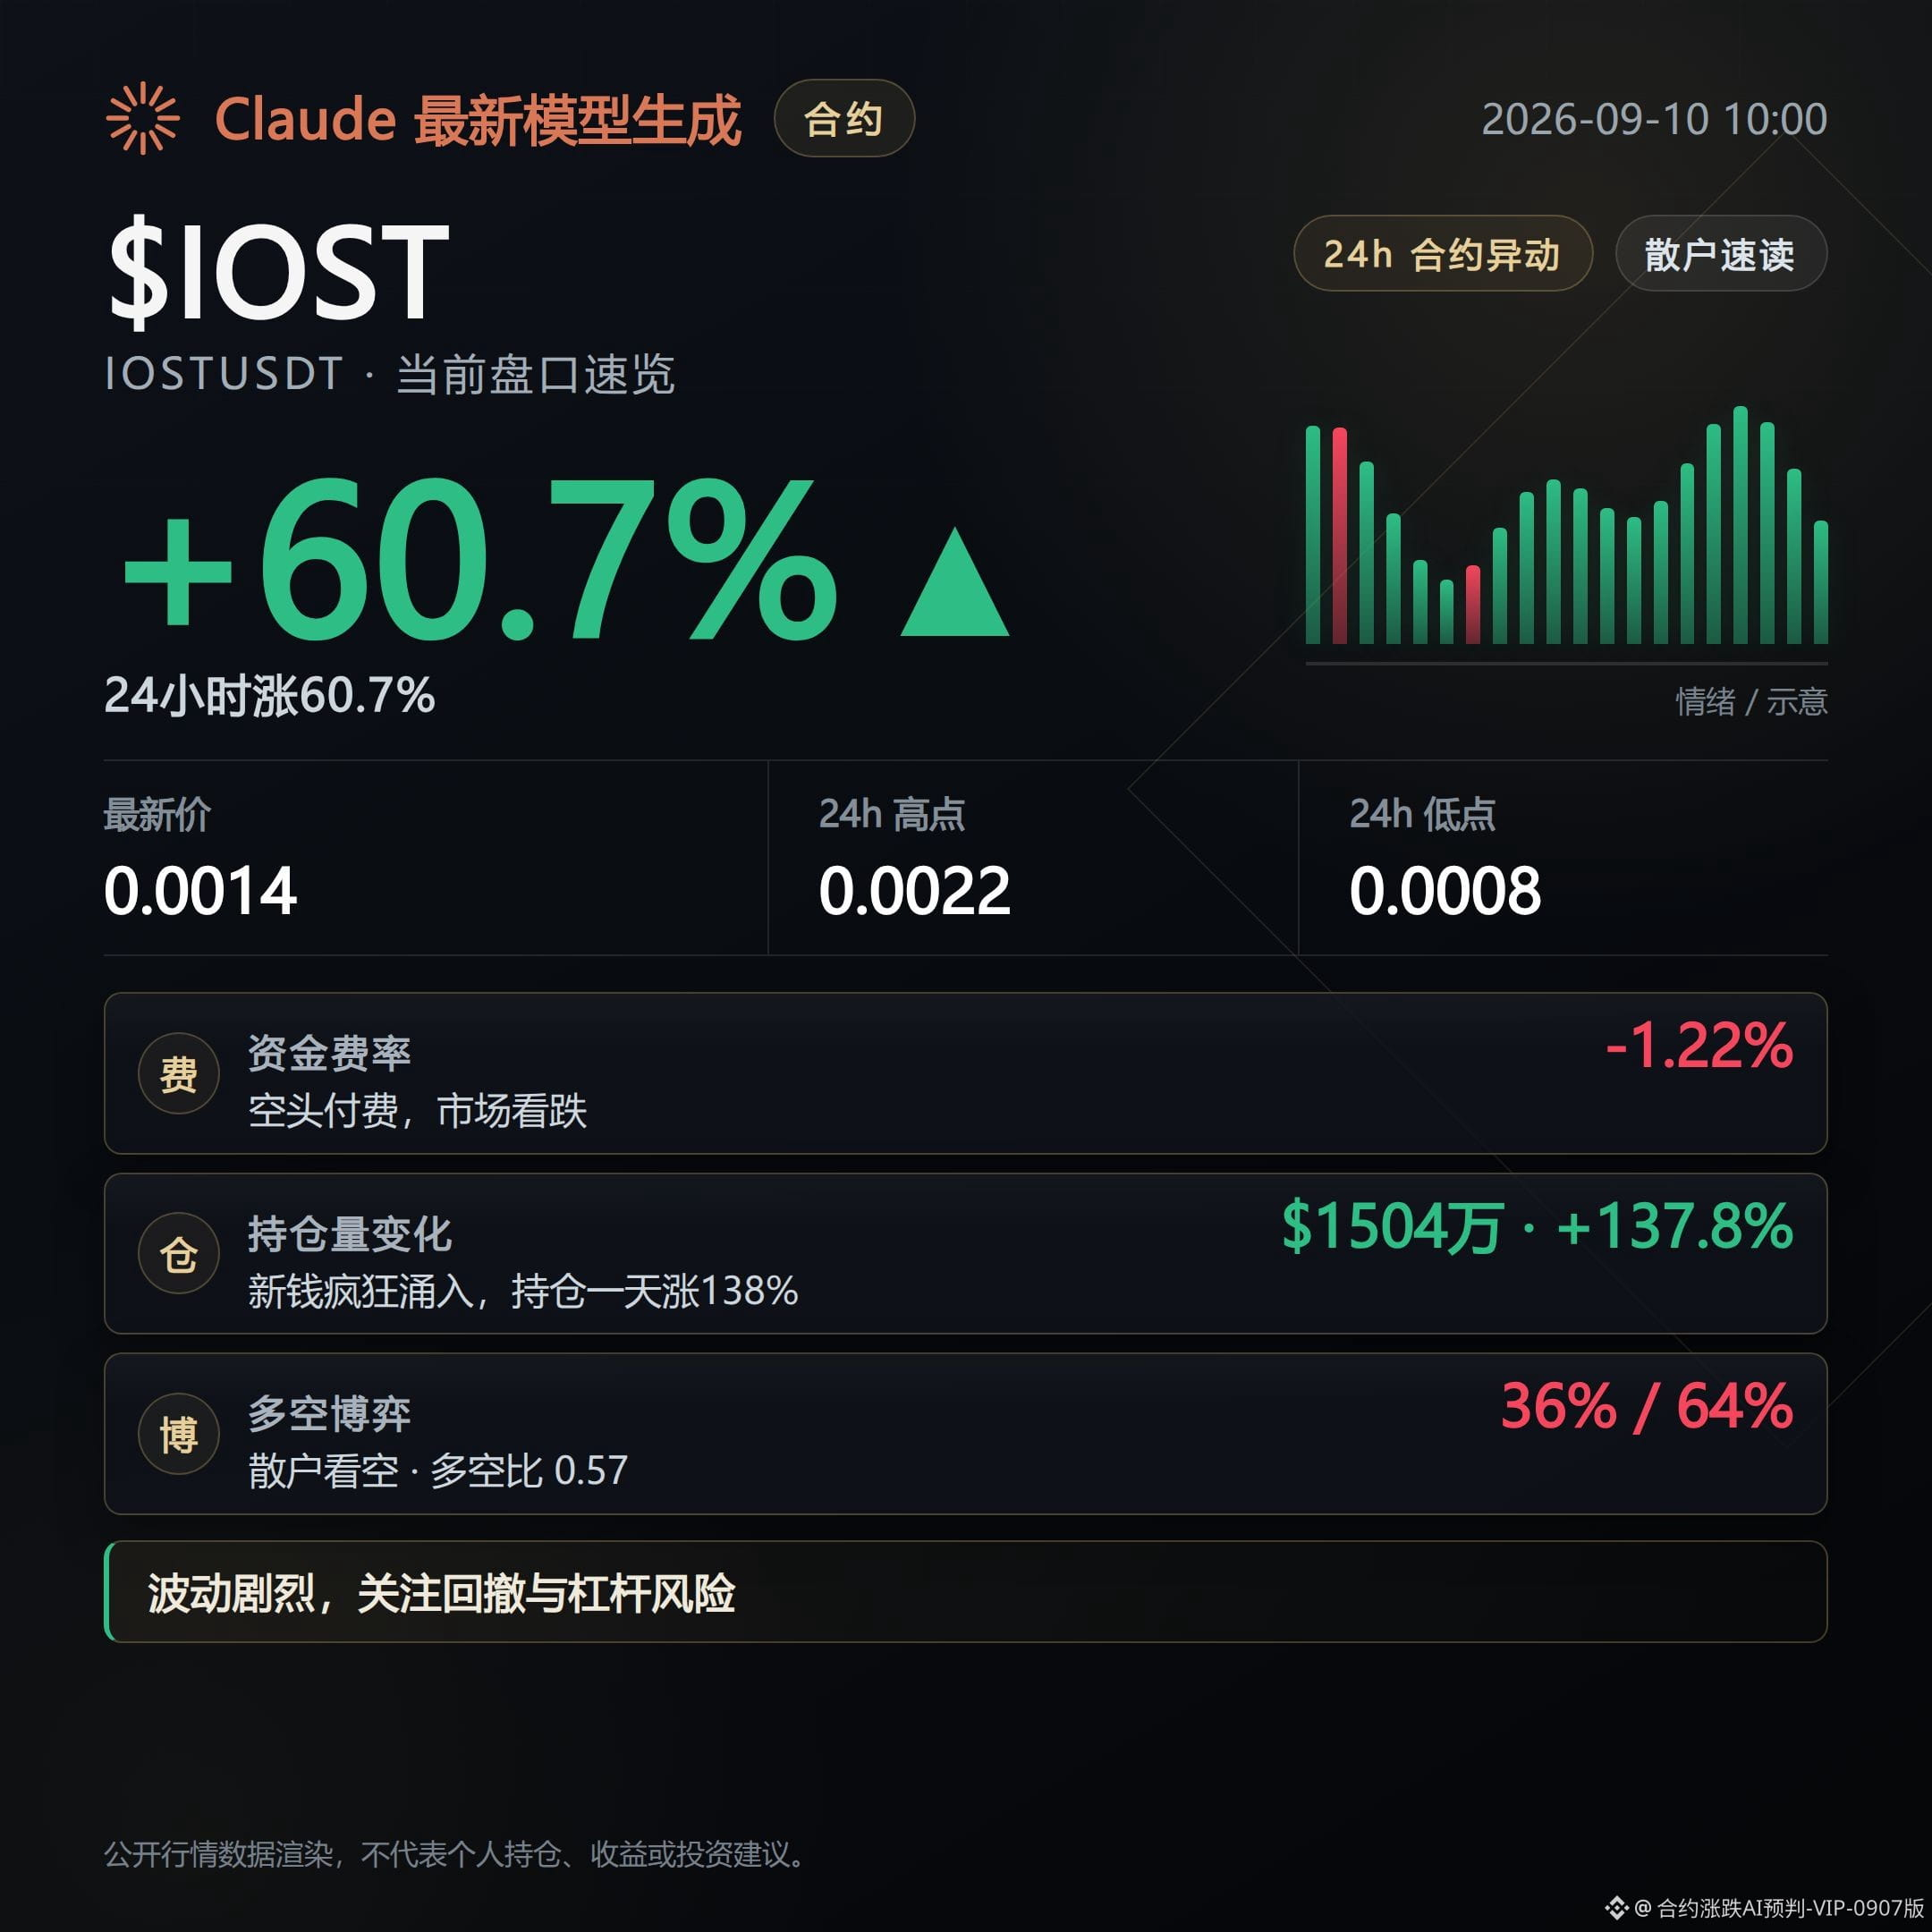
IOST 24H gain: 60.74%, currently #1 on the gainers list.
Trading volume over 24 hours reached $1.153 billion, and open interest surged 137.8% quarter-over-quarter (24H), but the last 1 hour quarter-over-quarter turned to a decline of 22.7%.
Funding rate is -1.2208%, and shorts have been paying for 4 consecutive periods. The top whale long/short ratio is 0.85, below 1, and the on-exchange funding structure still clearly leans toward bearish positioning.
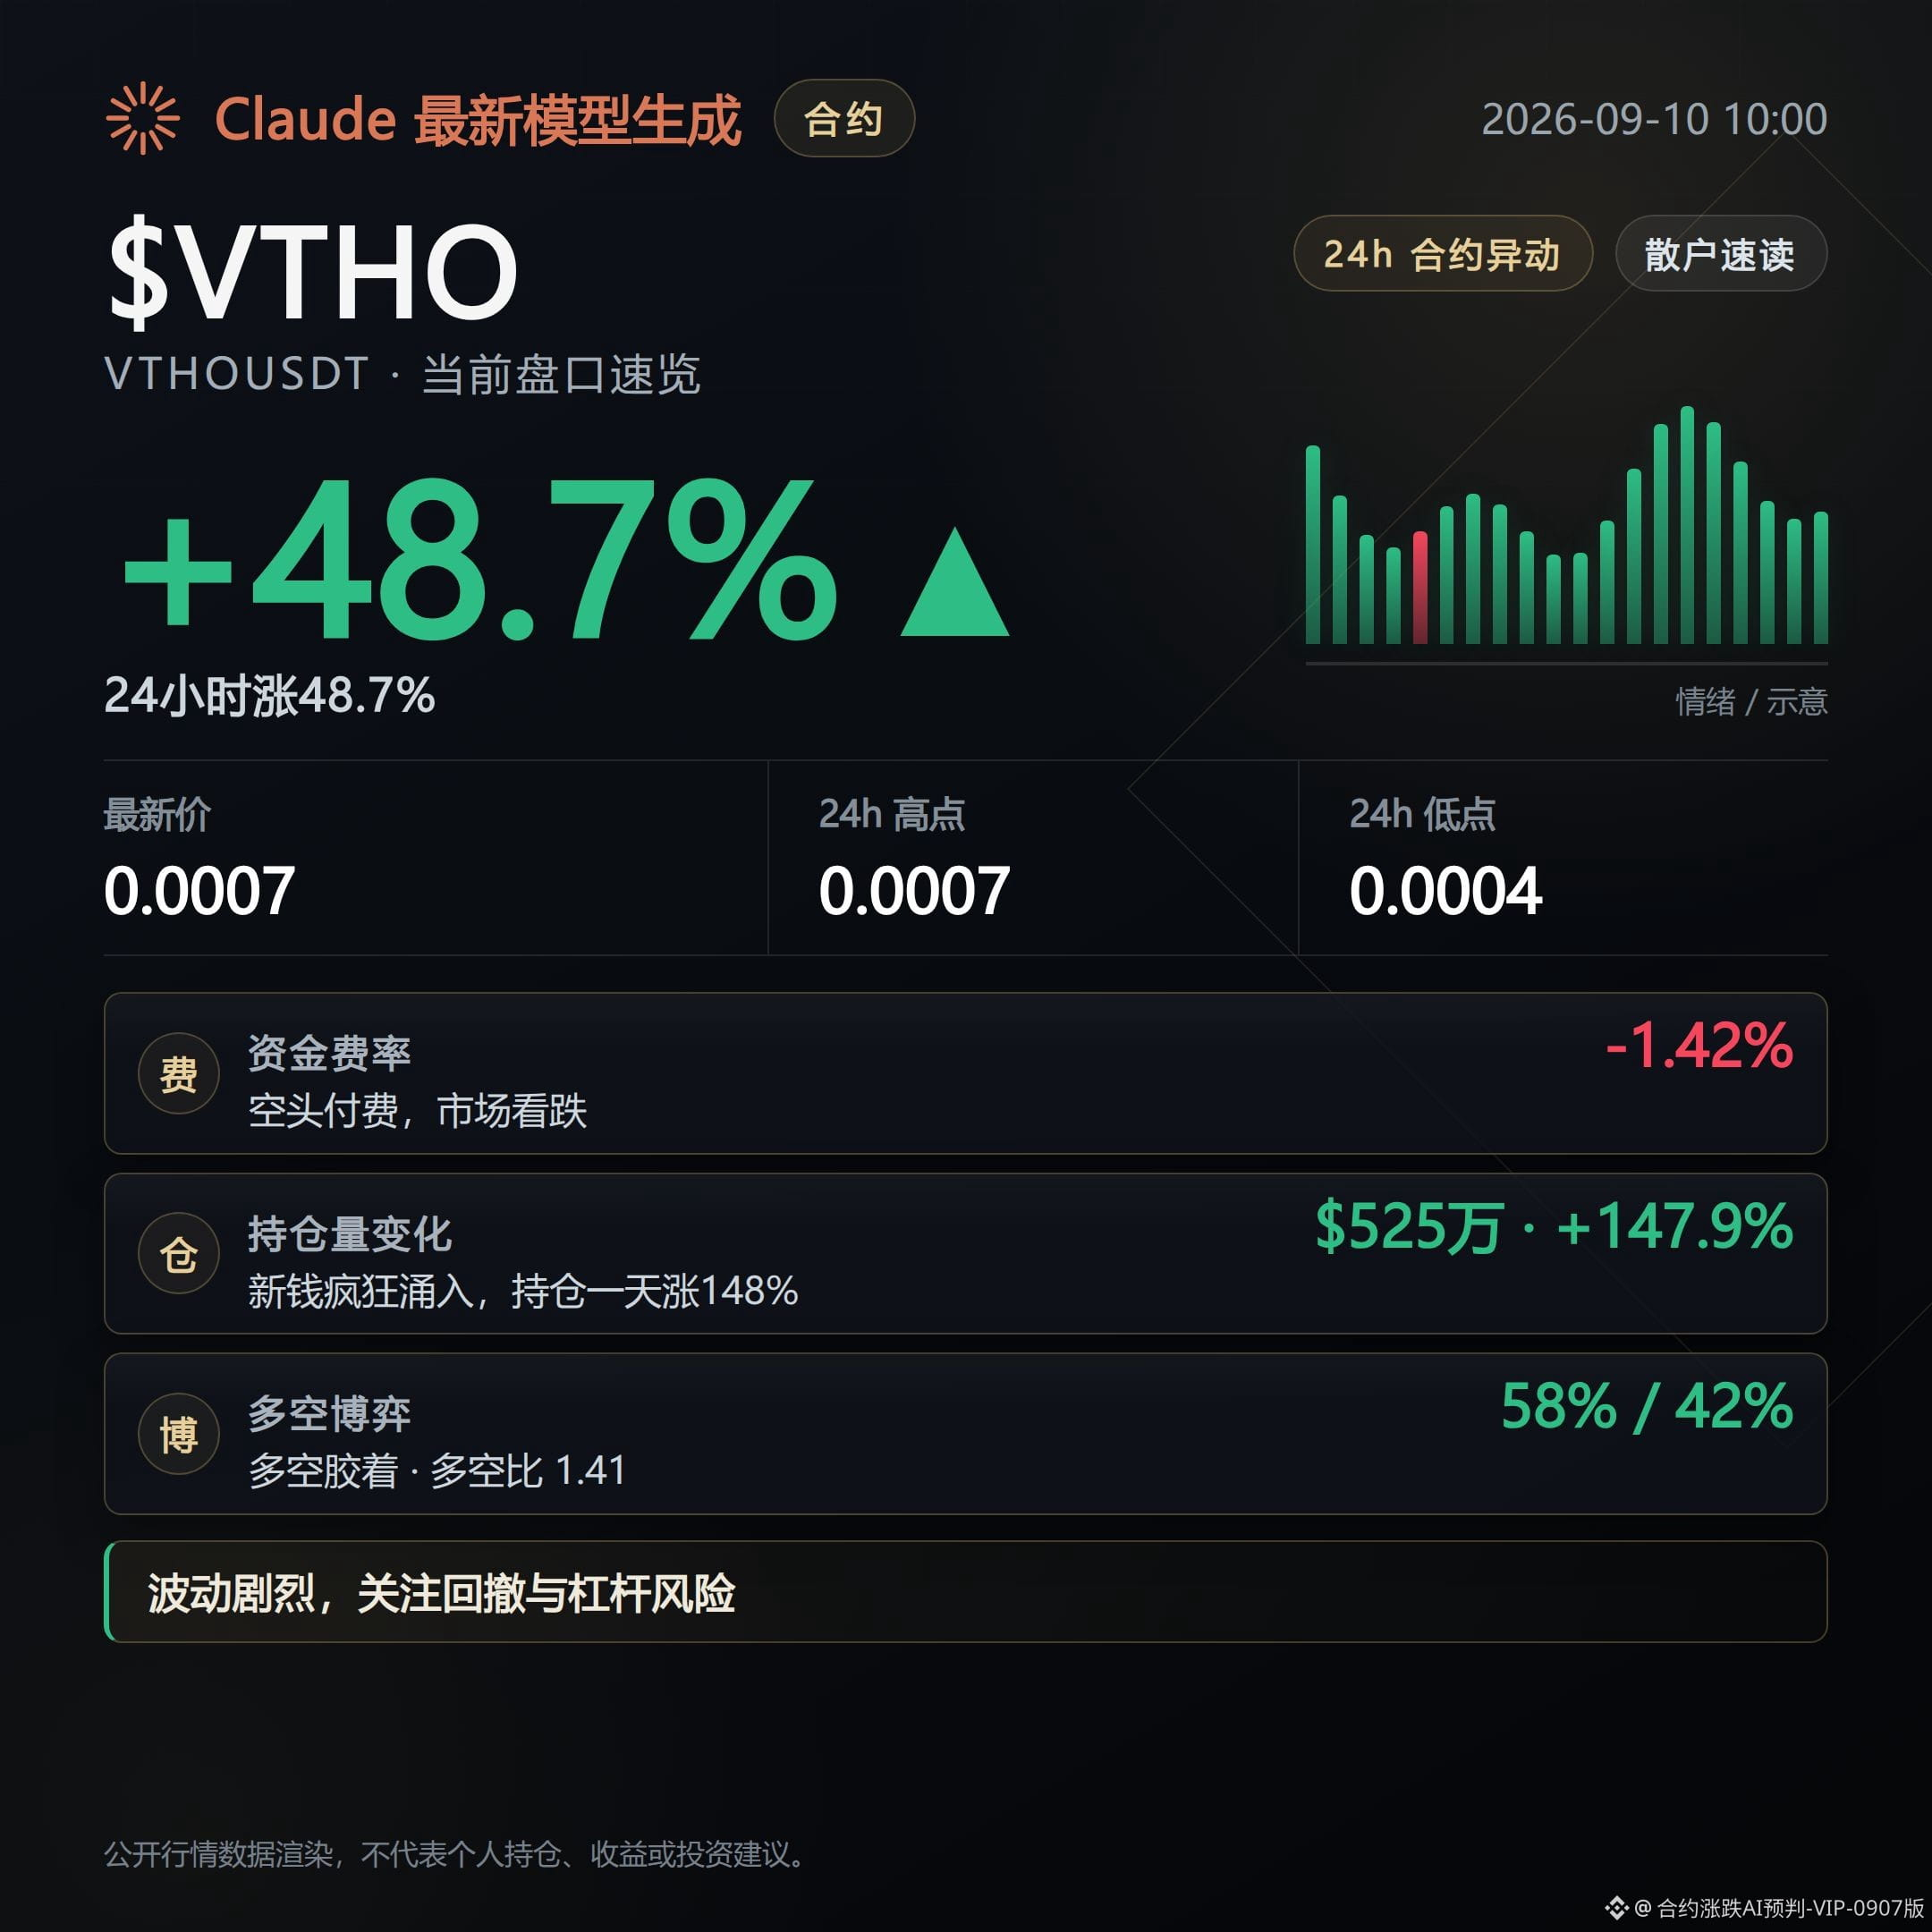
VTHO 24H gain: 48.68%, ranking #2 on the gainers list.
Open interest over 24 hours increased 147.9%, and in the last 1 hour it is still accelerating with a quarter-over-quarter increase of 171.2%. The pace of adding positions is steeper than the price’s rise.
The relative strength indicator is 92.8, in the overbought range. Funding rate is -1.4205%, meaning the on-exchange side is being paid by shorts.
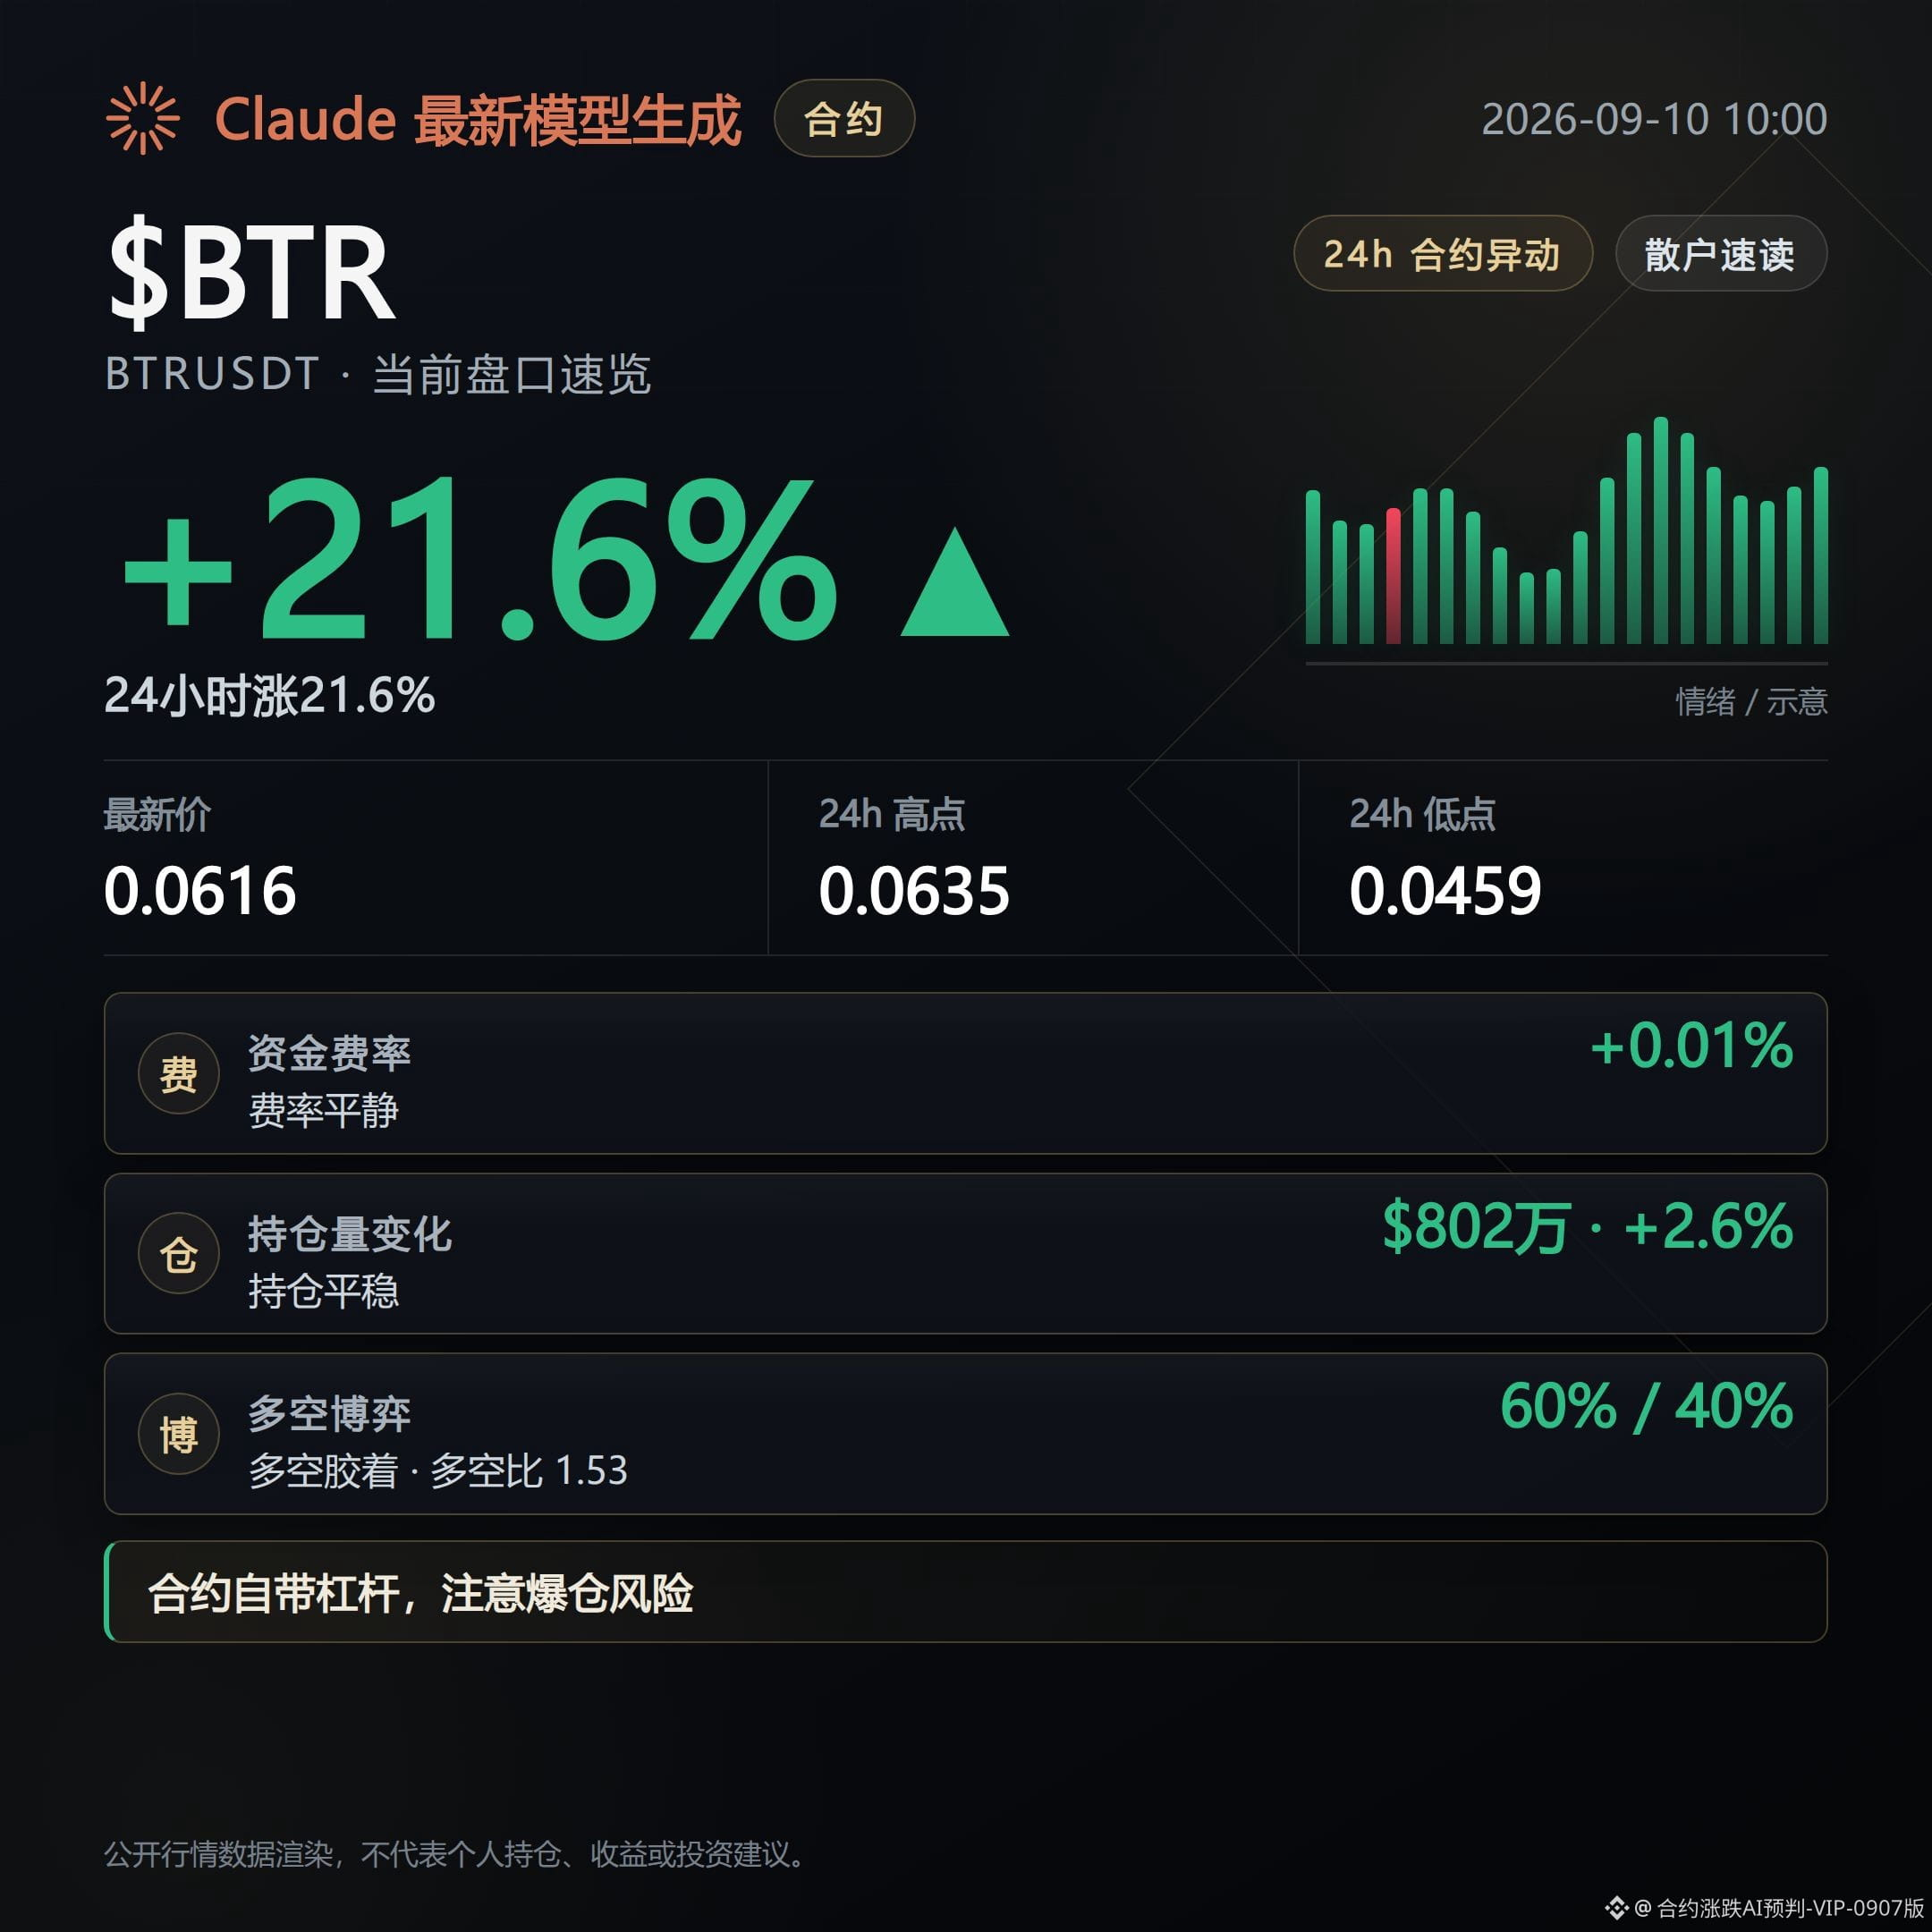
BTR 24H gain: 21.6%, ranking #3 on the gainers list.
Trading volume is $40.74 million. Open interest over 24 hours increased only 2.6%, so the gain is not mainly driven by newly added positions.
In the last 1 hour, open interest quarter-over-quarter turned to a decline of 10.9%, and the funding rate is close to 0 at 0.005%, indicating that fee/pressure from both long and short sides is not significant.
All three contracts share a common, verifiable signal: open interest’s quarter-over-quarter growth rate is generally running ahead of the price gain (IOST 137.8%, VTHO 147.9%, and BTR is relatively mild at only 2.6%), while open interest quarter-over-quarter has already diverged in the most recent 1 hour—IOST and BTR both switched to declining.
This combination—“the gain is built up by adding positions, and short-term open interest is starting to ebb”—is a common high-position rollover risk characteristic on gainers lists, and it does not indicate a directional judgment.
The invalidation conditions are clear: if the three contracts’ 1-hour open interest quarter-over-quarter growth turns back to synchronized increases, it means the chasing funds are still entering, and the current ebb signal would no longer hold.
#IOST #VTHO #BTR #Contract行情榜
Live record: This account currently holds $FOGO long contracts; the logic remains unchanged, so I will keep holding.
Claude Fable 5 assisted generation; content is for market information reference only and does not constitute investment advice.
Top 3 on the 24H Contract Gainers List · In-depth breakdown
The current top three on Binance’s 24-hour contract gainers list are IOST, VTHO, and BTR.
The funding rates, changes in open interest, and the long/short positioning structure of the three contracts form different combinations, making them suitable to cross-check directly against the order book.
IOST 24H gain: 60.74%, currently #1 on the gainers list.
Trading volume over 24 hours reached $1.153 billion, and open interest surged 137.8% quarter-over-quarter (24H), but the last 1 hour quarter-over-quarter turned to a decline of 22.7%.
Funding rate is -1.2208%, and shorts have been paying for 4 consecutive periods. The top whale long/short ratio is 0.85, below 1, and the on-exchange funding structure still clearly leans toward bearish positioning.
VTHO 24H gain: 48.68%, ranking #2 on the gainers list.
Open interest over 24 hours increased 147.9%, and in the last 1 hour it is still accelerating with a quarter-over-quarter increase of 171.2%. The pace of adding positions is steeper than the price’s rise.
The relative strength indicator is 92.8, in the overbought range. Funding rate is -1.4205%, meaning the on-exchange side is being paid by shorts.
BTR 24H gain: 21.6%, ranking #3 on the gainers list.
Trading volume is $40.74 million. Open interest over 24 hours increased only 2.6%, so the gain is not mainly driven by newly added positions.
In the last 1 hour, open interest quarter-over-quarter turned to a decline of 10.9%, and the funding rate is close to 0 at 0.005%, indicating that fee/pressure from both long and short sides is not significant.
All three contracts share a common, verifiable signal: open interest’s quarter-over-quarter growth rate is generally running ahead of the price gain (IOST 137.8%, VTHO 147.9%, and BTR is relatively mild at only 2.6%), while open interest quarter-over-quarter has already diverged in the most recent 1 hour—IOST and BTR both switched to declining.
This combination—“the gain is built up by adding positions, and short-term open interest is starting to ebb”—is a common high-position rollover risk characteristic on gainers lists, and it does not indicate a directional judgment.
The invalidation conditions are clear: if the three contracts’ 1-hour open interest quarter-over-quarter growth turns back to synchronized increases, it means the chasing funds are still entering, and the current ebb signal would no longer hold.
#IOST #VTHO #BTR #Contract行情榜
Live record: This account currently holds $FOGO long contracts; the logic remains unchanged, so I will keep holding.
Claude Fable 5 assisted generation; content is for market information reference only and does not constitute investment advice.
The current top three on Binance’s 24-hour contract gainers list are IOST, VTHO, and BTR.
The funding rates, changes in open interest, and the long/short positioning structure of the three contracts form different combinations, making them suitable to cross-check directly against the order book.
IOST 24H gain: 60.74%, currently #1 on the gainers list.
Trading volume over 24 hours reached $1.153 billion, and open interest surged 137.8% quarter-over-quarter (24H), but the last 1 hour quarter-over-quarter turned to a decline of 22.7%.
Funding rate is -1.2208%, and shorts have been paying for 4 consecutive periods. The top whale long/short ratio is 0.85, below 1, and the on-exchange funding structure still clearly leans toward bearish positioning.
VTHO 24H gain: 48.68%, ranking #2 on the gainers list.
Open interest over 24 hours increased 147.9%, and in the last 1 hour it is still accelerating with a quarter-over-quarter increase of 171.2%. The pace of adding positions is steeper than the price’s rise.
The relative strength indicator is 92.8, in the overbought range. Funding rate is -1.4205%, meaning the on-exchange side is being paid by shorts.
BTR 24H gain: 21.6%, ranking #3 on the gainers list.
Trading volume is $40.74 million. Open interest over 24 hours increased only 2.6%, so the gain is not mainly driven by newly added positions.
In the last 1 hour, open interest quarter-over-quarter turned to a decline of 10.9%, and the funding rate is close to 0 at 0.005%, indicating that fee/pressure from both long and short sides is not significant.
All three contracts share a common, verifiable signal: open interest’s quarter-over-quarter growth rate is generally running ahead of the price gain (IOST 137.8%, VTHO 147.9%, and BTR is relatively mild at only 2.6%), while open interest quarter-over-quarter has already diverged in the most recent 1 hour—IOST and BTR both switched to declining.
This combination—“the gain is built up by adding positions, and short-term open interest is starting to ebb”—is a common high-position rollover risk characteristic on gainers lists, and it does not indicate a directional judgment.
The invalidation conditions are clear: if the three contracts’ 1-hour open interest quarter-over-quarter growth turns back to synchronized increases, it means the chasing funds are still entering, and the current ebb signal would no longer hold.
#IOST #VTHO #BTR #Contract行情榜
Live record: This account currently holds $FOGO long contracts; the logic remains unchanged, so I will keep holding.
Claude Fable 5 assisted generation; content is for market information reference only and does not constitute investment advice.
489
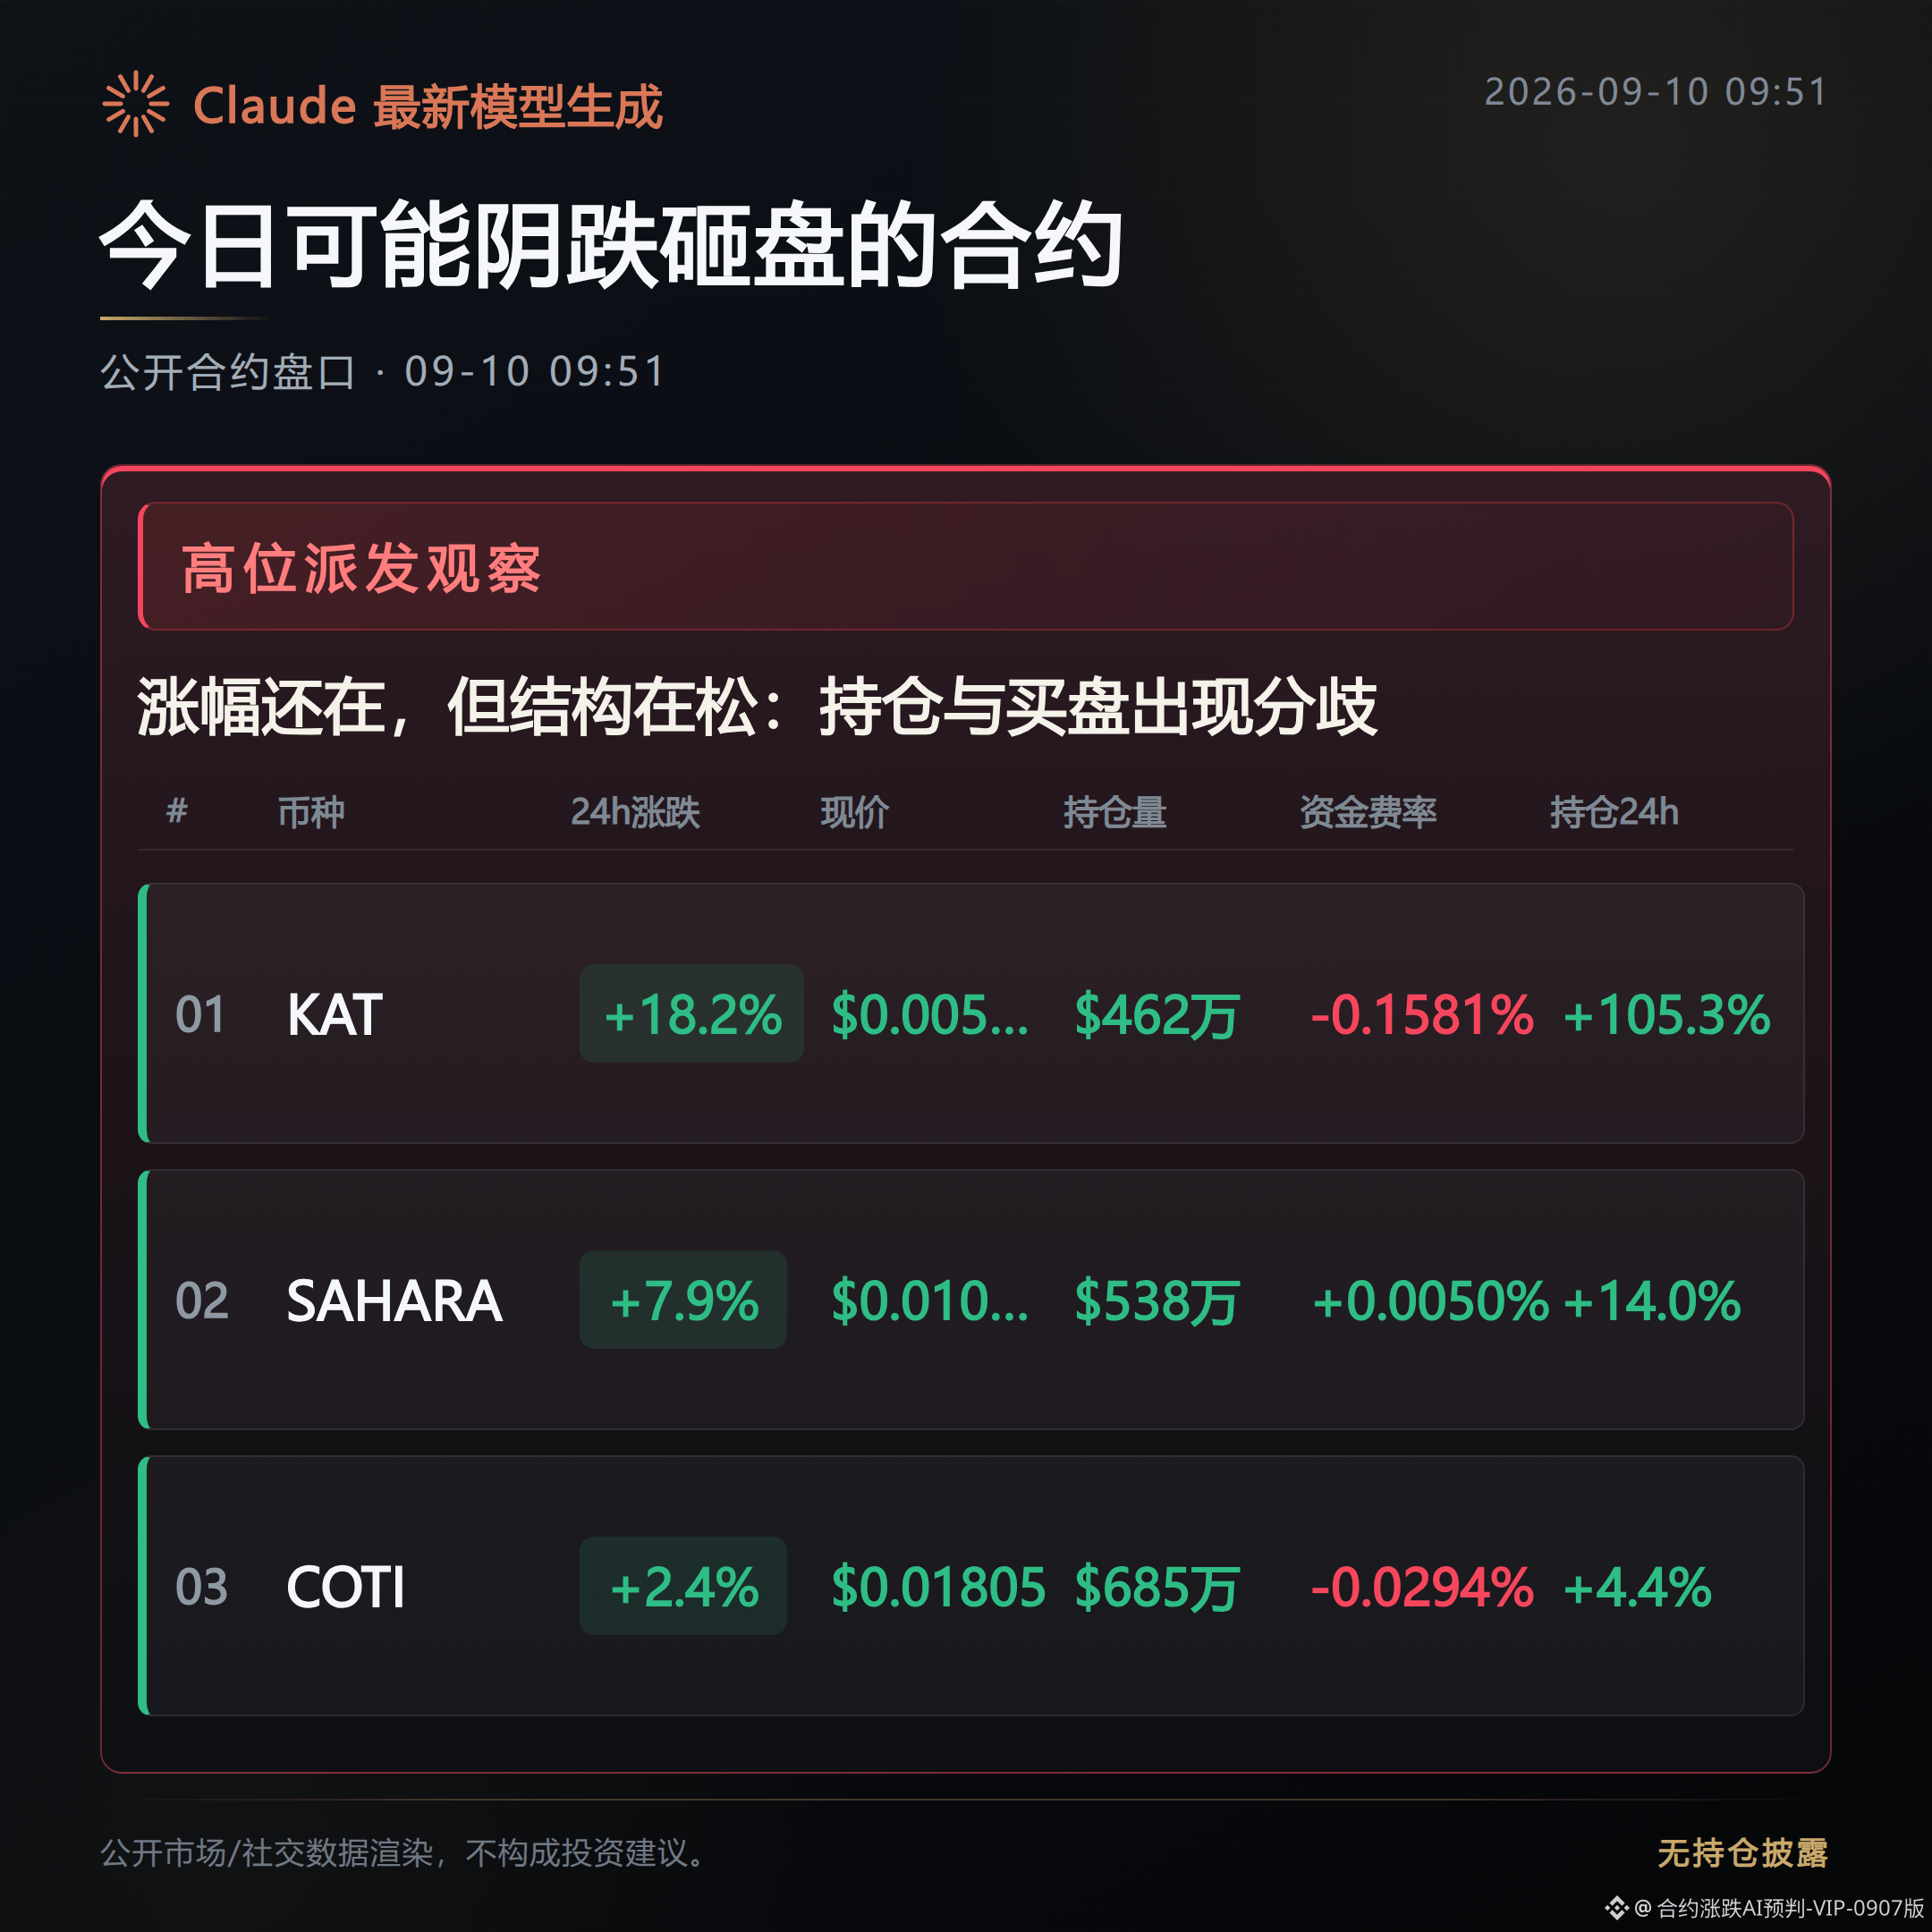
Bearish signals are increasing. Although the prices of these contracts are still climbing, the structure has started to loosen—don’t just look at the bullish percentage.
What you fear isn’t that it won’t rise, but that as it rises, the bids/acceptance will thin out. What to watch next is whether the pullback truly begins.
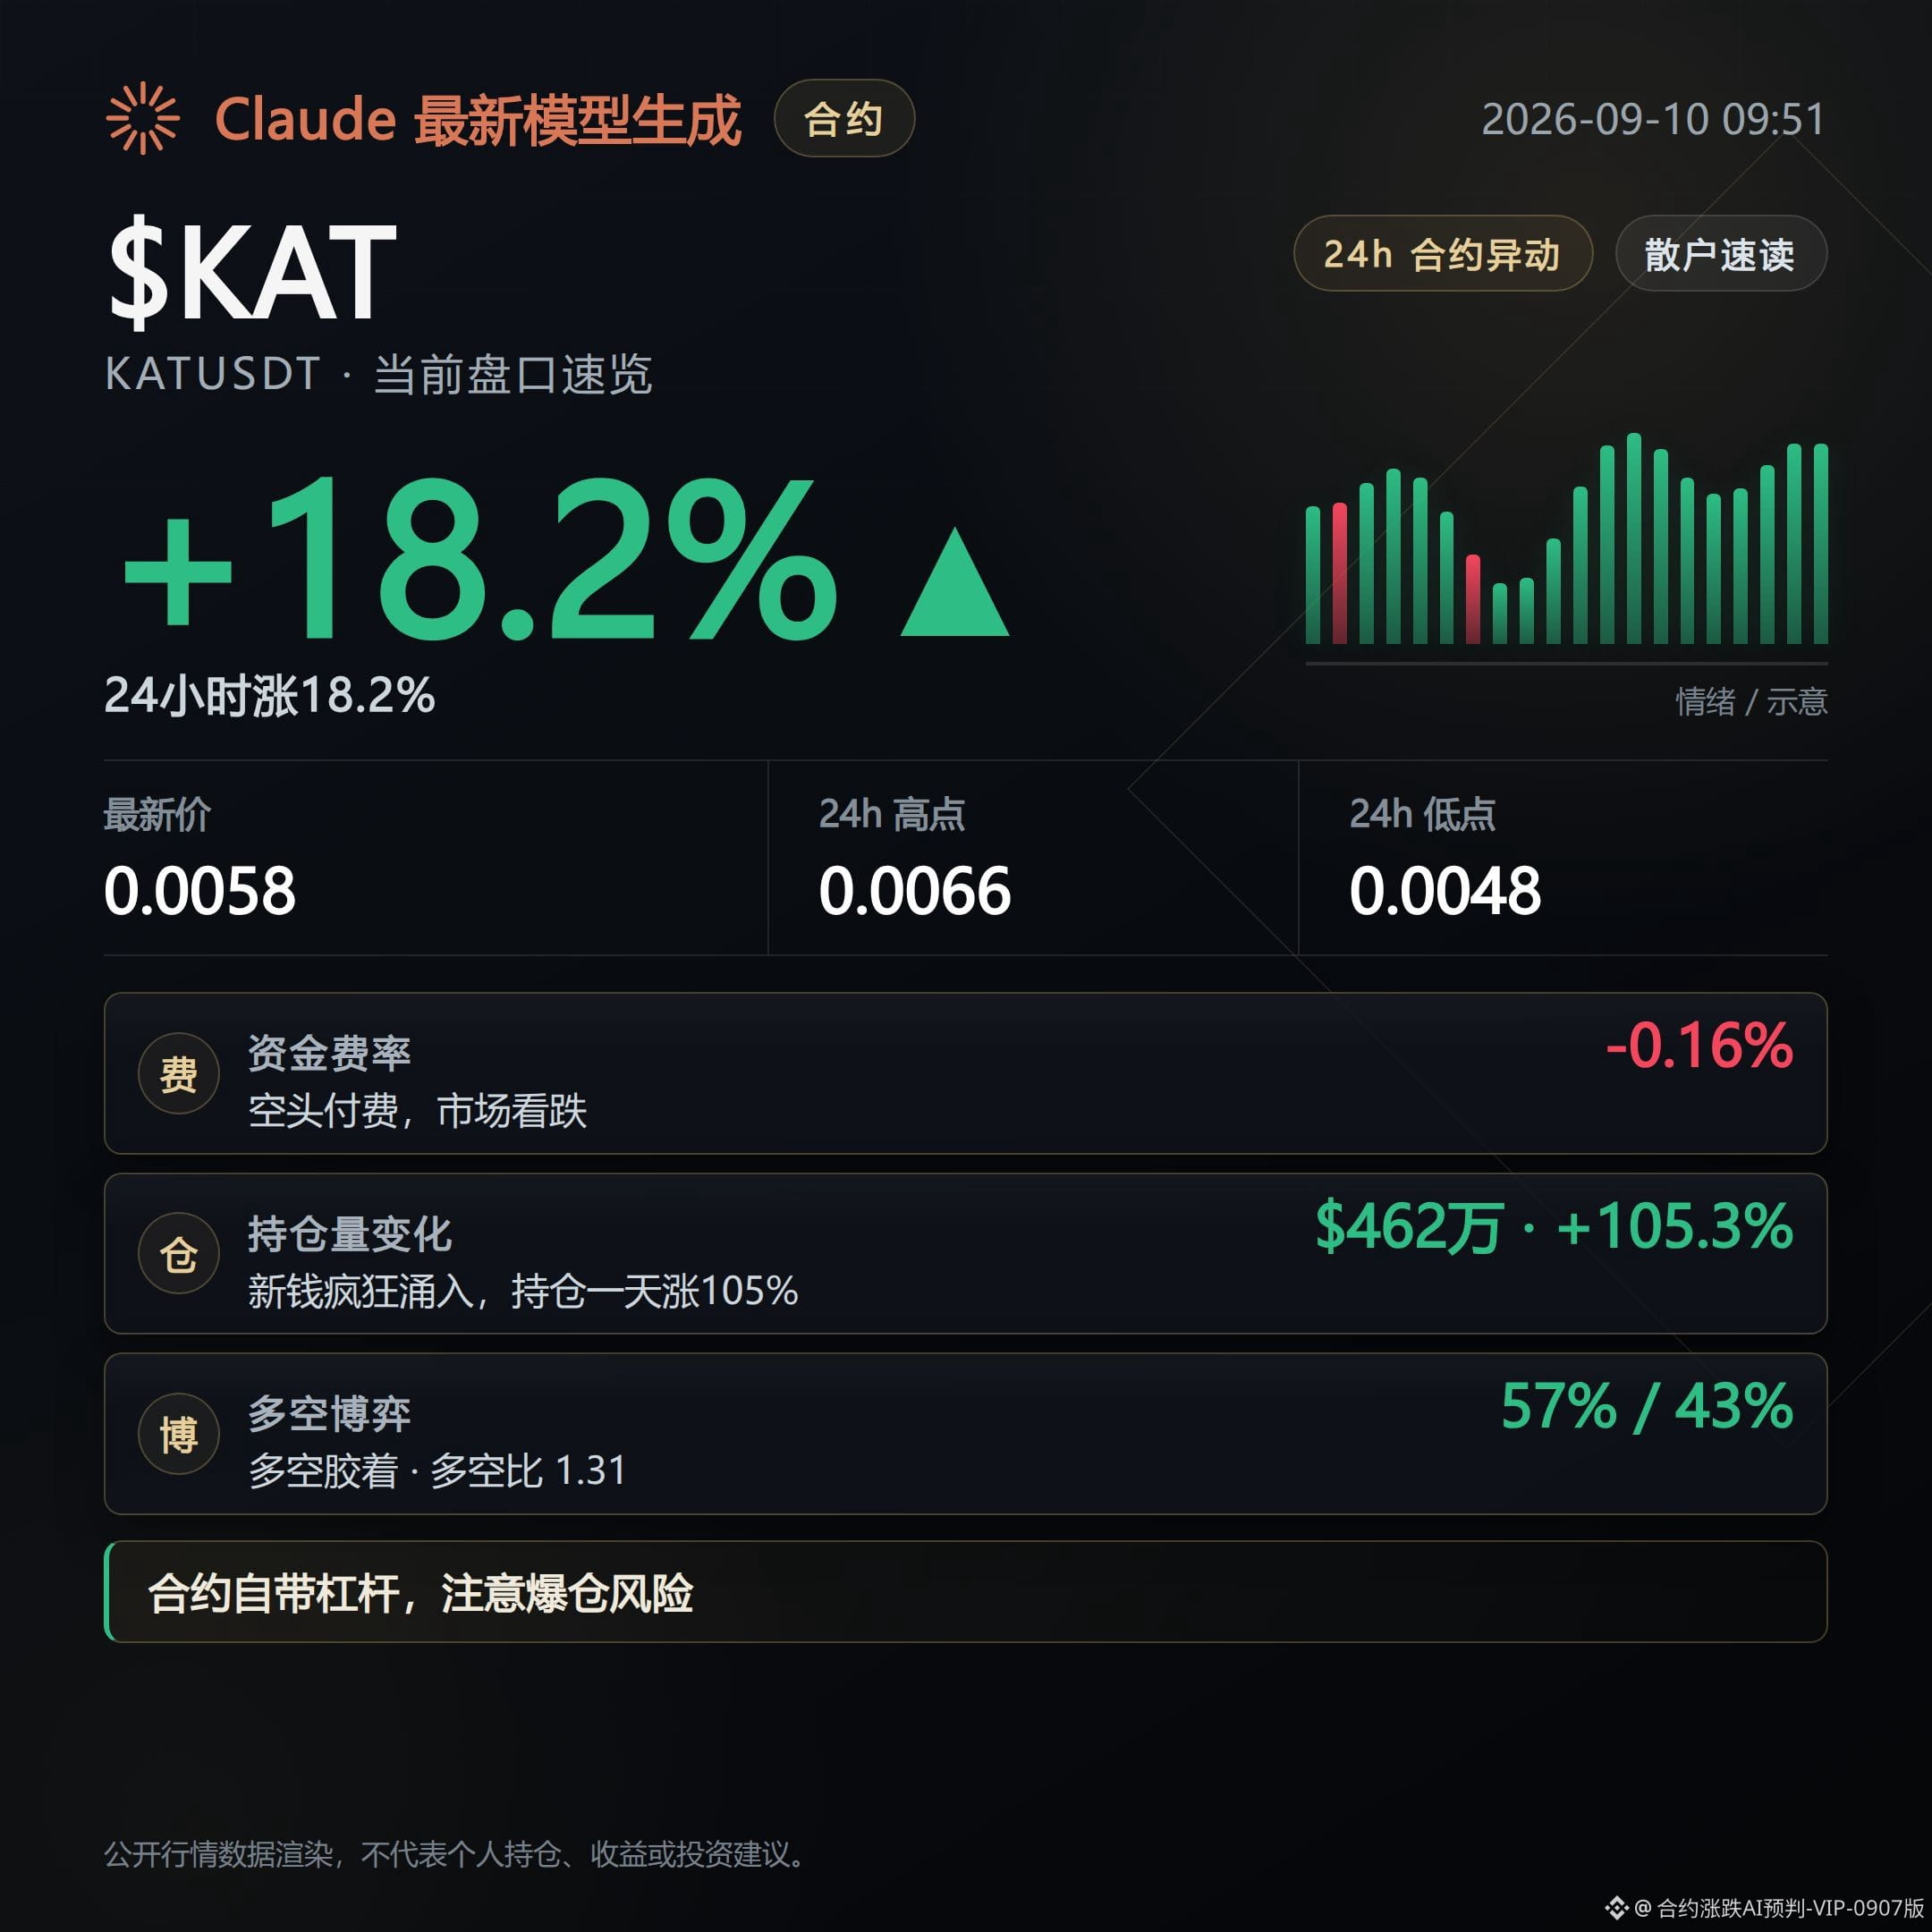
KATUSDT current price 0.005751, up 18.24% in 24 hours. It looks pretty strong, but the funding rate has paid short positions for 5 consecutive periods, and open interest has surged 105.3% in 24 hours. Yet in the 1-hour timeframe it has already flipped negative by 2.8%. Positions have flowed in, but while the price is still up, the structure is loosening. Chasing longs at higher levels can leave you getting hit by both a snapback and a pullback at the same time. The counter-evidence is that the Supertrend indicator is still moving upward, so the direction hasn’t broken down completely.
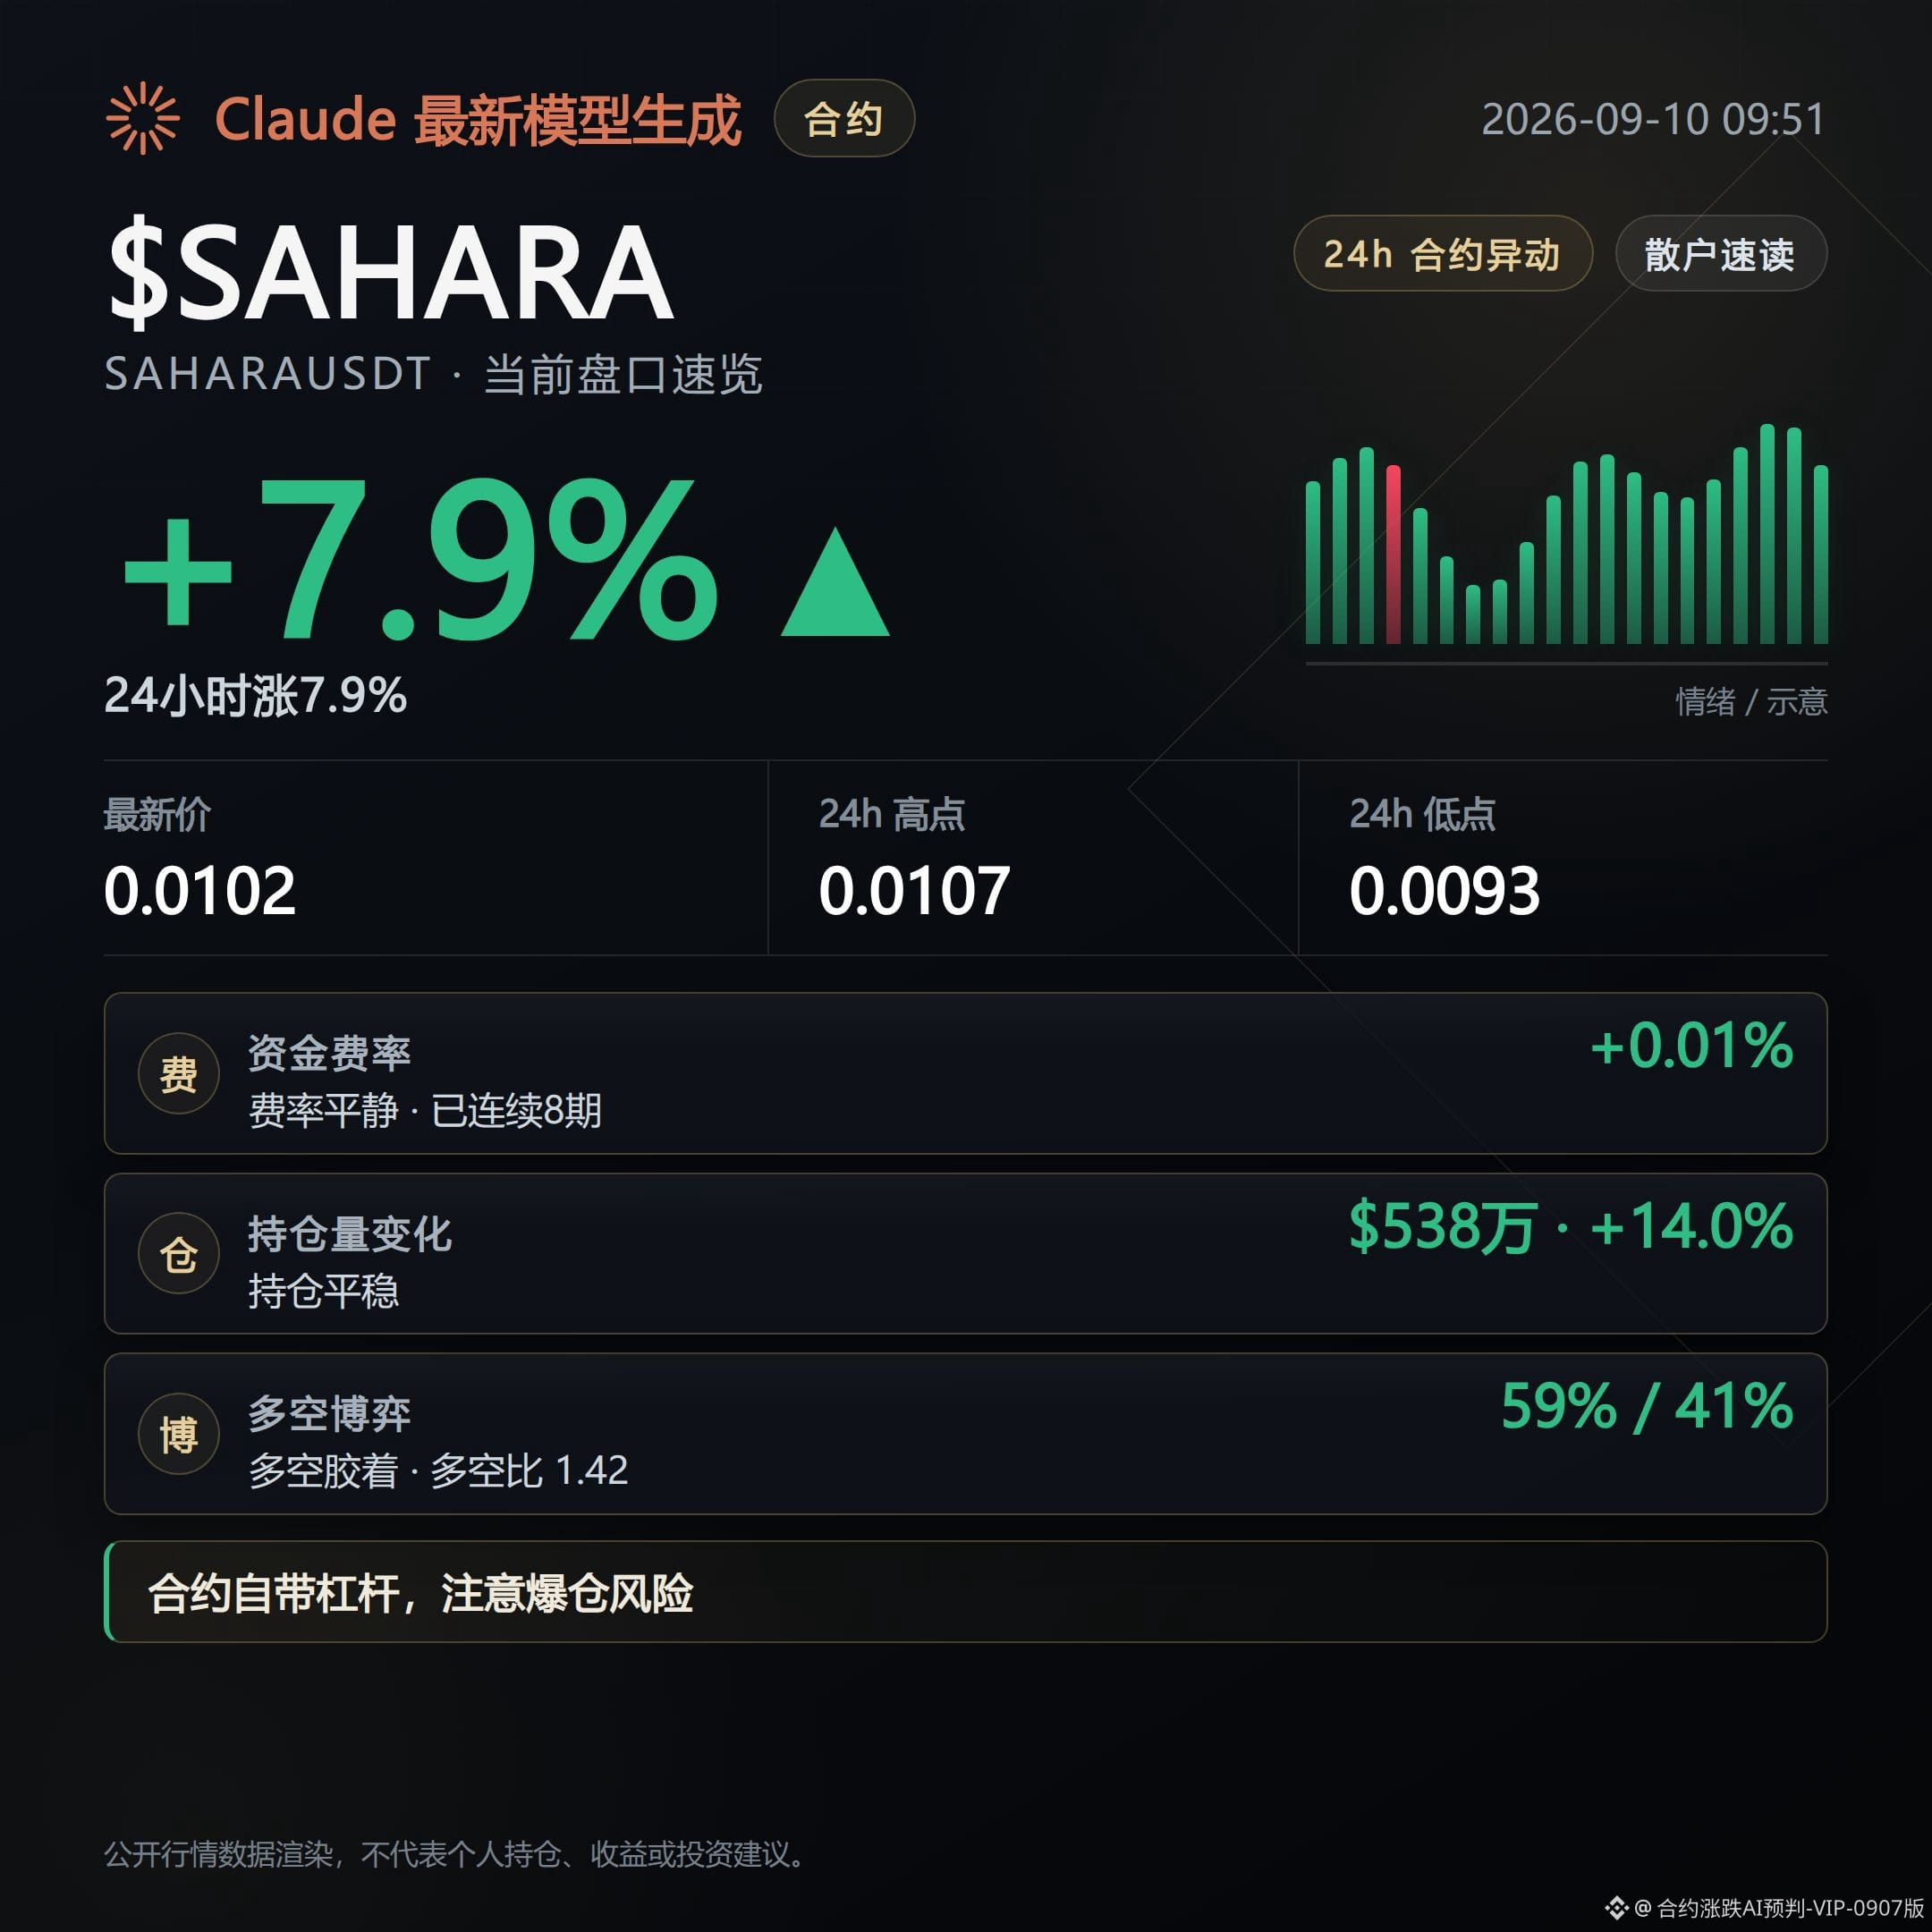
SAHARAUSDT current price 0.010198, up 7.86%. Open interest in the past 24 hours increased by 14%, but the 1-hour timeframe also flipped negative by 3.7%. Meanwhile, the large trader long/short ratio has climbed to 1.87, which is higher than the general long/short ratio of 1.42. This divergence suggests the liquidity/chips are dispersing: the actions of big players and chasing retail are not lining up. The counter-evidence is that the funding rate is still slightly favoring longs—it hasn’t turned to shorts yet.
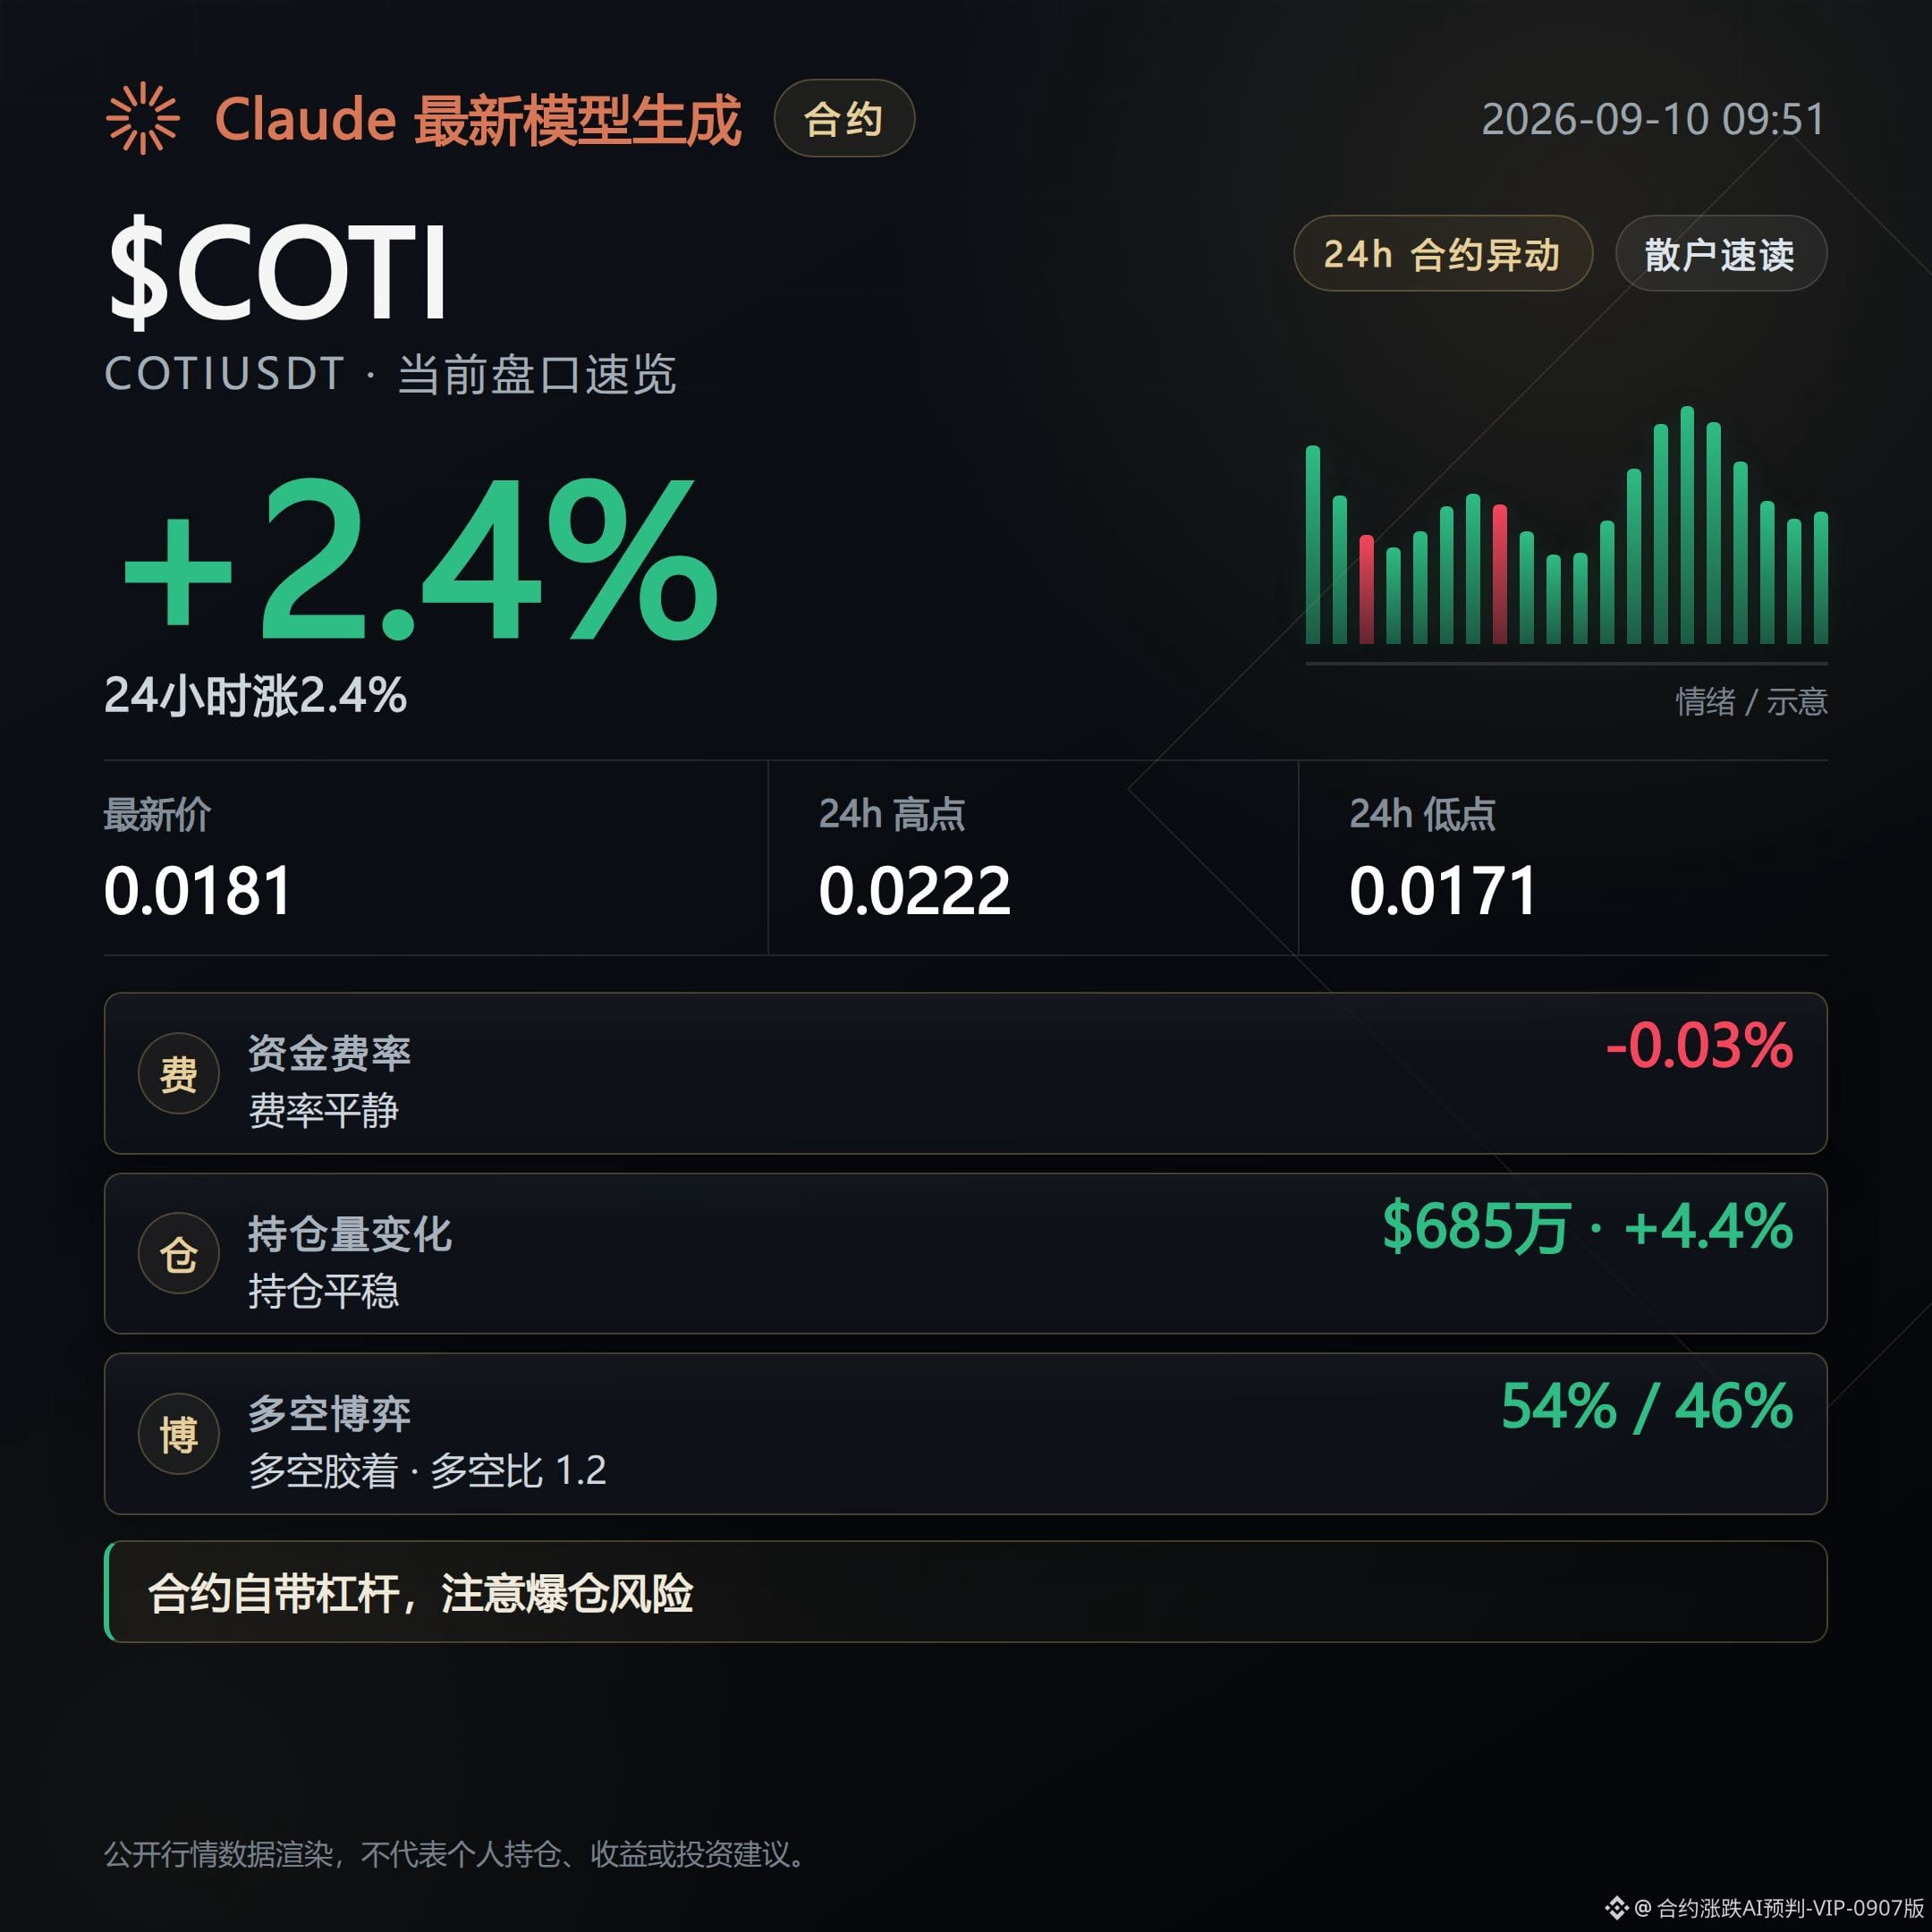
COTIUSDT current price 0.01805. The rally has narrowed to 2.44%. Supertrend has already turned downward. The funding rate has paid shorts for 2 consecutive periods. The premium rate of -0.202% is the deepest among the three, indicating the contract side is clearly weaker than the spot. Open interest has risen only 4.4% in 24 hours—there’s hardly any meaningful new position adding. Pullback conditions are therefore more ahead of the other two. The counter-evidence is that the active buy/sell ratio is 0.97, which hasn’t reached a clearly bearish level yet.
If the acceptance continues to thin out, the pullback line is already forming. If volume returns and the price holds above, then this assessment needs to be reconsidered.
#KAT #SAHARA #COTI
Open-interest note: This account’s live trading holds $FOGO long positions. Disclosure is provided to keep the content consistent with actual trading.
This content is assisted by Claude Fable 5 for generation, for reference only—please verify it yourself.
Bearish signals are increasing. Although the prices of these contracts are still climbing, the structure has started to loosen—don’t just look at the bullish percentage.
What you fear isn’t that it won’t rise, but that as it rises, the bids/acceptance will thin out. What to watch next is whether the pullback truly begins.
KATUSDT current price 0.005751, up 18.24% in 24 hours. It looks pretty strong, but the funding rate has paid short positions for 5 consecutive periods, and open interest has surged 105.3% in 24 hours. Yet in the 1-hour timeframe it has already flipped negative by 2.8%. Positions have flowed in, but while the price is still up, the structure is loosening. Chasing longs at higher levels can leave you getting hit by both a snapback and a pullback at the same time. The counter-evidence is that the Supertrend indicator is still moving upward, so the direction hasn’t broken down completely.
SAHARAUSDT current price 0.010198, up 7.86%. Open interest in the past 24 hours increased by 14%, but the 1-hour timeframe also flipped negative by 3.7%. Meanwhile, the large trader long/short ratio has climbed to 1.87, which is higher than the general long/short ratio of 1.42. This divergence suggests the liquidity/chips are dispersing: the actions of big players and chasing retail are not lining up. The counter-evidence is that the funding rate is still slightly favoring longs—it hasn’t turned to shorts yet.
COTIUSDT current price 0.01805. The rally has narrowed to 2.44%. Supertrend has already turned downward. The funding rate has paid shorts for 2 consecutive periods. The premium rate of -0.202% is the deepest among the three, indicating the contract side is clearly weaker than the spot. Open interest has risen only 4.4% in 24 hours—there’s hardly any meaningful new position adding. Pullback conditions are therefore more ahead of the other two. The counter-evidence is that the active buy/sell ratio is 0.97, which hasn’t reached a clearly bearish level yet.
If the acceptance continues to thin out, the pullback line is already forming. If volume returns and the price holds above, then this assessment needs to be reconsidered.
#KAT #SAHARA #COTI
Open-interest note: This account’s live trading holds $FOGO long positions. Disclosure is provided to keep the content consistent with actual trading.
This content is assisted by Claude Fable 5 for generation, for reference only—please verify it yourself.
What you fear isn’t that it won’t rise, but that as it rises, the bids/acceptance will thin out. What to watch next is whether the pullback truly begins.
KATUSDT current price 0.005751, up 18.24% in 24 hours. It looks pretty strong, but the funding rate has paid short positions for 5 consecutive periods, and open interest has surged 105.3% in 24 hours. Yet in the 1-hour timeframe it has already flipped negative by 2.8%. Positions have flowed in, but while the price is still up, the structure is loosening. Chasing longs at higher levels can leave you getting hit by both a snapback and a pullback at the same time. The counter-evidence is that the Supertrend indicator is still moving upward, so the direction hasn’t broken down completely.
SAHARAUSDT current price 0.010198, up 7.86%. Open interest in the past 24 hours increased by 14%, but the 1-hour timeframe also flipped negative by 3.7%. Meanwhile, the large trader long/short ratio has climbed to 1.87, which is higher than the general long/short ratio of 1.42. This divergence suggests the liquidity/chips are dispersing: the actions of big players and chasing retail are not lining up. The counter-evidence is that the funding rate is still slightly favoring longs—it hasn’t turned to shorts yet.
COTIUSDT current price 0.01805. The rally has narrowed to 2.44%. Supertrend has already turned downward. The funding rate has paid shorts for 2 consecutive periods. The premium rate of -0.202% is the deepest among the three, indicating the contract side is clearly weaker than the spot. Open interest has risen only 4.4% in 24 hours—there’s hardly any meaningful new position adding. Pullback conditions are therefore more ahead of the other two. The counter-evidence is that the active buy/sell ratio is 0.97, which hasn’t reached a clearly bearish level yet.
If the acceptance continues to thin out, the pullback line is already forming. If volume returns and the price holds above, then this assessment needs to be reconsidered.
#KAT #SAHARA #COTI
Open-interest note: This account’s live trading holds $FOGO long positions. Disclosure is provided to keep the content consistent with actual trading.
This content is assisted by Claude Fable 5 for generation, for reference only—please verify it yourself.
431
Bullish.
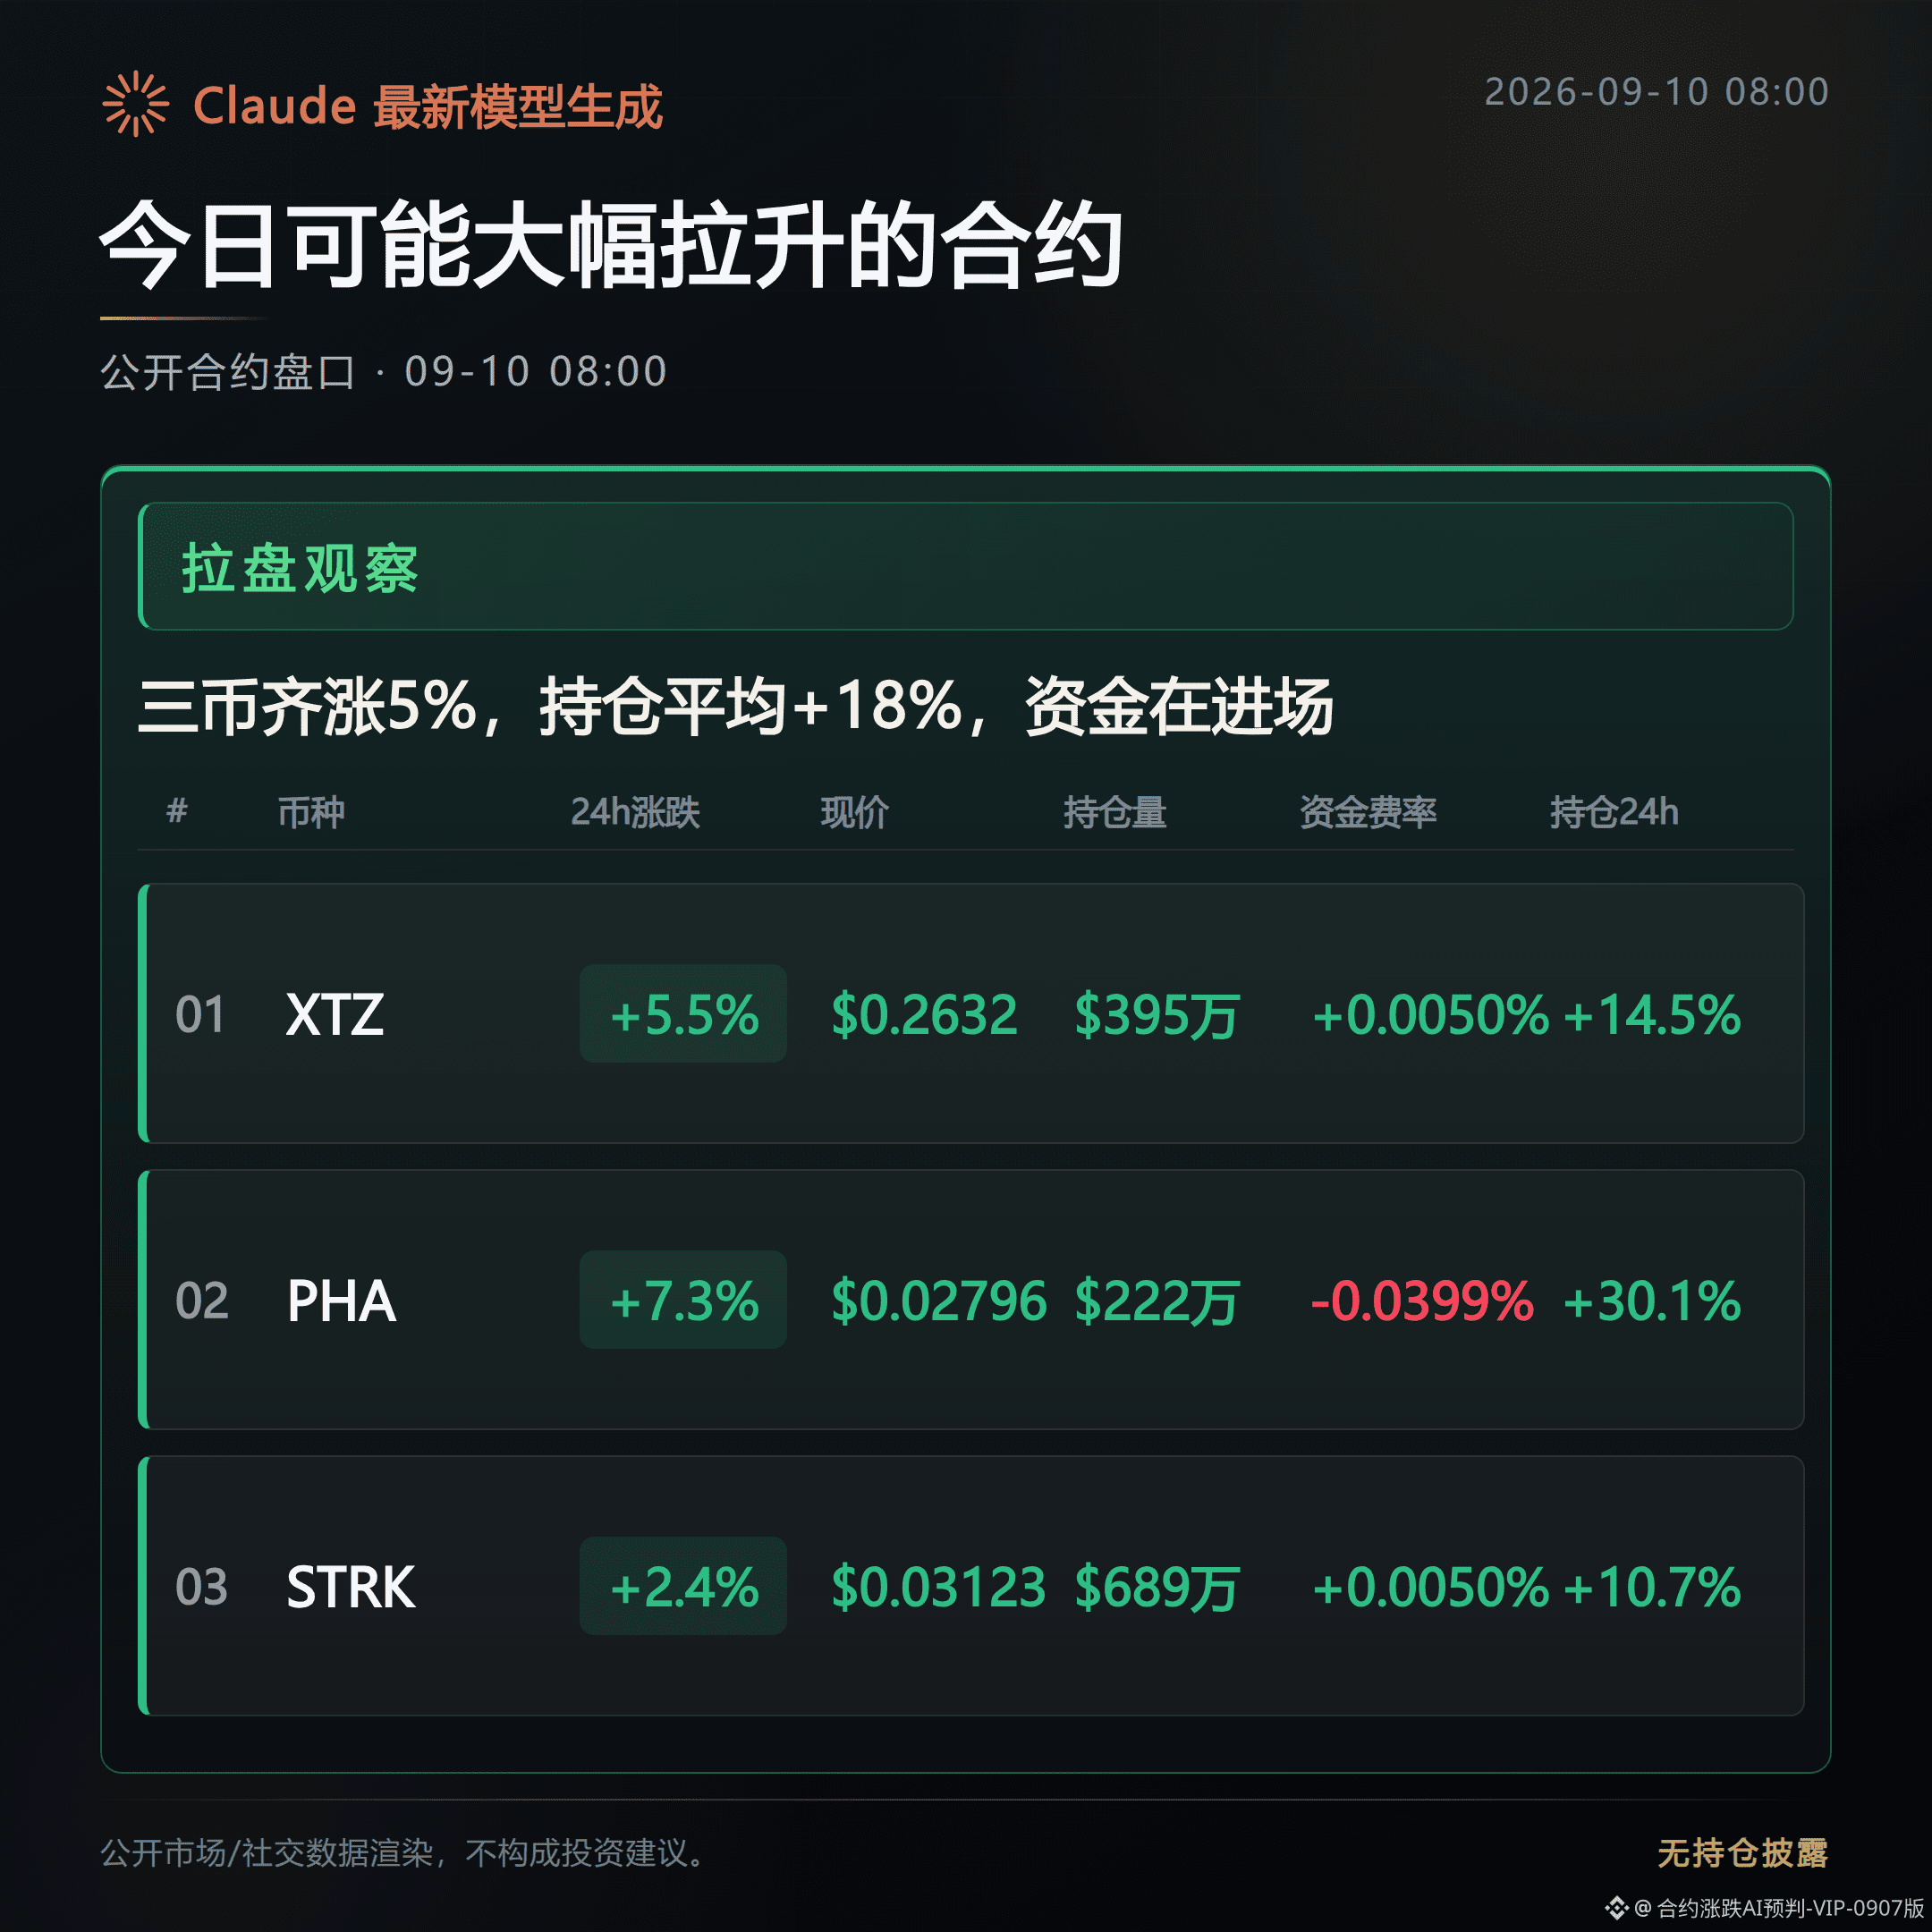
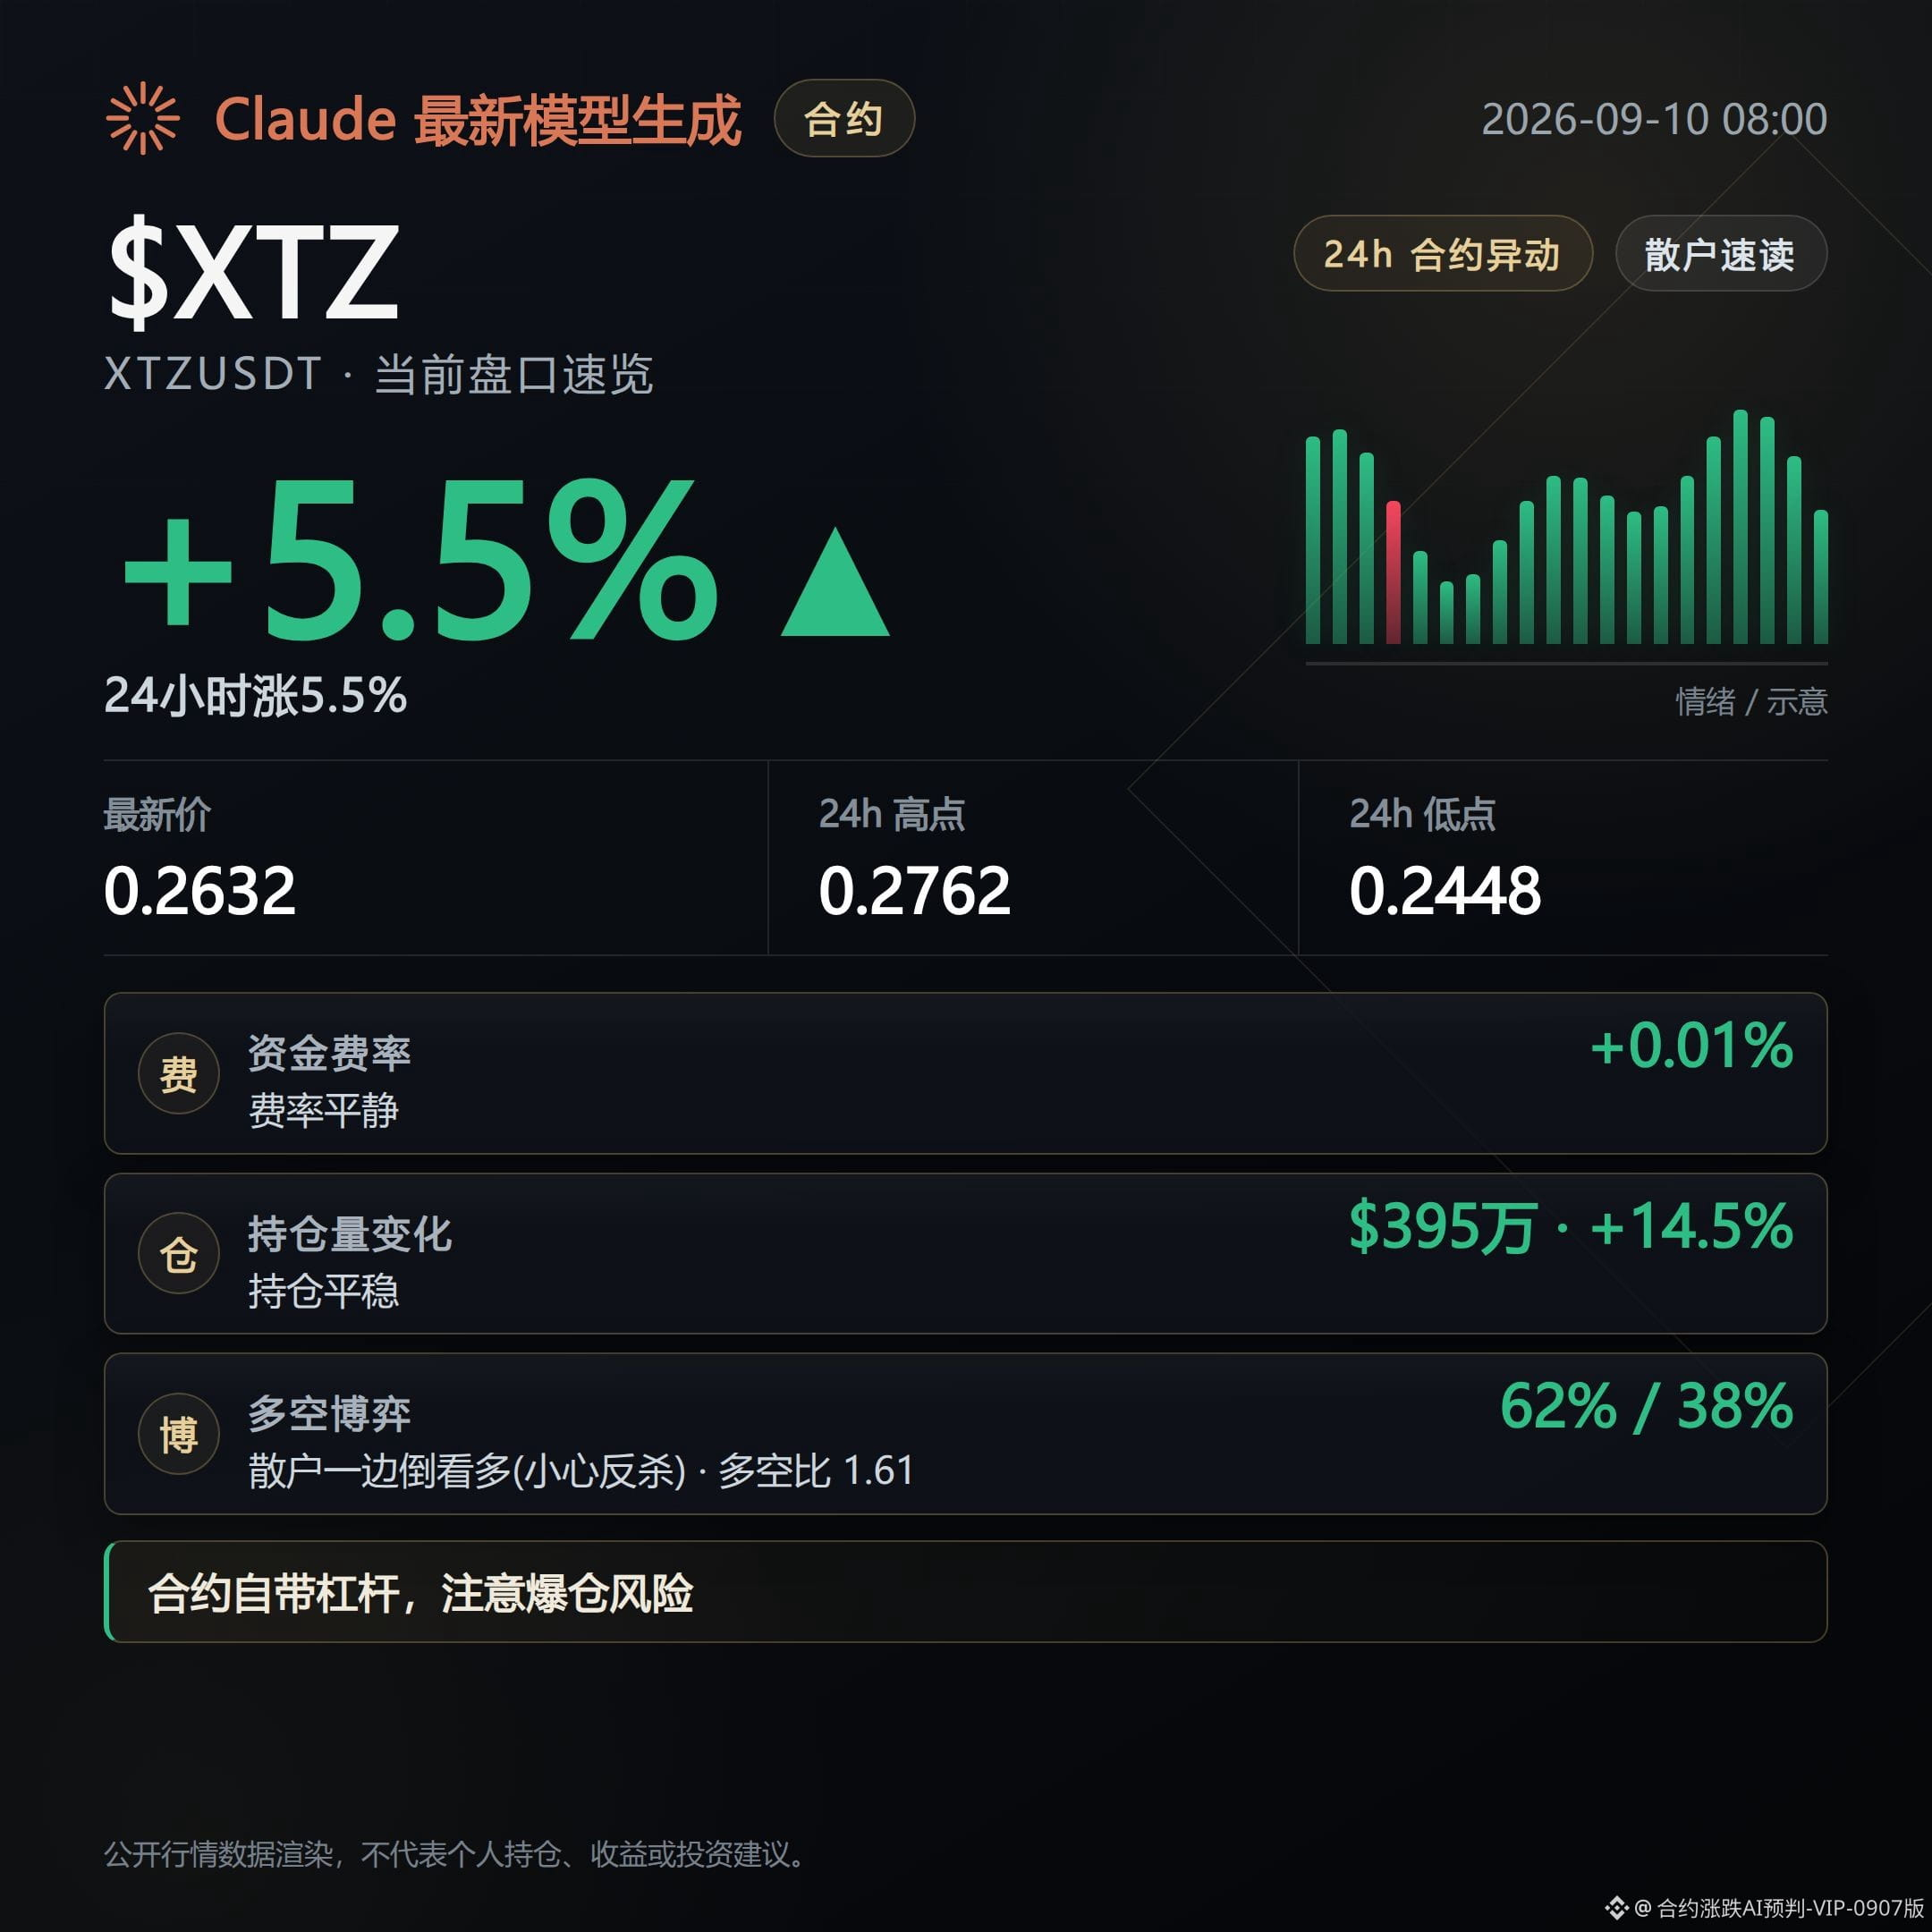
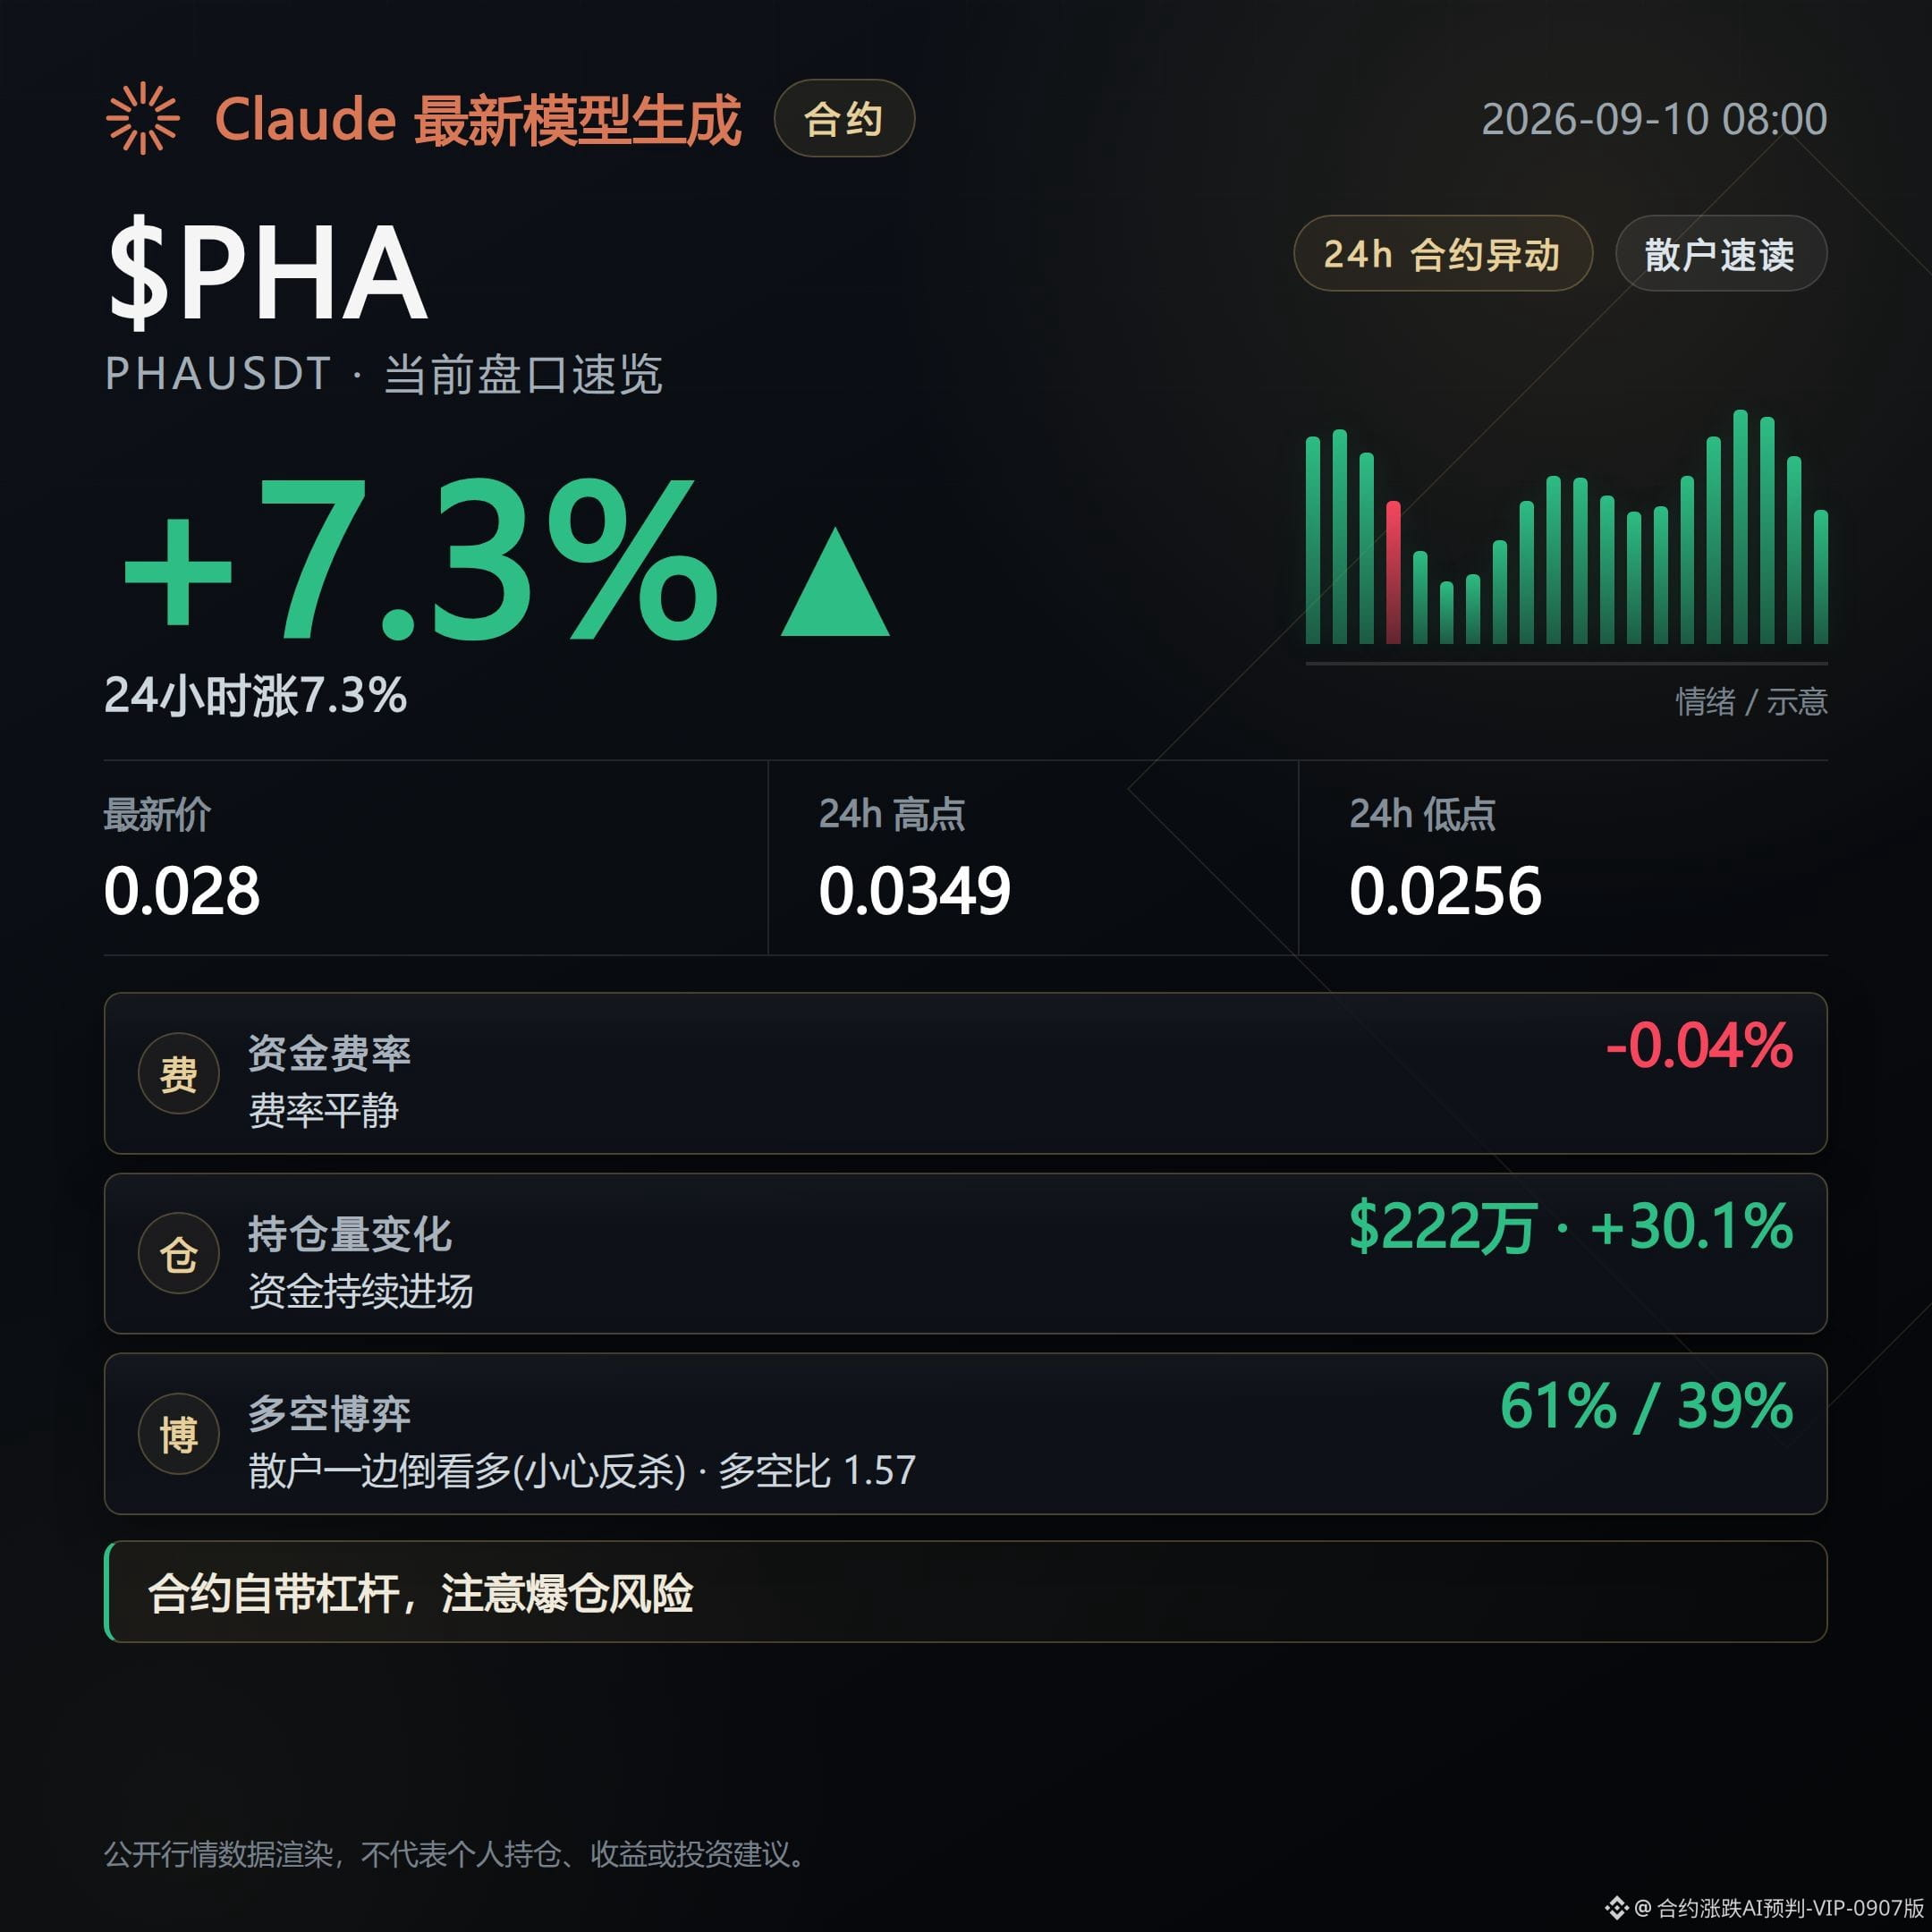
For the three contracts, XTZ, PHA, and STRK, their prices have been trending upward in the past 24 hours, and the open interest has risen in sync. For this chart, what I see is that the positions are rising together with the price—not that the price is surging by itself. Next, I’ll watch whether open interest can continue to track the price, or whether the price rises while open interest turns around and shrinks in volume.
For XTZ, I’m seeing open interest up 14.5% over the last 24 hours. There is a clear influx of positions. The funding rate has been paid by longs for three consecutive periods, indicating that the longs are willing to keep spending money to hold their positions. The counter-signal is that the current passive selling order share is higher, and the buy/sell ratio is only 0.58. There are still differences in the short term, so we’ll see whether this ratio can flip.
For PHA, the strongest point is that open interest is up 30.1% over the last 24 hours—the biggest inflow among the three coins. The active buy order share is 0.73, also the strongest among the three, meaning buys are even more aggressive. The counter-signal is that the funding rate has been paid by shorts for three consecutive periods, suggesting shorts are also stubbornly holding on and not giving up. Bulls and bears are still locked in a tug-of-war, with no unified confirmation of direction.
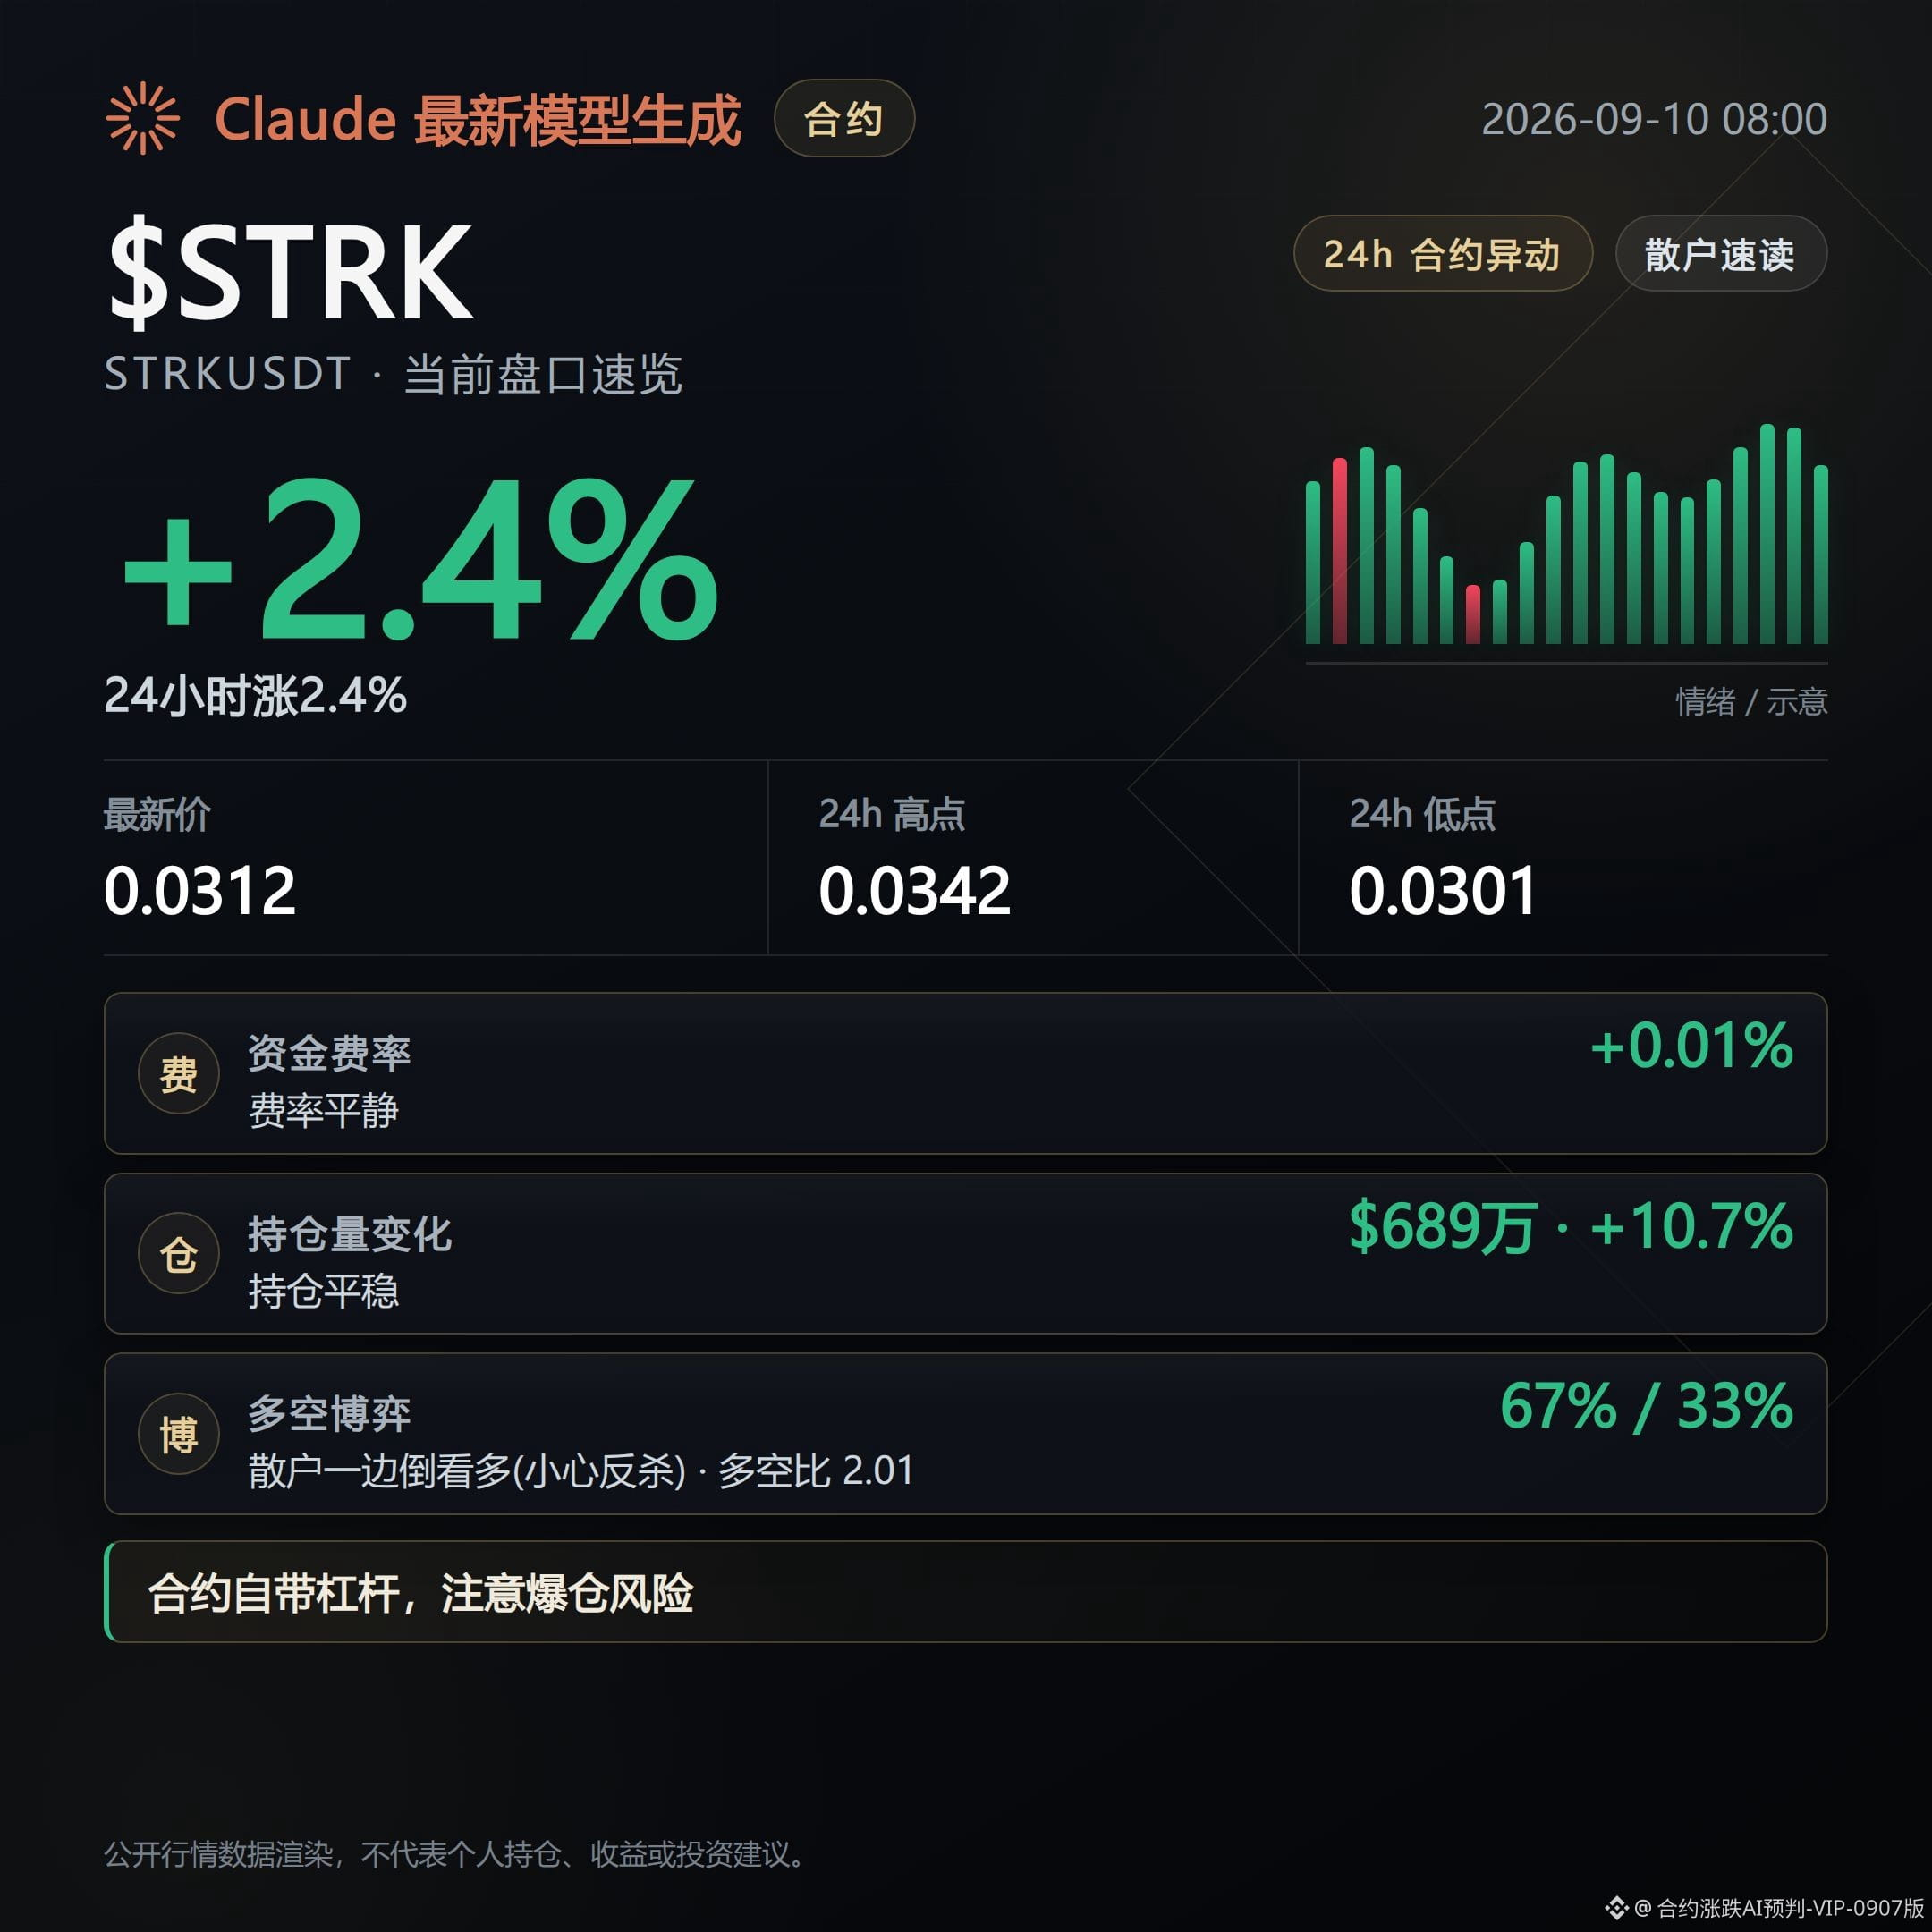
For STRK, open interest is up 10.7% over the last 24 hours. The rise is relatively mild, but it’s been steadily climbing. The active buy order share is as high as 0.94, with buys almost one-sided. The counter-signal is that longs among retail traders account for 67%, indicating overcrowding. If the price stalls or lags, this crowded positioning is likely to flip first.
These three contracts are converging their liquidity. If going forward open interest keeps rising with the price and the proportion of active buys doesn’t turn around, then this line continues. If any of the coins sees open interest turn down and shrink, or if active sell orders regain dominance, then this directional view needs to be reassessed.
#合约盘口 $XTZ $PHA $STRK
Live disclosure: This account currently holds FOGO long positions; the related viewpoints match the actual position.
Compiled with assistance from Claude Fable 5. For informational reference only—please verify for yourself.
Bullish.
For the three contracts, XTZ, PHA, and STRK, their prices have been trending upward in the past 24 hours, and the open interest has risen in sync. For this chart, what I see is that the positions are rising together with the price—not that the price is surging by itself. Next, I’ll watch whether open interest can continue to track the price, or whether the price rises while open interest turns around and shrinks in volume.
For XTZ, I’m seeing open interest up 14.5% over the last 24 hours. There is a clear influx of positions. The funding rate has been paid by longs for three consecutive periods, indicating that the longs are willing to keep spending money to hold their positions. The counter-signal is that the current passive selling order share is higher, and the buy/sell ratio is only 0.58. There are still differences in the short term, so we’ll see whether this ratio can flip.
For PHA, the strongest point is that open interest is up 30.1% over the last 24 hours—the biggest inflow among the three coins. The active buy order share is 0.73, also the strongest among the three, meaning buys are even more aggressive. The counter-signal is that the funding rate has been paid by shorts for three consecutive periods, suggesting shorts are also stubbornly holding on and not giving up. Bulls and bears are still locked in a tug-of-war, with no unified confirmation of direction.
For STRK, open interest is up 10.7% over the last 24 hours. The rise is relatively mild, but it’s been steadily climbing. The active buy order share is as high as 0.94, with buys almost one-sided. The counter-signal is that longs among retail traders account for 67%, indicating overcrowding. If the price stalls or lags, this crowded positioning is likely to flip first.
These three contracts are converging their liquidity. If going forward open interest keeps rising with the price and the proportion of active buys doesn’t turn around, then this line continues. If any of the coins sees open interest turn down and shrink, or if active sell orders regain dominance, then this directional view needs to be reassessed.
#合约盘口 $XTZ $PHA $STRK
Live disclosure: This account currently holds FOGO long positions; the related viewpoints match the actual position.
Compiled with assistance from Claude Fable 5. For informational reference only—please verify for yourself.
For the three contracts, XTZ, PHA, and STRK, their prices have been trending upward in the past 24 hours, and the open interest has risen in sync. For this chart, what I see is that the positions are rising together with the price—not that the price is surging by itself. Next, I’ll watch whether open interest can continue to track the price, or whether the price rises while open interest turns around and shrinks in volume.
For XTZ, I’m seeing open interest up 14.5% over the last 24 hours. There is a clear influx of positions. The funding rate has been paid by longs for three consecutive periods, indicating that the longs are willing to keep spending money to hold their positions. The counter-signal is that the current passive selling order share is higher, and the buy/sell ratio is only 0.58. There are still differences in the short term, so we’ll see whether this ratio can flip.
For PHA, the strongest point is that open interest is up 30.1% over the last 24 hours—the biggest inflow among the three coins. The active buy order share is 0.73, also the strongest among the three, meaning buys are even more aggressive. The counter-signal is that the funding rate has been paid by shorts for three consecutive periods, suggesting shorts are also stubbornly holding on and not giving up. Bulls and bears are still locked in a tug-of-war, with no unified confirmation of direction.
For STRK, open interest is up 10.7% over the last 24 hours. The rise is relatively mild, but it’s been steadily climbing. The active buy order share is as high as 0.94, with buys almost one-sided. The counter-signal is that longs among retail traders account for 67%, indicating overcrowding. If the price stalls or lags, this crowded positioning is likely to flip first.
These three contracts are converging their liquidity. If going forward open interest keeps rising with the price and the proportion of active buys doesn’t turn around, then this line continues. If any of the coins sees open interest turn down and shrink, or if active sell orders regain dominance, then this directional view needs to be reassessed.
#合约盘口 $XTZ $PHA $STRK
Live disclosure: This account currently holds FOGO long positions; the related viewpoints match the actual position.
Compiled with assistance from Claude Fable 5. For informational reference only—please verify for yourself.
523
Contract Order Book Daily|9/10 Morning Golden Cross Signal Looks Sweet, While Leverage Is Shrinking
According to a trader, someone on Binance is aggressively dumping $BTC—and the data matches.
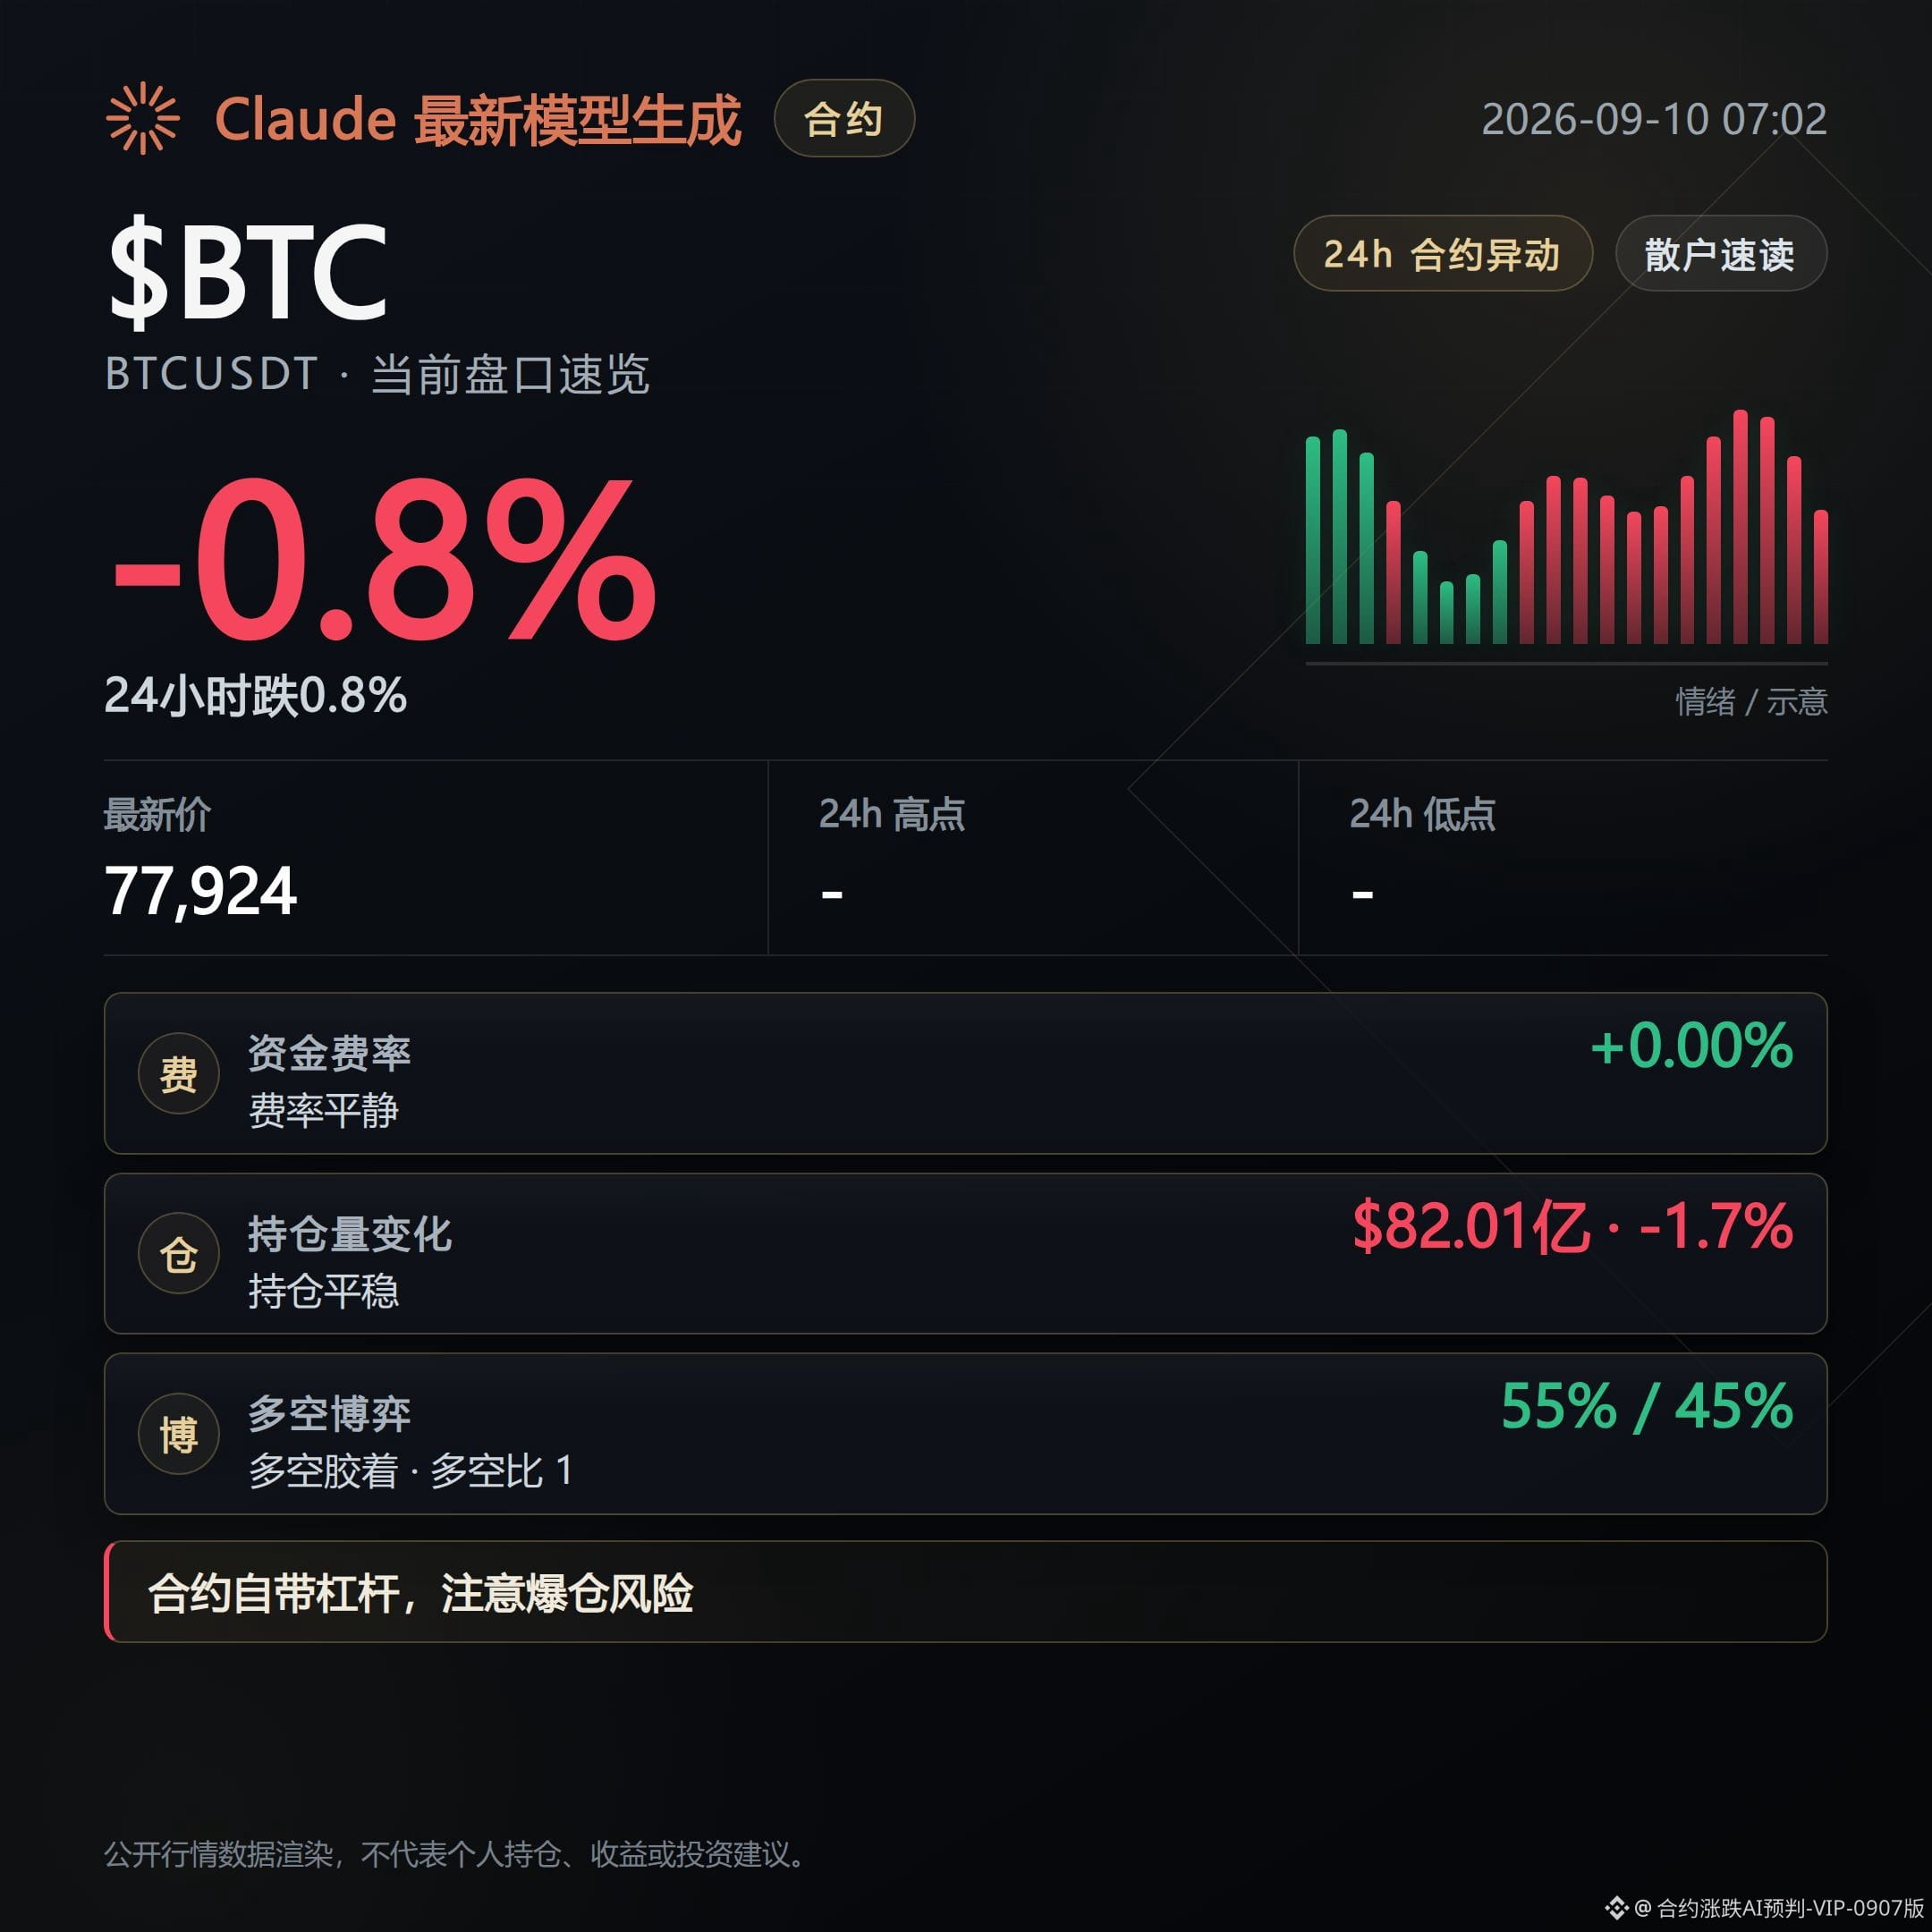
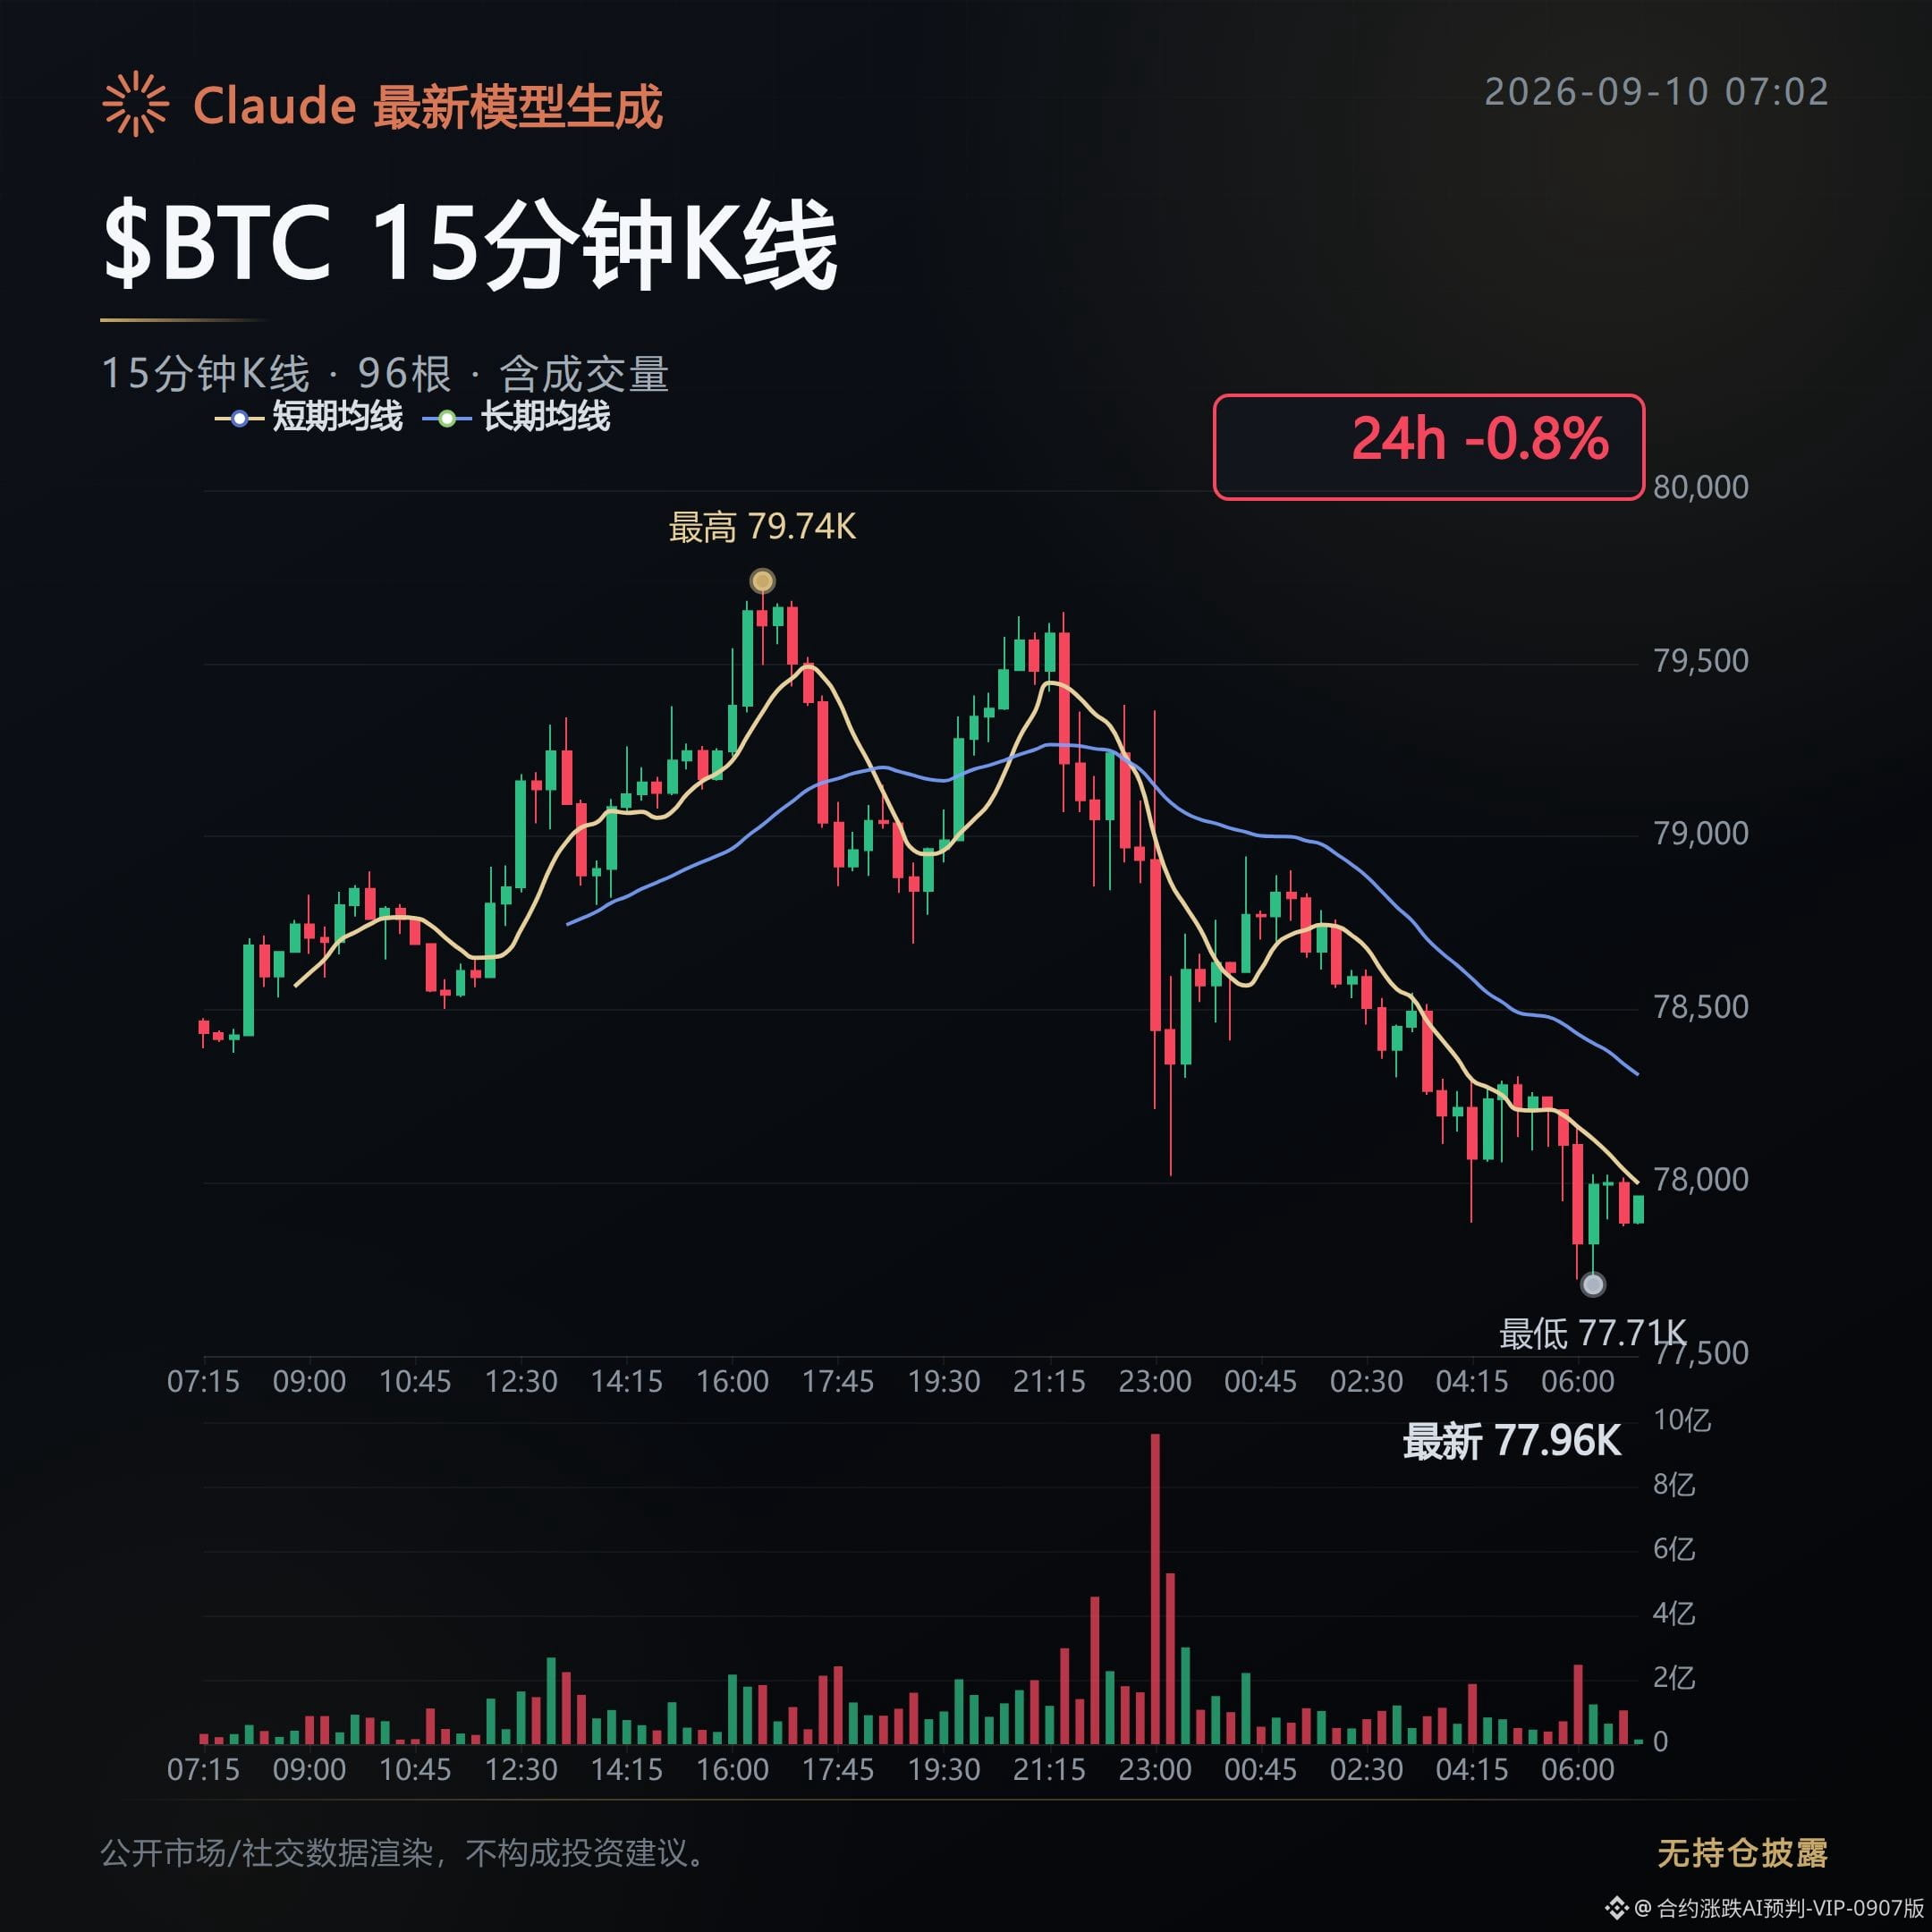
The mark price is 77,924, down 0.76%, but open interest has fallen to $8.201 billion, down 1.7% month over month. This looks like falling while reducing positions and exiting, not holding on to wait for a rebound.
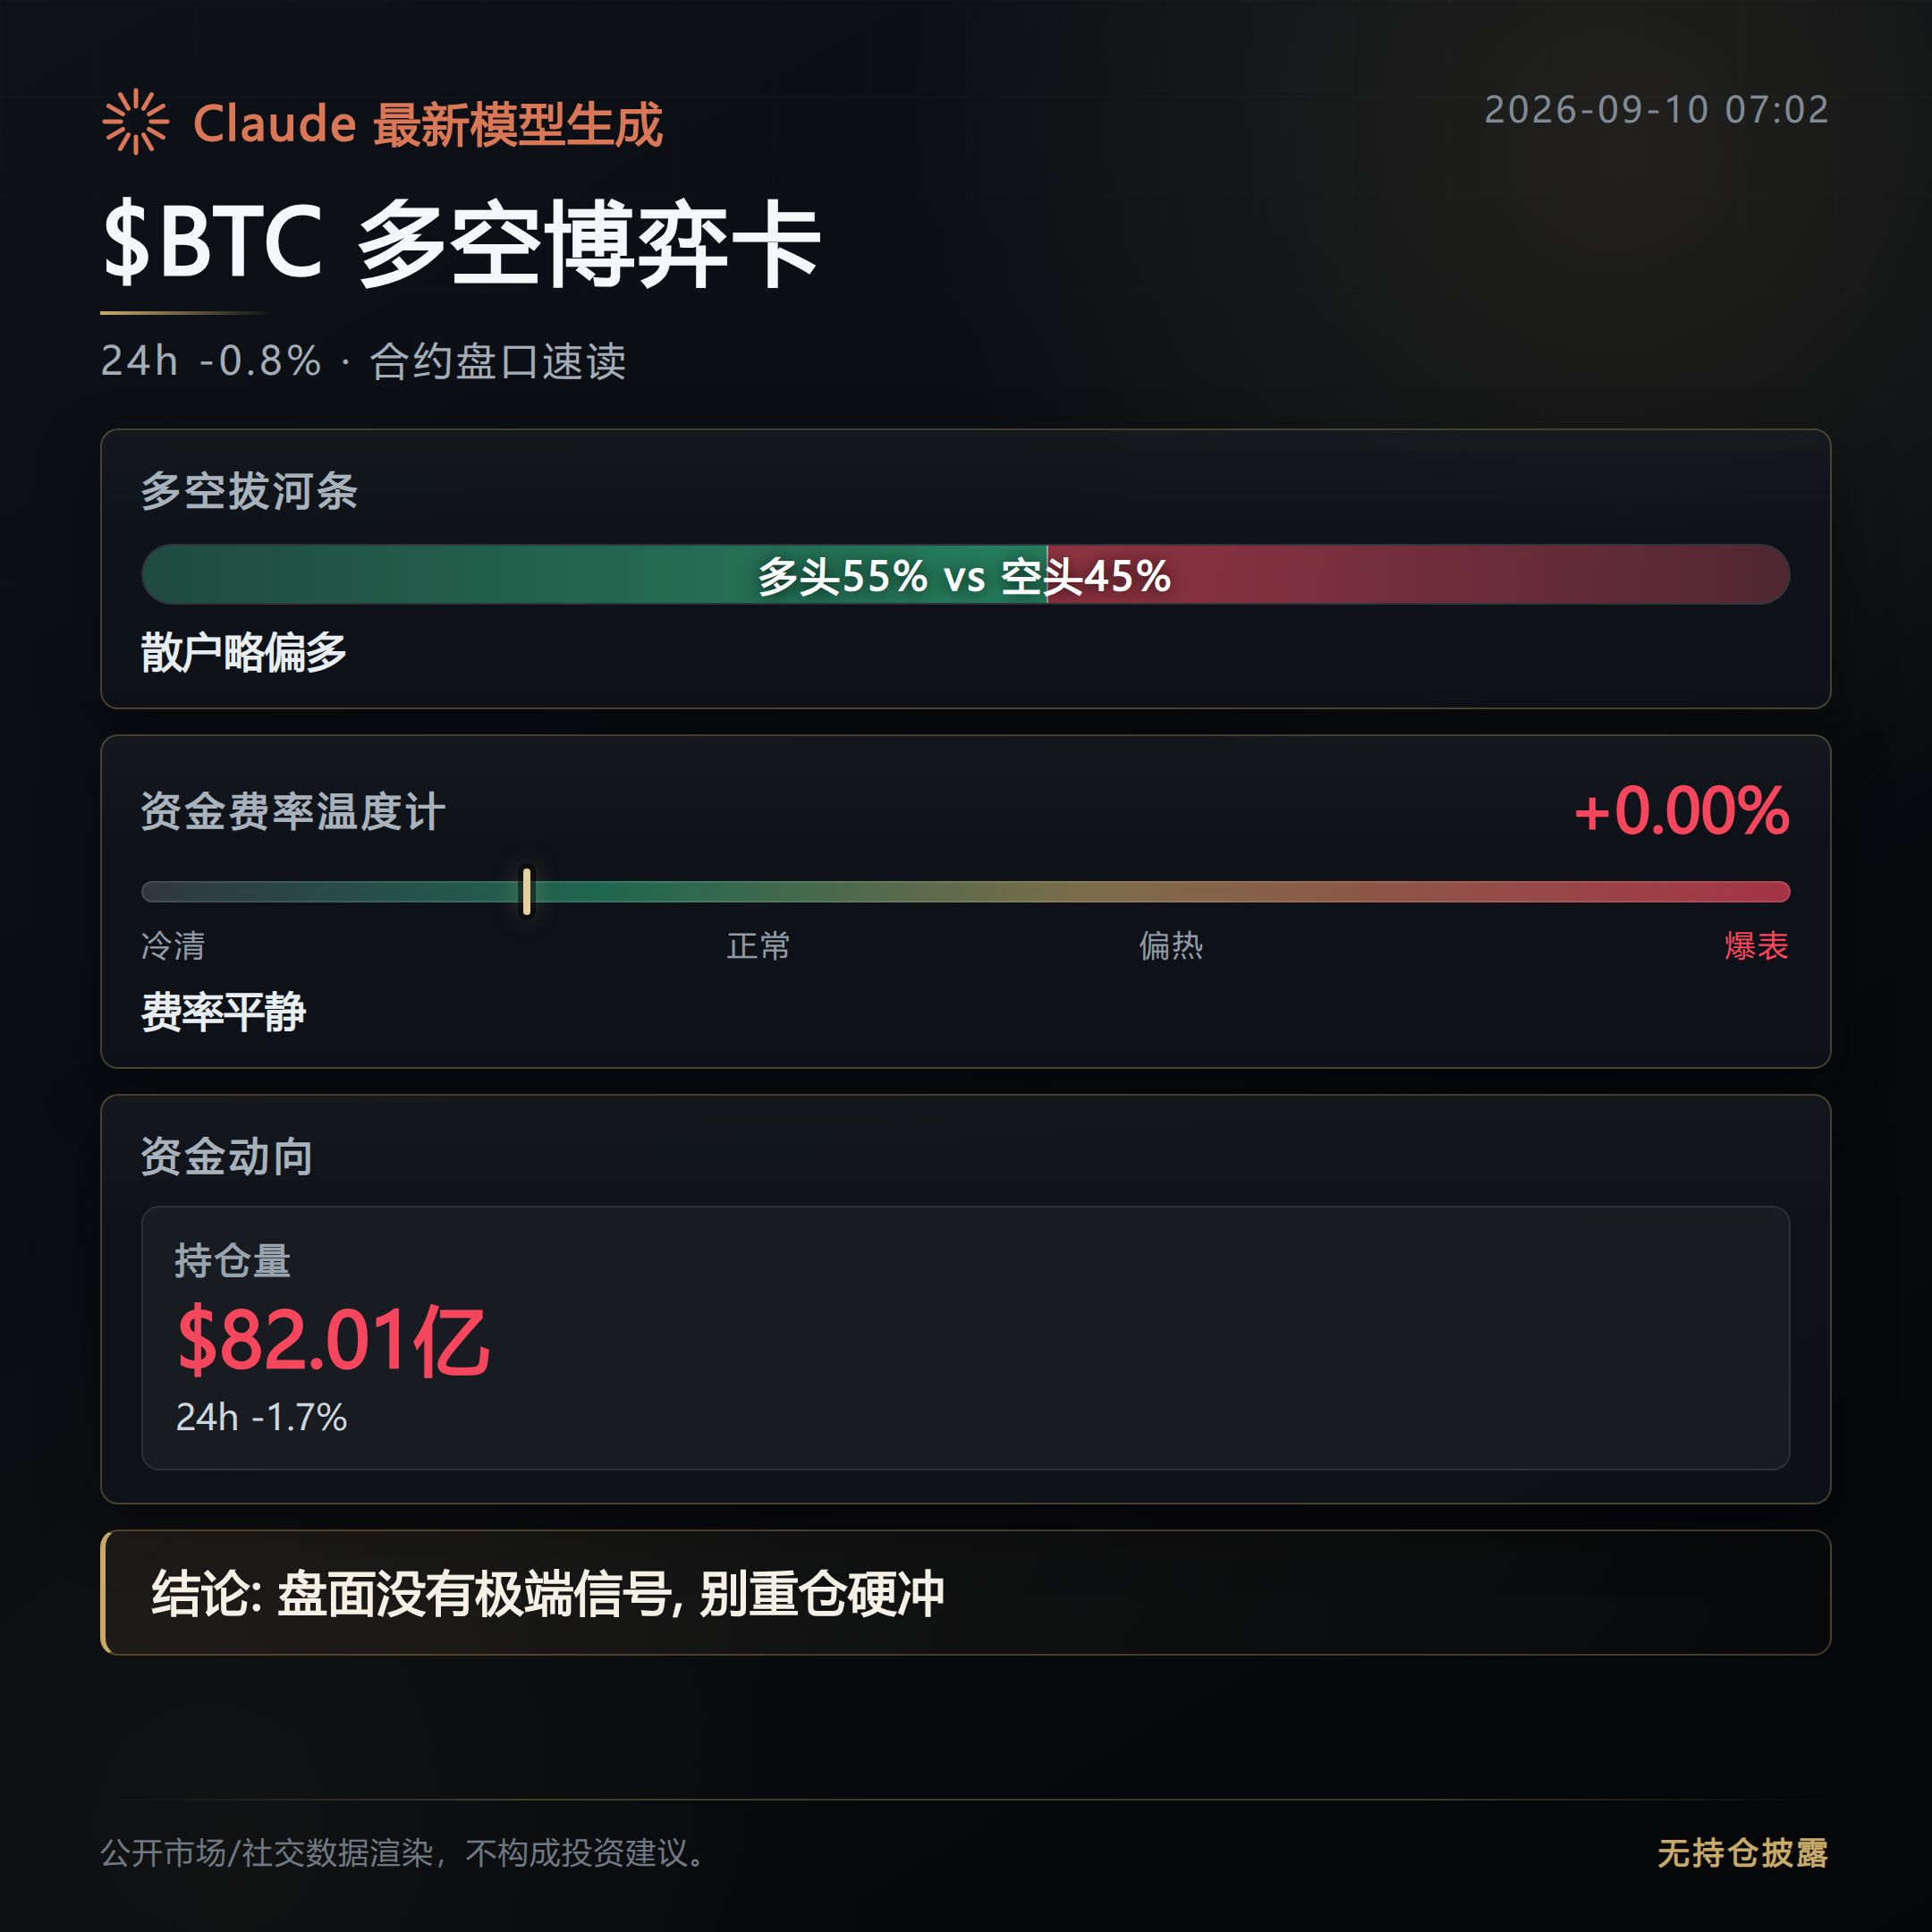
Sell-side orders are dominant: the sellers are putting real money on the line. Yet the funding rate is still positive at 0.0038%, and the long-side share is 55%. That suggests many accounts are still “supporting” with words, but they haven’t really added shorts— they’ve just stayed put.
A blogger dug up old notes about when the total market cap produced a golden cross. The last time it appeared was in 2023—the move then was the starting point of a reversal.
Let’s audit the current outcome: the golden cross is a lagging signal, and the four major perpetual contracts in front are all weakening.
$SOL is down 2.54%, and the funding rate has flipped to -0.9%—shorts are paying in the arena to hold their positions.
$BNB fell the most, down 4.67%, but the funding rate is 0. This indicates the move is being driven by spot selling and sentiment, with leverage not following through.
Ethereum is down 1.49%, funding rate -0.21%, sitting between the two.
When the signal and the result don’t match, I trust the result.
The greed index is still at 66. It diverges from the weakening price action—sentiment hasn’t caught up with the order book. This kind of lagging mismatch will eventually have to be corrected.
Watch both ends in the short term.
The shorts are likely to get squeezed in IOST, BMT, and MIRA—the funding rate is already pushed to below -0.5%.
The crowded longs—NATGAS, TEAM, and VRT—have funding rates turned positive, but not yet to an outrageous level. The real test is whether the funding rate keeps expanding further.
$BTC $SOL $BNB #Funding rate divergence
Live trade log: As of now, this account holds FOGO long positions. As long as the logic remains unchanged, I will keep holding.
Claude Fable 5 helps with content generation; the content is for market information reference only and does not constitute investment advice.
Contract Order Book Daily|9/10 Morning Golden Cross Signal Looks Sweet, While Leverage Is Shrinking
According to a trader, someone on Binance is aggressively dumping $BTC —and the data matches.
The mark price is 77,924, down 0.76%, but open interest has fallen to $8.201 billion, down 1.7% month over month. This looks like falling while reducing positions and exiting, not holding on to wait for a rebound.
Sell-side orders are dominant: the sellers are putting real money on the line. Yet the funding rate is still positive at 0.0038%, and the long-side share is 55%. That suggests many accounts are still “supporting” with words, but they haven’t really added shorts— they’ve just stayed put.
A blogger dug up old notes about when the total market cap produced a golden cross. The last time it appeared was in 2023—the move then was the starting point of a reversal.
Let’s audit the current outcome: the golden cross is a lagging signal, and the four major perpetual contracts in front are all weakening.
$SOL is down 2.54%, and the funding rate has flipped to -0.9%—shorts are paying in the arena to hold their positions.
$BNB fell the most, down 4.67%, but the funding rate is 0. This indicates the move is being driven by spot selling and sentiment, with leverage not following through.
Ethereum is down 1.49%, funding rate -0.21%, sitting between the two.
When the signal and the result don’t match, I trust the result.
The greed index is still at 66. It diverges from the weakening price action—sentiment hasn’t caught up with the order book. This kind of lagging mismatch will eventually have to be corrected.
Watch both ends in the short term.
The shorts are likely to get squeezed in IOST, BMT, and MIRA—the funding rate is already pushed to below -0.5%.
The crowded longs—NATGAS, TEAM, and VRT—have funding rates turned positive, but not yet to an outrageous level. The real test is whether the funding rate keeps expanding further.
$BTC $SOL $BNB #Funding rate divergence
Live trade log: As of now, this account holds FOGO long positions. As long as the logic remains unchanged, I will keep holding.
Claude Fable 5 helps with content generation; the content is for market information reference only and does not constitute investment advice.
According to a trader, someone on Binance is aggressively dumping $BTC —and the data matches.
The mark price is 77,924, down 0.76%, but open interest has fallen to $8.201 billion, down 1.7% month over month. This looks like falling while reducing positions and exiting, not holding on to wait for a rebound.
Sell-side orders are dominant: the sellers are putting real money on the line. Yet the funding rate is still positive at 0.0038%, and the long-side share is 55%. That suggests many accounts are still “supporting” with words, but they haven’t really added shorts— they’ve just stayed put.
A blogger dug up old notes about when the total market cap produced a golden cross. The last time it appeared was in 2023—the move then was the starting point of a reversal.
Let’s audit the current outcome: the golden cross is a lagging signal, and the four major perpetual contracts in front are all weakening.
$SOL is down 2.54%, and the funding rate has flipped to -0.9%—shorts are paying in the arena to hold their positions.
$BNB fell the most, down 4.67%, but the funding rate is 0. This indicates the move is being driven by spot selling and sentiment, with leverage not following through.
Ethereum is down 1.49%, funding rate -0.21%, sitting between the two.
When the signal and the result don’t match, I trust the result.
The greed index is still at 66. It diverges from the weakening price action—sentiment hasn’t caught up with the order book. This kind of lagging mismatch will eventually have to be corrected.
Watch both ends in the short term.
The shorts are likely to get squeezed in IOST, BMT, and MIRA—the funding rate is already pushed to below -0.5%.
The crowded longs—NATGAS, TEAM, and VRT—have funding rates turned positive, but not yet to an outrageous level. The real test is whether the funding rate keeps expanding further.
$BTC $SOL $BNB #Funding rate divergence
Live trade log: As of now, this account holds FOGO long positions. As long as the logic remains unchanged, I will keep holding.
Claude Fable 5 helps with content generation; the content is for market information reference only and does not constitute investment advice.
604
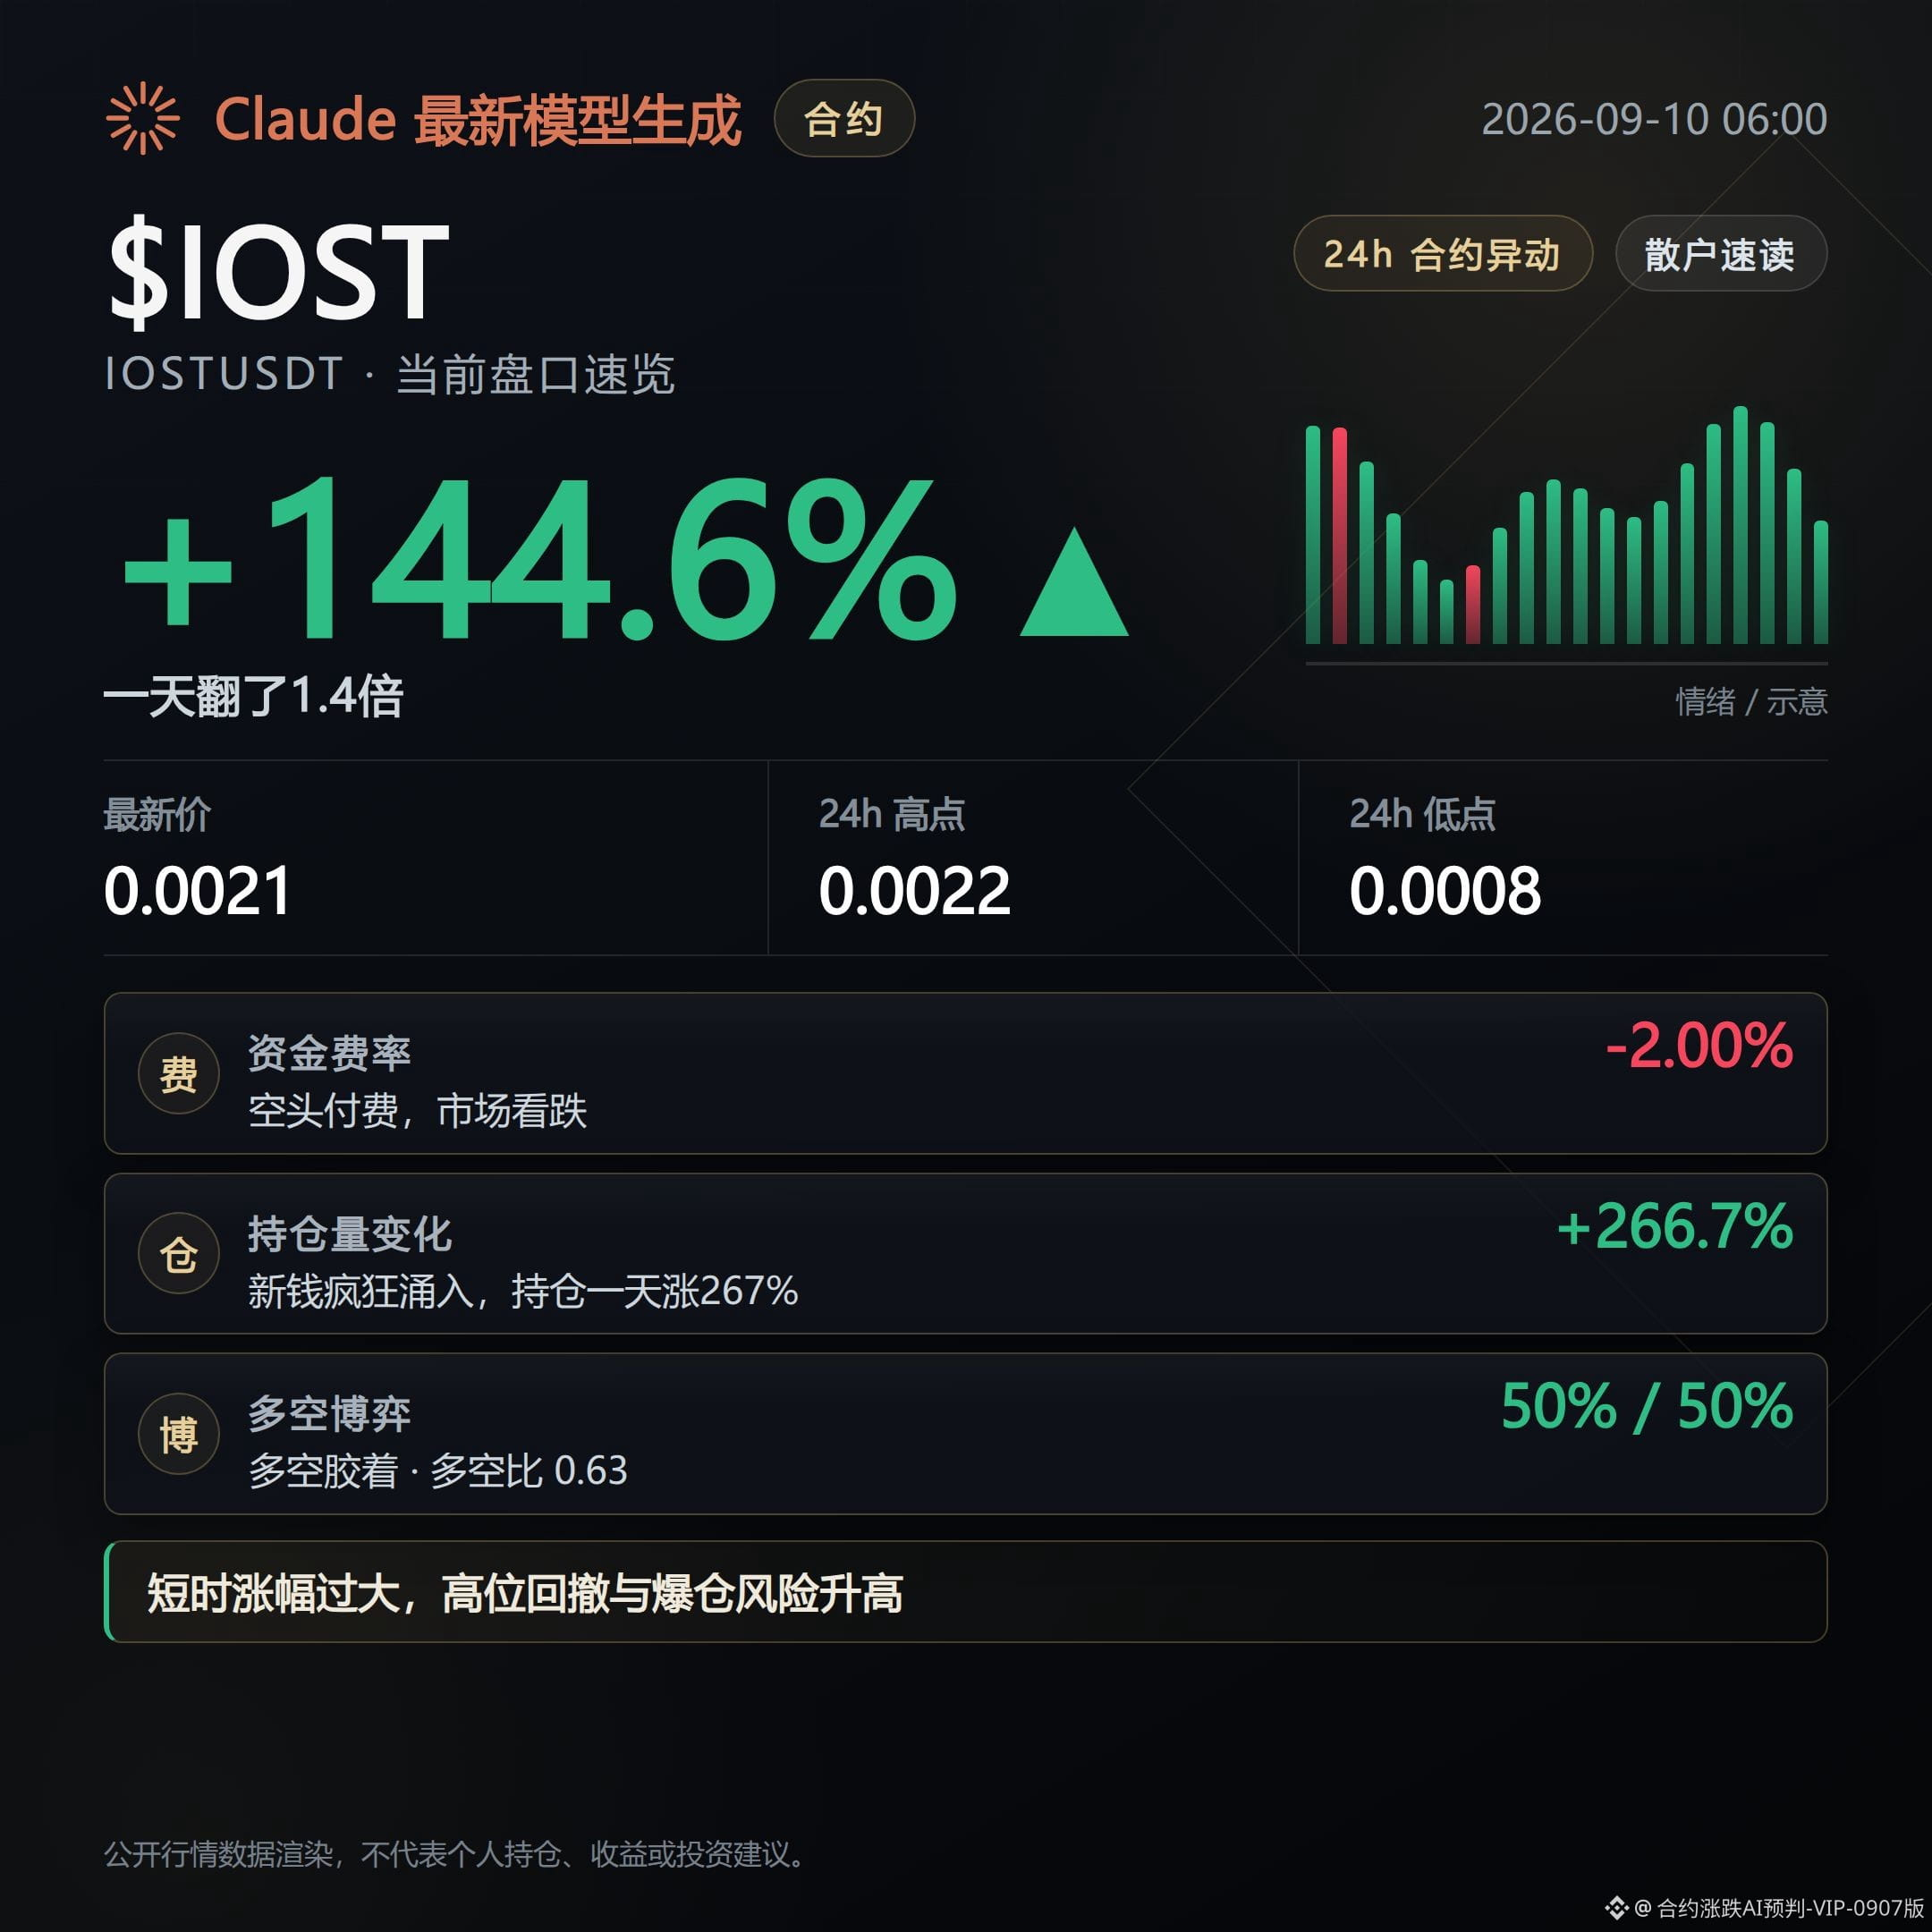
The funding rate is negative down to -2%, yet they’re still hardening through it—this kind of structure isn’t common.
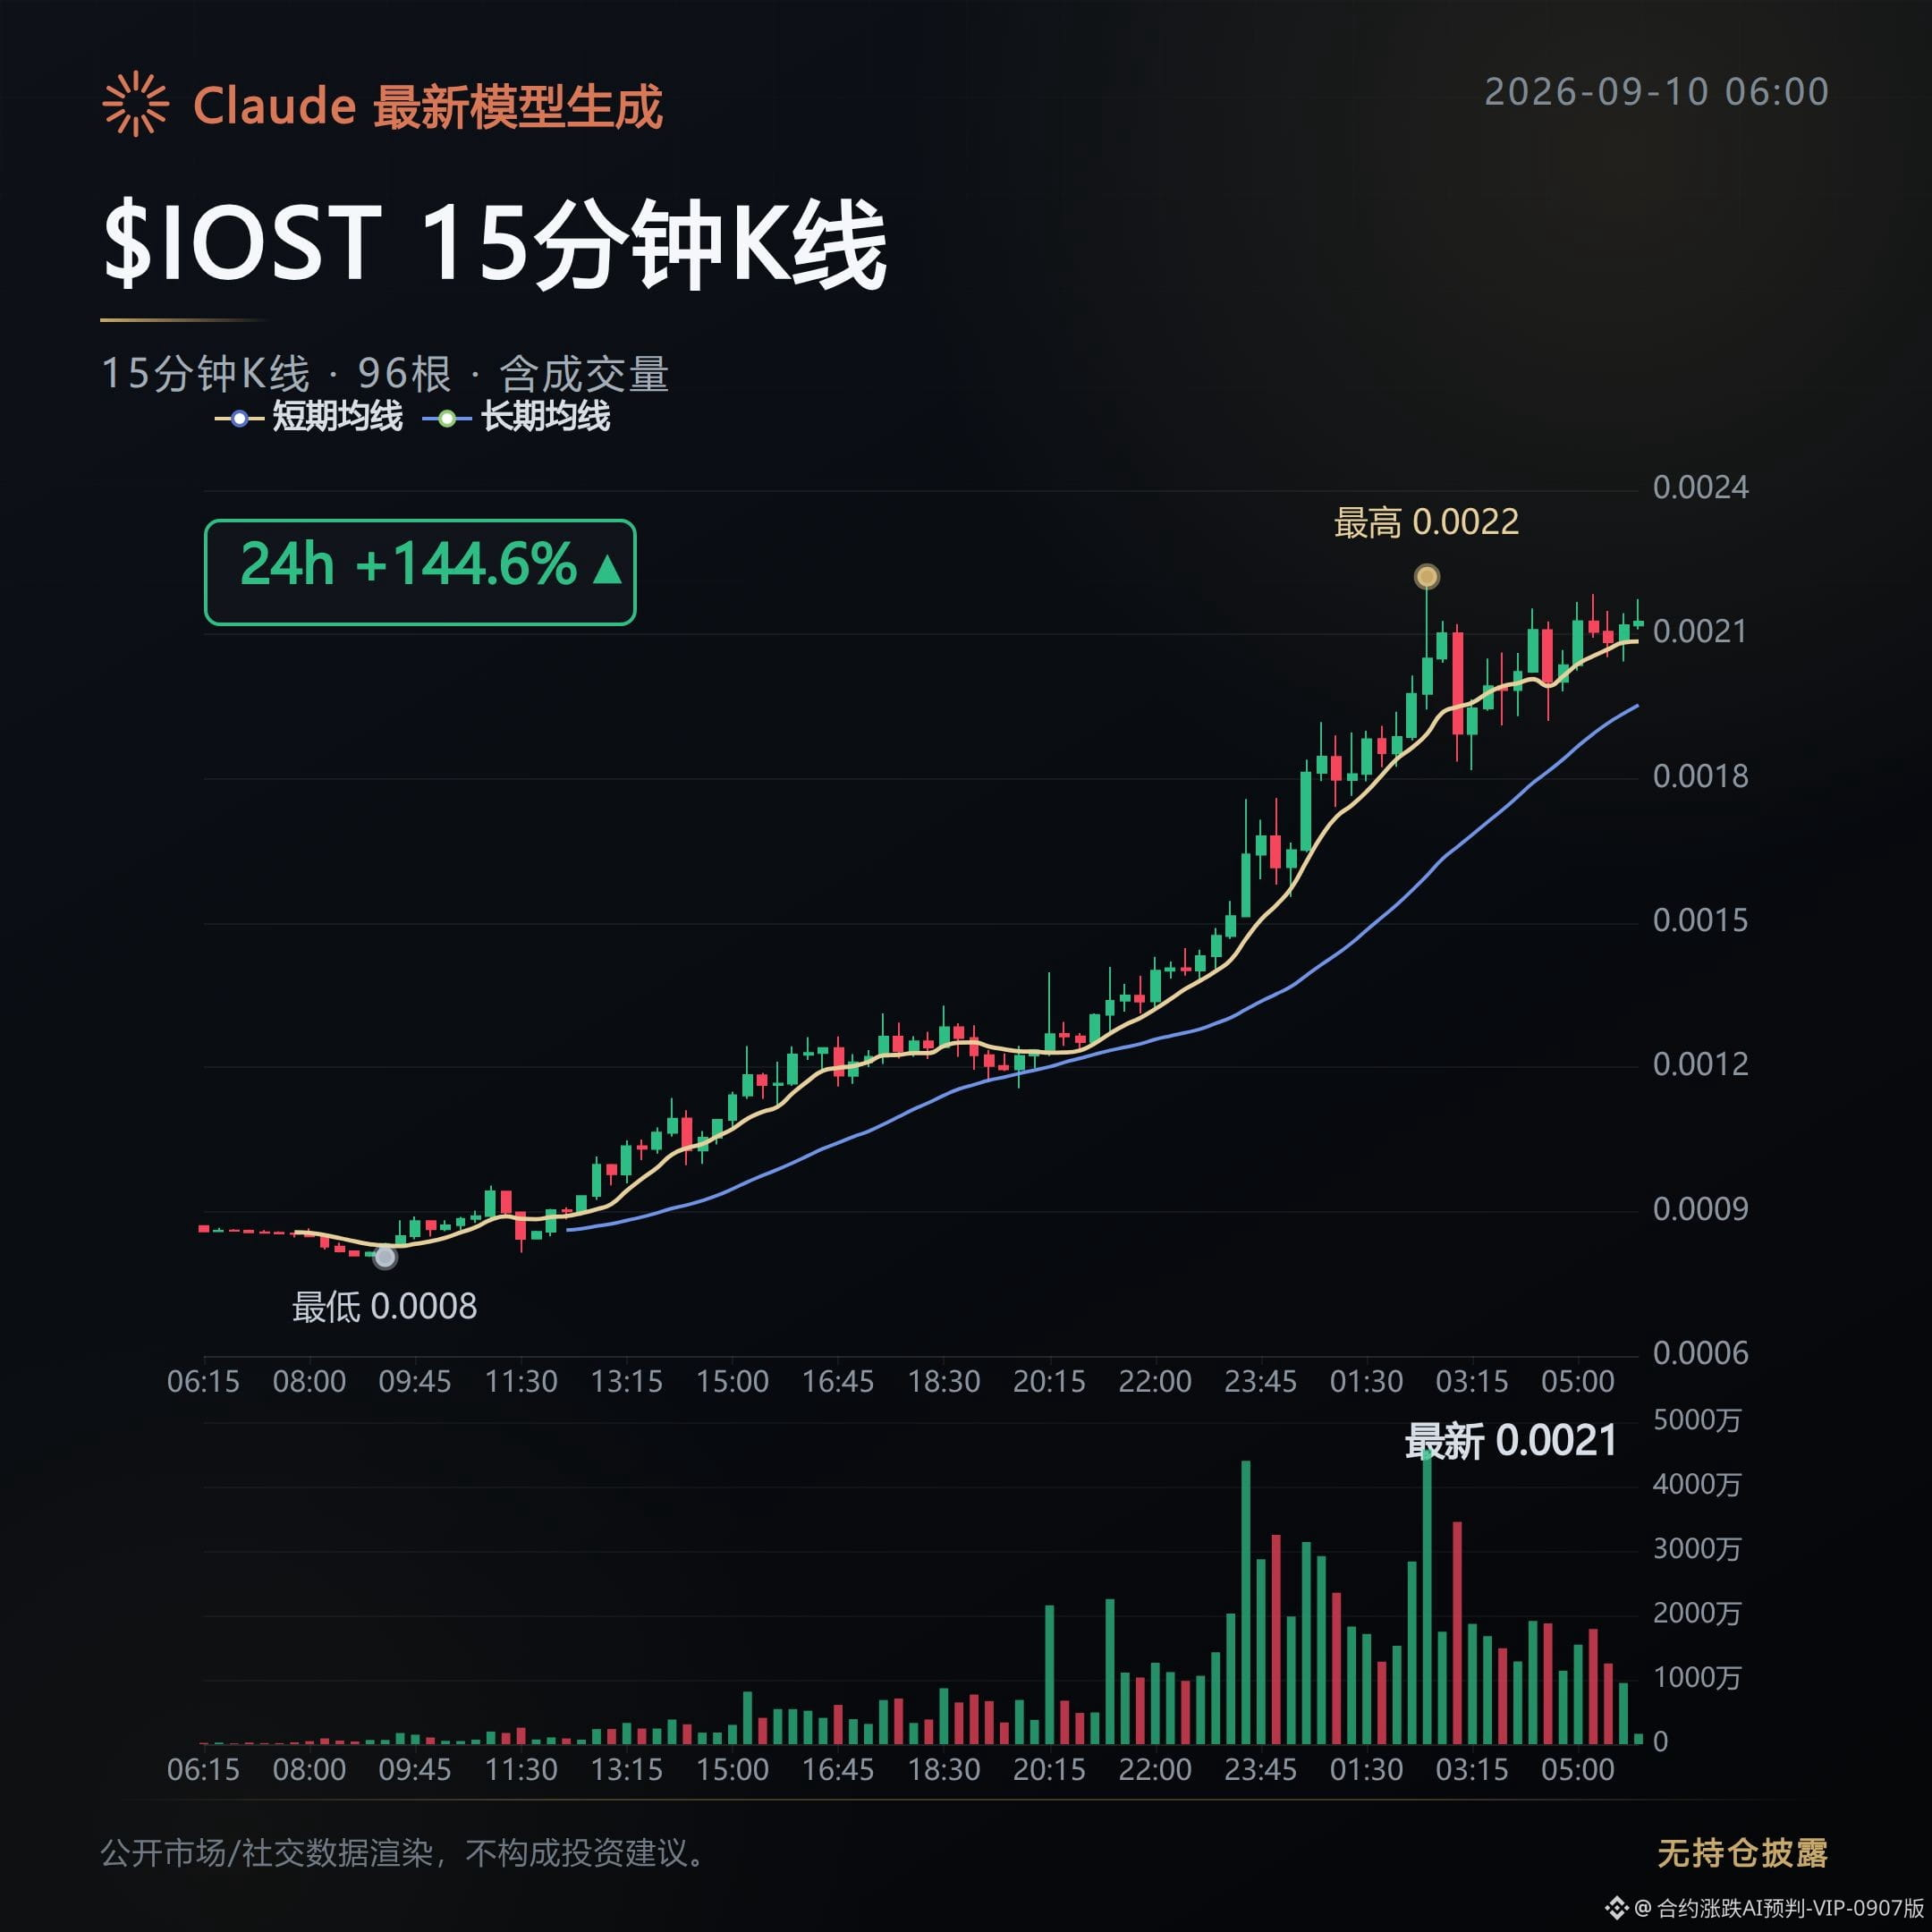
$IOST rose 144.6%, with the price moving from 0.0008 to 0.0021.
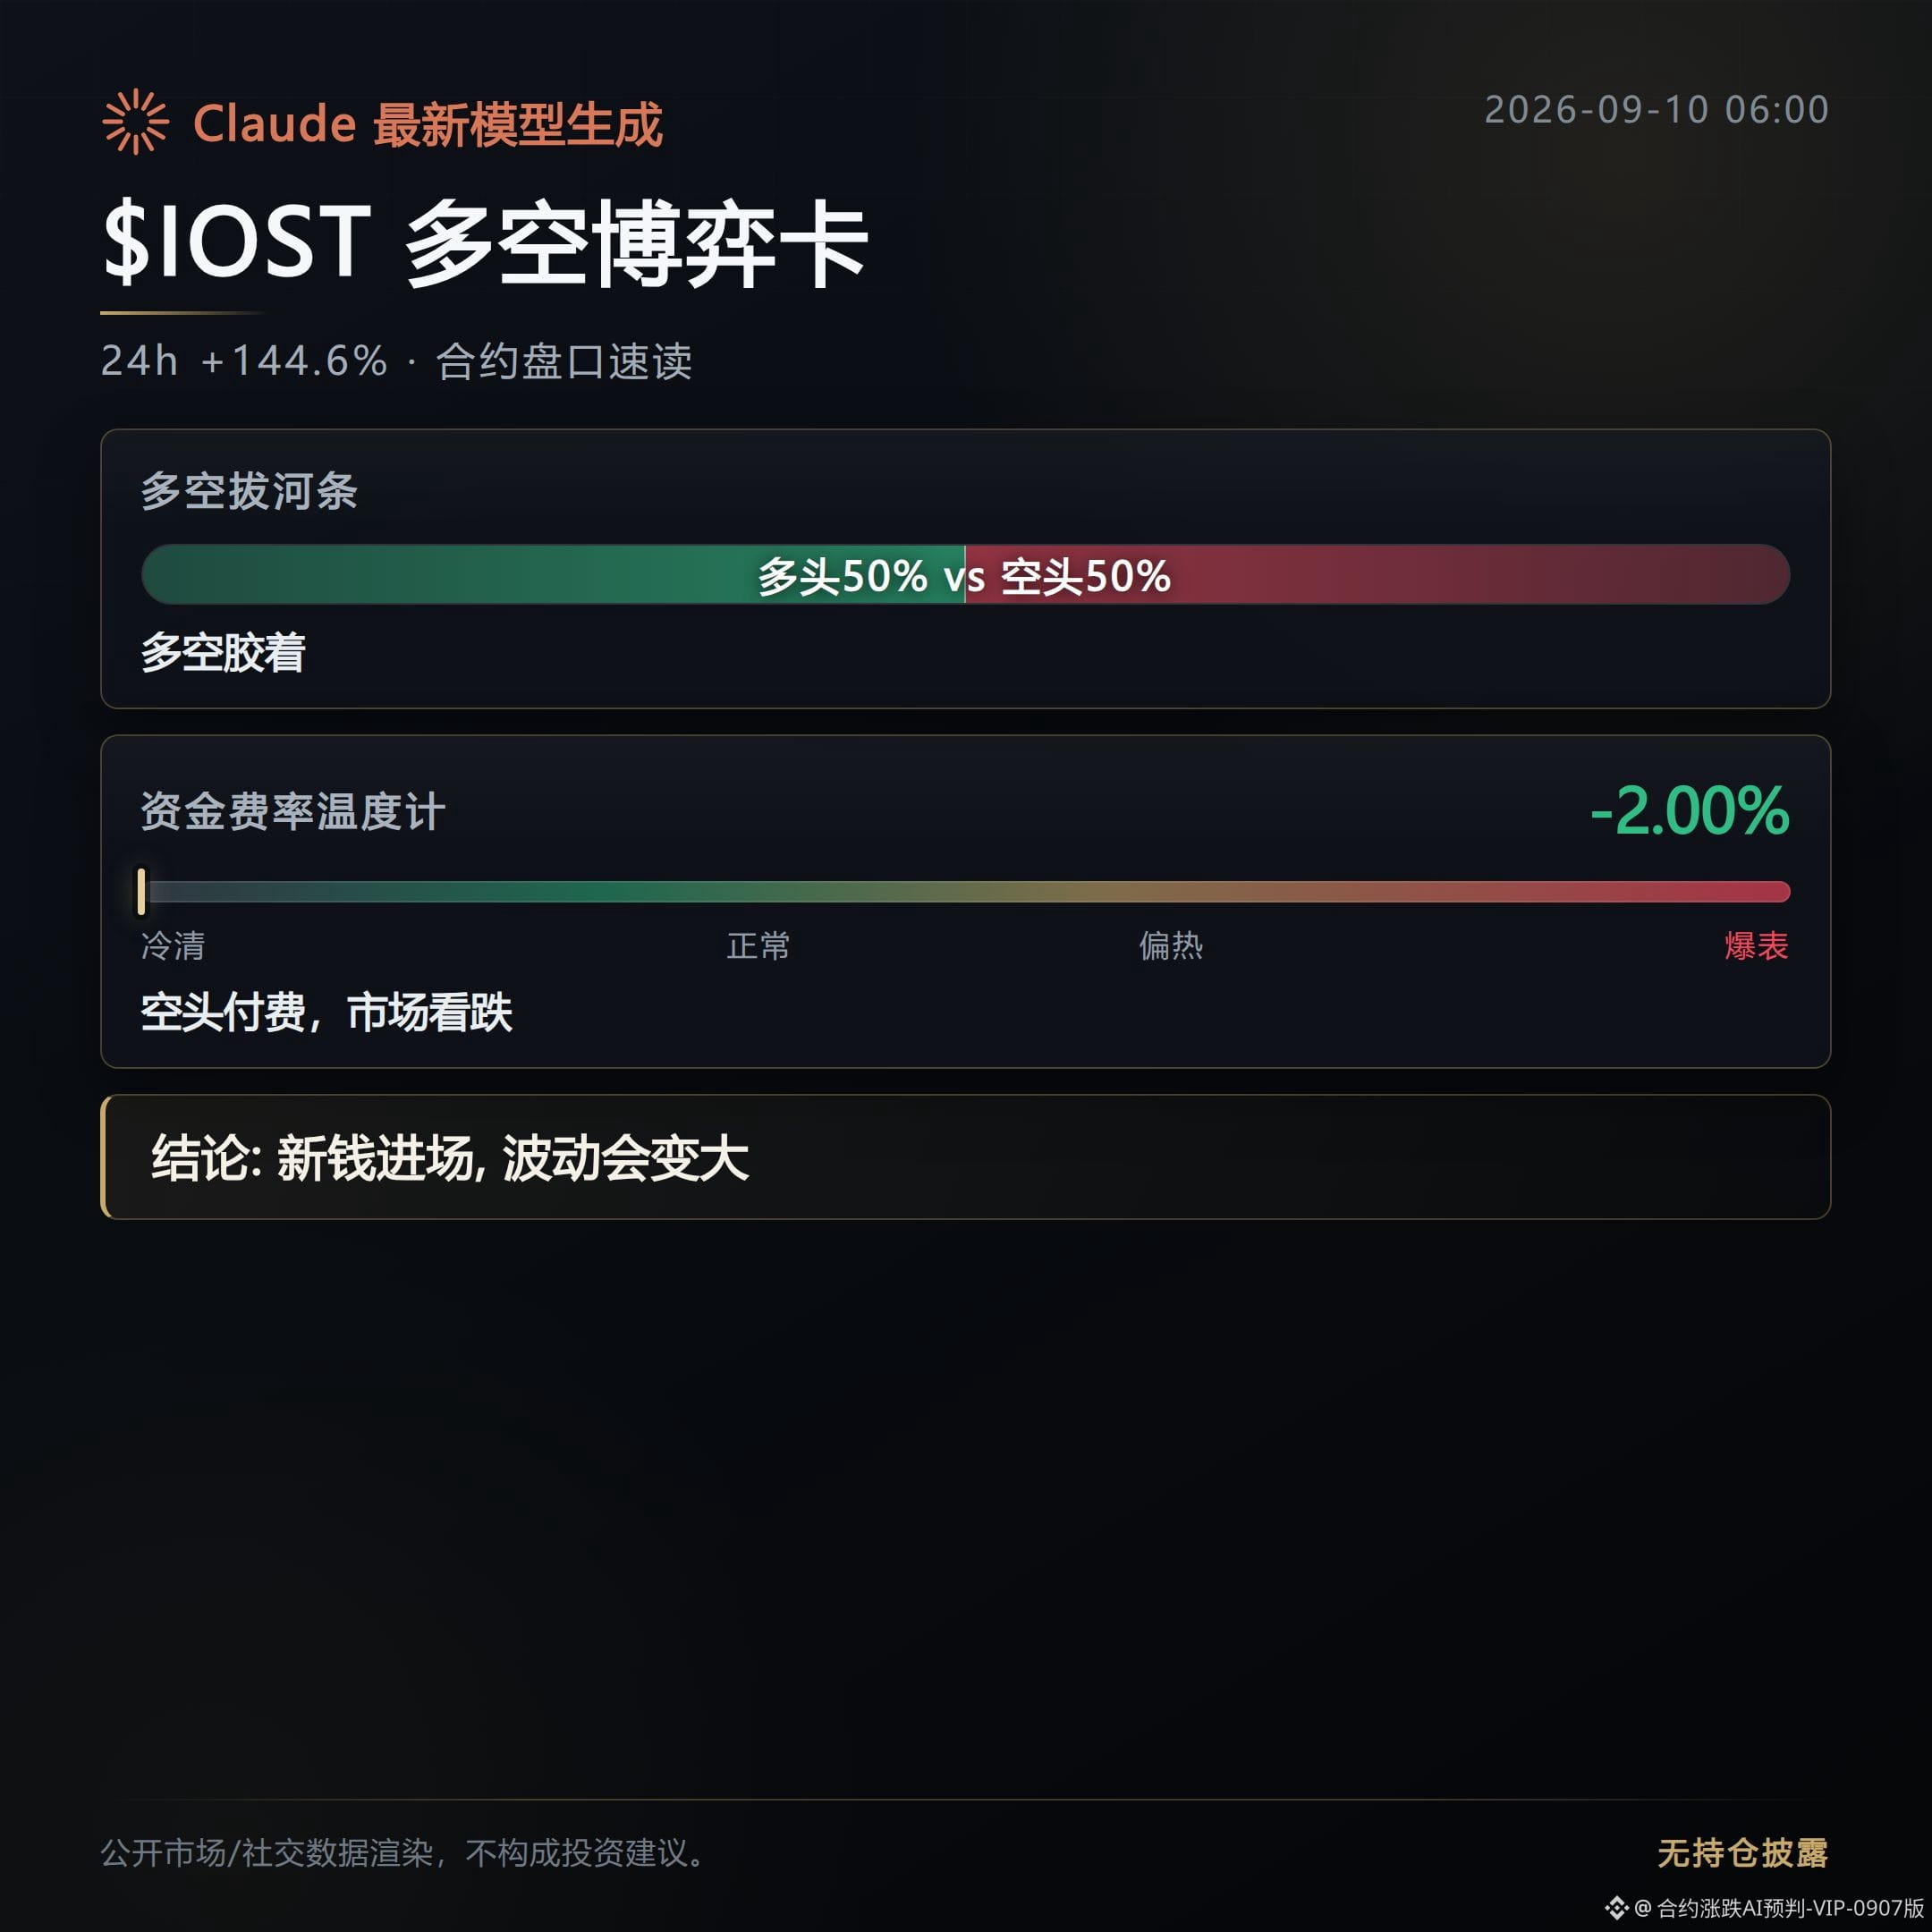
Funding rate is -2.0%; shorts are paying per hour (topping up), while the open interest jumps 266.7% in one hour. This isn’t slow adding—it’s concentrated inflow. The proportion of active buy orders is 1.07, and the long-to-short participant ratio is 0.63, meaning there are still more shorts among retail participants. That doesn’t match the direction of the explosive increase in open interest—classic case of shorts being left hanging in midair.
$KAT rose 31.9%, around the 0.0063 area.
Funding rate at -0.033% is also shorts paying money. Open interest rose 99.5%, and the volume of $144 million is enough to support this kind of move. Active buy orders are 0.93, and the long-to-short ratio is 1.5—this time longs have the participant advantage, and the structure isn’t as twisted, so the rally is a bit steadier.
$BR rose 17.5%, with volume of $34.94 million. Open interest increased 27.1%. The funding rate is still positive at 0.022%. Longs are paying as usual—this is a rare “normal-state” rise in this round. There’s no squeezing structure propping it up; it’s simply pushed up by buy orders.
A quick scan of names ranked 4 to 10: SAHARA and LSK both rose 13.2%, SKU U rose 12.7%, MINA rose 12.3%, XVG rose 11.7%, CROSS rose 10.6%, and PHA rose 9.3%. The complementary down-moves are obvious—the capital is rotating in and out via handoffs.
On the downside: SOPH fell 28.1%, and open interest fell in sync by 30.9%. This is genuinely deleveraging, not dumping. STAR fell 26.1%, but the long-to-short ratio is 1.84—longs still dominate by participant count. With a drop like this, a rebound is likely afterward.
The squeeze signals are clearly laid out: IOST funding rate at -2.0% combined with open interest up 266.7%. Shorts can’t hold this cost burden for long. Watch the open interest changes over the next one or two hours—the inflection-point signal will be very direct.
$IOST $KAT $BR #永续合约 #short-squeeze
Open interest note: This account’s position is a live hold of FOGO long orders. Disclosure is made to keep the content consistent with the actual trades.
This content is assisted by Claude Fable 5 and is for information only—please verify independently.
The funding rate is negative down to -2%, yet they’re still hardening through it—this kind of structure isn’t common.
$IOST rose 144.6%, with the price moving from 0.0008 to 0.0021.
Funding rate is -2.0%; shorts are paying per hour (topping up), while the open interest jumps 266.7% in one hour. This isn’t slow adding—it’s concentrated inflow. The proportion of active buy orders is 1.07, and the long-to-short participant ratio is 0.63, meaning there are still more shorts among retail participants. That doesn’t match the direction of the explosive increase in open interest—classic case of shorts being left hanging in midair.
$KAT rose 31.9%, around the 0.0063 area.
Funding rate at -0.033% is also shorts paying money. Open interest rose 99.5%, and the volume of $144 million is enough to support this kind of move. Active buy orders are 0.93, and the long-to-short ratio is 1.5—this time longs have the participant advantage, and the structure isn’t as twisted, so the rally is a bit steadier.
$BR rose 17.5%, with volume of $34.94 million. Open interest increased 27.1%. The funding rate is still positive at 0.022%. Longs are paying as usual—this is a rare “normal-state” rise in this round. There’s no squeezing structure propping it up; it’s simply pushed up by buy orders.
A quick scan of names ranked 4 to 10: SAHARA and LSK both rose 13.2%, SKU U rose 12.7%, MINA rose 12.3%, XVG rose 11.7%, CROSS rose 10.6%, and PHA rose 9.3%. The complementary down-moves are obvious—the capital is rotating in and out via handoffs.
On the downside: SOPH fell 28.1%, and open interest fell in sync by 30.9%. This is genuinely deleveraging, not dumping. STAR fell 26.1%, but the long-to-short ratio is 1.84—longs still dominate by participant count. With a drop like this, a rebound is likely afterward.
The squeeze signals are clearly laid out: IOST funding rate at -2.0% combined with open interest up 266.7%. Shorts can’t hold this cost burden for long. Watch the open interest changes over the next one or two hours—the inflection-point signal will be very direct.
$IOST $KAT $BR #永续合约 #short-squeeze
Open interest note: This account’s position is a live hold of FOGO long orders. Disclosure is made to keep the content consistent with the actual trades.
This content is assisted by Claude Fable 5 and is for information only—please verify independently.
$IOST rose 144.6%, with the price moving from 0.0008 to 0.0021.
Funding rate is -2.0%; shorts are paying per hour (topping up), while the open interest jumps 266.7% in one hour. This isn’t slow adding—it’s concentrated inflow. The proportion of active buy orders is 1.07, and the long-to-short participant ratio is 0.63, meaning there are still more shorts among retail participants. That doesn’t match the direction of the explosive increase in open interest—classic case of shorts being left hanging in midair.
$KAT rose 31.9%, around the 0.0063 area.
Funding rate at -0.033% is also shorts paying money. Open interest rose 99.5%, and the volume of $144 million is enough to support this kind of move. Active buy orders are 0.93, and the long-to-short ratio is 1.5—this time longs have the participant advantage, and the structure isn’t as twisted, so the rally is a bit steadier.
$BR rose 17.5%, with volume of $34.94 million. Open interest increased 27.1%. The funding rate is still positive at 0.022%. Longs are paying as usual—this is a rare “normal-state” rise in this round. There’s no squeezing structure propping it up; it’s simply pushed up by buy orders.
A quick scan of names ranked 4 to 10: SAHARA and LSK both rose 13.2%, SKU U rose 12.7%, MINA rose 12.3%, XVG rose 11.7%, CROSS rose 10.6%, and PHA rose 9.3%. The complementary down-moves are obvious—the capital is rotating in and out via handoffs.
On the downside: SOPH fell 28.1%, and open interest fell in sync by 30.9%. This is genuinely deleveraging, not dumping. STAR fell 26.1%, but the long-to-short ratio is 1.84—longs still dominate by participant count. With a drop like this, a rebound is likely afterward.
The squeeze signals are clearly laid out: IOST funding rate at -2.0% combined with open interest up 266.7%. Shorts can’t hold this cost burden for long. Watch the open interest changes over the next one or two hours—the inflection-point signal will be very direct.
$IOST $KAT $BR #永续合约 #short-squeeze
Open interest note: This account’s position is a live hold of FOGO long orders. Disclosure is made to keep the content consistent with the actual trades.
This content is assisted by Claude Fable 5 and is for information only—please verify independently.
784
Today, in the contract market, wallets are circling among a few thin-liquidity coins; there’s basically nothing worth talking about elsewhere.
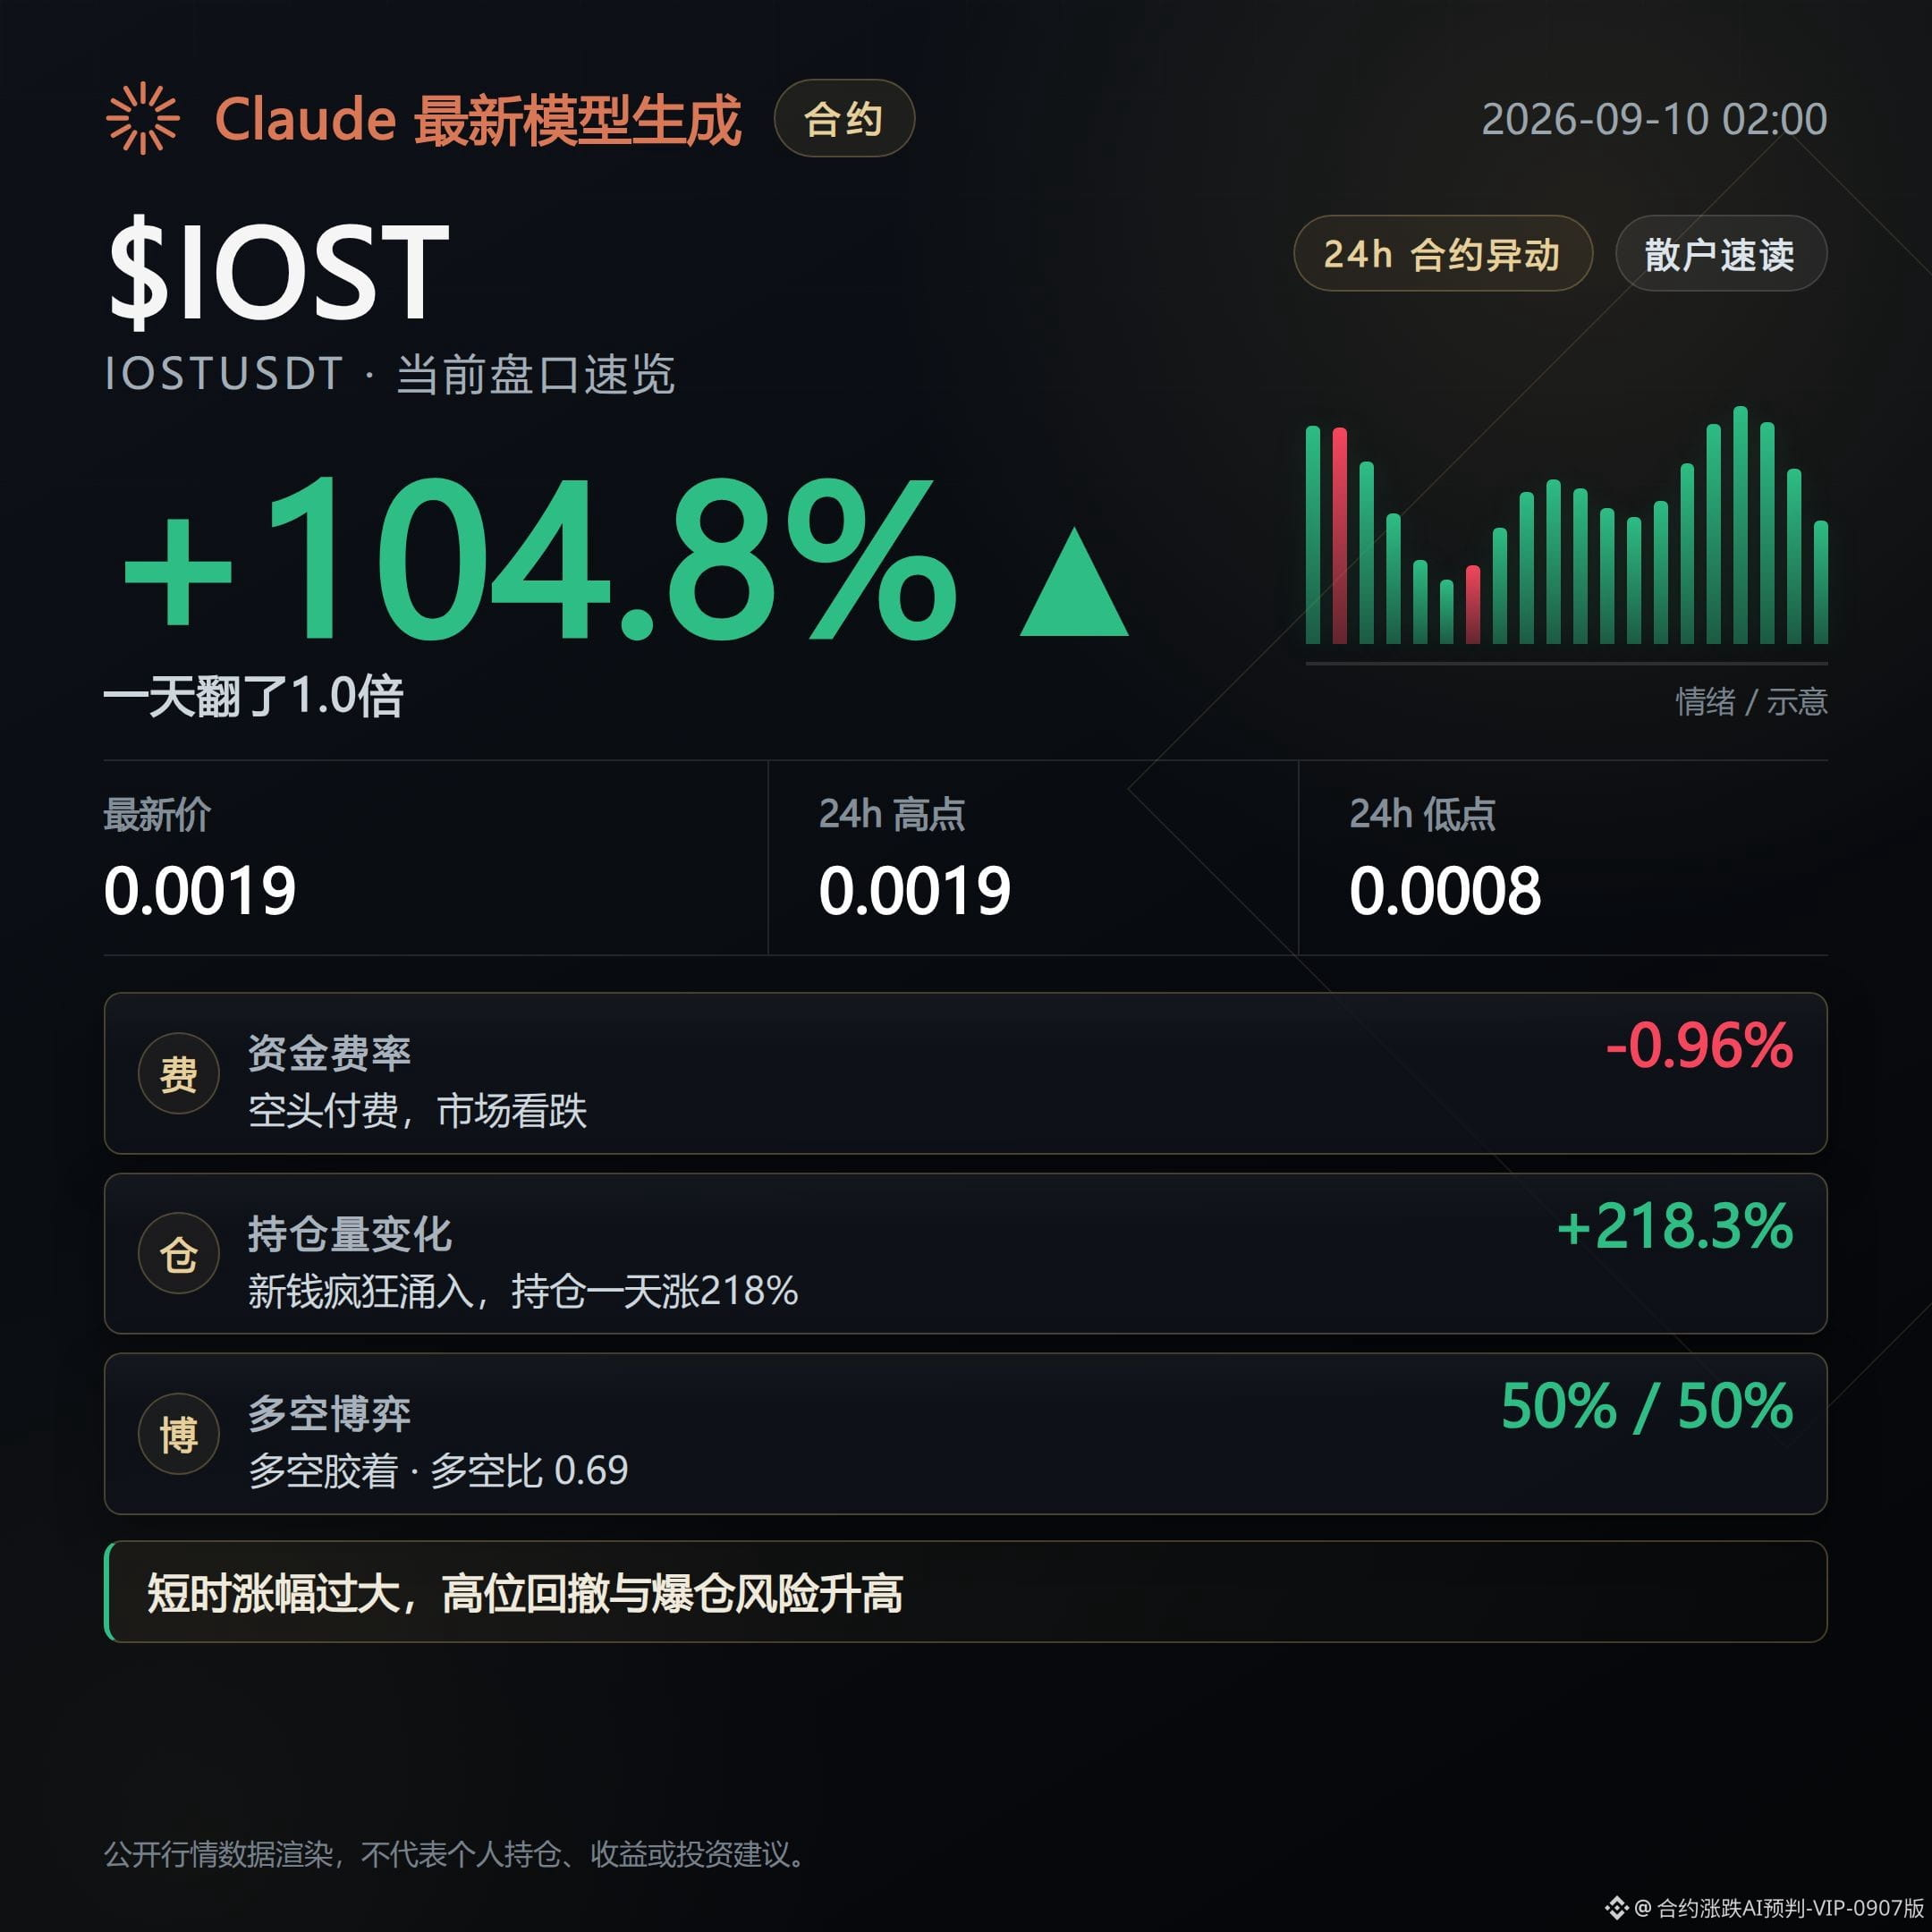
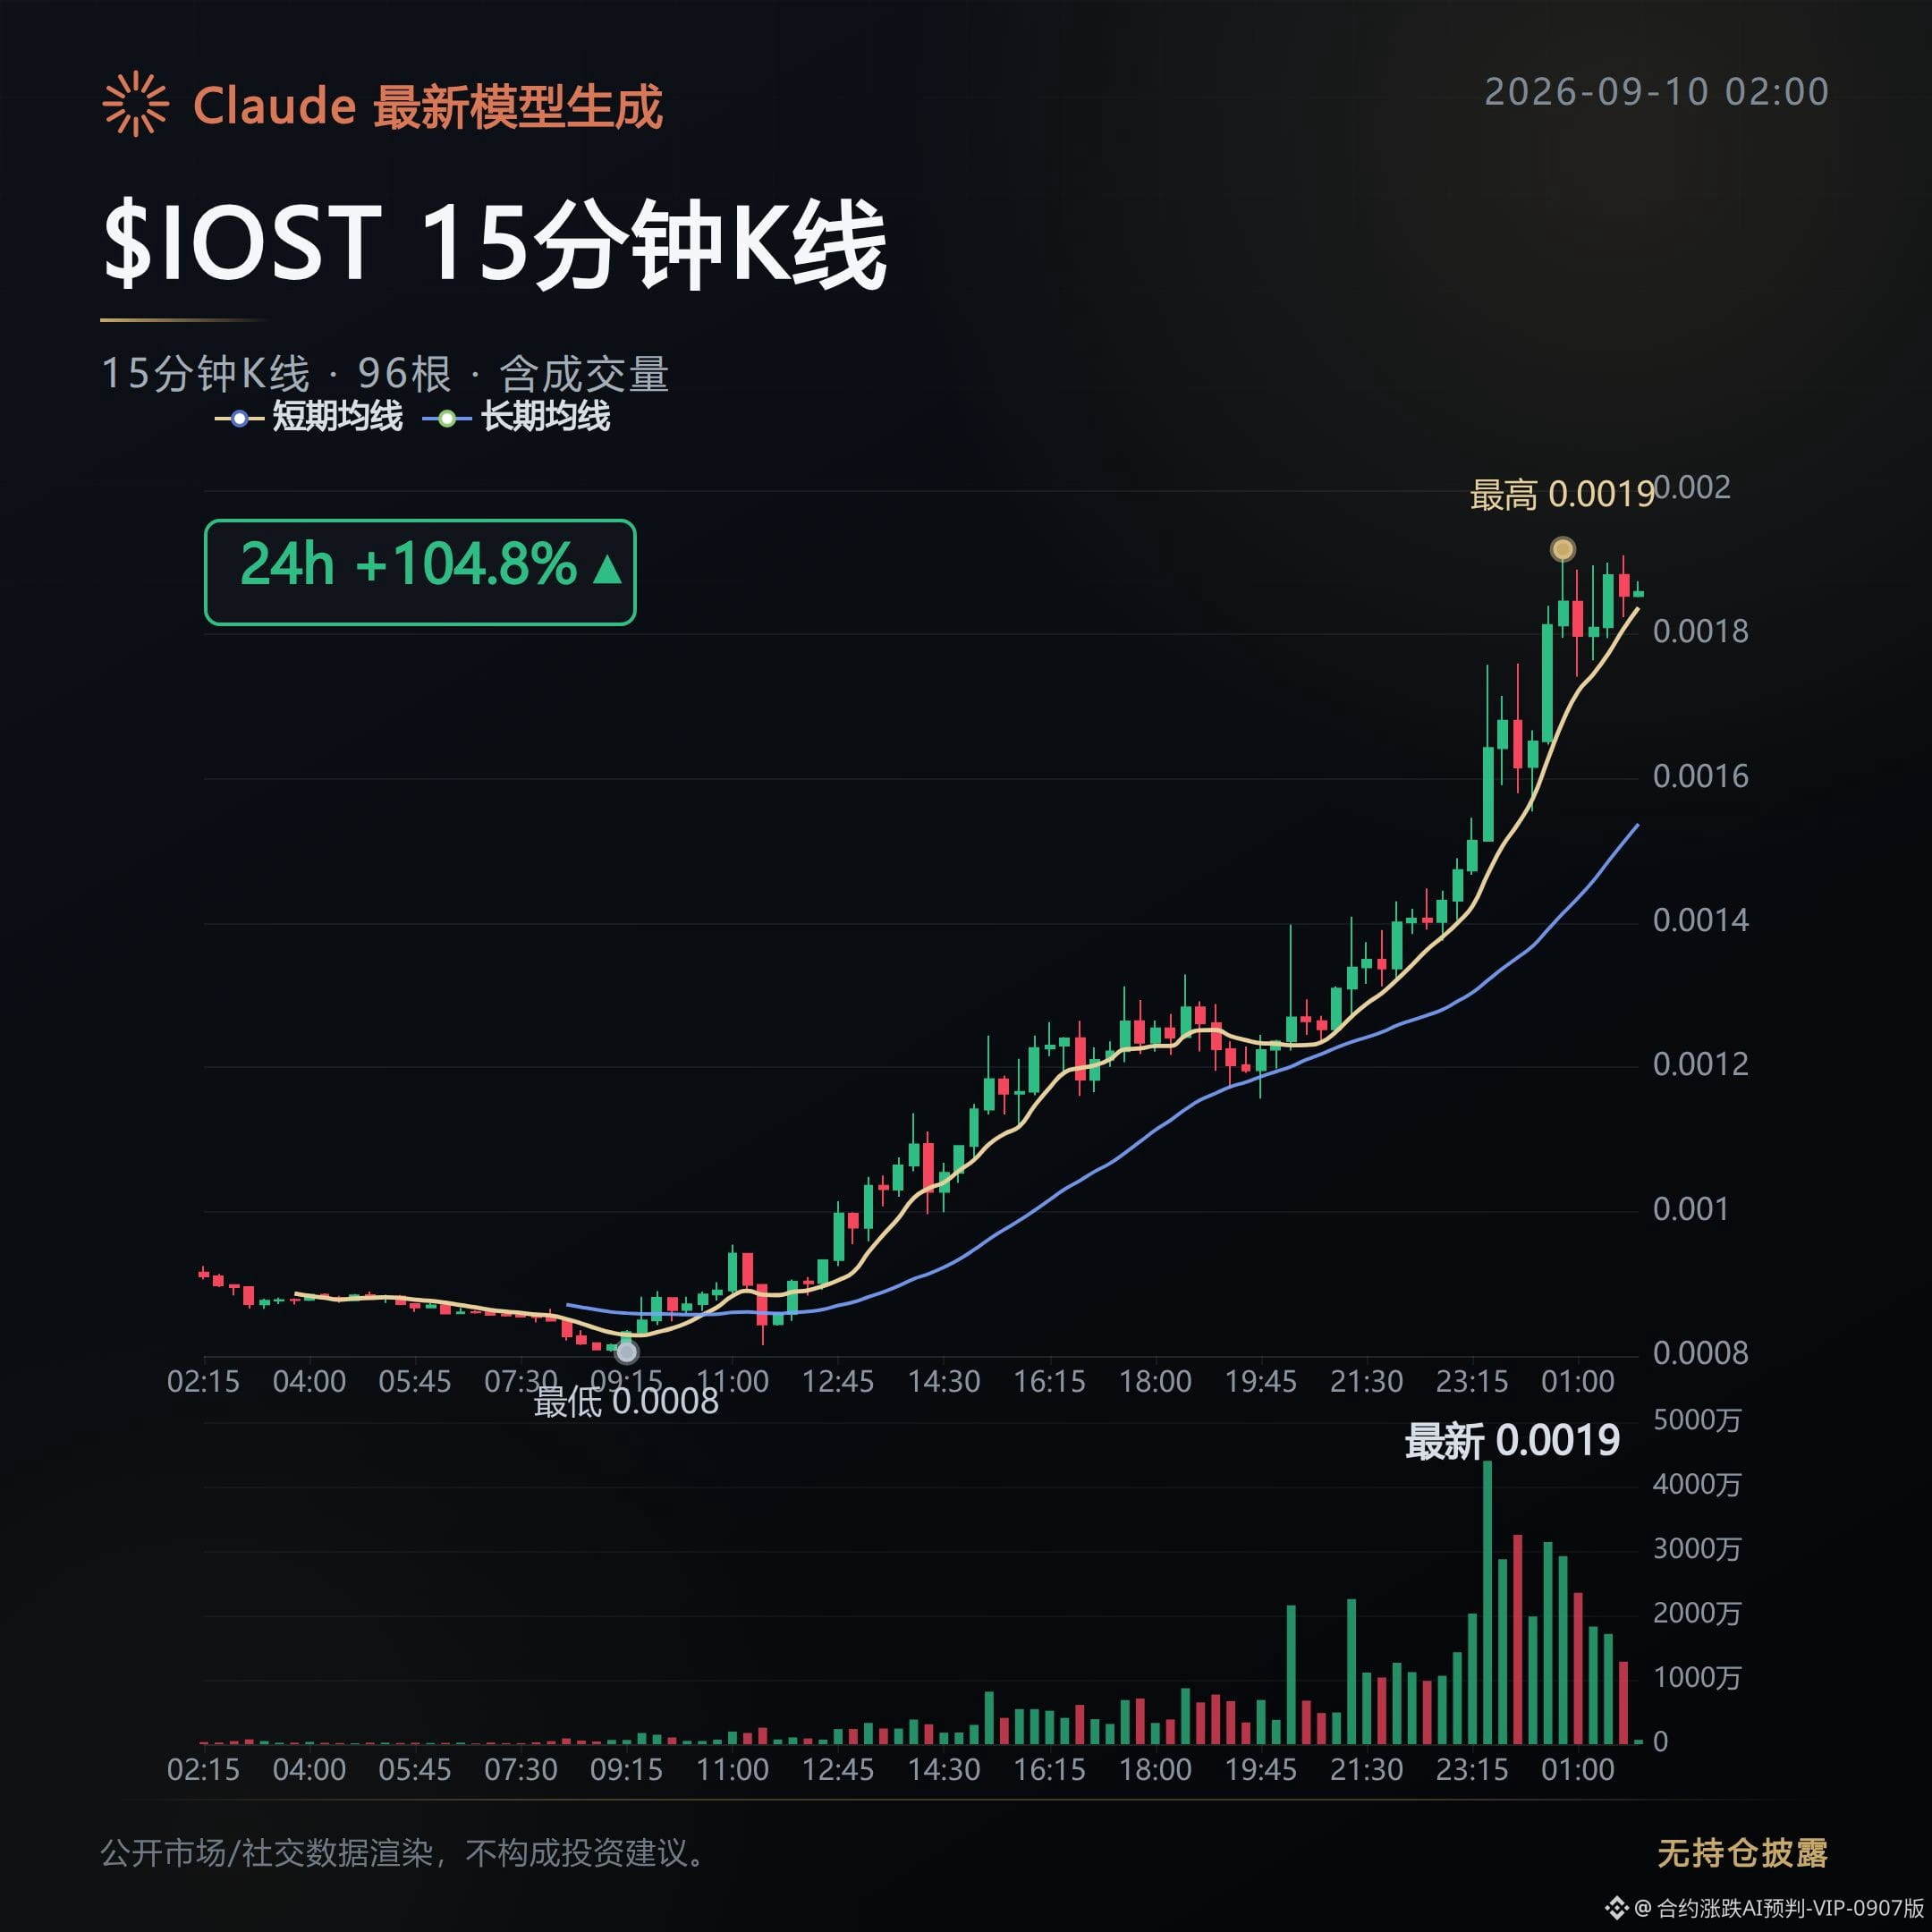
$IOST rose 104.8%, the only asset today whose data was completely topped out.
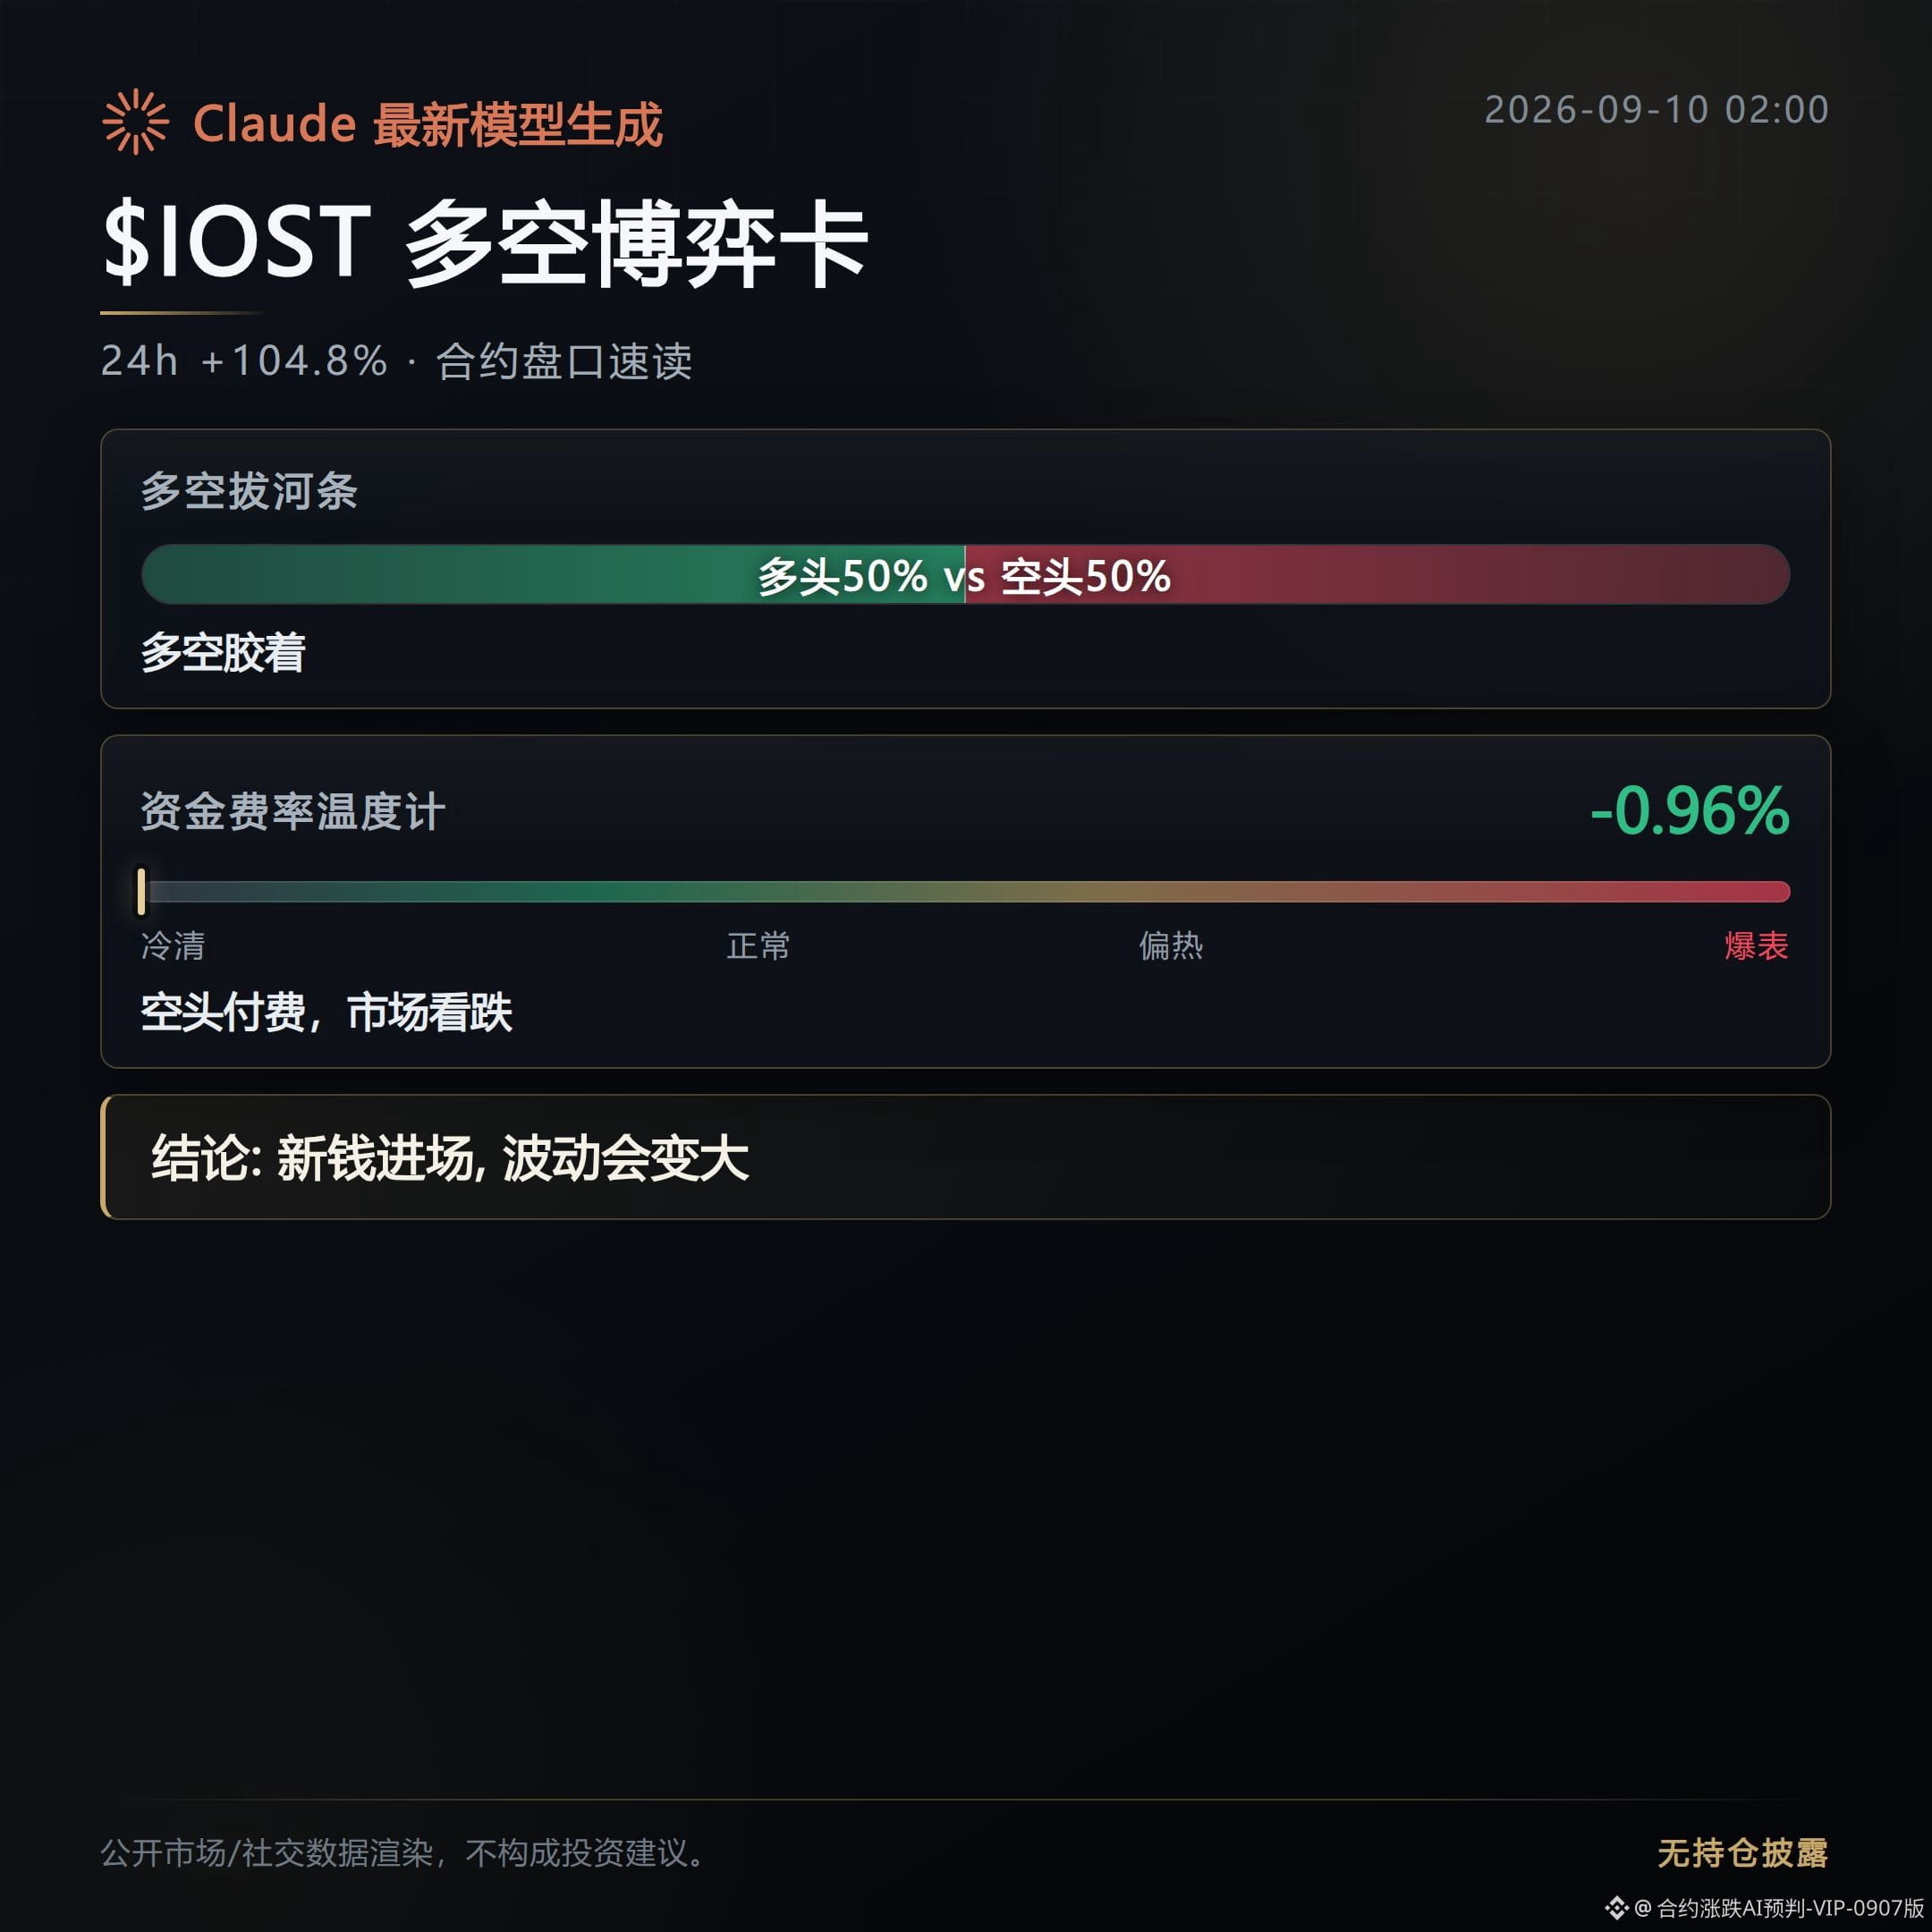
Shorts paid funding fees down to -0.964%. This kind of extreme negative value means shorts are essentially paying to stubbornly hold their positions.
At the same time, open interest surged 218.3% within an hour, and trading volume of $580 million also kept up—there’s no indication of a hollow, spin-up move.
Comparing with yesterday’s similar signals, this combination—funding rates and open interest both running to extremes—historically tends to have decent continuation. It’s worth watching to see whether it then causes a subsequent drop or whether squeezes keep intensifying.
$KAT rose 25.9%; its structure looks very similar to IOST. With funding rate at -0.164% boosting it alongside a 70.8% jump in open interest, it’s in the same batch of names being hard-pressed by shorts, though the strength is clearly one tier lower.
$PHA rose 20.4%; open interest rose 91.9%—that number is very eye-catching—but the funding rate is only -0.01%. This suggests this wave is more like new money rushing in to open positions, not something forced by shorts. Its nature is different from the first two, so don’t group it together.
From ranks 4 to 10: RAYSOL rose 19.2%, COTI and BULLA rose in sync at 13.5%, BR rose 13.4%, VVV rose 12.9%, GRASS rose 12.1%, and NEAR rose 11.8%. This batch is a broad-based up-move, but none of them pushed both open interest and funding rate to extremes like the top three. The evidence from volume isn’t hard enough.
For now, the only squeeze candidate recognized is IOST. The cost of shorts paying -0.964% is already the most extreme reading of the day. The longer they refuse to close, the more likely it is that they’ll be squeezed into a further bout of upward action.
On the downside: STAR fell 23.2%, SOPH fell 19.4%, and APR fell 18.6%. But all three saw their open interest shrink, and the long-side ratio is still relatively high. It looks more like longs are cutting and exiting on their own, not shorts actively launching an offensive—so it doesn’t form a reliable comparison signal for now.
Overall, the atmosphere is that funds are huddling together in a few low-float coins to set up a play/arrangement. The main focus remains whether the IOST short-hard-pressed structure can continue to play out.
#IOST #KAT #contract anomaly
Real-account disclosure: This account currently holds FOGO long positions; the related views match the actual position.
This content was generated with assistance from Claude Fable 5 and is for reference only. Please verify it yourself.
Today, in the contract market, wallets are circling among a few thin-liquidity coins; there’s basically nothing worth talking about elsewhere.
$IOST rose 104.8%, the only asset today whose data was completely topped out.
Shorts paid funding fees down to -0.964%. This kind of extreme negative value means shorts are essentially paying to stubbornly hold their positions.
At the same time, open interest surged 218.3% within an hour, and trading volume of $580 million also kept up—there’s no indication of a hollow, spin-up move.
Comparing with yesterday’s similar signals, this combination—funding rates and open interest both running to extremes—historically tends to have decent continuation. It’s worth watching to see whether it then causes a subsequent drop or whether squeezes keep intensifying.
$KAT rose 25.9%; its structure looks very similar to IOST. With funding rate at -0.164% boosting it alongside a 70.8% jump in open interest, it’s in the same batch of names being hard-pressed by shorts, though the strength is clearly one tier lower.
$PHA rose 20.4%; open interest rose 91.9%—that number is very eye-catching—but the funding rate is only -0.01%. This suggests this wave is more like new money rushing in to open positions, not something forced by shorts. Its nature is different from the first two, so don’t group it together.
From ranks 4 to 10: RAYSOL rose 19.2%, COTI and BULLA rose in sync at 13.5%, BR rose 13.4%, VVV rose 12.9%, GRASS rose 12.1%, and NEAR rose 11.8%. This batch is a broad-based up-move, but none of them pushed both open interest and funding rate to extremes like the top three. The evidence from volume isn’t hard enough.
For now, the only squeeze candidate recognized is IOST. The cost of shorts paying -0.964% is already the most extreme reading of the day. The longer they refuse to close, the more likely it is that they’ll be squeezed into a further bout of upward action.
On the downside: STAR fell 23.2%, SOPH fell 19.4%, and APR fell 18.6%. But all three saw their open interest shrink, and the long-side ratio is still relatively high. It looks more like longs are cutting and exiting on their own, not shorts actively launching an offensive—so it doesn’t form a reliable comparison signal for now.
Overall, the atmosphere is that funds are huddling together in a few low-float coins to set up a play/arrangement. The main focus remains whether the IOST short-hard-pressed structure can continue to play out.
#IOST #KAT #contract anomaly
Real-account disclosure: This account currently holds FOGO long positions; the related views match the actual position.
This content was generated with assistance from Claude Fable 5 and is for reference only. Please verify it yourself.
$IOST rose 104.8%, the only asset today whose data was completely topped out.
Shorts paid funding fees down to -0.964%. This kind of extreme negative value means shorts are essentially paying to stubbornly hold their positions.
At the same time, open interest surged 218.3% within an hour, and trading volume of $580 million also kept up—there’s no indication of a hollow, spin-up move.
Comparing with yesterday’s similar signals, this combination—funding rates and open interest both running to extremes—historically tends to have decent continuation. It’s worth watching to see whether it then causes a subsequent drop or whether squeezes keep intensifying.
$KAT rose 25.9%; its structure looks very similar to IOST. With funding rate at -0.164% boosting it alongside a 70.8% jump in open interest, it’s in the same batch of names being hard-pressed by shorts, though the strength is clearly one tier lower.
$PHA rose 20.4%; open interest rose 91.9%—that number is very eye-catching—but the funding rate is only -0.01%. This suggests this wave is more like new money rushing in to open positions, not something forced by shorts. Its nature is different from the first two, so don’t group it together.
From ranks 4 to 10: RAYSOL rose 19.2%, COTI and BULLA rose in sync at 13.5%, BR rose 13.4%, VVV rose 12.9%, GRASS rose 12.1%, and NEAR rose 11.8%. This batch is a broad-based up-move, but none of them pushed both open interest and funding rate to extremes like the top three. The evidence from volume isn’t hard enough.
For now, the only squeeze candidate recognized is IOST. The cost of shorts paying -0.964% is already the most extreme reading of the day. The longer they refuse to close, the more likely it is that they’ll be squeezed into a further bout of upward action.
On the downside: STAR fell 23.2%, SOPH fell 19.4%, and APR fell 18.6%. But all three saw their open interest shrink, and the long-side ratio is still relatively high. It looks more like longs are cutting and exiting on their own, not shorts actively launching an offensive—so it doesn’t form a reliable comparison signal for now.
Overall, the atmosphere is that funds are huddling together in a few low-float coins to set up a play/arrangement. The main focus remains whether the IOST short-hard-pressed structure can continue to play out.
#IOST #KAT #contract anomaly
Real-account disclosure: This account currently holds FOGO long positions; the related views match the actual position.
This content was generated with assistance from Claude Fable 5 and is for reference only. Please verify it yourself.
1
827
Contract Order Book Daily|9/9 Evening Pressure Won’t Hold Back, Fees Turn Positive
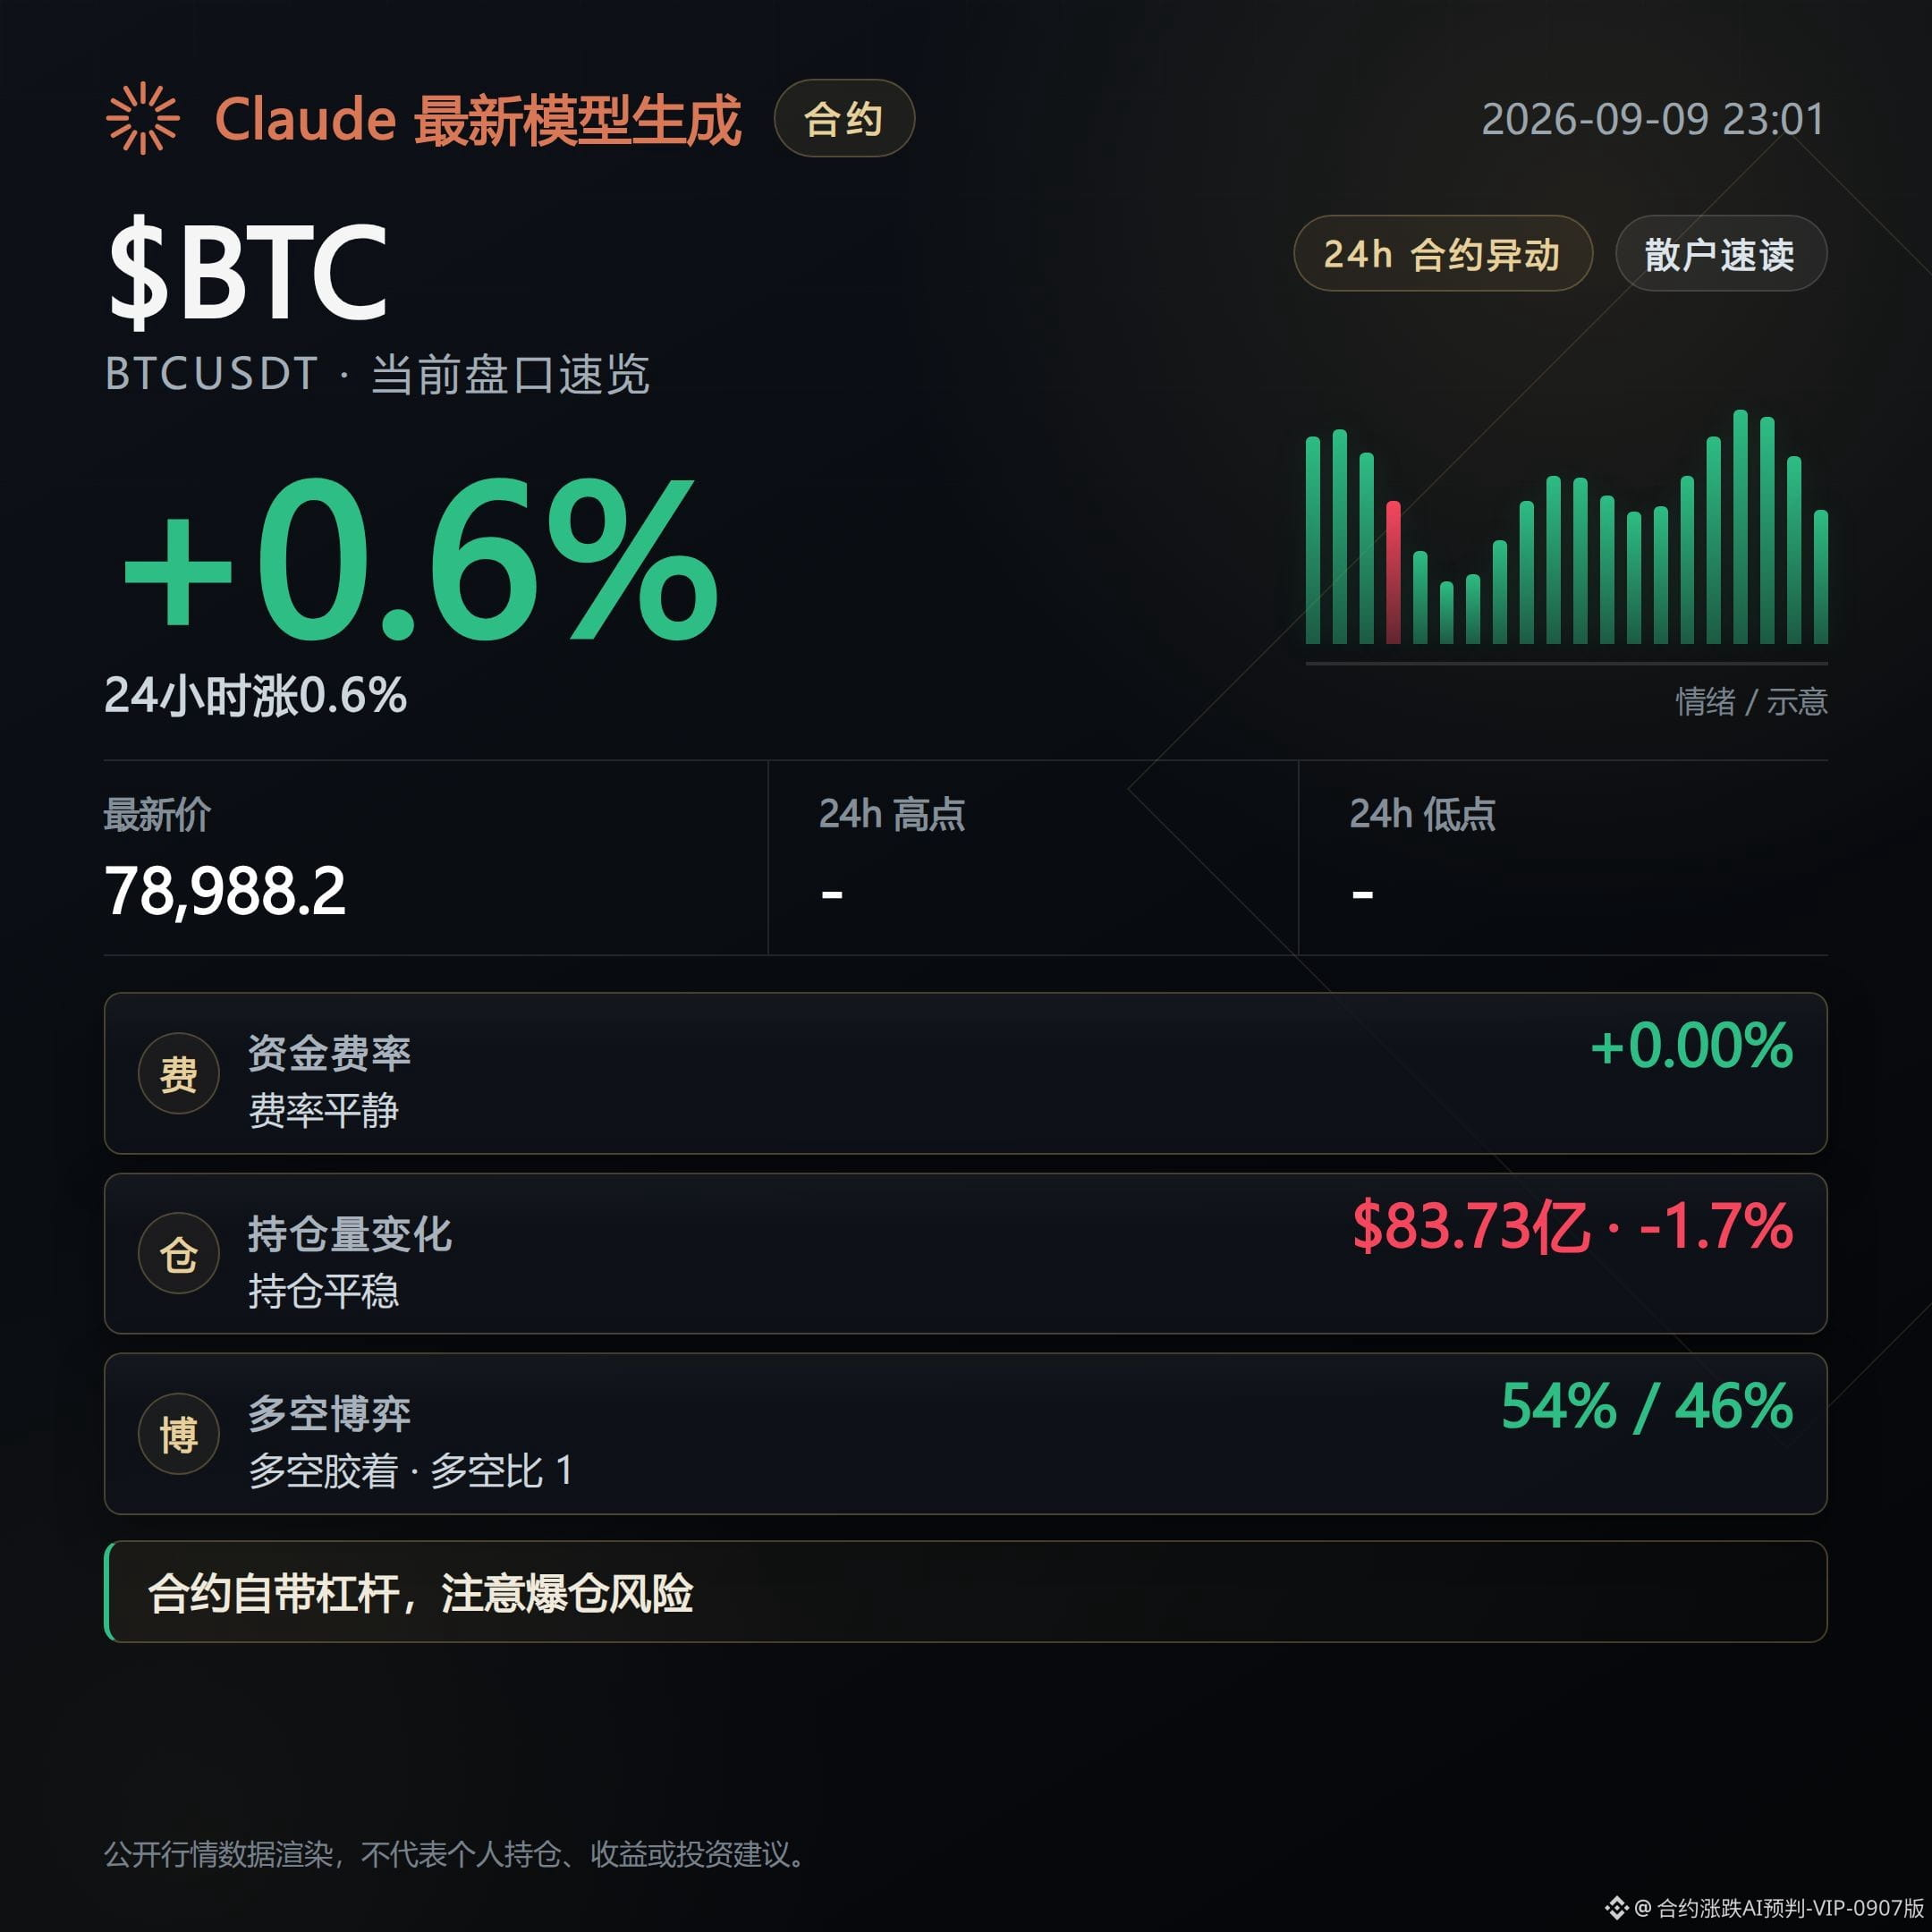
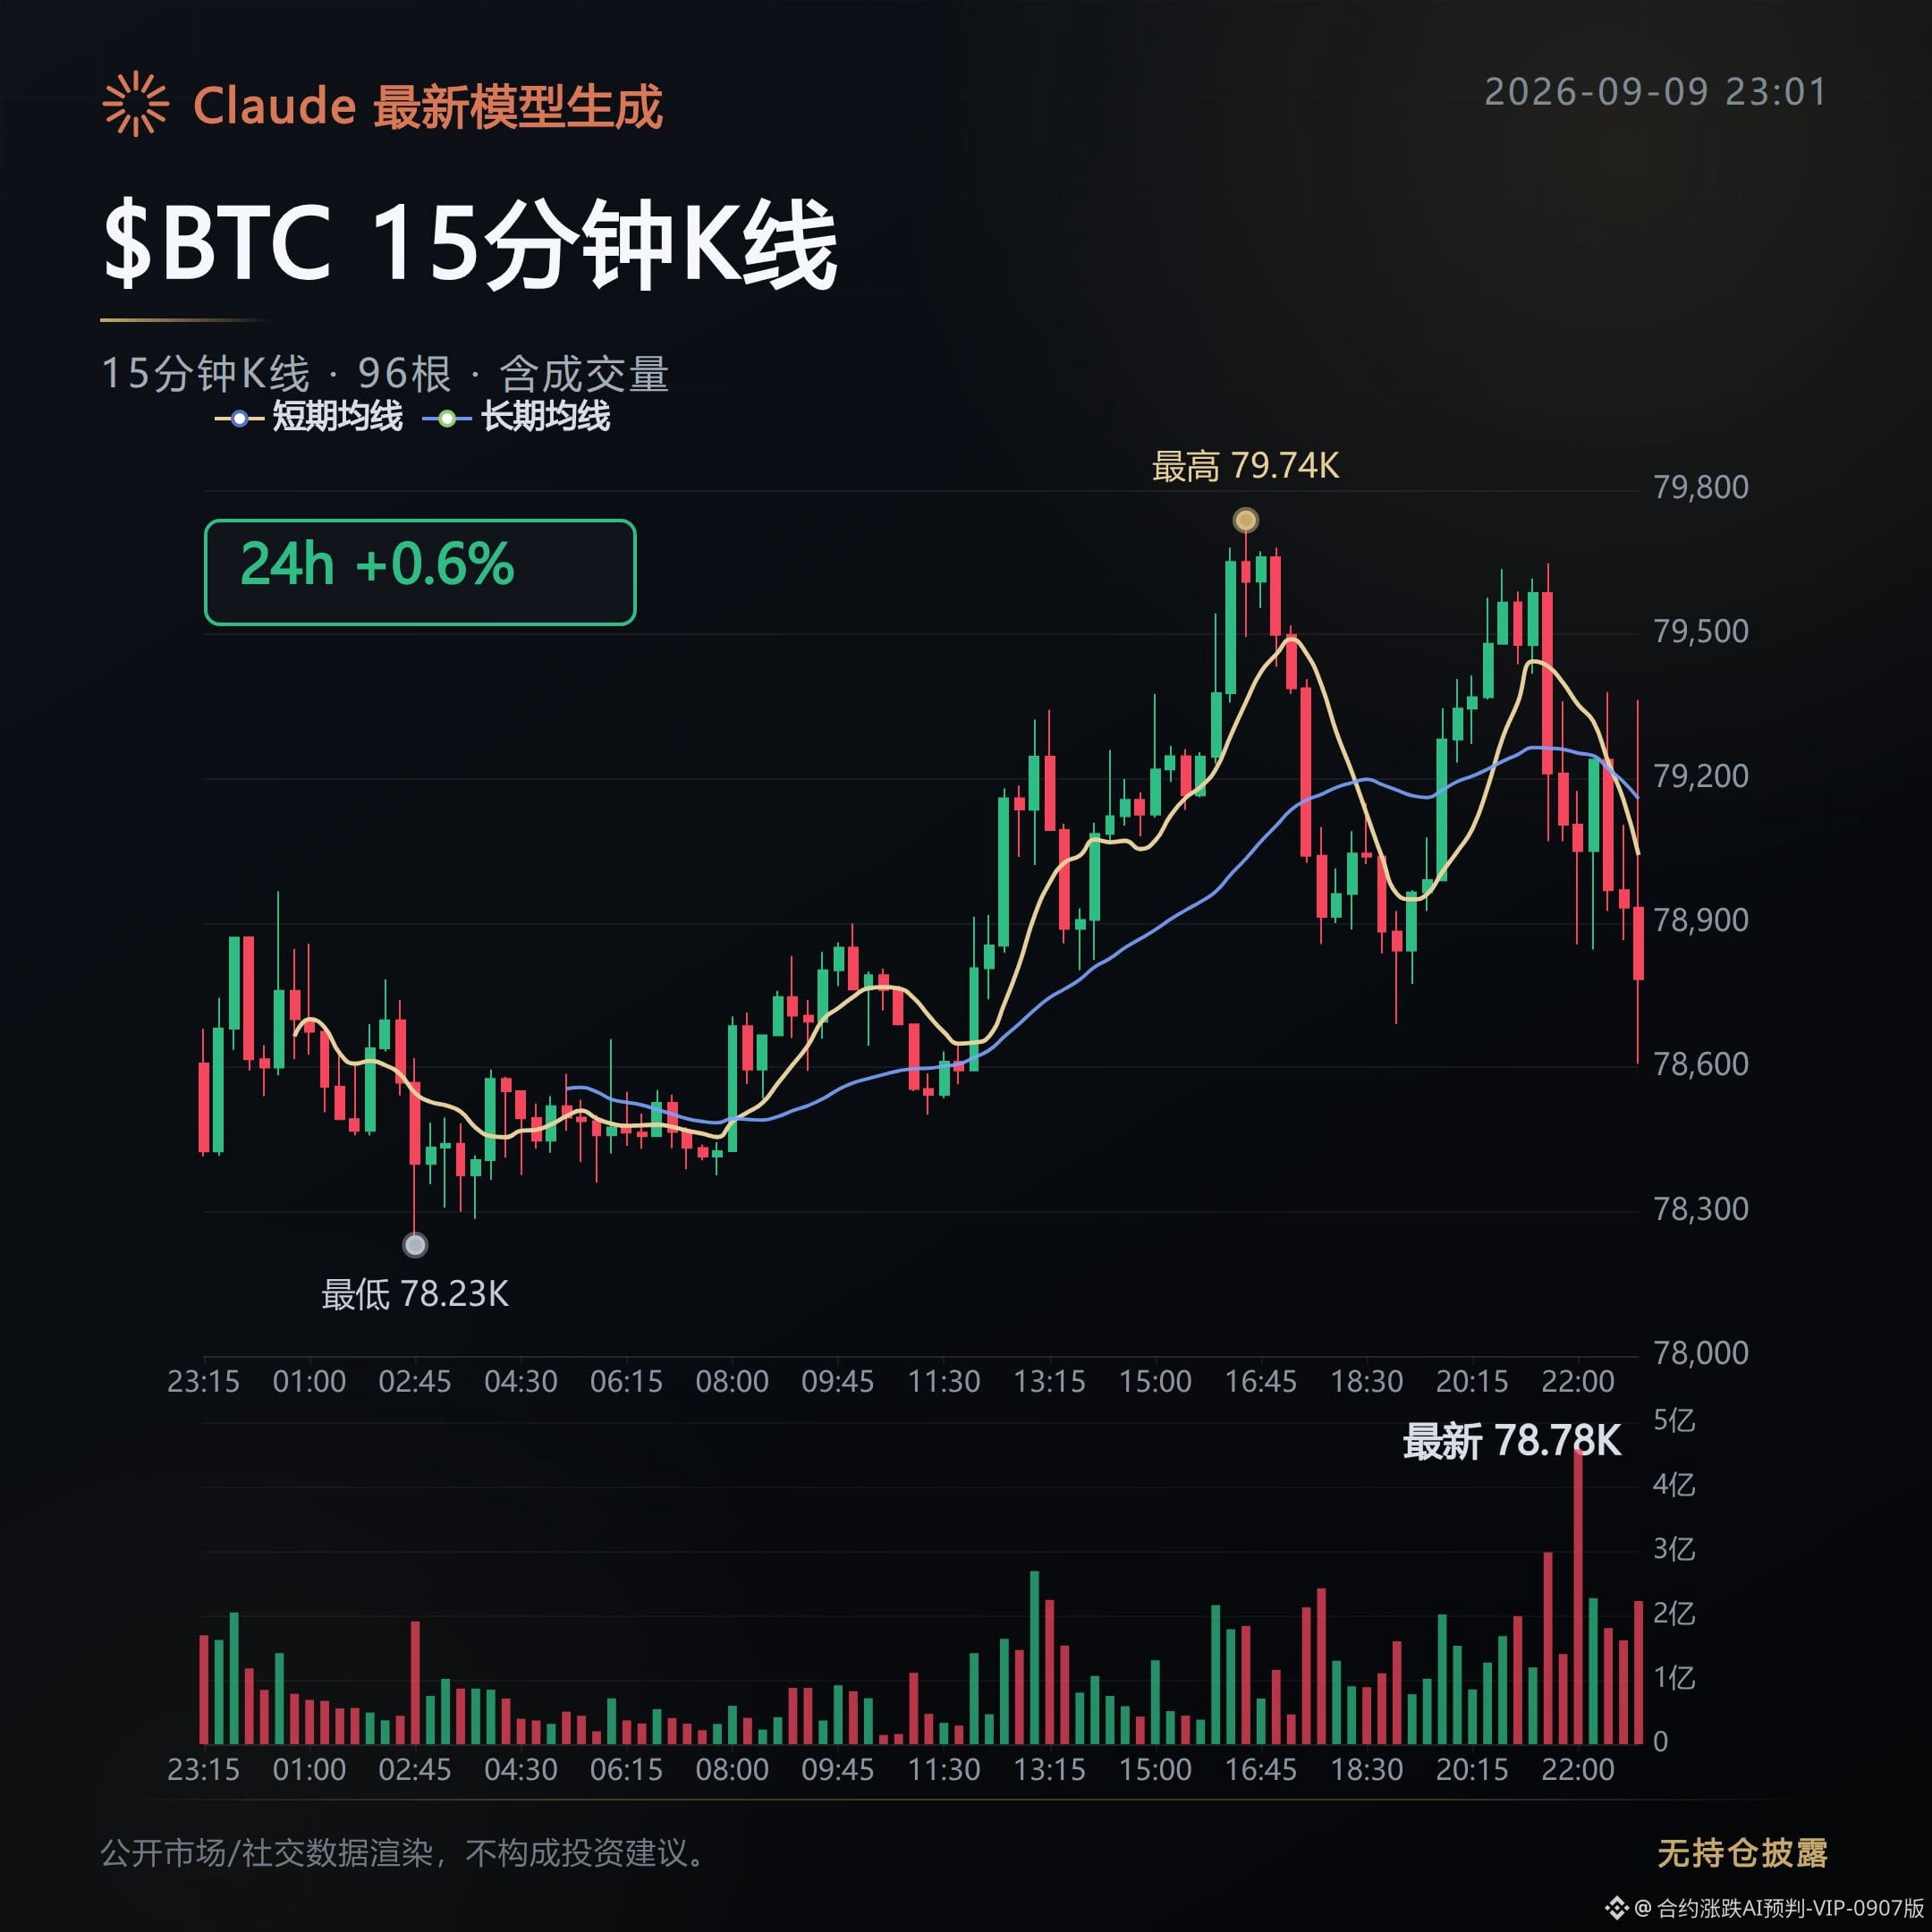
$BTC mark price is $78,988. It’s up 0.59% over the past 24 hours, yet the active buy side is only about 70% of the active sell side. The sellers are clearly more aggressive.
All else being equal, the dominance of sellers should drag the price lower. But the price hasn’t fallen—it's actually risen. Meanwhile, open interest also shrank by 1.7%, dropping to $8.373 billion. This combination is unusual. It doesn’t look like new money is rushing in to push the price up; it looks more like shorts in this upswing couldn’t hold on and were forced to liquidate and step out—there’s a whipsaw/squeeze flavor to it.
Long accounts are 54%. It’s not extremely crowded, but the funding rate helps support this read. The funding rates for $BTC and $ETH are both positive: longs steadily collect from shorts. The $ETH funding rate is 0.0054%, noticeably higher than $BTC’s 0.0037%, suggesting longs are more willing to deploy on Ethereum. $SOL is the only major coin with a negative funding rate: -0.0031%. In other words, shorts are actually paying longs. Once a bounce happens in the short term, the $SOL shorts will be the first to break.
In smaller-cap altcoin perps, things are even more extreme. For the few contracts where funding has fallen to around -0.2%, shorts are crowded to the point that they have to pay money. If there’s a rebound, they’re more likely to get squeezed. Conversely, for the few contracts where funding has surged to above +0.4%, longs are crowded to the point that they have to pay to keep positions open. During pullbacks, that also makes it easier to trigger a chain of liquidations. Either way, both sides are stacked heavily—neither is a comfortable setup.
The off-exchange news actually matches two extremes. INJ has officially been connected to compliant broker channels over the past couple of days, pushing on-chain assets one step further toward compliance—going the route of steady expansion. On the other side, a celebrity token listed less than an hour ago has already dropped by 98%, following pure speculation and “greater-fool” trading. Same kind of on-chain asset narrative: one side is expanding trust, the other is being falsified at high speed. Before you add leverage, you should first clarify which game you’re actually betting on.
The sentiment index is 66—leaning greedy, but not at extreme levels. This doesn’t line up with somewhat cautious signals like open interest shrinking and funding turning positive. In periods of divergence like this, things are most likely to flip back and forth. Next, watch closely: if open interest continues to fall while price keeps rising, it suggests shorts are being trampled while still supporting the move. Once the trampling completes, the direction could change at any moment.
$BTC $ETH $SOL # Funding Rate Divergence
Live trade note: This account currently holds FOGO long positions. The rationale hasn’t changed, so I will continue to hold.
Compiled with assistance from Claude Fable 5. For information only—please verify independently.
Contract Order Book Daily|9/9 Evening Pressure Won’t Hold Back, Fees Turn Positive
$BTC mark price is $78,988. It’s up 0.59% over the past 24 hours, yet the active buy side is only about 70% of the active sell side. The sellers are clearly more aggressive.
All else being equal, the dominance of sellers should drag the price lower. But the price hasn’t fallen—it's actually risen. Meanwhile, open interest also shrank by 1.7%, dropping to $8.373 billion. This combination is unusual. It doesn’t look like new money is rushing in to push the price up; it looks more like shorts in this upswing couldn’t hold on and were forced to liquidate and step out—there’s a whipsaw/squeeze flavor to it.
Long accounts are 54%. It’s not extremely crowded, but the funding rate helps support this read. The funding rates for $BTC and $ETH are both positive: longs steadily collect from shorts. The $ETH funding rate is 0.0054%, noticeably higher than $BTC ’s 0.0037%, suggesting longs are more willing to deploy on Ethereum. $SOL is the only major coin with a negative funding rate: -0.0031%. In other words, shorts are actually paying longs. Once a bounce happens in the short term, the $SOL shorts will be the first to break.
In smaller-cap altcoin perps, things are even more extreme. For the few contracts where funding has fallen to around -0.2%, shorts are crowded to the point that they have to pay money. If there’s a rebound, they’re more likely to get squeezed. Conversely, for the few contracts where funding has surged to above +0.4%, longs are crowded to the point that they have to pay to keep positions open. During pullbacks, that also makes it easier to trigger a chain of liquidations. Either way, both sides are stacked heavily—neither is a comfortable setup.
The off-exchange news actually matches two extremes. INJ has officially been connected to compliant broker channels over the past couple of days, pushing on-chain assets one step further toward compliance—going the route of steady expansion. On the other side, a celebrity token listed less than an hour ago has already dropped by 98%, following pure speculation and “greater-fool” trading. Same kind of on-chain asset narrative: one side is expanding trust, the other is being falsified at high speed. Before you add leverage, you should first clarify which game you’re actually betting on.
The sentiment index is 66—leaning greedy, but not at extreme levels. This doesn’t line up with somewhat cautious signals like open interest shrinking and funding turning positive. In periods of divergence like this, things are most likely to flip back and forth. Next, watch closely: if open interest continues to fall while price keeps rising, it suggests shorts are being trampled while still supporting the move. Once the trampling completes, the direction could change at any moment.
$BTC $ETH $SOL # Funding Rate Divergence
Live trade note: This account currently holds FOGO long positions. The rationale hasn’t changed, so I will continue to hold.
Compiled with assistance from Claude Fable 5. For information only—please verify independently.
$BTC mark price is $78,988. It’s up 0.59% over the past 24 hours, yet the active buy side is only about 70% of the active sell side. The sellers are clearly more aggressive.
All else being equal, the dominance of sellers should drag the price lower. But the price hasn’t fallen—it's actually risen. Meanwhile, open interest also shrank by 1.7%, dropping to $8.373 billion. This combination is unusual. It doesn’t look like new money is rushing in to push the price up; it looks more like shorts in this upswing couldn’t hold on and were forced to liquidate and step out—there’s a whipsaw/squeeze flavor to it.
Long accounts are 54%. It’s not extremely crowded, but the funding rate helps support this read. The funding rates for $BTC and $ETH are both positive: longs steadily collect from shorts. The $ETH funding rate is 0.0054%, noticeably higher than $BTC ’s 0.0037%, suggesting longs are more willing to deploy on Ethereum. $SOL is the only major coin with a negative funding rate: -0.0031%. In other words, shorts are actually paying longs. Once a bounce happens in the short term, the $SOL shorts will be the first to break.
In smaller-cap altcoin perps, things are even more extreme. For the few contracts where funding has fallen to around -0.2%, shorts are crowded to the point that they have to pay money. If there’s a rebound, they’re more likely to get squeezed. Conversely, for the few contracts where funding has surged to above +0.4%, longs are crowded to the point that they have to pay to keep positions open. During pullbacks, that also makes it easier to trigger a chain of liquidations. Either way, both sides are stacked heavily—neither is a comfortable setup.
The off-exchange news actually matches two extremes. INJ has officially been connected to compliant broker channels over the past couple of days, pushing on-chain assets one step further toward compliance—going the route of steady expansion. On the other side, a celebrity token listed less than an hour ago has already dropped by 98%, following pure speculation and “greater-fool” trading. Same kind of on-chain asset narrative: one side is expanding trust, the other is being falsified at high speed. Before you add leverage, you should first clarify which game you’re actually betting on.
The sentiment index is 66—leaning greedy, but not at extreme levels. This doesn’t line up with somewhat cautious signals like open interest shrinking and funding turning positive. In periods of divergence like this, things are most likely to flip back and forth. Next, watch closely: if open interest continues to fall while price keeps rising, it suggests shorts are being trampled while still supporting the move. Once the trampling completes, the direction could change at any moment.
$BTC $ETH $SOL # Funding Rate Divergence
Live trade note: This account currently holds FOGO long positions. The rationale hasn’t changed, so I will continue to hold.
Compiled with assistance from Claude Fable 5. For information only—please verify independently.
278
The three contracts named for a bearish move at the time, from the perspective of risk being distributed from a high level, were issued as a morning warning about 13 hours ago. Now, reconcile against the publicly available order book; the track record is 1 execution, 1 tug-of-war, and 1 pullback.
The initial judgment was based on a single observation of the order book—chip distribution was scattered.
SOPH: Execution. The bearish line in the morning has played out.
After the initial call, the price continued to weaken by 8.82%. The current price change has flipped to -30.58%, and there has been no reversal in direction.
Trading volume shrank by 63.86%, and the proportion of active buy orders fell from 0.93 to 0.86. This indicates that during the decline, both follow-through and buy-side heat retreated in sync; it is not just a simple low-volume consolidation.
FF: Tug-of-war. The bearish setup in the morning did not fully materialize.
After the initial call, the price instead rose by 1.38%. The price-change rate narrowed from 23.86% to 4.97%. While the overall heat is cooling, the price has not broken down.
The proportion of active buy orders increased from 1.02 to 1.18; buy-side strength did not retreat but actually advanced. The confirmation signal for a one-direction downward move has not appeared yet.
COTI: Pullback. The bearish direction from the morning has been thrown back.
After the initial call, the price did not drop—it rose by 5.2%. The funding rate also turned from negative to positive, and the bearish sentiment did not continue.
The proportion of active buy orders fell from 1.29 to 1.07, confirming that buy-side heat is indeed backing off, but it is still not enough to reverse the pullback direction.
Next, watch whether SOPH’s trading volume and proportion of active buy orders can continue to decline in sync. Once acceptance volume ramps up again and the buy-side proportion rebounds, the assessment that it will grind down lower must be re-evaluated.
For FF and COTI, neither has yet produced a confirmed one-directional down move. The key is whether the position size and the active buy order proportion turn weak. Only when the buy-side heat truly fades can we confirm that risk distribution at a high level has been executed. Otherwise, we continue to look at it as tug-of-war or pullback.
#SOPH #FF #COTI #Contract recap
Live disclosure: This account currently holds $FOGO long positions; the related views are consistent with the actual holdings.
This content is generated with assistance from Claude Fable 5 and is for informational reference only; please verify it yourself.
The three contracts named for a bearish move at the time, from the perspective of risk being distributed from a high level, were issued as a morning warning about 13 hours ago. Now, reconcile against the publicly available order book; the track record is 1 execution, 1 tug-of-war, and 1 pullback.
The initial judgment was based on a single observation of the order book—chip distribution was scattered.
SOPH: Execution. The bearish line in the morning has played out.
After the initial call, the price continued to weaken by 8.82%. The current price change has flipped to -30.58%, and there has been no reversal in direction.
Trading volume shrank by 63.86%, and the proportion of active buy orders fell from 0.93 to 0.86. This indicates that during the decline, both follow-through and buy-side heat retreated in sync; it is not just a simple low-volume consolidation.
FF: Tug-of-war. The bearish setup in the morning did not fully materialize.
After the initial call, the price instead rose by 1.38%. The price-change rate narrowed from 23.86% to 4.97%. While the overall heat is cooling, the price has not broken down.
The proportion of active buy orders increased from 1.02 to 1.18; buy-side strength did not retreat but actually advanced. The confirmation signal for a one-direction downward move has not appeared yet.
COTI: Pullback. The bearish direction from the morning has been thrown back.
After the initial call, the price did not drop—it rose by 5.2%. The funding rate also turned from negative to positive, and the bearish sentiment did not continue.
The proportion of active buy orders fell from 1.29 to 1.07, confirming that buy-side heat is indeed backing off, but it is still not enough to reverse the pullback direction.
Next, watch whether SOPH’s trading volume and proportion of active buy orders can continue to decline in sync. Once acceptance volume ramps up again and the buy-side proportion rebounds, the assessment that it will grind down lower must be re-evaluated.
For FF and COTI, neither has yet produced a confirmed one-directional down move. The key is whether the position size and the active buy order proportion turn weak. Only when the buy-side heat truly fades can we confirm that risk distribution at a high level has been executed. Otherwise, we continue to look at it as tug-of-war or pullback.
#SOPH #FF #COTI #Contract recap
Live disclosure: This account currently holds $FOGO long positions; the related views are consistent with the actual holdings.
This content is generated with assistance from Claude Fable 5 and is for informational reference only; please verify it yourself.
The initial judgment was based on a single observation of the order book—chip distribution was scattered.
SOPH: Execution. The bearish line in the morning has played out.
After the initial call, the price continued to weaken by 8.82%. The current price change has flipped to -30.58%, and there has been no reversal in direction.
Trading volume shrank by 63.86%, and the proportion of active buy orders fell from 0.93 to 0.86. This indicates that during the decline, both follow-through and buy-side heat retreated in sync; it is not just a simple low-volume consolidation.
FF: Tug-of-war. The bearish setup in the morning did not fully materialize.
After the initial call, the price instead rose by 1.38%. The price-change rate narrowed from 23.86% to 4.97%. While the overall heat is cooling, the price has not broken down.
The proportion of active buy orders increased from 1.02 to 1.18; buy-side strength did not retreat but actually advanced. The confirmation signal for a one-direction downward move has not appeared yet.
COTI: Pullback. The bearish direction from the morning has been thrown back.
After the initial call, the price did not drop—it rose by 5.2%. The funding rate also turned from negative to positive, and the bearish sentiment did not continue.
The proportion of active buy orders fell from 1.29 to 1.07, confirming that buy-side heat is indeed backing off, but it is still not enough to reverse the pullback direction.
Next, watch whether SOPH’s trading volume and proportion of active buy orders can continue to decline in sync. Once acceptance volume ramps up again and the buy-side proportion rebounds, the assessment that it will grind down lower must be re-evaluated.
For FF and COTI, neither has yet produced a confirmed one-directional down move. The key is whether the position size and the active buy order proportion turn weak. Only when the buy-side heat truly fades can we confirm that risk distribution at a high level has been executed. Otherwise, we continue to look at it as tug-of-war or pullback.
#SOPH #FF #COTI #Contract recap
Live disclosure: This account currently holds $FOGO long positions; the related views are consistent with the actual holdings.
This content is generated with assistance from Claude Fable 5 and is for informational reference only; please verify it yourself.
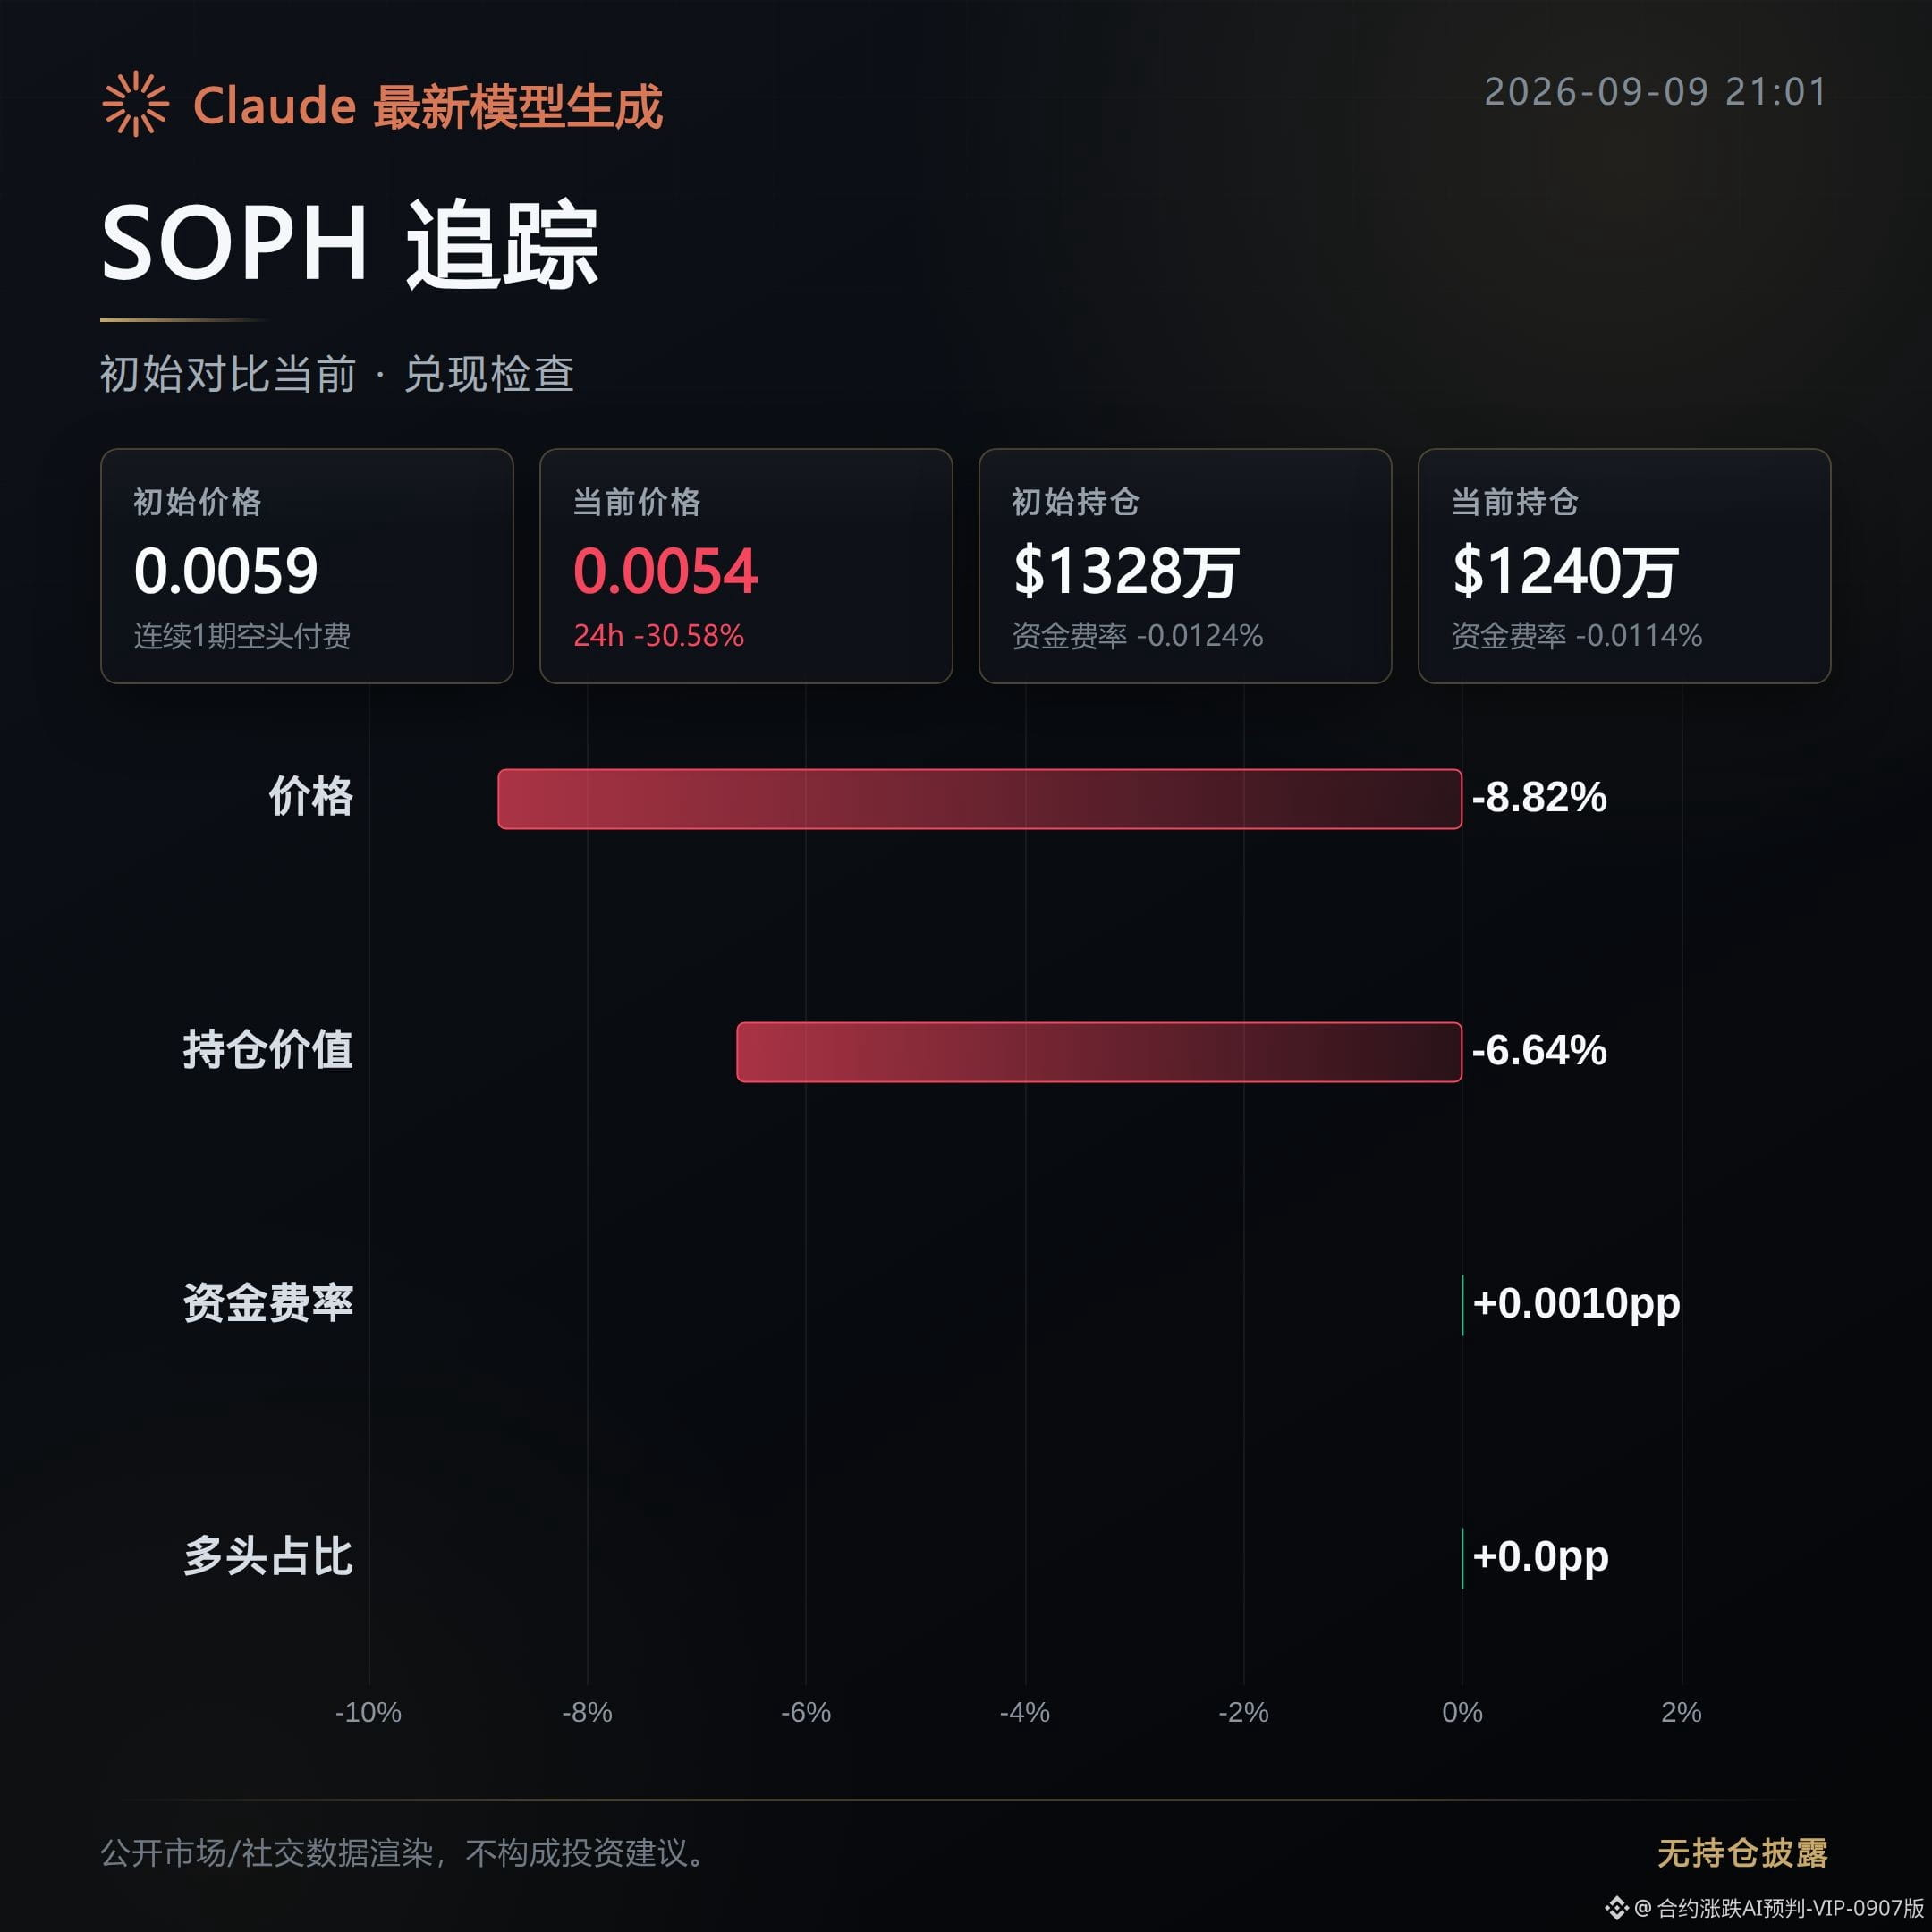
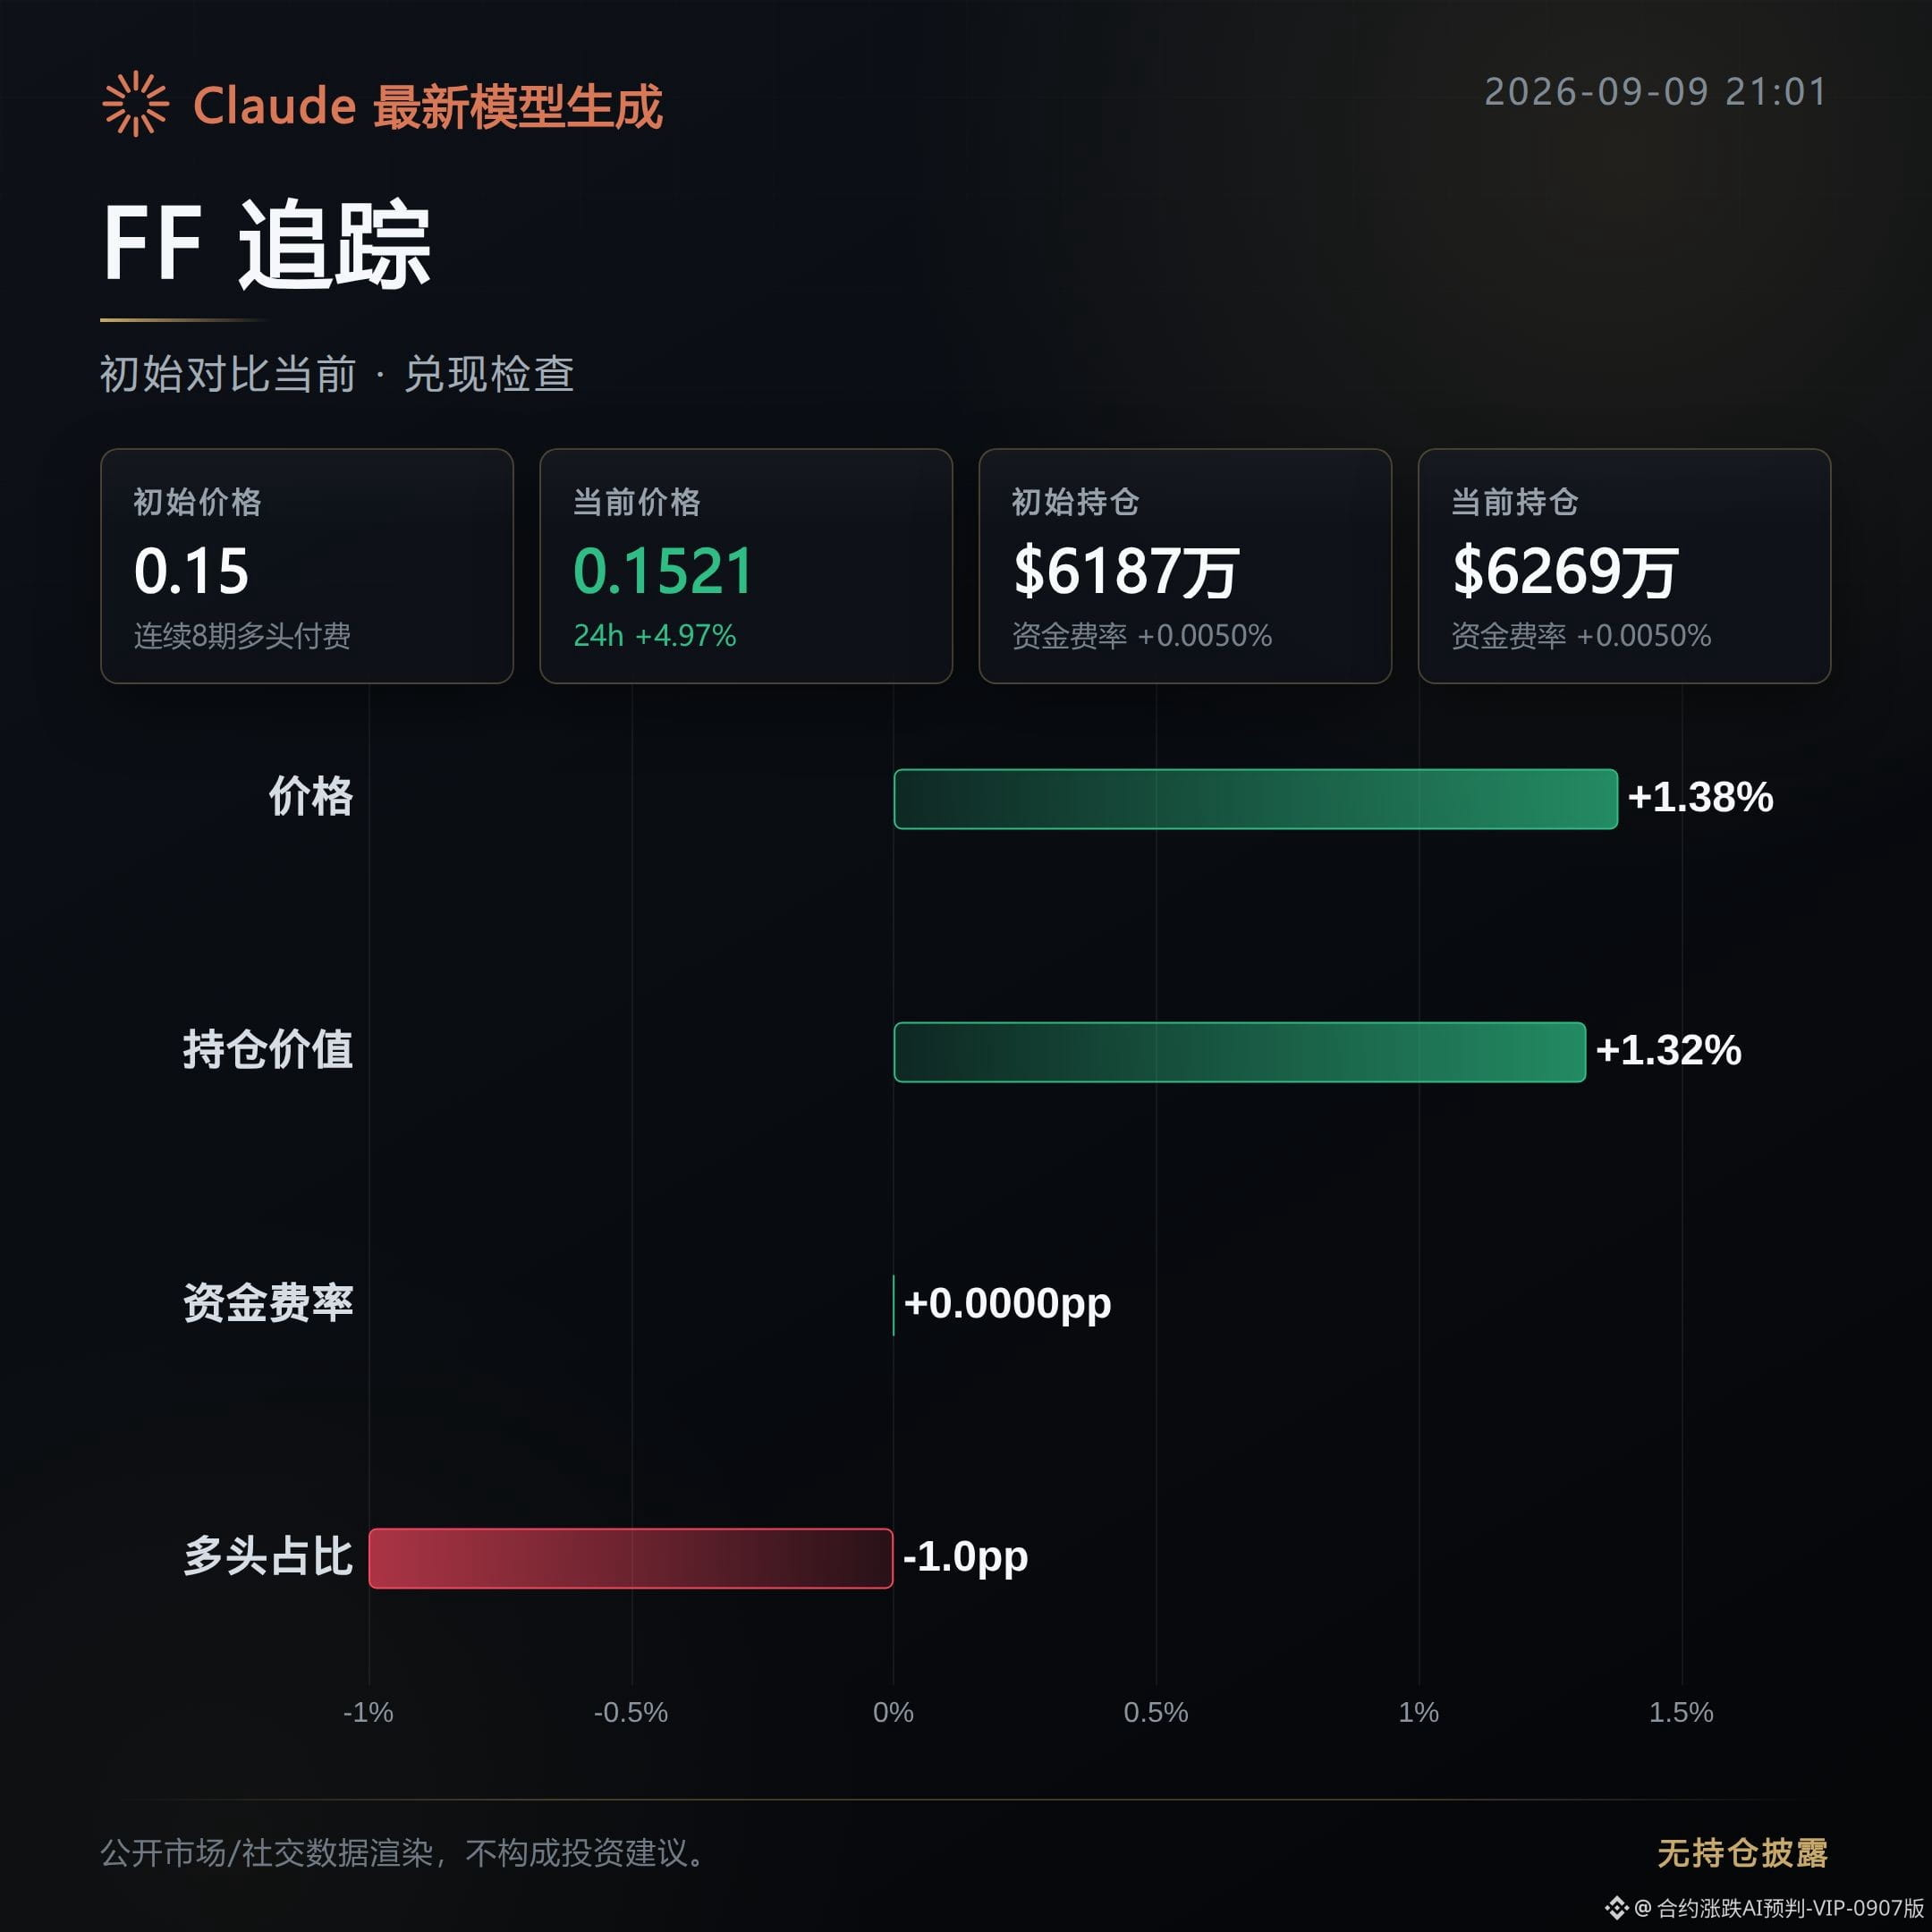
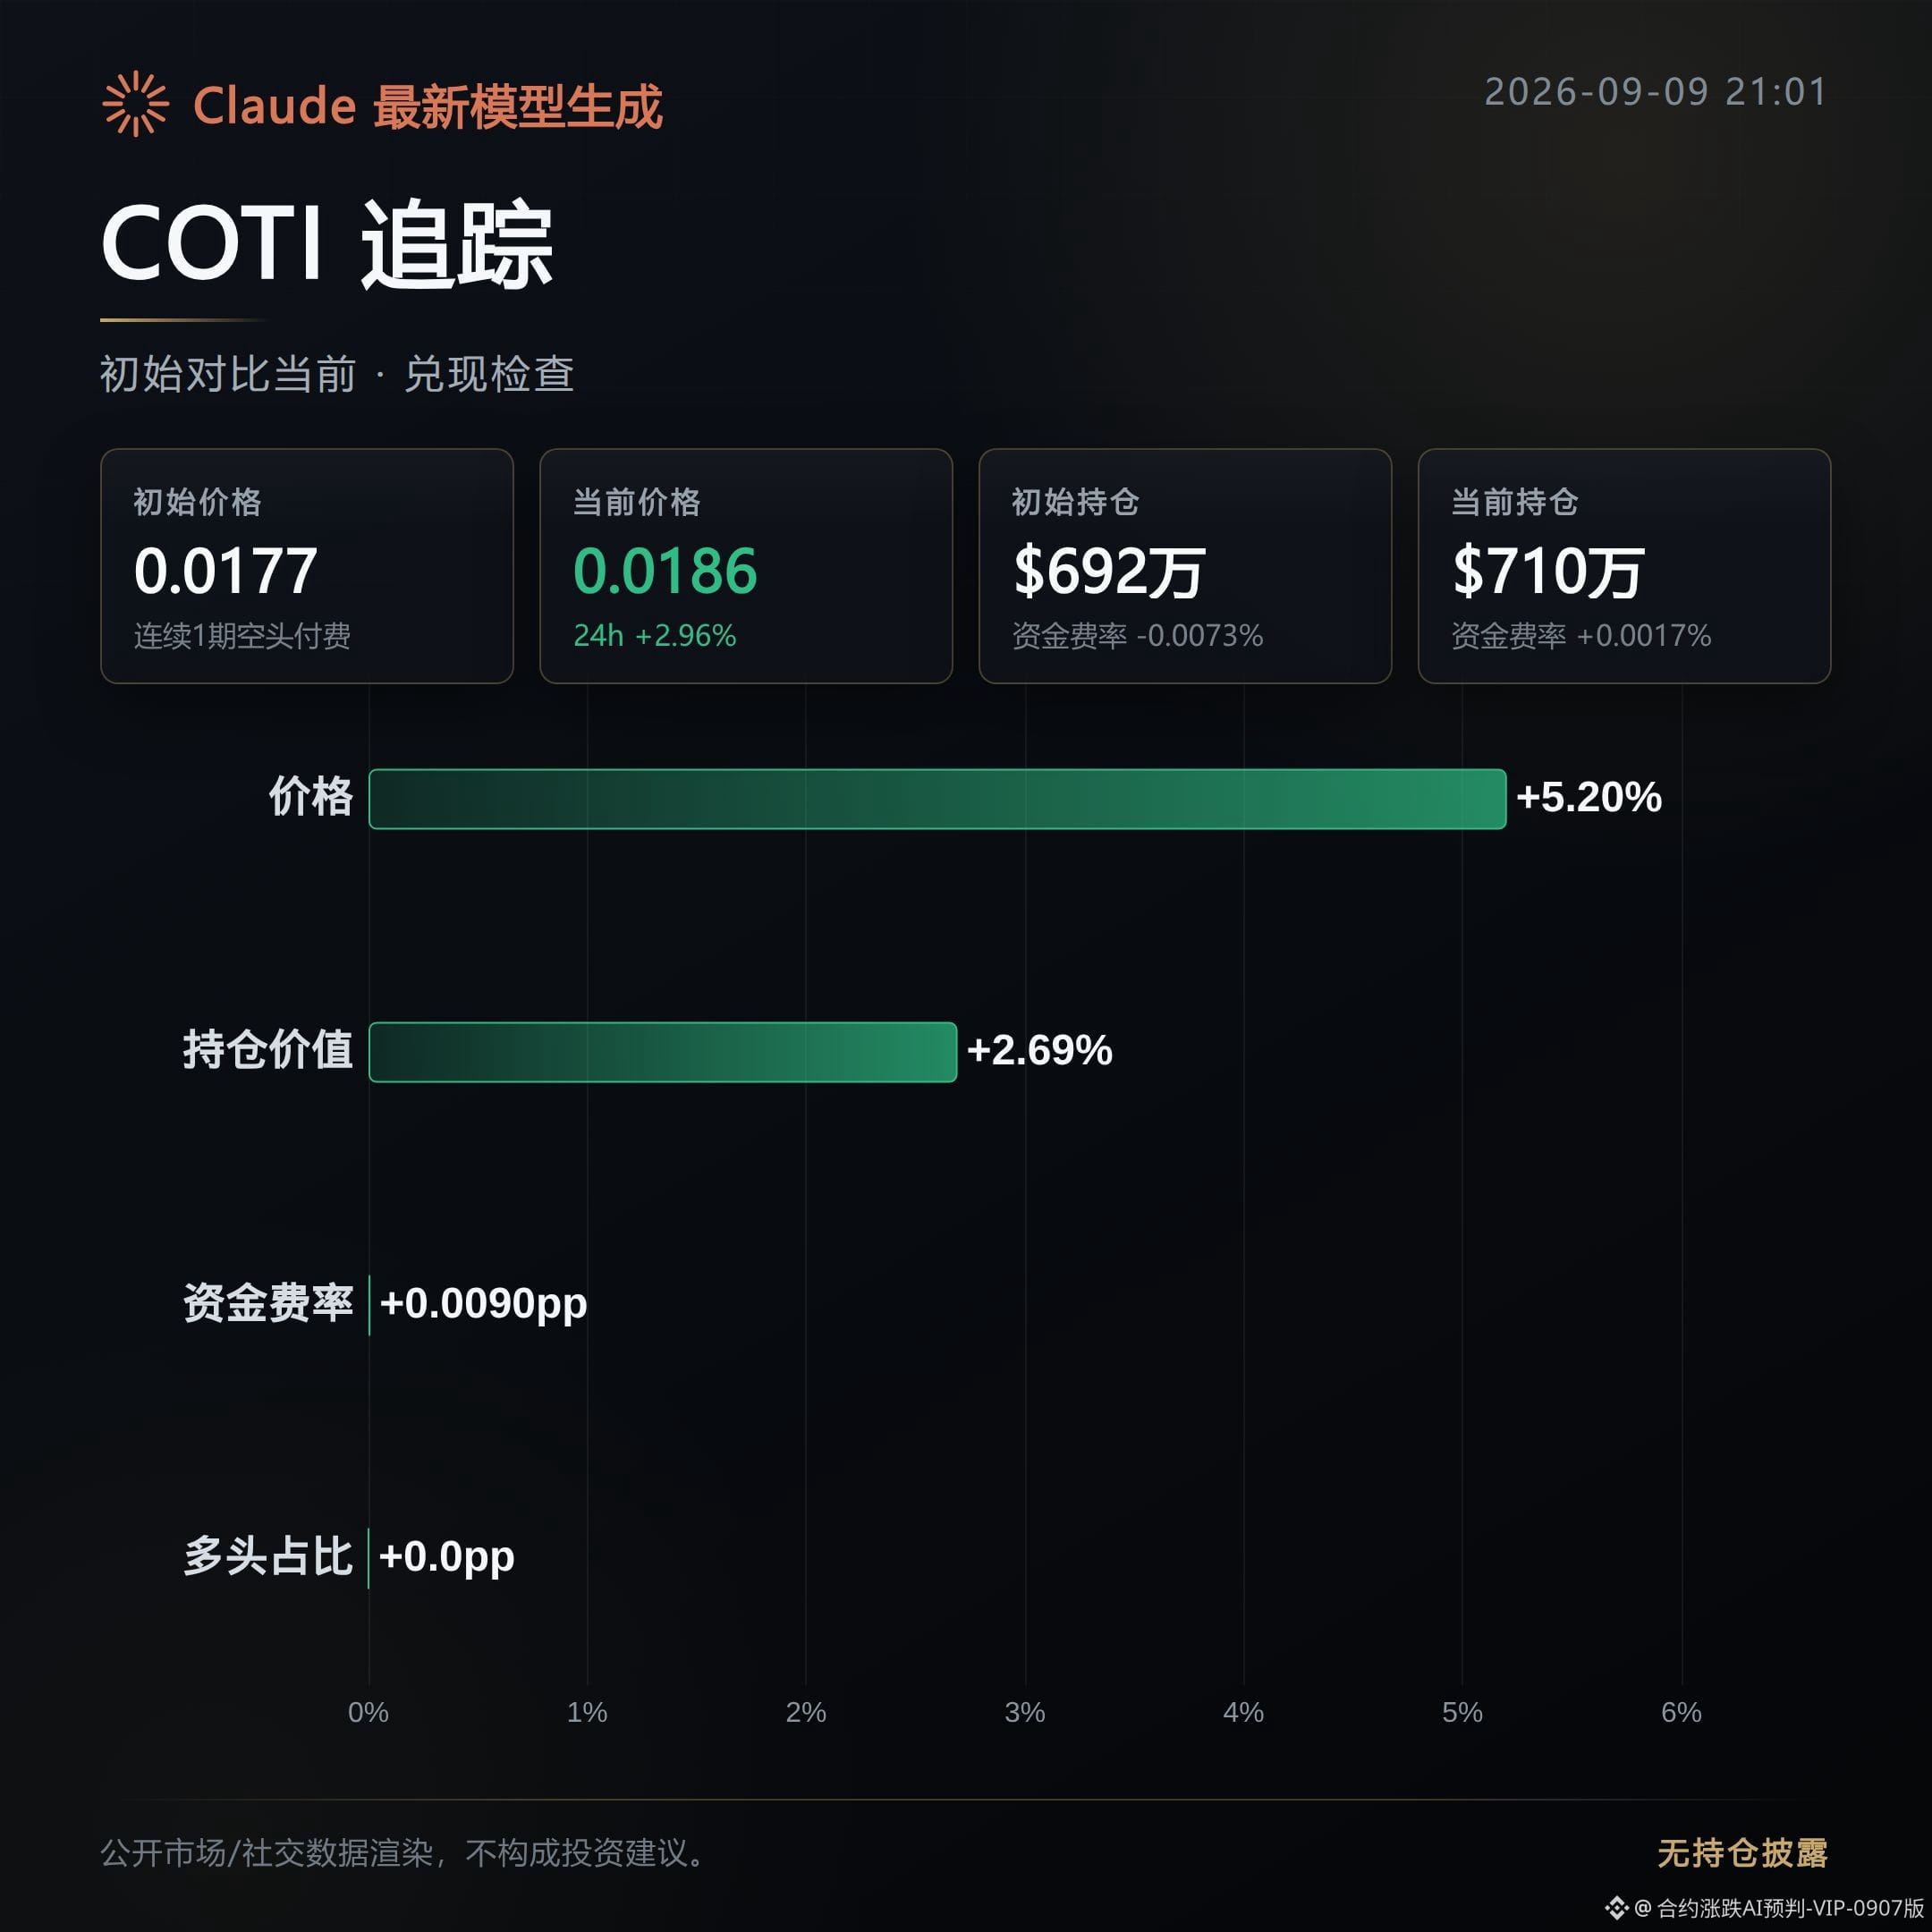
629
The morning “pull-up observation” about 13 hours ago was bullish on three contracts: MEGA, DOT, and PROM.
Now, according to the publicly available order-book reconciliation, none of the three truly “followed through.” MEGA and PROM are still pulling and tugging, while DOT has already fizzled out—so the results aren’t very impressive.
The observation takeaway back then was the same sentence: the chips are being accumulated.
MEGA: Pulling and tugging. The bullish direction hasn’t been confirmed yet, and it hasn’t been invalidated.
After the price first launched, it only rose 1.54%, but the open interest decreased by 4.06% over the same period. Trading volume shrank by as much as 32.65%, indicating that the capital pushing the price didn’t add any incremental flow.
The ratio of aggressive buy orders rose from 0.97 to 1.19, showing a slight recovery in buying sentiment, but the volume/energy didn’t keep up—so the direction hasn’t been set.
DOT: Fizzled out—the morning bullish thesis didn’t play out.
After the price first launched, it pulled back by 5.86%, and the 24-hour gain narrowed from 17.09% to 7.58%. The direction is already opposite to what the pull-up observation suggested.
More importantly, open interest decreased by 9.1% over the same period, while the aggressive buy ratio dropped from 1.22 to 0.94. Buying weakened—capital is withdrawing rather than replenishing.
PROM: Pulling and tugging—the bullish line currently can’t hold.
After the price first launched, it fell by 2.84%. The 24-hour gain turned from positive to negative at -4.34%. Open interest also decreased in sync by 5.47%, and trading volume shrank by 7.72%—all three (price, volume, and open interest) are contracting.
The aggressive buy ratio fell from 0.89 to 0.7, further weakening buying strength. For now, there’s no evidence confirming the bullish direction.
Next, if you’re watching these lines, the key for MEGA is whether open interest can stop the decline and start refilling, and whether trading volume can expand—those are the critical signals for a bullish continuation. For DOT, you’ll need to see whether the price can reclaim the portion it lost and get the aggressive buy ratio back above 1; otherwise, the fizzle will be confirmed. For PROM, watch whether open interest and trading volume stop declining in sync—judging only by a price bounce can easily produce a false signal.
As long as open interest continues to diverge from price, this bullish line still can’t be considered fulfilled.
#MEGA #DOT #PROM #Contract recap
Live disclosure: This account currently holds $FOGO long positions; the related viewpoints are consistent with the actual holdings.
This content is assisted by Claude Fable 5 for generation, and is for informational reference only—please verify for yourself.
The morning “pull-up observation” about 13 hours ago was bullish on three contracts: MEGA, DOT, and PROM.
Now, according to the publicly available order-book reconciliation, none of the three truly “followed through.” MEGA and PROM are still pulling and tugging, while DOT has already fizzled out—so the results aren’t very impressive.
The observation takeaway back then was the same sentence: the chips are being accumulated.
MEGA: Pulling and tugging. The bullish direction hasn’t been confirmed yet, and it hasn’t been invalidated.
After the price first launched, it only rose 1.54%, but the open interest decreased by 4.06% over the same period. Trading volume shrank by as much as 32.65%, indicating that the capital pushing the price didn’t add any incremental flow.
The ratio of aggressive buy orders rose from 0.97 to 1.19, showing a slight recovery in buying sentiment, but the volume/energy didn’t keep up—so the direction hasn’t been set.
DOT: Fizzled out—the morning bullish thesis didn’t play out.
After the price first launched, it pulled back by 5.86%, and the 24-hour gain narrowed from 17.09% to 7.58%. The direction is already opposite to what the pull-up observation suggested.
More importantly, open interest decreased by 9.1% over the same period, while the aggressive buy ratio dropped from 1.22 to 0.94. Buying weakened—capital is withdrawing rather than replenishing.
PROM: Pulling and tugging—the bullish line currently can’t hold.
After the price first launched, it fell by 2.84%. The 24-hour gain turned from positive to negative at -4.34%. Open interest also decreased in sync by 5.47%, and trading volume shrank by 7.72%—all three (price, volume, and open interest) are contracting.
The aggressive buy ratio fell from 0.89 to 0.7, further weakening buying strength. For now, there’s no evidence confirming the bullish direction.
Next, if you’re watching these lines, the key for MEGA is whether open interest can stop the decline and start refilling, and whether trading volume can expand—those are the critical signals for a bullish continuation. For DOT, you’ll need to see whether the price can reclaim the portion it lost and get the aggressive buy ratio back above 1; otherwise, the fizzle will be confirmed. For PROM, watch whether open interest and trading volume stop declining in sync—judging only by a price bounce can easily produce a false signal.
As long as open interest continues to diverge from price, this bullish line still can’t be considered fulfilled.
#MEGA #DOT #PROM #Contract recap
Live disclosure: This account currently holds $FOGO long positions; the related viewpoints are consistent with the actual holdings.
This content is assisted by Claude Fable 5 for generation, and is for informational reference only—please verify for yourself.
Now, according to the publicly available order-book reconciliation, none of the three truly “followed through.” MEGA and PROM are still pulling and tugging, while DOT has already fizzled out—so the results aren’t very impressive.
The observation takeaway back then was the same sentence: the chips are being accumulated.
MEGA: Pulling and tugging. The bullish direction hasn’t been confirmed yet, and it hasn’t been invalidated.
After the price first launched, it only rose 1.54%, but the open interest decreased by 4.06% over the same period. Trading volume shrank by as much as 32.65%, indicating that the capital pushing the price didn’t add any incremental flow.
The ratio of aggressive buy orders rose from 0.97 to 1.19, showing a slight recovery in buying sentiment, but the volume/energy didn’t keep up—so the direction hasn’t been set.
DOT: Fizzled out—the morning bullish thesis didn’t play out.
After the price first launched, it pulled back by 5.86%, and the 24-hour gain narrowed from 17.09% to 7.58%. The direction is already opposite to what the pull-up observation suggested.
More importantly, open interest decreased by 9.1% over the same period, while the aggressive buy ratio dropped from 1.22 to 0.94. Buying weakened—capital is withdrawing rather than replenishing.
PROM: Pulling and tugging—the bullish line currently can’t hold.
After the price first launched, it fell by 2.84%. The 24-hour gain turned from positive to negative at -4.34%. Open interest also decreased in sync by 5.47%, and trading volume shrank by 7.72%—all three (price, volume, and open interest) are contracting.
The aggressive buy ratio fell from 0.89 to 0.7, further weakening buying strength. For now, there’s no evidence confirming the bullish direction.
Next, if you’re watching these lines, the key for MEGA is whether open interest can stop the decline and start refilling, and whether trading volume can expand—those are the critical signals for a bullish continuation. For DOT, you’ll need to see whether the price can reclaim the portion it lost and get the aggressive buy ratio back above 1; otherwise, the fizzle will be confirmed. For PROM, watch whether open interest and trading volume stop declining in sync—judging only by a price bounce can easily produce a false signal.
As long as open interest continues to diverge from price, this bullish line still can’t be considered fulfilled.
#MEGA #DOT #PROM #Contract recap
Live disclosure: This account currently holds $FOGO long positions; the related viewpoints are consistent with the actual holdings.
This content is assisted by Claude Fable 5 for generation, and is for informational reference only—please verify for yourself.
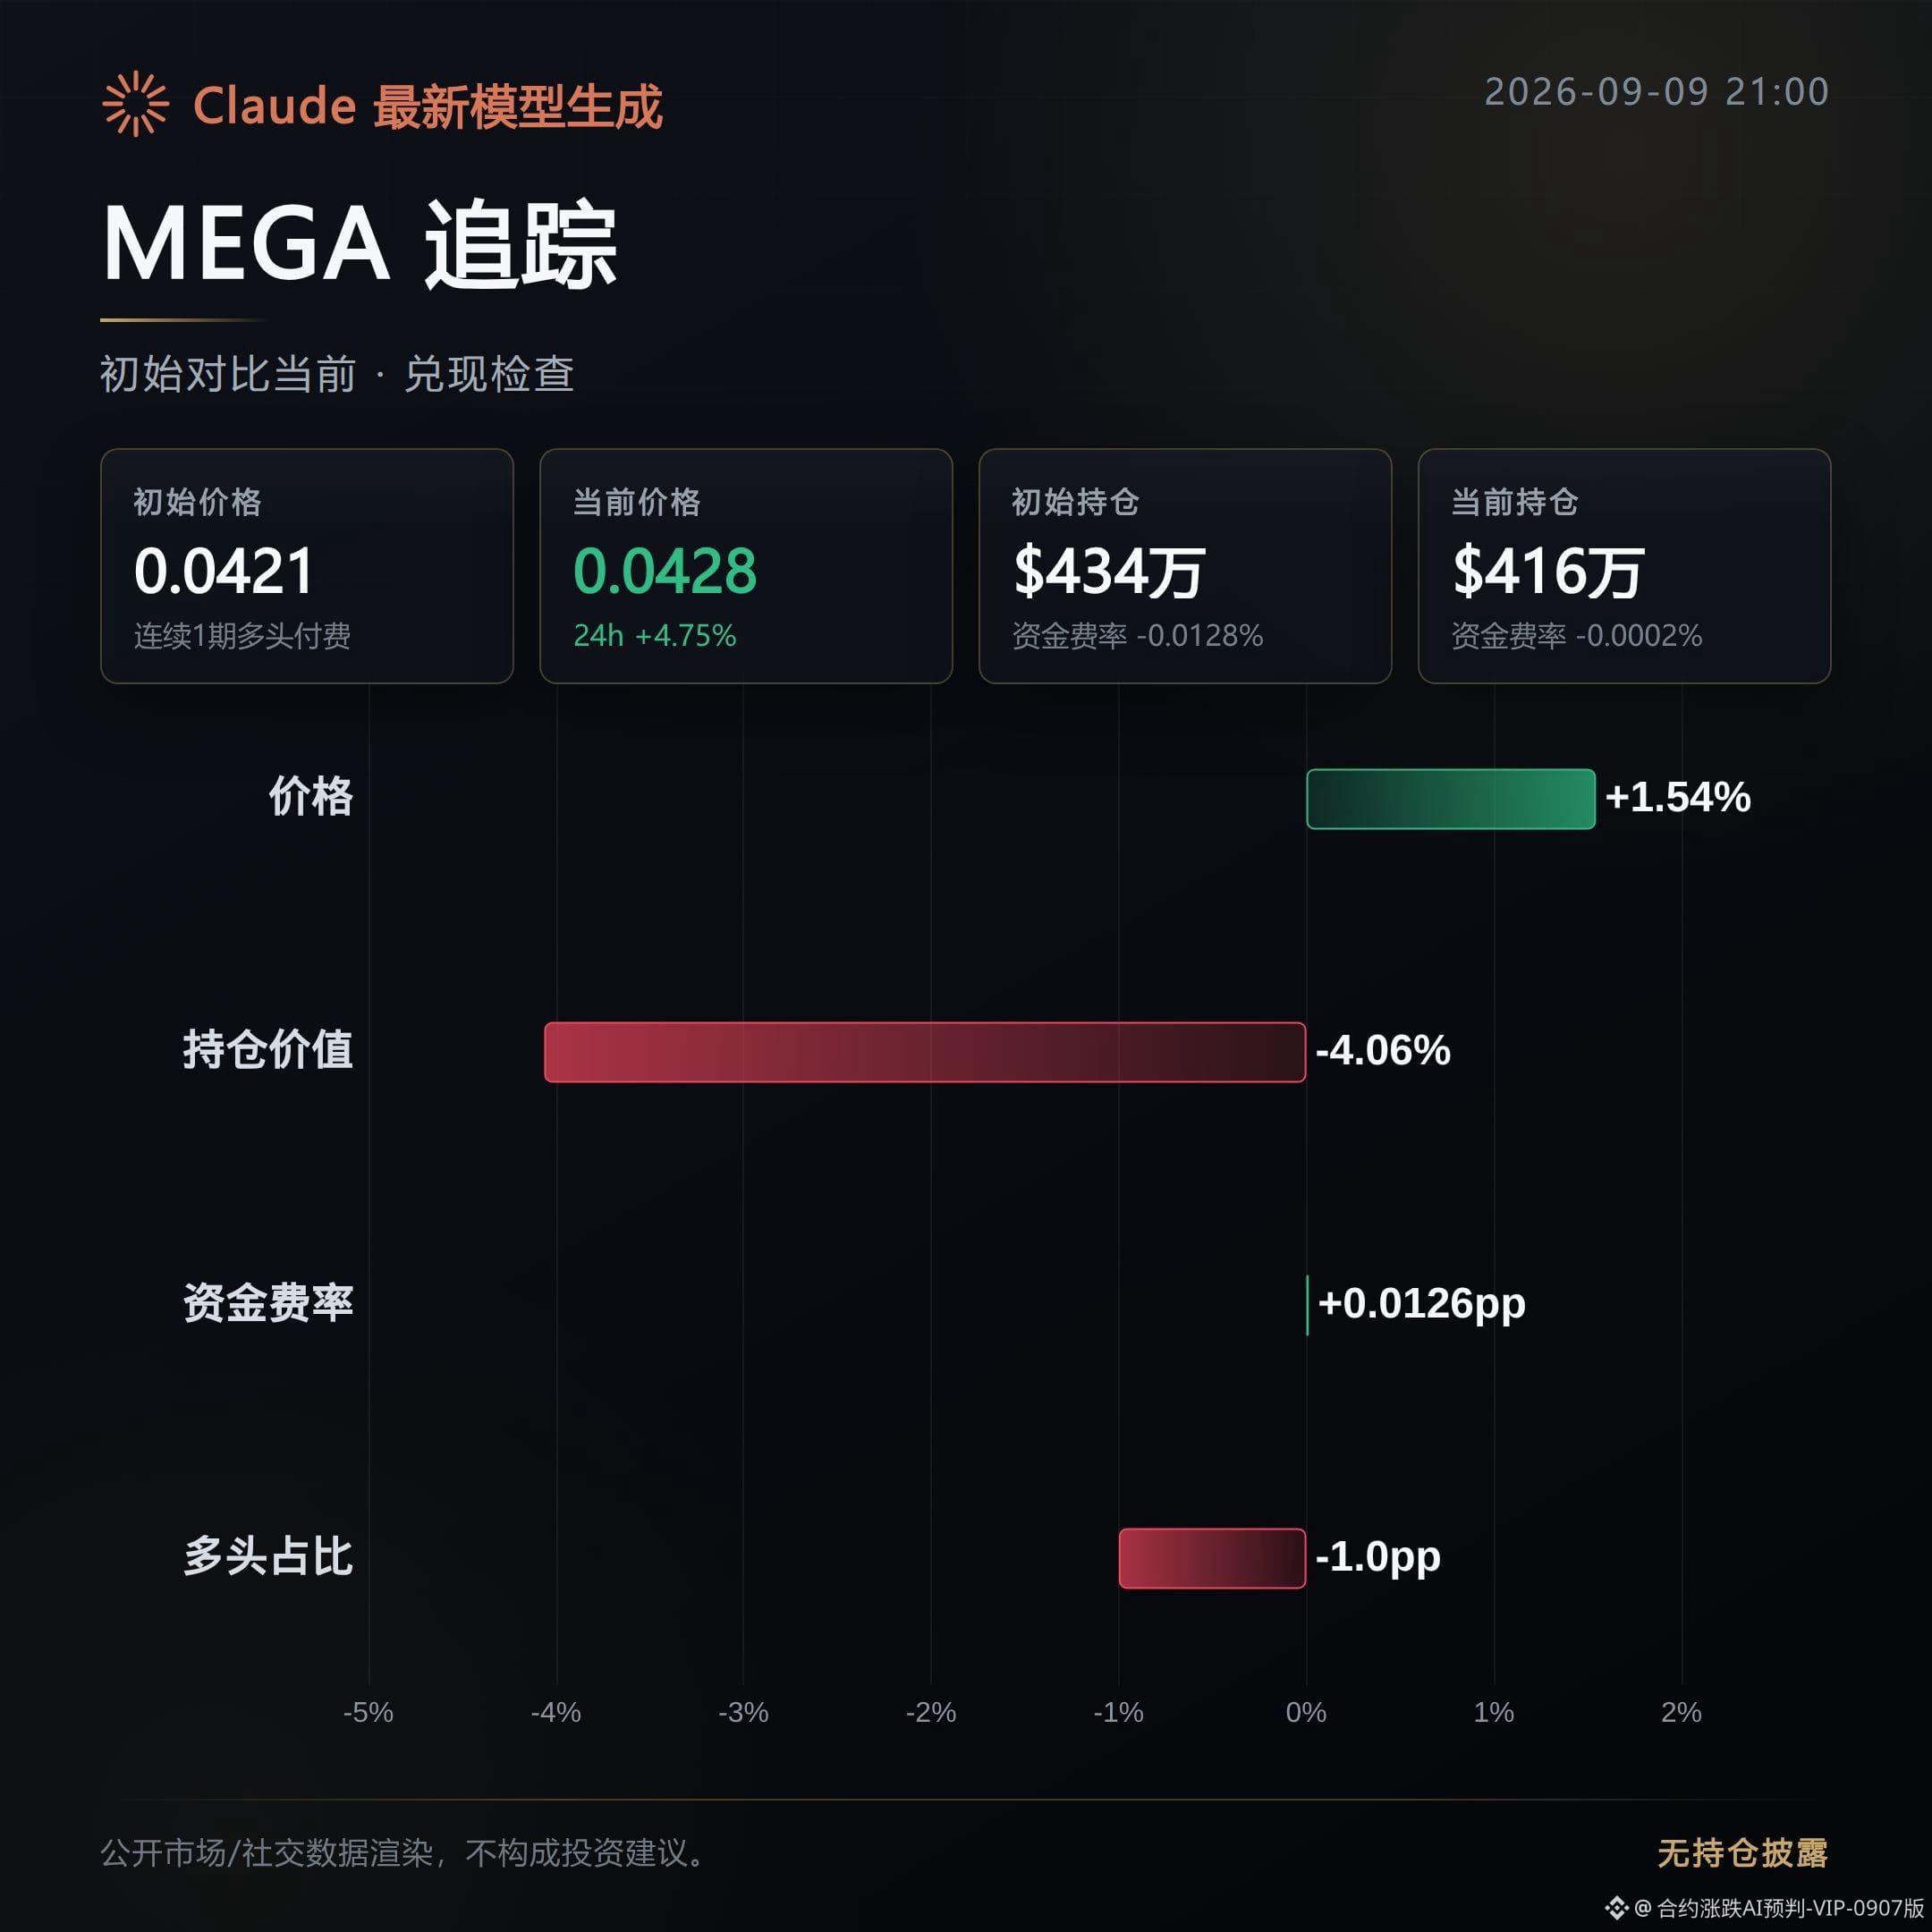
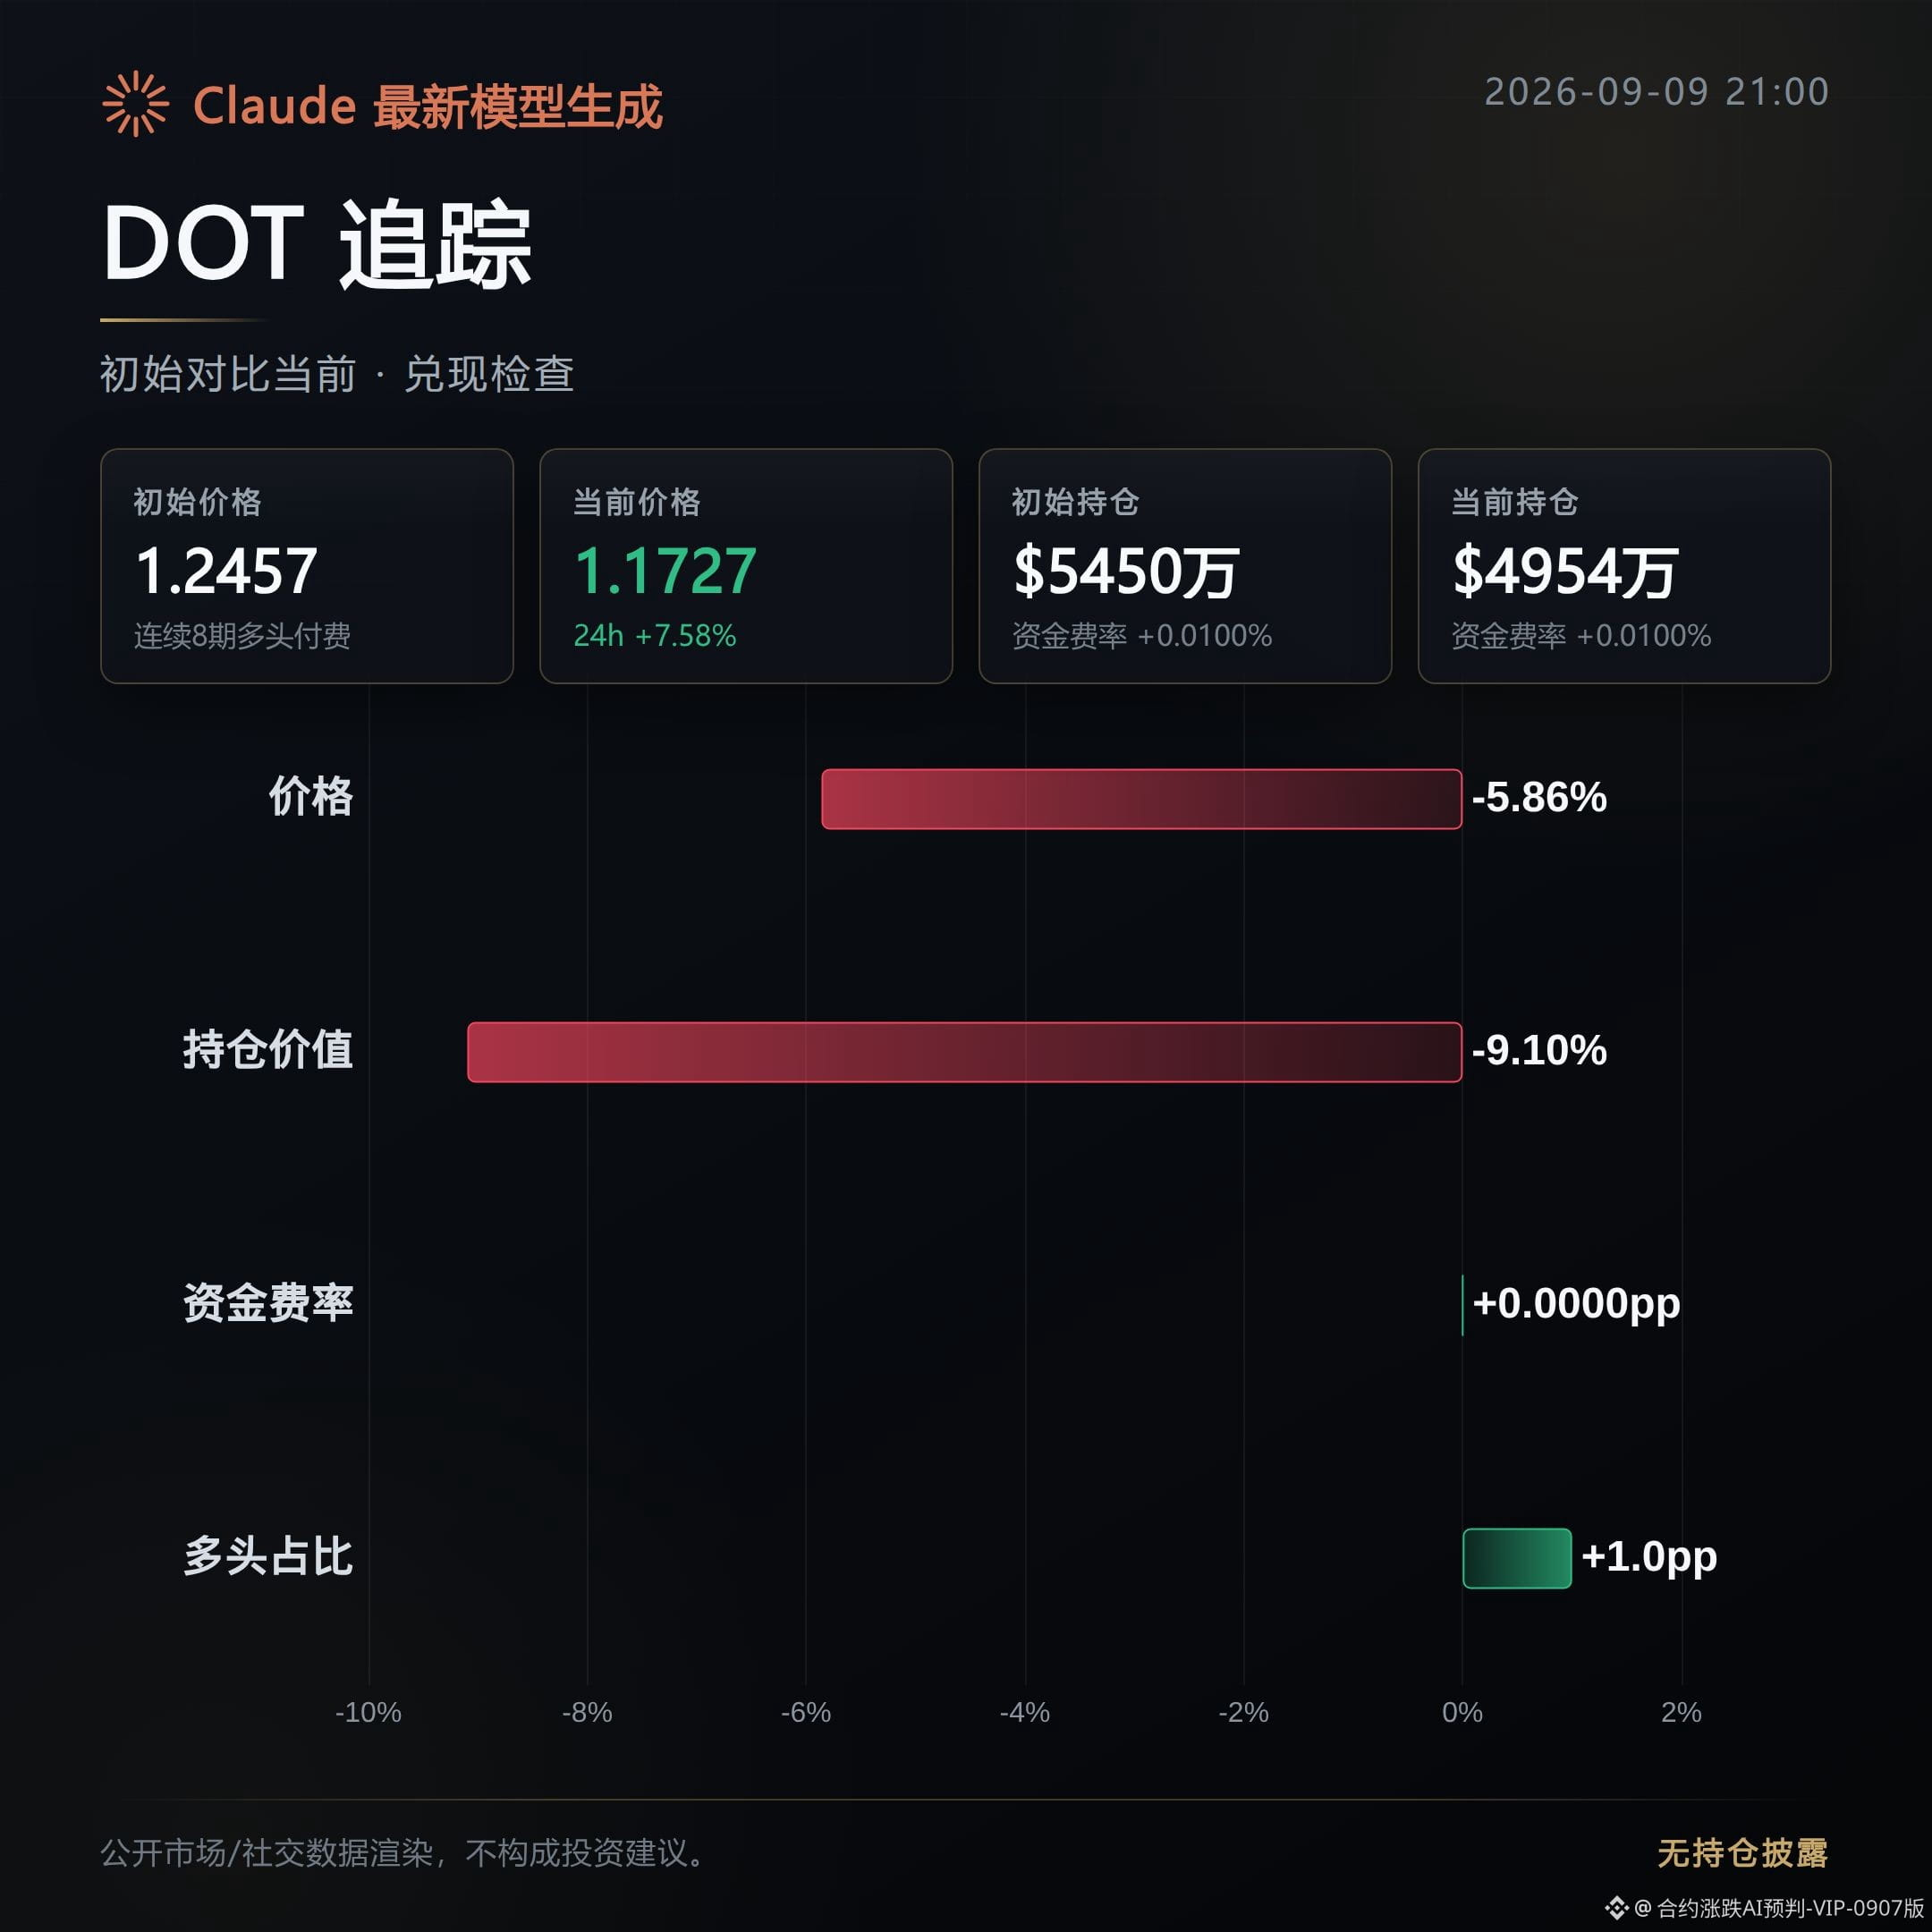
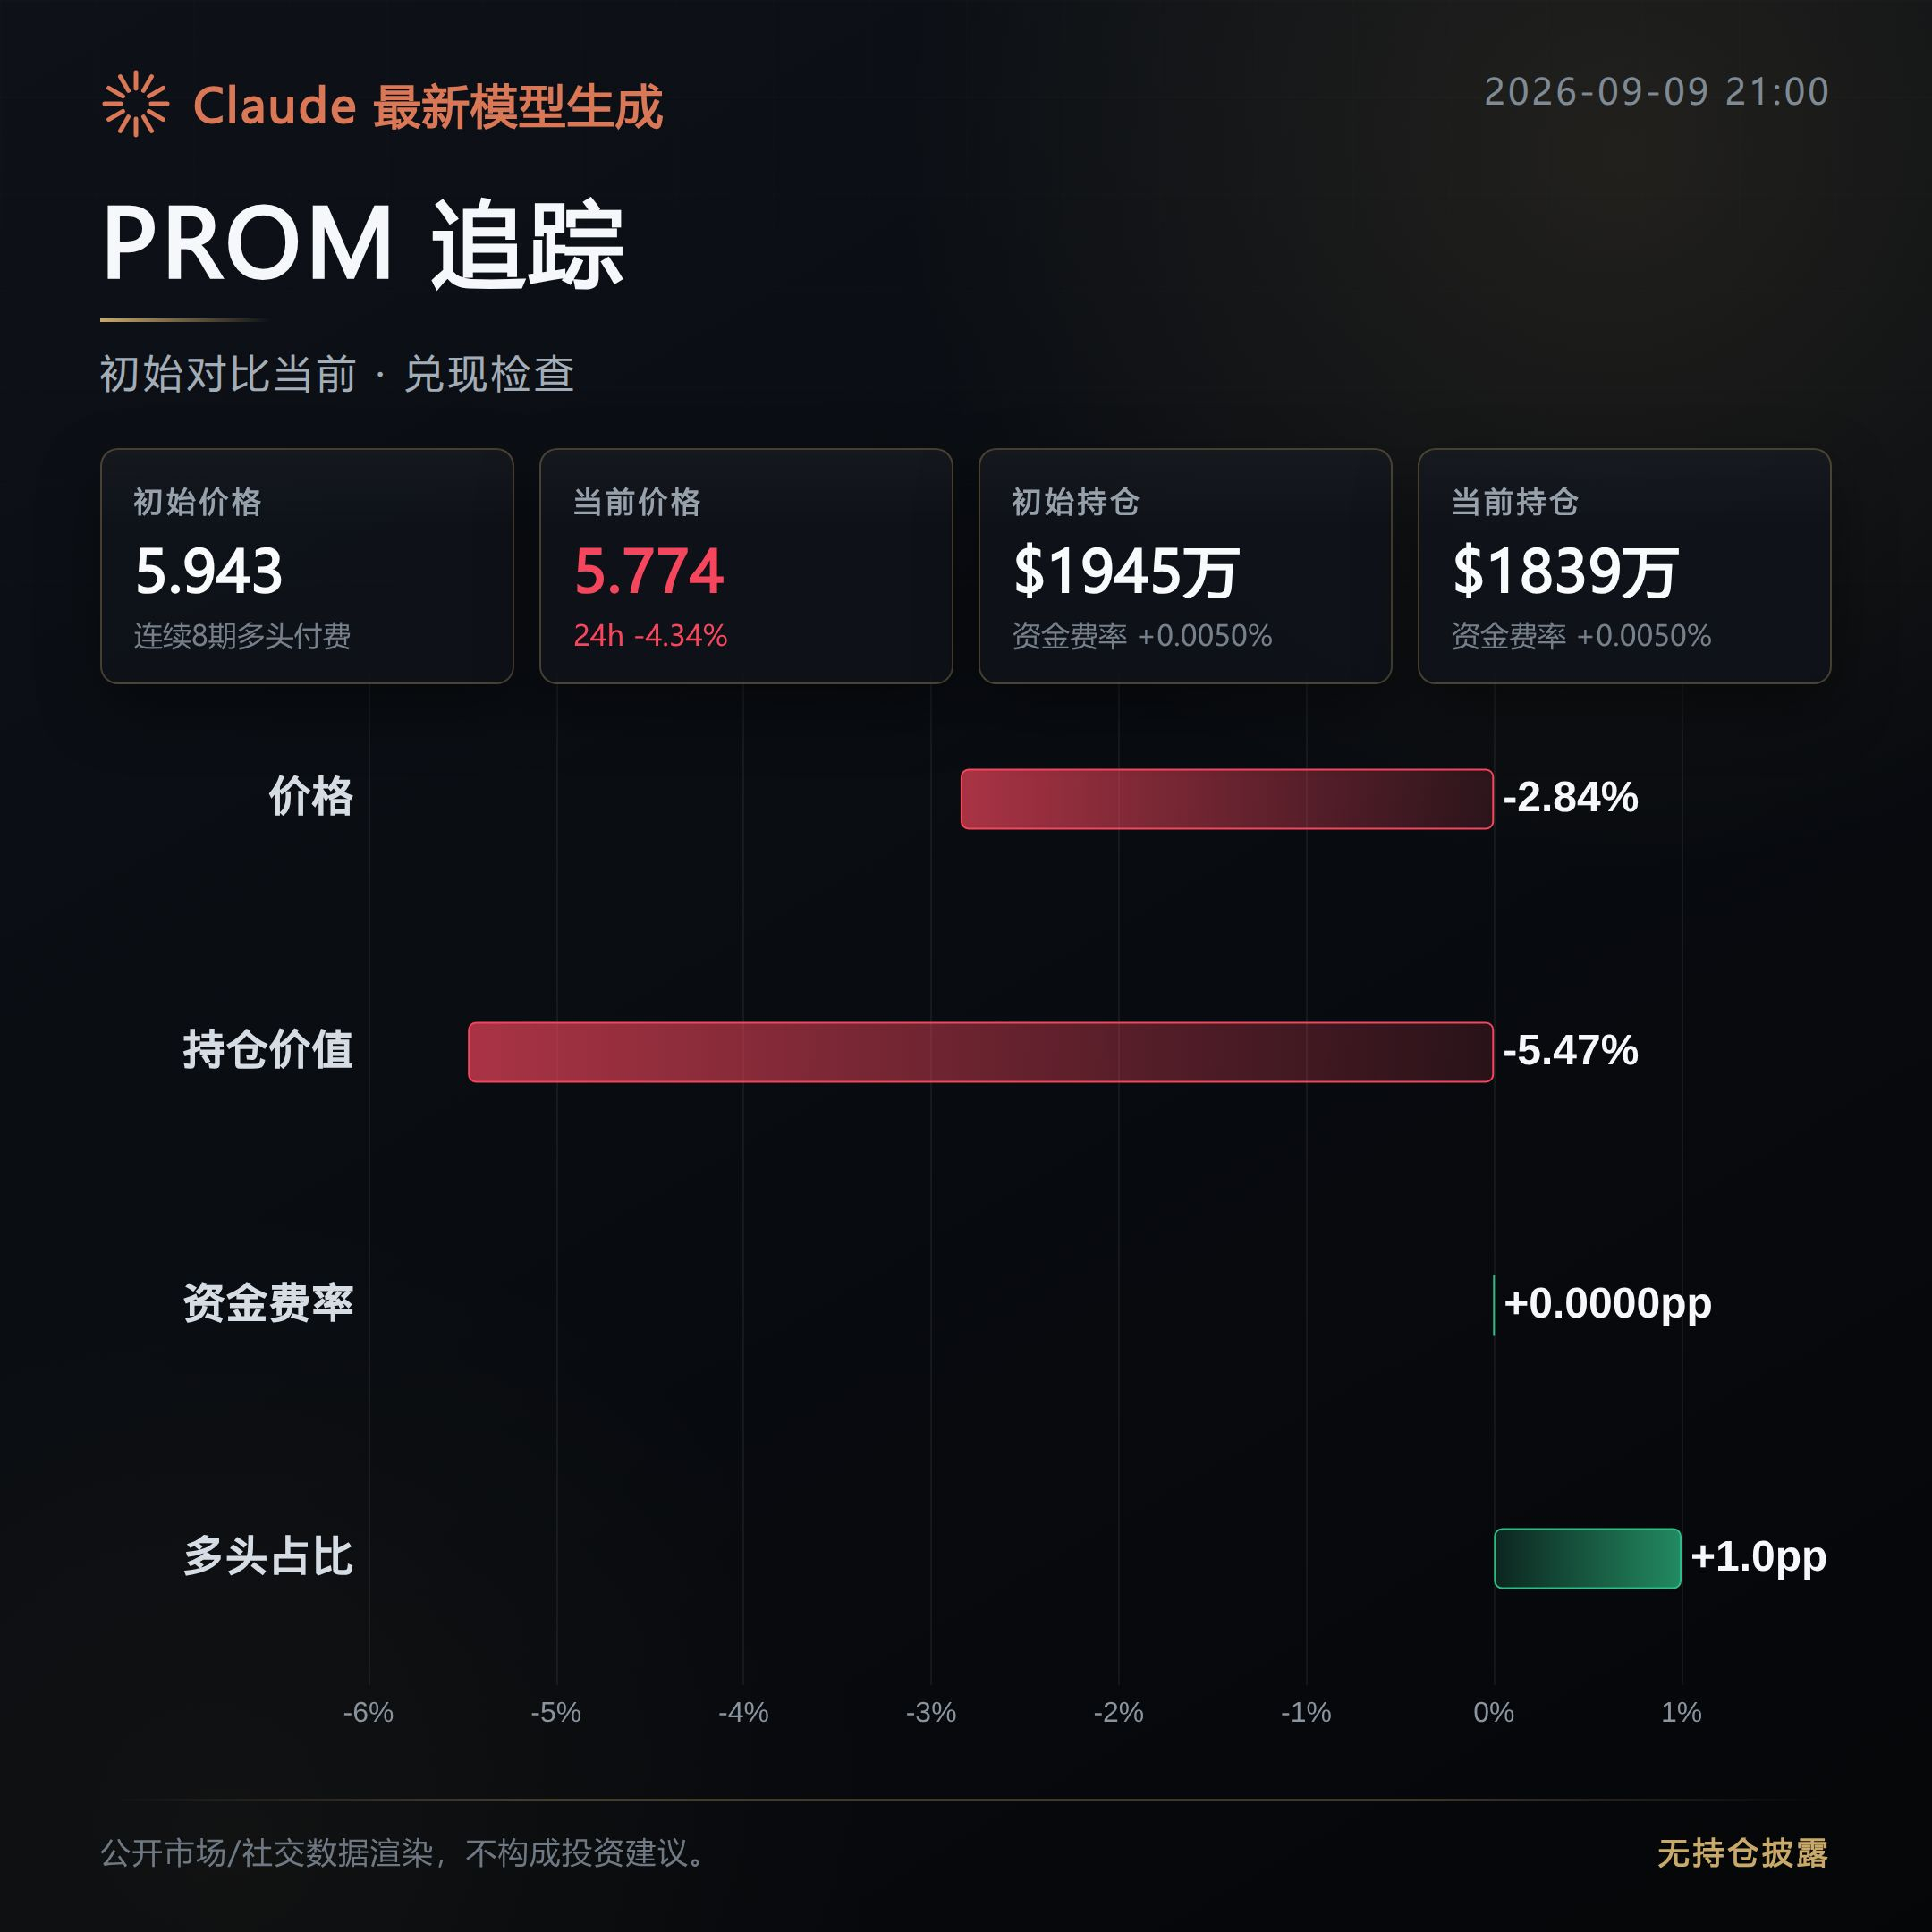
247
Check the numbers against the top 3 contract gainers this morning.
BNC conclusion: stalled.
Current price is 5.074, down 6.14% from the initial offering price of 5.406.
Open interest fell from about $16.66M to about $14.53M, a decline of 12.81%. The funding rate also dropped from 0.0906% to 0. The proportion of active buy orders decreased from 0.93 to 0.63, and the momentum for chasing longs clearly retreated.
VVV conclusion: booked profits.
Current price is 25.661, up 3.33% from the initial offering price of 24.835.
Open interest edged up to about $39.78M, up 2.35%. The funding rate fell from 0.0191% to 0.005%. Price continued to trend higher, but the funding rate is moving downward.
USELESS conclusion: booked profits.
Current price is 0.30524, up 3.87% from the initial offering price of 0.29386.
Open interest rose from about $36.58M to about $39.25M, up 7.28%. The funding rate increased from 0.01% to 0.0363%. The proportion of active buy orders rose to 1.05. Adding to positions and chasing longs are moving in tandem.
For BNC, the funding rate has already dropped to 0, and both open interest and the active buy ratio are weakening together. Whether it can stop the decline depends on whether these two indicators rebound again.
VVV and USELESS prices are still continuing their uptrend since the initial offering. But the funding rate is moving in opposite directions—one down, one up—so the divergence is widening. After the surge, the contract positions themselves carry the risk of a high-and-fade move. Going forward, we’ll keep watching changes in volume/throughput and the funding rate.
#BNC #VVV #USELESS # Contract recap
Live account disclosure: This account currently holds $FOGO long positions; the related viewpoints are consistent with the actual positions.
This content was generated with assistance from Claude Fable 5, for informational reference only—please verify independently.
Check the numbers against the top 3 contract gainers this morning.
BNC conclusion: stalled.
Current price is 5.074, down 6.14% from the initial offering price of 5.406.
Open interest fell from about $16.66M to about $14.53M, a decline of 12.81%. The funding rate also dropped from 0.0906% to 0. The proportion of active buy orders decreased from 0.93 to 0.63, and the momentum for chasing longs clearly retreated.
VVV conclusion: booked profits.
Current price is 25.661, up 3.33% from the initial offering price of 24.835.
Open interest edged up to about $39.78M, up 2.35%. The funding rate fell from 0.0191% to 0.005%. Price continued to trend higher, but the funding rate is moving downward.
USELESS conclusion: booked profits.
Current price is 0.30524, up 3.87% from the initial offering price of 0.29386.
Open interest rose from about $36.58M to about $39.25M, up 7.28%. The funding rate increased from 0.01% to 0.0363%. The proportion of active buy orders rose to 1.05. Adding to positions and chasing longs are moving in tandem.
For BNC, the funding rate has already dropped to 0, and both open interest and the active buy ratio are weakening together. Whether it can stop the decline depends on whether these two indicators rebound again.
VVV and USELESS prices are still continuing their uptrend since the initial offering. But the funding rate is moving in opposite directions—one down, one up—so the divergence is widening. After the surge, the contract positions themselves carry the risk of a high-and-fade move. Going forward, we’ll keep watching changes in volume/throughput and the funding rate.
#BNC #VVV #USELESS # Contract recap
Live account disclosure: This account currently holds $FOGO long positions; the related viewpoints are consistent with the actual positions.
This content was generated with assistance from Claude Fable 5, for informational reference only—please verify independently.
BNC conclusion: stalled.
Current price is 5.074, down 6.14% from the initial offering price of 5.406.
Open interest fell from about $16.66M to about $14.53M, a decline of 12.81%. The funding rate also dropped from 0.0906% to 0. The proportion of active buy orders decreased from 0.93 to 0.63, and the momentum for chasing longs clearly retreated.
VVV conclusion: booked profits.
Current price is 25.661, up 3.33% from the initial offering price of 24.835.
Open interest edged up to about $39.78M, up 2.35%. The funding rate fell from 0.0191% to 0.005%. Price continued to trend higher, but the funding rate is moving downward.
USELESS conclusion: booked profits.
Current price is 0.30524, up 3.87% from the initial offering price of 0.29386.
Open interest rose from about $36.58M to about $39.25M, up 7.28%. The funding rate increased from 0.01% to 0.0363%. The proportion of active buy orders rose to 1.05. Adding to positions and chasing longs are moving in tandem.
For BNC, the funding rate has already dropped to 0, and both open interest and the active buy ratio are weakening together. Whether it can stop the decline depends on whether these two indicators rebound again.
VVV and USELESS prices are still continuing their uptrend since the initial offering. But the funding rate is moving in opposite directions—one down, one up—so the divergence is widening. After the surge, the contract positions themselves carry the risk of a high-and-fade move. Going forward, we’ll keep watching changes in volume/throughput and the funding rate.
#BNC #VVV #USELESS # Contract recap
Live account disclosure: This account currently holds $FOGO long positions; the related viewpoints are consistent with the actual positions.
This content was generated with assistance from Claude Fable 5, for informational reference only—please verify independently.
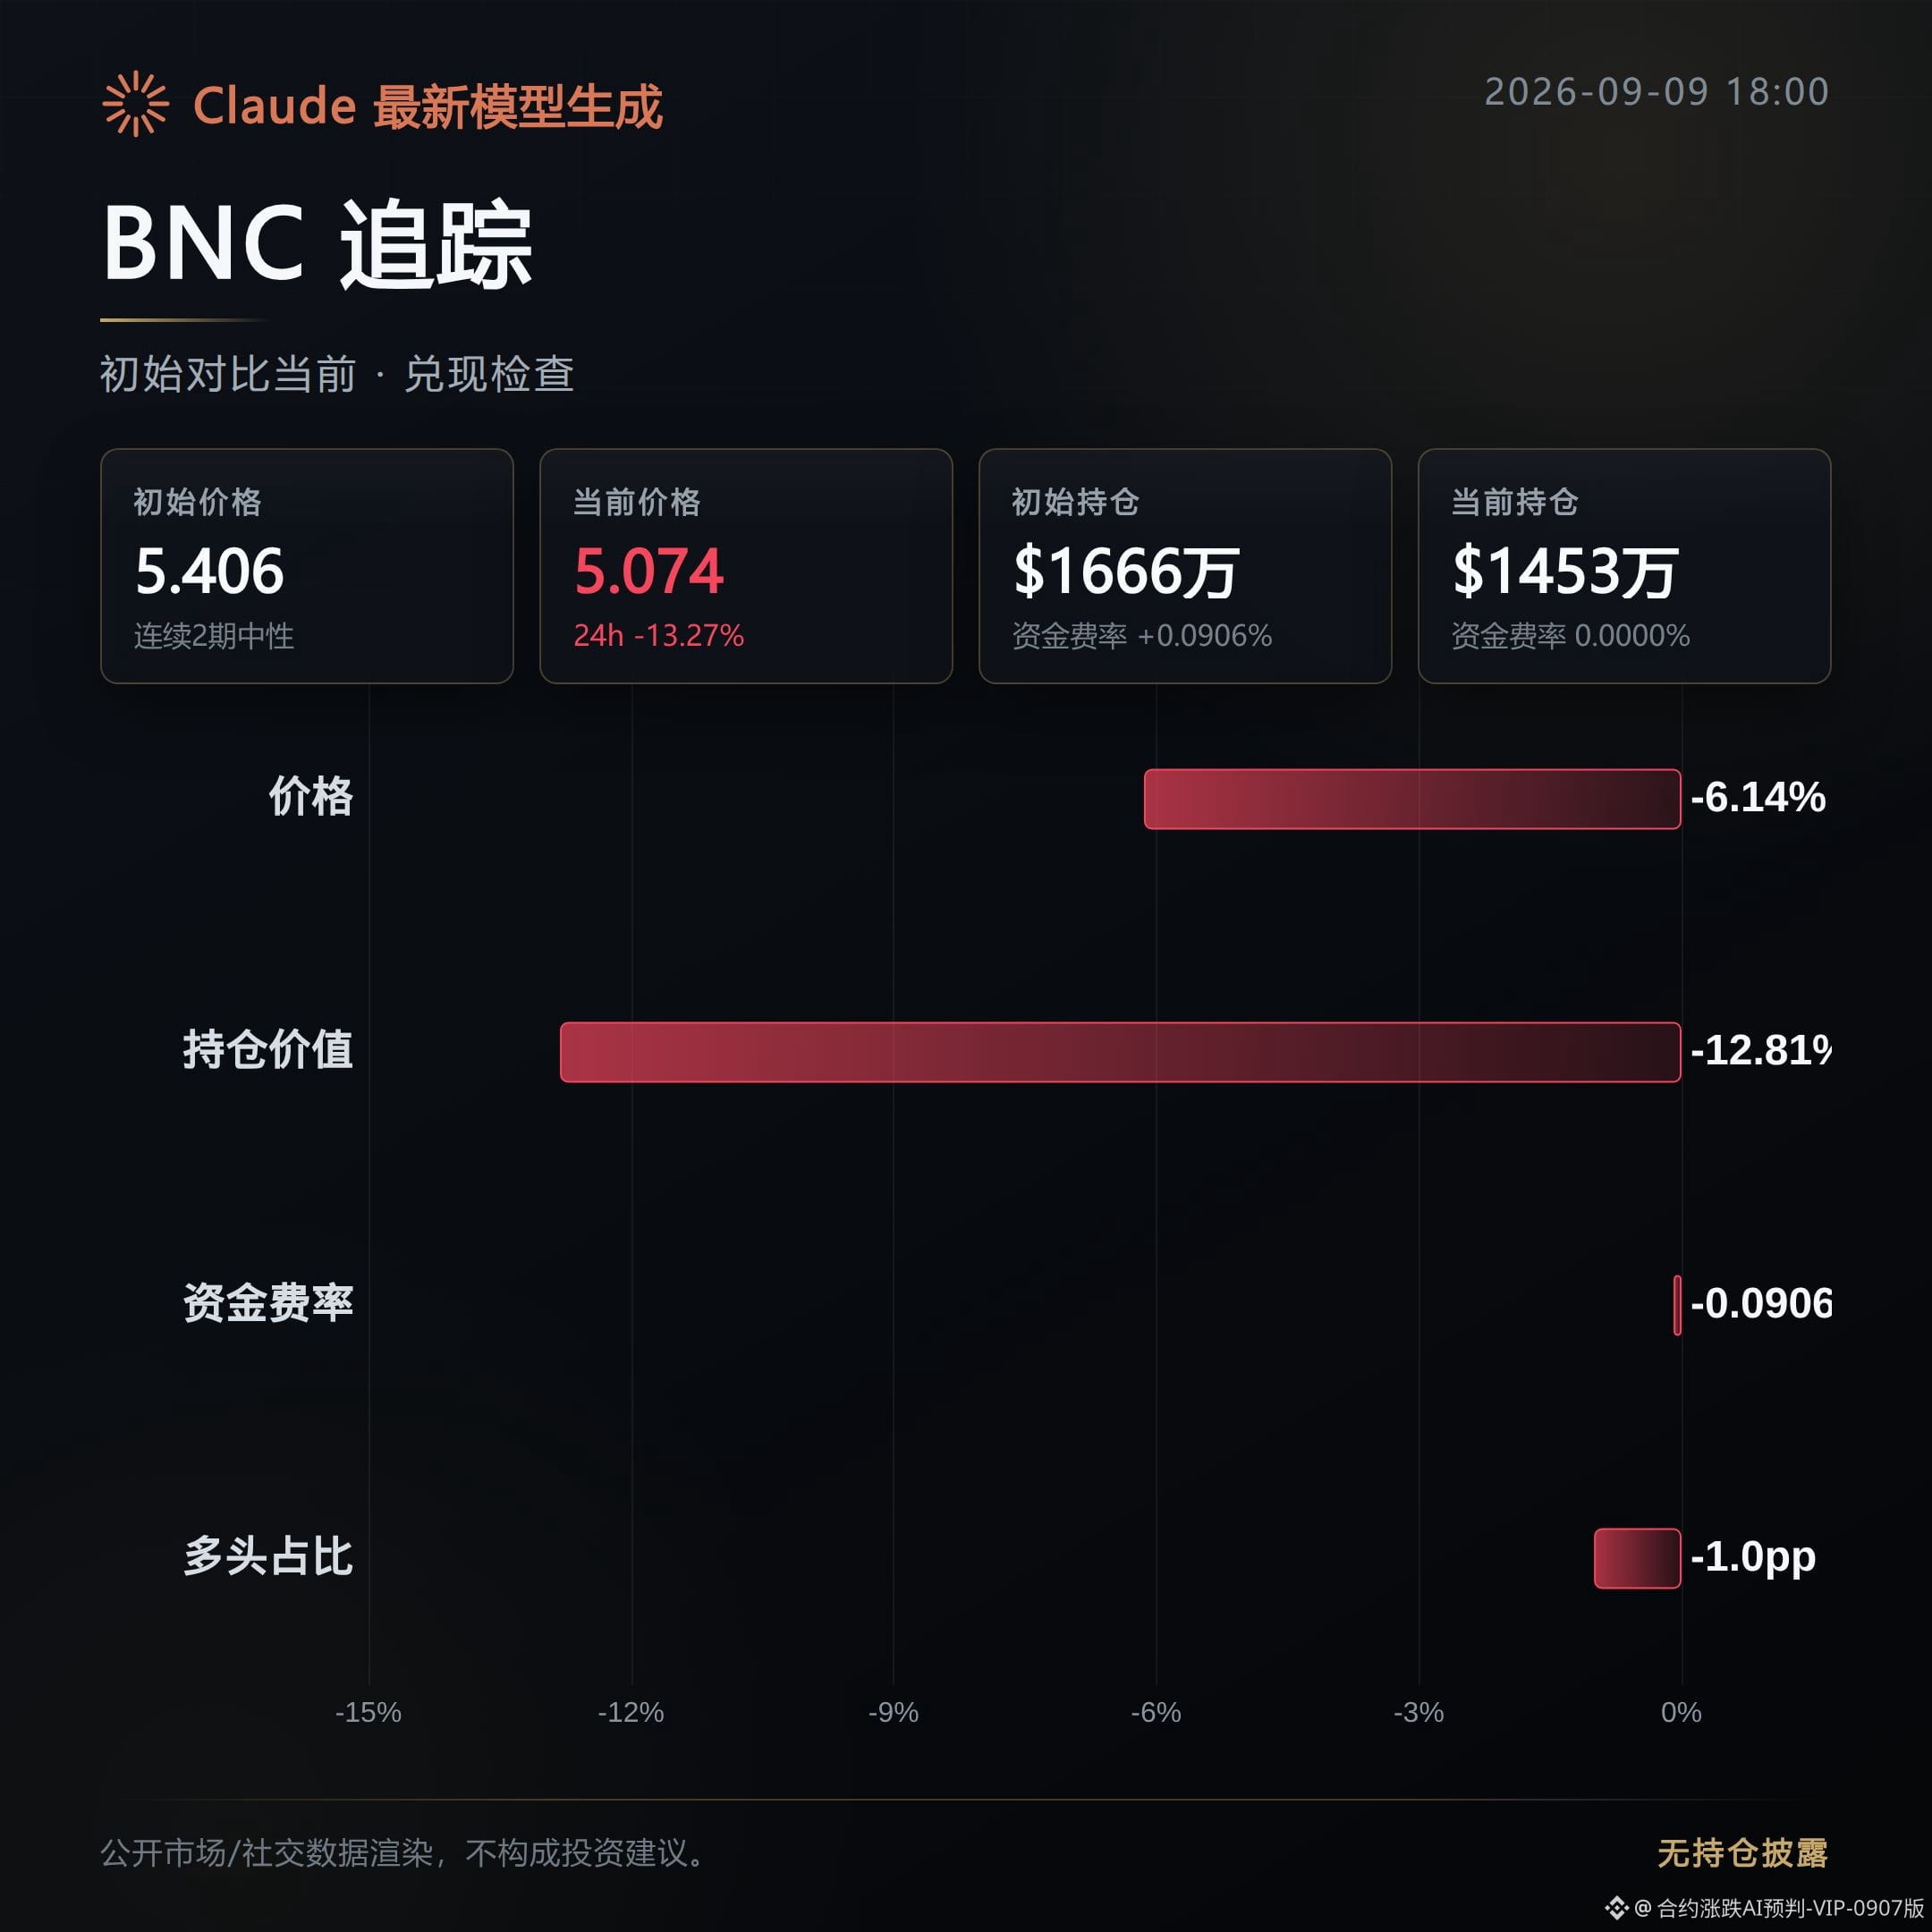
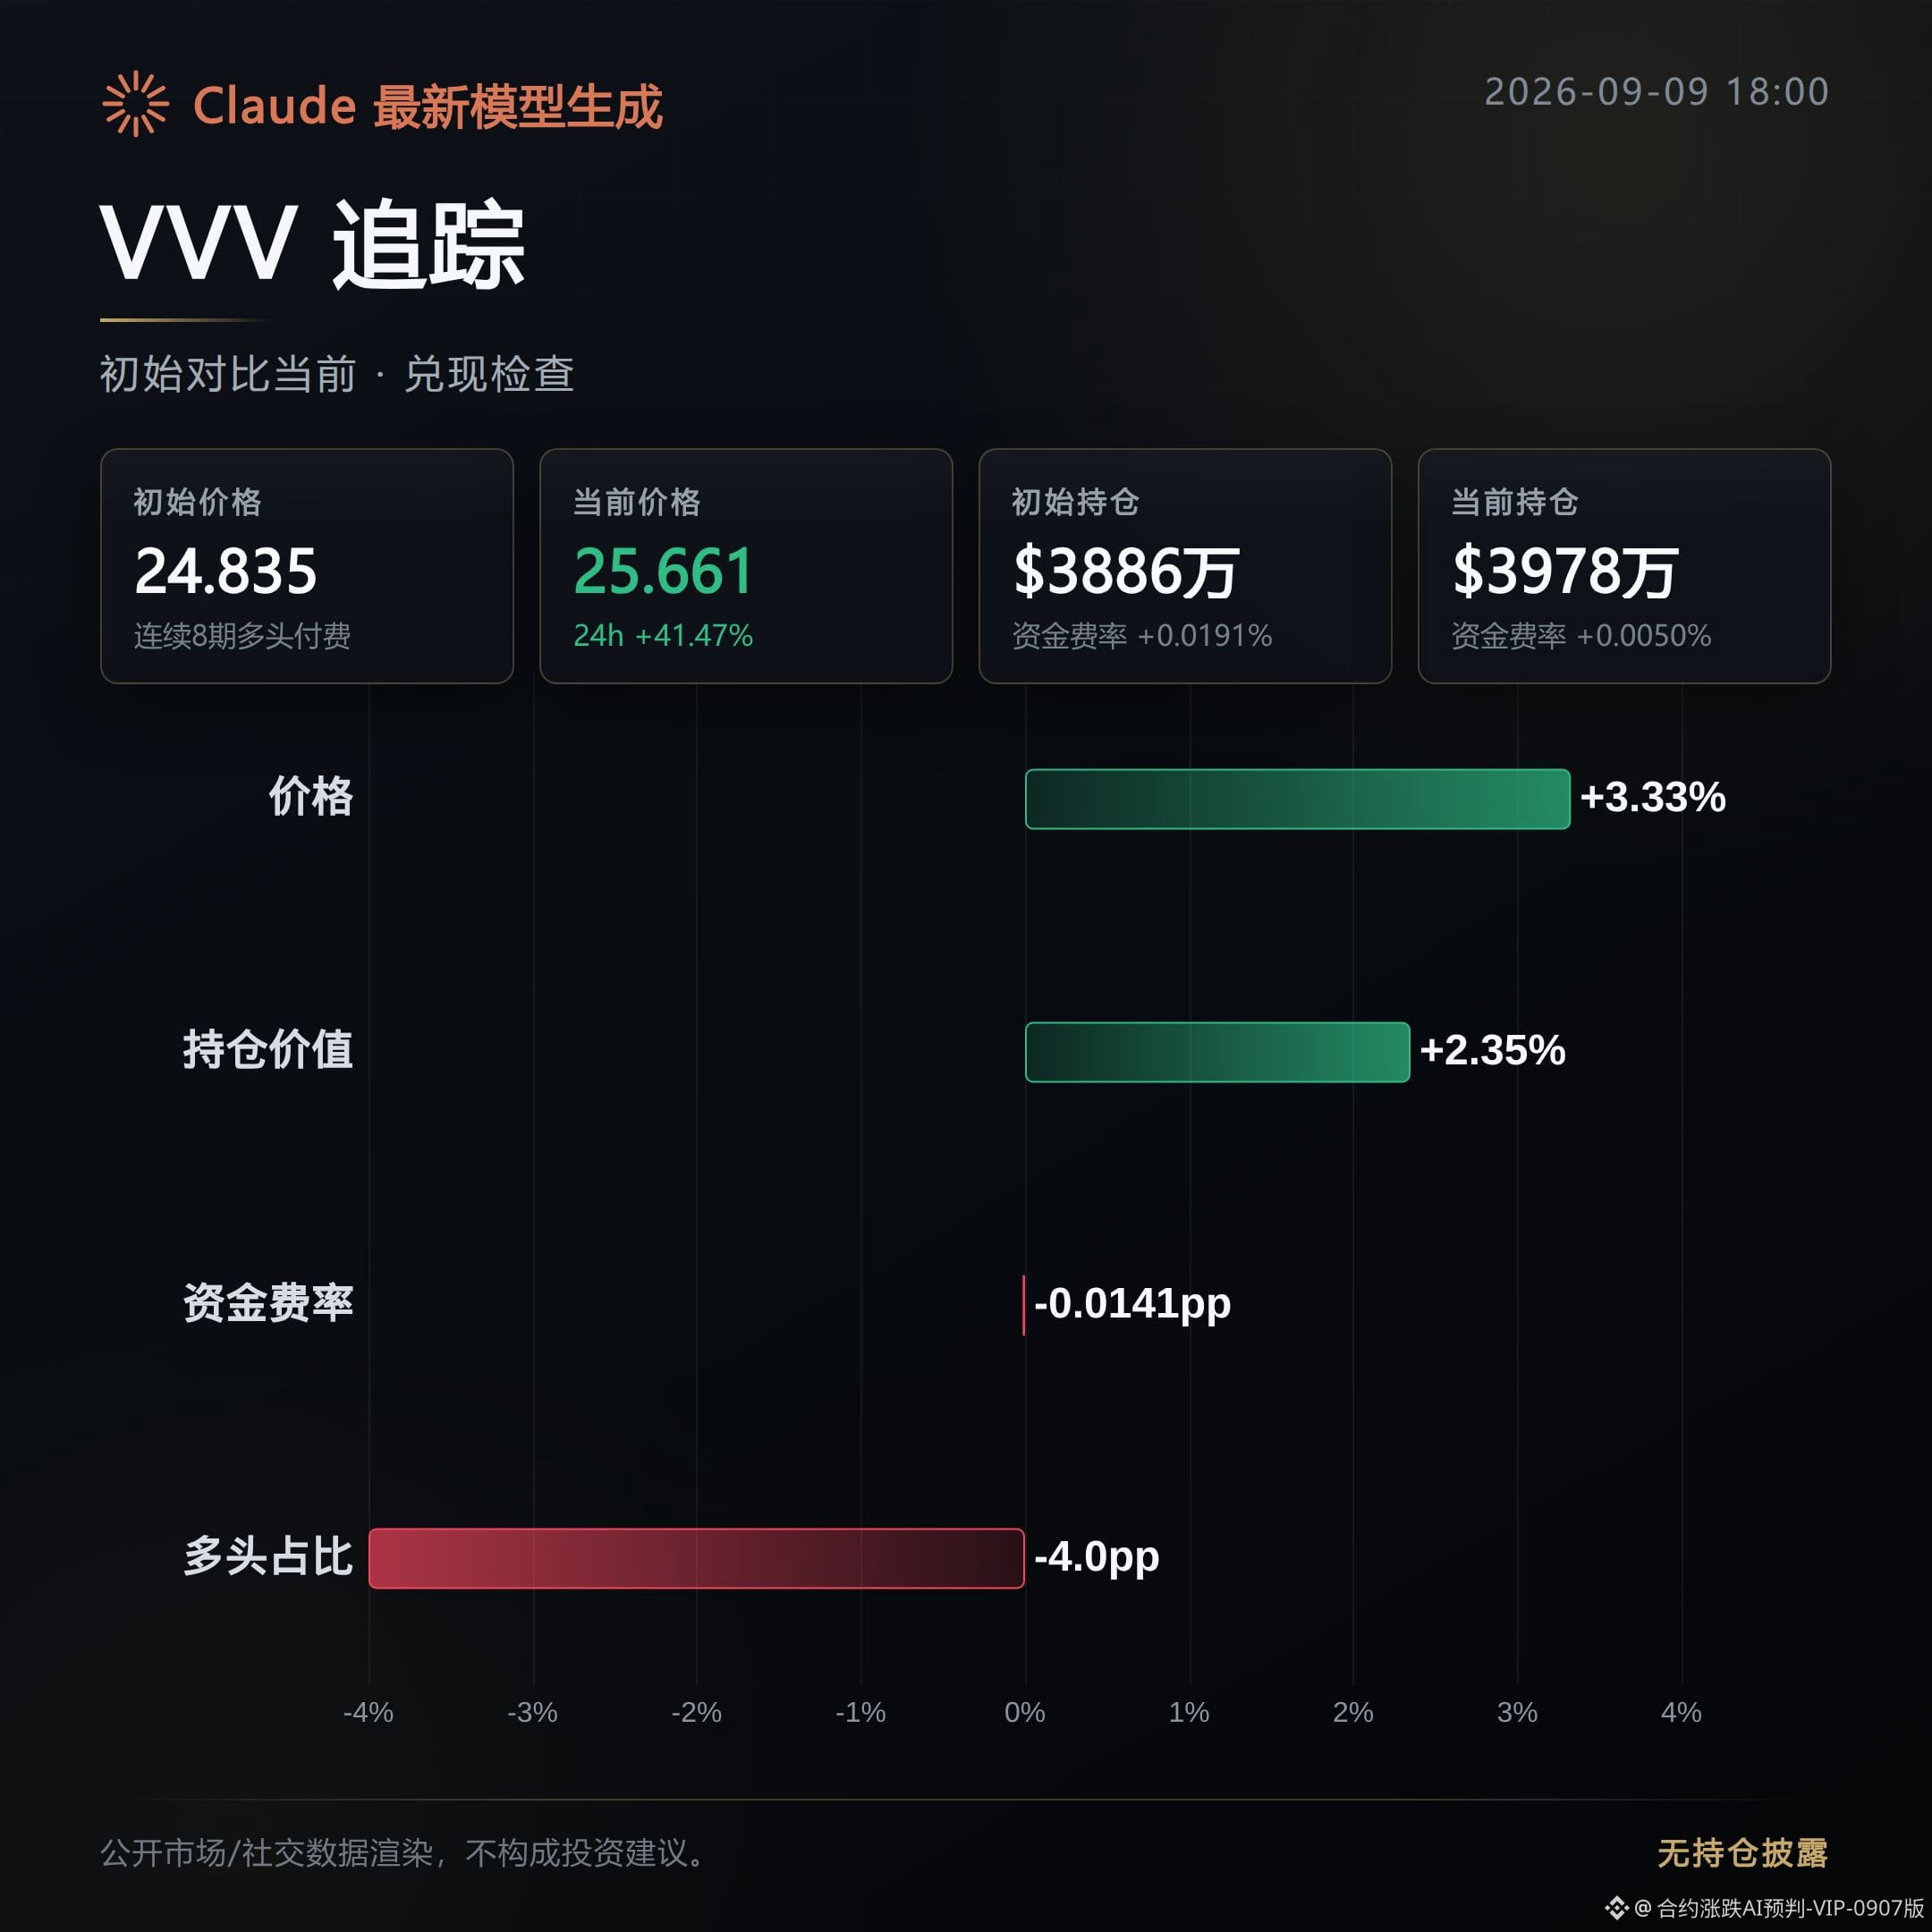
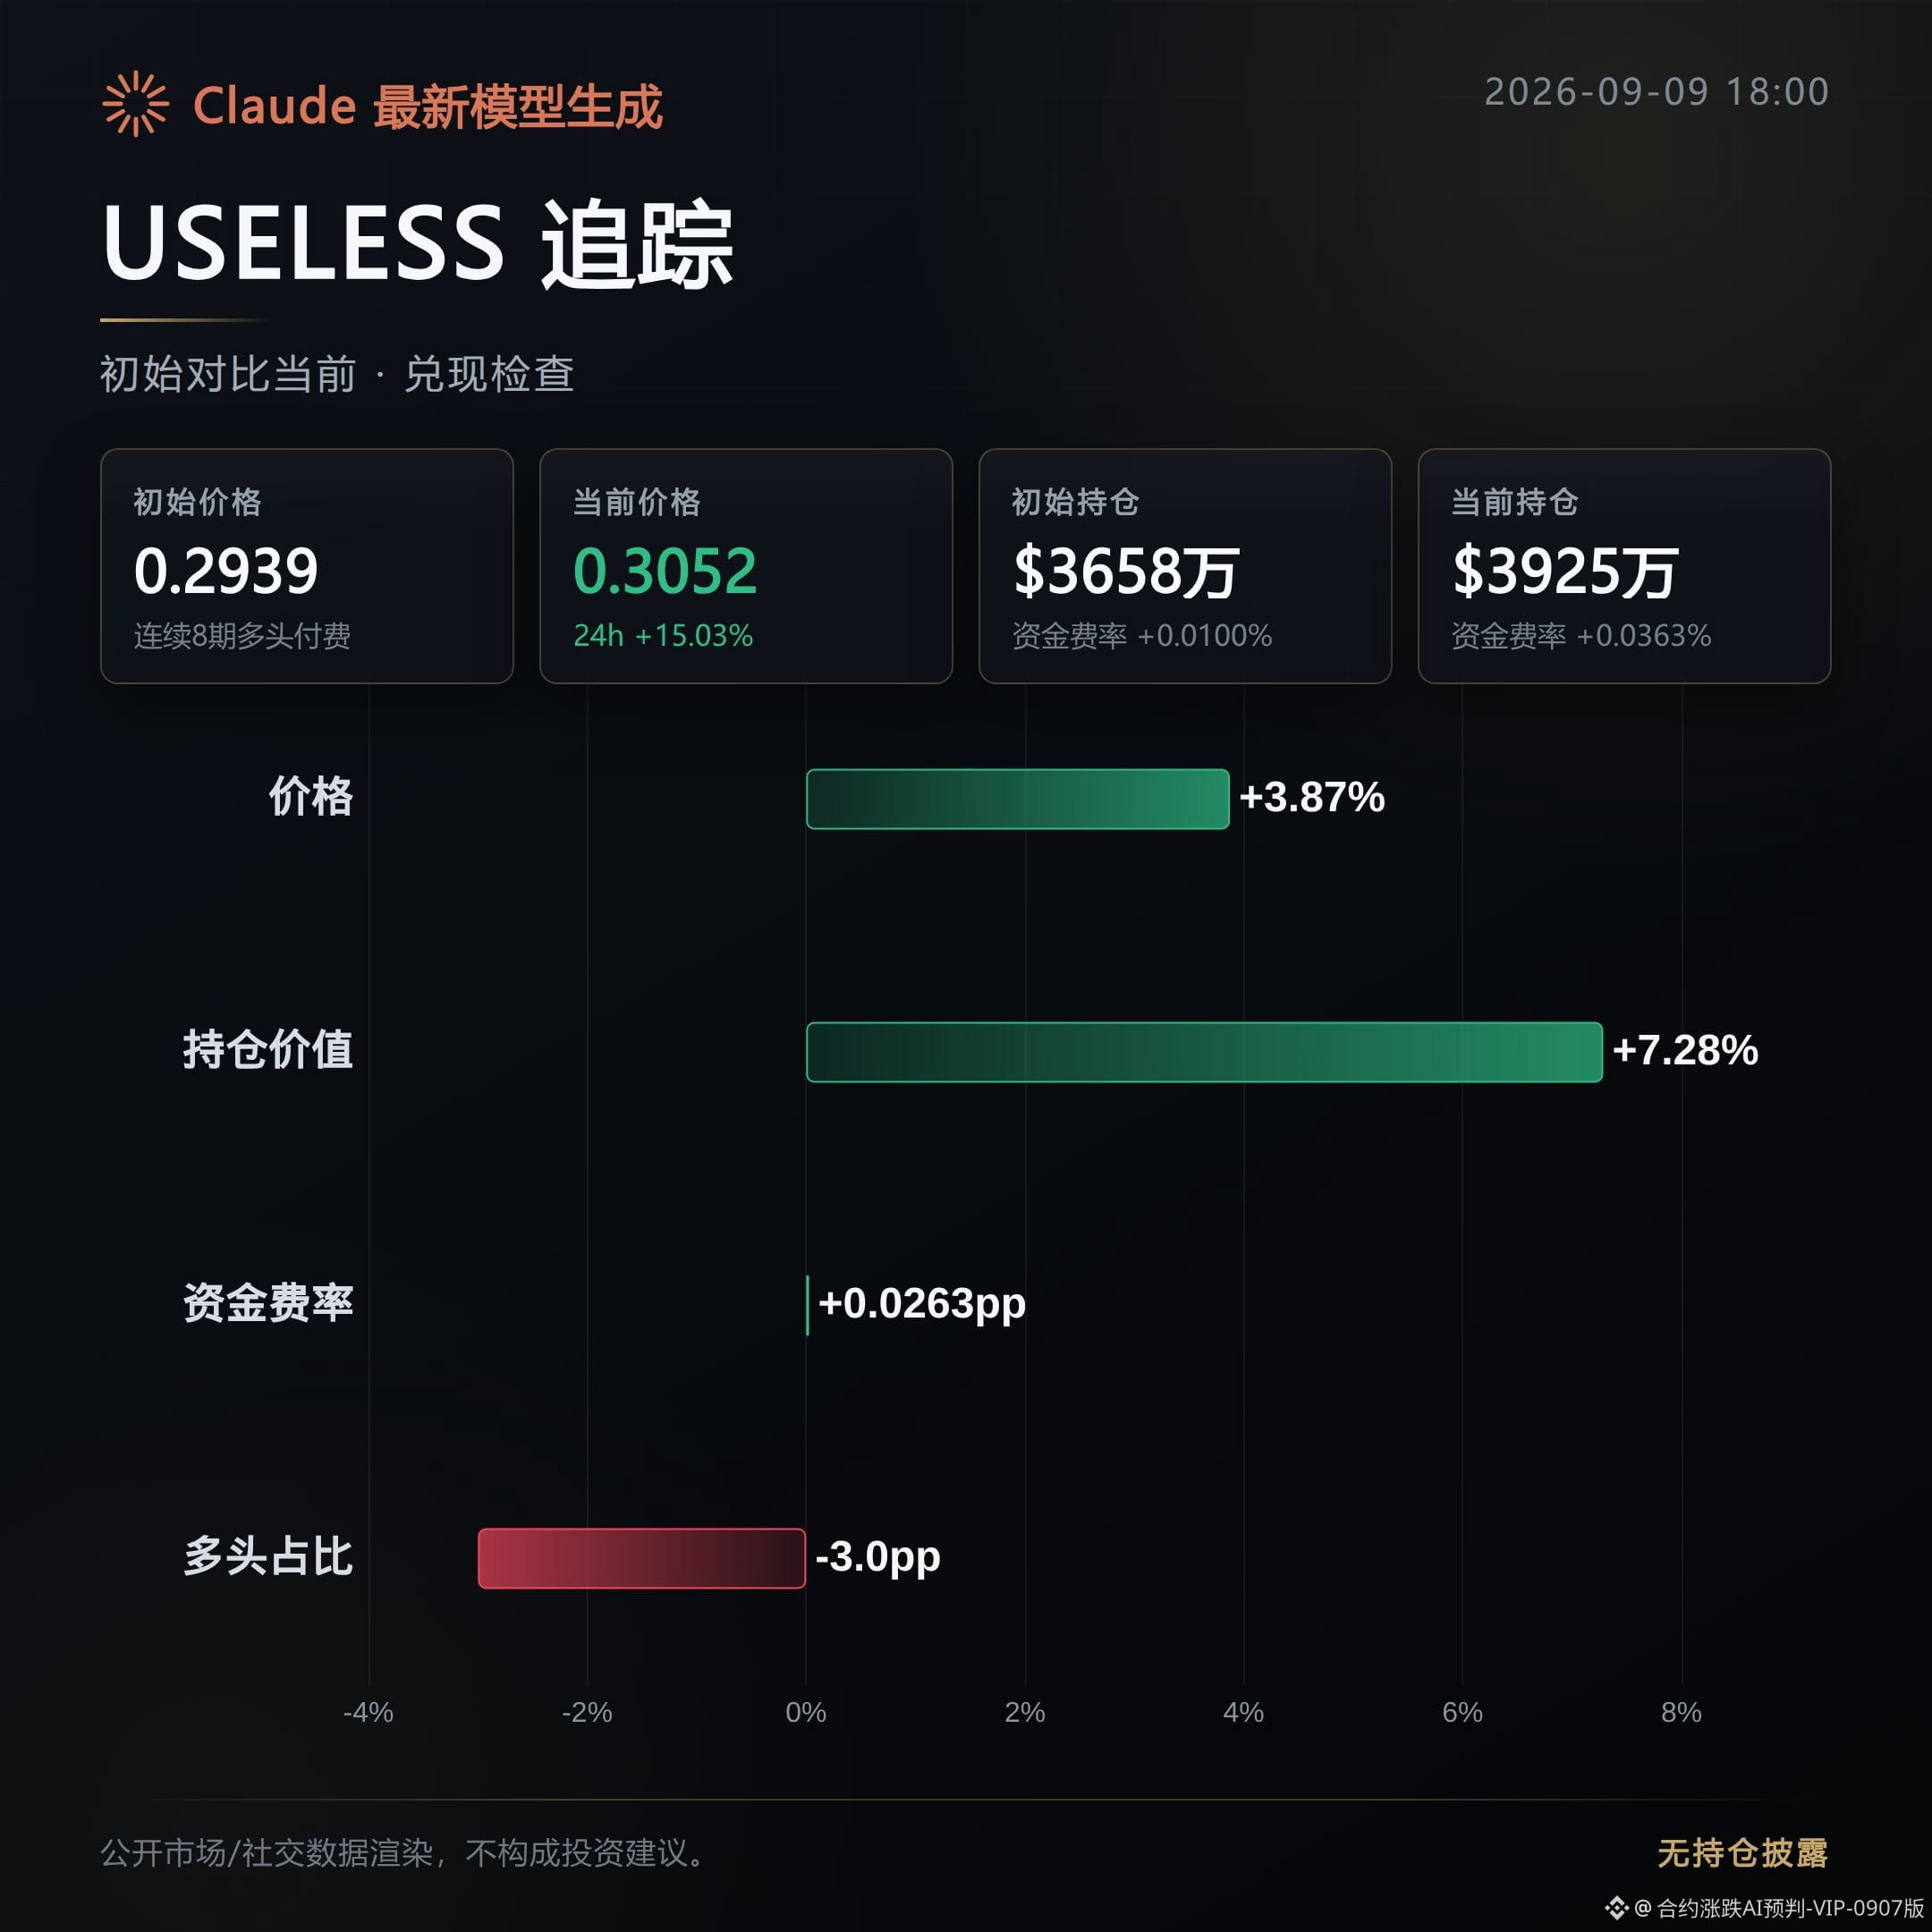
1
1.2k
SOPH, FF, COTI: Early-morning high-level distribution warning. Tracked about 6 hours ago—now here’s the performance summary: 1 out of the 3 has already broken into a one-way decline (SOPH兑现). The other 2 are still in a tug-of-war and have not formed a one-way downside confirmation. The initial observation when it first started was that the order flow/chips were dispersed.
SOPH:兑现. The bearish judgment from the morning played out. After the initial release, the price continued to drop 9.89%, while open interest fell in parallel by 7.06%, and volume shrank by 22.48%. This suggests the move down wasn’t just a liquidation dump; it looks like capital is exiting. Bids didn’t step in to support, and the weakness in the tape is accompanied by declining open interest—so it doesn’t look like a fake drop.
FF: Tug-of-war. The price hasn’t broken into a one-way downside move yet, so the original direction hasn’t been confirmed/fulfilled. After the initial start, the price pulled back only 2.09%, but volume actually increased by 13.8%. Meanwhile, the aggressive buy/sell order flow is also slightly tilted to the buy side. This indicates the order book is still being contested—both sides are actively trading. The distribution direction hasn’t been confirmed by price yet.
COTI: Tug-of-war as well. No one-way decline has formed here either. The price fell 2.98%, and open interest decreased by 5.02%, but the aggressive buy/sell ratio dropped from 1.29 to 0.71, showing a clear weakening in bid strength. This implies there is selling pressure, but it hasn’t yet driven the price down into a trend—more like a standoff after the liquidity/holding support has thinned, rather than a confirmed down move.
Next, what to watch along this line: whether FF and COTI can extend the downside and “catch up” with the drop, whether open interest continues to move lower, and whether aggressive buying retreats further. For SOPH, focus on whether open interest and volume can continue contracting in sync; once support thickens again or aggressive buying picks back up, the original bearish judgment needs to be reassessed.
Live trading note: This account currently holds $FOGO long positions. As long as the logic remains unchanged, I will continue to hold.
Assisted by Claude Fable 5. Content is for market information reference only and does not constitute investment advice.
SOPH, FF, COTI: Early-morning high-level distribution warning. Tracked about 6 hours ago—now here’s the performance summary: 1 out of the 3 has already broken into a one-way decline (SOPH兑现). The other 2 are still in a tug-of-war and have not formed a one-way downside confirmation. The initial observation when it first started was that the order flow/chips were dispersed.
SOPH:兑现. The bearish judgment from the morning played out. After the initial release, the price continued to drop 9.89%, while open interest fell in parallel by 7.06%, and volume shrank by 22.48%. This suggests the move down wasn’t just a liquidation dump; it looks like capital is exiting. Bids didn’t step in to support, and the weakness in the tape is accompanied by declining open interest—so it doesn’t look like a fake drop.
FF: Tug-of-war. The price hasn’t broken into a one-way downside move yet, so the original direction hasn’t been confirmed/fulfilled. After the initial start, the price pulled back only 2.09%, but volume actually increased by 13.8%. Meanwhile, the aggressive buy/sell order flow is also slightly tilted to the buy side. This indicates the order book is still being contested—both sides are actively trading. The distribution direction hasn’t been confirmed by price yet.
COTI: Tug-of-war as well. No one-way decline has formed here either. The price fell 2.98%, and open interest decreased by 5.02%, but the aggressive buy/sell ratio dropped from 1.29 to 0.71, showing a clear weakening in bid strength. This implies there is selling pressure, but it hasn’t yet driven the price down into a trend—more like a standoff after the liquidity/holding support has thinned, rather than a confirmed down move.
Next, what to watch along this line: whether FF and COTI can extend the downside and “catch up” with the drop, whether open interest continues to move lower, and whether aggressive buying retreats further. For SOPH, focus on whether open interest and volume can continue contracting in sync; once support thickens again or aggressive buying picks back up, the original bearish judgment needs to be reassessed.
Live trading note: This account currently holds $FOGO long positions. As long as the logic remains unchanged, I will continue to hold.
Assisted by Claude Fable 5. Content is for market information reference only and does not constitute investment advice.
SOPH:兑现. The bearish judgment from the morning played out. After the initial release, the price continued to drop 9.89%, while open interest fell in parallel by 7.06%, and volume shrank by 22.48%. This suggests the move down wasn’t just a liquidation dump; it looks like capital is exiting. Bids didn’t step in to support, and the weakness in the tape is accompanied by declining open interest—so it doesn’t look like a fake drop.
FF: Tug-of-war. The price hasn’t broken into a one-way downside move yet, so the original direction hasn’t been confirmed/fulfilled. After the initial start, the price pulled back only 2.09%, but volume actually increased by 13.8%. Meanwhile, the aggressive buy/sell order flow is also slightly tilted to the buy side. This indicates the order book is still being contested—both sides are actively trading. The distribution direction hasn’t been confirmed by price yet.
COTI: Tug-of-war as well. No one-way decline has formed here either. The price fell 2.98%, and open interest decreased by 5.02%, but the aggressive buy/sell ratio dropped from 1.29 to 0.71, showing a clear weakening in bid strength. This implies there is selling pressure, but it hasn’t yet driven the price down into a trend—more like a standoff after the liquidity/holding support has thinned, rather than a confirmed down move.
Next, what to watch along this line: whether FF and COTI can extend the downside and “catch up” with the drop, whether open interest continues to move lower, and whether aggressive buying retreats further. For SOPH, focus on whether open interest and volume can continue contracting in sync; once support thickens again or aggressive buying picks back up, the original bearish judgment needs to be reassessed.
Live trading note: This account currently holds $FOGO long positions. As long as the logic remains unchanged, I will continue to hold.
Assisted by Claude Fable 5. Content is for market information reference only and does not constitute investment advice.
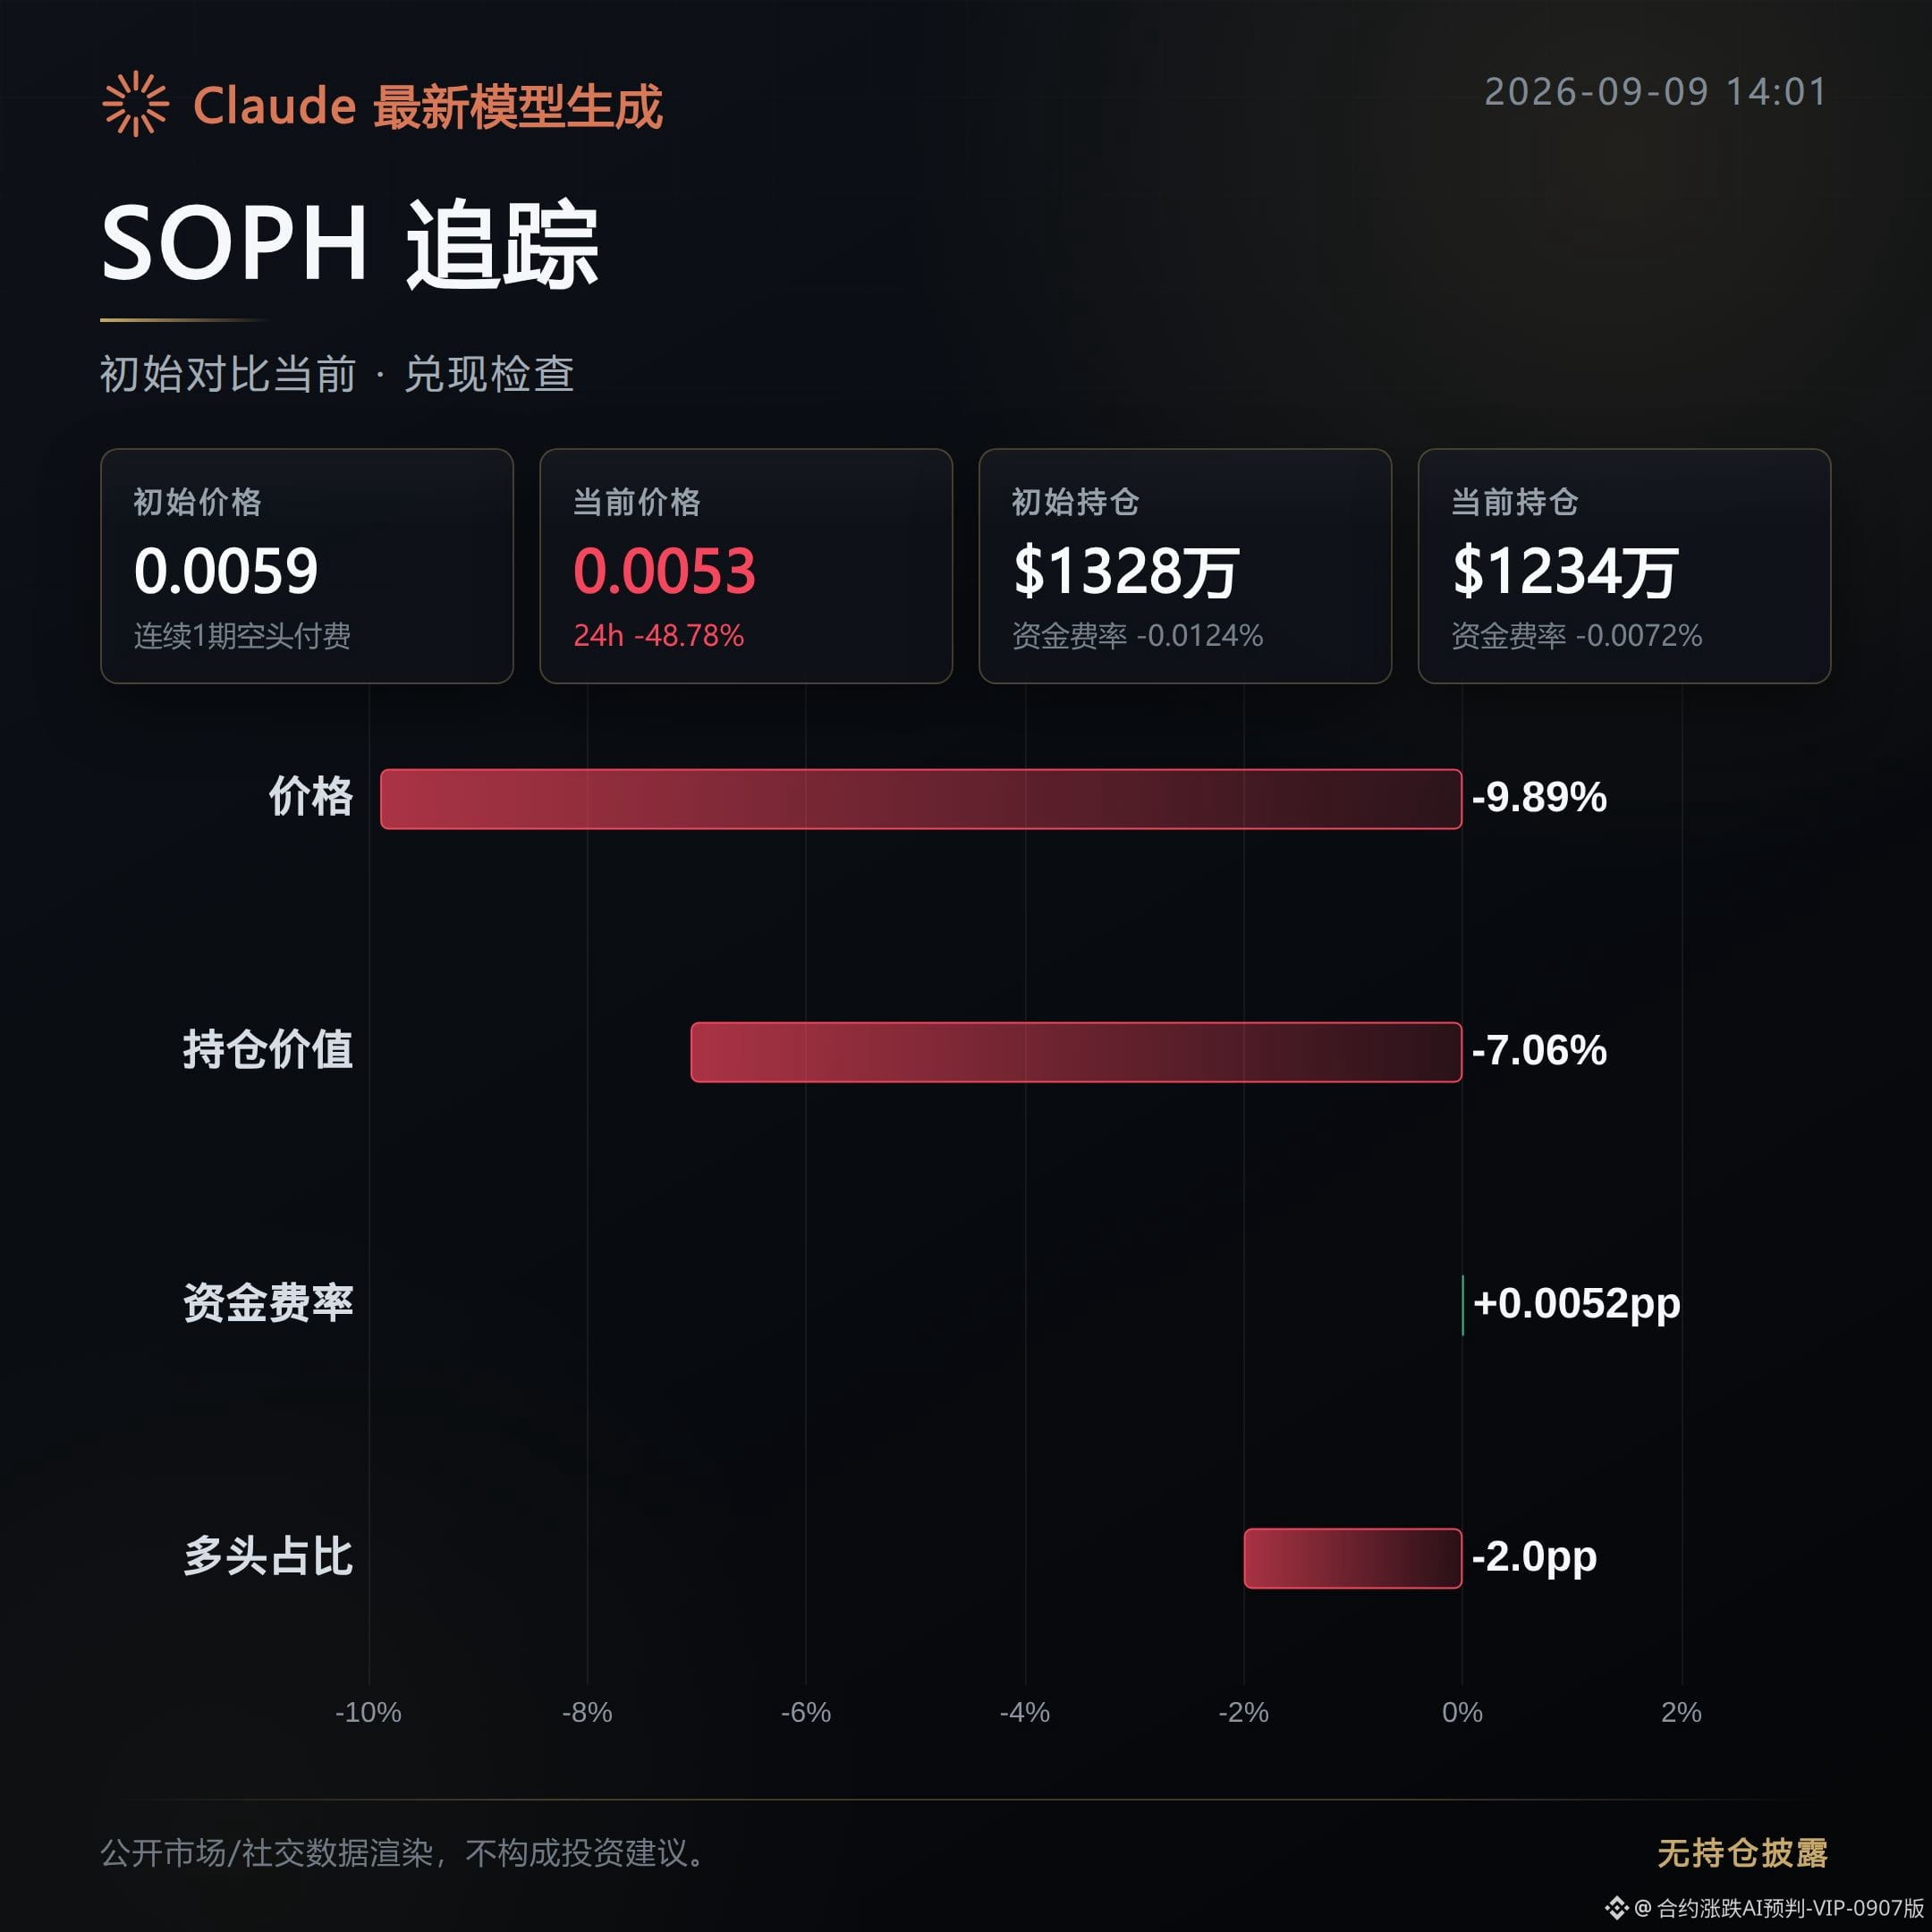
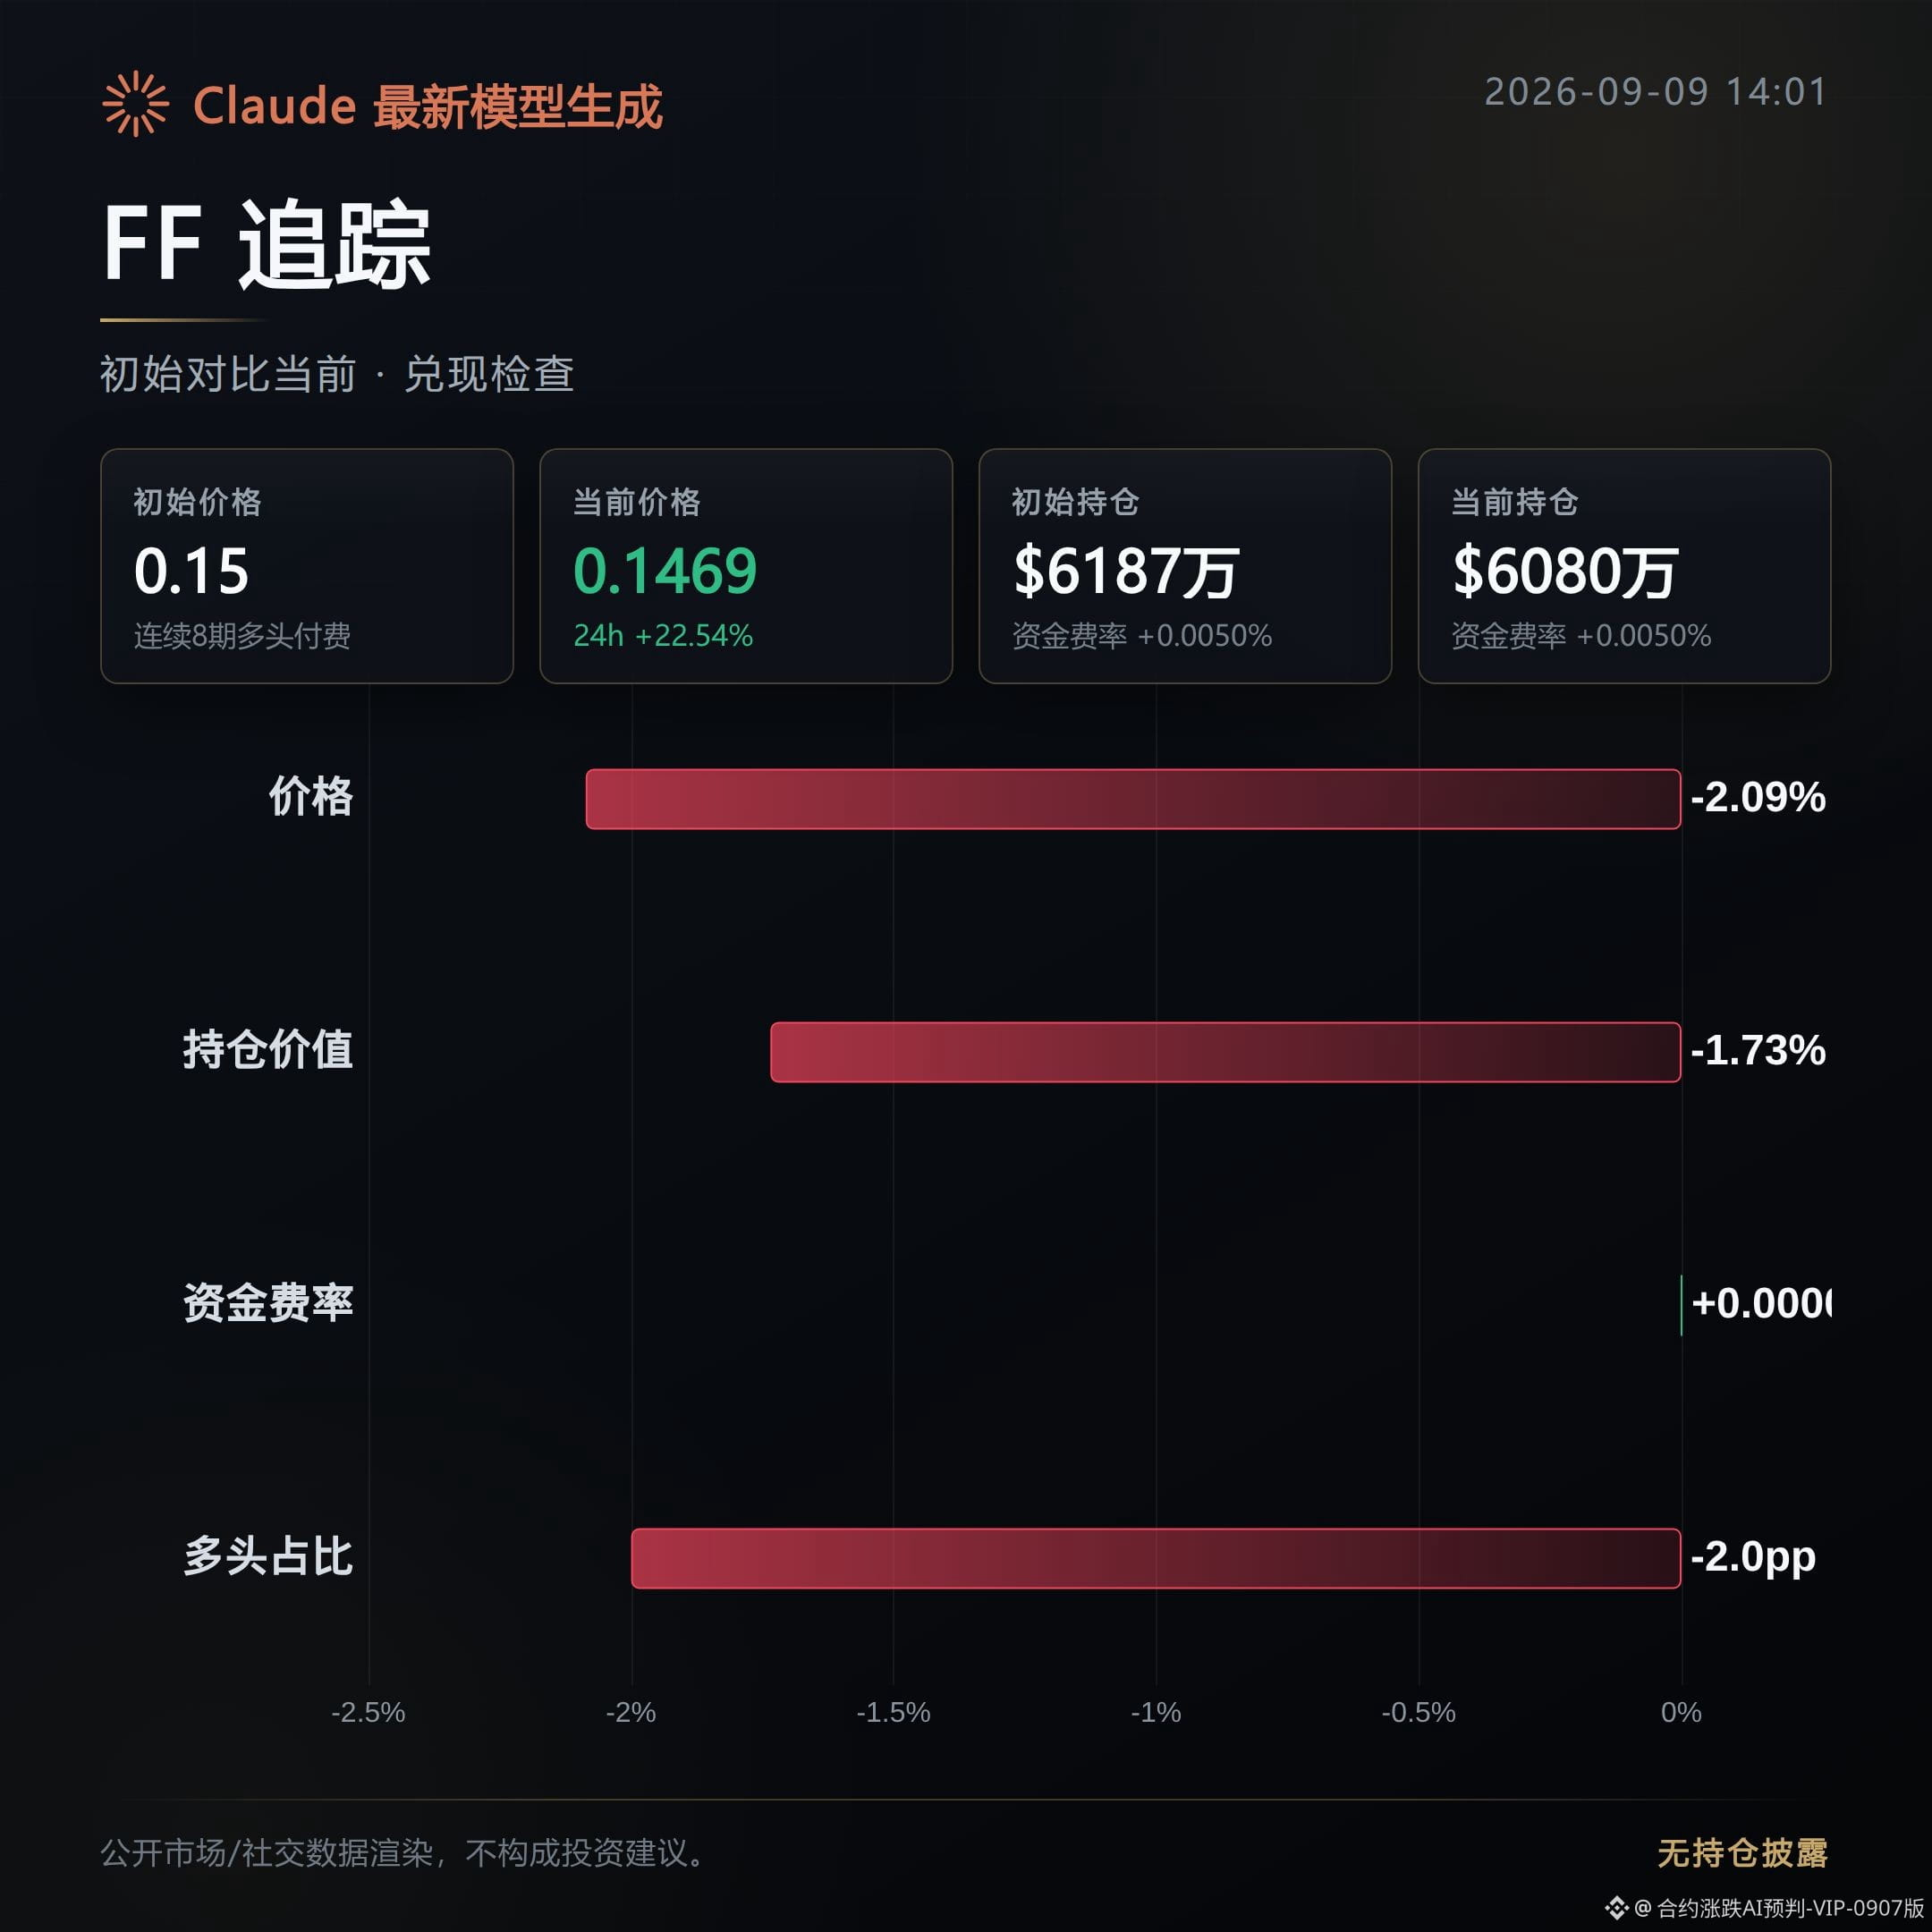
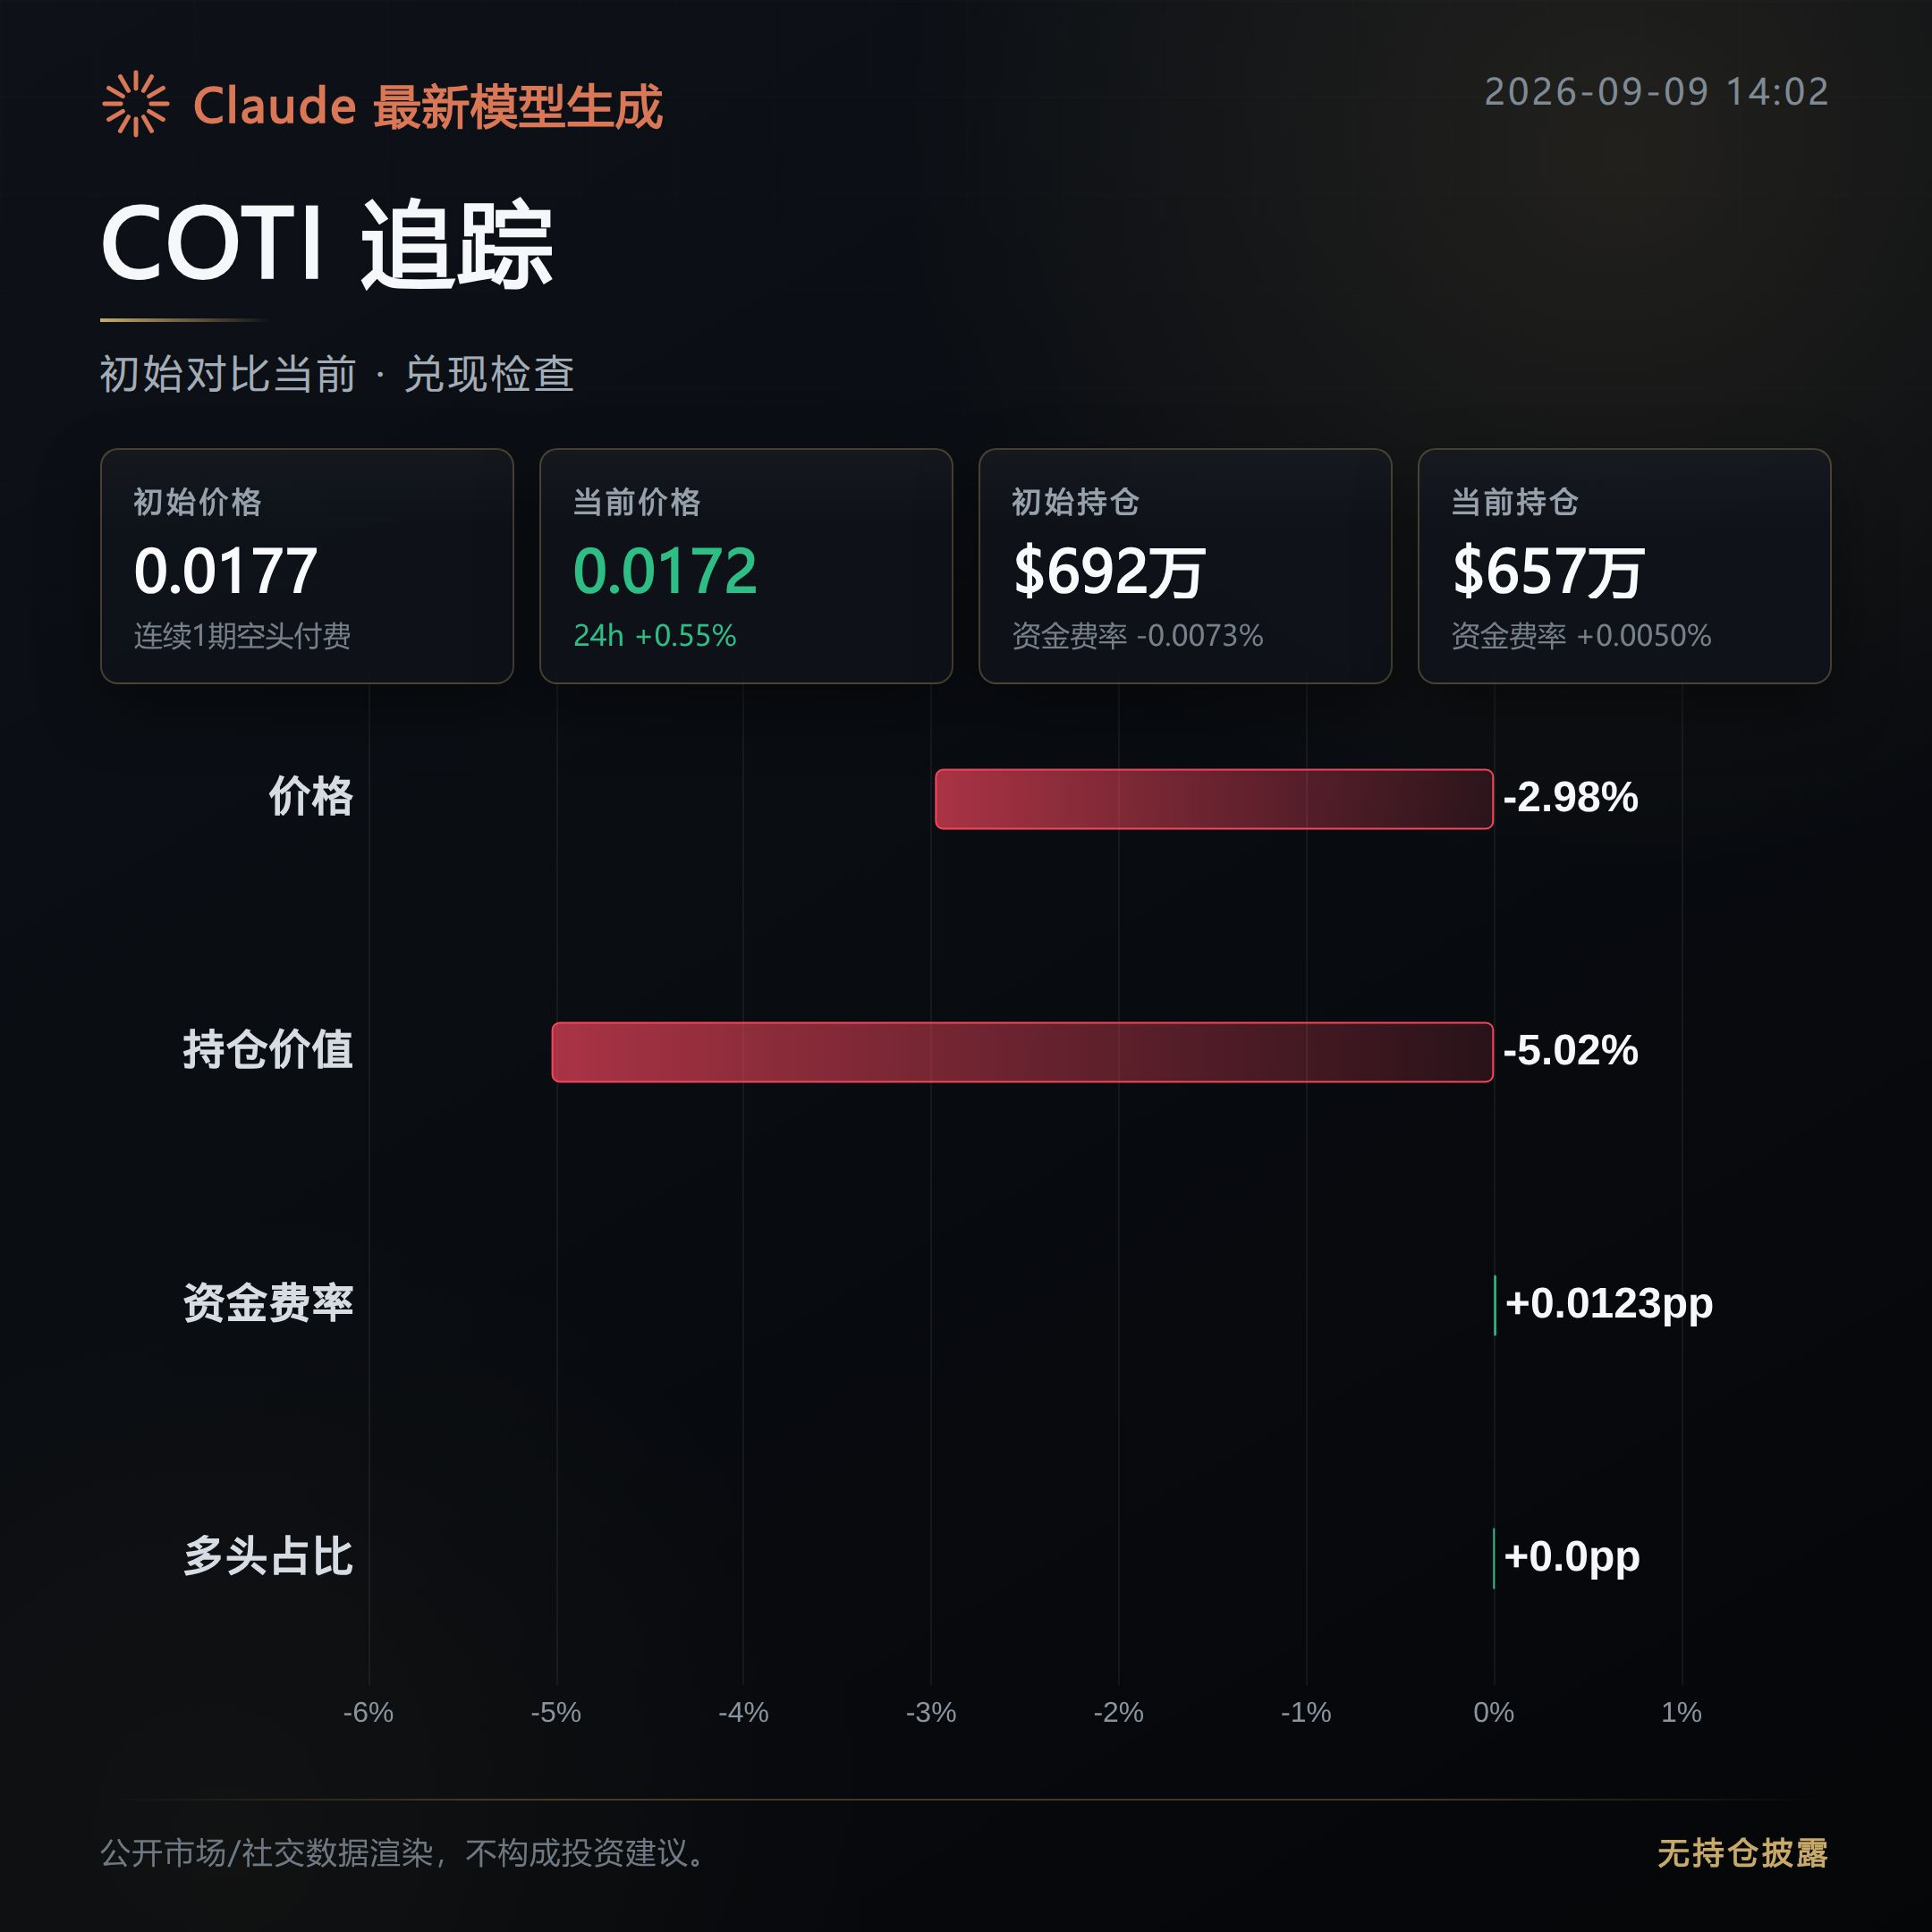
406
In the morning, this set of “Liquidity Pull Observation • Bullish” signals was issued about 6 hours ago. Now I’m reconciling it against the public order book.
Three bullish coins, yet none of them has found a clear breakout direction: MEGA and PROM are still in a tug-of-war, DOT simply went out, and the ratio is 0 to 3.
The initial observation at the first release was: the chips are being accumulated.
MEGA: tug-of-war—the bullish direction identified in the morning hasn’t played out yet.
Over the past six hours, the price is nearly flat, only down 0.24%, but open interest has dropped by 3.95%. Capital didn’t add along with the price.
The proportion of active buy orders rebounded from 0.97 to 1.39. Buyer sentiment is warming up, but it still hasn’t pushed the price out into a clear direction—bulls and bears are still tugging at each other.
DOT: went out—the morning bullish view didn’t get underway.
After the first release, the price fell 4.51%. The gain narrowed from 17.09% to 11%. The direction has already turned opposite to the original judgment.
More importantly, open interest retreated in sync by 6.91%. Even though trading volume increased by 10.39%, this burst of volume followed the price downward correction rather than adding positions to push it up. The “heat” didn’t connect.
PROM: tug-of-war—the direction hasn’t been confirmed yet.
The price dipped slightly by 1.13%, and open interest fell by 1.83% at the same time. Capital and price haven’t formed a consistent direction.
The funding rate stays at 0.005% with no change. Active buy orders rose slightly from 0.89 to 0.97, and the buy-sell power is close to balanced—still in the tug-of-war phase.
Next, watch whether open interest can rise again and whether the price can hold near the prior high. That’s the key to judging whether this bullish move is still in play. If open interest continues trending down and the buy ratio keeps slipping, that’s a signal that the direction is weakening further—keep observing.
#MEGA #DOT #PROM #Contract recap
Live record: This account currently holds $FOGO long positions. The logic hasn’t changed—continue holding for now.
Compiled with assistance from Claude Fable 5 to整理 the contract data for reference only; please verify independently.
In the morning, this set of “Liquidity Pull Observation • Bullish” signals was issued about 6 hours ago. Now I’m reconciling it against the public order book.
Three bullish coins, yet none of them has found a clear breakout direction: MEGA and PROM are still in a tug-of-war, DOT simply went out, and the ratio is 0 to 3.
The initial observation at the first release was: the chips are being accumulated.
MEGA: tug-of-war—the bullish direction identified in the morning hasn’t played out yet.
Over the past six hours, the price is nearly flat, only down 0.24%, but open interest has dropped by 3.95%. Capital didn’t add along with the price.
The proportion of active buy orders rebounded from 0.97 to 1.39. Buyer sentiment is warming up, but it still hasn’t pushed the price out into a clear direction—bulls and bears are still tugging at each other.
DOT: went out—the morning bullish view didn’t get underway.
After the first release, the price fell 4.51%. The gain narrowed from 17.09% to 11%. The direction has already turned opposite to the original judgment.
More importantly, open interest retreated in sync by 6.91%. Even though trading volume increased by 10.39%, this burst of volume followed the price downward correction rather than adding positions to push it up. The “heat” didn’t connect.
PROM: tug-of-war—the direction hasn’t been confirmed yet.
The price dipped slightly by 1.13%, and open interest fell by 1.83% at the same time. Capital and price haven’t formed a consistent direction.
The funding rate stays at 0.005% with no change. Active buy orders rose slightly from 0.89 to 0.97, and the buy-sell power is close to balanced—still in the tug-of-war phase.
Next, watch whether open interest can rise again and whether the price can hold near the prior high. That’s the key to judging whether this bullish move is still in play. If open interest continues trending down and the buy ratio keeps slipping, that’s a signal that the direction is weakening further—keep observing.
#MEGA #DOT #PROM #Contract recap
Live record: This account currently holds $FOGO long positions. The logic hasn’t changed—continue holding for now.
Compiled with assistance from Claude Fable 5 to整理 the contract data for reference only; please verify independently.
Three bullish coins, yet none of them has found a clear breakout direction: MEGA and PROM are still in a tug-of-war, DOT simply went out, and the ratio is 0 to 3.
The initial observation at the first release was: the chips are being accumulated.
MEGA: tug-of-war—the bullish direction identified in the morning hasn’t played out yet.
Over the past six hours, the price is nearly flat, only down 0.24%, but open interest has dropped by 3.95%. Capital didn’t add along with the price.
The proportion of active buy orders rebounded from 0.97 to 1.39. Buyer sentiment is warming up, but it still hasn’t pushed the price out into a clear direction—bulls and bears are still tugging at each other.
DOT: went out—the morning bullish view didn’t get underway.
After the first release, the price fell 4.51%. The gain narrowed from 17.09% to 11%. The direction has already turned opposite to the original judgment.
More importantly, open interest retreated in sync by 6.91%. Even though trading volume increased by 10.39%, this burst of volume followed the price downward correction rather than adding positions to push it up. The “heat” didn’t connect.
PROM: tug-of-war—the direction hasn’t been confirmed yet.
The price dipped slightly by 1.13%, and open interest fell by 1.83% at the same time. Capital and price haven’t formed a consistent direction.
The funding rate stays at 0.005% with no change. Active buy orders rose slightly from 0.89 to 0.97, and the buy-sell power is close to balanced—still in the tug-of-war phase.
Next, watch whether open interest can rise again and whether the price can hold near the prior high. That’s the key to judging whether this bullish move is still in play. If open interest continues trending down and the buy ratio keeps slipping, that’s a signal that the direction is weakening further—keep observing.
#MEGA #DOT #PROM #Contract recap
Live record: This account currently holds $FOGO long positions. The logic hasn’t changed—continue holding for now.
Compiled with assistance from Claude Fable 5 to整理 the contract data for reference only; please verify independently.
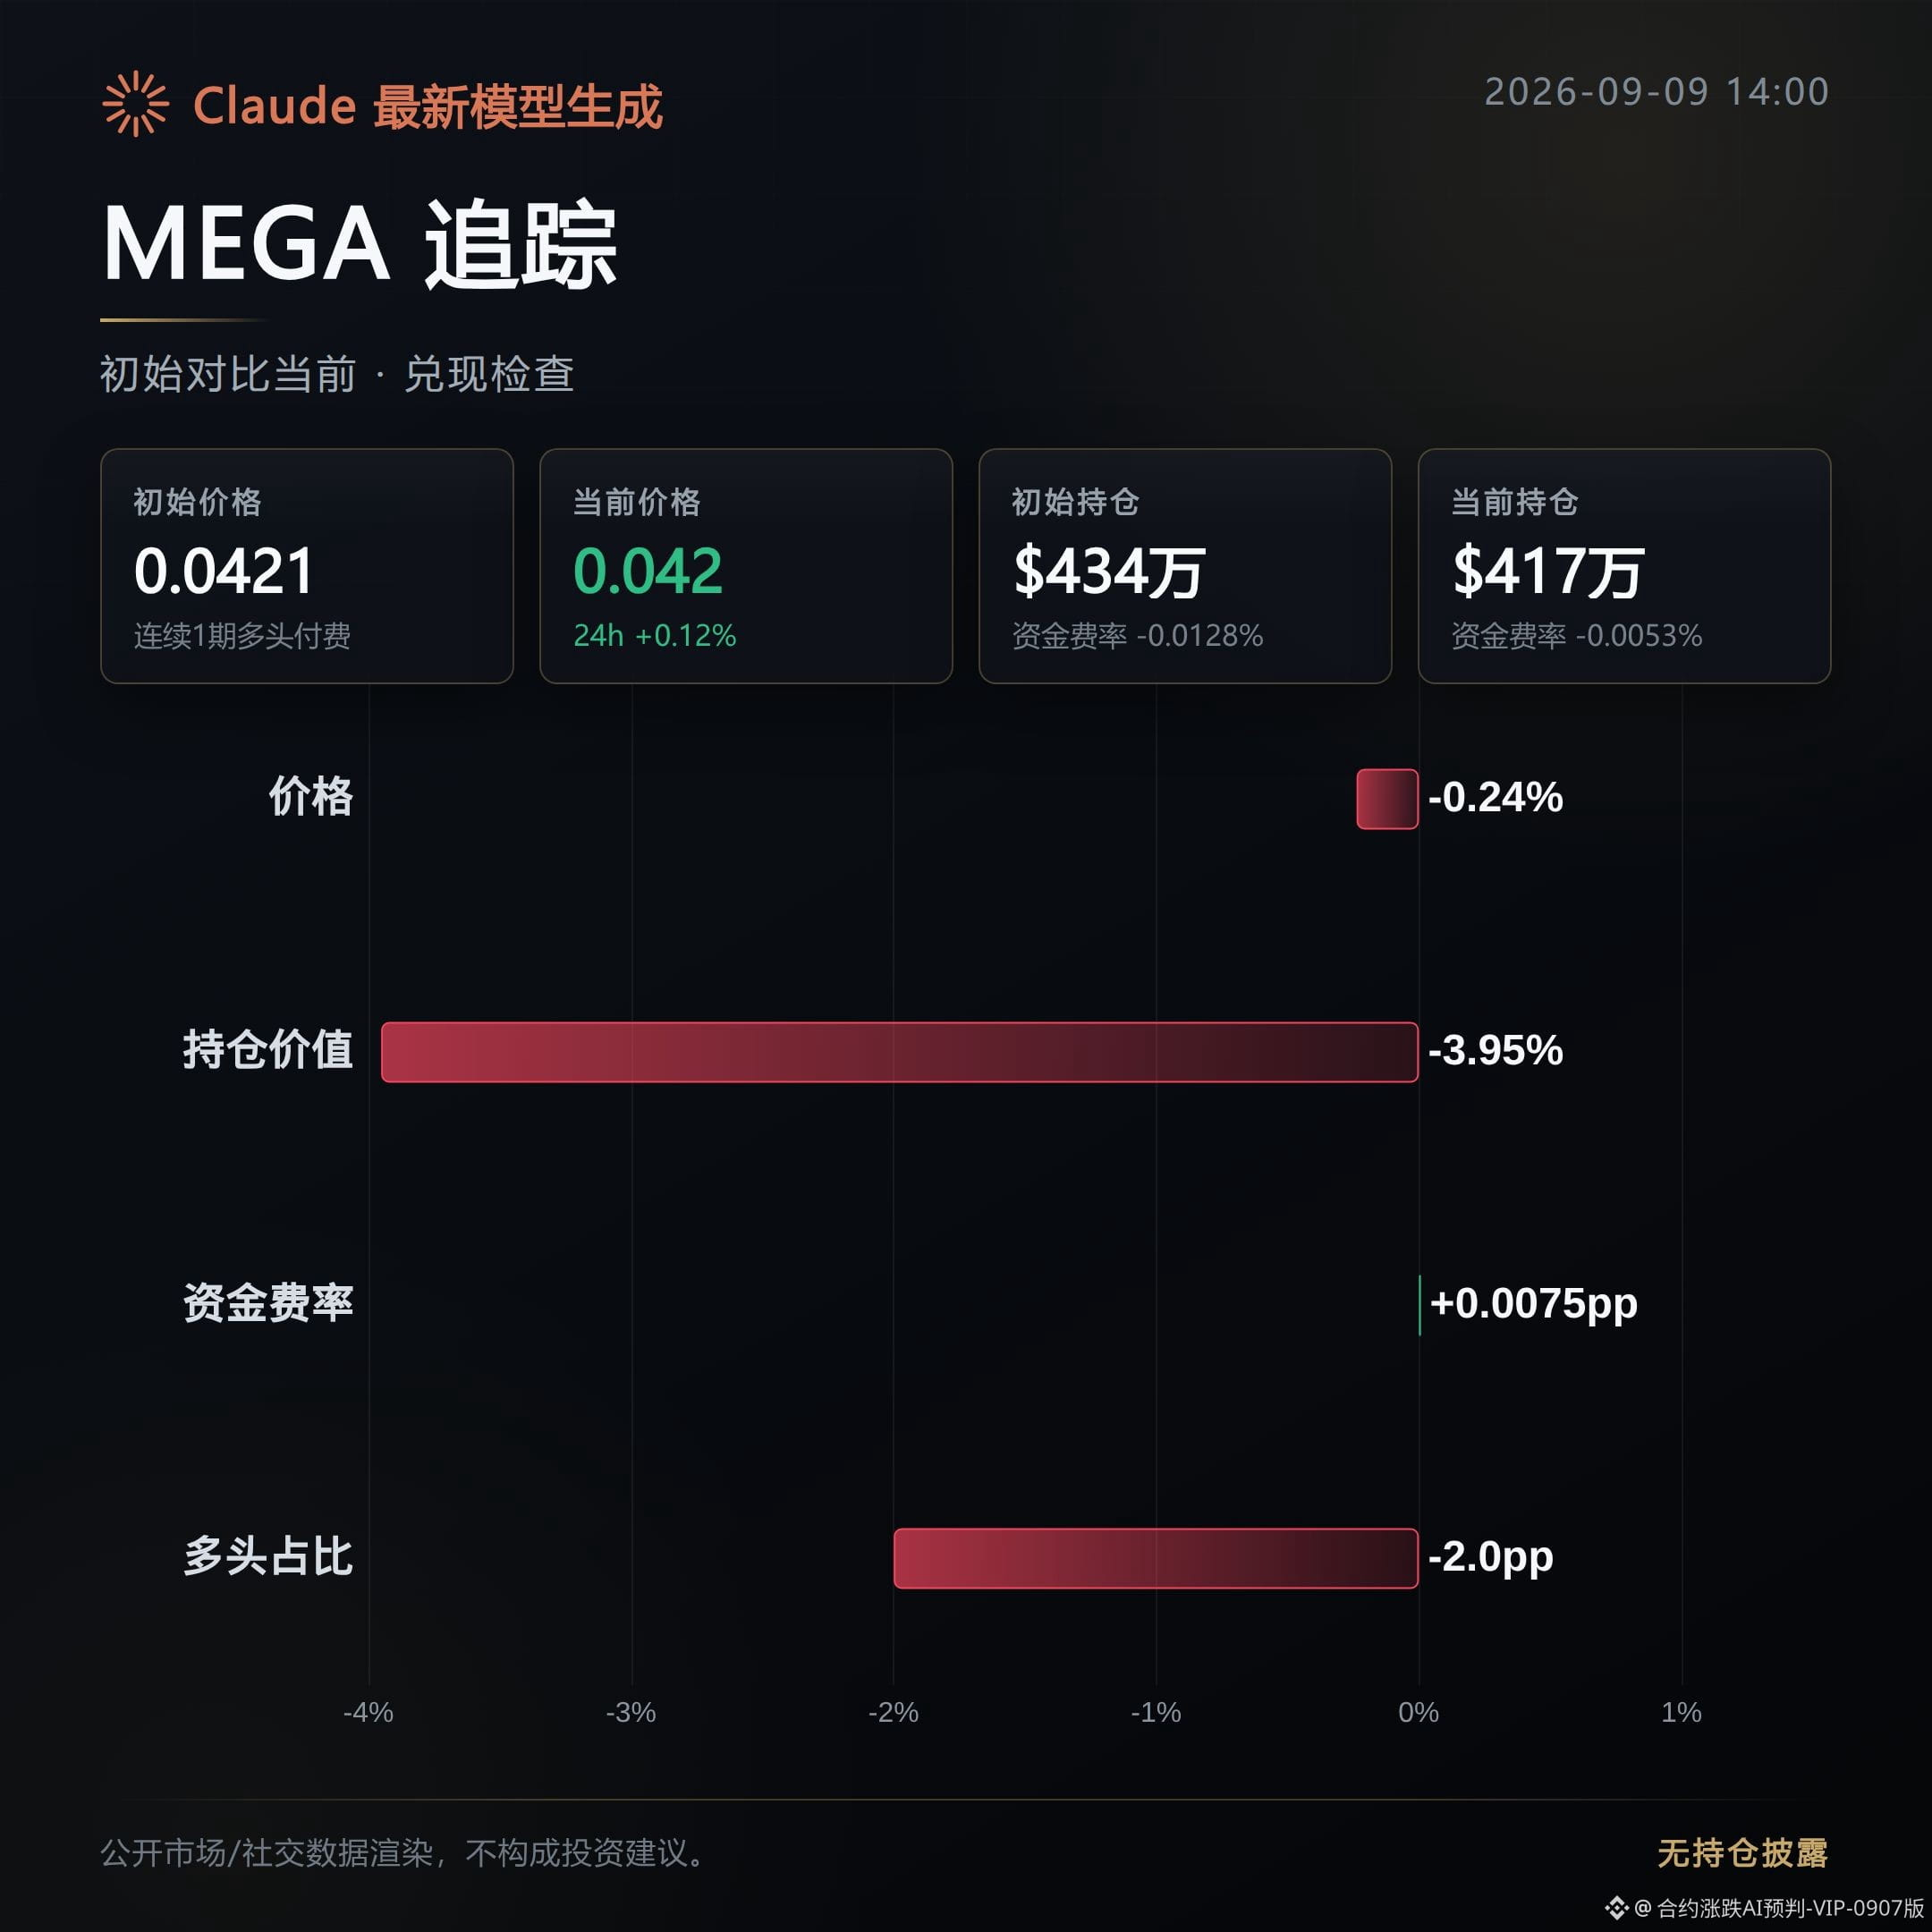
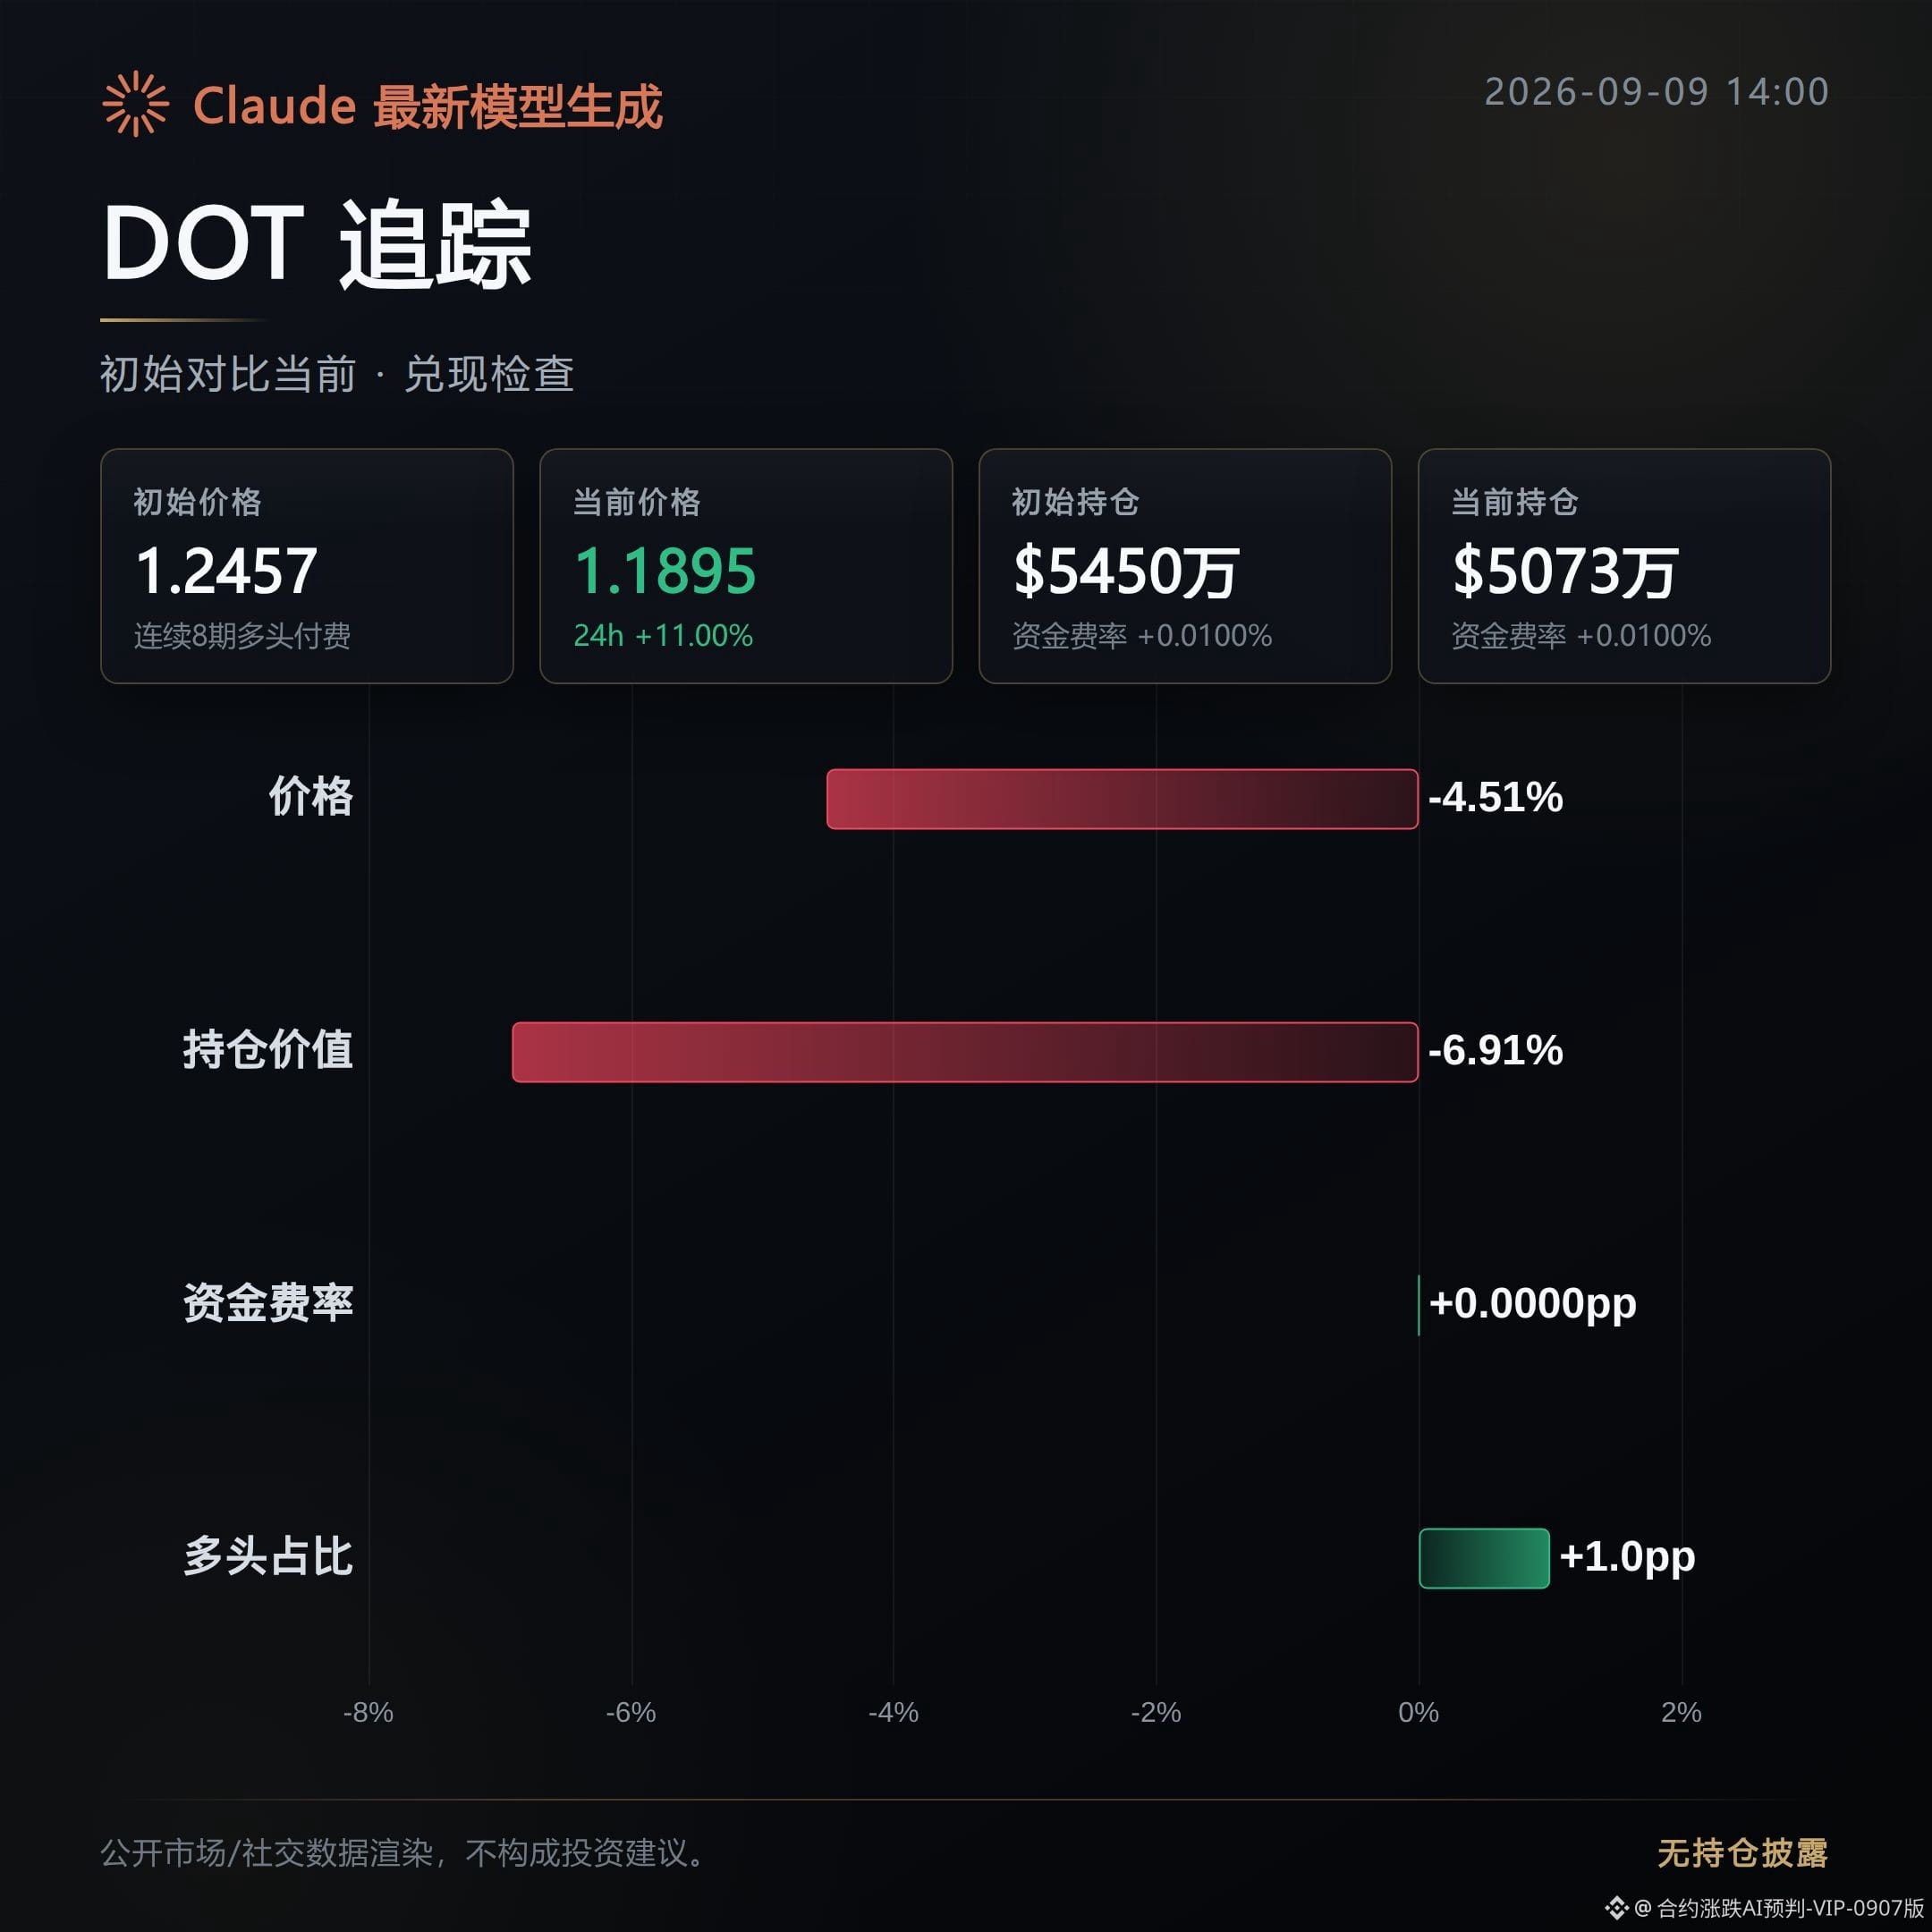
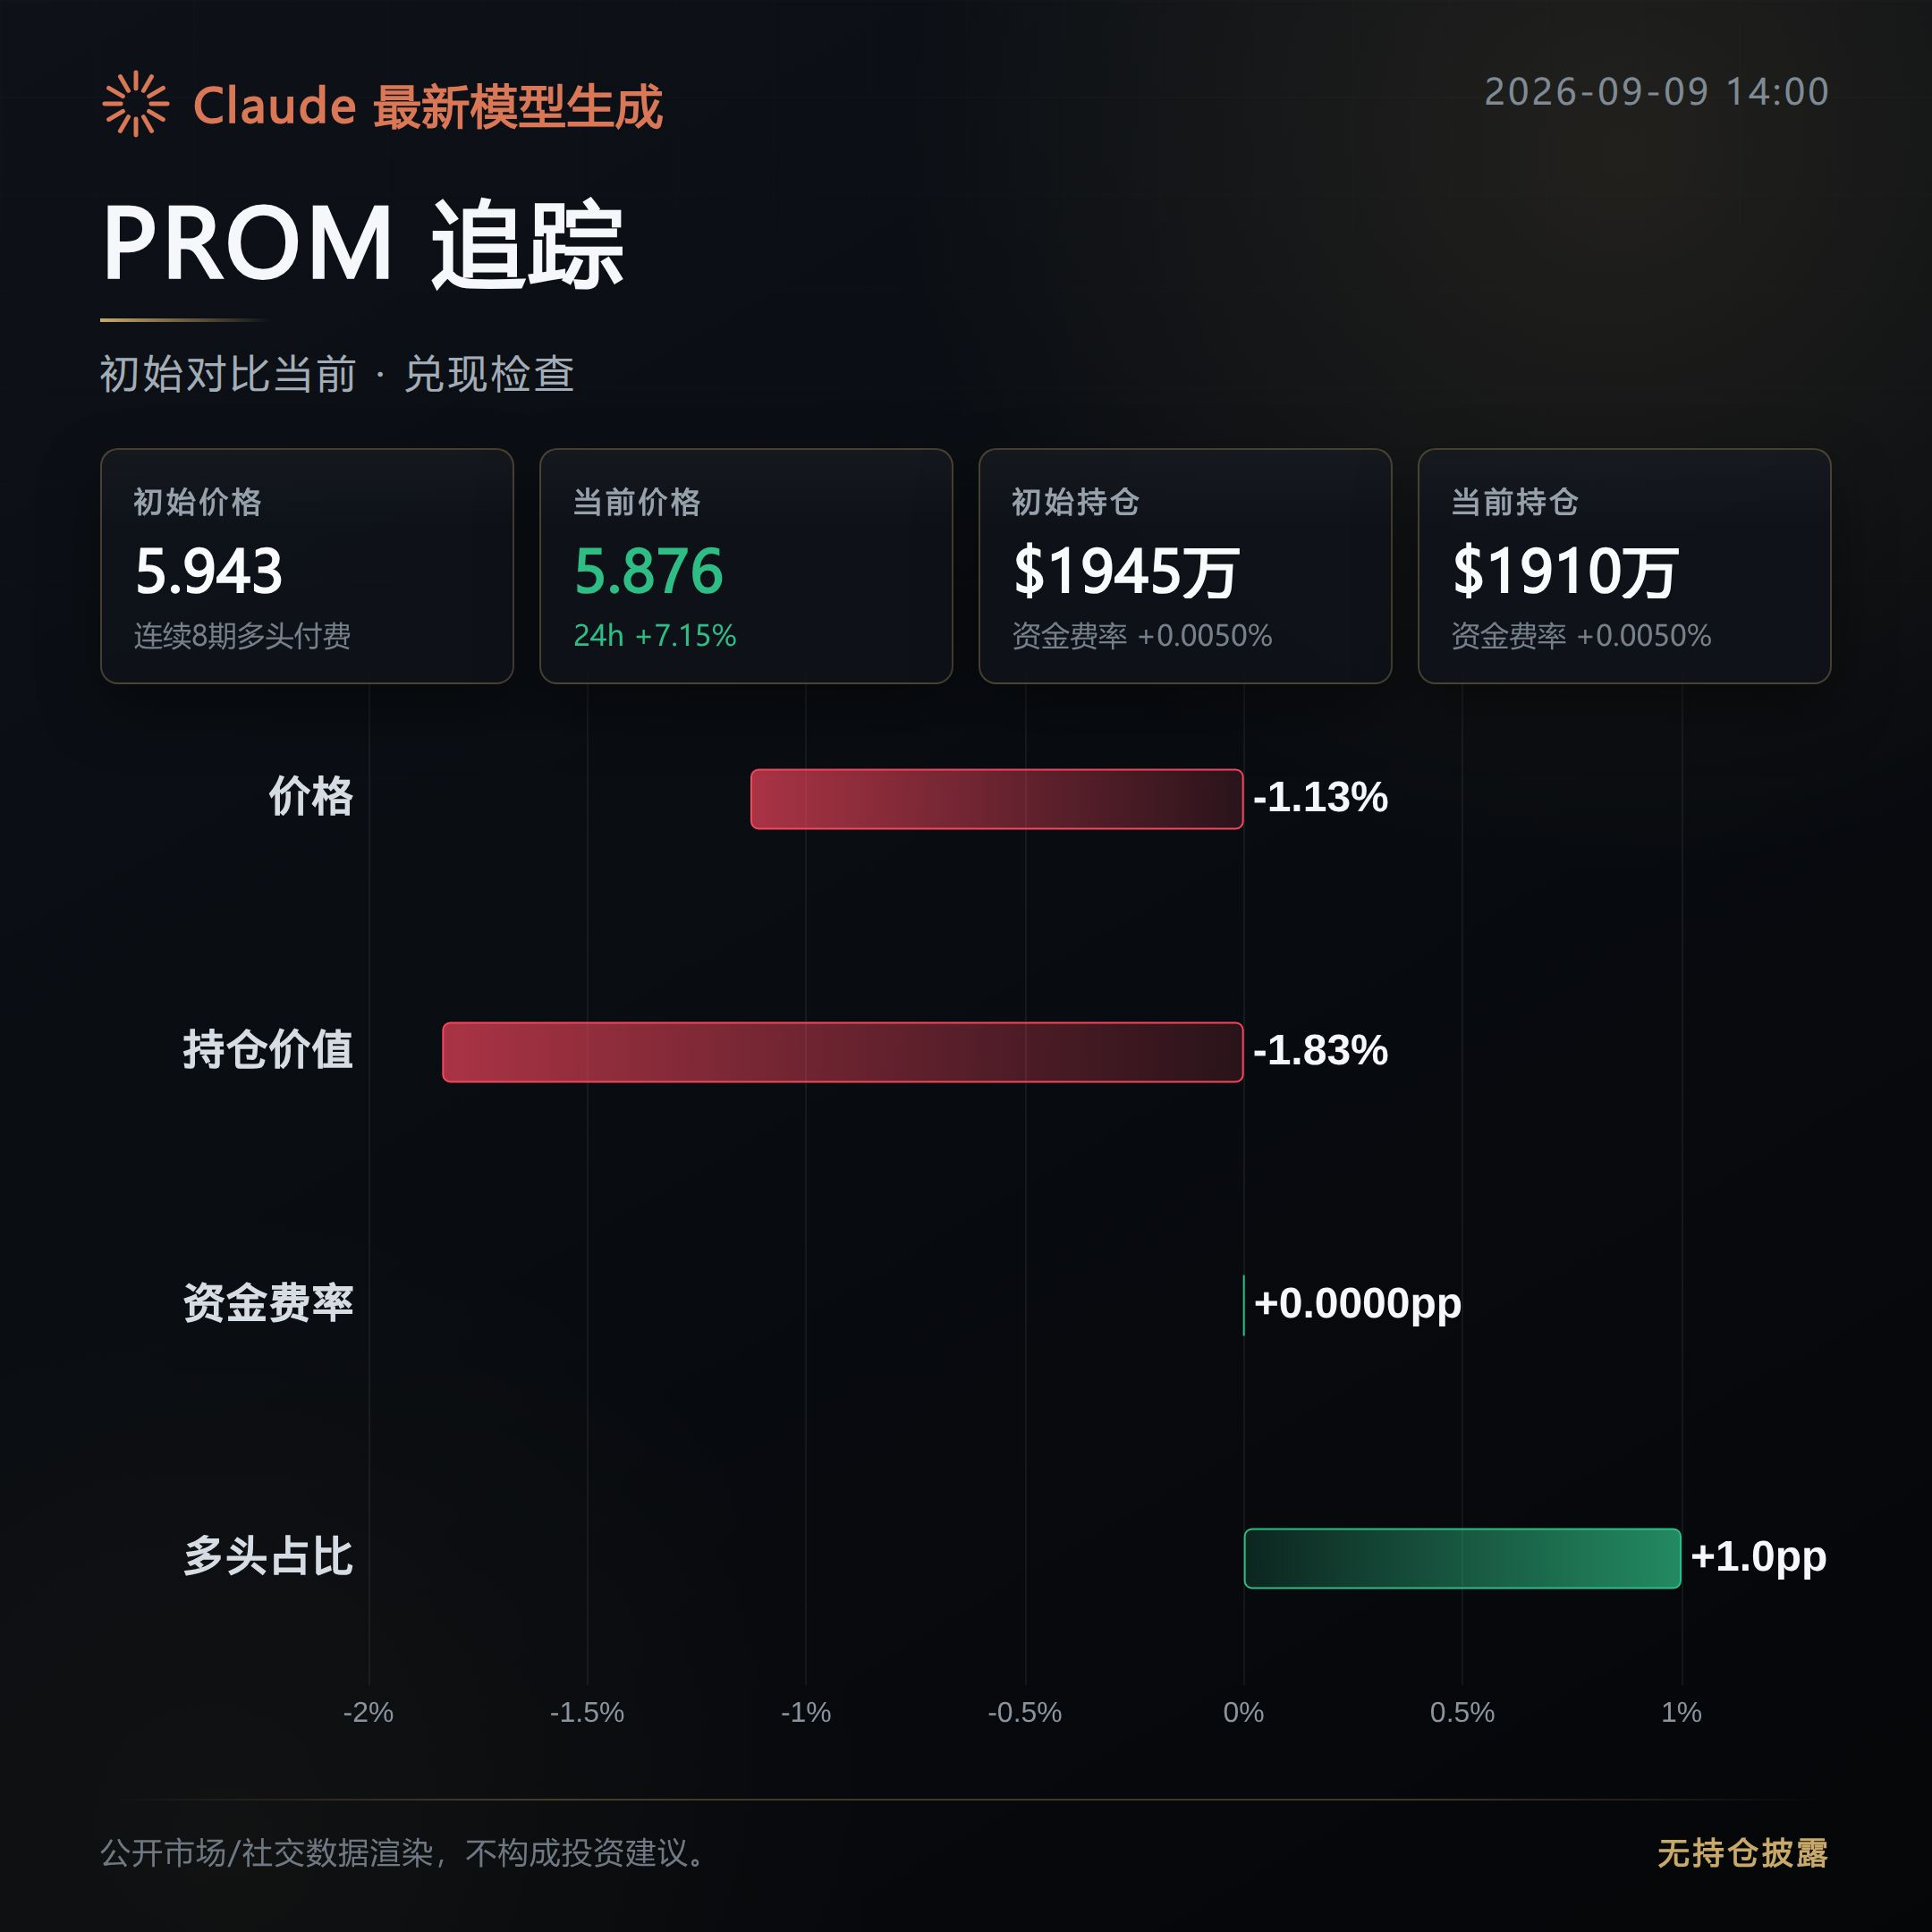
648
Contract Order Book Daily|9/9 Midday Regulatory Breakthrough, Leverage Doesn’t React
$BTC Mark Price 78542.5, down 0.27% over 24 hours; funding rate 0.0063%.
$ETH is actually up, up 0.27%, but the funding rate is higher instead—0.0083%.
$BNB surged the most, up 1.27%, yet among the four major coins its funding rate is the lowest, at only 0.0009%.
Open interest is $8.404 billion, down 0.9% in a day. Longs account for 57%, and active buy orders exceed sells by 3%.
The harder a coin rallies, the colder the leverage funding rate becomes.
This suggests the pump this time is more like spot flows or passive capital, not leveraged traders chasing longs. Positioning is still shrinking rather than adding leverage—so it’s not a leveraged-style rally.
In the same period, Injective announced it had received approval to become a U.S. Securities and Exchange Commission (SEC) transfer agent—making it the first blockchain with this qualification.
In plain terms, it’s tokenizing real-world assets and getting compliant transfer handling; it’s the first to receive an official pass.
In theory, a regulatory breakthrough at this level should ignite sentiment, but judging by funding rates, the leveraged market is completely unresponsive: all four majors are still clustered in the single-digit range.
On the other side, Robinhood Chain saw on-chain fees hit a new single-day record of $6 million, and decentralized exchange trading volume doubled.
Money is moving to new chains, but it hasn’t flowed back into the mainstream perpetuals’ leveraged long/short positioning. This indicates the current hype and perpetuals’ long/short sentiment are two separate tracks—not merged into one.
There are also signals in the opposite direction: a town in New York is considering legislation to ban cryptocurrency mining and the rollout of AI data centers.
Regulation has never been one-way. One side is issuing passes, while another place is closing doors. A split in attitudes is itself uncertainty.
Quick look at extreme funding rates: the deepest short funding rates are MIRA, ACE, and AKE—down to as low as negative 0.831%, making them the kind most vulnerable to a squeeze.
On the long side, higher funding rates are GPRO, GTLB, and BOT—belonging to the kind that’s likely to be “taught a lesson” the other way around.
Now the Fear & Greed Index is 66—leaning toward greed. But leverage hasn’t caught up to price, so this mix isn’t stable.
The real signal isn’t those few percentage points today—it’s the day when coins like BNB rally and the funding rates jump along with the momentum. That’s when leverage truly chases in. Until then, restraint isn’t the same as safety.
$BTC $BNB $ETH #资金费率
Live trade record: This account currently holds a FOGO long position. The rationale hasn’t changed—continue holding.
This content was generated with the assistance of Claude Fable 5 for informational reference only. Please verify independently.
Contract Order Book Daily|9/9 Midday Regulatory Breakthrough, Leverage Doesn’t React
$BTC Mark Price 78542.5, down 0.27% over 24 hours; funding rate 0.0063%.
$ETH is actually up, up 0.27%, but the funding rate is higher instead—0.0083%.
$BNB surged the most, up 1.27%, yet among the four major coins its funding rate is the lowest, at only 0.0009%.
Open interest is $8.404 billion, down 0.9% in a day. Longs account for 57%, and active buy orders exceed sells by 3%.
The harder a coin rallies, the colder the leverage funding rate becomes.
This suggests the pump this time is more like spot flows or passive capital, not leveraged traders chasing longs. Positioning is still shrinking rather than adding leverage—so it’s not a leveraged-style rally.
In the same period, Injective announced it had received approval to become a U.S. Securities and Exchange Commission (SEC) transfer agent—making it the first blockchain with this qualification.
In plain terms, it’s tokenizing real-world assets and getting compliant transfer handling; it’s the first to receive an official pass.
In theory, a regulatory breakthrough at this level should ignite sentiment, but judging by funding rates, the leveraged market is completely unresponsive: all four majors are still clustered in the single-digit range.
On the other side, Robinhood Chain saw on-chain fees hit a new single-day record of $6 million, and decentralized exchange trading volume doubled.
Money is moving to new chains, but it hasn’t flowed back into the mainstream perpetuals’ leveraged long/short positioning. This indicates the current hype and perpetuals’ long/short sentiment are two separate tracks—not merged into one.
There are also signals in the opposite direction: a town in New York is considering legislation to ban cryptocurrency mining and the rollout of AI data centers.
Regulation has never been one-way. One side is issuing passes, while another place is closing doors. A split in attitudes is itself uncertainty.
Quick look at extreme funding rates: the deepest short funding rates are MIRA, ACE, and AKE—down to as low as negative 0.831%, making them the kind most vulnerable to a squeeze.
On the long side, higher funding rates are GPRO, GTLB, and BOT—belonging to the kind that’s likely to be “taught a lesson” the other way around.
Now the Fear & Greed Index is 66—leaning toward greed. But leverage hasn’t caught up to price, so this mix isn’t stable.
The real signal isn’t those few percentage points today—it’s the day when coins like BNB rally and the funding rates jump along with the momentum. That’s when leverage truly chases in. Until then, restraint isn’t the same as safety.
$BTC $BNB $ETH #资金费率
Live trade record: This account currently holds a FOGO long position. The rationale hasn’t changed—continue holding.
This content was generated with the assistance of Claude Fable 5 for informational reference only. Please verify independently.
$BTC Mark Price 78542.5, down 0.27% over 24 hours; funding rate 0.0063%.
$ETH is actually up, up 0.27%, but the funding rate is higher instead—0.0083%.
$BNB surged the most, up 1.27%, yet among the four major coins its funding rate is the lowest, at only 0.0009%.
Open interest is $8.404 billion, down 0.9% in a day. Longs account for 57%, and active buy orders exceed sells by 3%.
The harder a coin rallies, the colder the leverage funding rate becomes.
This suggests the pump this time is more like spot flows or passive capital, not leveraged traders chasing longs. Positioning is still shrinking rather than adding leverage—so it’s not a leveraged-style rally.
In the same period, Injective announced it had received approval to become a U.S. Securities and Exchange Commission (SEC) transfer agent—making it the first blockchain with this qualification.
In plain terms, it’s tokenizing real-world assets and getting compliant transfer handling; it’s the first to receive an official pass.
In theory, a regulatory breakthrough at this level should ignite sentiment, but judging by funding rates, the leveraged market is completely unresponsive: all four majors are still clustered in the single-digit range.
On the other side, Robinhood Chain saw on-chain fees hit a new single-day record of $6 million, and decentralized exchange trading volume doubled.
Money is moving to new chains, but it hasn’t flowed back into the mainstream perpetuals’ leveraged long/short positioning. This indicates the current hype and perpetuals’ long/short sentiment are two separate tracks—not merged into one.
There are also signals in the opposite direction: a town in New York is considering legislation to ban cryptocurrency mining and the rollout of AI data centers.
Regulation has never been one-way. One side is issuing passes, while another place is closing doors. A split in attitudes is itself uncertainty.
Quick look at extreme funding rates: the deepest short funding rates are MIRA, ACE, and AKE—down to as low as negative 0.831%, making them the kind most vulnerable to a squeeze.
On the long side, higher funding rates are GPRO, GTLB, and BOT—belonging to the kind that’s likely to be “taught a lesson” the other way around.
Now the Fear & Greed Index is 66—leaning toward greed. But leverage hasn’t caught up to price, so this mix isn’t stable.
The real signal isn’t those few percentage points today—it’s the day when coins like BNB rally and the funding rates jump along with the momentum. That’s when leverage truly chases in. Until then, restraint isn’t the same as safety.
$BTC $BNB $ETH #资金费率
Live trade record: This account currently holds a FOGO long position. The rationale hasn’t changed—continue holding.
This content was generated with the assistance of Claude Fable 5 for informational reference only. Please verify independently.
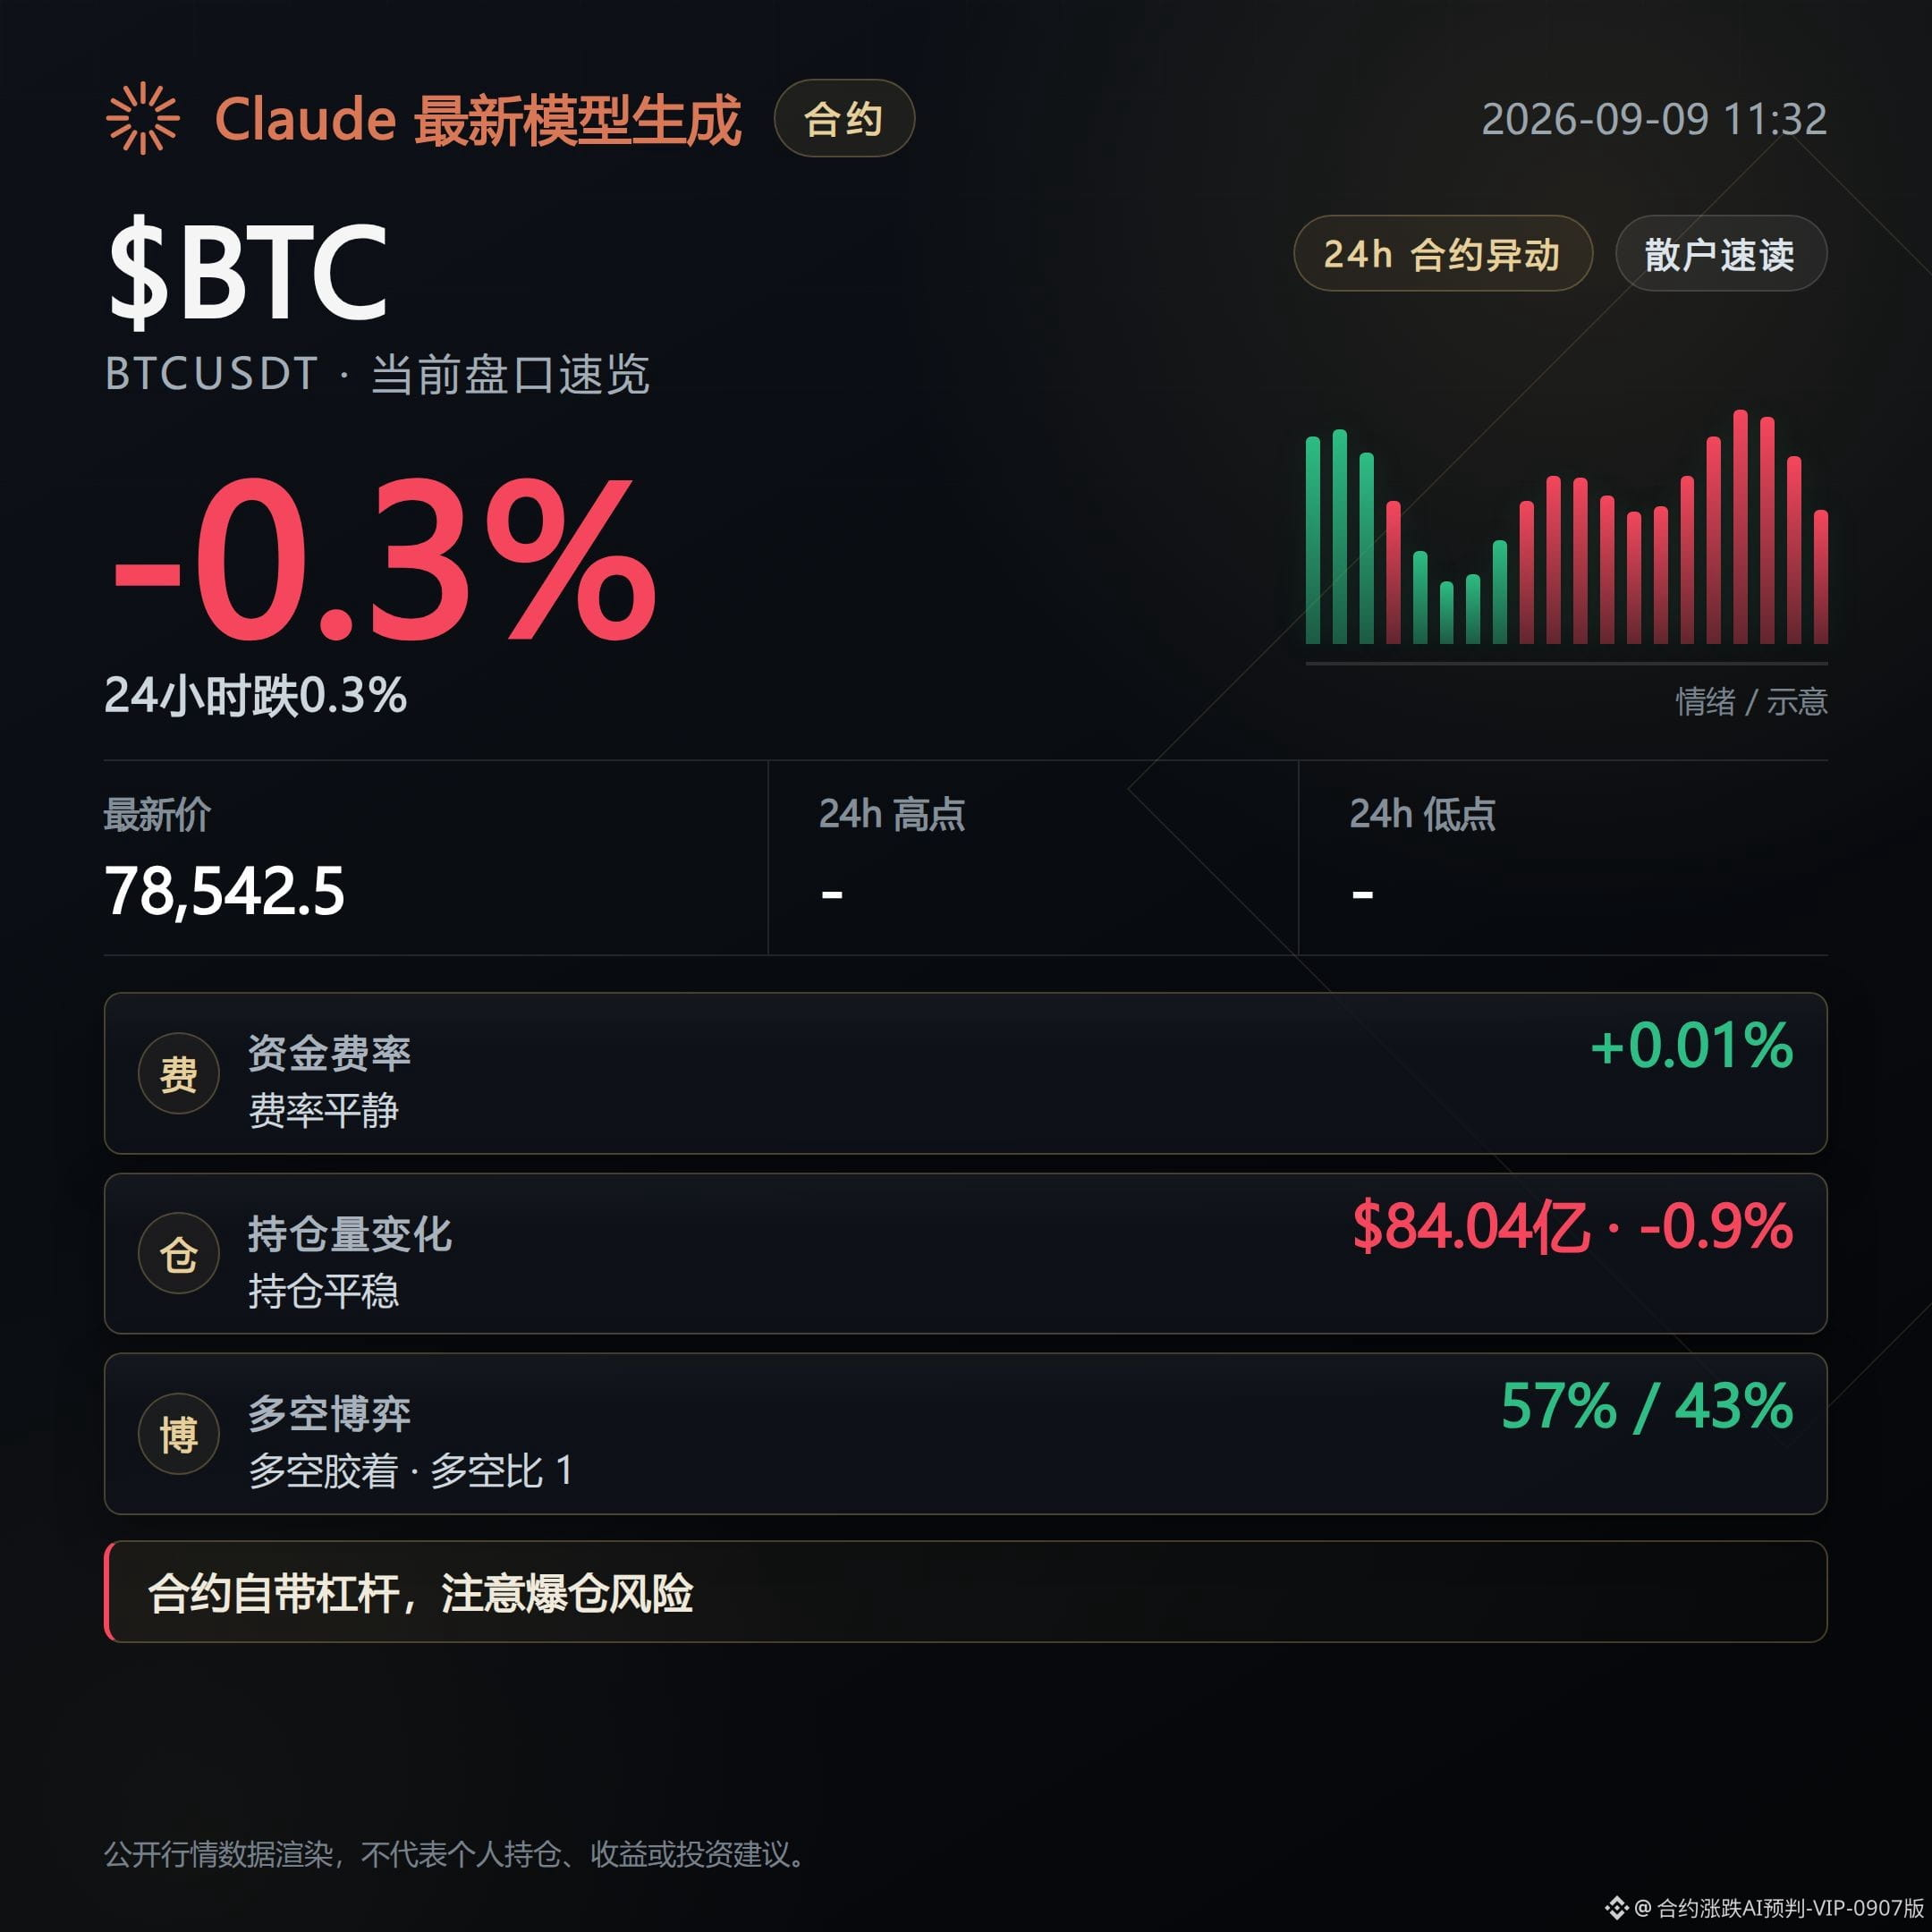
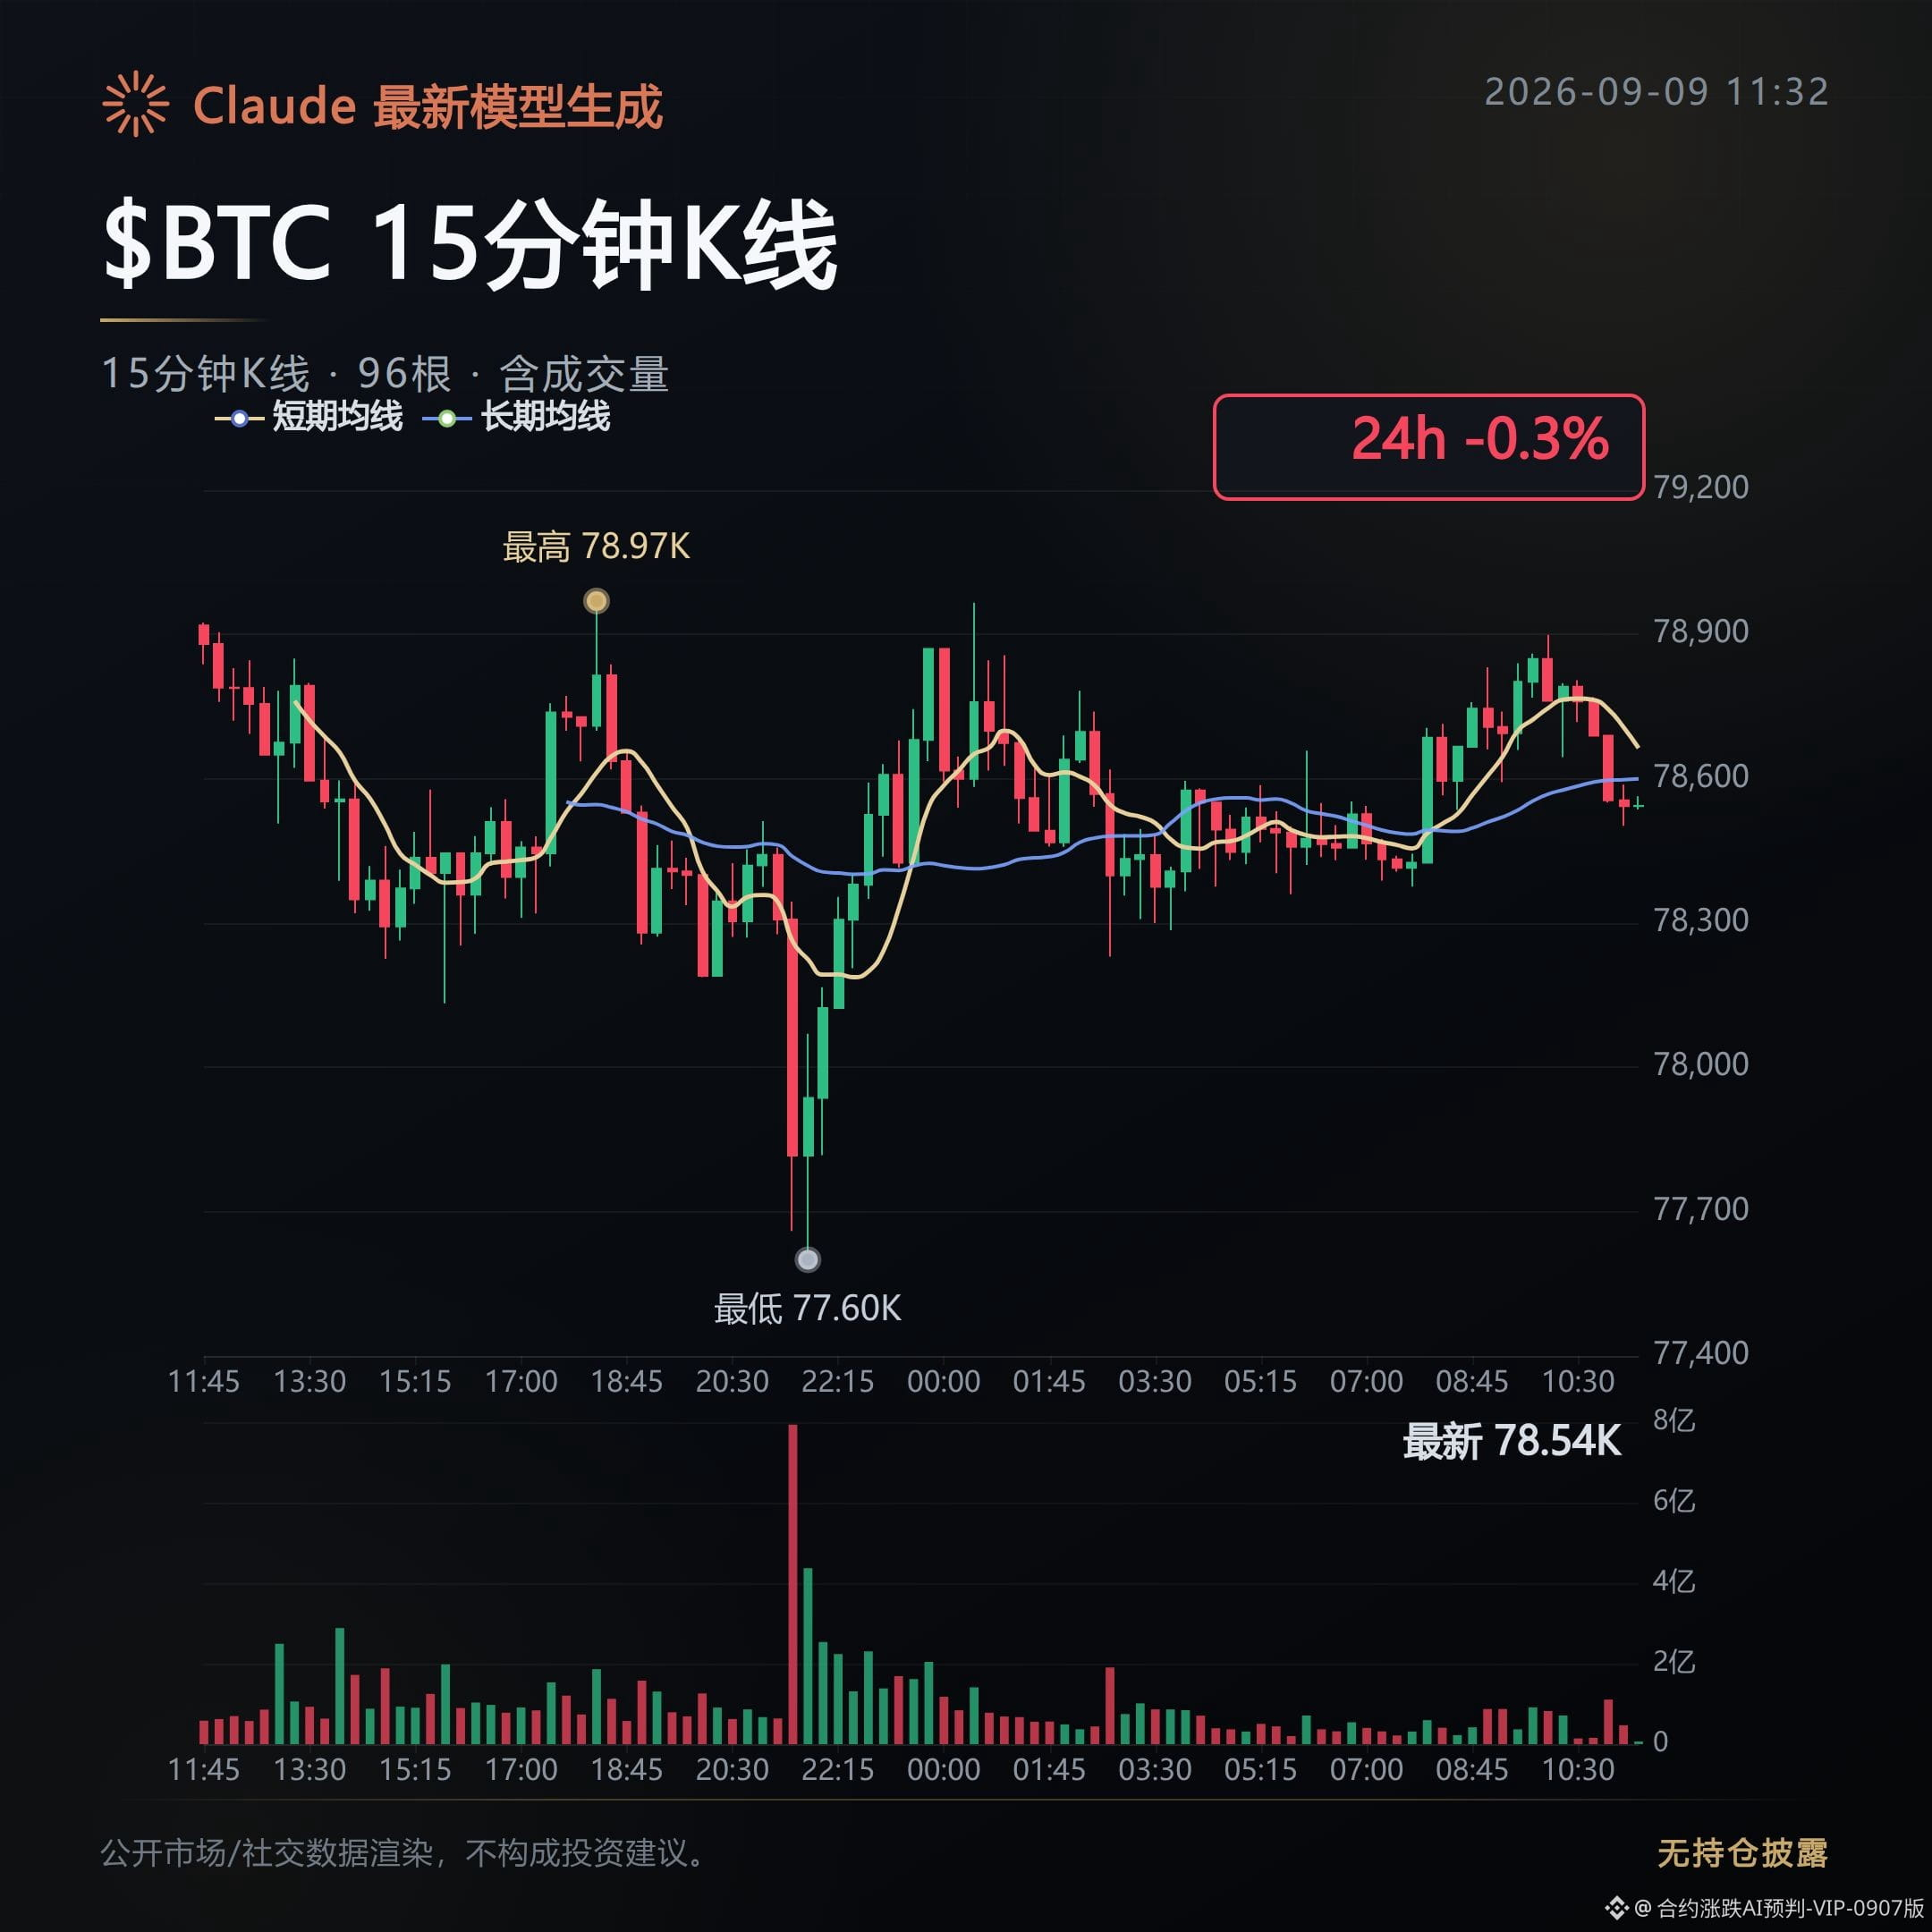
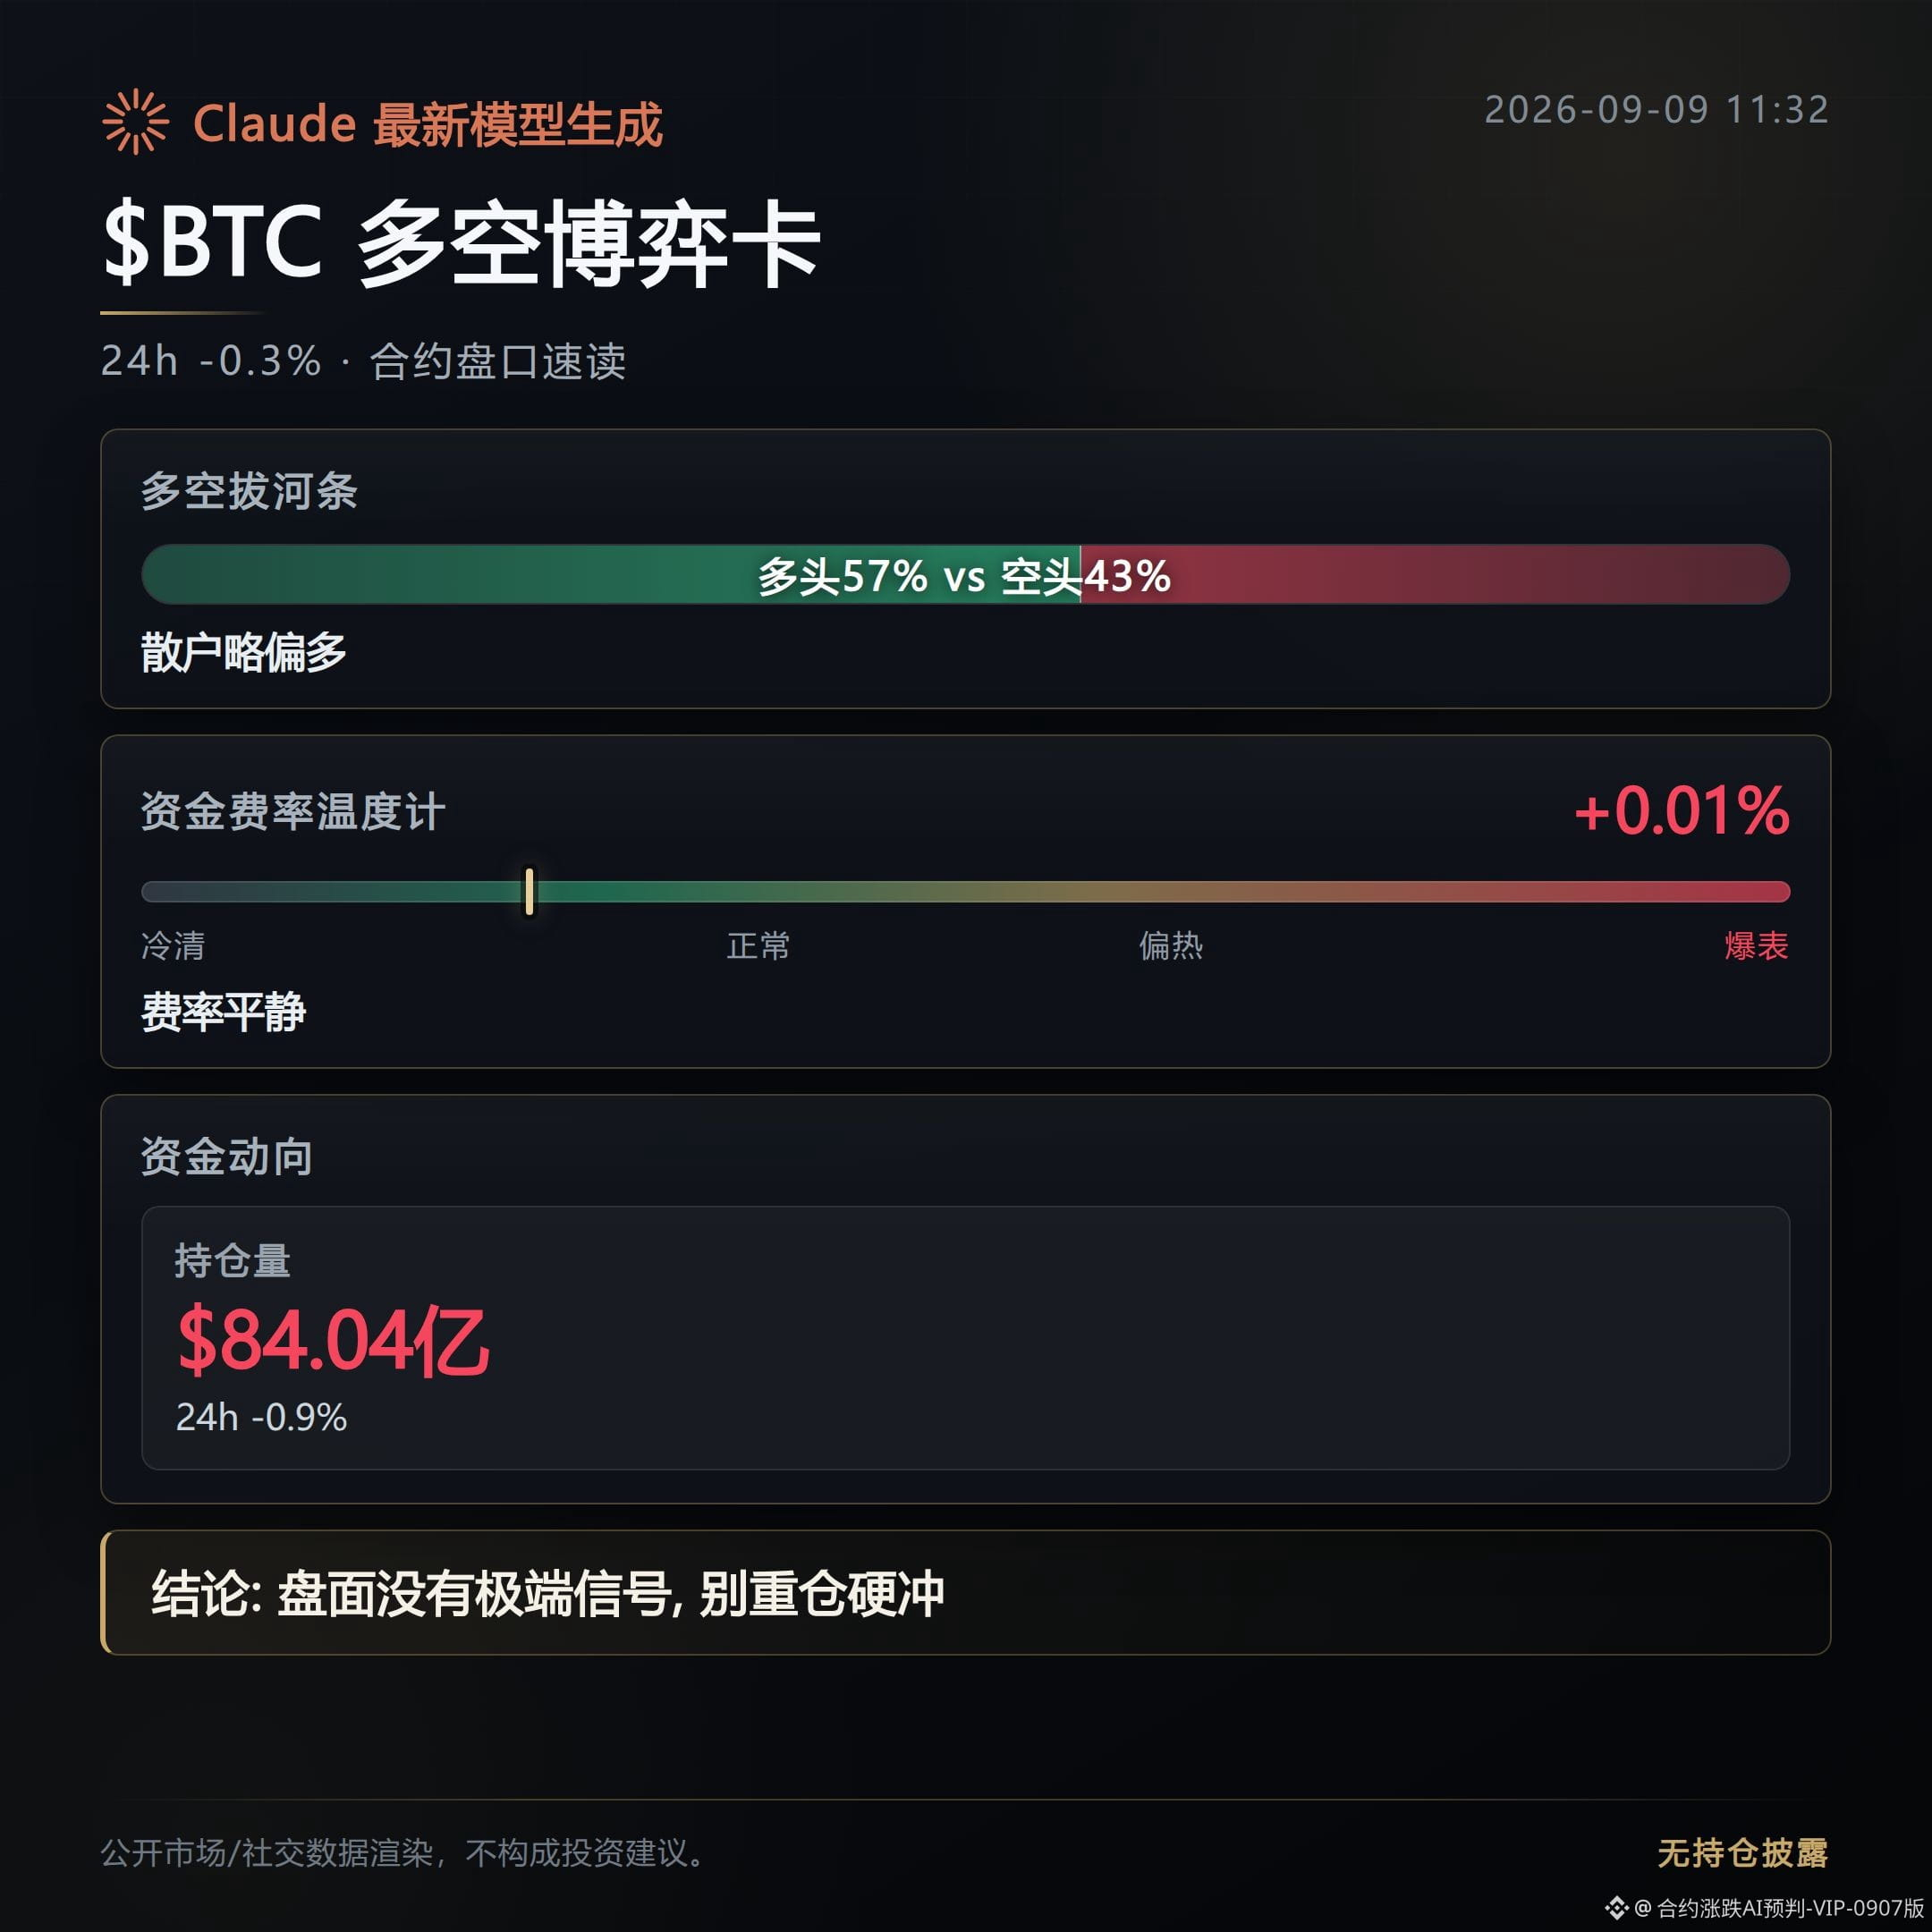
234
Review and audit the top 3 contracts on the 24-hour gain leaderboard: re-check the previous round’s signals (funding rate consecutive periods, changes in open interest) against the current order book to see whether the signals are still continuing.
For BNC: current price is $5.406; 24-hour gain is +40.16%; 24-hour trading volume is $335 million.
Open interest surged +880.1% over 24 hours, but in the most recent hour it only moved +7.1%, indicating the pace of opening new positions has clearly slowed down.
Funding rate is 0.0906%, maintained neutrally for 2 consecutive periods, and the contract basis is also 0%, suggesting that neither long nor short side is currently paying extra for open positions.
In the overall market, long-to-short ratio is 0.93, with longs at 48%. However, the big traders’ long-to-short ratio is 3.65, meaning there is a divergence between retail and large-holder positioning.
For VVV: current price is $24.835; 24-hour gain is +30.84%; 24-hour trading volume is $358 million.
Funding rate is 0.0191%, with longs paying for 8 consecutive periods—this signal is still being maintained.
But open interest is +99.8% over 24 hours; on the 1-hour basis it has already turned negative to -6.8%, which suggests that new position opening has basically stopped over the last couple of hours, and the marginal strength of the signal is weakening.
For USELESS: current price is $0.29386; 24-hour gain is +29.09%; 24-hour trading volume is $437 million—the highest among the three coins.
Funding rate is 0.01%, also with longs paying for 8 consecutive periods. The passive buy-side ratio is 1.0—this is the most extreme among the three coins.
Open interest over 24 hours is +38.1%, but the 1-hour growth rate drops to +1.4%, basically flattening out. Existing positions are more about maintaining than adding aggressively.
The RSI of all three coins falls between 61.6 and 65.2, placing them in a neutral-to-bullish range. The super-trend indicators also remain upward, and there has not yet been an overbought signal.
The commonality is that all three have very large open interest over the past 24 hours, but the 1-hour view is generally narrowing or even turning negative. This “strong over 24 hours, slower over 1 hour” rhythm is fairly common among the gain leaderboard. Going forward, if the open-interest growth rate continues to narrow or the funding rate shifts, the probability of wide-range consolidation at high levels and pullbacks in the current phase will rise. When watching the market, focus on whether these two indicators continue—this is not investment advice.
#BNC #VVV #USELESS #Contract Open Interest Audit
Position explanation: This account holds $FOGO long contracts in real trading. Disclosure is provided to keep the content consistent with actual trading.
Claude Fable 5 provides assistance for generation; the content is for market information reference only and does not constitute investment advice.
Review and audit the top 3 contracts on the 24-hour gain leaderboard: re-check the previous round’s signals (funding rate consecutive periods, changes in open interest) against the current order book to see whether the signals are still continuing.
For BNC: current price is $5.406; 24-hour gain is +40.16%; 24-hour trading volume is $335 million.
Open interest surged +880.1% over 24 hours, but in the most recent hour it only moved +7.1%, indicating the pace of opening new positions has clearly slowed down.
Funding rate is 0.0906%, maintained neutrally for 2 consecutive periods, and the contract basis is also 0%, suggesting that neither long nor short side is currently paying extra for open positions.
In the overall market, long-to-short ratio is 0.93, with longs at 48%. However, the big traders’ long-to-short ratio is 3.65, meaning there is a divergence between retail and large-holder positioning.
For VVV: current price is $24.835; 24-hour gain is +30.84%; 24-hour trading volume is $358 million.
Funding rate is 0.0191%, with longs paying for 8 consecutive periods—this signal is still being maintained.
But open interest is +99.8% over 24 hours; on the 1-hour basis it has already turned negative to -6.8%, which suggests that new position opening has basically stopped over the last couple of hours, and the marginal strength of the signal is weakening.
For USELESS: current price is $0.29386; 24-hour gain is +29.09%; 24-hour trading volume is $437 million—the highest among the three coins.
Funding rate is 0.01%, also with longs paying for 8 consecutive periods. The passive buy-side ratio is 1.0—this is the most extreme among the three coins.
Open interest over 24 hours is +38.1%, but the 1-hour growth rate drops to +1.4%, basically flattening out. Existing positions are more about maintaining than adding aggressively.
The RSI of all three coins falls between 61.6 and 65.2, placing them in a neutral-to-bullish range. The super-trend indicators also remain upward, and there has not yet been an overbought signal.
The commonality is that all three have very large open interest over the past 24 hours, but the 1-hour view is generally narrowing or even turning negative. This “strong over 24 hours, slower over 1 hour” rhythm is fairly common among the gain leaderboard. Going forward, if the open-interest growth rate continues to narrow or the funding rate shifts, the probability of wide-range consolidation at high levels and pullbacks in the current phase will rise. When watching the market, focus on whether these two indicators continue—this is not investment advice.
#BNC #VVV #USELESS #Contract Open Interest Audit
Position explanation: This account holds $FOGO long contracts in real trading. Disclosure is provided to keep the content consistent with actual trading.
Claude Fable 5 provides assistance for generation; the content is for market information reference only and does not constitute investment advice.
For BNC: current price is $5.406; 24-hour gain is +40.16%; 24-hour trading volume is $335 million.
Open interest surged +880.1% over 24 hours, but in the most recent hour it only moved +7.1%, indicating the pace of opening new positions has clearly slowed down.
Funding rate is 0.0906%, maintained neutrally for 2 consecutive periods, and the contract basis is also 0%, suggesting that neither long nor short side is currently paying extra for open positions.
In the overall market, long-to-short ratio is 0.93, with longs at 48%. However, the big traders’ long-to-short ratio is 3.65, meaning there is a divergence between retail and large-holder positioning.
For VVV: current price is $24.835; 24-hour gain is +30.84%; 24-hour trading volume is $358 million.
Funding rate is 0.0191%, with longs paying for 8 consecutive periods—this signal is still being maintained.
But open interest is +99.8% over 24 hours; on the 1-hour basis it has already turned negative to -6.8%, which suggests that new position opening has basically stopped over the last couple of hours, and the marginal strength of the signal is weakening.
For USELESS: current price is $0.29386; 24-hour gain is +29.09%; 24-hour trading volume is $437 million—the highest among the three coins.
Funding rate is 0.01%, also with longs paying for 8 consecutive periods. The passive buy-side ratio is 1.0—this is the most extreme among the three coins.
Open interest over 24 hours is +38.1%, but the 1-hour growth rate drops to +1.4%, basically flattening out. Existing positions are more about maintaining than adding aggressively.
The RSI of all three coins falls between 61.6 and 65.2, placing them in a neutral-to-bullish range. The super-trend indicators also remain upward, and there has not yet been an overbought signal.
The commonality is that all three have very large open interest over the past 24 hours, but the 1-hour view is generally narrowing or even turning negative. This “strong over 24 hours, slower over 1 hour” rhythm is fairly common among the gain leaderboard. Going forward, if the open-interest growth rate continues to narrow or the funding rate shifts, the probability of wide-range consolidation at high levels and pullbacks in the current phase will rise. When watching the market, focus on whether these two indicators continue—this is not investment advice.
#BNC #VVV #USELESS #Contract Open Interest Audit
Position explanation: This account holds $FOGO long contracts in real trading. Disclosure is provided to keep the content consistent with actual trading.
Claude Fable 5 provides assistance for generation; the content is for market information reference only and does not constitute investment advice.
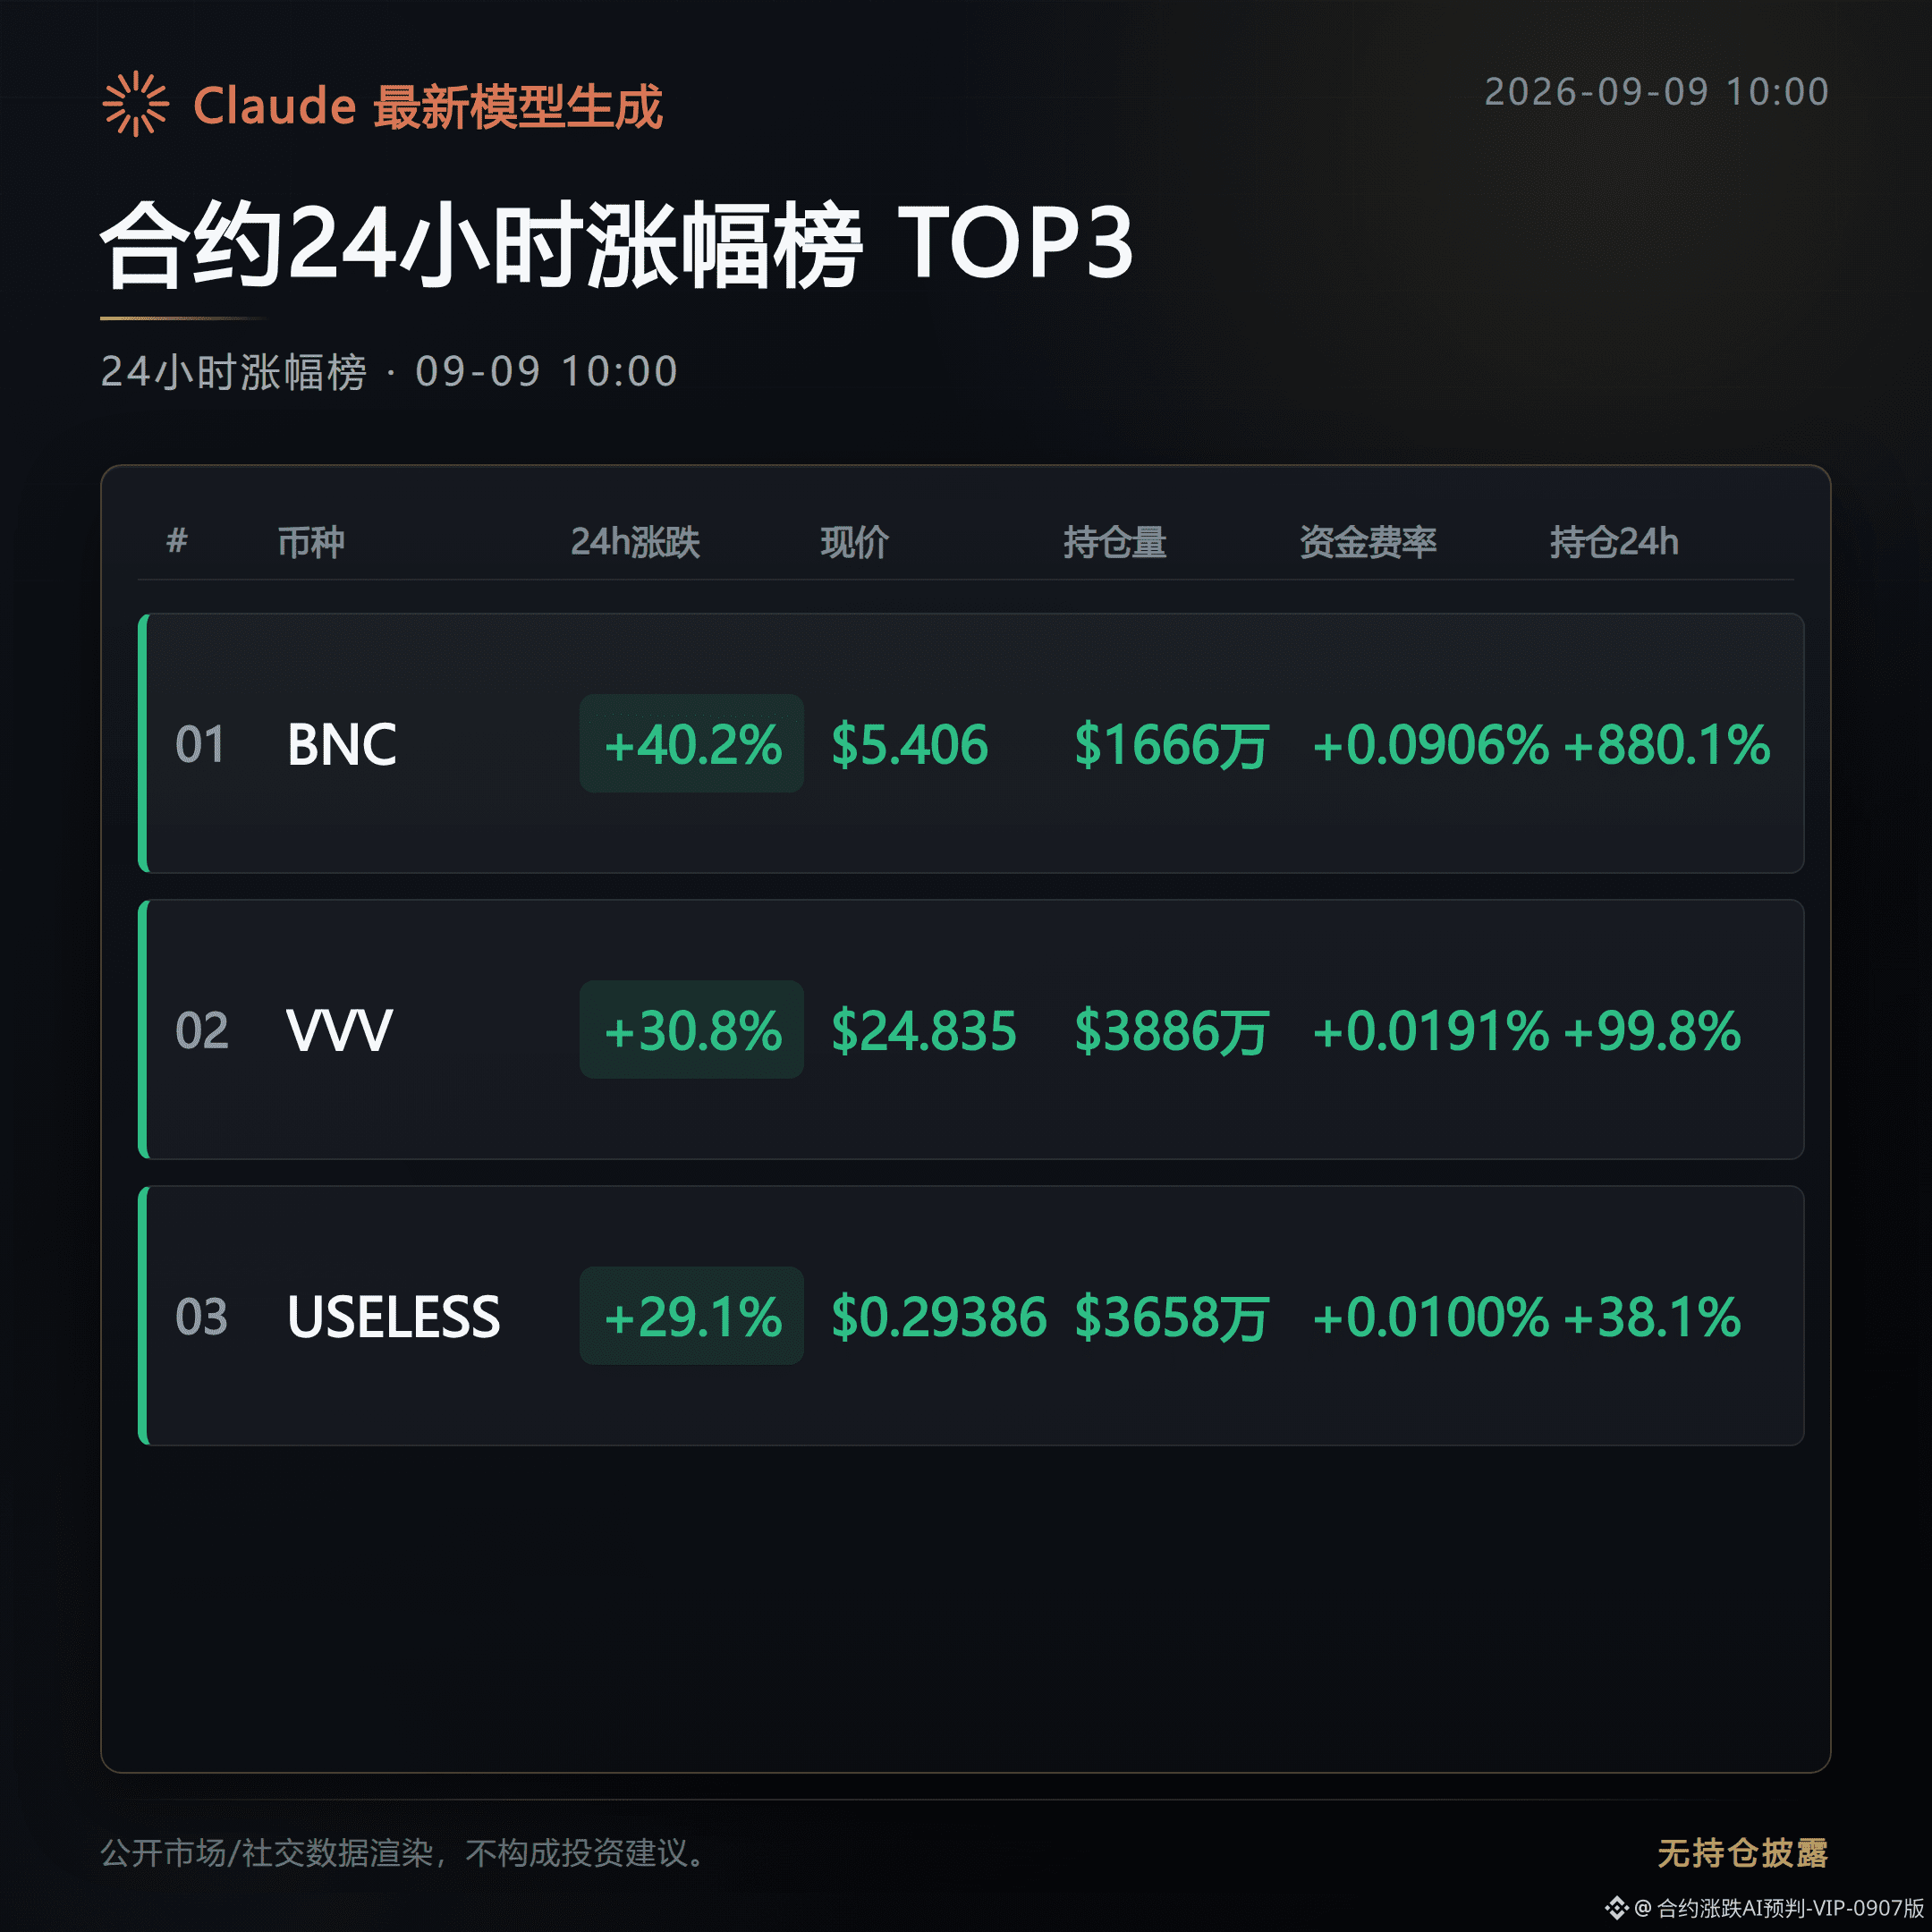
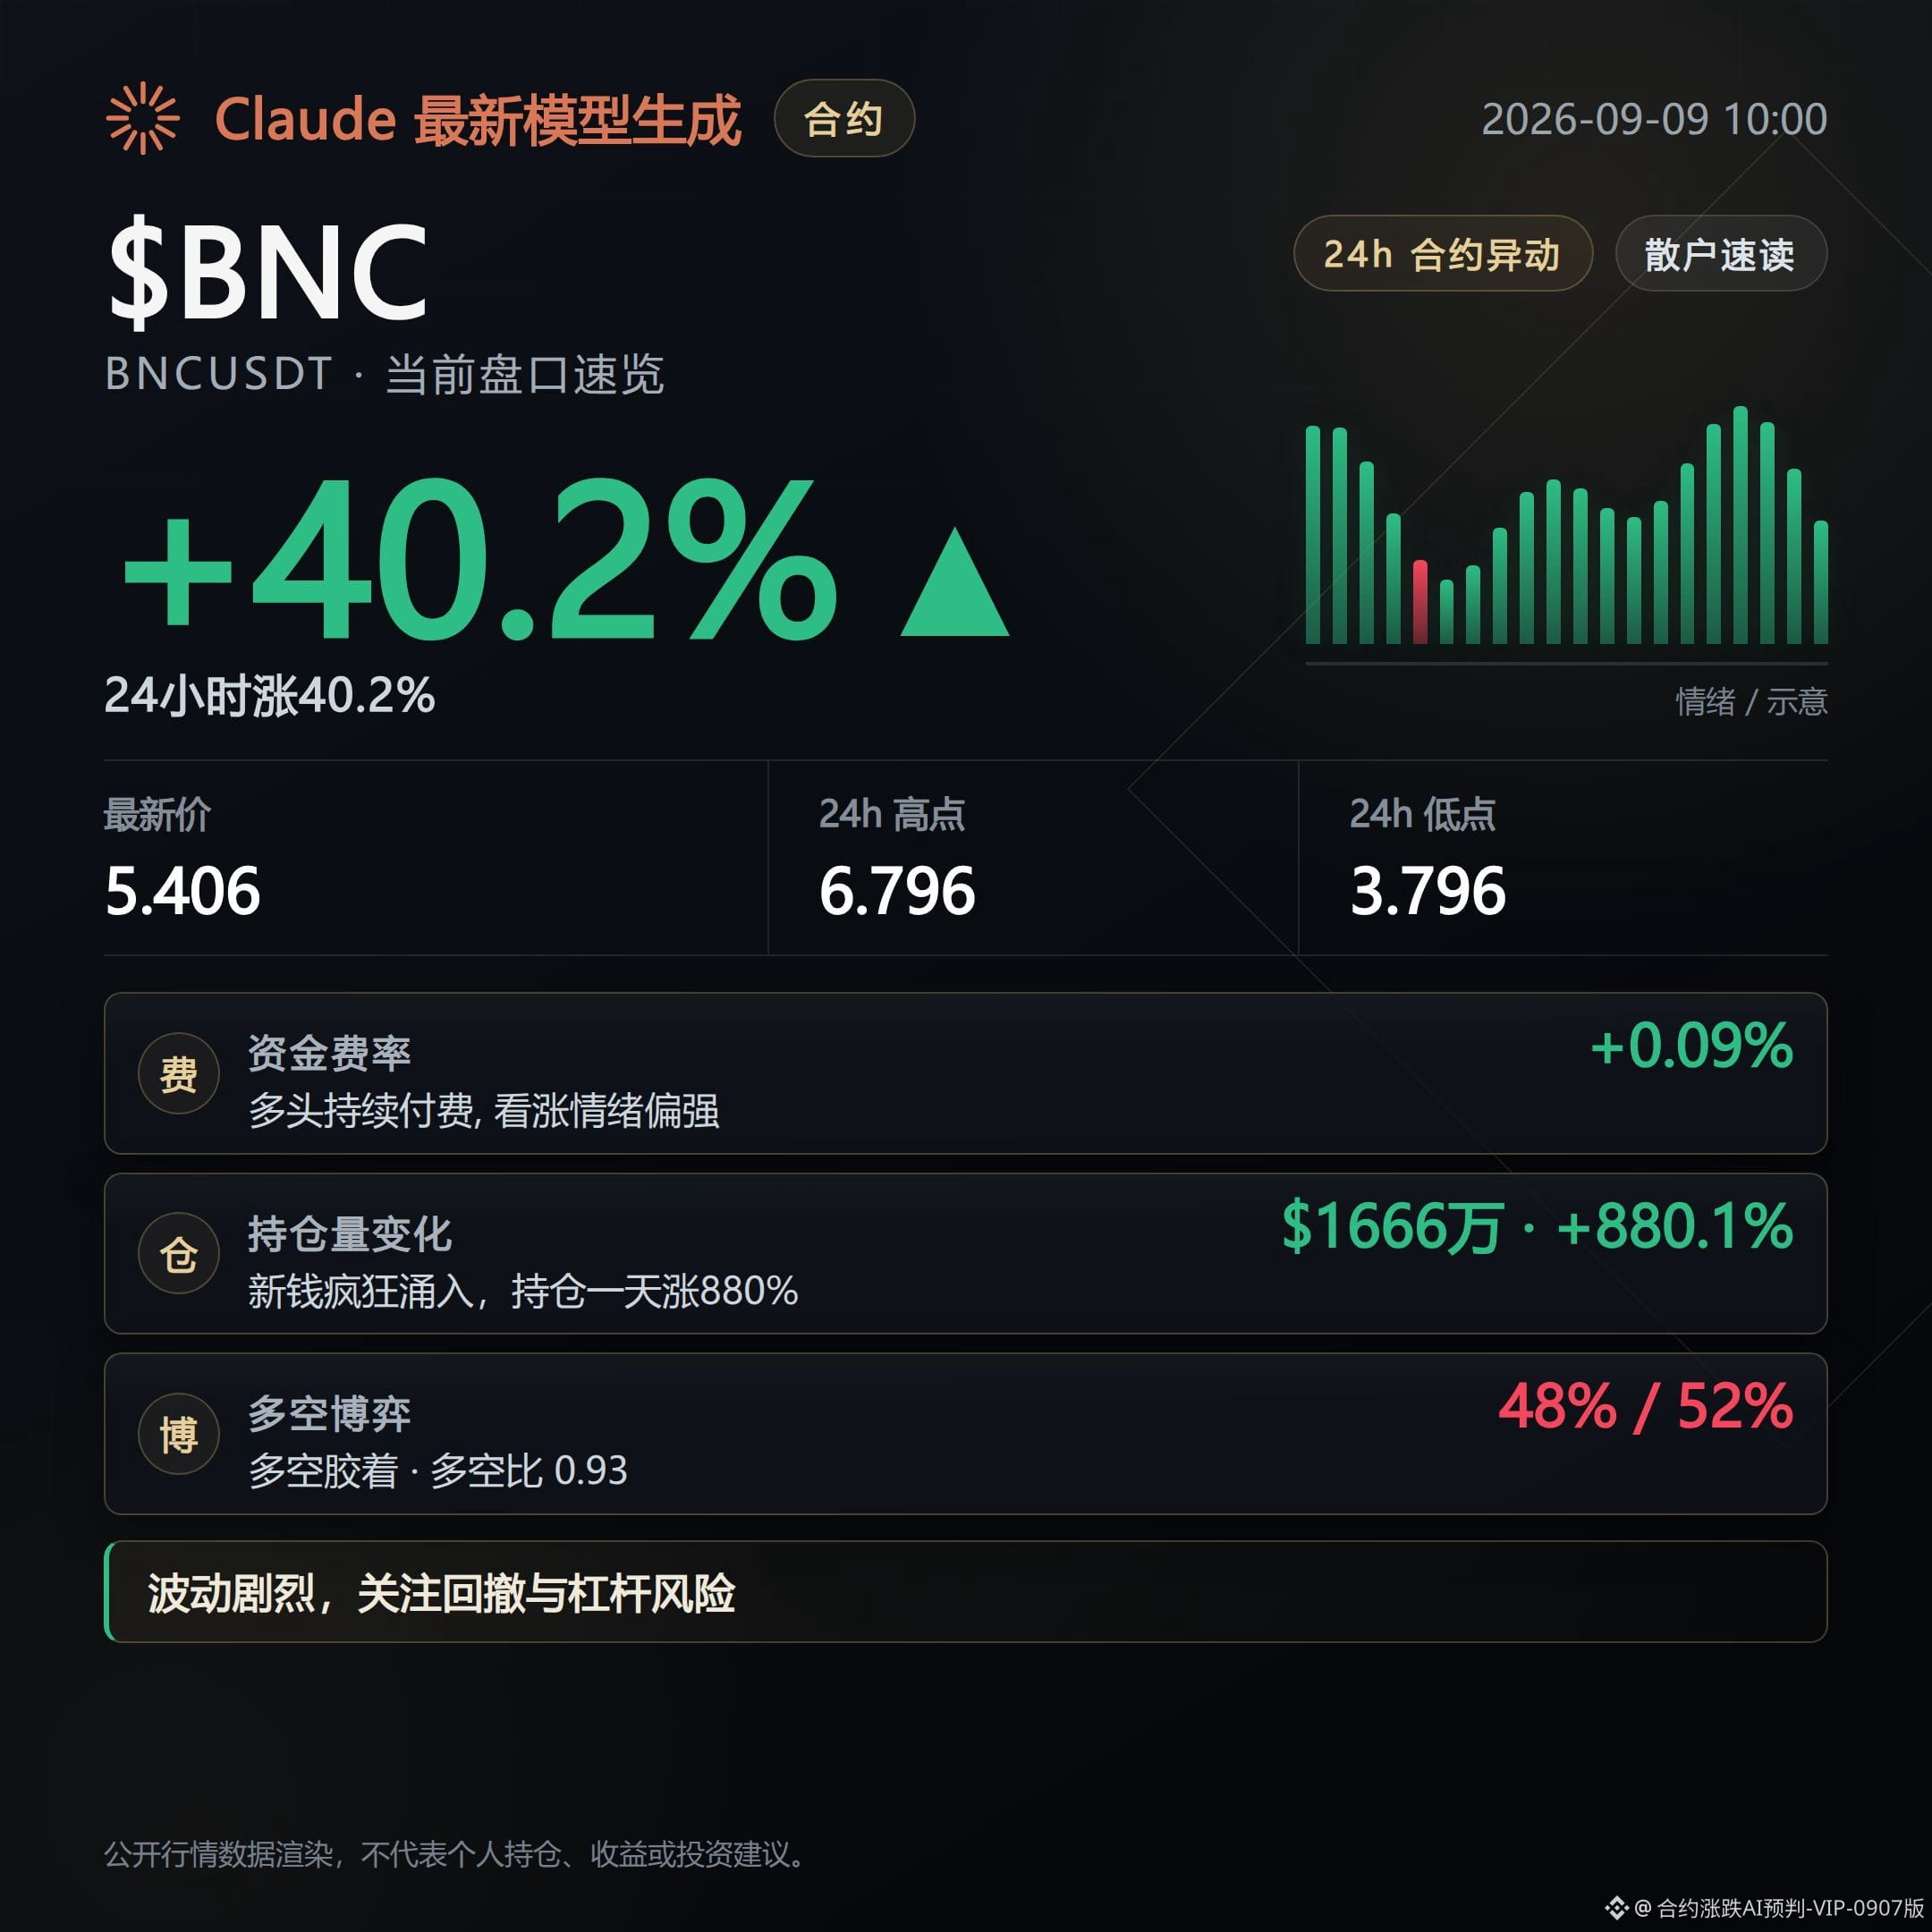
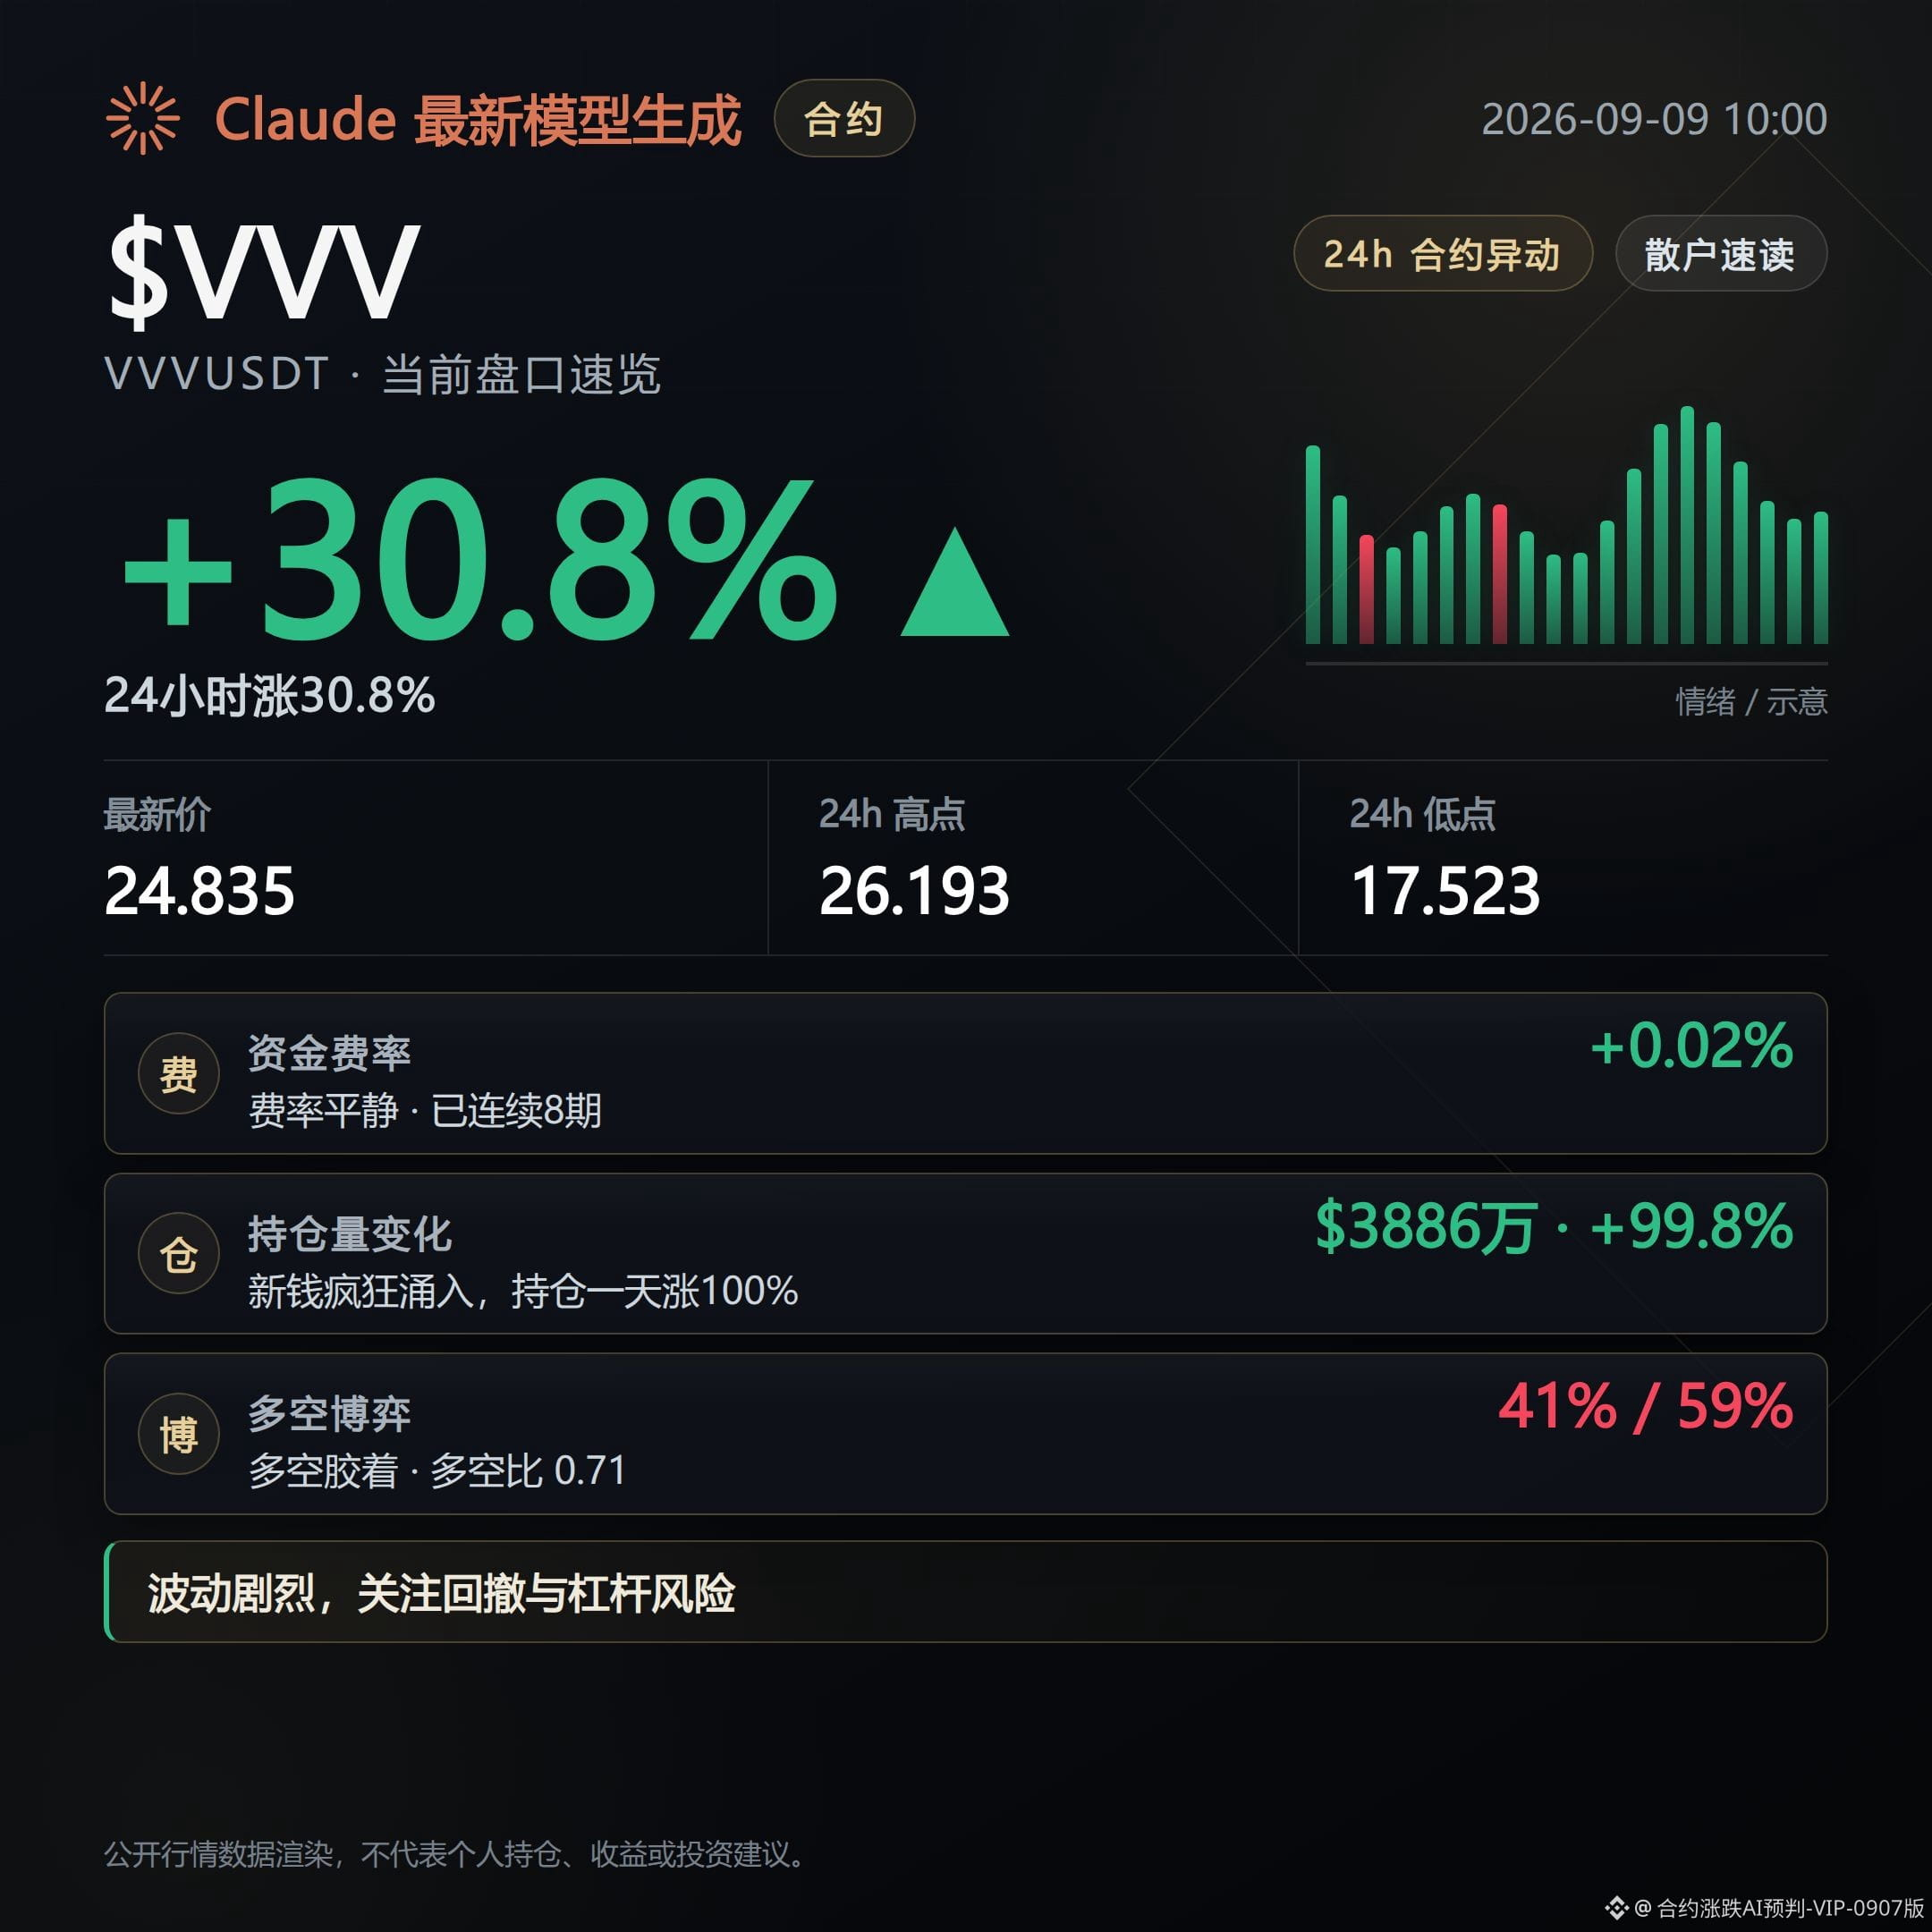
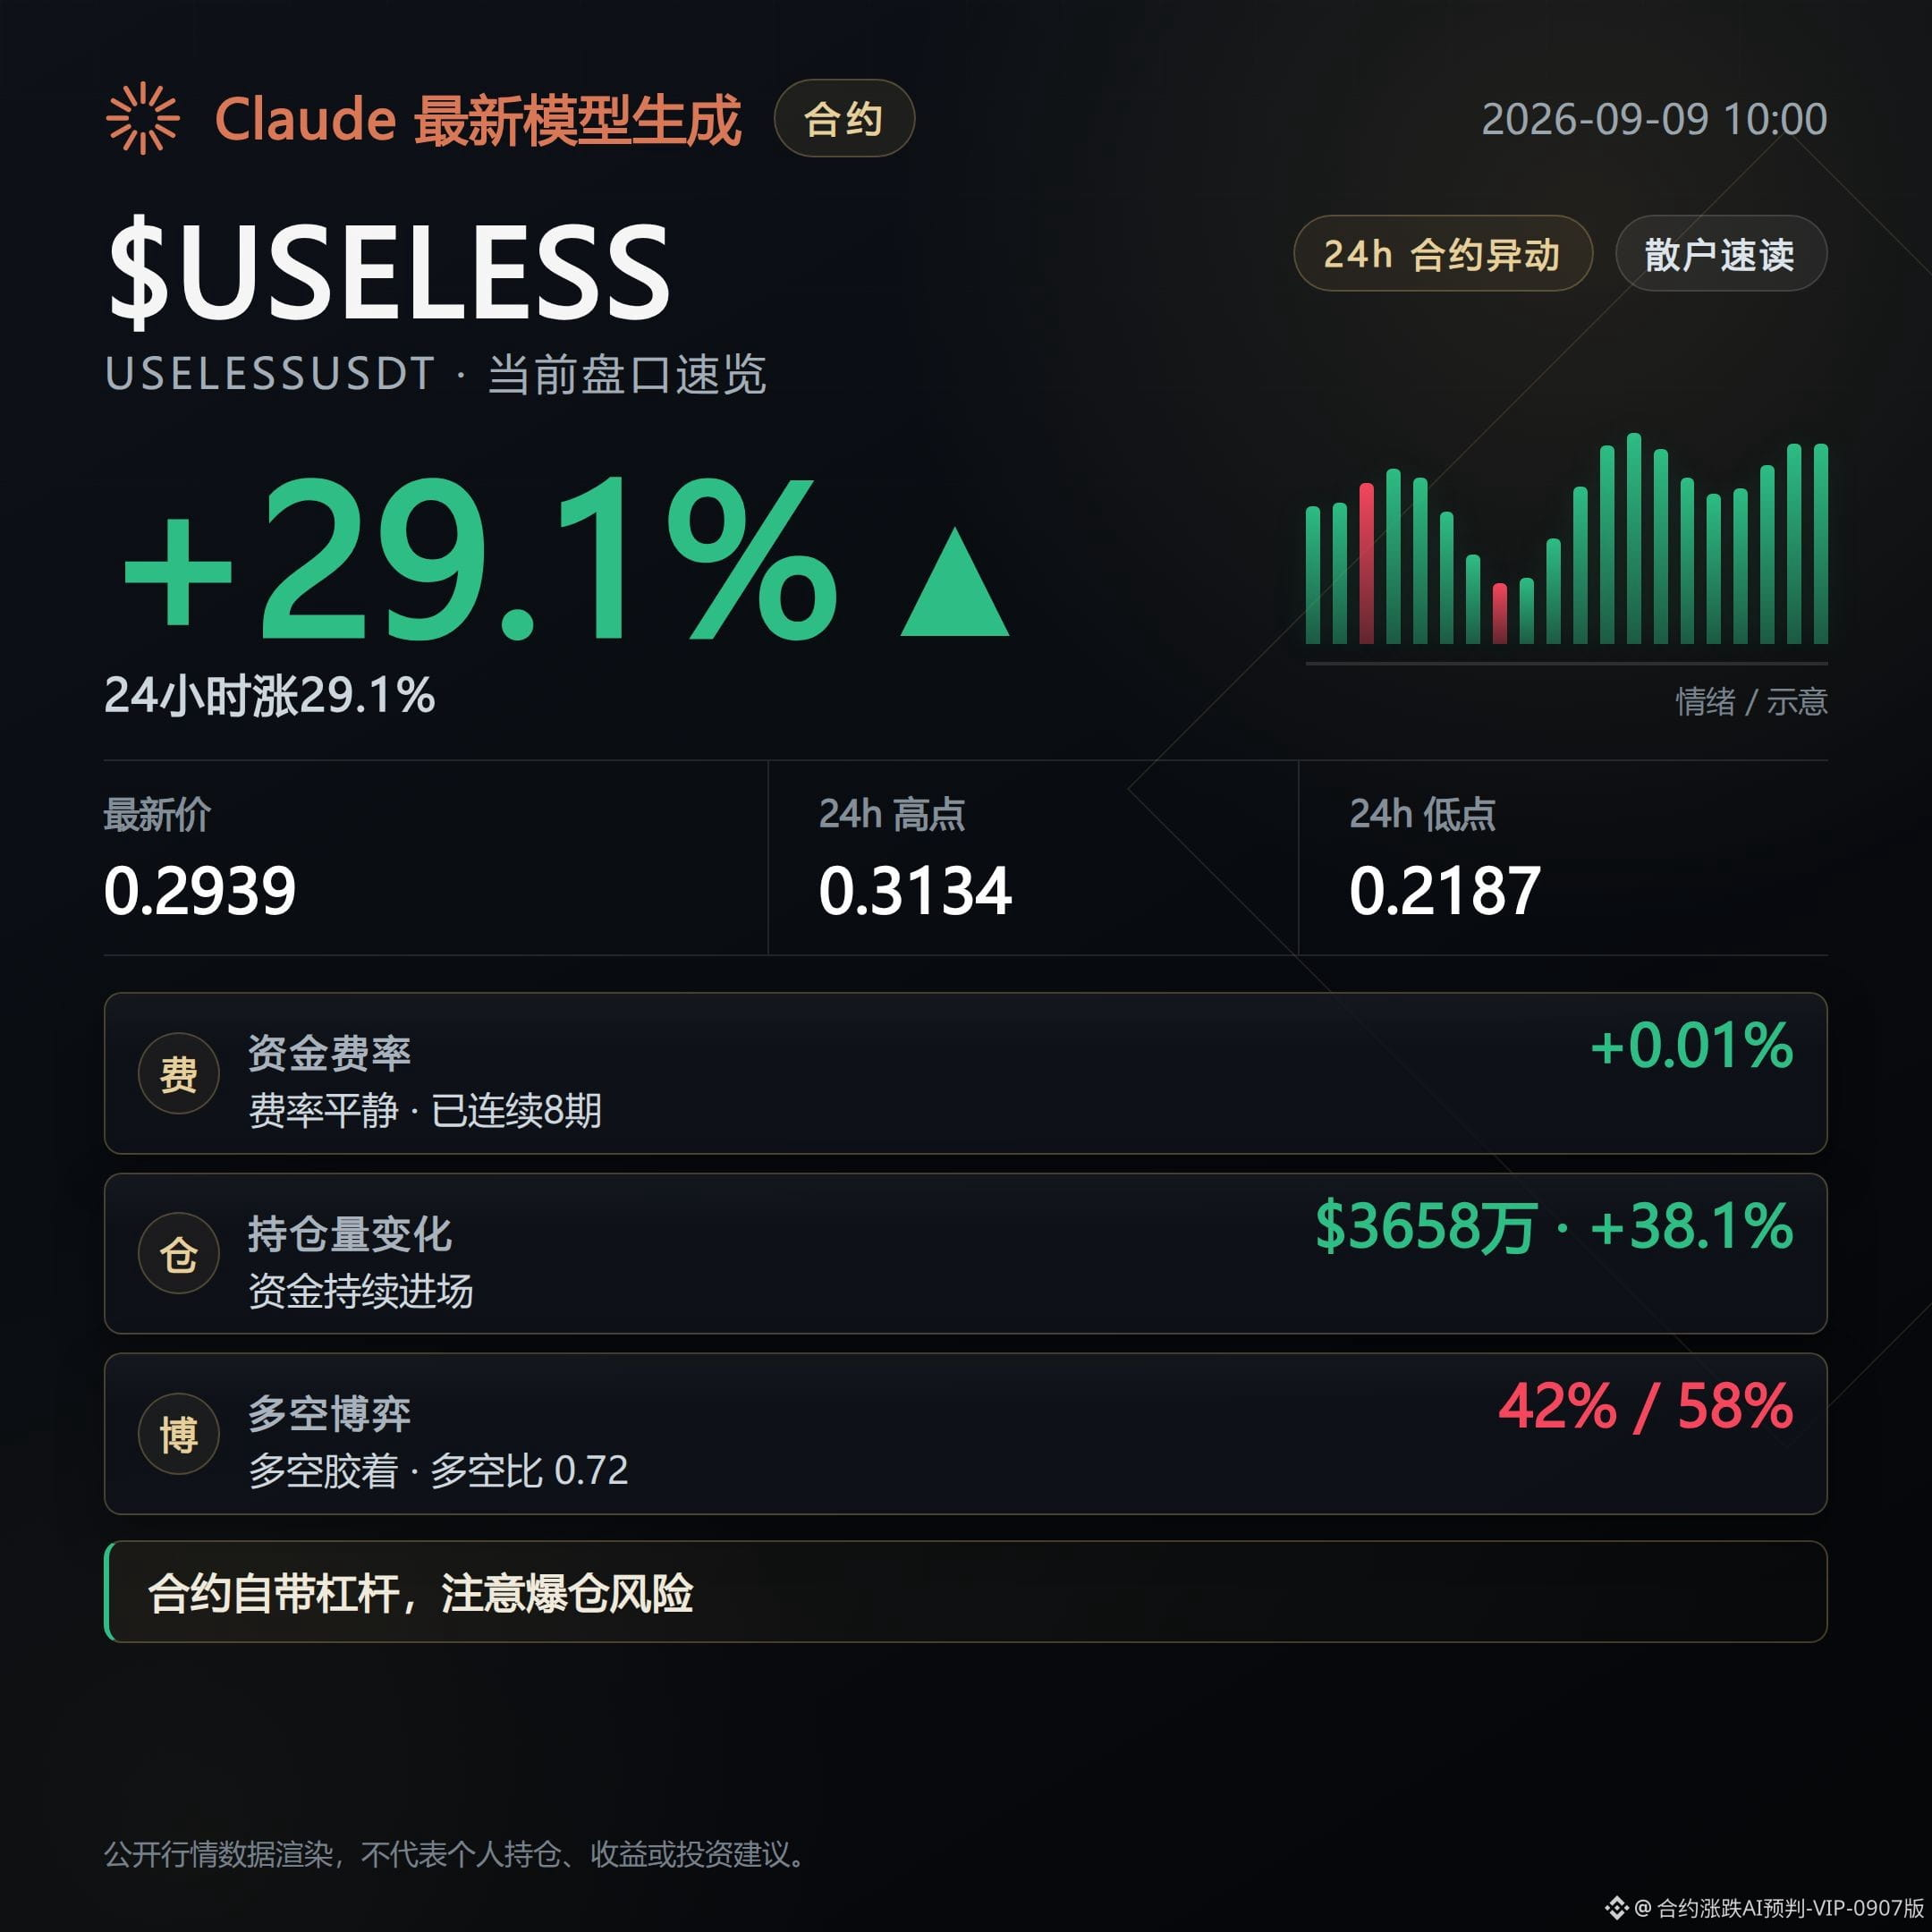
539
Bearish—these contracts’ order flow today looks more like a high-level distribution warning.
Prices are still up, but the structure has loosened; don’t just look at the green % gain number.
What you fear isn’t that it won’t rise—it’s that as it keeps rising, the follow-through (support) gets thinner.
Next, watch whether a pullback actually develops, and whether the follow-through is really getting thinner.
SOPH current price is $0.005873. Over the past 24 hours it’s up only 1.22%; the rise itself is already fairly weak.
But open interest over the past 24 hours increased by 4.1%, and even in the last hour it’s still adding positions—while price hasn’t kept up with the expansion of positioning.
The funding rate has turned negative: 1 consecutive period of shorts paying. The super-trend indicator shows a downward move; momentum has already flipped.
However, the number of long vs short positions is 1.44 and large-lot long vs short is 1.65—longs still have the advantage. If this group doesn’t withdraw, the slope of the pullback can be “pinned down.”
FF current price is $0.15001. In the past 24 hours it surged 23.86%, the strongest mover by % among the three.
Open interest over the past 24 hours exploded 30.2%; this is a position-influx type of rally. The relative strength index is already at 74.5, entering an overbought zone.
Funding rate has been positive for 8 straight periods (longs paying), but the premium is still negative at -0.0384%. Futures are cheaper than spot; longs are paying money to support positions, and the price structure no longer aligns well.
A counterpoint is that the buy/sell order ratio is 1.02—buys are still slightly dominant. The large-lot long vs short ratio is also 3.26, clearly leaning bullish. Short-term strength hasn’t been broken yet; it’s just that the higher new positions pile in, the more likely that once someone starts to run, sell pressure will concentrate.
COTI current price is $0.017685. It’s up 5.07% over the past 24 hours; the gain isn’t particularly extreme.
But open interest over the past 24 hours actually decreased 1.5%, which doesn’t match the direction of price rising. Positioning is retreating rather than chasing.
Premium/discount is at -0.0854%, the deepest discount among the three. The funding rate has also turned to shorts paying for 1 consecutive period.
A counterpoint is that the buy/sell order ratio is 1.29—buys still dominate. The long vs short position count ratio is 0.99, close to 50/50, so the structure hasn’t tilted clearly one way or the other.
The common feature of these three contracts today is that the “chips” are dispersed: price gains are still happening, but positioning and funding rate have already started to loosen.
If follow-through continues to thin, that pullback line is already forming.
If it puts volume back and holds above, then this view needs to be reassessed.
Chasing high prices can suffer both a dead-cat bounce and a pullback at the same time.
#SOPH #FF #COTI # contract order book
Live record: This account currently holds $FOGO long positions. As long as the logic hasn’t changed, I will continue to hold.
Claude Fable 5 assists generation; the content is for market information reference only and does not constitute investment advice.
Bearish—these contracts’ order flow today looks more like a high-level distribution warning.
Prices are still up, but the structure has loosened; don’t just look at the green % gain number.
What you fear isn’t that it won’t rise—it’s that as it keeps rising, the follow-through (support) gets thinner.
Next, watch whether a pullback actually develops, and whether the follow-through is really getting thinner.
SOPH current price is $0.005873. Over the past 24 hours it’s up only 1.22%; the rise itself is already fairly weak.
But open interest over the past 24 hours increased by 4.1%, and even in the last hour it’s still adding positions—while price hasn’t kept up with the expansion of positioning.
The funding rate has turned negative: 1 consecutive period of shorts paying. The super-trend indicator shows a downward move; momentum has already flipped.
However, the number of long vs short positions is 1.44 and large-lot long vs short is 1.65—longs still have the advantage. If this group doesn’t withdraw, the slope of the pullback can be “pinned down.”
FF current price is $0.15001. In the past 24 hours it surged 23.86%, the strongest mover by % among the three.
Open interest over the past 24 hours exploded 30.2%; this is a position-influx type of rally. The relative strength index is already at 74.5, entering an overbought zone.
Funding rate has been positive for 8 straight periods (longs paying), but the premium is still negative at -0.0384%. Futures are cheaper than spot; longs are paying money to support positions, and the price structure no longer aligns well.
A counterpoint is that the buy/sell order ratio is 1.02—buys are still slightly dominant. The large-lot long vs short ratio is also 3.26, clearly leaning bullish. Short-term strength hasn’t been broken yet; it’s just that the higher new positions pile in, the more likely that once someone starts to run, sell pressure will concentrate.
COTI current price is $0.017685. It’s up 5.07% over the past 24 hours; the gain isn’t particularly extreme.
But open interest over the past 24 hours actually decreased 1.5%, which doesn’t match the direction of price rising. Positioning is retreating rather than chasing.
Premium/discount is at -0.0854%, the deepest discount among the three. The funding rate has also turned to shorts paying for 1 consecutive period.
A counterpoint is that the buy/sell order ratio is 1.29—buys still dominate. The long vs short position count ratio is 0.99, close to 50/50, so the structure hasn’t tilted clearly one way or the other.
The common feature of these three contracts today is that the “chips” are dispersed: price gains are still happening, but positioning and funding rate have already started to loosen.
If follow-through continues to thin, that pullback line is already forming.
If it puts volume back and holds above, then this view needs to be reassessed.
Chasing high prices can suffer both a dead-cat bounce and a pullback at the same time.
#SOPH #FF #COTI # contract order book
Live record: This account currently holds $FOGO long positions. As long as the logic hasn’t changed, I will continue to hold.
Claude Fable 5 assists generation; the content is for market information reference only and does not constitute investment advice.
Prices are still up, but the structure has loosened; don’t just look at the green % gain number.
What you fear isn’t that it won’t rise—it’s that as it keeps rising, the follow-through (support) gets thinner.
Next, watch whether a pullback actually develops, and whether the follow-through is really getting thinner.
SOPH current price is $0.005873. Over the past 24 hours it’s up only 1.22%; the rise itself is already fairly weak.
But open interest over the past 24 hours increased by 4.1%, and even in the last hour it’s still adding positions—while price hasn’t kept up with the expansion of positioning.
The funding rate has turned negative: 1 consecutive period of shorts paying. The super-trend indicator shows a downward move; momentum has already flipped.
However, the number of long vs short positions is 1.44 and large-lot long vs short is 1.65—longs still have the advantage. If this group doesn’t withdraw, the slope of the pullback can be “pinned down.”
FF current price is $0.15001. In the past 24 hours it surged 23.86%, the strongest mover by % among the three.
Open interest over the past 24 hours exploded 30.2%; this is a position-influx type of rally. The relative strength index is already at 74.5, entering an overbought zone.
Funding rate has been positive for 8 straight periods (longs paying), but the premium is still negative at -0.0384%. Futures are cheaper than spot; longs are paying money to support positions, and the price structure no longer aligns well.
A counterpoint is that the buy/sell order ratio is 1.02—buys are still slightly dominant. The large-lot long vs short ratio is also 3.26, clearly leaning bullish. Short-term strength hasn’t been broken yet; it’s just that the higher new positions pile in, the more likely that once someone starts to run, sell pressure will concentrate.
COTI current price is $0.017685. It’s up 5.07% over the past 24 hours; the gain isn’t particularly extreme.
But open interest over the past 24 hours actually decreased 1.5%, which doesn’t match the direction of price rising. Positioning is retreating rather than chasing.
Premium/discount is at -0.0854%, the deepest discount among the three. The funding rate has also turned to shorts paying for 1 consecutive period.
A counterpoint is that the buy/sell order ratio is 1.29—buys still dominate. The long vs short position count ratio is 0.99, close to 50/50, so the structure hasn’t tilted clearly one way or the other.
The common feature of these three contracts today is that the “chips” are dispersed: price gains are still happening, but positioning and funding rate have already started to loosen.
If follow-through continues to thin, that pullback line is already forming.
If it puts volume back and holds above, then this view needs to be reassessed.
Chasing high prices can suffer both a dead-cat bounce and a pullback at the same time.
#SOPH #FF #COTI # contract order book
Live record: This account currently holds $FOGO long positions. As long as the logic hasn’t changed, I will continue to hold.
Claude Fable 5 assists generation; the content is for market information reference only and does not constitute investment advice.
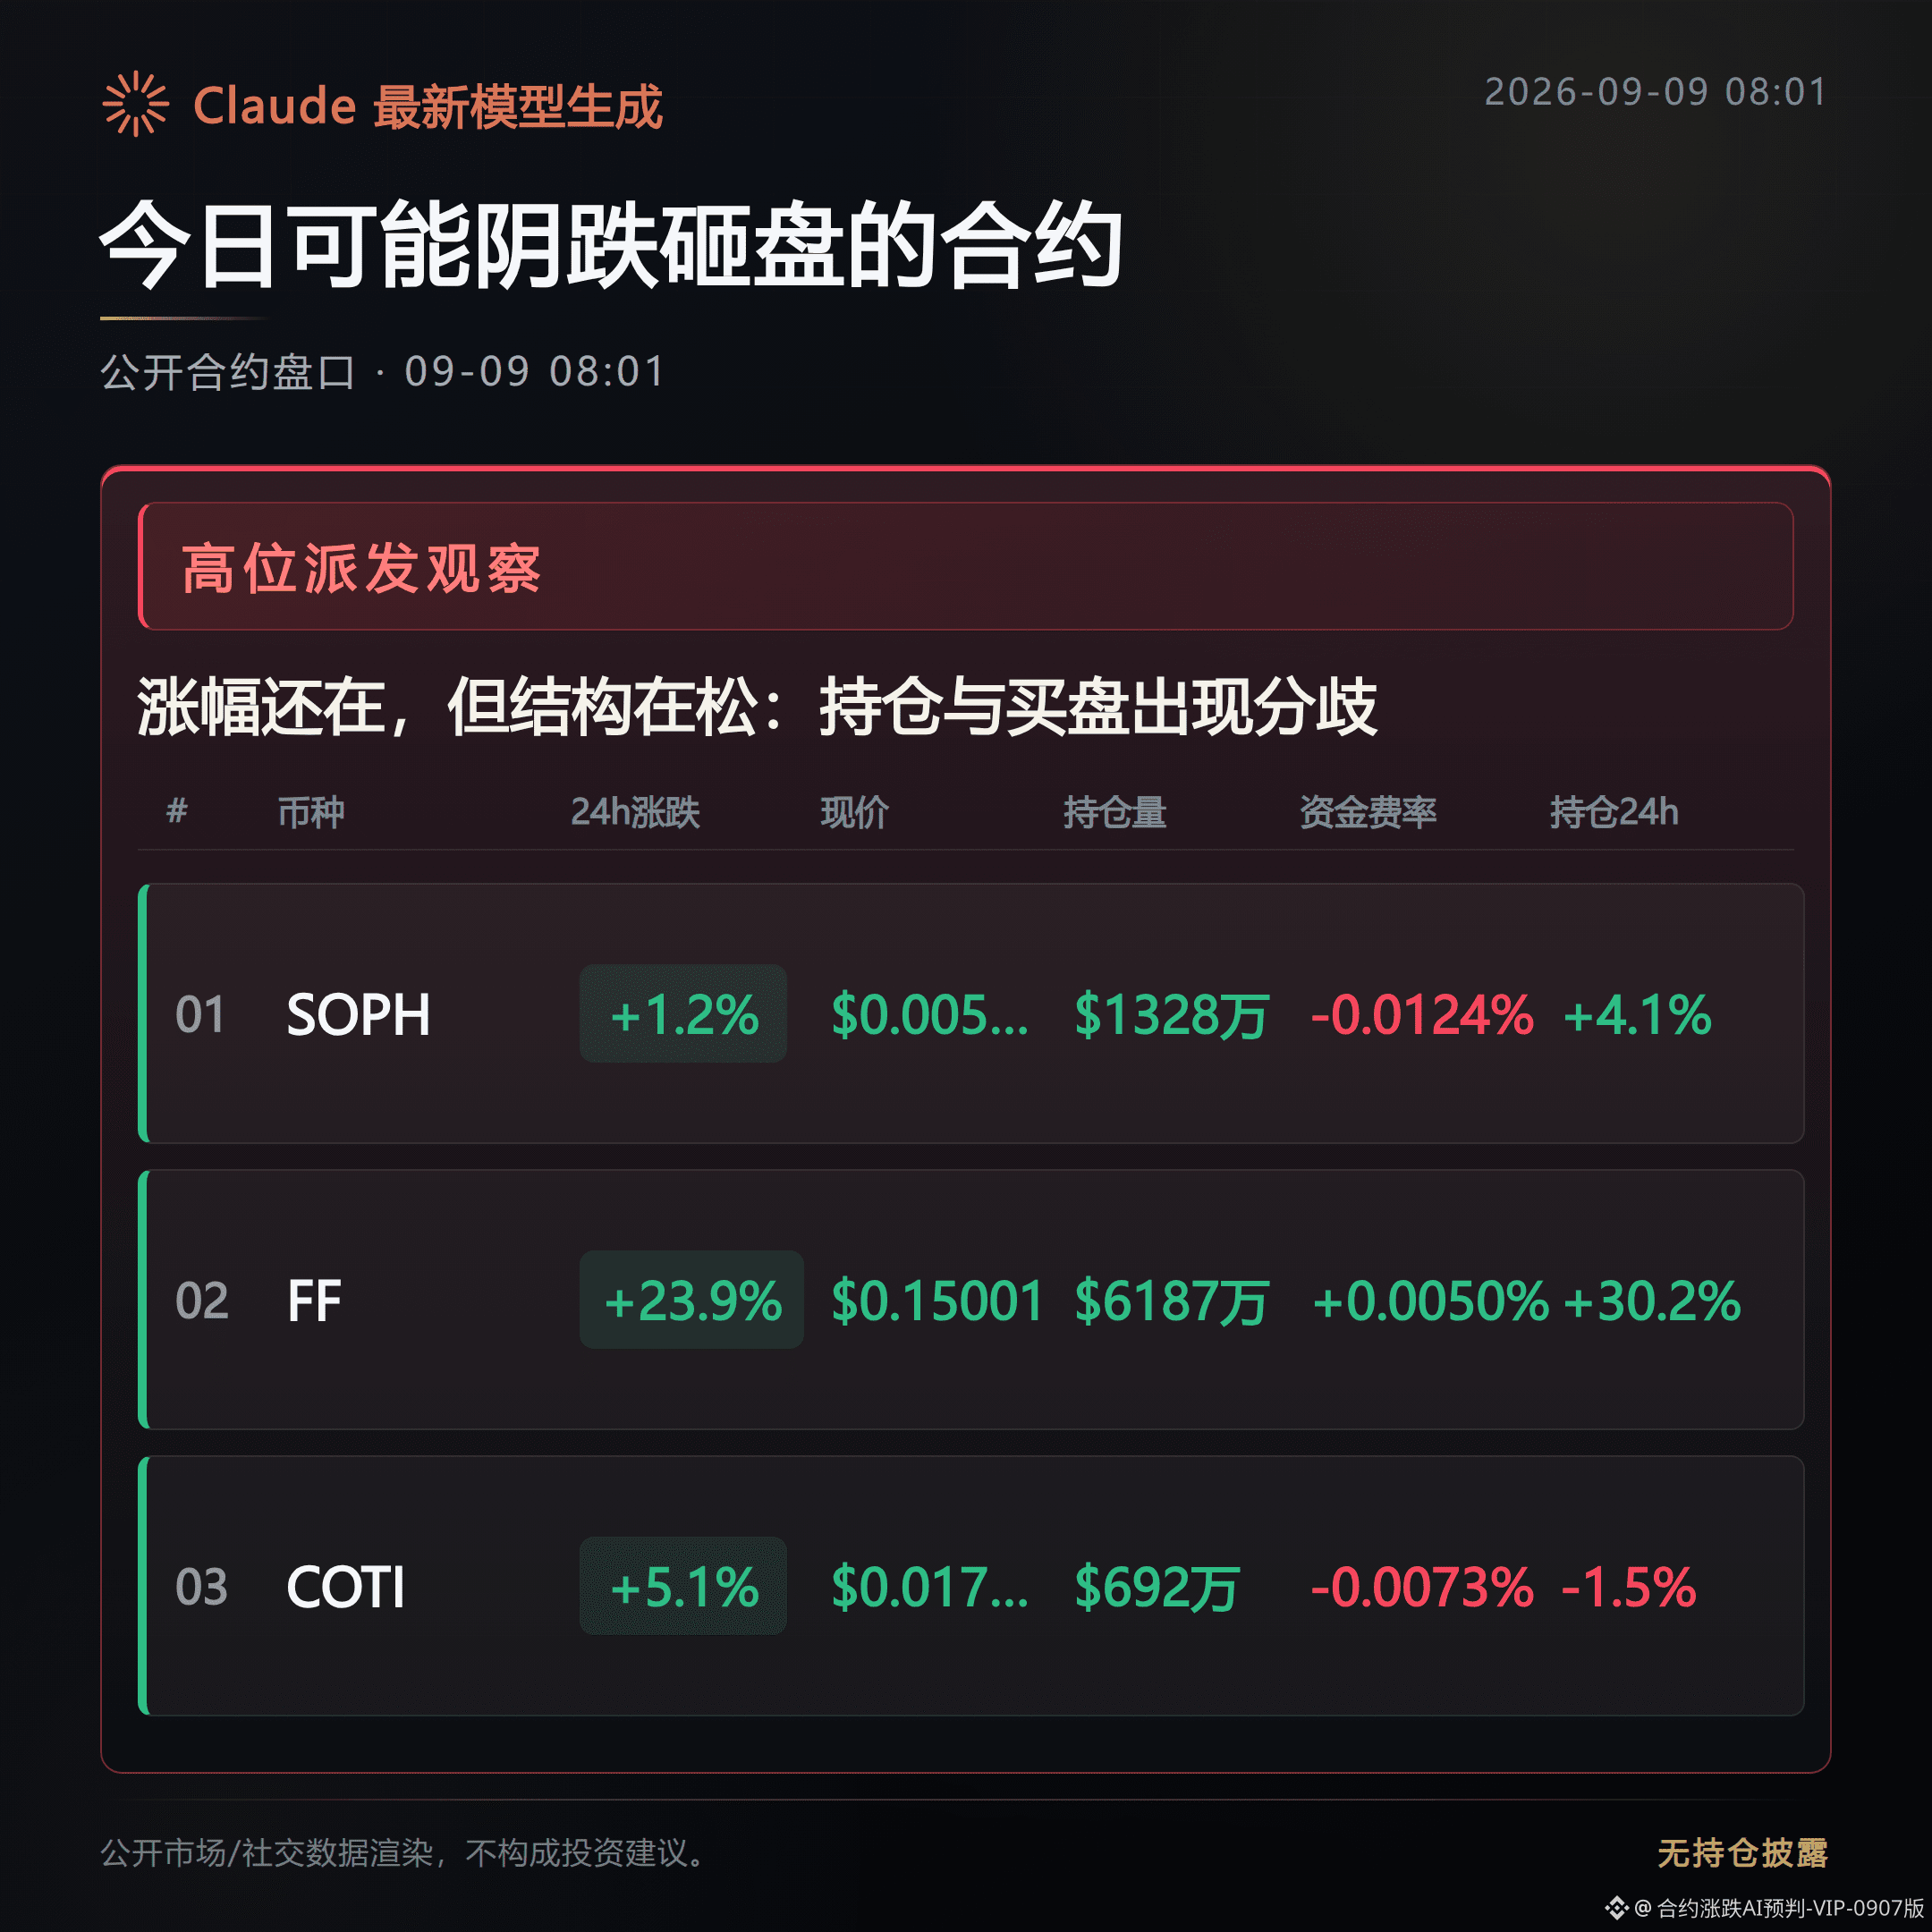
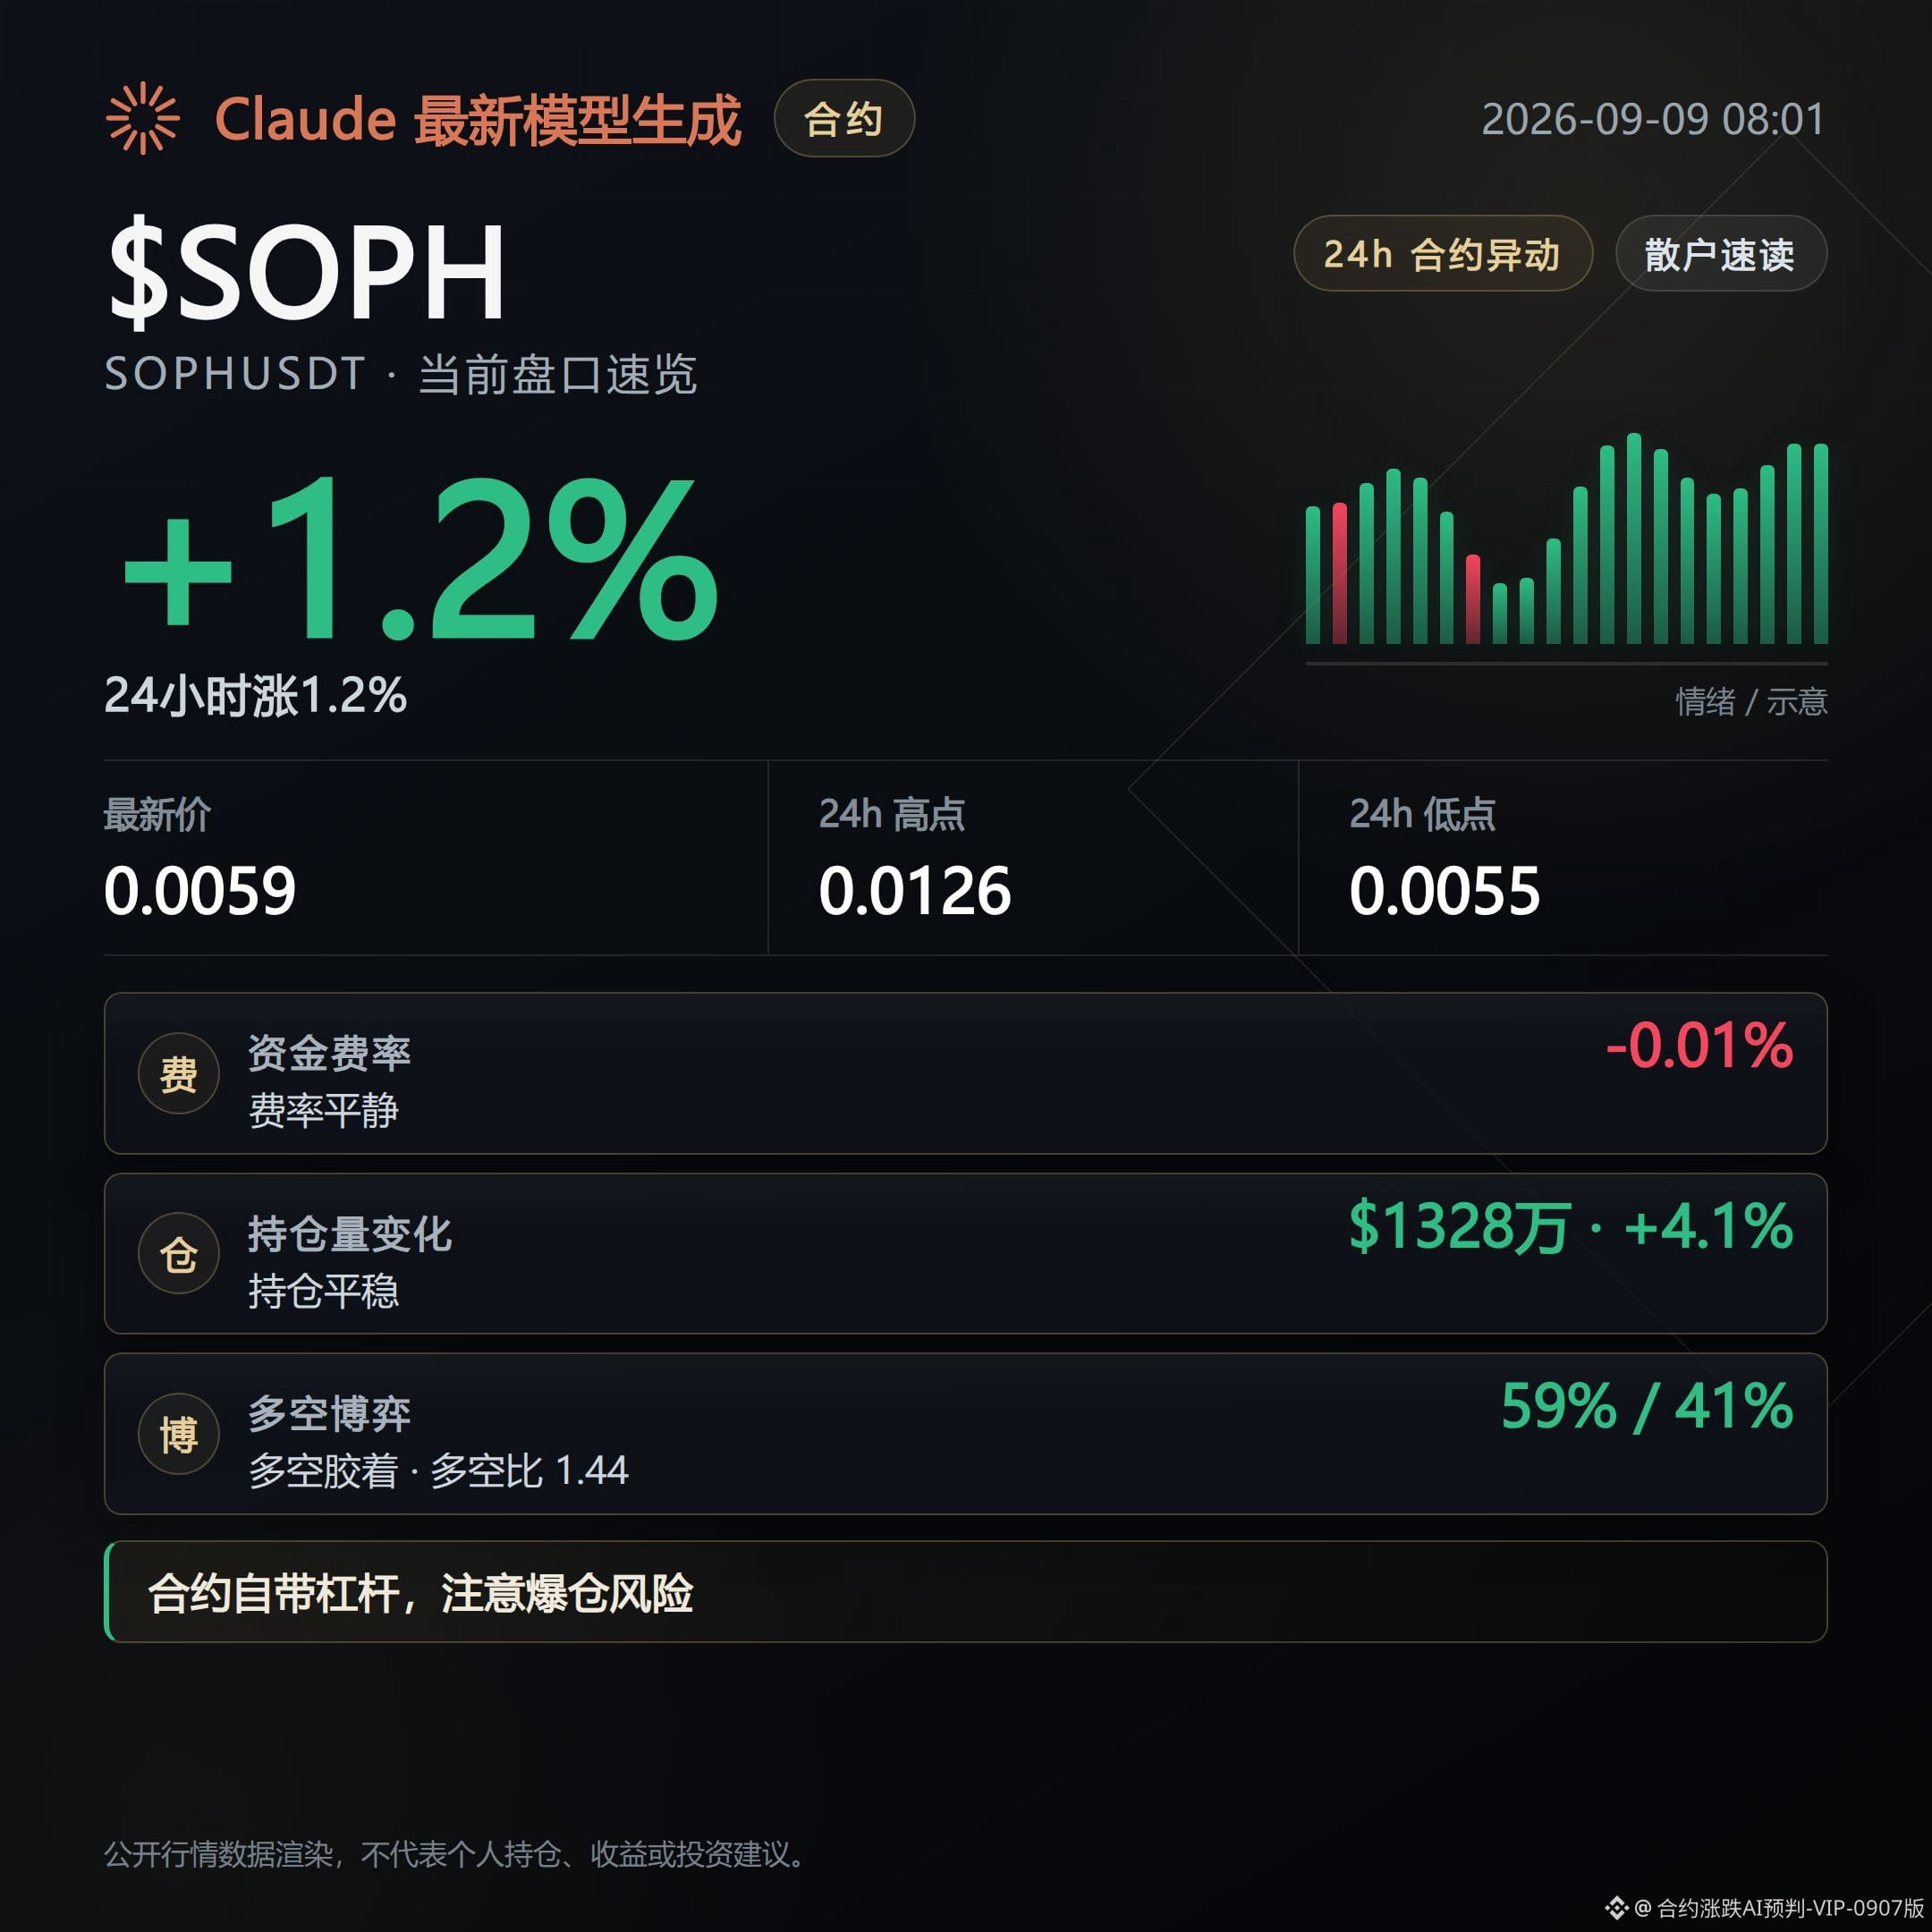
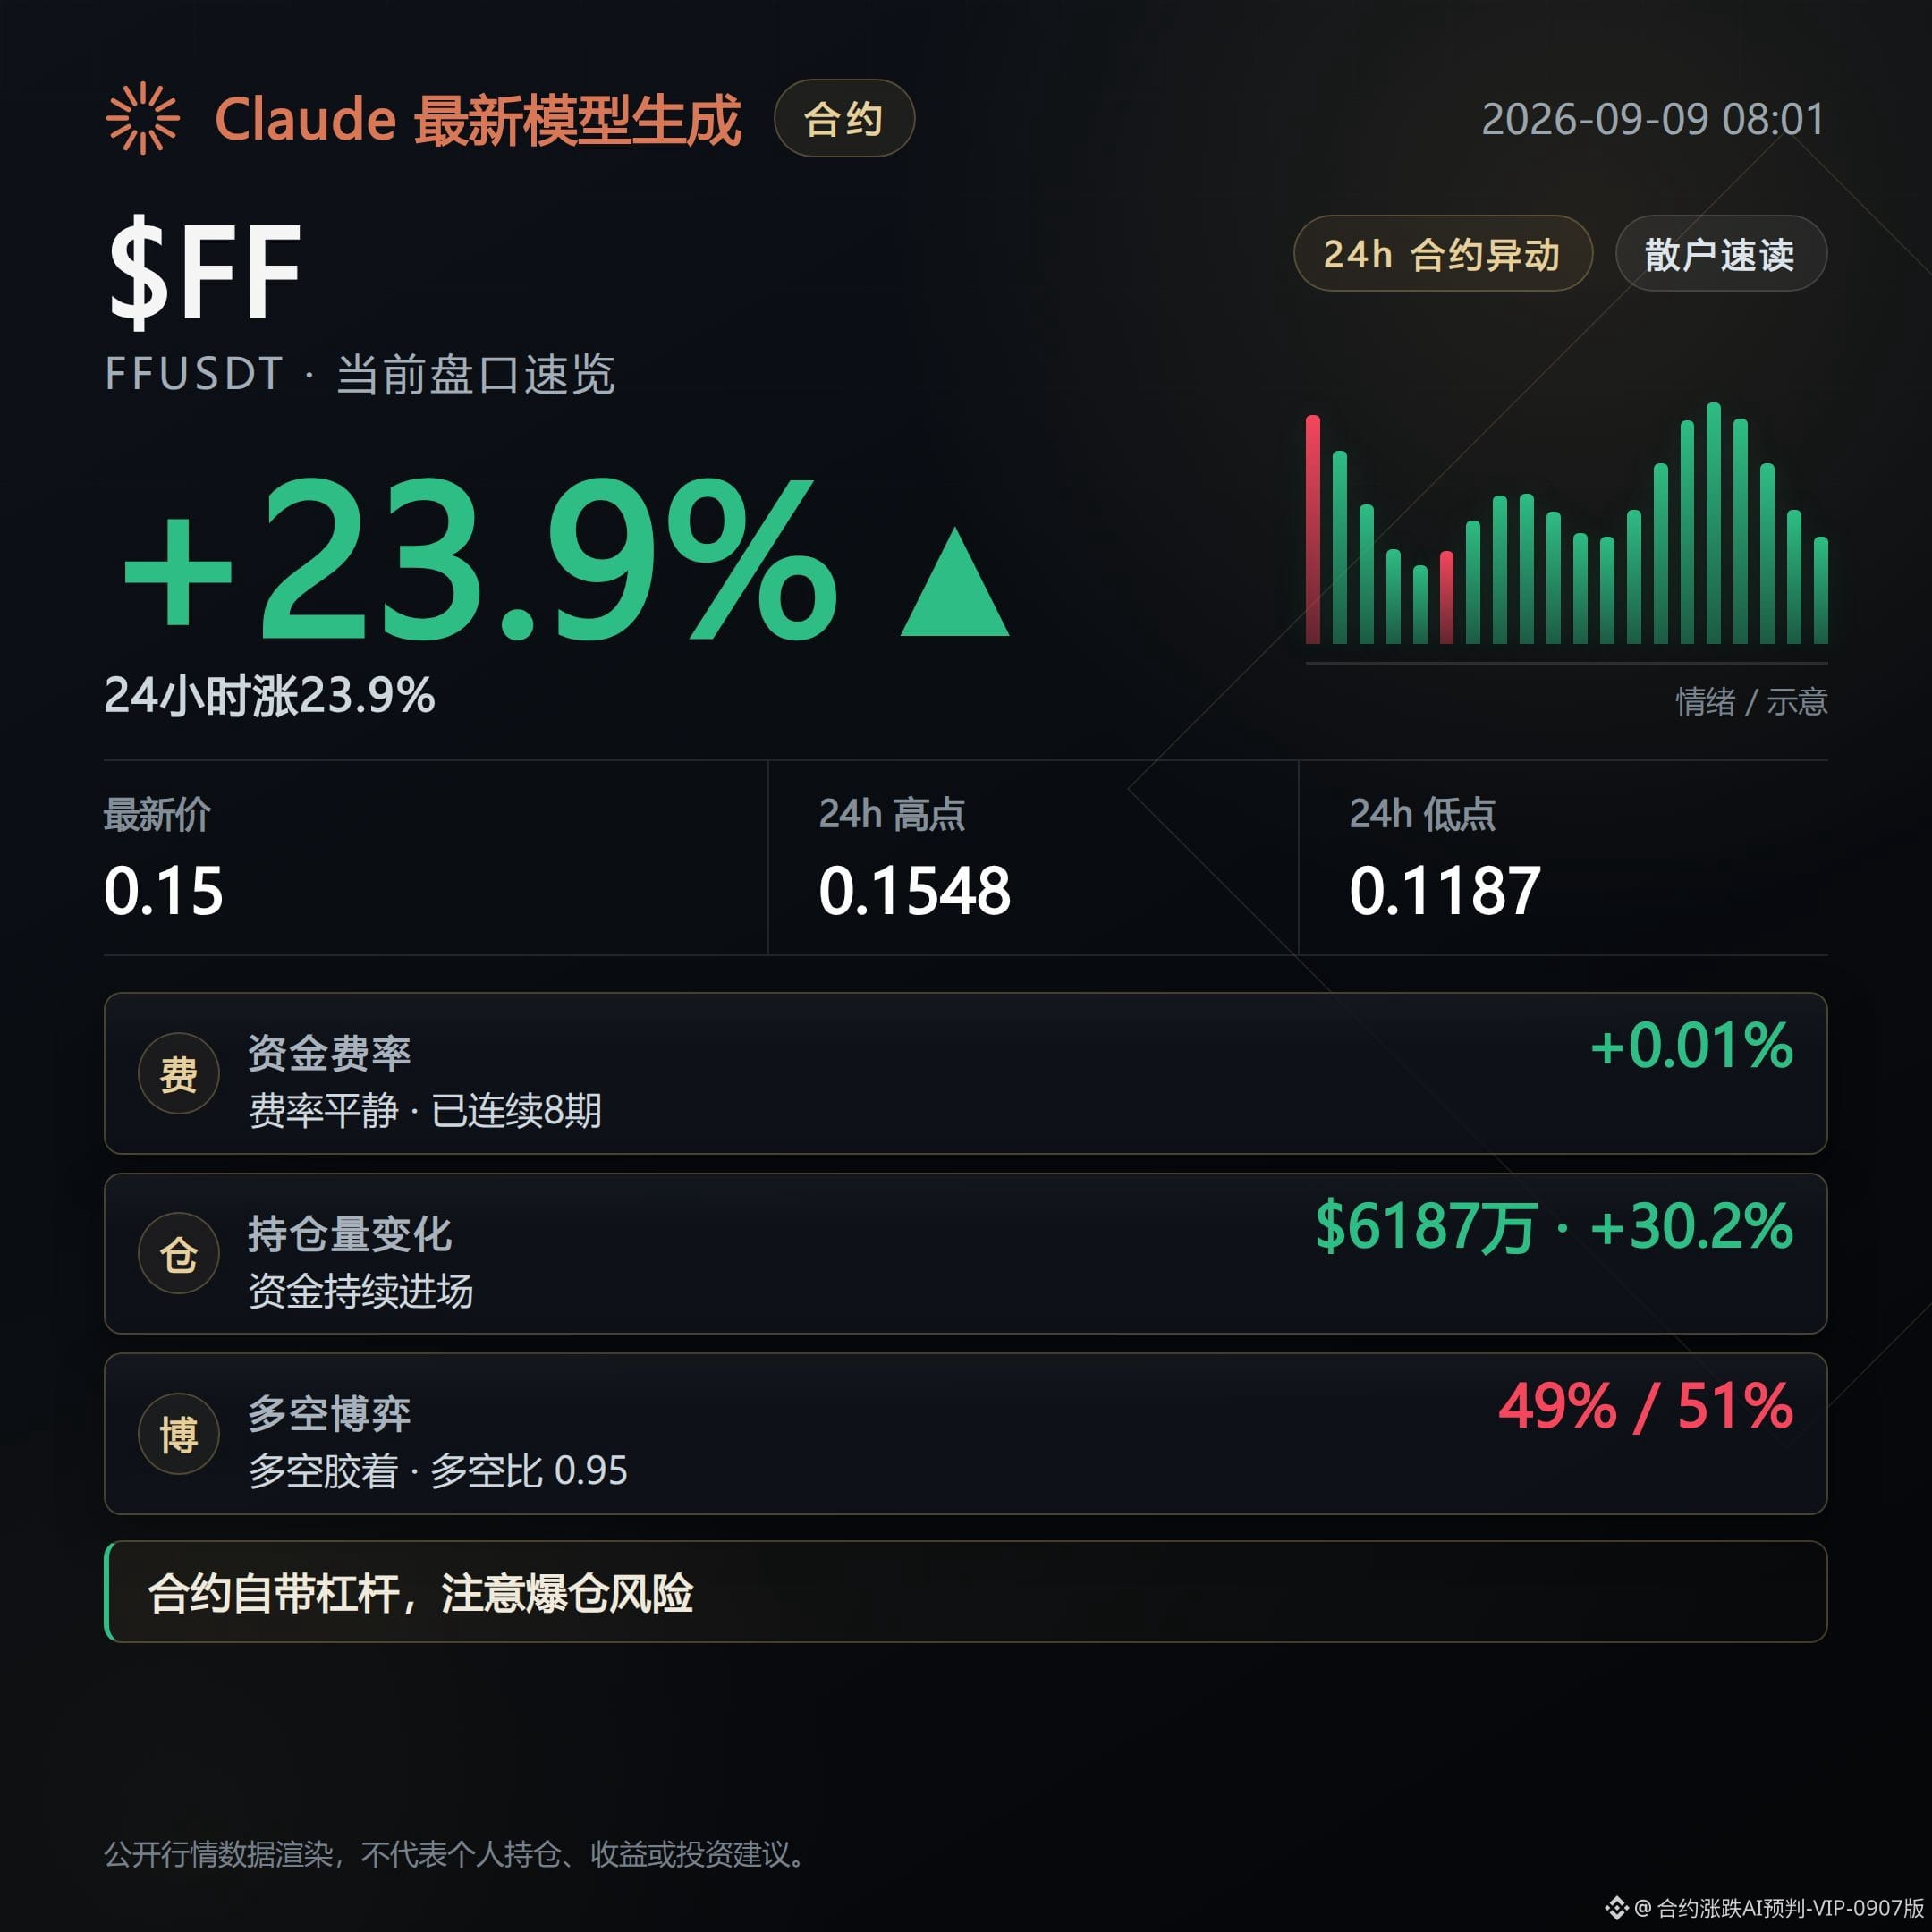
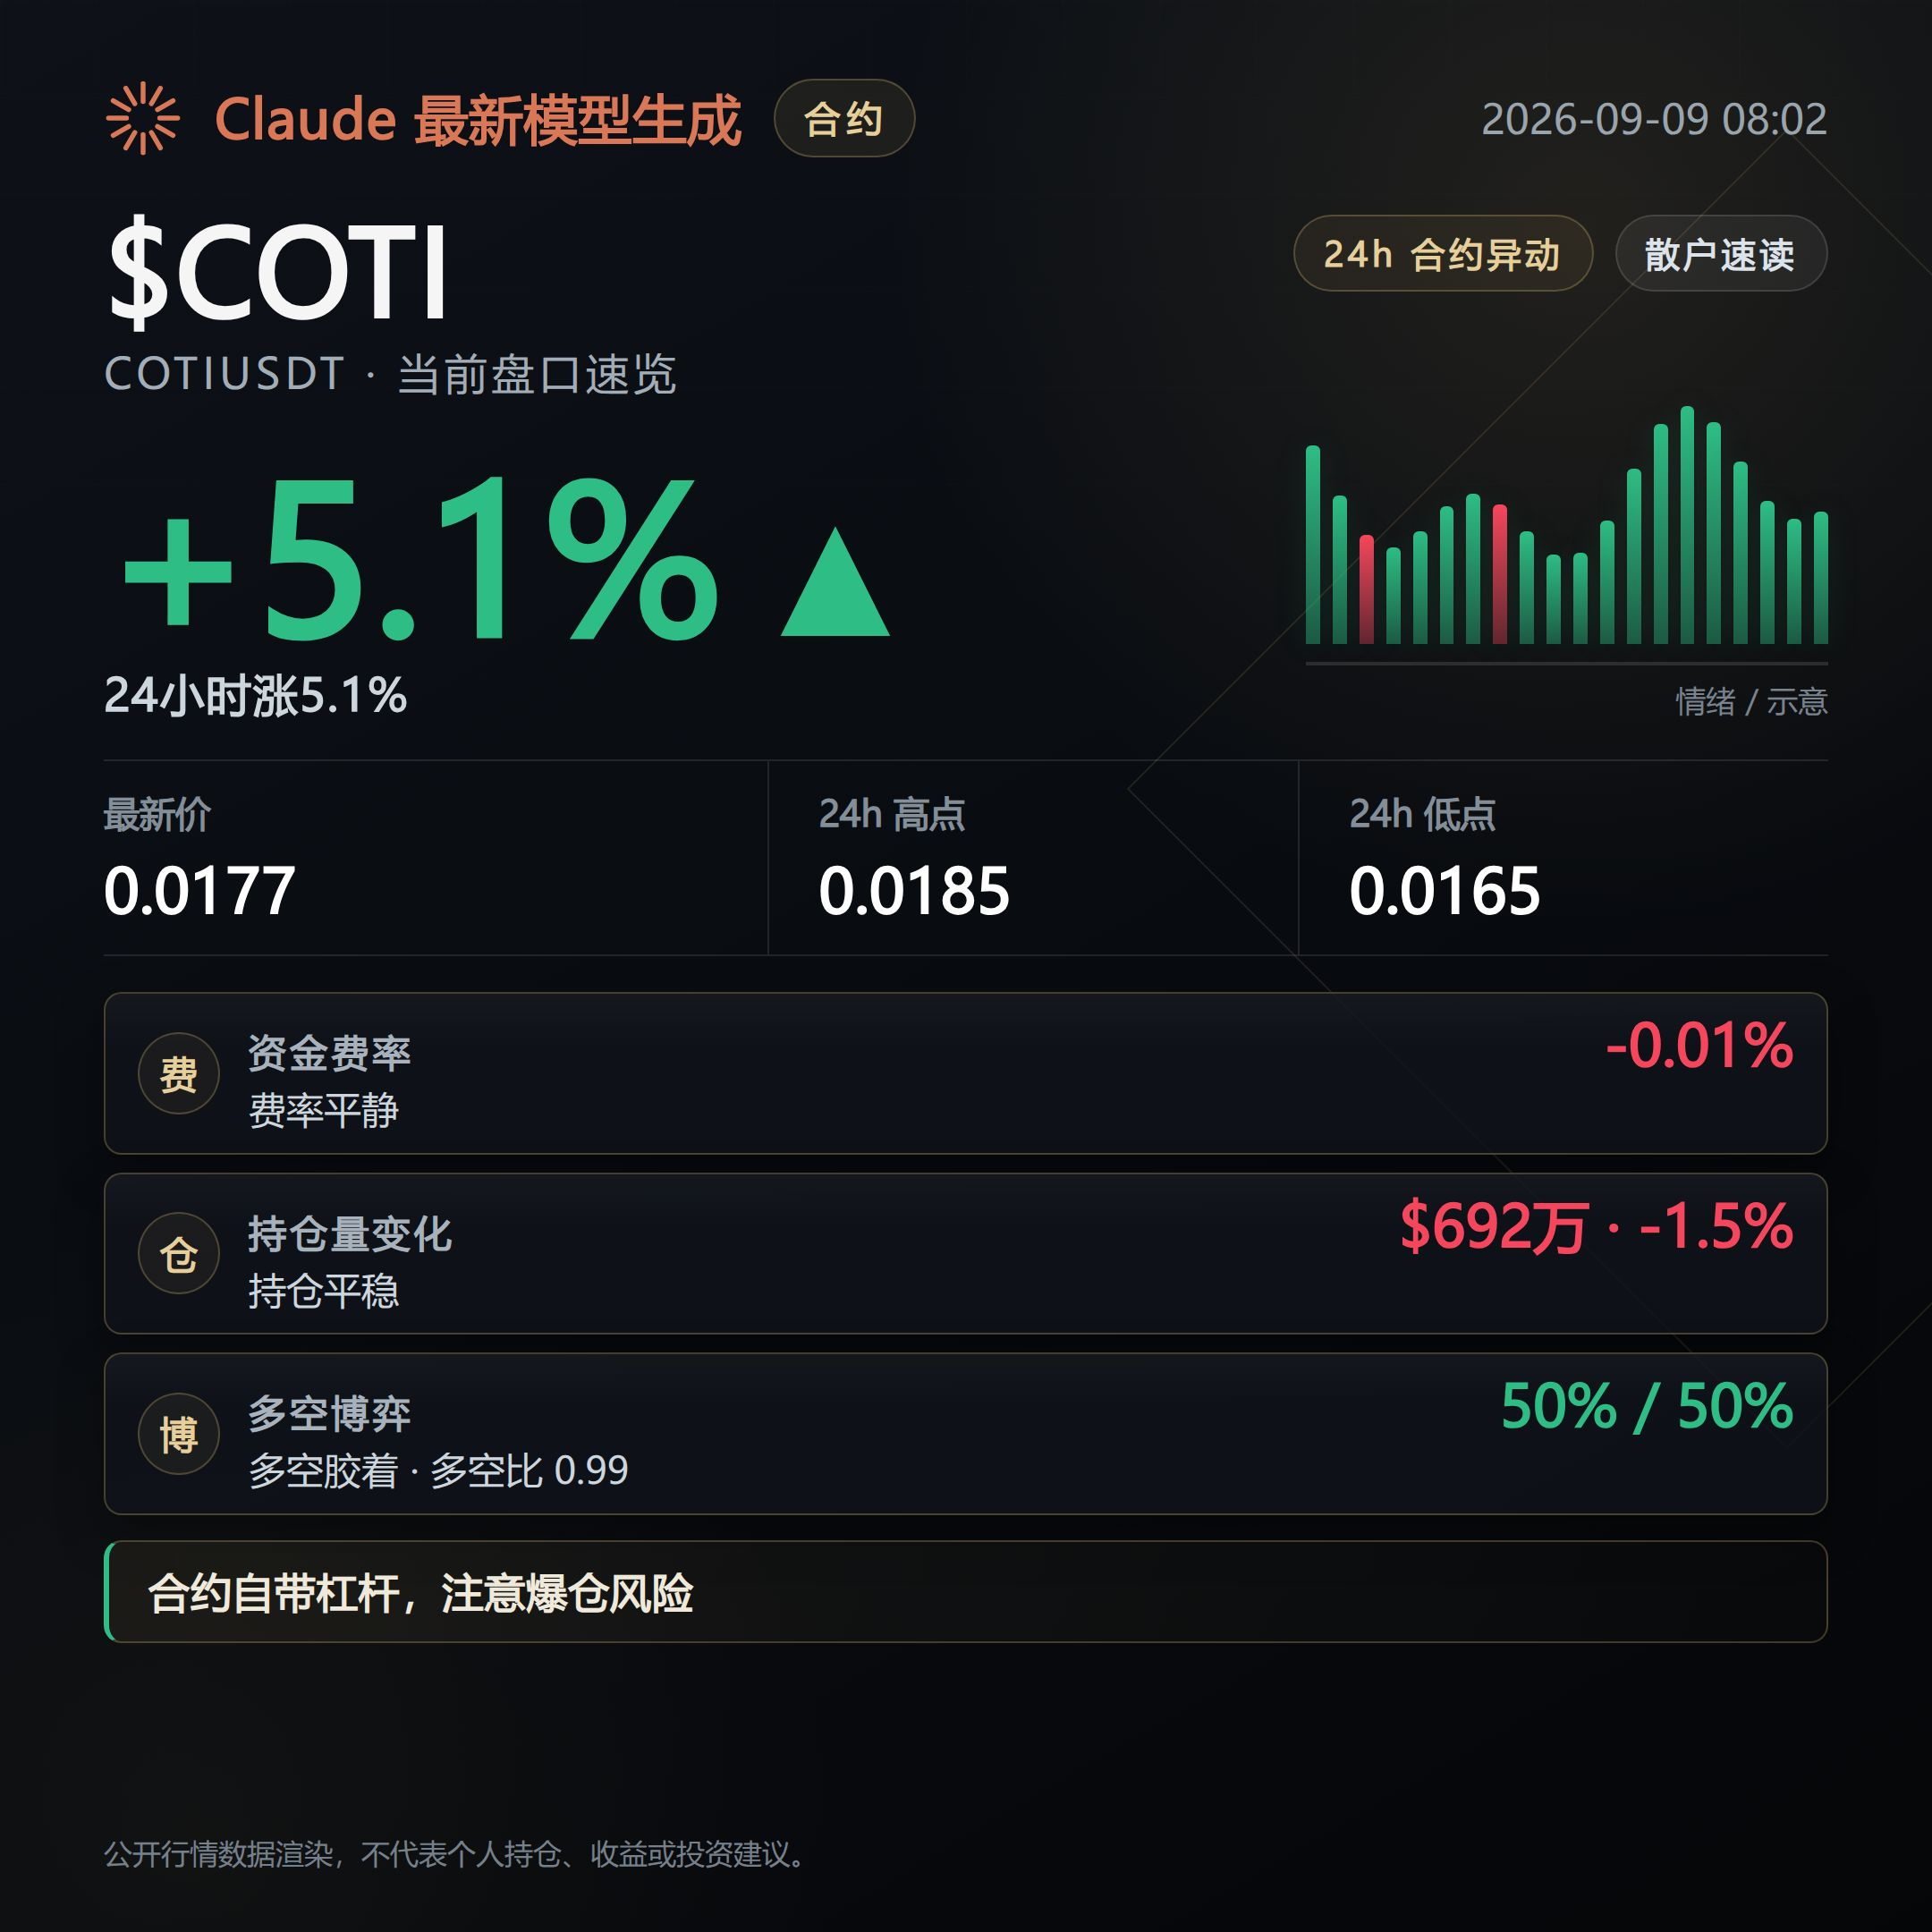
1
1k
Bullish. For these three contracts—MEGA, DOT, and PROM—their prices on the board are all moving upward in the last 24 hours with the trend, open interest is rising in sync, and the buying power hasn’t fallen behind. This isn’t an isolated action by a single coin. Next, watch whether each of these coins’ open-interest growth rate and proportion of aggressive buy orders can continue to hold up—especially whether the one with high crowding will loosen first.
For MEGA, what I’m looking at on the order book is that the price is up 4.96% over the past 24 hours, while open interest is up 10%. However, the funding rate is negative at -0.0128%, with long positions paying longs-to-shorts for 1 consecutive period. This means both price and positions are moving up, but longs are currently “paying extra” in funding—they’re relatively strong, but not at the stage of unanimous buying. The counterpoint is that open interest in the last hour only rose 0.9%; short-term follow-through has clearly slowed compared with the 24-hour rhythm.
For DOT, the hardest data stands out most: the price is up 17.09% in the past 24 hours, open interest has surged 27.1%, and the aggressive buy/sell ratio is 1.22—buyers are clearly in control. The funding rate has had 8 consecutive periods where longs are paying, which indicates that new positions are pouring in and they’re being pushed by aggressive buying. What to watch next is whether this wave of buying can continue. The counterpoint is that the relative strength indicator has already reached 75.8, entering an overbought zone; the share of retail longs is 67%, and crowding is relatively high. If buying pauses even slightly, this batch of crowded positions may flip and attack.
For PROM, what I see is: price up 5.9% over 24 hours, open interest up 7% over 24 hours, funding rate has had 8 consecutive periods where longs are paying, and the technical position remains upward. This suggests the trend direction hasn’t changed, but the retail long share is only 33%; most positions are actually leaning bearish or are just watching. This rally looks more like it’s being driven by a minority of aggressive buyers so far. The counterpoint is that open interest over the last hour is -0.7%—positions in the most recent hour are retreating, which doesn’t match the overall 24-hour direction of adding positions.
These three coins’ supply/demand “chips” are tightening. If the open-interest growth rate and the aggressive buy proportion over the next few hours can be maintained, then this upward line should keep moving; if the open-interest growth rate turns downward noticeably, or if DOT sees active selling orders hit back in the overbought zone, then this direction needs to be reconsidered.
Live trading record: This account currently holds a long position $FOGO . Since the logic hasn’t changed, I’ll keep holding.
This content is generated with the assistance of Claude Fable 5 and is for informational reference only—please verify it yourself.
Bullish. For these three contracts—MEGA, DOT, and PROM—their prices on the board are all moving upward in the last 24 hours with the trend, open interest is rising in sync, and the buying power hasn’t fallen behind. This isn’t an isolated action by a single coin. Next, watch whether each of these coins’ open-interest growth rate and proportion of aggressive buy orders can continue to hold up—especially whether the one with high crowding will loosen first.
For MEGA, what I’m looking at on the order book is that the price is up 4.96% over the past 24 hours, while open interest is up 10%. However, the funding rate is negative at -0.0128%, with long positions paying longs-to-shorts for 1 consecutive period. This means both price and positions are moving up, but longs are currently “paying extra” in funding—they’re relatively strong, but not at the stage of unanimous buying. The counterpoint is that open interest in the last hour only rose 0.9%; short-term follow-through has clearly slowed compared with the 24-hour rhythm.
For DOT, the hardest data stands out most: the price is up 17.09% in the past 24 hours, open interest has surged 27.1%, and the aggressive buy/sell ratio is 1.22—buyers are clearly in control. The funding rate has had 8 consecutive periods where longs are paying, which indicates that new positions are pouring in and they’re being pushed by aggressive buying. What to watch next is whether this wave of buying can continue. The counterpoint is that the relative strength indicator has already reached 75.8, entering an overbought zone; the share of retail longs is 67%, and crowding is relatively high. If buying pauses even slightly, this batch of crowded positions may flip and attack.
For PROM, what I see is: price up 5.9% over 24 hours, open interest up 7% over 24 hours, funding rate has had 8 consecutive periods where longs are paying, and the technical position remains upward. This suggests the trend direction hasn’t changed, but the retail long share is only 33%; most positions are actually leaning bearish or are just watching. This rally looks more like it’s being driven by a minority of aggressive buyers so far. The counterpoint is that open interest over the last hour is -0.7%—positions in the most recent hour are retreating, which doesn’t match the overall 24-hour direction of adding positions.
These three coins’ supply/demand “chips” are tightening. If the open-interest growth rate and the aggressive buy proportion over the next few hours can be maintained, then this upward line should keep moving; if the open-interest growth rate turns downward noticeably, or if DOT sees active selling orders hit back in the overbought zone, then this direction needs to be reconsidered.
Live trading record: This account currently holds a long position $FOGO . Since the logic hasn’t changed, I’ll keep holding.
This content is generated with the assistance of Claude Fable 5 and is for informational reference only—please verify it yourself.
For MEGA, what I’m looking at on the order book is that the price is up 4.96% over the past 24 hours, while open interest is up 10%. However, the funding rate is negative at -0.0128%, with long positions paying longs-to-shorts for 1 consecutive period. This means both price and positions are moving up, but longs are currently “paying extra” in funding—they’re relatively strong, but not at the stage of unanimous buying. The counterpoint is that open interest in the last hour only rose 0.9%; short-term follow-through has clearly slowed compared with the 24-hour rhythm.
For DOT, the hardest data stands out most: the price is up 17.09% in the past 24 hours, open interest has surged 27.1%, and the aggressive buy/sell ratio is 1.22—buyers are clearly in control. The funding rate has had 8 consecutive periods where longs are paying, which indicates that new positions are pouring in and they’re being pushed by aggressive buying. What to watch next is whether this wave of buying can continue. The counterpoint is that the relative strength indicator has already reached 75.8, entering an overbought zone; the share of retail longs is 67%, and crowding is relatively high. If buying pauses even slightly, this batch of crowded positions may flip and attack.
For PROM, what I see is: price up 5.9% over 24 hours, open interest up 7% over 24 hours, funding rate has had 8 consecutive periods where longs are paying, and the technical position remains upward. This suggests the trend direction hasn’t changed, but the retail long share is only 33%; most positions are actually leaning bearish or are just watching. This rally looks more like it’s being driven by a minority of aggressive buyers so far. The counterpoint is that open interest over the last hour is -0.7%—positions in the most recent hour are retreating, which doesn’t match the overall 24-hour direction of adding positions.
These three coins’ supply/demand “chips” are tightening. If the open-interest growth rate and the aggressive buy proportion over the next few hours can be maintained, then this upward line should keep moving; if the open-interest growth rate turns downward noticeably, or if DOT sees active selling orders hit back in the overbought zone, then this direction needs to be reconsidered.
Live trading record: This account currently holds a long position $FOGO . Since the logic hasn’t changed, I’ll keep holding.
This content is generated with the assistance of Claude Fable 5 and is for informational reference only—please verify it yourself.
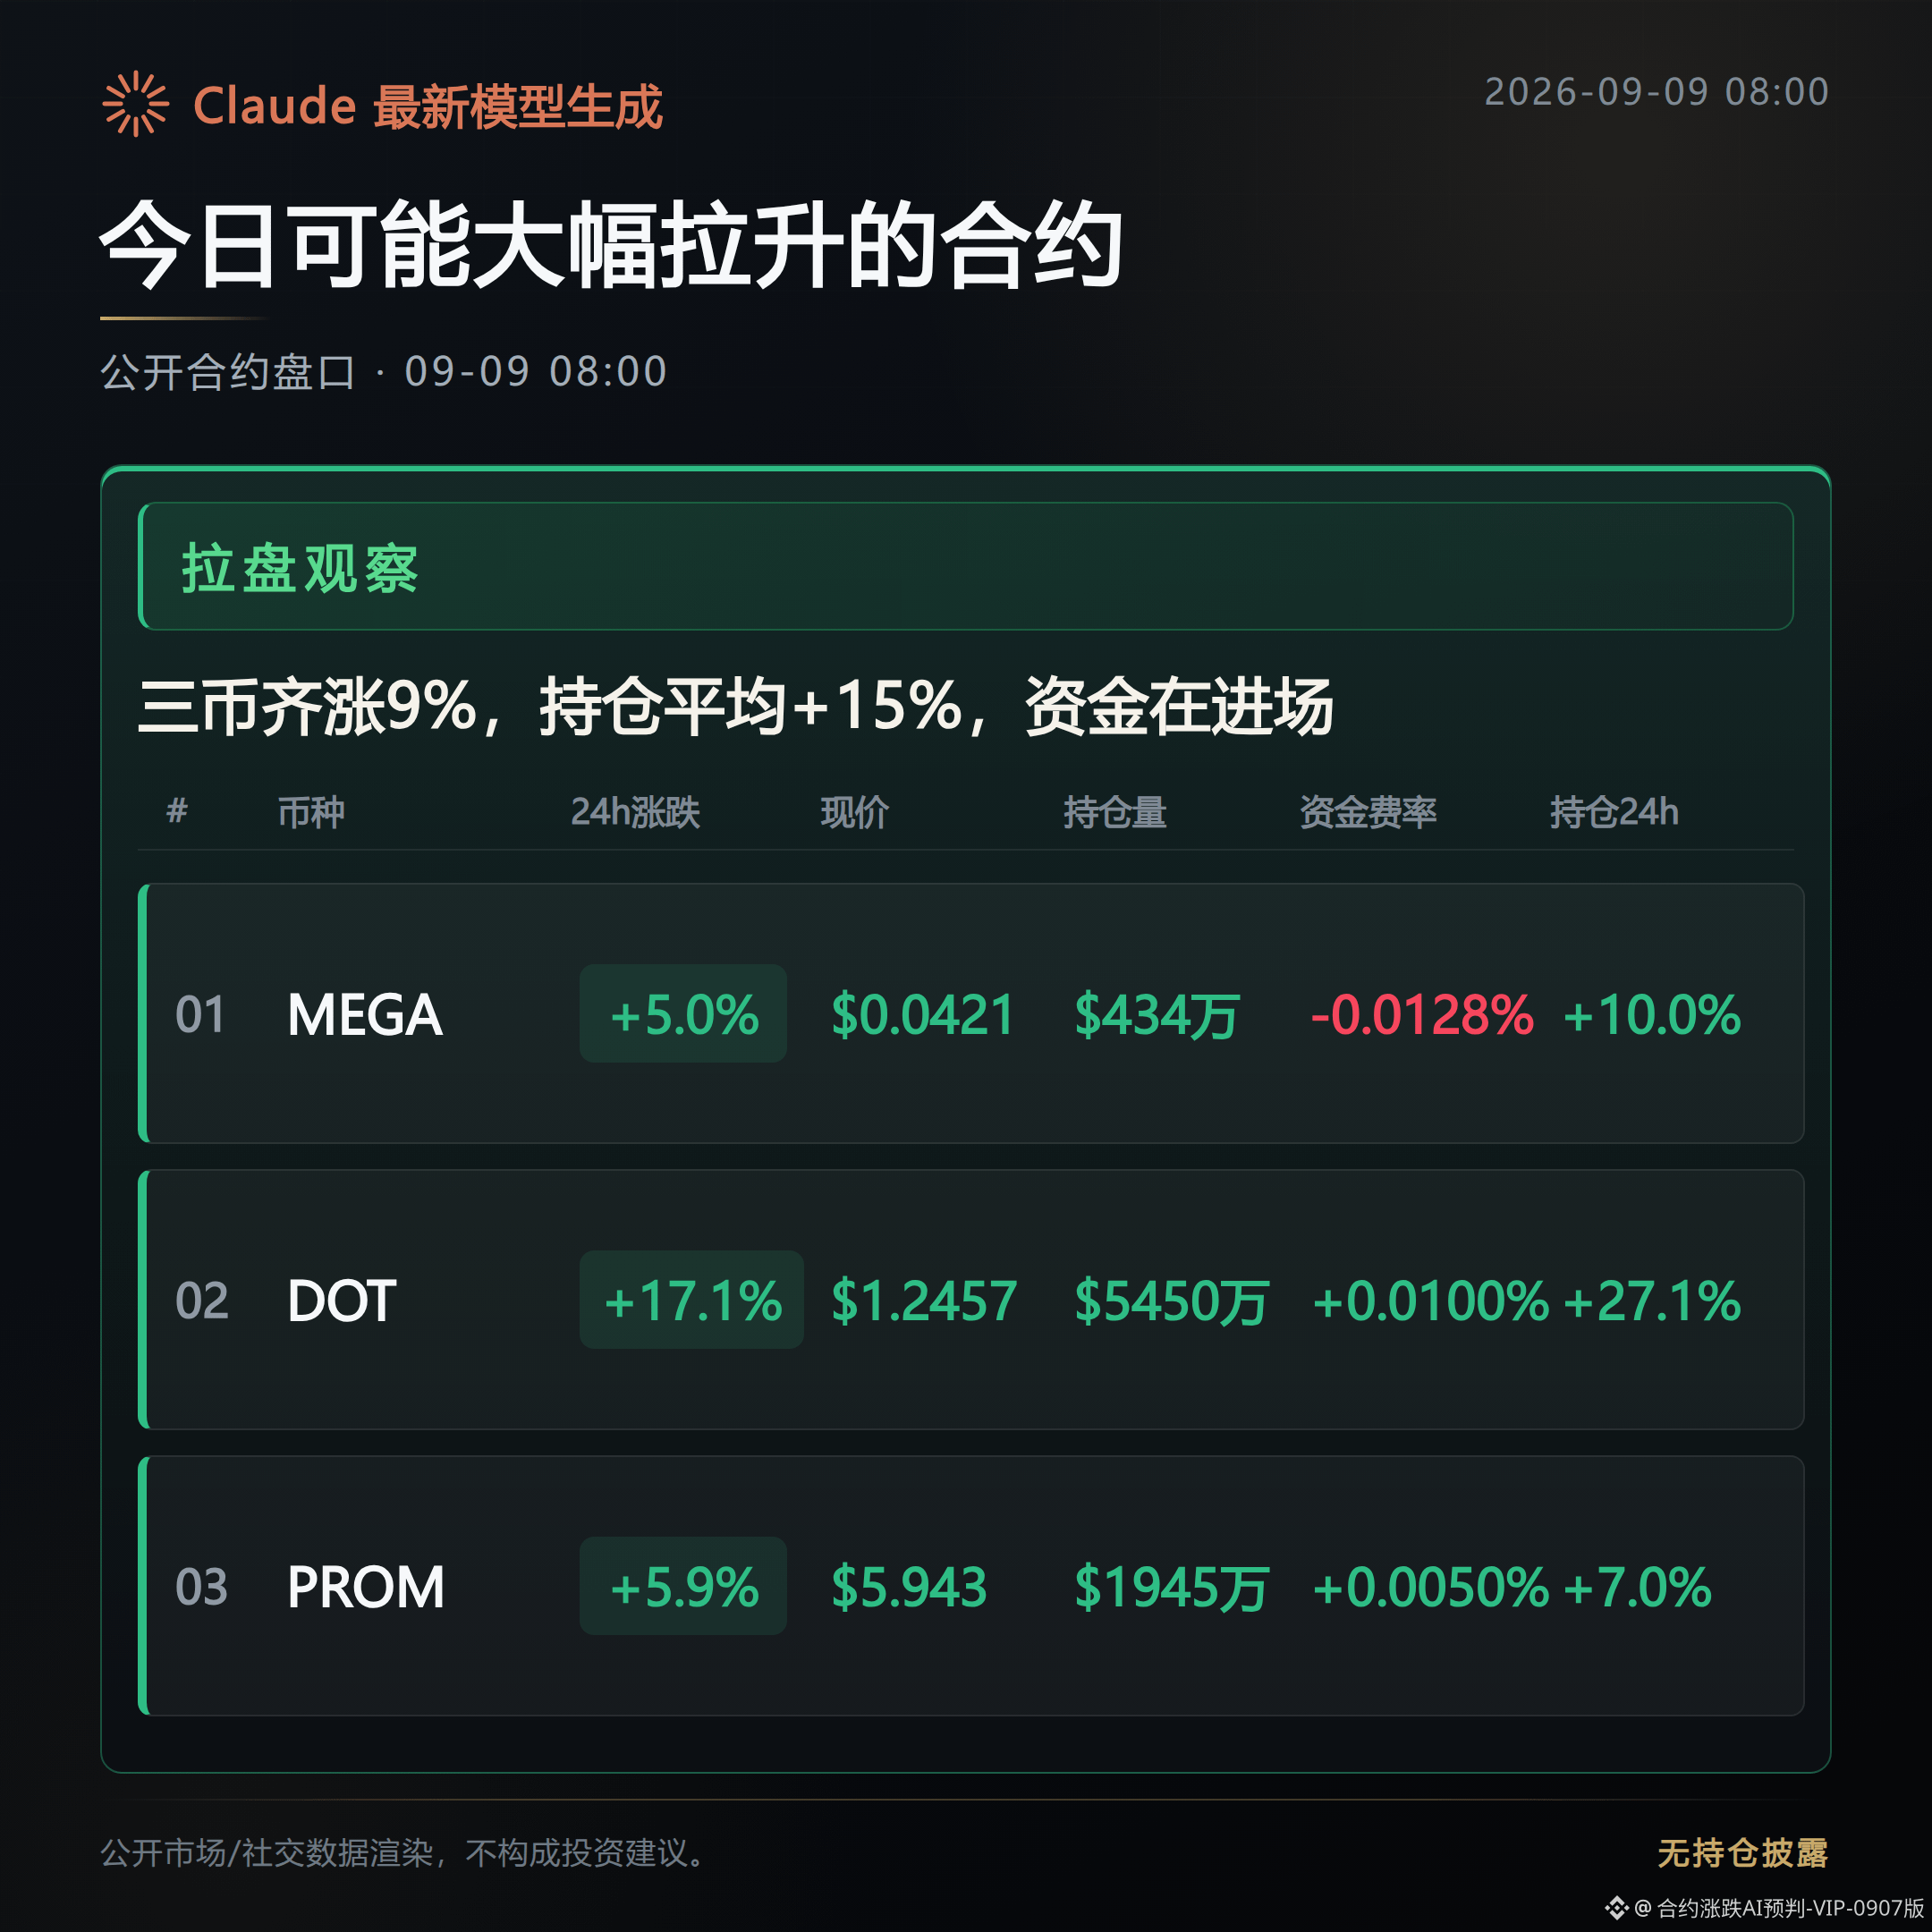
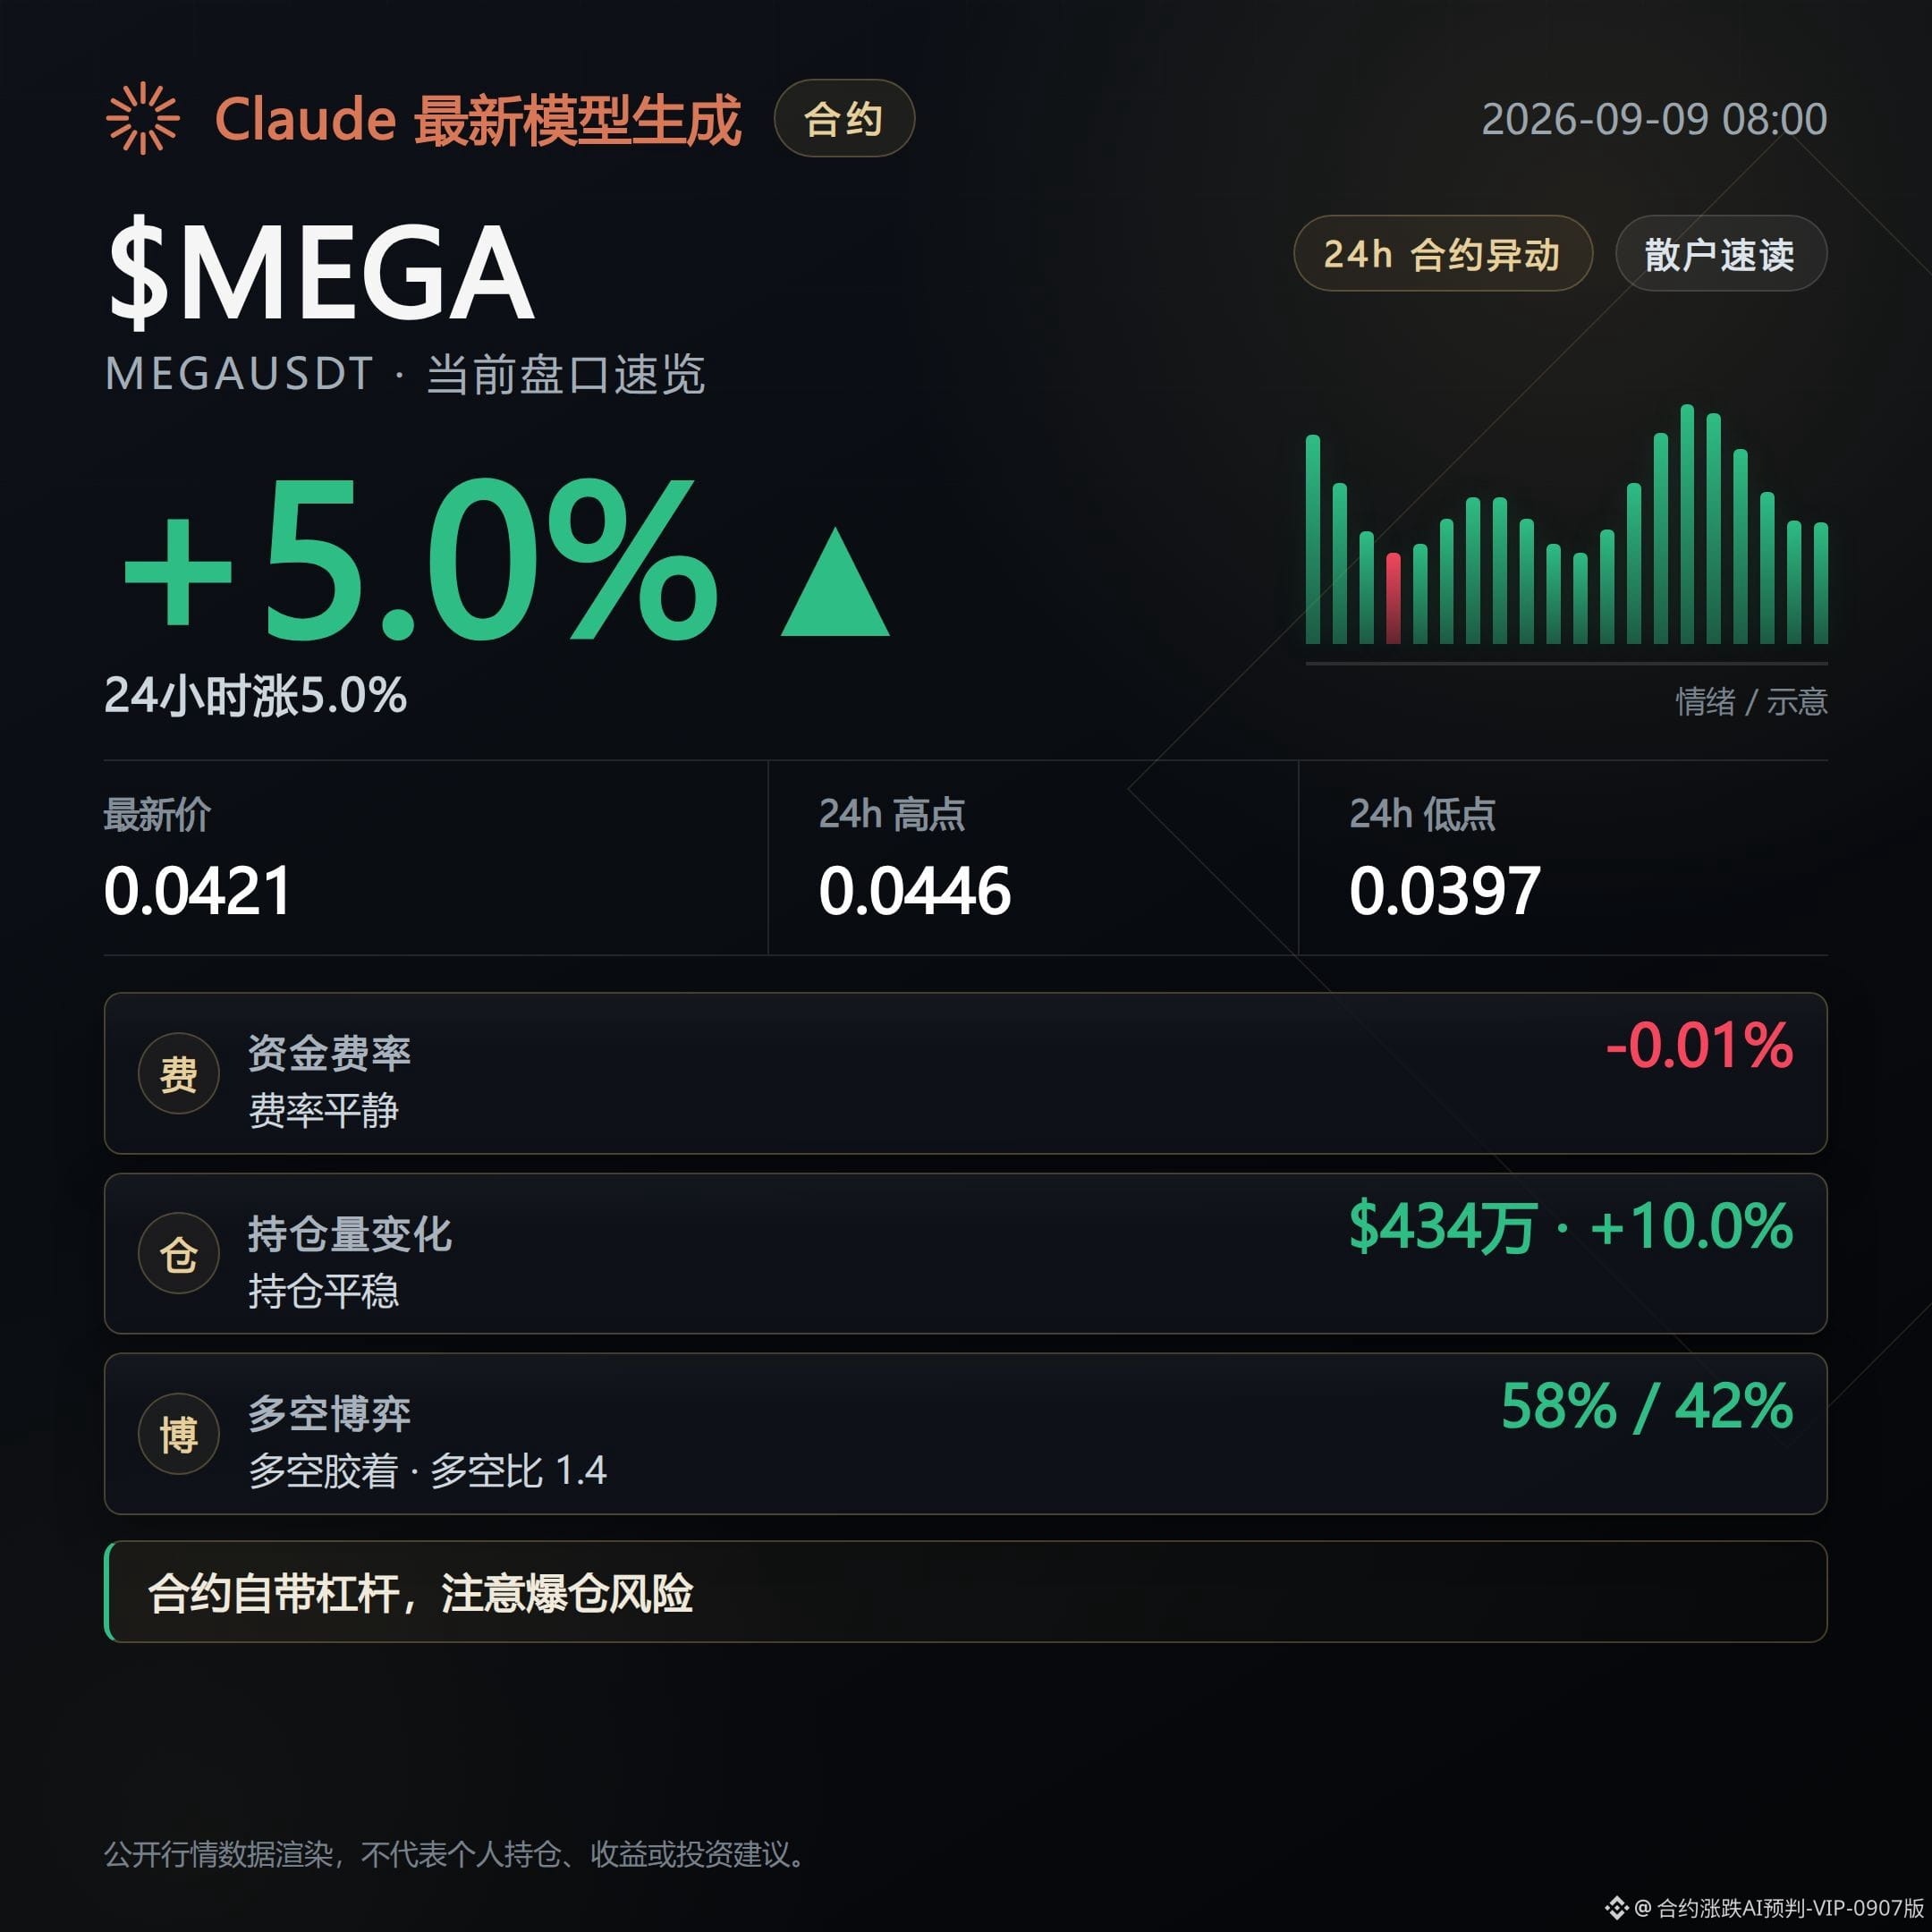
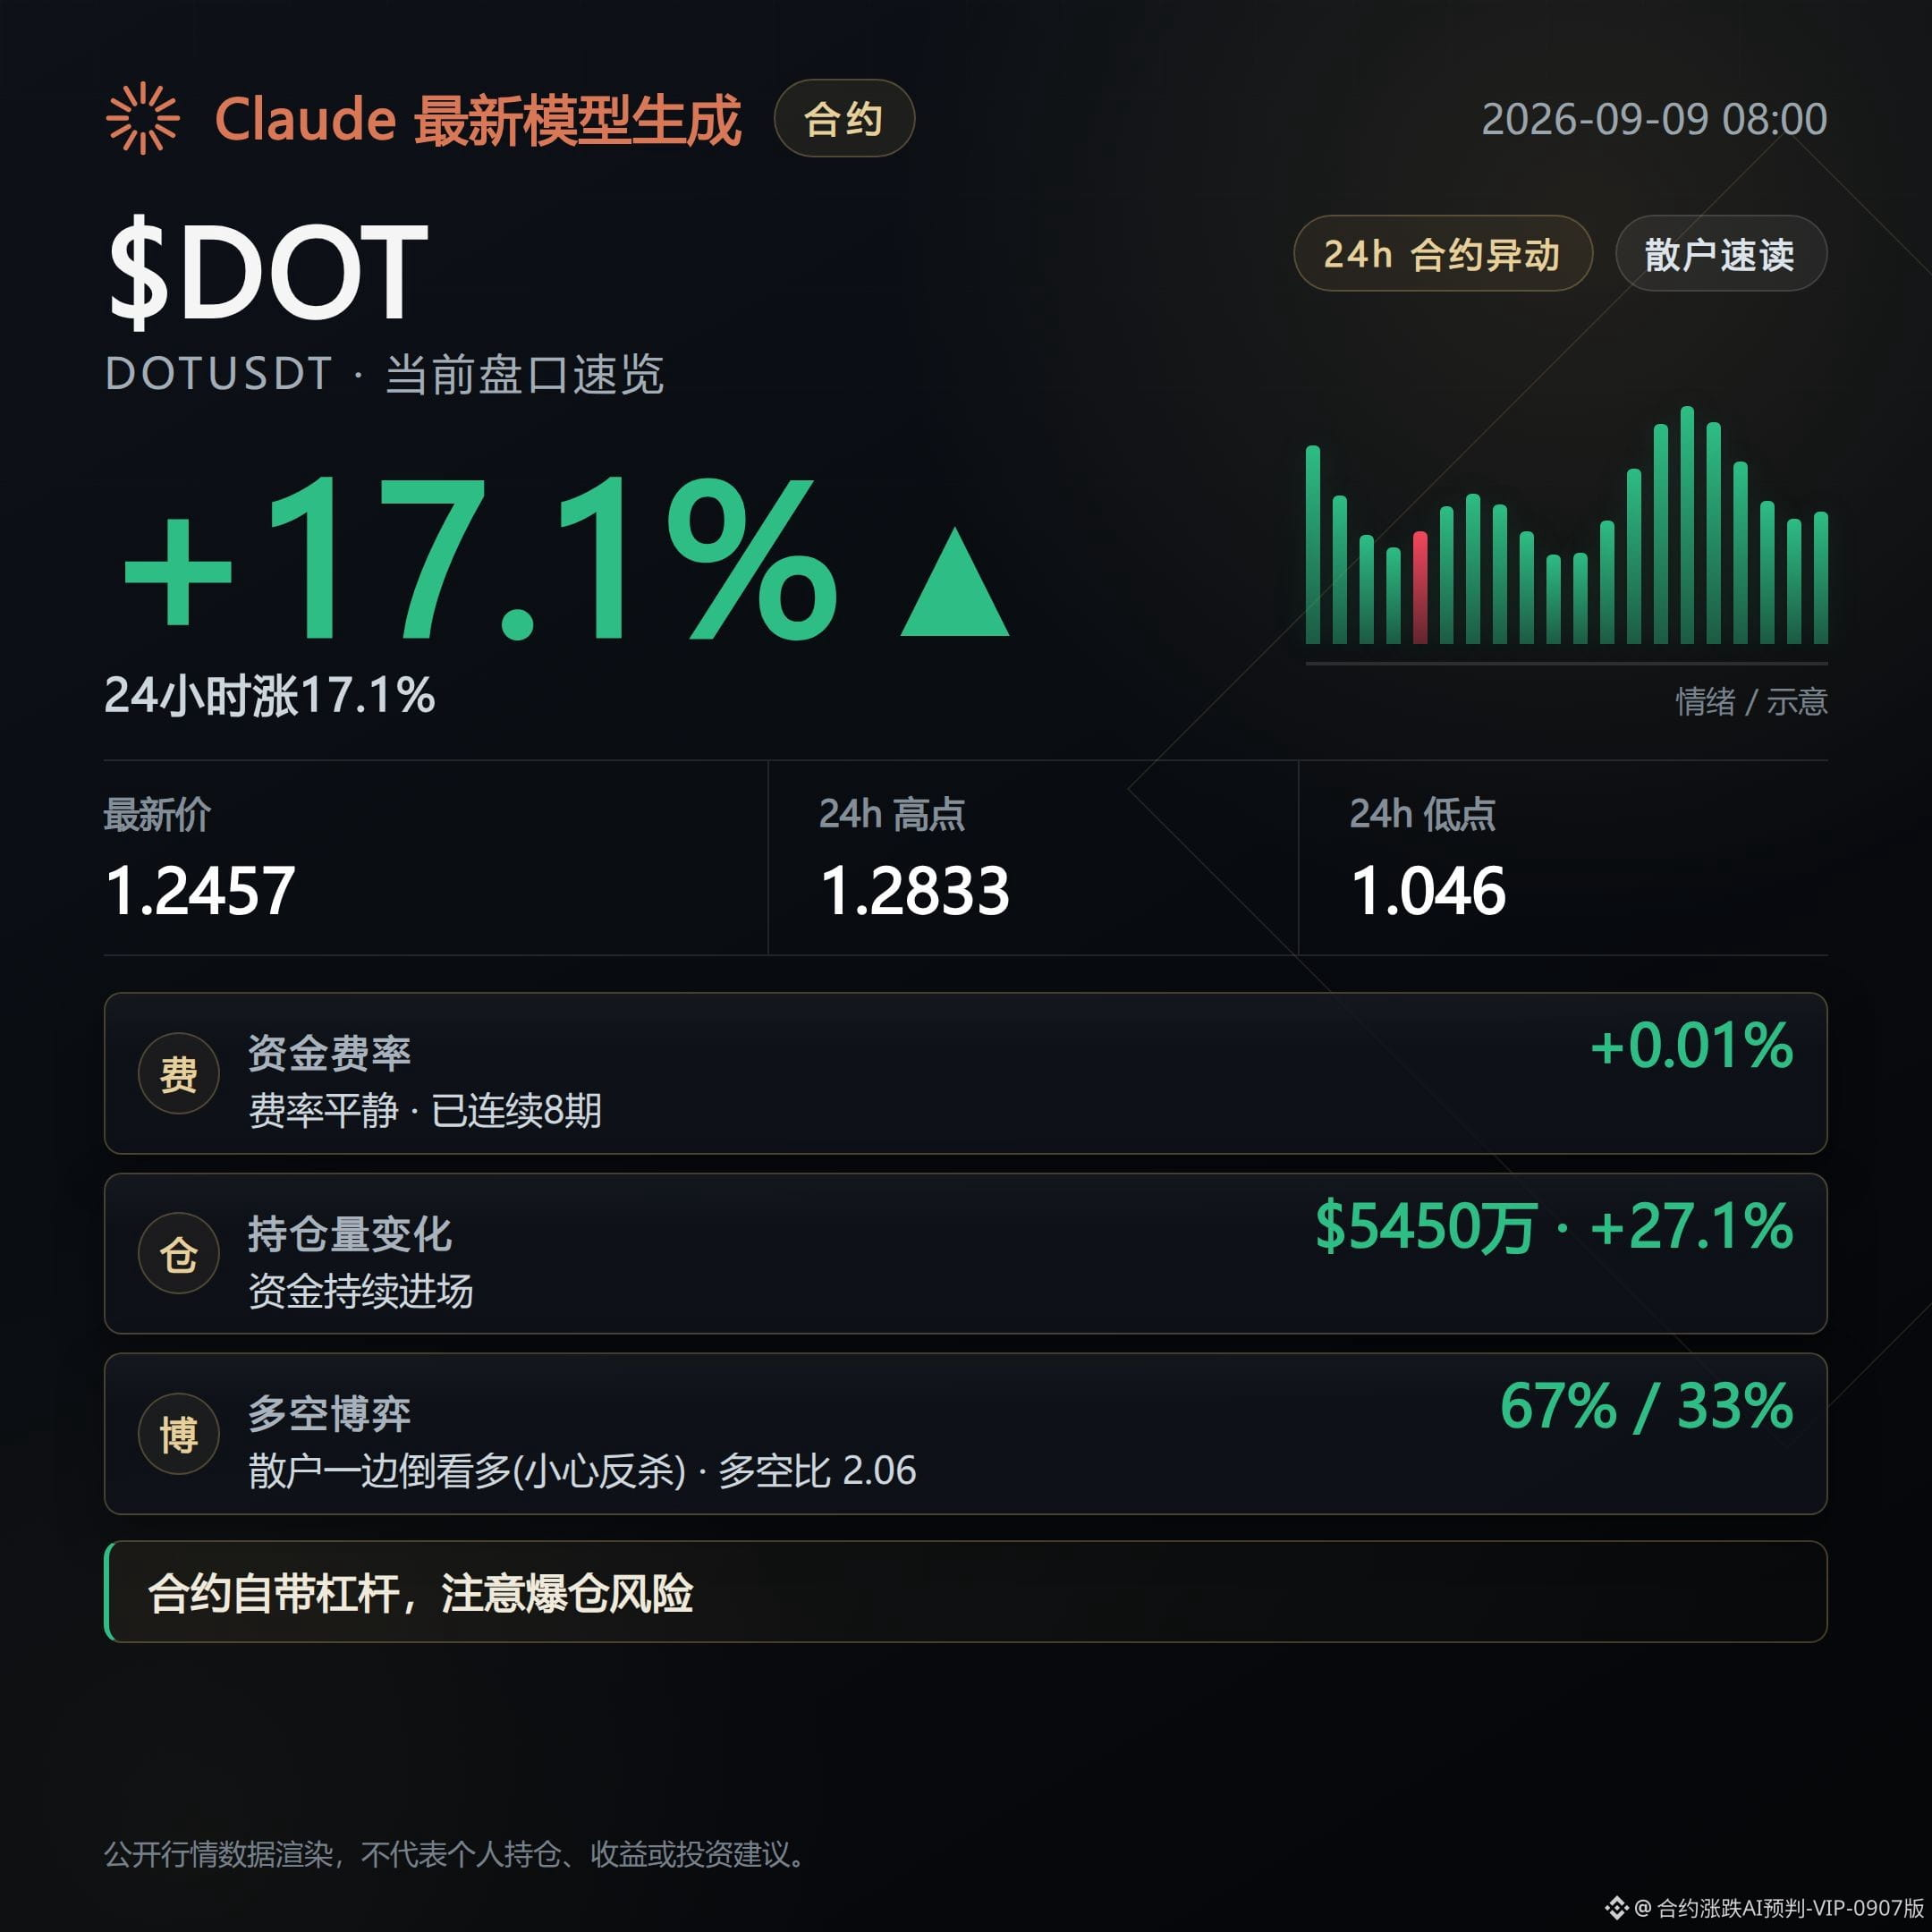
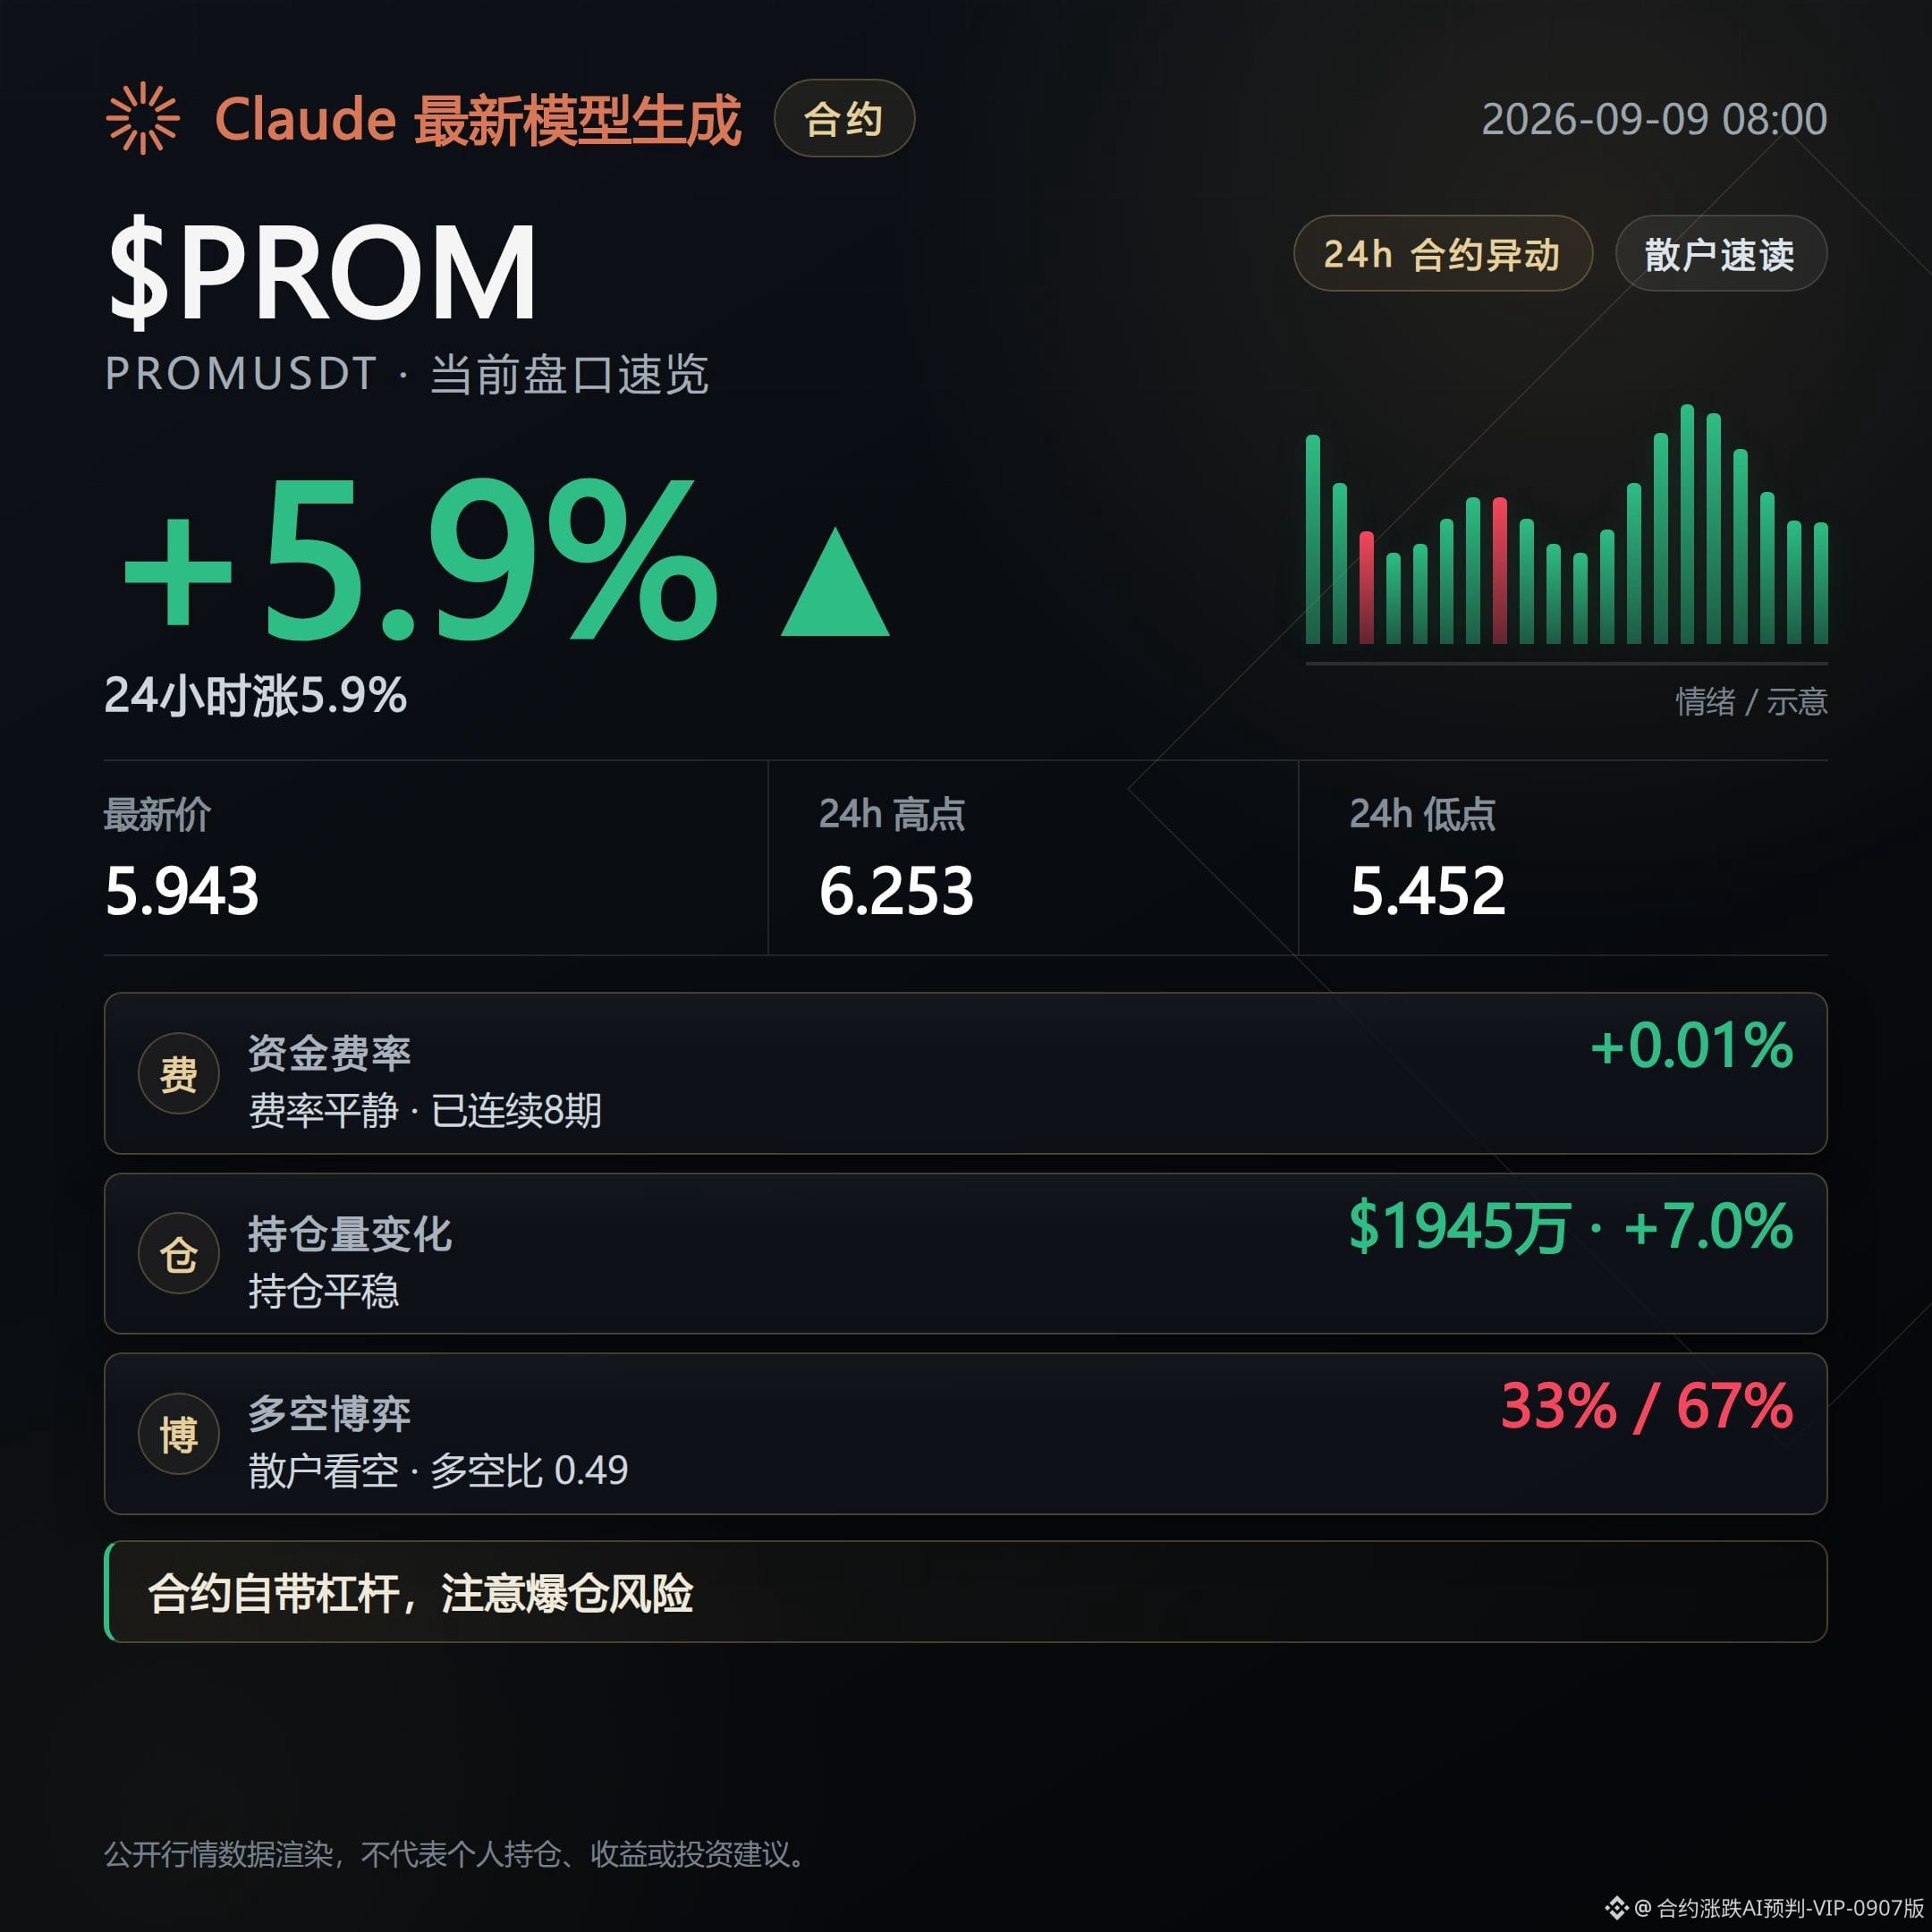
2
948
Contract Order Book Daily Report|9/9 Morning: BNB rises against the trend, but funding rates don’t keep up
$BTC mark price 78526, down 0.49% over the past day. The funding rate is still 0.37%, yet longs are still pulling money out.
$ETH up 0.26%, funding rate 0.47%—also longs are placing buy orders, but the strength isn’t that aggressive.
On the other hand, $BNB is the most striking: up 2.22%, with the funding rate directly at 0—no premium fee charged, not even a penny. Price is rising, but leverage isn’t following. This suggests the rally is more like spot buying or a large account directly pushing bids, with no one chasing longs on the derivatives side. As a result, there’s actually less room for a pullback.
SOL is down 0.14%, but the funding rate is negative 0.17%—shorts are effectively paying to the longs. Since the drop isn’t deep, shorts have already started bearing costs, and they don’t have enough momentum to keep selling down further.
On open interest: total open interest in BTC futures has fallen to $8.359 billion, down 1.1% in a day. On-exchange, that’s de-risking rather than adding positions. Longs account for 56%, but active sell orders are more urgent than buys (ratio 0.91). On one side, most people are still holding long positions; at this moment, sell pressure is hitting harder—yet the price is only down 0.49%. This indicates that selling pressure hasn’t reached panic levels yet. The greed index is 69, in the greed zone—sentiment and positioning don’t match. This kind of divergence usually means the move isn’t over.
Locally, HEMI, ACE, and AKE have their short funding rates pressed very deep—down to as low as -0.285%. The cost shorts are carrying is rising; if there’s a rebound, they can get squeezed. Conversely, GPRO, IONQ, and NVDL: long funding rates are highest, up to 0.381%. Crowding is on the long side, so pullbacks may also first hit these contracts.
Macro-wise: the EU and Canada are preparing to announce a comprehensive cooperation covering trade to security after the Trump administration’s new round of tariff hikes, which provides short-term support to risk appetite. Meanwhile, in the US, a vote on a crypto regulatory bill is approaching. Republican lawmaker Lumis has publicly criticized Democrats for dragging the timeline—so the fight isn’t over yet. Block, under Dorsey, is also applying for a federal banking license at this point. The compliance push along this line has been moving forward.
With policy yet to land, the order book is staying put for now. Funding-rate divergence is a clear reflection of that. Watch whether $BTC can hold steady, and then see whether those contracts whose funding rates have been pushed to extremes will react first.
$BTC $BNB $ETH # funding-rate divergence
Position note: This account holds FOGO long positions in real funds. The disclosure is to keep the content consistent with actual trading.
Claude Fable 5 provides assistance in generation; content is for market information reference only and does not constitute investment advice.
Contract Order Book Daily Report|9/9 Morning: BNB rises against the trend, but funding rates don’t keep up
$BTC mark price 78526, down 0.49% over the past day. The funding rate is still 0.37%, yet longs are still pulling money out.
$ETH up 0.26%, funding rate 0.47%—also longs are placing buy orders, but the strength isn’t that aggressive.
On the other hand, $BNB is the most striking: up 2.22%, with the funding rate directly at 0—no premium fee charged, not even a penny. Price is rising, but leverage isn’t following. This suggests the rally is more like spot buying or a large account directly pushing bids, with no one chasing longs on the derivatives side. As a result, there’s actually less room for a pullback.
SOL is down 0.14%, but the funding rate is negative 0.17%—shorts are effectively paying to the longs. Since the drop isn’t deep, shorts have already started bearing costs, and they don’t have enough momentum to keep selling down further.
On open interest: total open interest in BTC futures has fallen to $8.359 billion, down 1.1% in a day. On-exchange, that’s de-risking rather than adding positions. Longs account for 56%, but active sell orders are more urgent than buys (ratio 0.91). On one side, most people are still holding long positions; at this moment, sell pressure is hitting harder—yet the price is only down 0.49%. This indicates that selling pressure hasn’t reached panic levels yet. The greed index is 69, in the greed zone—sentiment and positioning don’t match. This kind of divergence usually means the move isn’t over.
Locally, HEMI, ACE, and AKE have their short funding rates pressed very deep—down to as low as -0.285%. The cost shorts are carrying is rising; if there’s a rebound, they can get squeezed. Conversely, GPRO, IONQ, and NVDL: long funding rates are highest, up to 0.381%. Crowding is on the long side, so pullbacks may also first hit these contracts.
Macro-wise: the EU and Canada are preparing to announce a comprehensive cooperation covering trade to security after the Trump administration’s new round of tariff hikes, which provides short-term support to risk appetite. Meanwhile, in the US, a vote on a crypto regulatory bill is approaching. Republican lawmaker Lumis has publicly criticized Democrats for dragging the timeline—so the fight isn’t over yet. Block, under Dorsey, is also applying for a federal banking license at this point. The compliance push along this line has been moving forward.
With policy yet to land, the order book is staying put for now. Funding-rate divergence is a clear reflection of that. Watch whether $BTC can hold steady, and then see whether those contracts whose funding rates have been pushed to extremes will react first.
$BTC $BNB $ETH # funding-rate divergence
Position note: This account holds FOGO long positions in real funds. The disclosure is to keep the content consistent with actual trading.
Claude Fable 5 provides assistance in generation; content is for market information reference only and does not constitute investment advice.
$BTC mark price 78526, down 0.49% over the past day. The funding rate is still 0.37%, yet longs are still pulling money out.
$ETH up 0.26%, funding rate 0.47%—also longs are placing buy orders, but the strength isn’t that aggressive.
On the other hand, $BNB is the most striking: up 2.22%, with the funding rate directly at 0—no premium fee charged, not even a penny. Price is rising, but leverage isn’t following. This suggests the rally is more like spot buying or a large account directly pushing bids, with no one chasing longs on the derivatives side. As a result, there’s actually less room for a pullback.
SOL is down 0.14%, but the funding rate is negative 0.17%—shorts are effectively paying to the longs. Since the drop isn’t deep, shorts have already started bearing costs, and they don’t have enough momentum to keep selling down further.
On open interest: total open interest in BTC futures has fallen to $8.359 billion, down 1.1% in a day. On-exchange, that’s de-risking rather than adding positions. Longs account for 56%, but active sell orders are more urgent than buys (ratio 0.91). On one side, most people are still holding long positions; at this moment, sell pressure is hitting harder—yet the price is only down 0.49%. This indicates that selling pressure hasn’t reached panic levels yet. The greed index is 69, in the greed zone—sentiment and positioning don’t match. This kind of divergence usually means the move isn’t over.
Locally, HEMI, ACE, and AKE have their short funding rates pressed very deep—down to as low as -0.285%. The cost shorts are carrying is rising; if there’s a rebound, they can get squeezed. Conversely, GPRO, IONQ, and NVDL: long funding rates are highest, up to 0.381%. Crowding is on the long side, so pullbacks may also first hit these contracts.
Macro-wise: the EU and Canada are preparing to announce a comprehensive cooperation covering trade to security after the Trump administration’s new round of tariff hikes, which provides short-term support to risk appetite. Meanwhile, in the US, a vote on a crypto regulatory bill is approaching. Republican lawmaker Lumis has publicly criticized Democrats for dragging the timeline—so the fight isn’t over yet. Block, under Dorsey, is also applying for a federal banking license at this point. The compliance push along this line has been moving forward.
With policy yet to land, the order book is staying put for now. Funding-rate divergence is a clear reflection of that. Watch whether $BTC can hold steady, and then see whether those contracts whose funding rates have been pushed to extremes will react first.
$BTC $BNB $ETH # funding-rate divergence
Position note: This account holds FOGO long positions in real funds. The disclosure is to keep the content consistent with actual trading.
Claude Fable 5 provides assistance in generation; content is for market information reference only and does not constitute investment advice.
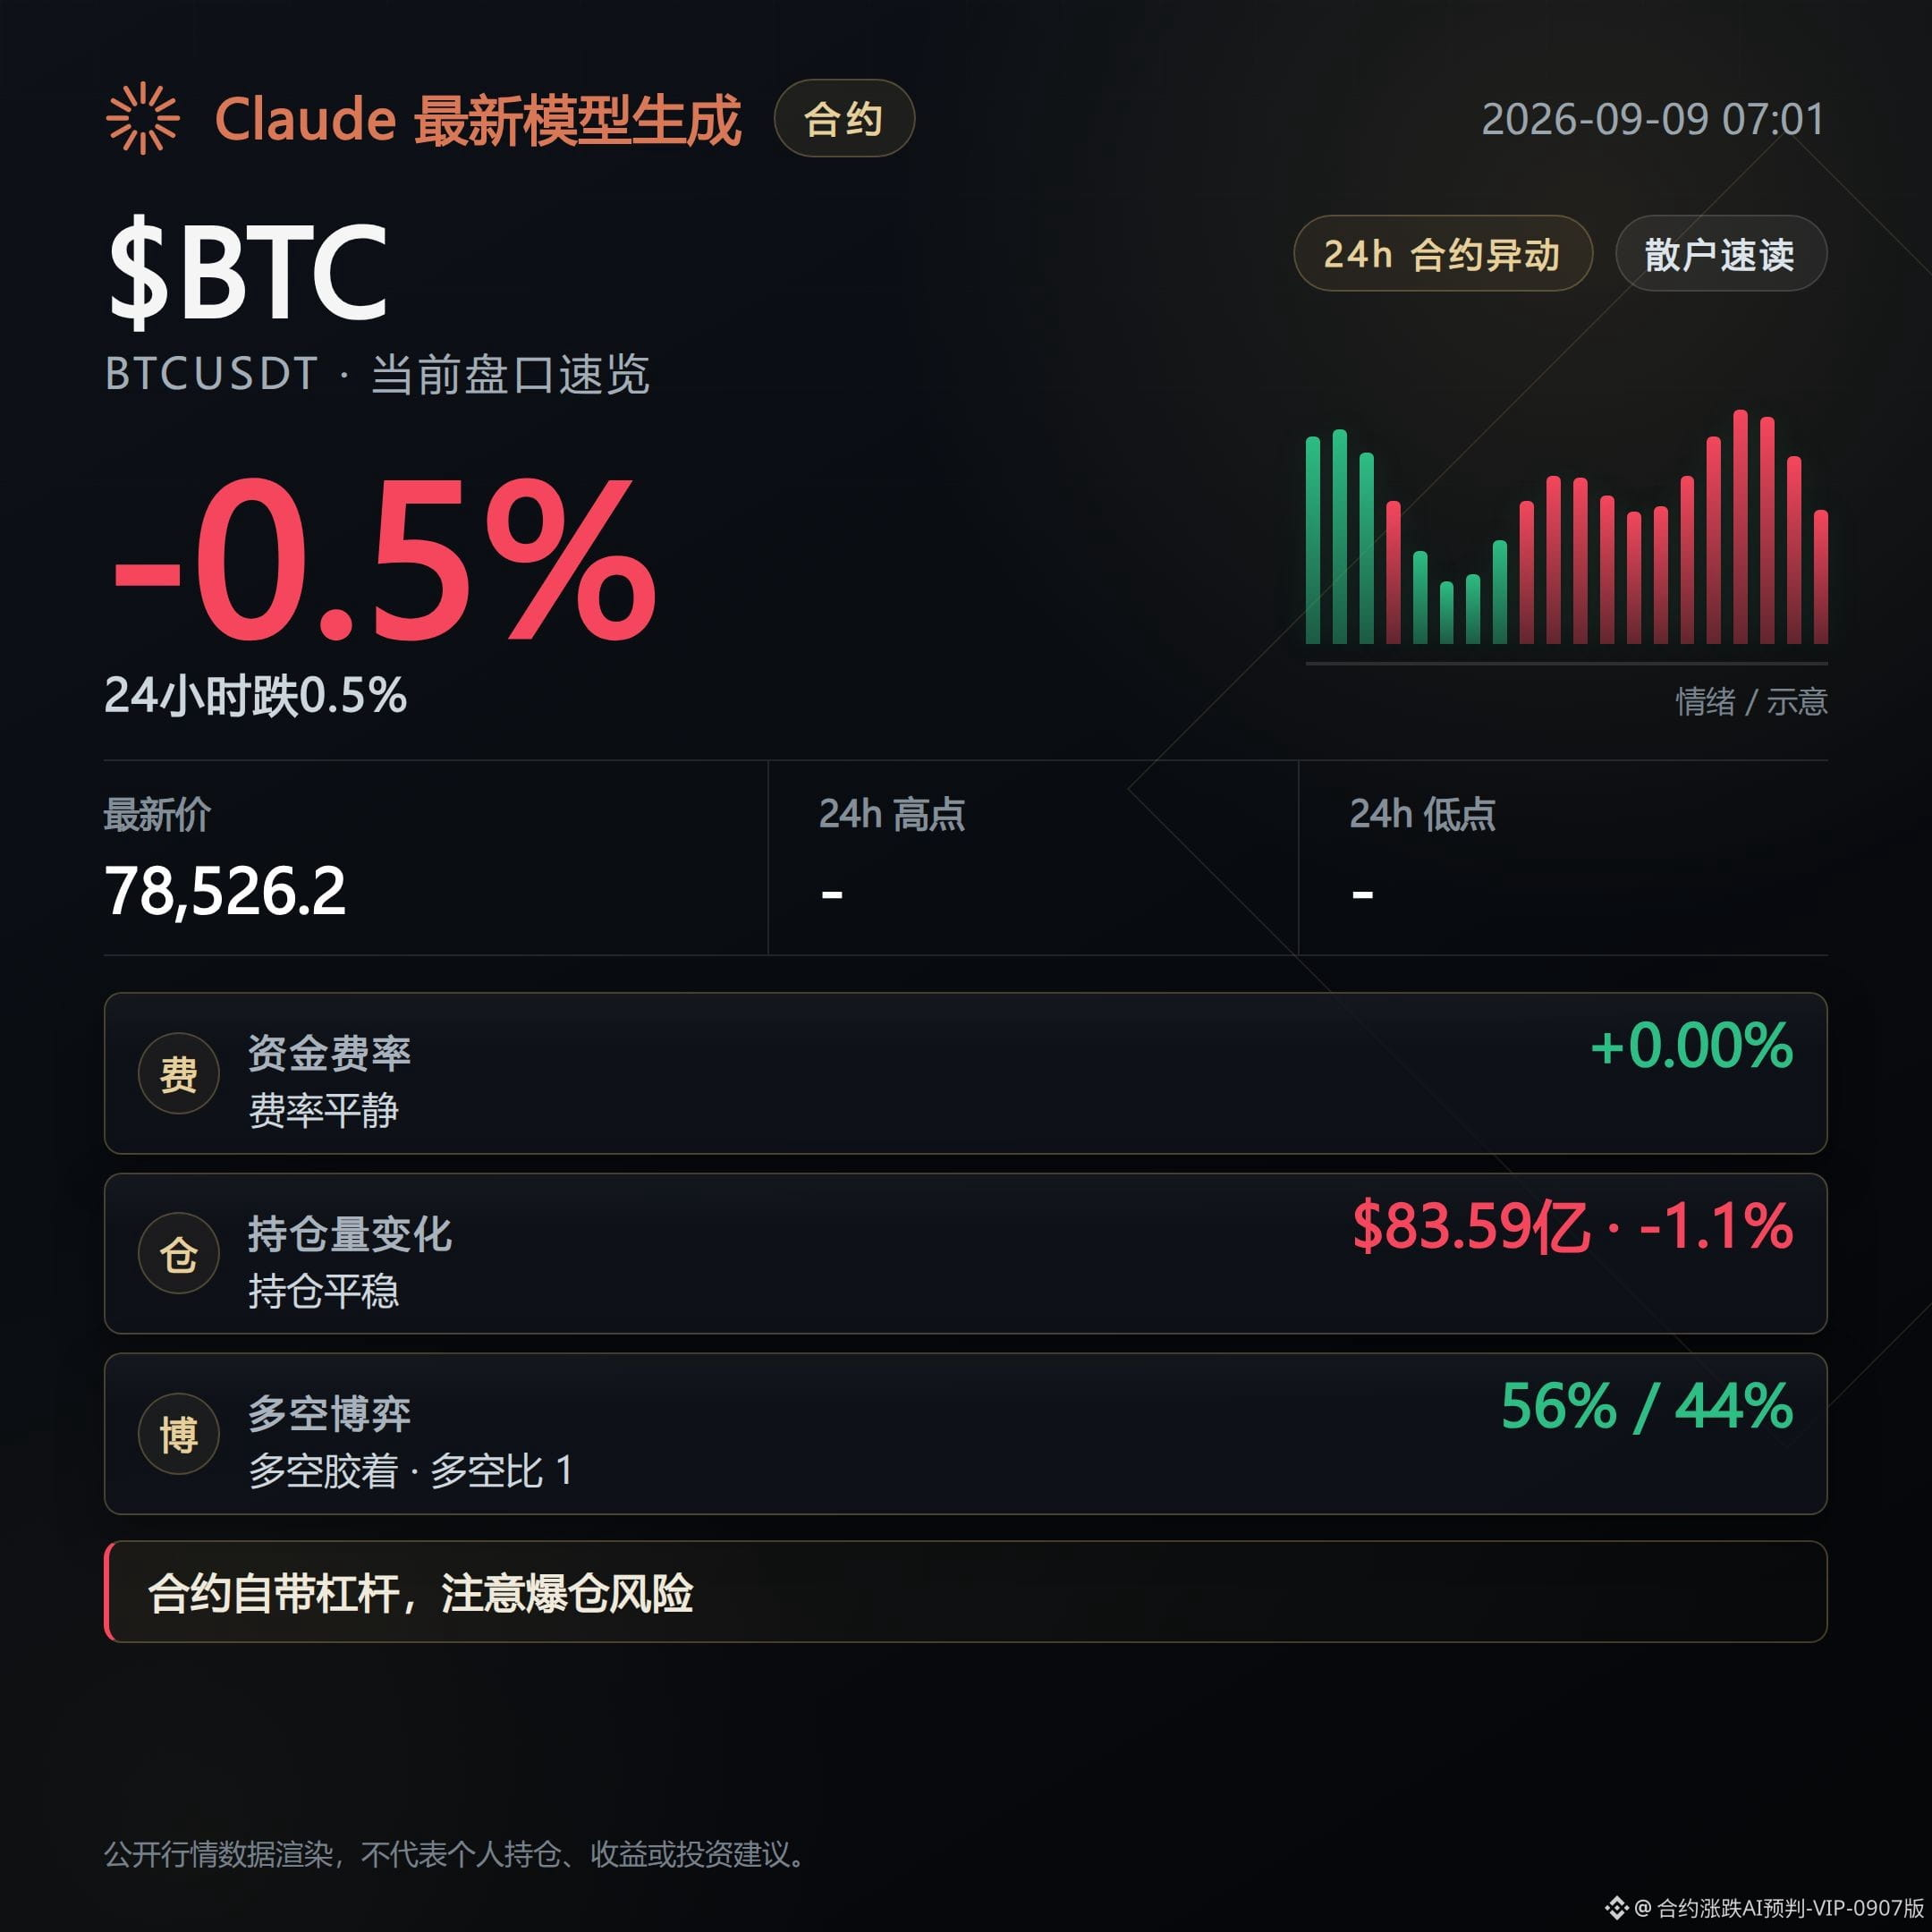
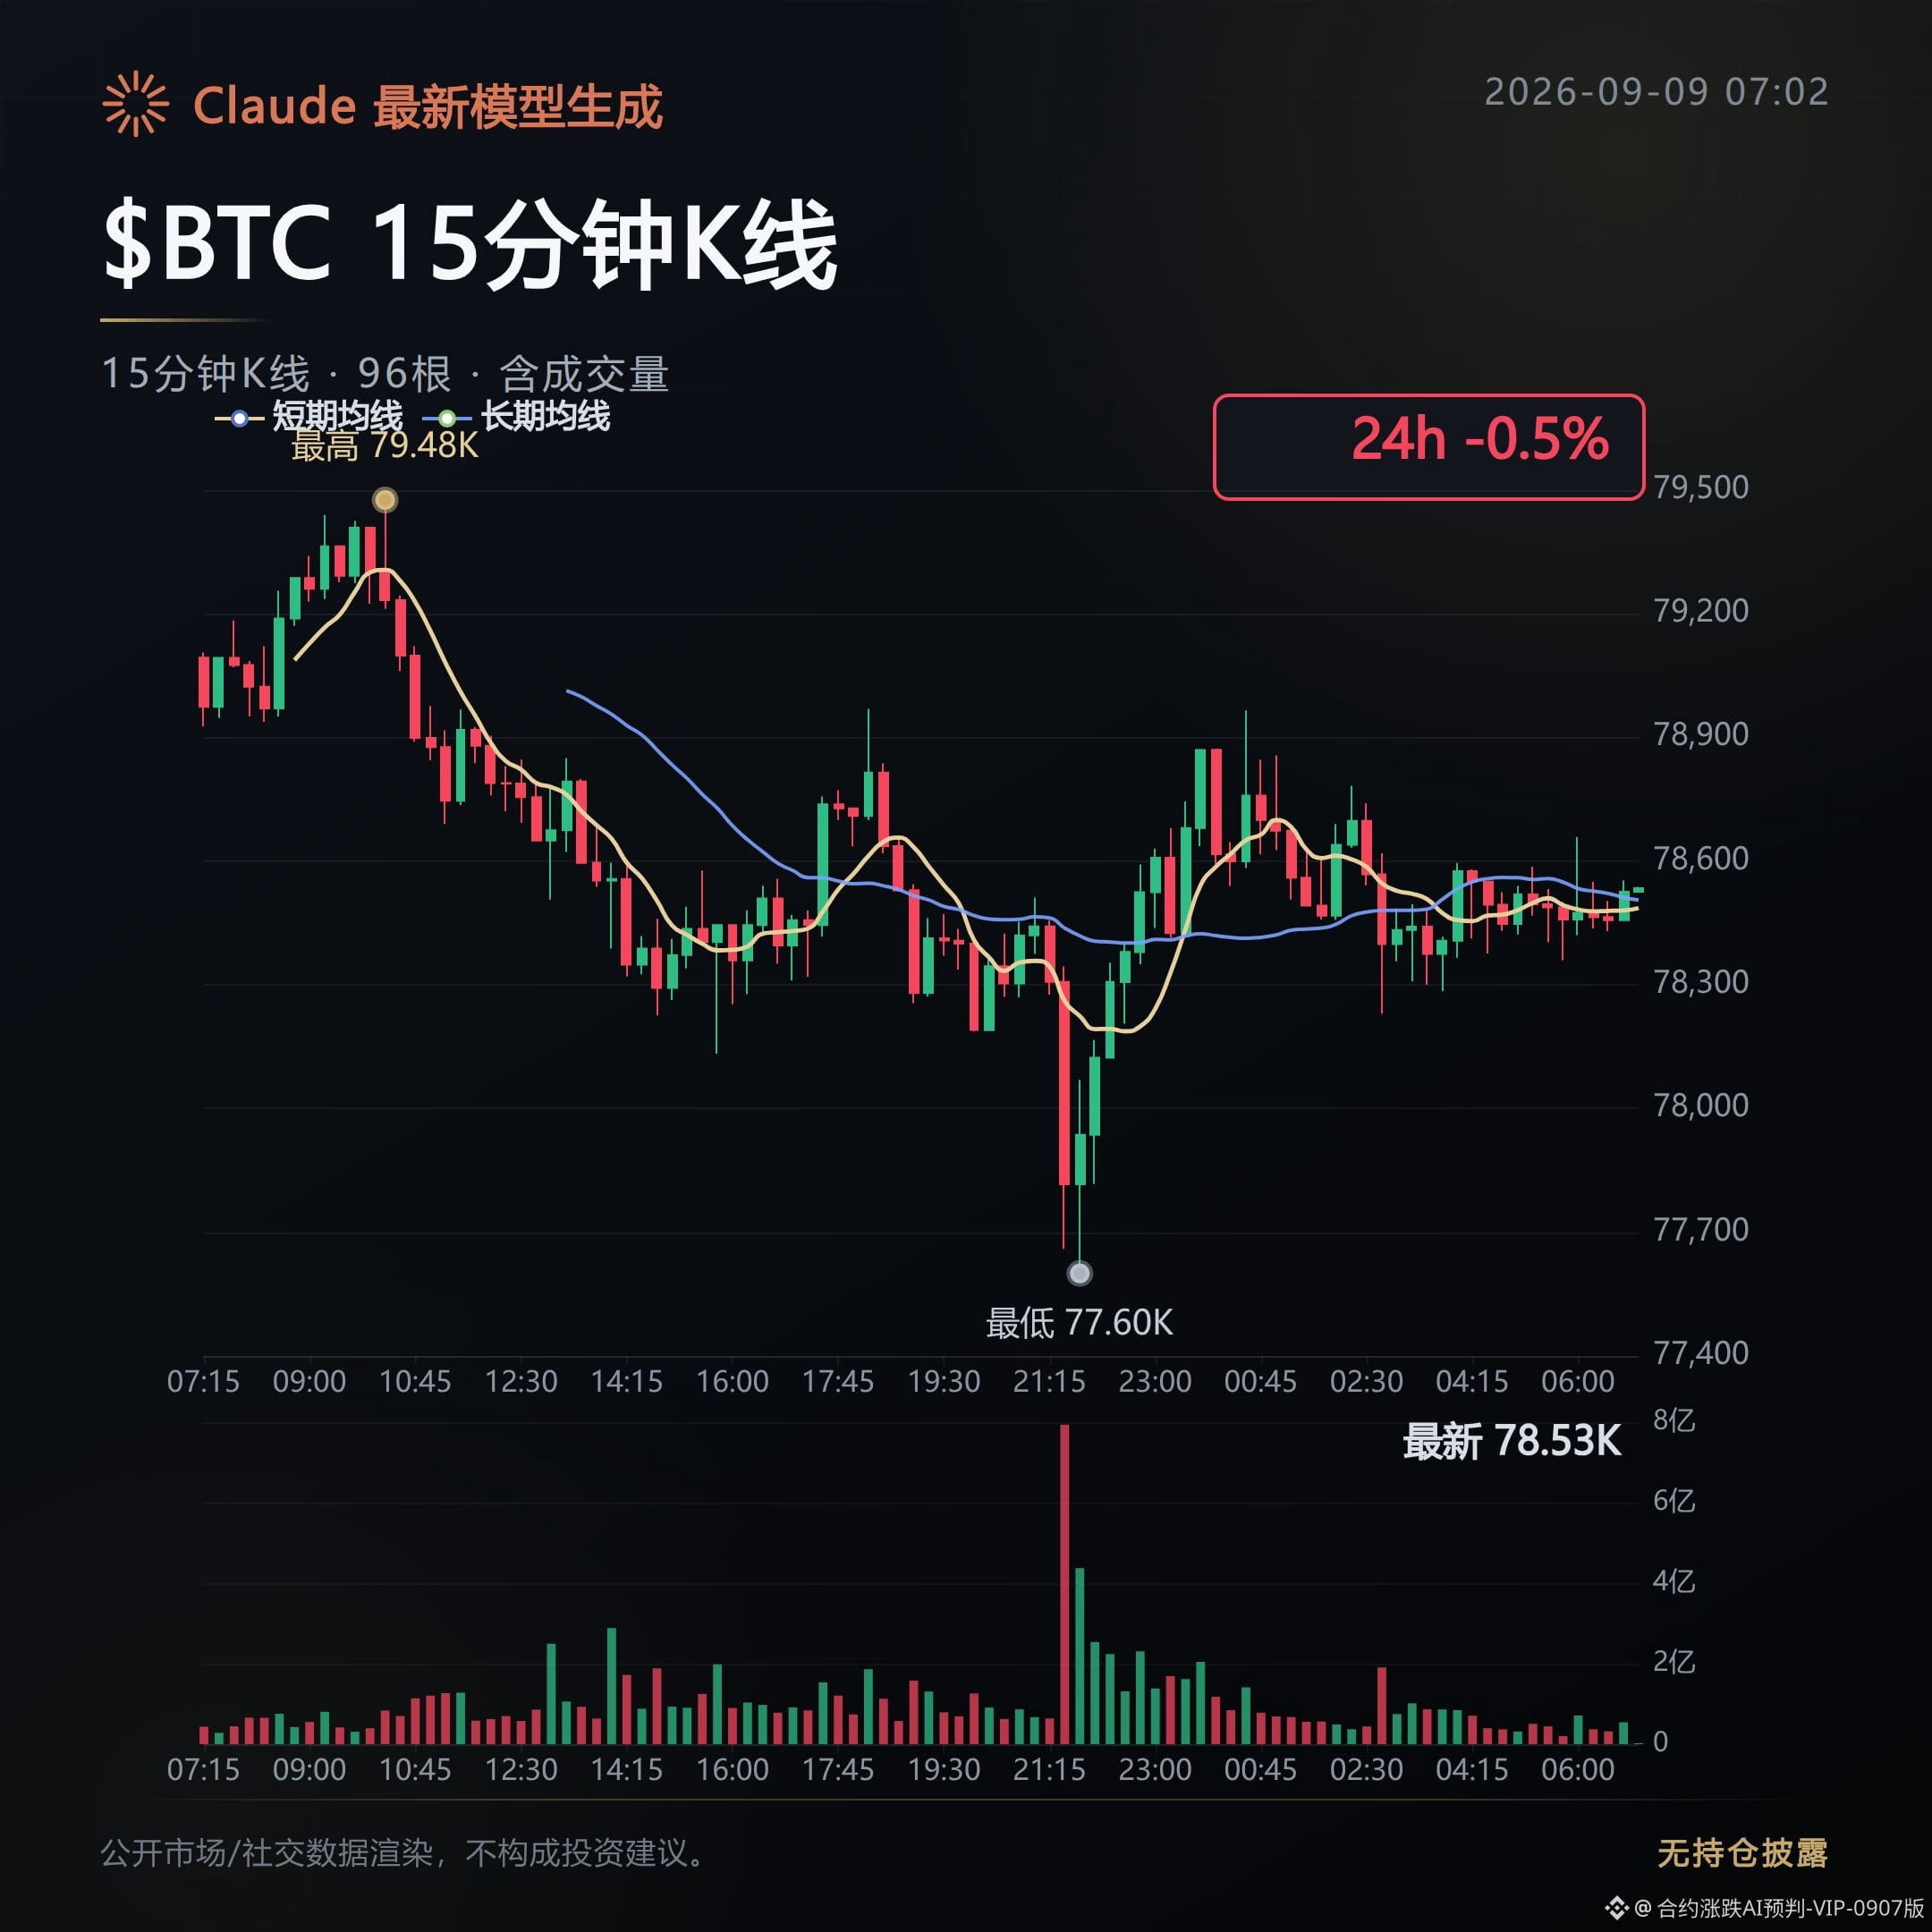
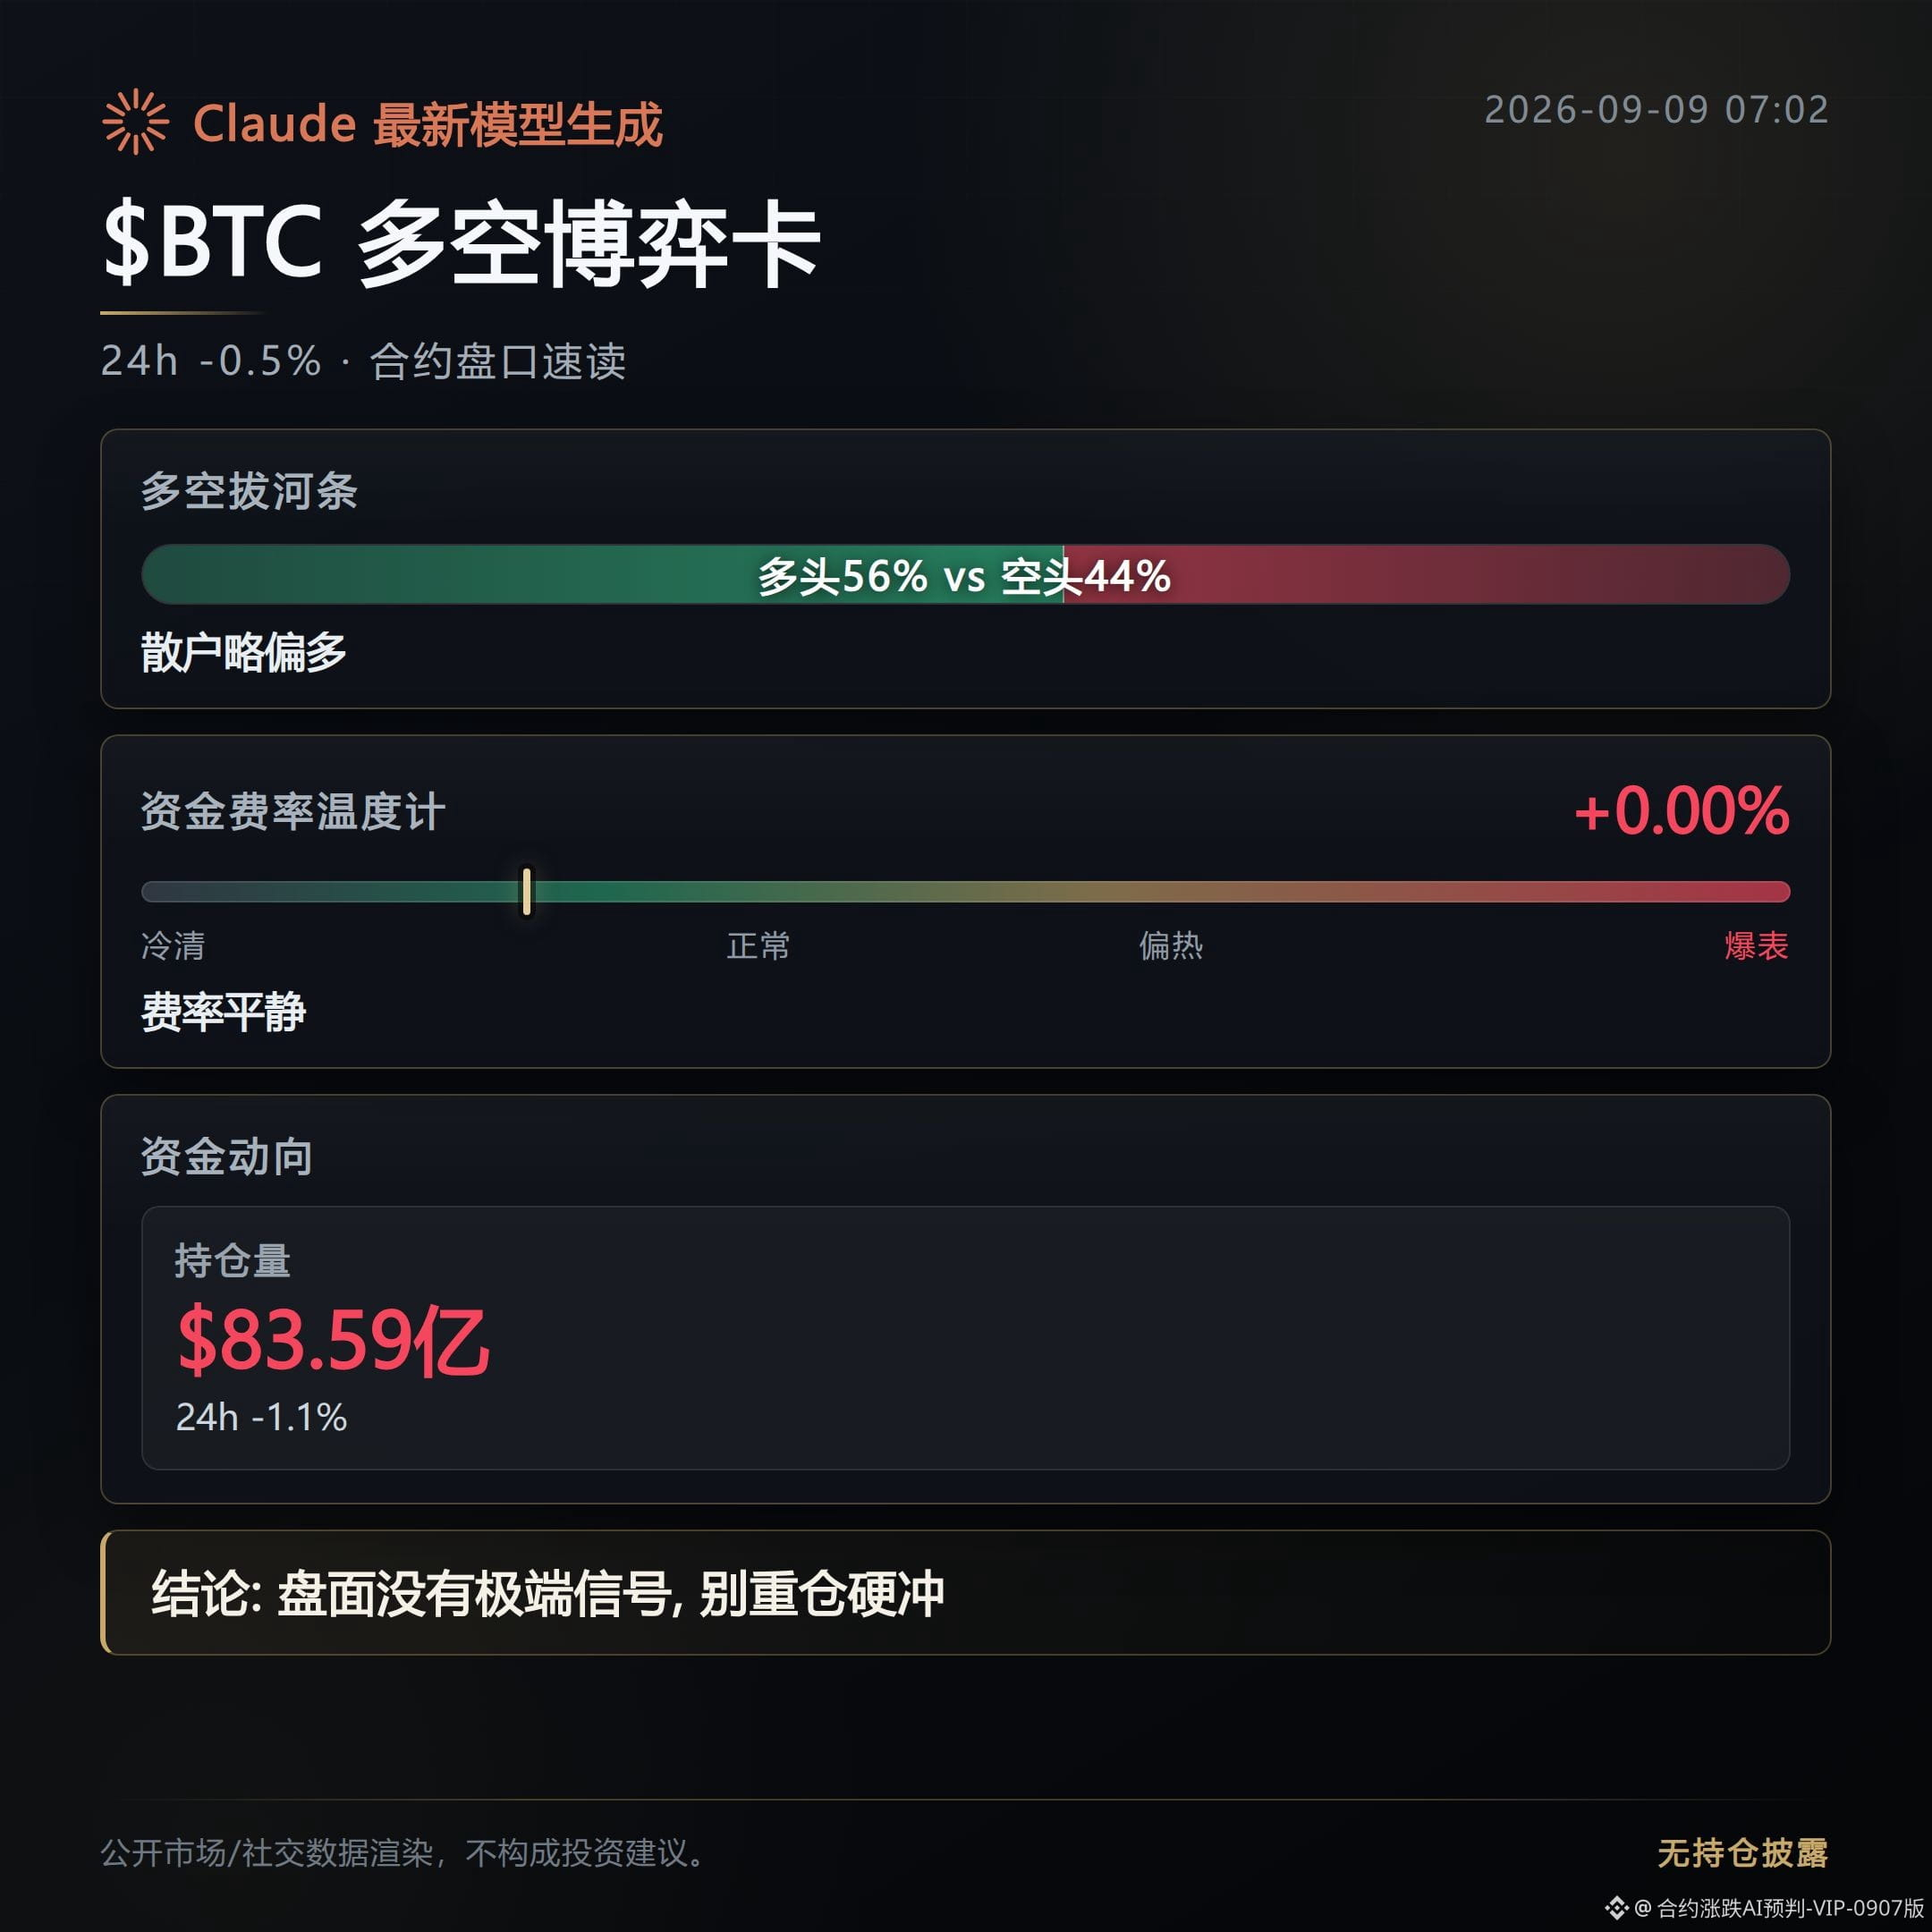
392
Log in to explore more content
Join global crypto users on Binance Square
⚡️ Get latest and useful information about crypto.
💬 Trusted by the world’s largest crypto exchange.
👍 Discover real insights from verified creators.
Email / Phone number
Trending Topics
AppleDebutsFoldablePhone
29,615 views
637 Discussing
Apple just dropped the foldable iPhone — and the market is paying attention. This isn't just another product cycle; it's a new product category, a new CEO on stage, and a $1,999 price tag that pushes $AAPL further into ultra-premium territory. Foldables are the narrative, and Apple is now the headline.
#appledebutsfoldablephone #EUExtendsCentralContactPointToCASPs #US10YTreasuryYieldHitsHighestSinceNov2023 #BrentCrudeTops$100 #USTreasuryToBuyBackUpTo$6BLongDatedDebt
KimHotbae
·2 Likes
·2.8k views
TSMCAugustRevenueUp53.3%YoY
2,354 views
121 Discussing
IranSaysReadyToEscalateWarWithUS
5,394 views
160 Discussing