
Dollar Print Machine
914 Posts

Dollar Print Machine
Report
Block User
Crypto analyst & trader | Market insights & strategies | Sharing updates to empower smarter investing | More on X: @Dollar_Print
Frequent Trader
1.4 Years
228 Following
9.5K+ Followers
3.5K+ Liked
Posts
All
Videos
Live
INIT: The Price Is Falling, But Something Interesting Is Happening Behind the Scenes.
Initia (INIT) is giving traders a mixed signal, and that's exactly why I'm watching it.
As of November 15:
Price is trading around $0.10–$0.13 across market feeds.
24H trading volume is roughly $56M .
Circulating supply stands at 219.24M INIT.
Futures open interest is around $8M.
Funding remains negative, meaning shorts are paying longs.
Futures positioning is heavily tilted toward shorts, while spot buyers are showing some interest.
That creates an interesting possibility: if buyers regain control, short covering could accelerate a recovery. But don't confuse a potential squeeze with a confirmed reversal.
INIT is at a point where market positioning deserves more attention than the latest green candle. I want to see sustained buying volume before calling this a genuine bullish breakout.
The next move could surprise traders on either side.
Are you accumulating INIT at these levels, or waiting for confirmation?
#INIT #CryptoAnalysis
INIT: The Price Is Falling, But Something Interesting Is Happening Behind the Scenes.
Initia (INIT) is giving traders a mixed signal, and that's exactly why I'm watching it.
As of November 15:
Price is trading around $0.10–$0.13 across market feeds.
24H trading volume is roughly $56M .
Circulating supply stands at 219.24M INIT.
Futures open interest is around $8M.
Funding remains negative, meaning shorts are paying longs.
Futures positioning is heavily tilted toward shorts, while spot buyers are showing some interest.
That creates an interesting possibility: if buyers regain control, short covering could accelerate a recovery. But don't confuse a potential squeeze with a confirmed reversal.
INIT is at a point where market positioning deserves more attention than the latest green candle. I want to see sustained buying volume before calling this a genuine bullish breakout.
The next move could surprise traders on either side.
Are you accumulating INIT at these levels, or waiting for confirmation?
#INIT #CryptoAnalysis
Initia (INIT) is giving traders a mixed signal, and that's exactly why I'm watching it.
As of November 15:
Price is trading around $0.10–$0.13 across market feeds.
24H trading volume is roughly $56M .
Circulating supply stands at 219.24M INIT.
Futures open interest is around $8M.
Funding remains negative, meaning shorts are paying longs.
Futures positioning is heavily tilted toward shorts, while spot buyers are showing some interest.
That creates an interesting possibility: if buyers regain control, short covering could accelerate a recovery. But don't confuse a potential squeeze with a confirmed reversal.
INIT is at a point where market positioning deserves more attention than the latest green candle. I want to see sustained buying volume before calling this a genuine bullish breakout.
The next move could surprise traders on either side.
Are you accumulating INIT at these levels, or waiting for confirmation?
#INIT #CryptoAnalysis

270
Crypto is bleeding. But who's actually selling?
Bitcoin has slipped below $64,000, Ethereum has fallen below $1,800, and the weakness is spreading across altcoins.
I see four major forces behind this sell-off:
1. The Fed is changing the game. Hotter-than-expected US inflation has pushed traders to price in another December rate hike. Higher rates mean less appetite for risky assets.
2. Institutional money is moving out. US spot Bitcoin ETFs have experienced consecutive days of withdrawals, with cumulative outflows approaching $2 billion since November 5.
3. Leverage is destroying the recovery attempts.More than $1.6 billion in crypto positions were liquidated during the November 12–13 sell-off. Most were bullish long positions.
4. Wall Street sentiment is deteriorating. Technology-stock weakness and Nvidia-related turmoil have added pressure to an already nervous market.
Here's what concerns me most: Bitcoin's decline is no longer just a Bitcoin story. It's becoming a broader liquidity and confidence problem.
My market view: I wouldn't rush to buy every dip. I want to see ETF inflows return, selling pressure weaken and Bitcoin reclaim important resistance levels before calling a sustainable recovery.
But remember, extreme fear can also create opportunities. The key is knowing when the selling is exhausted.
**What do you think?**
A) Bitcoin is preparing for another major leg down.
B) This is a healthy correction before recovery.
C) The real buying opportunity is approaching.
#Bitcoin #Ethereum
{spot}(BTCUSDT)
{spot}(ETHUSDT)
Crypto is bleeding. But who's actually selling?
Bitcoin has slipped below $64,000, Ethereum has fallen below $1,800, and the weakness is spreading across altcoins.
I see four major forces behind this sell-off:
1. The Fed is changing the game. Hotter-than-expected US inflation has pushed traders to price in another December rate hike. Higher rates mean less appetite for risky assets.
2. Institutional money is moving out. US spot Bitcoin ETFs have experienced consecutive days of withdrawals, with cumulative outflows approaching $2 billion since November 5.
3. Leverage is destroying the recovery attempts.More than $1.6 billion in crypto positions were liquidated during the November 12–13 sell-off. Most were bullish long positions.
4. Wall Street sentiment is deteriorating. Technology-stock weakness and Nvidia-related turmoil have added pressure to an already nervous market.
Here's what concerns me most: Bitcoin's decline is no longer just a Bitcoin story. It's becoming a broader liquidity and confidence problem.
My market view: I wouldn't rush to buy every dip. I want to see ETF inflows return, selling pressure weaken and Bitcoin reclaim important resistance levels before calling a sustainable recovery.
But remember, extreme fear can also create opportunities. The key is knowing when the selling is exhausted.
**What do you think?**
A) Bitcoin is preparing for another major leg down.
B) This is a healthy correction before recovery.
C) The real buying opportunity is approaching.
#Bitcoin #Ethereum
Bitcoin has slipped below $64,000, Ethereum has fallen below $1,800, and the weakness is spreading across altcoins.
I see four major forces behind this sell-off:
1. The Fed is changing the game. Hotter-than-expected US inflation has pushed traders to price in another December rate hike. Higher rates mean less appetite for risky assets.
2. Institutional money is moving out. US spot Bitcoin ETFs have experienced consecutive days of withdrawals, with cumulative outflows approaching $2 billion since November 5.
3. Leverage is destroying the recovery attempts.More than $1.6 billion in crypto positions were liquidated during the November 12–13 sell-off. Most were bullish long positions.
4. Wall Street sentiment is deteriorating. Technology-stock weakness and Nvidia-related turmoil have added pressure to an already nervous market.
Here's what concerns me most: Bitcoin's decline is no longer just a Bitcoin story. It's becoming a broader liquidity and confidence problem.
My market view: I wouldn't rush to buy every dip. I want to see ETF inflows return, selling pressure weaken and Bitcoin reclaim important resistance levels before calling a sustainable recovery.
But remember, extreme fear can also create opportunities. The key is knowing when the selling is exhausted.
**What do you think?**
A) Bitcoin is preparing for another major leg down.
B) This is a healthy correction before recovery.
C) The real buying opportunity is approaching.
#Bitcoin #Ethereum
161
$SOPH
{spot}(SOPHUSDT)
is up nearly 25% today. But the interesting part isn't the rally.
Sophon is making a major strategic shift. Instead of spending millions maintaining its own Layer-2 blockchain, the team is moving towards consumer applications on Base.
The bigger question is whether those applications can generate real revenue.
The new strategy plans to direct a significant portion of product revenue towards SOPH buybacks and burns. If execution delivers, this could create a different value proposition for the token.
Now look at the market:
Price: around $0.00222
24h gain: approximately 25%
24h volume: $141.5M
Market cap: $14.6M
One thing stands out: trading volume is almost 10 times the market cap. That's serious activity, but it doesn't automatically mean sustainable buying pressure.
My view? SOPH is an interesting speculative turnaround story, not a confirmed recovery yet. I want to see actual product adoption and revenue before calling it a long-term winner.
Would you bet on Sophon's new strategy, or is this rally just short-term speculation?
#SOPH
$SOPH
is up nearly 25% today. But the interesting part isn't the rally.
Sophon is making a major strategic shift. Instead of spending millions maintaining its own Layer-2 blockchain, the team is moving towards consumer applications on Base.
The bigger question is whether those applications can generate real revenue.
The new strategy plans to direct a significant portion of product revenue towards SOPH buybacks and burns. If execution delivers, this could create a different value proposition for the token.
Now look at the market:
Price: around $0.00222
24h gain: approximately 25%
24h volume: $141.5M
Market cap: $14.6M
One thing stands out: trading volume is almost 10 times the market cap. That's serious activity, but it doesn't automatically mean sustainable buying pressure.
My view? SOPH is an interesting speculative turnaround story, not a confirmed recovery yet. I want to see actual product adoption and revenue before calling it a long-term winner.
Would you bet on Sophon's new strategy, or is this rally just short-term speculation?
#SOPH
is up nearly 25% today. But the interesting part isn't the rally.
Sophon is making a major strategic shift. Instead of spending millions maintaining its own Layer-2 blockchain, the team is moving towards consumer applications on Base.
The bigger question is whether those applications can generate real revenue.
The new strategy plans to direct a significant portion of product revenue towards SOPH buybacks and burns. If execution delivers, this could create a different value proposition for the token.
Now look at the market:
Price: around $0.00222
24h gain: approximately 25%
24h volume: $141.5M
Market cap: $14.6M
One thing stands out: trading volume is almost 10 times the market cap. That's serious activity, but it doesn't automatically mean sustainable buying pressure.
My view? SOPH is an interesting speculative turnaround story, not a confirmed recovery yet. I want to see actual product adoption and revenue before calling it a long-term winner.
Would you bet on Sophon's new strategy, or is this rally just short-term speculation?
#SOPH

226
·
--
Bullish
🎬 Could MovieBloc be an overlooked crypto opportunity?
$MBL is bringing blockchain into the film industry, connecting filmmakers, viewers and digital content.
What makes it interesting? Its recent developments include a subscription model, film festival partnerships and DAO voting for token holders.
The real opportunity depends on one thing: turning platform growth into actual demand for MBL.
I'm keeping this project on my watchlist. It could be worth researching for a small, high-risk allocation — but adoption still needs to prove itself.
Would you invest in MBL or wait for stronger growth signals?
#MovieBloc
🎬 Could MovieBloc be an overlooked crypto opportunity?
$MBL is bringing blockchain into the film industry, connecting filmmakers, viewers and digital content.
What makes it interesting? Its recent developments include a subscription model, film festival partnerships and DAO voting for token holders.
The real opportunity depends on one thing: turning platform growth into actual demand for MBL.
I'm keeping this project on my watchlist. It could be worth researching for a small, high-risk allocation — but adoption still needs to prove itself.
Would you invest in MBL or wait for stronger growth signals?
#MovieBloc
$MBL is bringing blockchain into the film industry, connecting filmmakers, viewers and digital content.
What makes it interesting? Its recent developments include a subscription model, film festival partnerships and DAO voting for token holders.
The real opportunity depends on one thing: turning platform growth into actual demand for MBL.
I'm keeping this project on my watchlist. It could be worth researching for a small, high-risk allocation — but adoption still needs to prove itself.
Would you invest in MBL or wait for stronger growth signals?
#MovieBloc

210
Bitcoin is trying to recover, but I'm not convinced the worst is over yet.
$BTC is trading around $73.7K, and the market still feels weak. ETF outflows, inflation concerns and uncertainty around the Fed are keeping buyers cautious.
One thing worth watching: ETF outflows have slowed. That's encouraging, but we still need to see fresh buying before calling it a real recovery.
For now, $72K is an important level to hold. On the upside, I'd like to see BTC reclaim $75.5K before getting more confident.
Personally, I'm not rushing into a trade. I'd rather miss the first part of a move than enter without confirmation.
What's your move
buying this dip or staying on the sidelines?
#Bitcoin
{spot}(BTCUSDT)
Bitcoin is trying to recover, but I'm not convinced the worst is over yet.
$BTC is trading around $73.7K, and the market still feels weak. ETF outflows, inflation concerns and uncertainty around the Fed are keeping buyers cautious.
One thing worth watching: ETF outflows have slowed. That's encouraging, but we still need to see fresh buying before calling it a real recovery.
For now, $72K is an important level to hold. On the upside, I'd like to see BTC reclaim $75.5K before getting more confident.
Personally, I'm not rushing into a trade. I'd rather miss the first part of a move than enter without confirmation.
What's your move
buying this dip or staying on the sidelines?
#Bitcoin
$BTC is trading around $73.7K, and the market still feels weak. ETF outflows, inflation concerns and uncertainty around the Fed are keeping buyers cautious.
One thing worth watching: ETF outflows have slowed. That's encouraging, but we still need to see fresh buying before calling it a real recovery.
For now, $72K is an important level to hold. On the upside, I'd like to see BTC reclaim $75.5K before getting more confident.
Personally, I'm not rushing into a trade. I'd rather miss the first part of a move than enter without confirmation.
What's your move
buying this dip or staying on the sidelines?
#Bitcoin
112
BITCOIN IS RECOVERING… BUT SOMETHING IS STILL MISSING.
BTC is trading around $74,400, recovering slightly after the recent sell-off. But I’m not convinced the market has found its bottom just yet.
What caught my attention.
📊 The numbers tell an interesting story:
• BTC is up approximately 1.2% in 24 hours, but still down around 7.7% over the past week.
• US Spot Bitcoin ETFs recorded another $95 million in net outflows on November 10.
• November ETF outflows have reached approximately $1.6 billion through November 10.
• Futures trading volume is running roughly 9 times higher than spot volume. That's a sign of heavy derivatives activity, not necessarily genuine spot demand.
The bigger concern?
Glassnode's latest research suggests Bitcoin is struggling to attract fresh capital. Stablecoin supply has contracted by $14.2 billion over 30 days, while recent buyers are increasingly underwater.
That's important because a sustainable rally needs more than short covering and leveraged speculation. It needs fresh capital coming into the market.
I'm watching the $73,000–$73,200 area as immediate support and $74,750 as the first resistance zone.
A convincing move above resistance, backed by stronger spot buying and ETF inflows, could improve the bullish picture.
But if support breaks, another wave of selling cannot be ruled out.
Bitcoin isn't necessarily bearish for the long term, but the short-term market needs proof before I call this a recovery.
Sometimes the most important signal isn't what price is doing. It's where the money is going.
What do you think?
Is BTC preparing for another recovery, or is this just a temporary bounce before the next leg down?
{spot}(BTCUSDT)
#BitcoinAnalysis
BITCOIN IS RECOVERING… BUT SOMETHING IS STILL MISSING.
BTC is trading around $74,400, recovering slightly after the recent sell-off. But I’m not convinced the market has found its bottom just yet.
What caught my attention.
📊 The numbers tell an interesting story:
• BTC is up approximately 1.2% in 24 hours, but still down around 7.7% over the past week.
• US Spot Bitcoin ETFs recorded another $95 million in net outflows on November 10.
• November ETF outflows have reached approximately $1.6 billion through November 10.
• Futures trading volume is running roughly 9 times higher than spot volume. That's a sign of heavy derivatives activity, not necessarily genuine spot demand.
The bigger concern?
Glassnode's latest research suggests Bitcoin is struggling to attract fresh capital. Stablecoin supply has contracted by $14.2 billion over 30 days, while recent buyers are increasingly underwater.
That's important because a sustainable rally needs more than short covering and leveraged speculation. It needs fresh capital coming into the market.
I'm watching the $73,000–$73,200 area as immediate support and $74,750 as the first resistance zone.
A convincing move above resistance, backed by stronger spot buying and ETF inflows, could improve the bullish picture.
But if support breaks, another wave of selling cannot be ruled out.
Bitcoin isn't necessarily bearish for the long term, but the short-term market needs proof before I call this a recovery.
Sometimes the most important signal isn't what price is doing. It's where the money is going.
What do you think?
Is BTC preparing for another recovery, or is this just a temporary bounce before the next leg down?
#BitcoinAnalysis
BTC is trading around $74,400, recovering slightly after the recent sell-off. But I’m not convinced the market has found its bottom just yet.
What caught my attention.
📊 The numbers tell an interesting story:
• BTC is up approximately 1.2% in 24 hours, but still down around 7.7% over the past week.
• US Spot Bitcoin ETFs recorded another $95 million in net outflows on November 10.
• November ETF outflows have reached approximately $1.6 billion through November 10.
• Futures trading volume is running roughly 9 times higher than spot volume. That's a sign of heavy derivatives activity, not necessarily genuine spot demand.
The bigger concern?
Glassnode's latest research suggests Bitcoin is struggling to attract fresh capital. Stablecoin supply has contracted by $14.2 billion over 30 days, while recent buyers are increasingly underwater.
That's important because a sustainable rally needs more than short covering and leveraged speculation. It needs fresh capital coming into the market.
I'm watching the $73,000–$73,200 area as immediate support and $74,750 as the first resistance zone.
A convincing move above resistance, backed by stronger spot buying and ETF inflows, could improve the bullish picture.
But if support breaks, another wave of selling cannot be ruled out.
Bitcoin isn't necessarily bearish for the long term, but the short-term market needs proof before I call this a recovery.
Sometimes the most important signal isn't what price is doing. It's where the money is going.
What do you think?
Is BTC preparing for another recovery, or is this just a temporary bounce before the next leg down?
#BitcoinAnalysis

95
·
--
Bullish
$ERA /USDT – BULLISH FUTURES TRADE SETUP
Direction: LONG
Strategy: 15-Minute Scalping
Leverage: 15x Isolated
Entry Zone: $0.0825 – $0.0845
Stop Loss: $0.0790
Take Profit Targets:
TP1: $0.0915
TP2: $0.0960
TP3: $0.1018
Risk Management:
Risk maximum 1% of account capital.
Take partial profit at TP1 and TP2.
Avoid chasing green candles.
$ERA
$ERA /USDT – BULLISH FUTURES TRADE SETUP
Direction: LONG
Strategy: 15-Minute Scalping
Leverage: 15x Isolated
Entry Zone: $0.0825 – $0.0845
Stop Loss: $0.0790
Take Profit Targets:
TP1: $0.0915
TP2: $0.0960
TP3: $0.1018
Risk Management:
Risk maximum 1% of account capital.
Take partial profit at TP1 and TP2.
Avoid chasing green candles.
$ERA
Direction: LONG
Strategy: 15-Minute Scalping
Leverage: 15x Isolated
Entry Zone: $0.0825 – $0.0845
Stop Loss: $0.0790
Take Profit Targets:
TP1: $0.0915
TP2: $0.0960
TP3: $0.1018
Risk Management:
Risk maximum 1% of account capital.
Take partial profit at TP1 and TP2.
Avoid chasing green candles.
$ERA

260
CALDERA (ERA): A 20% Rally, But Is the Market Ignoring the Supply Risk?
Caldera is getting attention again, and the numbers are worth watching.
According to Binance's November 11 market snapshot, ERA was trading around $0.083, up approximately 10.17% in 24 hours, with a market capitalization of $12.3M and daily trading volume near $76M.
what catches my attention: daily volume is more than six times the reported market cap. That's significant trading activity, but high volume alone doesn't confirm sustainable accumulation.
The fundamental story
Caldera isn't just another speculative token. Its Rollup-as-a-Service infrastructure allows developers to deploy application-specific blockchains, while its Metalayer aims to connect those rollups and reduce ecosystem fragmentation.
The concept has real relevance as blockchain applications increasingly require dedicated, scalable infrastructure.
The trader's perspective
Three things deserve attention:
Volume expansion: Strong participation can support a breakout, but I want to see price holding above reclaimed resistance rather than immediately giving back the rally.
Supply pressure: Only 148.5M ERA are circulating against a maximum supply of 1B. That's just 14.85%. Future token releases deserve serious attention.
November 17 unlock: Binance's market analysis flags a scheduled release of approximately 23.45M ERA. If confirmed, that's around 15.8% of the current circulating supply. Traders should watch how the market absorbs this additional supply.
ERA has an interesting infrastructure narrative, and the recent volume expansion suggests renewed market attention. However, the low circulating-supply ratio and upcoming unlock make chasing a vertical rally risky.
I'd rather see a healthy consolidation, sustained spot demand and a successful retest before considering a stronger bullish continuation.
Remember: a strong narrative can attract buyers, but token economics ultimately matter.
Will ERA continue its recovery, or will the November 17 unlock create selling pressure?
#Caldera
CALDERA (ERA): A 20% Rally, But Is the Market Ignoring the Supply Risk?
Caldera is getting attention again, and the numbers are worth watching.
According to Binance's November 11 market snapshot, ERA was trading around $0.083, up approximately 10.17% in 24 hours, with a market capitalization of $12.3M and daily trading volume near $76M.
what catches my attention: daily volume is more than six times the reported market cap. That's significant trading activity, but high volume alone doesn't confirm sustainable accumulation.
The fundamental story
Caldera isn't just another speculative token. Its Rollup-as-a-Service infrastructure allows developers to deploy application-specific blockchains, while its Metalayer aims to connect those rollups and reduce ecosystem fragmentation.
The concept has real relevance as blockchain applications increasingly require dedicated, scalable infrastructure.
The trader's perspective
Three things deserve attention:
Volume expansion: Strong participation can support a breakout, but I want to see price holding above reclaimed resistance rather than immediately giving back the rally.
Supply pressure: Only 148.5M ERA are circulating against a maximum supply of 1B. That's just 14.85%. Future token releases deserve serious attention.
November 17 unlock: Binance's market analysis flags a scheduled release of approximately 23.45M ERA. If confirmed, that's around 15.8% of the current circulating supply. Traders should watch how the market absorbs this additional supply.
ERA has an interesting infrastructure narrative, and the recent volume expansion suggests renewed market attention. However, the low circulating-supply ratio and upcoming unlock make chasing a vertical rally risky.
I'd rather see a healthy consolidation, sustained spot demand and a successful retest before considering a stronger bullish continuation.
Remember: a strong narrative can attract buyers, but token economics ultimately matter.
Will ERA continue its recovery, or will the November 17 unlock create selling pressure?
#Caldera
Caldera is getting attention again, and the numbers are worth watching.
According to Binance's November 11 market snapshot, ERA was trading around $0.083, up approximately 10.17% in 24 hours, with a market capitalization of $12.3M and daily trading volume near $76M.
what catches my attention: daily volume is more than six times the reported market cap. That's significant trading activity, but high volume alone doesn't confirm sustainable accumulation.
The fundamental story
Caldera isn't just another speculative token. Its Rollup-as-a-Service infrastructure allows developers to deploy application-specific blockchains, while its Metalayer aims to connect those rollups and reduce ecosystem fragmentation.
The concept has real relevance as blockchain applications increasingly require dedicated, scalable infrastructure.
The trader's perspective
Three things deserve attention:
Volume expansion: Strong participation can support a breakout, but I want to see price holding above reclaimed resistance rather than immediately giving back the rally.
Supply pressure: Only 148.5M ERA are circulating against a maximum supply of 1B. That's just 14.85%. Future token releases deserve serious attention.
November 17 unlock: Binance's market analysis flags a scheduled release of approximately 23.45M ERA. If confirmed, that's around 15.8% of the current circulating supply. Traders should watch how the market absorbs this additional supply.
ERA has an interesting infrastructure narrative, and the recent volume expansion suggests renewed market attention. However, the low circulating-supply ratio and upcoming unlock make chasing a vertical rally risky.
I'd rather see a healthy consolidation, sustained spot demand and a successful retest before considering a stronger bullish continuation.
Remember: a strong narrative can attract buyers, but token economics ultimately matter.
Will ERA continue its recovery, or will the November 17 unlock create selling pressure?
#Caldera

253
$ARIA : The Rally Is Interesting, But What Happens Next?
ARIA has caught the market's attention after a strong upward move. But here's what I find more interesting than the rally itself: can buyers actually defend these higher prices?
The chart is showing a bullish bigger-picture structure, but momentum is getting stretched. That's where things become interesting.
I'm watching three levels:
🔹 $0.220 – The breakout level bulls need to reclaim and hold.
🔹 $0.204 – An important support zone. Losing it could change the short-term picture.
🔹 $0.225–$0.239 – Potential upside territory if buying pressure returns.
One thing traders shouldn't ignore: positive funding and rising open interest can indicate growing demand, but they can also make a crowded long trade vulnerable to liquidation.
My approach? No FOMO entries. I want to see confirmation, not just another green candle.
The real question is: Is ARIA preparing for another leg up, or does the market need a cooldown first?
What's your view?
#ARIA
$ARIA : The Rally Is Interesting, But What Happens Next?
ARIA has caught the market's attention after a strong upward move. But here's what I find more interesting than the rally itself: can buyers actually defend these higher prices?
The chart is showing a bullish bigger-picture structure, but momentum is getting stretched. That's where things become interesting.
I'm watching three levels:
🔹 $0.220 – The breakout level bulls need to reclaim and hold.
🔹 $0.204 – An important support zone. Losing it could change the short-term picture.
🔹 $0.225–$0.239 – Potential upside territory if buying pressure returns.
One thing traders shouldn't ignore: positive funding and rising open interest can indicate growing demand, but they can also make a crowded long trade vulnerable to liquidation.
My approach? No FOMO entries. I want to see confirmation, not just another green candle.
The real question is: Is ARIA preparing for another leg up, or does the market need a cooldown first?
What's your view?
#ARIA
ARIA has caught the market's attention after a strong upward move. But here's what I find more interesting than the rally itself: can buyers actually defend these higher prices?
The chart is showing a bullish bigger-picture structure, but momentum is getting stretched. That's where things become interesting.
I'm watching three levels:
🔹 $0.220 – The breakout level bulls need to reclaim and hold.
🔹 $0.204 – An important support zone. Losing it could change the short-term picture.
🔹 $0.225–$0.239 – Potential upside territory if buying pressure returns.
One thing traders shouldn't ignore: positive funding and rising open interest can indicate growing demand, but they can also make a crowded long trade vulnerable to liquidation.
My approach? No FOMO entries. I want to see confirmation, not just another green candle.
The real question is: Is ARIA preparing for another leg up, or does the market need a cooldown first?
What's your view?
#ARIA

1
419
INIT is moving hard, but I'm not ready to call it a comeback yet.
A nearly 60% jump in 24 hours definitely gets attention. INIT is trading around $0.192, and the volume is unusually high.
But what makes this one interesting.
Initia actually has a decent idea behind it. It's building an ecosystem where different app-specific blockchains can work together. That's a real use case, not just another token riding a hype narrative.
Still, there's something traders shouldn't forget. The project recently went through a security incident. Even though the team has restored operations, trust takes longer to rebuild.
Personally, I wouldn't chase a candle this big. I'd rather see whether buyers can defend the current levels and whether volume stays strong over the next few sessions.
Are you buying this move, or waiting for a pullback?
I want to hear what other traders think. 👇
#INIT #CryptoTrading
INIT is moving hard, but I'm not ready to call it a comeback yet.
A nearly 60% jump in 24 hours definitely gets attention. INIT is trading around $0.192, and the volume is unusually high.
But what makes this one interesting.
Initia actually has a decent idea behind it. It's building an ecosystem where different app-specific blockchains can work together. That's a real use case, not just another token riding a hype narrative.
Still, there's something traders shouldn't forget. The project recently went through a security incident. Even though the team has restored operations, trust takes longer to rebuild.
Personally, I wouldn't chase a candle this big. I'd rather see whether buyers can defend the current levels and whether volume stays strong over the next few sessions.
Are you buying this move, or waiting for a pullback?
I want to hear what other traders think. 👇
#INIT #CryptoTrading
A nearly 60% jump in 24 hours definitely gets attention. INIT is trading around $0.192, and the volume is unusually high.
But what makes this one interesting.
Initia actually has a decent idea behind it. It's building an ecosystem where different app-specific blockchains can work together. That's a real use case, not just another token riding a hype narrative.
Still, there's something traders shouldn't forget. The project recently went through a security incident. Even though the team has restored operations, trust takes longer to rebuild.
Personally, I wouldn't chase a candle this big. I'd rather see whether buyers can defend the current levels and whether volume stays strong over the next few sessions.
Are you buying this move, or waiting for a pullback?
I want to hear what other traders think. 👇
#INIT #CryptoTrading

1
394
WALL STREET JUST GOT A BRUTAL REALITY CHECK — AND AI IS AT THE CENTER OF IT.
More than $2 trillion disappeared from US equities within the first hour of Thursday's trading. By the end of the session, the Nasdaq 100 had lost around $2.5 trillion in market value.
what makes this selloff interesting: Wall Street was celebrating the midterm election results just 24 hours earlier. That optimism didn't last.
What actually triggered the crash? Three things stand out:
- Political risk meets the AI boom
Democratic victories raised concerns about tougher oversight and potential delays in US data-center construction. That's a serious issue for companies betting billions on AI infrastructure.
- The AI valuation reality check
Investors are starting to question whether massive AI spending will generate enough returns. Nvidia fell 9%, while AMD plunged 17%. This looks like more than ordinary profit-taking.
- Leverage is making everything worse
Bitcoin dropped toward $76,000, while more than $1 billion in leveraged crypto positions were liquidated over 24 hours. Forced selling added another layer of pressure to an already nervous market.
The bigger concern isn't simply that stocks are falling. It's that investors are reconsidering the price they're willing to pay for future AI growth.
And when technology stocks, Bitcoin and leveraged traders all move in the same direction, risk can spread much faster than expected.
Now I'm interested in your view.
What is the BIGGEST threat to the markets right now?
Vote and explain your reasoning in the comments.
#stockmarket #Bitcoin #MarketCrash
WALL STREET JUST GOT A BRUTAL REALITY CHECK — AND AI IS AT THE CENTER OF IT.
More than $2 trillion disappeared from US equities within the first hour of Thursday's trading. By the end of the session, the Nasdaq 100 had lost around $2.5 trillion in market value.
what makes this selloff interesting: Wall Street was celebrating the midterm election results just 24 hours earlier. That optimism didn't last.
What actually triggered the crash? Three things stand out:
- Political risk meets the AI boom
Democratic victories raised concerns about tougher oversight and potential delays in US data-center construction. That's a serious issue for companies betting billions on AI infrastructure.
- The AI valuation reality check
Investors are starting to question whether massive AI spending will generate enough returns. Nvidia fell 9%, while AMD plunged 17%. This looks like more than ordinary profit-taking.
- Leverage is making everything worse
Bitcoin dropped toward $76,000, while more than $1 billion in leveraged crypto positions were liquidated over 24 hours. Forced selling added another layer of pressure to an already nervous market.
The bigger concern isn't simply that stocks are falling. It's that investors are reconsidering the price they're willing to pay for future AI growth.
And when technology stocks, Bitcoin and leveraged traders all move in the same direction, risk can spread much faster than expected.
Now I'm interested in your view.
What is the BIGGEST threat to the markets right now?
Vote and explain your reasoning in the comments.
#stockmarket #Bitcoin #MarketCrash
More than $2 trillion disappeared from US equities within the first hour of Thursday's trading. By the end of the session, the Nasdaq 100 had lost around $2.5 trillion in market value.
what makes this selloff interesting: Wall Street was celebrating the midterm election results just 24 hours earlier. That optimism didn't last.
What actually triggered the crash? Three things stand out:
- Political risk meets the AI boom
Democratic victories raised concerns about tougher oversight and potential delays in US data-center construction. That's a serious issue for companies betting billions on AI infrastructure.
- The AI valuation reality check
Investors are starting to question whether massive AI spending will generate enough returns. Nvidia fell 9%, while AMD plunged 17%. This looks like more than ordinary profit-taking.
- Leverage is making everything worse
Bitcoin dropped toward $76,000, while more than $1 billion in leveraged crypto positions were liquidated over 24 hours. Forced selling added another layer of pressure to an already nervous market.
The bigger concern isn't simply that stocks are falling. It's that investors are reconsidering the price they're willing to pay for future AI growth.
And when technology stocks, Bitcoin and leveraged traders all move in the same direction, risk can spread much faster than expected.
Now I'm interested in your view.
What is the BIGGEST threat to the markets right now?
Vote and explain your reasoning in the comments.
#stockmarket #Bitcoin #MarketCrash
AI bubble & excesive valuation
50%
Political Risk
50%
Leverage & Liquidations
0%
Interest Rates & Economy
0%
6 votes • Voting closed
1
1.8k
The Democrats' victory in both chambers of Congress has introduced a new layer of uncertainty into financial markets.
Bitcoin initially dropped near $75,630, then recovered toward $78,354 (+0.7%) in Reuters' November 4 market update. Ethereum also rebounded to around $2,323 (+1.4%).
But what matters beyond the headlines:
🔹 Crypto: Potential delays in crypto-friendly legislation could increase regulatory uncertainty.
🔹 Bitcoin: ETF outflows remain a concern. A price rebound needs stronger institutional demand to become sustainable.
🔹 AI stocks: Political scrutiny may increase, but demand for AI infrastructure remains a major fundamental driver.
🔹 Wall Street: Investors are reassessing policy, interest rates, corporate earnings and government spending.
This is not automatically bullish or bearish. Watch Bitcoin ETF flows, Treasury yields and technology earnings before making a decision. The next trend needs confirmation from real capital, not political headlines.
🗳️ POLL: Which market has the strongest opportunity over the next 30 days?
#USMidterms-WhatAreMarketsExpecting? #MarketAnalysis
The Democrats' victory in both chambers of Congress has introduced a new layer of uncertainty into financial markets.
Bitcoin initially dropped near $75,630, then recovered toward $78,354 (+0.7%) in Reuters' November 4 market update. Ethereum also rebounded to around $2,323 (+1.4%).
But what matters beyond the headlines:
🔹 Crypto: Potential delays in crypto-friendly legislation could increase regulatory uncertainty.
🔹 Bitcoin: ETF outflows remain a concern. A price rebound needs stronger institutional demand to become sustainable.
🔹 AI stocks: Political scrutiny may increase, but demand for AI infrastructure remains a major fundamental driver.
🔹 Wall Street: Investors are reassessing policy, interest rates, corporate earnings and government spending.
This is not automatically bullish or bearish. Watch Bitcoin ETF flows, Treasury yields and technology earnings before making a decision. The next trend needs confirmation from real capital, not political headlines.
🗳️ POLL: Which market has the strongest opportunity over the next 30 days?
#USMidterms-WhatAreMarketsExpecting? #MarketAnalysis
Bitcoin initially dropped near $75,630, then recovered toward $78,354 (+0.7%) in Reuters' November 4 market update. Ethereum also rebounded to around $2,323 (+1.4%).
But what matters beyond the headlines:
🔹 Crypto: Potential delays in crypto-friendly legislation could increase regulatory uncertainty.
🔹 Bitcoin: ETF outflows remain a concern. A price rebound needs stronger institutional demand to become sustainable.
🔹 AI stocks: Political scrutiny may increase, but demand for AI infrastructure remains a major fundamental driver.
🔹 Wall Street: Investors are reassessing policy, interest rates, corporate earnings and government spending.
This is not automatically bullish or bearish. Watch Bitcoin ETF flows, Treasury yields and technology earnings before making a decision. The next trend needs confirmation from real capital, not political headlines.
🗳️ POLL: Which market has the strongest opportunity over the next 30 days?
#USMidterms-WhatAreMarketsExpecting? #MarketAnalysis
A) Bitcoin
58%
B) AI stocks — NVIDIA / AMD
17%
C) Traditional US stocks
8%
D) Gold
17%
12 votes • Voting closed
619
Article
BITCOIN REBOUNDS, BUT THE REAL MARKET STORY IS MUCH BIGGER THAN THE ELECTION!The market initially reacted to the Democratic sweep of the US Congress with fear. Bitcoin dropped below $76,000, technology shares came under pressure, and investors began reassessing trades built around the Trump administration's policies.
What traders should not overlook: political headlines can move prices quickly, but fundamentals determine whether a trend can sustain itself.
Let's look beyond the headlines.
1. Bitcoin: Price recovery versus real demand
Bitcoin recovered from its election-driven drop and moved back toward the $78,000 area. In the latest market snapshot used for this analysis, BTC was around $77,687, up approximately 1.30% over 24 hours.
However, there is a fundamental concern.
US spot Bitcoin ETFs recorded approximately $52.6 million in net outflows on November 3, following substantial withdrawals in the preceding sessions.
This matters because a sustainable Bitcoin recovery needs more than short-covering or leveraged buying. It needs renewed spot demand and institutional capital.
My trading perspective: Watch whether Bitcoin can reclaim and hold $78,000–$80,000. A recovery without improving spot demand may struggle to maintain momentum.
2. AMD: AI demand is still delivering real numbers
Here is where the story becomes interesting.
AMD reported record Q3 2026 revenue of $13.4 billion, up 45% year over year.
Its Data Center business generated $8.5 billion in revenue, growing 97% year over year.
That is a powerful fundamental signal.
Even if political uncertainty creates pressure on AI-related stocks, actual demand for data-center processors and AI infrastructure remains substantial.
The market should distinguish between two different risks:
Political and regulatory uncertainty around data-center expansion.The actual commercial demand for AI computing infrastructure.
They are related, but they are not the same thing.
3. Solar stocks: A political opportunity, but not a guaranteed rally
Solar companies attracted buying interest after investors considered the possibility of changes to US clean-energy policies.
Enphase was among the companies benefiting from the initial market reaction.
However, political optimism should not replace financial analysis. Enphase reported Q3 2026 revenue of $293.3 million, with a GAAP gross margin of 43.3%.
For solar investors, future policy support, installation demand, margins and cash flow will matter more than a one-day election rally.
4. The bigger macro picture
The election also raises questions about government spending, regulation, taxation and the US fiscal outlook.
A divided political environment can create uncertainty for technology and crypto legislation. At the same time, lower Treasury yields and a weaker dollar can provide support to certain risk assets.
This creates a complicated market environment:
Bitcoin: ETF flows and regulatory clarity remain important.AI stocks: Earnings growth must justify high valuations.Solar: Policy expectations need confirmation through actual demand.Treasuries and the dollar: Interest-rate expectations and fiscal policy remain major drivers.
5. My market watchlist
Asset Important level or developmentBTC$75,600–$76,000 support zoneBTC$78,000 recovery thresholdBTC$80,000 stronger bullish confirmation AMD Monitor earnings follow-through NVIDIA Watch AI valuation and demand expectations ENPH Watch policy developments and earnings
These Bitcoin levels are observation zones, not guaranteed support or resistance.
Final thought
I would not call this an automatic bearish signal for crypto or an automatic buying opportunity in AI stocks.
The more important question is whether the market can separate political fear from business fundamentals.
AMD's results show that AI demand is real. Bitcoin's ETF outflows show that institutional demand still needs attention. Solar's rally shows how quickly policy expectations can change market sentiment.
My approach: Follow the money, verify the fundamentals, and never confuse a headline-driven bounce with a confirmed trend.
What is your reasoning? Share your view in the comments.
#BTC #AMD #NVIDIA #AIStocks #ETFFlows
BITCOIN REBOUNDS, BUT THE REAL MARKET STORY IS MUCH BIGGER THAN THE ELECTION!
The market initially reacted to the Democratic sweep of the US Congress with fear. Bitcoin dropped below $76,000, technology shares came under pressure, and investors began reassessing trades built around the Trump administration's policies.
What traders should not overlook: political headlines can move prices quickly, but fundamentals determine whether a trend can sustain itself.
Let's look beyond the headlines.
1. Bitcoin: Price recovery versus real demand
Bitcoin recovered from its election-driven drop and moved back toward the $78,000 area. In the latest market snapshot used for this analysis, BTC was around $77,687, up approximately 1.30% over 24 hours.
However, there is a fundamental concern.
US spot Bitcoin ETFs recorded approximately $52.6 million in net outflows on November 3, following substantial withdrawals in the preceding sessions.
This matters because a sustainable Bitcoin recovery needs more than short-covering or leveraged buying. It needs renewed spot demand and institutional capital.
My trading perspective: Watch whether Bitcoin can reclaim and hold $78,000–$80,000. A recovery without improving spot demand may struggle to maintain momentum.
2. AMD: AI demand is still delivering real numbers
Here is where the story becomes interesting.
AMD reported record Q3 2026 revenue of $13.4 billion, up 45% year over year.
Its Data Center business generated $8.5 billion in revenue, growing 97% year over year.
That is a powerful fundamental signal.
Even if political uncertainty creates pressure on AI-related stocks, actual demand for data-center processors and AI infrastructure remains substantial.
The market should distinguish between two different risks:
Political and regulatory uncertainty around data-center expansion.The actual commercial demand for AI computing infrastructure.
They are related, but they are not the same thing.
3. Solar stocks: A political opportunity, but not a guaranteed rally
Solar companies attracted buying interest after investors considered the possibility of changes to US clean-energy policies.
Enphase was among the companies benefiting from the initial market reaction.
However, political optimism should not replace financial analysis. Enphase reported Q3 2026 revenue of $293.3 million, with a GAAP gross margin of 43.3%.
For solar investors, future policy support, installation demand, margins and cash flow will matter more than a one-day election rally.
4. The bigger macro picture
The election also raises questions about government spending, regulation, taxation and the US fiscal outlook.
A divided political environment can create uncertainty for technology and crypto legislation. At the same time, lower Treasury yields and a weaker dollar can provide support to certain risk assets.
This creates a complicated market environment:
Bitcoin: ETF flows and regulatory clarity remain important.AI stocks: Earnings growth must justify high valuations.Solar: Policy expectations need confirmation through actual demand.Treasuries and the dollar: Interest-rate expectations and fiscal policy remain major drivers.
5. My market watchlist
Asset Important level or developmentBTC$75,600–$76,000 support zoneBTC$78,000 recovery thresholdBTC$80,000 stronger bullish confirmation AMD Monitor earnings follow-through NVIDIA Watch AI valuation and demand expectations ENPH Watch policy developments and earnings
These Bitcoin levels are observation zones, not guaranteed support or resistance.
Final thought
I would not call this an automatic bearish signal for crypto or an automatic buying opportunity in AI stocks.
The more important question is whether the market can separate political fear from business fundamentals.
AMD's results show that AI demand is real. Bitcoin's ETF outflows show that institutional demand still needs attention. Solar's rally shows how quickly policy expectations can change market sentiment.
My approach: Follow the money, verify the fundamentals, and never confuse a headline-driven bounce with a confirmed trend.
What is your reasoning? Share your view in the comments.
#BTC #AMD #NVIDIA #AIStocks #ETFFlows
What traders should not overlook: political headlines can move prices quickly, but fundamentals determine whether a trend can sustain itself.
Let's look beyond the headlines.
1. Bitcoin: Price recovery versus real demand
Bitcoin recovered from its election-driven drop and moved back toward the $78,000 area. In the latest market snapshot used for this analysis, BTC was around $77,687, up approximately 1.30% over 24 hours.
However, there is a fundamental concern.
US spot Bitcoin ETFs recorded approximately $52.6 million in net outflows on November 3, following substantial withdrawals in the preceding sessions.
This matters because a sustainable Bitcoin recovery needs more than short-covering or leveraged buying. It needs renewed spot demand and institutional capital.
My trading perspective: Watch whether Bitcoin can reclaim and hold $78,000–$80,000. A recovery without improving spot demand may struggle to maintain momentum.
2. AMD: AI demand is still delivering real numbers
Here is where the story becomes interesting.
AMD reported record Q3 2026 revenue of $13.4 billion, up 45% year over year.
Its Data Center business generated $8.5 billion in revenue, growing 97% year over year.
That is a powerful fundamental signal.
Even if political uncertainty creates pressure on AI-related stocks, actual demand for data-center processors and AI infrastructure remains substantial.
The market should distinguish between two different risks:
Political and regulatory uncertainty around data-center expansion.The actual commercial demand for AI computing infrastructure.
They are related, but they are not the same thing.
3. Solar stocks: A political opportunity, but not a guaranteed rally
Solar companies attracted buying interest after investors considered the possibility of changes to US clean-energy policies.
Enphase was among the companies benefiting from the initial market reaction.
However, political optimism should not replace financial analysis. Enphase reported Q3 2026 revenue of $293.3 million, with a GAAP gross margin of 43.3%.
For solar investors, future policy support, installation demand, margins and cash flow will matter more than a one-day election rally.
4. The bigger macro picture
The election also raises questions about government spending, regulation, taxation and the US fiscal outlook.
A divided political environment can create uncertainty for technology and crypto legislation. At the same time, lower Treasury yields and a weaker dollar can provide support to certain risk assets.
This creates a complicated market environment:
Bitcoin: ETF flows and regulatory clarity remain important.AI stocks: Earnings growth must justify high valuations.Solar: Policy expectations need confirmation through actual demand.Treasuries and the dollar: Interest-rate expectations and fiscal policy remain major drivers.
5. My market watchlist
Asset Important level or developmentBTC$75,600–$76,000 support zoneBTC$78,000 recovery thresholdBTC$80,000 stronger bullish confirmation AMD Monitor earnings follow-through NVIDIA Watch AI valuation and demand expectations ENPH Watch policy developments and earnings
These Bitcoin levels are observation zones, not guaranteed support or resistance.
Final thought
I would not call this an automatic bearish signal for crypto or an automatic buying opportunity in AI stocks.
The more important question is whether the market can separate political fear from business fundamentals.
AMD's results show that AI demand is real. Bitcoin's ETF outflows show that institutional demand still needs attention. Solar's rally shows how quickly policy expectations can change market sentiment.
My approach: Follow the money, verify the fundamentals, and never confuse a headline-driven bounce with a confirmed trend.
What is your reasoning? Share your view in the comments.
#BTC #AMD #NVIDIA #AIStocks #ETFFlows
186
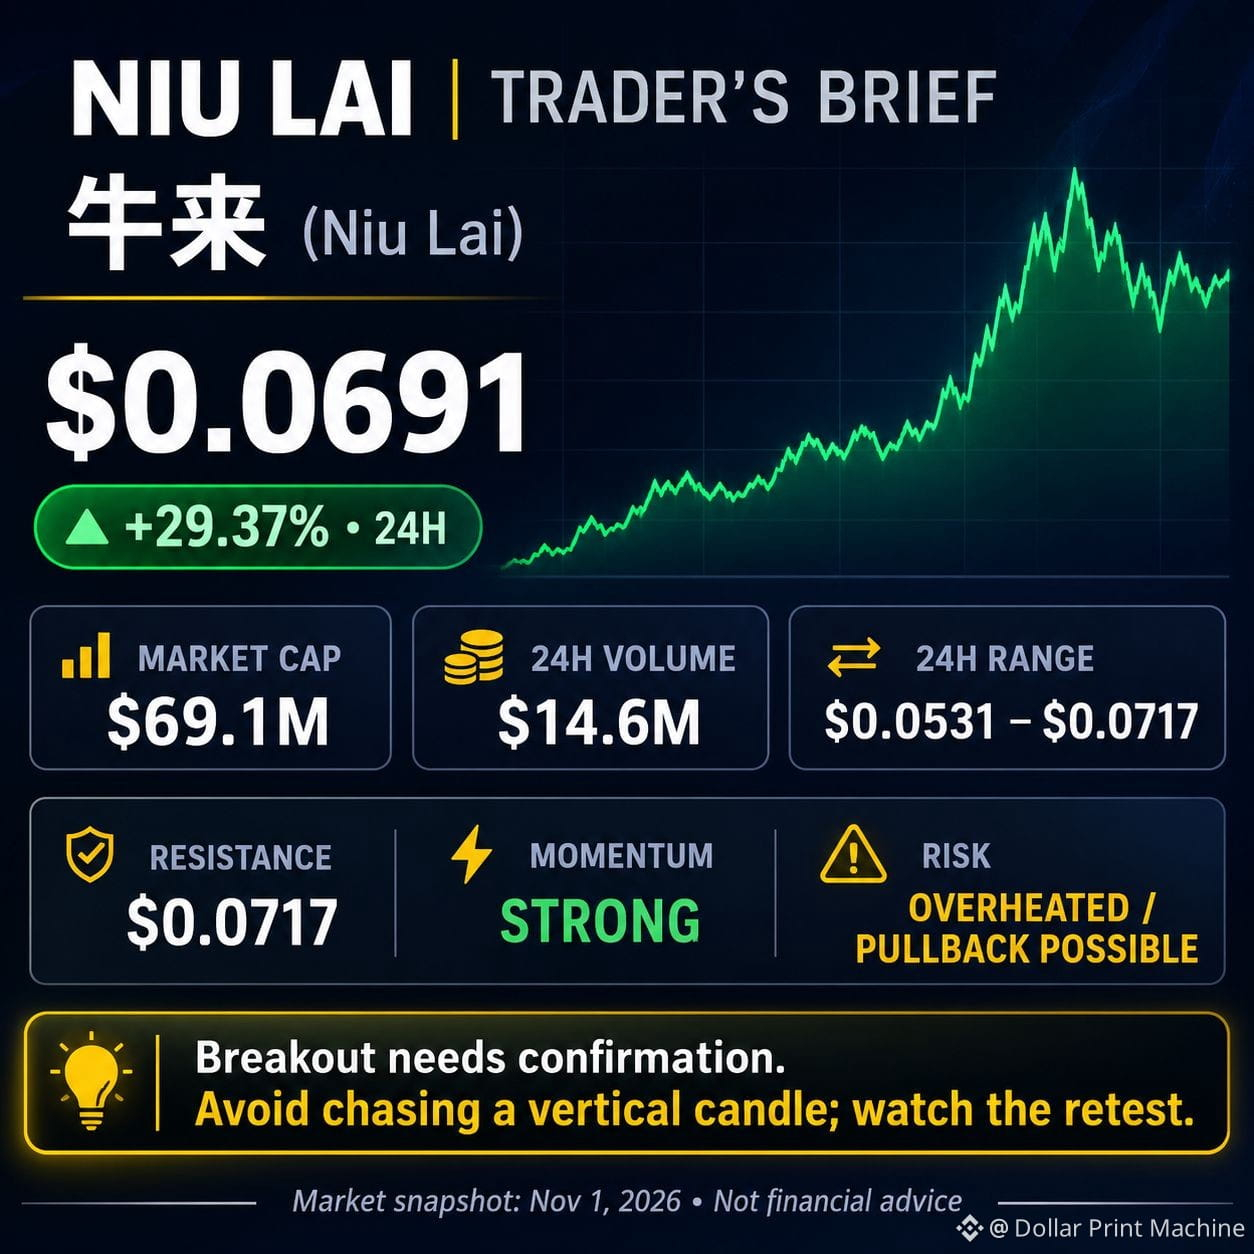
NIU LAI IS MOVING BUT IS THE REAL BREAKOUT HERE?
$牛来 (Niu Lai) is up roughly 28% in 24 hours, trading near $0.069 with a market cap around $69M. Impressive momentum, but traders should look beyond the green candle.
Momentum is strong, but chasing a pump can be expensive. With RSI readings indicating overbought conditions, a pullback or sideways consolidation wouldn't be surprising.
Watch the $0.0717 area for a breakout attempt. If price pulls back, look for buyers to defend support before considering an entry. A failed breakout could quickly turn bullish excitement into selling pressure.
Remember, Niu Lai is a meme-driven token, not a proven utility play. Trade the price action, manage risk, and never confuse hype with confirmation.
Would you buy this momentum or wait for a pullback?
#NiuLai
{spot}(牛来USDT)
NIU LAI IS MOVING BUT IS THE REAL BREAKOUT HERE?
$牛来 (Niu Lai) is up roughly 28% in 24 hours, trading near $0.069 with a market cap around $69M. Impressive momentum, but traders should look beyond the green candle.
Momentum is strong, but chasing a pump can be expensive. With RSI readings indicating overbought conditions, a pullback or sideways consolidation wouldn't be surprising.
Watch the $0.0717 area for a breakout attempt. If price pulls back, look for buyers to defend support before considering an entry. A failed breakout could quickly turn bullish excitement into selling pressure.
Remember, Niu Lai is a meme-driven token, not a proven utility play. Trade the price action, manage risk, and never confuse hype with confirmation.
Would you buy this momentum or wait for a pullback?
#NiuLai
$牛来 (Niu Lai) is up roughly 28% in 24 hours, trading near $0.069 with a market cap around $69M. Impressive momentum, but traders should look beyond the green candle.
Momentum is strong, but chasing a pump can be expensive. With RSI readings indicating overbought conditions, a pullback or sideways consolidation wouldn't be surprising.
Watch the $0.0717 area for a breakout attempt. If price pulls back, look for buyers to defend support before considering an entry. A failed breakout could quickly turn bullish excitement into selling pressure.
Remember, Niu Lai is a meme-driven token, not a proven utility play. Trade the price action, manage risk, and never confuse hype with confirmation.
Would you buy this momentum or wait for a pullback?
#NiuLai
334
$BEAM: The Real Trade Is Beyond the Price Chart
Most traders watch the candle. I watch what sits behind it.
According to Binance's latest available snapshot, BEAM was trading near $0.00326, down 2.89% over 24 hours, with a $167M market cap and $10.4M in daily volume.
- Real utility: BEAM powers transactions across a gaming-focused blockchain ecosystem, including gas fees, gaming assets and network participation.
- Supply factor: The project reports that roughly 38% of BEAM's supply has been burned over time. But burns alone cannot guarantee price appreciation.
- My trading approach: I want to see buyers defend the $0.00322–$0.00323 area, followed by stronger volume and a reclaim of $0.00345. A breakdown below support would weaken the setup.
- My verdict: BEAM has an actual ecosystem behind its token, but the chart still needs to prove that buyers are returning. I wouldn't chase a move without confirmation.
Would you accumulate BEAM at these levels, or wait for a confirmed breakout?
#BEAM
{spot}(BEAMXUSDT)
$BEAM: The Real Trade Is Beyond the Price Chart
Most traders watch the candle. I watch what sits behind it.
According to Binance's latest available snapshot, BEAM was trading near $0.00326, down 2.89% over 24 hours, with a $167M market cap and $10.4M in daily volume.
- Real utility: BEAM powers transactions across a gaming-focused blockchain ecosystem, including gas fees, gaming assets and network participation.
- Supply factor: The project reports that roughly 38% of BEAM's supply has been burned over time. But burns alone cannot guarantee price appreciation.
- My trading approach: I want to see buyers defend the $0.00322–$0.00323 area, followed by stronger volume and a reclaim of $0.00345. A breakdown below support would weaken the setup.
- My verdict: BEAM has an actual ecosystem behind its token, but the chart still needs to prove that buyers are returning. I wouldn't chase a move without confirmation.
Would you accumulate BEAM at these levels, or wait for a confirmed breakout?
#BEAM
Most traders watch the candle. I watch what sits behind it.
According to Binance's latest available snapshot, BEAM was trading near $0.00326, down 2.89% over 24 hours, with a $167M market cap and $10.4M in daily volume.
- Real utility: BEAM powers transactions across a gaming-focused blockchain ecosystem, including gas fees, gaming assets and network participation.
- Supply factor: The project reports that roughly 38% of BEAM's supply has been burned over time. But burns alone cannot guarantee price appreciation.
- My trading approach: I want to see buyers defend the $0.00322–$0.00323 area, followed by stronger volume and a reclaim of $0.00345. A breakdown below support would weaken the setup.
- My verdict: BEAM has an actual ecosystem behind its token, but the chart still needs to prove that buyers are returning. I wouldn't chase a move without confirmation.
Would you accumulate BEAM at these levels, or wait for a confirmed breakout?
#BEAM
170
SOPH: A 90%+ Rally Is Interesting. But Is It Sustainable?
$SOPH has caught my attention, but the real story goes beyond the price chart.
Recent market data showed SOPH trading near $0.0023, up approximately 55% in 24 hours, with trading volume around $51M. Price previously touched $0.001196, while the all-time high remains near $0.1105. These figures can change rapidly.
Sophon is moving away from its own Layer-2 blockchain toward consumer finance applications, including Pyre. Its new token model aims to use product revenue for SOPH buybacks and permanent burns. The key question is whether those products can generate enough sustainable revenue to support meaningful buybacks.
- Can buyers defend the recent low near $0.00120?
- Does volume remain strong after the initial surge?
- Can price reclaim and hold above the recent high near $0.00252?
A high-volume rally can signal renewed interest, but it can also attract late buyers into a sharp reversal. I would rather see consolidation and confirmation than chase a green candle.
SOPH offers a turnaround thesis, not a confirmed recovery. Execution, real revenue and sustained buying pressure will matter more than hype.
#SOPH
SOPH: A 90%+ Rally Is Interesting. But Is It Sustainable?
$SOPH has caught my attention, but the real story goes beyond the price chart.
Recent market data showed SOPH trading near $0.0023, up approximately 55% in 24 hours, with trading volume around $51M. Price previously touched $0.001196, while the all-time high remains near $0.1105. These figures can change rapidly.
Sophon is moving away from its own Layer-2 blockchain toward consumer finance applications, including Pyre. Its new token model aims to use product revenue for SOPH buybacks and permanent burns. The key question is whether those products can generate enough sustainable revenue to support meaningful buybacks.
- Can buyers defend the recent low near $0.00120?
- Does volume remain strong after the initial surge?
- Can price reclaim and hold above the recent high near $0.00252?
A high-volume rally can signal renewed interest, but it can also attract late buyers into a sharp reversal. I would rather see consolidation and confirmation than chase a green candle.
SOPH offers a turnaround thesis, not a confirmed recovery. Execution, real revenue and sustained buying pressure will matter more than hype.
#SOPH
$SOPH has caught my attention, but the real story goes beyond the price chart.
Recent market data showed SOPH trading near $0.0023, up approximately 55% in 24 hours, with trading volume around $51M. Price previously touched $0.001196, while the all-time high remains near $0.1105. These figures can change rapidly.
Sophon is moving away from its own Layer-2 blockchain toward consumer finance applications, including Pyre. Its new token model aims to use product revenue for SOPH buybacks and permanent burns. The key question is whether those products can generate enough sustainable revenue to support meaningful buybacks.
- Can buyers defend the recent low near $0.00120?
- Does volume remain strong after the initial surge?
- Can price reclaim and hold above the recent high near $0.00252?
A high-volume rally can signal renewed interest, but it can also attract late buyers into a sharp reversal. I would rather see consolidation and confirmation than chase a green candle.
SOPH offers a turnaround thesis, not a confirmed recovery. Execution, real revenue and sustained buying pressure will matter more than hype.
#SOPH

350

Article
BINANCE IS FACING ONE OF ITS TOUGHEST TESTS —AND THIS IS WHEN TRUST MATTERS MOSTA major cyberattack has shaken the crypto market. Binance has reported an estimated $6.3 billion impact, making this a serious moment for the entire digital asset industry.
But beyond the headlines, there is another story worth watching: how an exchange responds when its security is challenged.
What Investors Need to Know:
🔹 Loss coverage: Binance says it will cover the losses through its SAFU fund and company resources.
🔹 Recovery efforts: Approximately $3 billion in affected assets has been frozen on-chain, according to Binance's latest update.
🔹 Security measures: Withdrawals have been temporarily suspended while the exchange investigates, strengthens security, and works with blockchain partners and law enforcement.
🔹 Accountability matters: Investors should look for a transparent technical investigation, updated Proof of Reserves, and clear communication as the situation develops.
WHY I'M NOT WRITING BINANCE OFF
Every major financial system faces challenges, and crypto is no exception. A security incident is serious, but the response, transparency, and long-term corrective measures will help determine what comes next.
Binance has built a major role in the global crypto ecosystem. Supporting its recovery does not mean ignoring the risks. It means demanding accountability while allowing the facts and corrective actions to speak for themselves.
My Message to the Binance Community:
Don't let panic make your decisions for you. Follow verified announcements, protect your accounts, and evaluate the evidence rather than rumours.
Let's support stronger security, greater transparency, and a more resilient crypto industry.
Trust is not built by avoiding difficult moments. It's built by how those moments are handled.
Do you believe Binance can emerge from this crisis stronger? Share your perspective below.
#CryptoCommunity #CryptoSecurity
BINANCE IS FACING ONE OF ITS TOUGHEST TESTS —AND THIS IS WHEN TRUST MATTERS MOST
A major cyberattack has shaken the crypto market. Binance has reported an estimated $6.3 billion impact, making this a serious moment for the entire digital asset industry.
But beyond the headlines, there is another story worth watching: how an exchange responds when its security is challenged.
What Investors Need to Know:
🔹 Loss coverage: Binance says it will cover the losses through its SAFU fund and company resources.
🔹 Recovery efforts: Approximately $3 billion in affected assets has been frozen on-chain, according to Binance's latest update.
🔹 Security measures: Withdrawals have been temporarily suspended while the exchange investigates, strengthens security, and works with blockchain partners and law enforcement.
🔹 Accountability matters: Investors should look for a transparent technical investigation, updated Proof of Reserves, and clear communication as the situation develops.
WHY I'M NOT WRITING BINANCE OFF
Every major financial system faces challenges, and crypto is no exception. A security incident is serious, but the response, transparency, and long-term corrective measures will help determine what comes next.
Binance has built a major role in the global crypto ecosystem. Supporting its recovery does not mean ignoring the risks. It means demanding accountability while allowing the facts and corrective actions to speak for themselves.
My Message to the Binance Community:
Don't let panic make your decisions for you. Follow verified announcements, protect your accounts, and evaluate the evidence rather than rumours.
Let's support stronger security, greater transparency, and a more resilient crypto industry.
Trust is not built by avoiding difficult moments. It's built by how those moments are handled.
Do you believe Binance can emerge from this crisis stronger? Share your perspective below.
#CryptoCommunity #CryptoSecurity
But beyond the headlines, there is another story worth watching: how an exchange responds when its security is challenged.
What Investors Need to Know:
🔹 Loss coverage: Binance says it will cover the losses through its SAFU fund and company resources.
🔹 Recovery efforts: Approximately $3 billion in affected assets has been frozen on-chain, according to Binance's latest update.
🔹 Security measures: Withdrawals have been temporarily suspended while the exchange investigates, strengthens security, and works with blockchain partners and law enforcement.
🔹 Accountability matters: Investors should look for a transparent technical investigation, updated Proof of Reserves, and clear communication as the situation develops.
WHY I'M NOT WRITING BINANCE OFF
Every major financial system faces challenges, and crypto is no exception. A security incident is serious, but the response, transparency, and long-term corrective measures will help determine what comes next.
Binance has built a major role in the global crypto ecosystem. Supporting its recovery does not mean ignoring the risks. It means demanding accountability while allowing the facts and corrective actions to speak for themselves.
My Message to the Binance Community:
Don't let panic make your decisions for you. Follow verified announcements, protect your accounts, and evaluate the evidence rather than rumours.
Let's support stronger security, greater transparency, and a more resilient crypto industry.
Trust is not built by avoiding difficult moments. It's built by how those moments are handled.
Do you believe Binance can emerge from this crisis stronger? Share your perspective below.
#CryptoCommunity #CryptoSecurity
2
2
1.1k
BlackBerry Once Changed the Smartphone Game. Could Its Tokenized Stock Catch Crypto Traders’ Attention Next?
An iconic tech name is entering a different arena: crypto trading.
BlackBerry Tokenized bStocks ($BBB ) connects traditional stock-market exposure with the digital asset world, giving traders another way to explore the growing real-world asset (RWA) trend.
But tokenized exposure isn’t the same as owning BlackBerry shares directly. Price movements, liquidity, market sentiment, and the structure of the token all deserve attention.
Trading volume, price stability, and how closely BBB tracks BlackBerry’s underlying stock.
The bigger opportunity may be the trend itself: if tokenized equities gain traction, the line between traditional finance and crypto could become increasingly blurred.
Would you trade a tokenized stock, or stick to traditional shares?
#BlackBerry #TokenizedStocks
{spot}(BBBUSDT)
BlackBerry Once Changed the Smartphone Game. Could Its Tokenized Stock Catch Crypto Traders’ Attention Next?
An iconic tech name is entering a different arena: crypto trading.
BlackBerry Tokenized bStocks ($BBB ) connects traditional stock-market exposure with the digital asset world, giving traders another way to explore the growing real-world asset (RWA) trend.
But tokenized exposure isn’t the same as owning BlackBerry shares directly. Price movements, liquidity, market sentiment, and the structure of the token all deserve attention.
Trading volume, price stability, and how closely BBB tracks BlackBerry’s underlying stock.
The bigger opportunity may be the trend itself: if tokenized equities gain traction, the line between traditional finance and crypto could become increasingly blurred.
Would you trade a tokenized stock, or stick to traditional shares?
#BlackBerry #TokenizedStocks
An iconic tech name is entering a different arena: crypto trading.
BlackBerry Tokenized bStocks ($BBB ) connects traditional stock-market exposure with the digital asset world, giving traders another way to explore the growing real-world asset (RWA) trend.
But tokenized exposure isn’t the same as owning BlackBerry shares directly. Price movements, liquidity, market sentiment, and the structure of the token all deserve attention.
Trading volume, price stability, and how closely BBB tracks BlackBerry’s underlying stock.
The bigger opportunity may be the trend itself: if tokenized equities gain traction, the line between traditional finance and crypto could become increasingly blurred.
Would you trade a tokenized stock, or stick to traditional shares?
#BlackBerry #TokenizedStocks

2
203
Verified

Article
AI NEEDS COMPUTING POWER. COMPUTING POWER NEEDS CAPITAL. $CHIP IS TARGETING THAT GAPUSD.AI (CHIP): Is the AI Financing Narrative Heating Up Again?
AI is not just about chatbots and powerful models. Behind the AI boom lies a massive demand for GPUs, data centers, and the capital needed to build them.
That’s where USD.AI enters the picture.
What makes this project interesting?
USD.AI is building decentralized financing infrastructure that allows AI infrastructure operators to use GPU hardware as collateral to access funding. Its $CHIP token serves as the ecosystem’s governance token.
📊 The market is getting attention:
💰 Recent price: approximately $0.0556
🚀 24-hour gain: approximately 22.4%
📈 24-hour trading activity: elevated alongside the price move
Figures are from Binance's displayed data and may change rapidly.
🎯 The bigger opportunity isn't just the price pump.
It's whether USD.AI can turn growing demand for AI computing into sustainable lending activity, stronger adoption, and long-term ecosystem value.
⚠️ But don't ignore the risk: A sharp rally can attract momentum traders, yet it can also trigger profit-taking. Watch trading volume, support levels, and whether buyers can sustain the move before chasing the green candle.
AI infrastructure financing is a narrative worth watching—but execution matters more than hype.
Is $CHIP becoming a serious AI-finance contender, or is this rally mainly short-term speculation?
👇 Share your view below!
#CHIP
{spot}(CHIPUSDT)
AI NEEDS COMPUTING POWER. COMPUTING POWER NEEDS CAPITAL. $CHIP IS TARGETING THAT GAP
USD.AI (CHIP): Is the AI Financing Narrative Heating Up Again?
AI is not just about chatbots and powerful models. Behind the AI boom lies a massive demand for GPUs, data centers, and the capital needed to build them.
That’s where USD.AI enters the picture.
What makes this project interesting?
USD.AI is building decentralized financing infrastructure that allows AI infrastructure operators to use GPU hardware as collateral to access funding. Its $CHIP token serves as the ecosystem’s governance token.
📊 The market is getting attention:
💰 Recent price: approximately $0.0556
🚀 24-hour gain: approximately 22.4%
📈 24-hour trading activity: elevated alongside the price move
Figures are from Binance's displayed data and may change rapidly.
🎯 The bigger opportunity isn't just the price pump.
It's whether USD.AI can turn growing demand for AI computing into sustainable lending activity, stronger adoption, and long-term ecosystem value.
⚠️ But don't ignore the risk: A sharp rally can attract momentum traders, yet it can also trigger profit-taking. Watch trading volume, support levels, and whether buyers can sustain the move before chasing the green candle.
AI infrastructure financing is a narrative worth watching—but execution matters more than hype.
Is $CHIP becoming a serious AI-finance contender, or is this rally mainly short-term speculation?
👇 Share your view below!
#CHIP
AI is not just about chatbots and powerful models. Behind the AI boom lies a massive demand for GPUs, data centers, and the capital needed to build them.
That’s where USD.AI enters the picture.
What makes this project interesting?
USD.AI is building decentralized financing infrastructure that allows AI infrastructure operators to use GPU hardware as collateral to access funding. Its $CHIP token serves as the ecosystem’s governance token.
📊 The market is getting attention:
💰 Recent price: approximately $0.0556
🚀 24-hour gain: approximately 22.4%
📈 24-hour trading activity: elevated alongside the price move
Figures are from Binance's displayed data and may change rapidly.
🎯 The bigger opportunity isn't just the price pump.
It's whether USD.AI can turn growing demand for AI computing into sustainable lending activity, stronger adoption, and long-term ecosystem value.
⚠️ But don't ignore the risk: A sharp rally can attract momentum traders, yet it can also trigger profit-taking. Watch trading volume, support levels, and whether buyers can sustain the move before chasing the green candle.
AI infrastructure financing is a narrative worth watching—but execution matters more than hype.
Is $CHIP becoming a serious AI-finance contender, or is this rally mainly short-term speculation?
👇 Share your view below!
#CHIP
156

Article
BTC ETF Outflows Hit $636 Million as China Seeks $5 Billion in BTC: Is BTC Heading for a Correction?Bitcoin faces a critical test as institutional investors withdraw capital from spot Bitcoin ETFs while Chinese prosecutors pursue nearly 62,000 BTC linked to a major investment fraud. Is this a warning sign for the market—or a temporary shakeout before the next opportunity?
Published: October 24, 2026
Two Headlines, One Critical Question for Bitcoin Investors
Bitcoin has spent years attracting institutional capital and gaining mainstream acceptance. But recent developments show why that growth does not guarantee uninterrupted demand.
On October 22, U.S. spot Bitcoin ETFs recorded approximately $635.6 million in net outflows. Meanwhile, Chinese prosecutors advanced a legal effort to confiscate 61,896 BTC connected to a major investment fraud.
At a reported Bitcoin price of approximately $81,460 on October 23, those holdings were worth around $5.04 billion.
These developments matter for different reasons:
ETF outflows signal changes in investment demand.China's confiscation case raises questions about ownership and potential future selling pressure.Bitcoin's price reaction reveals how the market absorbs these developments.
However, these are separate events. There is no established evidence that the ETF withdrawals were caused by China's legal proceedings.
1. Bitcoin ETFs Lose $635.6 Million in a Single Day
The biggest immediate market signal came from U.S. spot Bitcoin ETFs.
According to reports, these funds experienced approximately $635.6 million in net outflows on October 22—the largest single-day outflow of October at that point.
The reversal was particularly notable because Bitcoin ETFs had attracted approximately $1.07 billion over the previous three sessions.
After those inflows pushed October's net position to around $460 million, the latest withdrawals reportedly moved the month's net flows into negative territory, at approximately $176 million.
Why ETF outflows matter
Spot Bitcoin ETFs allow investors to gain Bitcoin exposure through conventional brokerage accounts.
When investors put money into these funds, providers generally need to acquire additional Bitcoin. When investors withdraw money, funds may need to reduce their holdings.
Although the timing and mechanics vary, sustained outflows can weaken an important source of market demand.
The key question is whether the latest withdrawal represents a temporary adjustment or the beginning of a more persistent institutional selling trend.
One negative session cannot answer that question. Several consecutive sessions of outflows would provide stronger evidence of weakening demand.
2. Which Bitcoin ETFs Experienced the Biggest Withdrawals?
Reported figures identified several major funds contributing to the October 22 outflows.
BlackRock IBIT: approximately $254.1 million in outflows.Fidelity FBTC: approximately $217.5 million in outflows.ARK 21Shares ARKB: approximately $109 million in outflows.
These are selected fund figures, not the complete ETF breakdown.
BlackRock and Fidelity are particularly important because their funds provide significant channels for traditional investors to access Bitcoin.
The withdrawals suggest that selling pressure was not limited to a single small fund. However, daily redemption data alone cannot establish whether investors are abandoning Bitcoin permanently, taking profits or temporarily reducing risk.
Institutional capital can move quickly when market conditions change. The same investors may return if prices, liquidity and economic expectations become more attractive.
3. Bitcoin Holds Near $81,460 Despite Heavy Outflows
One of the most interesting aspects of the latest market report is that Bitcoin remained relatively stable despite the size of the ETF withdrawals.
On October 23, Bitcoin traded near $81,460. The report described little change over 24 hours, alongside a weekly decline of approximately 0.4% and a 30-day decline of around 4.8%.
This creates an important contrast: ETF flows deteriorated sharply, but Bitcoin did not collapse in proportion to the headline outflow.
What could explain this?
Other buyers may be absorbing supply. Spot-market demand, purchases outside ETFs and other trading activity can offset some selling pressure.
ETF redemptions do not necessarily translate into immediate open-market selling. Fund mechanics and the timing of transactions matter.
Negative expectations may already be reflected in the price. When investors anticipate bad news, its eventual arrival can sometimes produce a relatively muted reaction.
These are possible explanations, not confirmed conclusions.
For traders, the more useful question is whether Bitcoin can maintain support while ETF flows remain weak.
If BTC holds steady despite persistent outflows, that may suggest other buyers are providing a cushion. If outflows continue alongside a price breakdown, the bearish signal becomes stronger.
4. China Seeks 61,896 Bitcoin Worth Approximately $5 Billion
The second development involves a different kind of risk: the legal status of a massive cryptocurrency holding.
Chinese prosecutors have applied to confiscate 61,896 BTC linked to an investment fraud associated with Tianjin Lantian Gerui Electronic Technology.
The company allegedly marketed unlicensed wealth-management products between 2014 and 2017, promising guaranteed principal repayments and unusually high returns.
According to reports, the scheme attracted more than 102,000 investors and raised approximately 40.38 billion yuan. Chinese authorities have reported investor losses approaching 20 billion yuan.
The cryptocurrency was traced to Zhimin Qian, who left China in 2017 and was later arrested in the United Kingdom. British authorities seized the Bitcoin during their investigation.
Qian was sentenced in London in November 2025 to 11 years and eight months in prison after pleading guilty to money-laundering offences.
The case has since developed into an international dispute over the recovered assets.
Why does China want the Bitcoin?
Chinese prosecutors argue that the seized assets represent proceeds of the alleged investment fraud and should be confiscated through the legal process.
The application reportedly covers more than Bitcoin, including other cryptocurrencies, cash, jewellery, bank deposits and investment holdings.
The Tianjin No. 2 Intermediate People's Court accepted the confiscation application on September 28, 2026. A subsequent notice opened a six-month period for victims and other interested parties to participate.
However, the application is not a final ruling awarding the Bitcoin to China.
The legal ownership of the assets remains unresolved, and victims' claims are an important part of the proceedings.
5. Could China's Bitcoin Case Trigger a Major Sell-Off?
This is where the story becomes particularly relevant to traders.
At approximately $81,460 per Bitcoin, 61,896 BTC would be worth roughly $5.04 billion.
That is a substantial asset pool, but its size alone does not establish how much selling pressure the market will face.
The key distinction is between confiscation and liquidation.
Confiscation determines whether assets can legally be taken by the relevant authorities. Liquidation involves converting those assets into cash or another form of value.
These are different events.
Three possible scenarios deserve attention.
Scenario 1: The Bitcoin remains frozen.
Legal proceedings continue without an immediate sale. The case remains a headline risk, but the coins do not automatically become new exchange supply.
Scenario 2: Authorities eventually sell the Bitcoin.
A large, rapid sale could add selling pressure, particularly if market liquidity is weak. An orderly sale spread over time could have a different effect.
Scenario 3: The assets are distributed to eligible claimants.
If compensation or other transfers occur, recipients may hold, transfer or sell their Bitcoin. The eventual market impact would depend on their decisions.
At present, the case should be treated as a potential future supply event—not proof that 61,896 BTC are about to hit the market.
6. What Connects ETF Outflows and China's Bitcoin Case?
The two developments are related through market sentiment, but they should not be confused with one another.
ETF withdrawals provide a current, measurable indication of investor flows. China's confiscation effort is a legal process that could affect the disposition of a large Bitcoin holding in the future.
One concerns demand today. The other concerns uncertain future ownership and potential supply.
Together, they create an environment in which traders have reason to watch both sides of the market.
The critical factors are:
ETF flows: Are institutional investors continuing to withdraw capital?Price action: Is Bitcoin holding important support levels?Potential supply: Will the legal process eventually result in a confirmed sale?Liquidity: Can the market absorb selling pressure without a sharp price decline?
These factors can influence Bitcoin's direction, but none independently guarantees a bullish or bearish outcome.
7. Macroeconomic Pressure Adds Another Layer of Uncertainty
Bitcoin does not trade in isolation.
The October 23 market report described a broader risk-off environment, with oil prices moving above $111 per barrel, technology stocks declining and major U.S. equity indexes coming under pressure. Investors were also watching the Federal Reserve's October 27–28 meeting.
These conditions matter because Bitcoin can behave like a risk-sensitive asset during periods of market stress.
When investors become concerned about economic growth, inflation, interest rates or expensive technology stocks, they may reduce exposure to volatile assets across several markets simultaneously.
Higher oil prices can complicate the inflation outlook. Persistent inflation could limit the Federal Reserve's flexibility to ease monetary policy, depending on the broader economic data.
For Bitcoin, the potential chain reaction is straightforward:
Rising uncertainty encourages investors to reduce risk.Reduced risk appetite can weaken demand for speculative assets.Weak ETF flows can reinforce concerns about institutional buying.If selling accelerates while liquidity deteriorates, price volatility may increase.
This is a possible scenario, not a guaranteed forecast. Bitcoin's reaction will depend on actual economic developments, investor positioning and the balance between buyers and sellers.
8. Bitcoin Price Outlook: What Should Traders Watch?
With Bitcoin near $81,460 in the latest cited snapshot, traders should focus on price confirmation rather than making decisions based on headlines alone.
The following are illustrative monitoring zones, not independently verified live Binance technical levels.
Bullish scenario: $84,800–$87,500
A recovery through this zone, supported by improving spot demand and renewed ETF inflows, would strengthen the case for a short-term rebound. A breakout would still require confirmation.
Neutral scenario: $80,000–$84,800
Continued trading within this broad range would suggest consolidation. ETF flows, trading volume and reactions at the range boundaries would help determine the next move.
Bearish scenario: Below $80,000, followed by $77,500
A sustained breakdown below $80,000, particularly alongside continuing ETF outflows, would raise downside risk. The $77,500 area is a potential scenario level, not a guaranteed target.
What would strengthen the bullish case?
A more convincing recovery would involve several developments occurring together:
ETF flows return to sustained positive territory.Bitcoin reclaims nearby resistance and holds it on a daily closing basis.Spot buying strengthens rather than relying primarily on leveraged futures.Broader financial markets become more supportive of risk assets.
What would strengthen the bearish case?
The downside scenario would become more credible if ETF outflows continued, Bitcoin lost the $80,000 area decisively and market liquidity weakened.
Confirmed news of an imminent liquidation of the disputed Bitcoin could also affect sentiment. Traders should distinguish official announcements from rumours.
9. Three Indicators Smart Bitcoin Investors Should Track
Rather than trying to predict every headline, investors can monitor three useful indicators.
1. Daily and weekly spot Bitcoin ETF flows
One negative day is not enough to establish a trend. Several sessions of sustained outflows would provide stronger evidence that this source of demand is weakening.
2. Spot volume versus derivatives activity
A price rally supported by spot buying is generally more convincing than one driven primarily by leveraged positions. Funding rates, open interest and liquidation data can help identify when a move is becoming crowded, although no indicator guarantees a reversal.
3. Verified developments in China's confiscation case
Court decisions, confirmed asset transfers and official sale announcements would be more significant than speculation about what authorities might eventually do.
Investors should also monitor inflation, interest-rate expectations and broader equity-market conditions.
Is Bitcoin Facing a Major Turning Point?
Bitcoin's latest developments present a challenging but not one-sided picture.
The $635.6 million ETF outflow is a warning that institutional demand can fluctuate sharply, even after several days of strong inflows. The reported return of October ETF flows to negative territory adds to the uncertainty.
Meanwhile, China's effort to confiscate 61,896 BTC introduces a separate legal issue involving approximately $5 billion in cryptocurrency. Yet confiscation does not automatically mean liquidation, and the final ownership of the assets remains unresolved.
The strongest conclusion is not that Bitcoin must crash—or that a rebound is guaranteed.
It is that Bitcoin needs to demonstrate resilient demand while investors assess the possibility of future supply changes.
If ETF inflows recover and BTC holds key price levels, the recent weakness could prove temporary. If outflows persist and support breaks, the market may face a deeper correction.
For long-term investors, patience and risk management matter more than reacting to every alarming headline. For short-term traders, confirmed price action and liquidity conditions are more useful than assuming the two stories guarantee a particular direction.
The next phase of Bitcoin's market will depend on the balance between real buying demand, broader financial conditions and developments that actually change available supply.
What do you think: is Bitcoin preparing for a recovery near $80,000, or could persistent ETF outflows open the door to another correction?
Share your analysis in the comments.
Disclaimer: This article is for educational and informational purposes only and does not constitute financial or investment advice. Cryptocurrency prices are volatile. Market figures reflect the latest cited reports available for October 23–24, 2026, and may change. Verify live prices and ETF data before making investment decisions.
BTC ETF Outflows Hit $636 Million as China Seeks $5 Billion in BTC: Is BTC Heading for a Correction?
Bitcoin faces a critical test as institutional investors withdraw capital from spot Bitcoin ETFs while Chinese prosecutors pursue nearly 62,000 BTC linked to a major investment fraud. Is this a warning sign for the market—or a temporary shakeout before the next opportunity?
Published: October 24, 2026
Two Headlines, One Critical Question for Bitcoin Investors
Bitcoin has spent years attracting institutional capital and gaining mainstream acceptance. But recent developments show why that growth does not guarantee uninterrupted demand.
On October 22, U.S. spot Bitcoin ETFs recorded approximately $635.6 million in net outflows. Meanwhile, Chinese prosecutors advanced a legal effort to confiscate 61,896 BTC connected to a major investment fraud.
At a reported Bitcoin price of approximately $81,460 on October 23, those holdings were worth around $5.04 billion.
These developments matter for different reasons:
ETF outflows signal changes in investment demand.China's confiscation case raises questions about ownership and potential future selling pressure.Bitcoin's price reaction reveals how the market absorbs these developments.
However, these are separate events. There is no established evidence that the ETF withdrawals were caused by China's legal proceedings.
1. Bitcoin ETFs Lose $635.6 Million in a Single Day
The biggest immediate market signal came from U.S. spot Bitcoin ETFs.
According to reports, these funds experienced approximately $635.6 million in net outflows on October 22—the largest single-day outflow of October at that point.
The reversal was particularly notable because Bitcoin ETFs had attracted approximately $1.07 billion over the previous three sessions.
After those inflows pushed October's net position to around $460 million, the latest withdrawals reportedly moved the month's net flows into negative territory, at approximately $176 million.
Why ETF outflows matter
Spot Bitcoin ETFs allow investors to gain Bitcoin exposure through conventional brokerage accounts.
When investors put money into these funds, providers generally need to acquire additional Bitcoin. When investors withdraw money, funds may need to reduce their holdings.
Although the timing and mechanics vary, sustained outflows can weaken an important source of market demand.
The key question is whether the latest withdrawal represents a temporary adjustment or the beginning of a more persistent institutional selling trend.
One negative session cannot answer that question. Several consecutive sessions of outflows would provide stronger evidence of weakening demand.
2. Which Bitcoin ETFs Experienced the Biggest Withdrawals?
Reported figures identified several major funds contributing to the October 22 outflows.
BlackRock IBIT: approximately $254.1 million in outflows.Fidelity FBTC: approximately $217.5 million in outflows.ARK 21Shares ARKB: approximately $109 million in outflows.
These are selected fund figures, not the complete ETF breakdown.
BlackRock and Fidelity are particularly important because their funds provide significant channels for traditional investors to access Bitcoin.
The withdrawals suggest that selling pressure was not limited to a single small fund. However, daily redemption data alone cannot establish whether investors are abandoning Bitcoin permanently, taking profits or temporarily reducing risk.
Institutional capital can move quickly when market conditions change. The same investors may return if prices, liquidity and economic expectations become more attractive.
3. Bitcoin Holds Near $81,460 Despite Heavy Outflows
One of the most interesting aspects of the latest market report is that Bitcoin remained relatively stable despite the size of the ETF withdrawals.
On October 23, Bitcoin traded near $81,460. The report described little change over 24 hours, alongside a weekly decline of approximately 0.4% and a 30-day decline of around 4.8%.
This creates an important contrast: ETF flows deteriorated sharply, but Bitcoin did not collapse in proportion to the headline outflow.
What could explain this?
Other buyers may be absorbing supply. Spot-market demand, purchases outside ETFs and other trading activity can offset some selling pressure.
ETF redemptions do not necessarily translate into immediate open-market selling. Fund mechanics and the timing of transactions matter.
Negative expectations may already be reflected in the price. When investors anticipate bad news, its eventual arrival can sometimes produce a relatively muted reaction.
These are possible explanations, not confirmed conclusions.
For traders, the more useful question is whether Bitcoin can maintain support while ETF flows remain weak.
If BTC holds steady despite persistent outflows, that may suggest other buyers are providing a cushion. If outflows continue alongside a price breakdown, the bearish signal becomes stronger.
4. China Seeks 61,896 Bitcoin Worth Approximately $5 Billion
The second development involves a different kind of risk: the legal status of a massive cryptocurrency holding.
Chinese prosecutors have applied to confiscate 61,896 BTC linked to an investment fraud associated with Tianjin Lantian Gerui Electronic Technology.
The company allegedly marketed unlicensed wealth-management products between 2014 and 2017, promising guaranteed principal repayments and unusually high returns.
According to reports, the scheme attracted more than 102,000 investors and raised approximately 40.38 billion yuan. Chinese authorities have reported investor losses approaching 20 billion yuan.
The cryptocurrency was traced to Zhimin Qian, who left China in 2017 and was later arrested in the United Kingdom. British authorities seized the Bitcoin during their investigation.
Qian was sentenced in London in November 2025 to 11 years and eight months in prison after pleading guilty to money-laundering offences.
The case has since developed into an international dispute over the recovered assets.
Why does China want the Bitcoin?
Chinese prosecutors argue that the seized assets represent proceeds of the alleged investment fraud and should be confiscated through the legal process.
The application reportedly covers more than Bitcoin, including other cryptocurrencies, cash, jewellery, bank deposits and investment holdings.
The Tianjin No. 2 Intermediate People's Court accepted the confiscation application on September 28, 2026. A subsequent notice opened a six-month period for victims and other interested parties to participate.
However, the application is not a final ruling awarding the Bitcoin to China.
The legal ownership of the assets remains unresolved, and victims' claims are an important part of the proceedings.
5. Could China's Bitcoin Case Trigger a Major Sell-Off?
This is where the story becomes particularly relevant to traders.
At approximately $81,460 per Bitcoin, 61,896 BTC would be worth roughly $5.04 billion.
That is a substantial asset pool, but its size alone does not establish how much selling pressure the market will face.
The key distinction is between confiscation and liquidation.
Confiscation determines whether assets can legally be taken by the relevant authorities. Liquidation involves converting those assets into cash or another form of value.
These are different events.
Three possible scenarios deserve attention.
Scenario 1: The Bitcoin remains frozen.
Legal proceedings continue without an immediate sale. The case remains a headline risk, but the coins do not automatically become new exchange supply.
Scenario 2: Authorities eventually sell the Bitcoin.
A large, rapid sale could add selling pressure, particularly if market liquidity is weak. An orderly sale spread over time could have a different effect.
Scenario 3: The assets are distributed to eligible claimants.
If compensation or other transfers occur, recipients may hold, transfer or sell their Bitcoin. The eventual market impact would depend on their decisions.
At present, the case should be treated as a potential future supply event—not proof that 61,896 BTC are about to hit the market.
6. What Connects ETF Outflows and China's Bitcoin Case?
The two developments are related through market sentiment, but they should not be confused with one another.
ETF withdrawals provide a current, measurable indication of investor flows. China's confiscation effort is a legal process that could affect the disposition of a large Bitcoin holding in the future.
One concerns demand today. The other concerns uncertain future ownership and potential supply.
Together, they create an environment in which traders have reason to watch both sides of the market.
The critical factors are:
ETF flows: Are institutional investors continuing to withdraw capital?Price action: Is Bitcoin holding important support levels?Potential supply: Will the legal process eventually result in a confirmed sale?Liquidity: Can the market absorb selling pressure without a sharp price decline?
These factors can influence Bitcoin's direction, but none independently guarantees a bullish or bearish outcome.
7. Macroeconomic Pressure Adds Another Layer of Uncertainty
Bitcoin does not trade in isolation.
The October 23 market report described a broader risk-off environment, with oil prices moving above $111 per barrel, technology stocks declining and major U.S. equity indexes coming under pressure. Investors were also watching the Federal Reserve's October 27–28 meeting.
These conditions matter because Bitcoin can behave like a risk-sensitive asset during periods of market stress.
When investors become concerned about economic growth, inflation, interest rates or expensive technology stocks, they may reduce exposure to volatile assets across several markets simultaneously.
Higher oil prices can complicate the inflation outlook. Persistent inflation could limit the Federal Reserve's flexibility to ease monetary policy, depending on the broader economic data.
For Bitcoin, the potential chain reaction is straightforward:
Rising uncertainty encourages investors to reduce risk.Reduced risk appetite can weaken demand for speculative assets.Weak ETF flows can reinforce concerns about institutional buying.If selling accelerates while liquidity deteriorates, price volatility may increase.
This is a possible scenario, not a guaranteed forecast. Bitcoin's reaction will depend on actual economic developments, investor positioning and the balance between buyers and sellers.
8. Bitcoin Price Outlook: What Should Traders Watch?
With Bitcoin near $81,460 in the latest cited snapshot, traders should focus on price confirmation rather than making decisions based on headlines alone.
The following are illustrative monitoring zones, not independently verified live Binance technical levels.
Bullish scenario: $84,800–$87,500
A recovery through this zone, supported by improving spot demand and renewed ETF inflows, would strengthen the case for a short-term rebound. A breakout would still require confirmation.
Neutral scenario: $80,000–$84,800
Continued trading within this broad range would suggest consolidation. ETF flows, trading volume and reactions at the range boundaries would help determine the next move.
Bearish scenario: Below $80,000, followed by $77,500
A sustained breakdown below $80,000, particularly alongside continuing ETF outflows, would raise downside risk. The $77,500 area is a potential scenario level, not a guaranteed target.
What would strengthen the bullish case?
A more convincing recovery would involve several developments occurring together:
ETF flows return to sustained positive territory.Bitcoin reclaims nearby resistance and holds it on a daily closing basis.Spot buying strengthens rather than relying primarily on leveraged futures.Broader financial markets become more supportive of risk assets.
What would strengthen the bearish case?
The downside scenario would become more credible if ETF outflows continued, Bitcoin lost the $80,000 area decisively and market liquidity weakened.
Confirmed news of an imminent liquidation of the disputed Bitcoin could also affect sentiment. Traders should distinguish official announcements from rumours.
9. Three Indicators Smart Bitcoin Investors Should Track
Rather than trying to predict every headline, investors can monitor three useful indicators.
1. Daily and weekly spot Bitcoin ETF flows
One negative day is not enough to establish a trend. Several sessions of sustained outflows would provide stronger evidence that this source of demand is weakening.
2. Spot volume versus derivatives activity
A price rally supported by spot buying is generally more convincing than one driven primarily by leveraged positions. Funding rates, open interest and liquidation data can help identify when a move is becoming crowded, although no indicator guarantees a reversal.
3. Verified developments in China's confiscation case
Court decisions, confirmed asset transfers and official sale announcements would be more significant than speculation about what authorities might eventually do.
Investors should also monitor inflation, interest-rate expectations and broader equity-market conditions.
Is Bitcoin Facing a Major Turning Point?
Bitcoin's latest developments present a challenging but not one-sided picture.
The $635.6 million ETF outflow is a warning that institutional demand can fluctuate sharply, even after several days of strong inflows. The reported return of October ETF flows to negative territory adds to the uncertainty.
Meanwhile, China's effort to confiscate 61,896 BTC introduces a separate legal issue involving approximately $5 billion in cryptocurrency. Yet confiscation does not automatically mean liquidation, and the final ownership of the assets remains unresolved.
The strongest conclusion is not that Bitcoin must crash—or that a rebound is guaranteed.
It is that Bitcoin needs to demonstrate resilient demand while investors assess the possibility of future supply changes.
If ETF inflows recover and BTC holds key price levels, the recent weakness could prove temporary. If outflows persist and support breaks, the market may face a deeper correction.
For long-term investors, patience and risk management matter more than reacting to every alarming headline. For short-term traders, confirmed price action and liquidity conditions are more useful than assuming the two stories guarantee a particular direction.
The next phase of Bitcoin's market will depend on the balance between real buying demand, broader financial conditions and developments that actually change available supply.
What do you think: is Bitcoin preparing for a recovery near $80,000, or could persistent ETF outflows open the door to another correction?
Share your analysis in the comments.
Disclaimer: This article is for educational and informational purposes only and does not constitute financial or investment advice. Cryptocurrency prices are volatile. Market figures reflect the latest cited reports available for October 23–24, 2026, and may change. Verify live prices and ETF data before making investment decisions.
Published: October 24, 2026
Two Headlines, One Critical Question for Bitcoin Investors
Bitcoin has spent years attracting institutional capital and gaining mainstream acceptance. But recent developments show why that growth does not guarantee uninterrupted demand.
On October 22, U.S. spot Bitcoin ETFs recorded approximately $635.6 million in net outflows. Meanwhile, Chinese prosecutors advanced a legal effort to confiscate 61,896 BTC connected to a major investment fraud.
At a reported Bitcoin price of approximately $81,460 on October 23, those holdings were worth around $5.04 billion.
These developments matter for different reasons:
ETF outflows signal changes in investment demand.China's confiscation case raises questions about ownership and potential future selling pressure.Bitcoin's price reaction reveals how the market absorbs these developments.
However, these are separate events. There is no established evidence that the ETF withdrawals were caused by China's legal proceedings.
1. Bitcoin ETFs Lose $635.6 Million in a Single Day
The biggest immediate market signal came from U.S. spot Bitcoin ETFs.
According to reports, these funds experienced approximately $635.6 million in net outflows on October 22—the largest single-day outflow of October at that point.
The reversal was particularly notable because Bitcoin ETFs had attracted approximately $1.07 billion over the previous three sessions.
After those inflows pushed October's net position to around $460 million, the latest withdrawals reportedly moved the month's net flows into negative territory, at approximately $176 million.
Why ETF outflows matter
Spot Bitcoin ETFs allow investors to gain Bitcoin exposure through conventional brokerage accounts.
When investors put money into these funds, providers generally need to acquire additional Bitcoin. When investors withdraw money, funds may need to reduce their holdings.
Although the timing and mechanics vary, sustained outflows can weaken an important source of market demand.
The key question is whether the latest withdrawal represents a temporary adjustment or the beginning of a more persistent institutional selling trend.
One negative session cannot answer that question. Several consecutive sessions of outflows would provide stronger evidence of weakening demand.
2. Which Bitcoin ETFs Experienced the Biggest Withdrawals?
Reported figures identified several major funds contributing to the October 22 outflows.
BlackRock IBIT: approximately $254.1 million in outflows.Fidelity FBTC: approximately $217.5 million in outflows.ARK 21Shares ARKB: approximately $109 million in outflows.
These are selected fund figures, not the complete ETF breakdown.
BlackRock and Fidelity are particularly important because their funds provide significant channels for traditional investors to access Bitcoin.
The withdrawals suggest that selling pressure was not limited to a single small fund. However, daily redemption data alone cannot establish whether investors are abandoning Bitcoin permanently, taking profits or temporarily reducing risk.
Institutional capital can move quickly when market conditions change. The same investors may return if prices, liquidity and economic expectations become more attractive.
3. Bitcoin Holds Near $81,460 Despite Heavy Outflows
One of the most interesting aspects of the latest market report is that Bitcoin remained relatively stable despite the size of the ETF withdrawals.
On October 23, Bitcoin traded near $81,460. The report described little change over 24 hours, alongside a weekly decline of approximately 0.4% and a 30-day decline of around 4.8%.
This creates an important contrast: ETF flows deteriorated sharply, but Bitcoin did not collapse in proportion to the headline outflow.
What could explain this?
Other buyers may be absorbing supply. Spot-market demand, purchases outside ETFs and other trading activity can offset some selling pressure.
ETF redemptions do not necessarily translate into immediate open-market selling. Fund mechanics and the timing of transactions matter.
Negative expectations may already be reflected in the price. When investors anticipate bad news, its eventual arrival can sometimes produce a relatively muted reaction.
These are possible explanations, not confirmed conclusions.
For traders, the more useful question is whether Bitcoin can maintain support while ETF flows remain weak.
If BTC holds steady despite persistent outflows, that may suggest other buyers are providing a cushion. If outflows continue alongside a price breakdown, the bearish signal becomes stronger.
4. China Seeks 61,896 Bitcoin Worth Approximately $5 Billion
The second development involves a different kind of risk: the legal status of a massive cryptocurrency holding.
Chinese prosecutors have applied to confiscate 61,896 BTC linked to an investment fraud associated with Tianjin Lantian Gerui Electronic Technology.
The company allegedly marketed unlicensed wealth-management products between 2014 and 2017, promising guaranteed principal repayments and unusually high returns.
According to reports, the scheme attracted more than 102,000 investors and raised approximately 40.38 billion yuan. Chinese authorities have reported investor losses approaching 20 billion yuan.
The cryptocurrency was traced to Zhimin Qian, who left China in 2017 and was later arrested in the United Kingdom. British authorities seized the Bitcoin during their investigation.
Qian was sentenced in London in November 2025 to 11 years and eight months in prison after pleading guilty to money-laundering offences.
The case has since developed into an international dispute over the recovered assets.
Why does China want the Bitcoin?
Chinese prosecutors argue that the seized assets represent proceeds of the alleged investment fraud and should be confiscated through the legal process.
The application reportedly covers more than Bitcoin, including other cryptocurrencies, cash, jewellery, bank deposits and investment holdings.
The Tianjin No. 2 Intermediate People's Court accepted the confiscation application on September 28, 2026. A subsequent notice opened a six-month period for victims and other interested parties to participate.
However, the application is not a final ruling awarding the Bitcoin to China.
The legal ownership of the assets remains unresolved, and victims' claims are an important part of the proceedings.
5. Could China's Bitcoin Case Trigger a Major Sell-Off?
This is where the story becomes particularly relevant to traders.
At approximately $81,460 per Bitcoin, 61,896 BTC would be worth roughly $5.04 billion.
That is a substantial asset pool, but its size alone does not establish how much selling pressure the market will face.
The key distinction is between confiscation and liquidation.
Confiscation determines whether assets can legally be taken by the relevant authorities. Liquidation involves converting those assets into cash or another form of value.
These are different events.
Three possible scenarios deserve attention.
Scenario 1: The Bitcoin remains frozen.
Legal proceedings continue without an immediate sale. The case remains a headline risk, but the coins do not automatically become new exchange supply.
Scenario 2: Authorities eventually sell the Bitcoin.
A large, rapid sale could add selling pressure, particularly if market liquidity is weak. An orderly sale spread over time could have a different effect.
Scenario 3: The assets are distributed to eligible claimants.
If compensation or other transfers occur, recipients may hold, transfer or sell their Bitcoin. The eventual market impact would depend on their decisions.
At present, the case should be treated as a potential future supply event—not proof that 61,896 BTC are about to hit the market.
6. What Connects ETF Outflows and China's Bitcoin Case?
The two developments are related through market sentiment, but they should not be confused with one another.
ETF withdrawals provide a current, measurable indication of investor flows. China's confiscation effort is a legal process that could affect the disposition of a large Bitcoin holding in the future.
One concerns demand today. The other concerns uncertain future ownership and potential supply.
Together, they create an environment in which traders have reason to watch both sides of the market.
The critical factors are:
ETF flows: Are institutional investors continuing to withdraw capital?Price action: Is Bitcoin holding important support levels?Potential supply: Will the legal process eventually result in a confirmed sale?Liquidity: Can the market absorb selling pressure without a sharp price decline?
These factors can influence Bitcoin's direction, but none independently guarantees a bullish or bearish outcome.
7. Macroeconomic Pressure Adds Another Layer of Uncertainty
Bitcoin does not trade in isolation.
The October 23 market report described a broader risk-off environment, with oil prices moving above $111 per barrel, technology stocks declining and major U.S. equity indexes coming under pressure. Investors were also watching the Federal Reserve's October 27–28 meeting.
These conditions matter because Bitcoin can behave like a risk-sensitive asset during periods of market stress.
When investors become concerned about economic growth, inflation, interest rates or expensive technology stocks, they may reduce exposure to volatile assets across several markets simultaneously.
Higher oil prices can complicate the inflation outlook. Persistent inflation could limit the Federal Reserve's flexibility to ease monetary policy, depending on the broader economic data.
For Bitcoin, the potential chain reaction is straightforward:
Rising uncertainty encourages investors to reduce risk.Reduced risk appetite can weaken demand for speculative assets.Weak ETF flows can reinforce concerns about institutional buying.If selling accelerates while liquidity deteriorates, price volatility may increase.
This is a possible scenario, not a guaranteed forecast. Bitcoin's reaction will depend on actual economic developments, investor positioning and the balance between buyers and sellers.
8. Bitcoin Price Outlook: What Should Traders Watch?
With Bitcoin near $81,460 in the latest cited snapshot, traders should focus on price confirmation rather than making decisions based on headlines alone.
The following are illustrative monitoring zones, not independently verified live Binance technical levels.
Bullish scenario: $84,800–$87,500
A recovery through this zone, supported by improving spot demand and renewed ETF inflows, would strengthen the case for a short-term rebound. A breakout would still require confirmation.
Neutral scenario: $80,000–$84,800
Continued trading within this broad range would suggest consolidation. ETF flows, trading volume and reactions at the range boundaries would help determine the next move.
Bearish scenario: Below $80,000, followed by $77,500
A sustained breakdown below $80,000, particularly alongside continuing ETF outflows, would raise downside risk. The $77,500 area is a potential scenario level, not a guaranteed target.
What would strengthen the bullish case?
A more convincing recovery would involve several developments occurring together:
ETF flows return to sustained positive territory.Bitcoin reclaims nearby resistance and holds it on a daily closing basis.Spot buying strengthens rather than relying primarily on leveraged futures.Broader financial markets become more supportive of risk assets.
What would strengthen the bearish case?
The downside scenario would become more credible if ETF outflows continued, Bitcoin lost the $80,000 area decisively and market liquidity weakened.
Confirmed news of an imminent liquidation of the disputed Bitcoin could also affect sentiment. Traders should distinguish official announcements from rumours.
9. Three Indicators Smart Bitcoin Investors Should Track
Rather than trying to predict every headline, investors can monitor three useful indicators.
1. Daily and weekly spot Bitcoin ETF flows
One negative day is not enough to establish a trend. Several sessions of sustained outflows would provide stronger evidence that this source of demand is weakening.
2. Spot volume versus derivatives activity
A price rally supported by spot buying is generally more convincing than one driven primarily by leveraged positions. Funding rates, open interest and liquidation data can help identify when a move is becoming crowded, although no indicator guarantees a reversal.
3. Verified developments in China's confiscation case
Court decisions, confirmed asset transfers and official sale announcements would be more significant than speculation about what authorities might eventually do.
Investors should also monitor inflation, interest-rate expectations and broader equity-market conditions.
Is Bitcoin Facing a Major Turning Point?
Bitcoin's latest developments present a challenging but not one-sided picture.
The $635.6 million ETF outflow is a warning that institutional demand can fluctuate sharply, even after several days of strong inflows. The reported return of October ETF flows to negative territory adds to the uncertainty.
Meanwhile, China's effort to confiscate 61,896 BTC introduces a separate legal issue involving approximately $5 billion in cryptocurrency. Yet confiscation does not automatically mean liquidation, and the final ownership of the assets remains unresolved.
The strongest conclusion is not that Bitcoin must crash—or that a rebound is guaranteed.
It is that Bitcoin needs to demonstrate resilient demand while investors assess the possibility of future supply changes.
If ETF inflows recover and BTC holds key price levels, the recent weakness could prove temporary. If outflows persist and support breaks, the market may face a deeper correction.
For long-term investors, patience and risk management matter more than reacting to every alarming headline. For short-term traders, confirmed price action and liquidity conditions are more useful than assuming the two stories guarantee a particular direction.
The next phase of Bitcoin's market will depend on the balance between real buying demand, broader financial conditions and developments that actually change available supply.
What do you think: is Bitcoin preparing for a recovery near $80,000, or could persistent ETF outflows open the door to another correction?
Share your analysis in the comments.
Disclaimer: This article is for educational and informational purposes only and does not constitute financial or investment advice. Cryptocurrency prices are volatile. Market figures reflect the latest cited reports available for October 23–24, 2026, and may change. Verify live prices and ETF data before making investment decisions.
1
149
Log in to explore more content
Join global crypto users on Binance Square
⚡️ Get latest and useful information about crypto.
💬 Trusted by the world’s largest crypto exchange.
👍 Discover real insights from verified creators.
Email / Phone number
Trending Topics
A Packed Week of Earnings and Data Tests Markets
46,730 views
322 Discussing
🚨🇺🇸 BIG WEEK AHEAD FOR THE MARKETS!
Markets are pricing in a Fed rate hike in December and $BTC could see some big moves next week.
Here's what's coming:
• Monday: Fed Chair Warsh speaks
• Tuesday: US Retail Sales + $NVDA earnings
• Wednesday: FOMC Minutes
• Thursday: Jobless Claims + Philly Fed Index
• Friday: Consumer Sentiment + Fed speeches
All eyes on $BTC as another important week begins.
#bitcoin
Mookie
·14 Likes
·6k views
AnthropicIPOTestsInvestorAppetiteForAI
70,860 views
1,109 Discussing
BitcoinExtendsLosingStreakToSixWeeks
31,915 views
465 Discussing